Article

In-Field Absolute Calibration of Ground and Airborne VIS-NIR-SWIR Hyperspectral Point Spectrometers

1
The Remote Sensing Laboratory, Jacob Blaustein Institutes for Desert Research, Ben-Gurion University of the Negev, Sede Boker Campus 84990, Israel
2
IARD Sensing Solutions Ltd., Kibbutz Yagur, 30065, Israel
*
Author to whom correspondence should be addressed.
Remote Sens. 2014, 6(2), 1158-1170; https://doi.org/10.3390/rs6021158
Submission received: 18 December 2013 / Revised: 20 January 2014 / Accepted: 23 January 2014 / Published: 29 January 2014

Abstract

:
Spectrometer calibration and measurements of spectral radiance are often required when performing ground, aerial, and space measurements. While calibrating a spectrometer in the field using an integrating sphere is practically unachievable, calibration against a quartz halogen (QH) lamp is a quite easy and feasible option. We describe a calibration protocol whereby a professional QH lamp, operating with a stabilized current source, is first calibrated in the laboratory against a US National Institute of Standards and Technology (NIST) traceable integrating sphere and, then, used for the field calibration of a spectrometer before a ground or airborne campaign. Another advantage of the lamp over the integrating sphere is its ability to create a continuous calibration curve at the spectrometer resolution, while the integrating sphere is calibrated only for a few discrete wavelengths. A calibrated lamp could also be used for a secondary continuous calibration of an un-calibrated integrating sphere.

1. Introduction

Spectrometers are often used by the remote sensing community to characterize in situ the reflectance of surface features and to perform vicarious calibrations of air- and spaceborne sensors. The spectra measured vary from specific objects and small areas (e.g., leaves, rocks) to composite scenes (e.g., vegetation canopies), and, ultimately, to image pixels [13]. Mostly, we use a spectrometer to derive the reflectance of an object by comparing the signal reflected from the object to that of a white reference panel, such as Spectralon (compressed polytetrafluoroethylene) or BaSO4. Measuring radiance rather than reflectance is necessary when performing aerial measurements for which Spectralon calibration is cumbersome [4]. On this occasion, a pre-flight absolute calibration of the irradiance received at the device’s aperture is needed. In aerial measurements, a fiber optic extension is often used to connect the spectrometer located inside the airplane to the collecting optics located in a pod at the bottom of the aircraft. In this case, the calibration of the spectrometer must be done in the field. While this calibration procedure is usually performed using an integrating sphere (described below) [5], it is not feasible to move and use this delicate and often large device in the field. The aim of this paper is to describe a simplified procedure suited for in-field absolute calibration of a spectrometer. Section 2 presents the apparatus used to achieve an ideal flat angular response by the spectrometer. Section 3 describes the procedure to calibrate a spectrometer by using an integrating sphere and by a quartz halogen (QH) lamp. In section 4 it is shown how a calibrated QH lamp can be used as a secondary calibration source for an integrating sphere. Section 5 discusses the advantages and shortcomings of the proposed calibration protocol. Section 6 offers concluding remarks.

2. Uniformity of the Radiometer Field of View (FOV)

We used the Analytical Spectral Devices (ASD) FieldSpec Pro FR spectrometer (Analytical Spectral Devices Inc., Boulder, CO, USA) with a spectral range of 350–2,500 nm. This device is based on a bare fiber bundle, with or without collecting optics, which has a given Field of View (FOV). The spectral irradiance (W·cm−2·μm−1) that enters the fiber (through the aperture of the fiber/optics) is either reflected from the object(s) located in the FOV or emitted by them. The collected spectral power (W μm−1) is divided between three linear detector arrays that measure the spectral power in three different spectral regions (350–985, 986–1,765, and 1,766–2,500 nm) with spectral sampling of 3, 10, and 10 nm, respectively. The ASD output is statistically standardized to 1 nm intervals. The calibration of this device converts the read-out signal (in digital numbers −DN) to spectral irradiance (see below).
The first calibration problem in this process is the non-uniform sensitivity of the FOV. When a point source is measured, the signal has some (spectral and amplitude) dependence on the position of the source inside the FOV of the bare fiber [6,7]. When this point source is measured with collecting optics, this non-uniformity becomes extremely large due to the focusing of the source on different fibers in the bundle that contribute to different parts of the detector. We measured the FOV of a bare fiber used in an ASD spectrometer by recording the transmitted signal as a function of the angular position of the fiber. A distant QH lamp (point source) illuminated the bare fiber through a scanning flat mirror. As a result the turning of the mirror placed the source at different positions across the fiber’s FOV. Results showed that it has a field of view (FOV) of 400 mrad (this value should be compared with the FOV defined by its Numerical Aperture = 0.22 that predicts a FOV of 25° = 436 mrad) with a fairly flat response (Figure 1). The bare fiber ends with a FOV limiter in all subsequent calibrations, thus providing an ideal angular flat response. The FOV limiter is a black-coated, custom-made metal cylinder that has a limiting iris at its end. In our tests, we used a FOV limiter of 103.6 mrad = 5.9° (Figure 2A). The sensitivity of the bare fiber within this limiting aperture is fairly uniform. On the other hand, when a uniformly illuminated background is measured, the use of the collecting optics is recommended since every fiber in the bundle will be equally irradiated.

3. Calibration of a Spectrometer Using an Integrating Sphere and a QH Lamp

An integrating sphere is a hollow spherical cavity with small entrance holes (for calibration lamps) and an exit hole, acting as a uniformly illuminated radiance source. The inner coating of an integrating sphere is a high reflectivity near-Lambertian surface that homogenizes the reflected spectral radiant intensities (W·str−1·μm−1) of the calibration lamps [8]. The spectral radiance at the exit port is accurately measured by the manufacturer and can be used as the US National Institute of Standards and Technology (NIST) traceable standard. This known radiance is used to calibrate spectrometers in the visible (VIS), near-infrared (NIR), and shortwave infrared (SWIR) at the integrating sphere’s aperture. Although transportable integrating spheres [9] have been used to calibrate remote sensing sensors in the field, these devices are expensive to manufacture and technically complicated to calibrate. In addition, transporting and operating them outside clean laboratory may lead to deterioration of their quality and their traceability to NIST primary standards. Another disadvantage of using common BaSO4-coated integrating spheres for calibrating a spectrometer is that they may only be calibrated for discrete wavelengths in the VIS-NIR-SWIR regions where there is no absorption of water vapor that is adsorbed to their walls (as discussed later). The use of dry N2 for purging the integrating sphere during NIST continuous-wavelength calibration will require a similar cumbersome purging during its use in the laboratory calibration. An interpolation made between discrete calibration points will introduce spectral features caused by the water adsorbed to the coating of the sphere [2]. Therefore, the numeric interpolation approach is inadmissible and a physical-analytical approach is required.
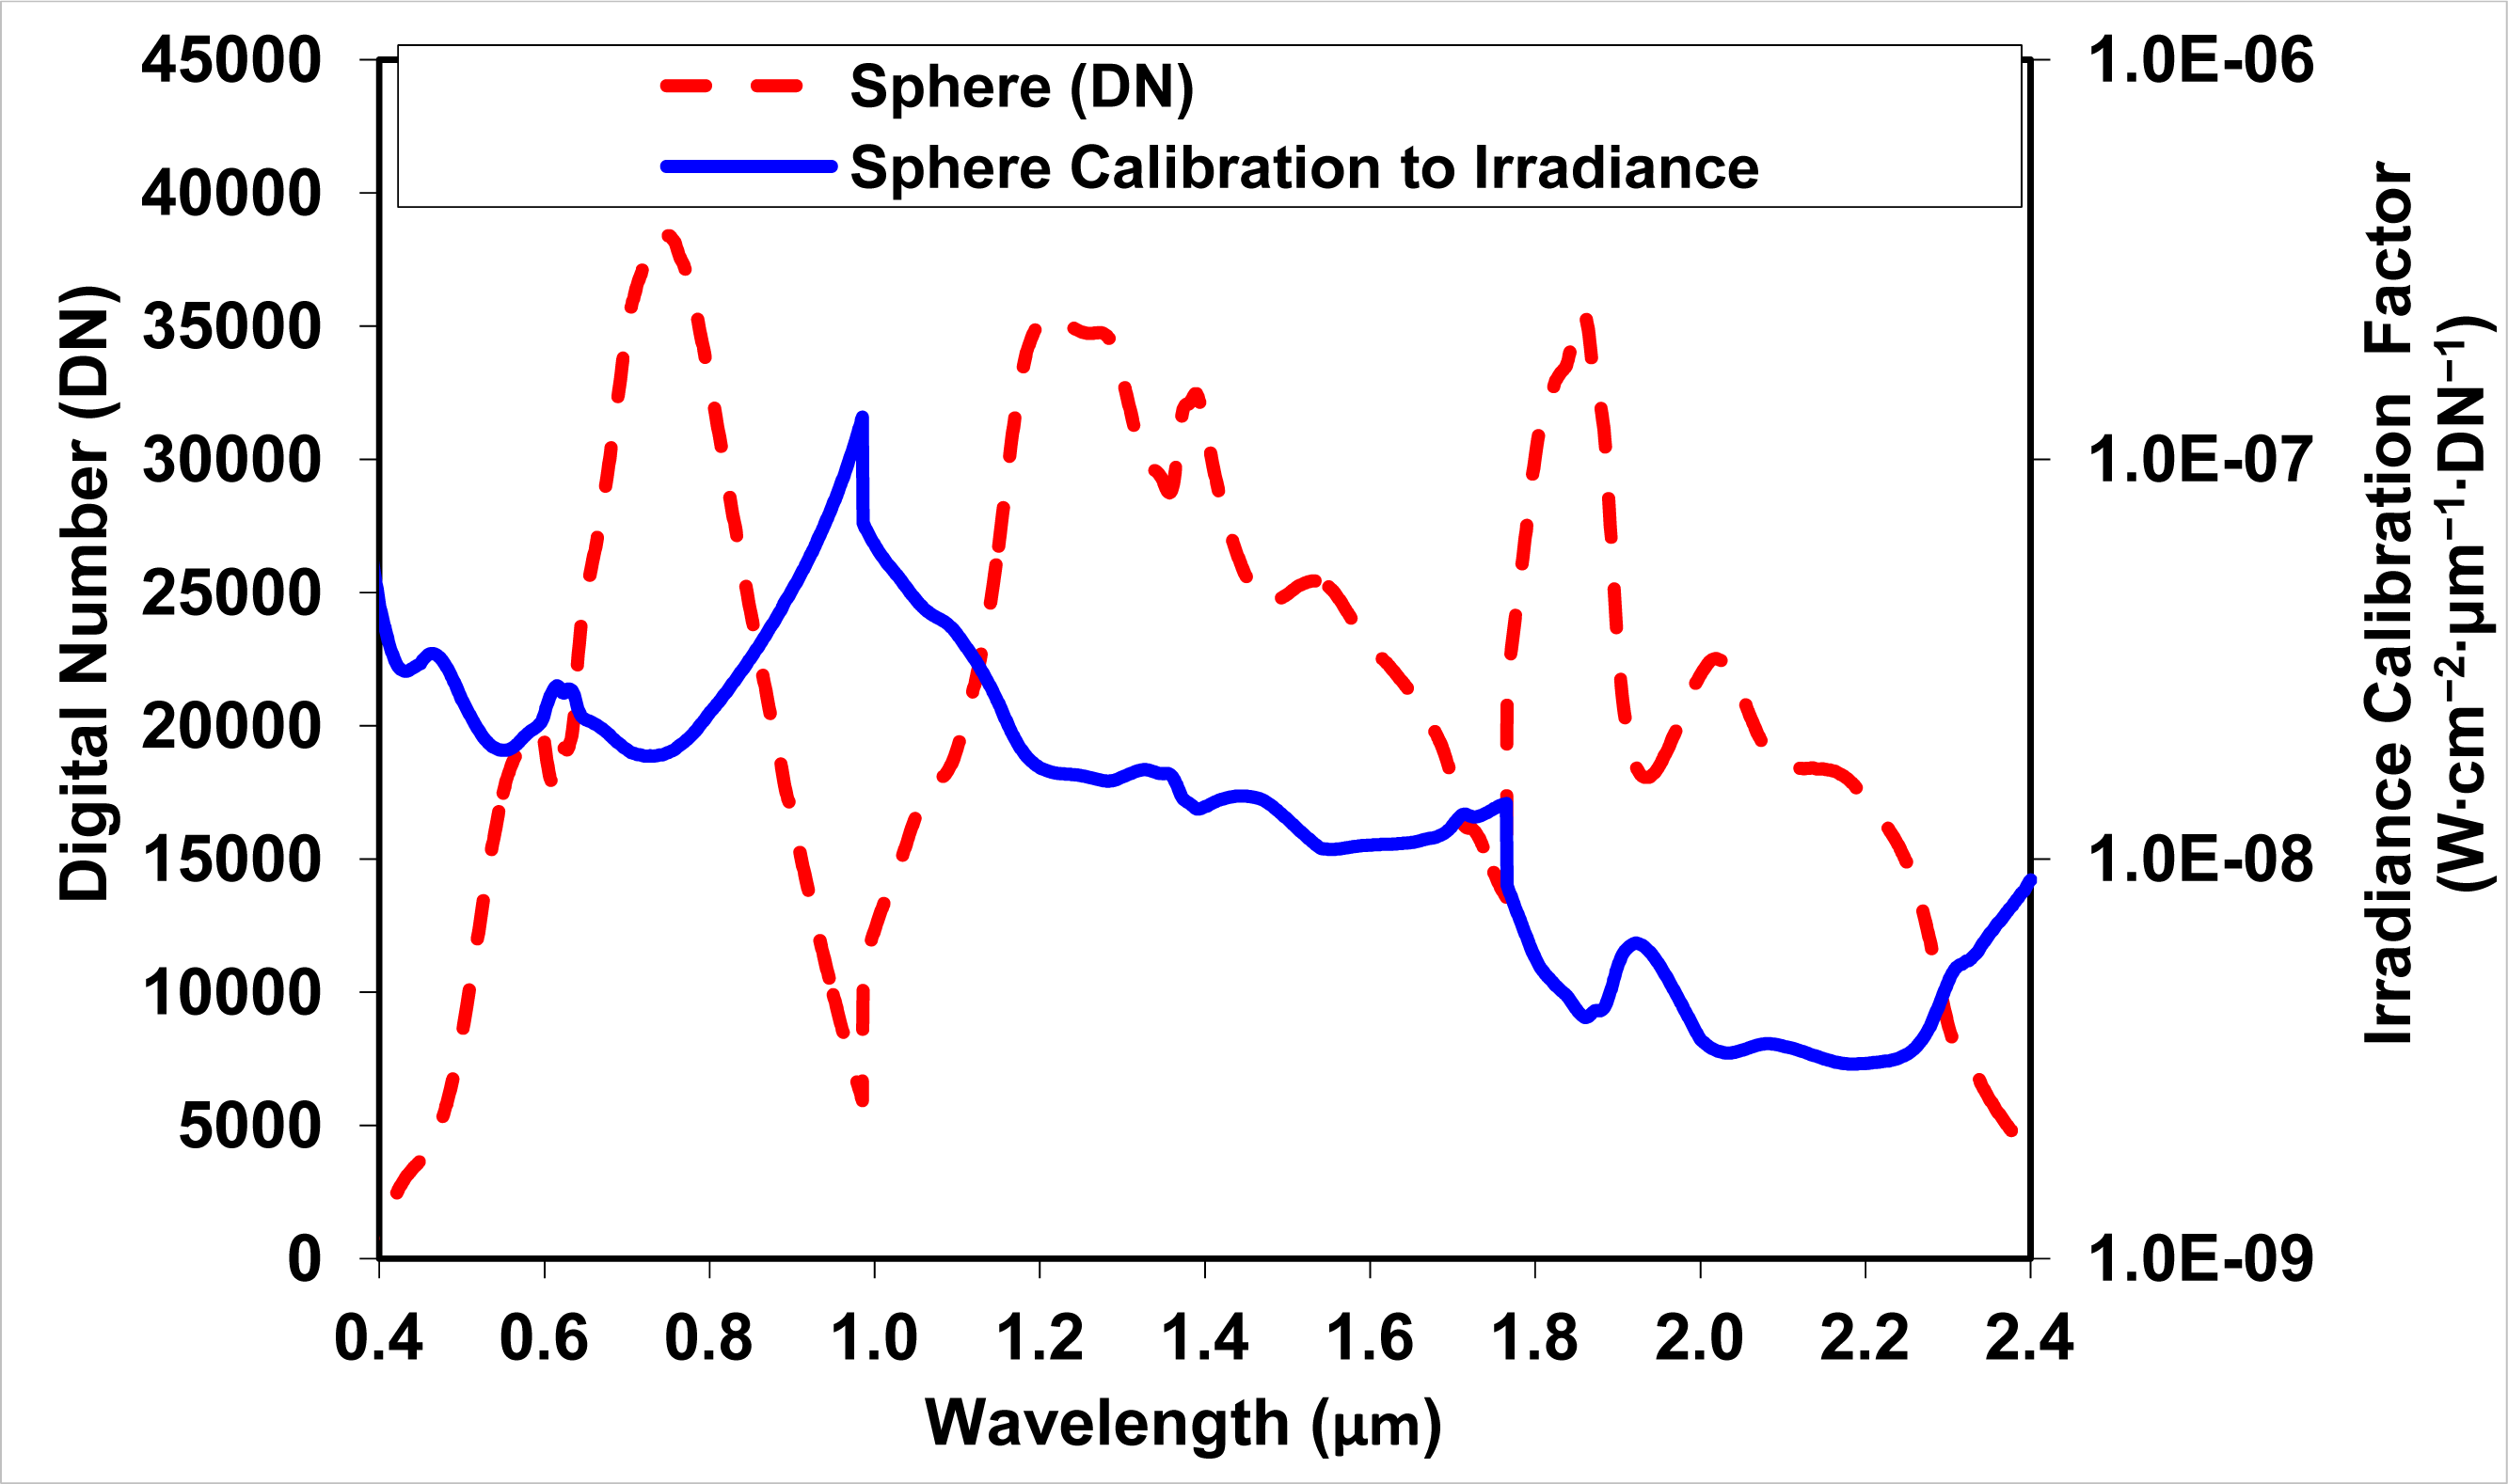
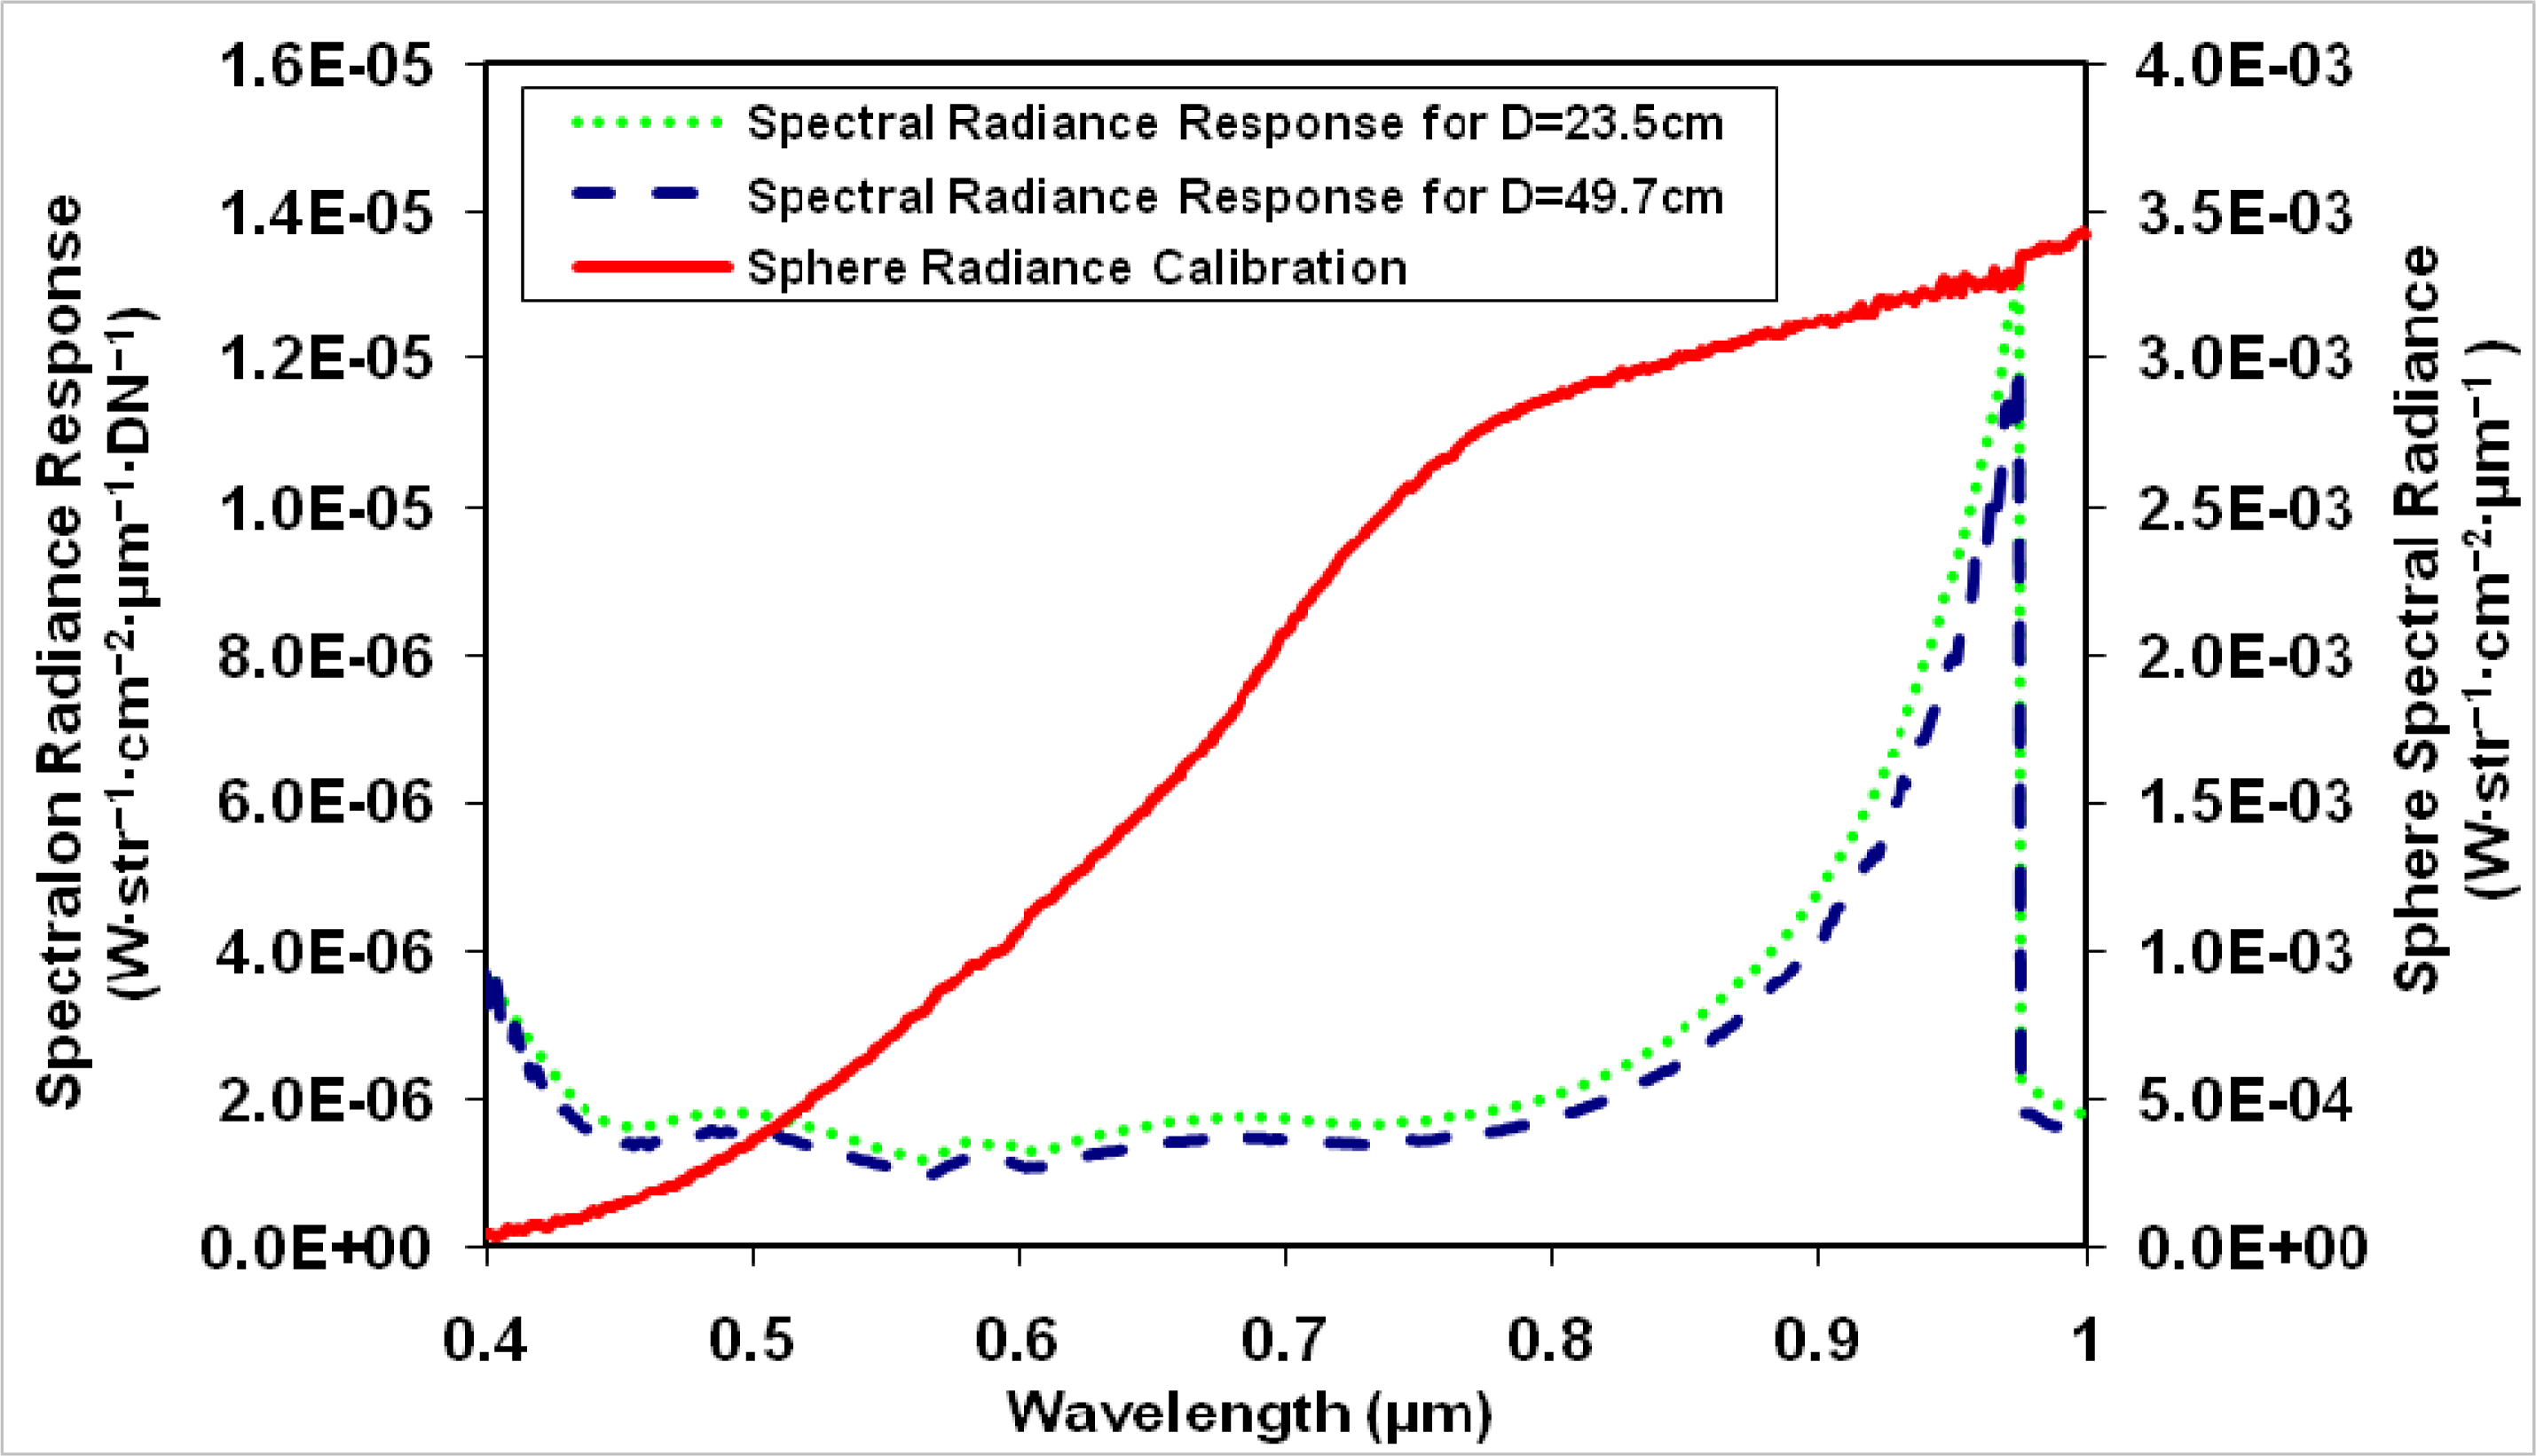
The process of calibrating a spectrometer produces a calibration curve that allows for converting the DN readout of the spectrometer to irradiance units. 
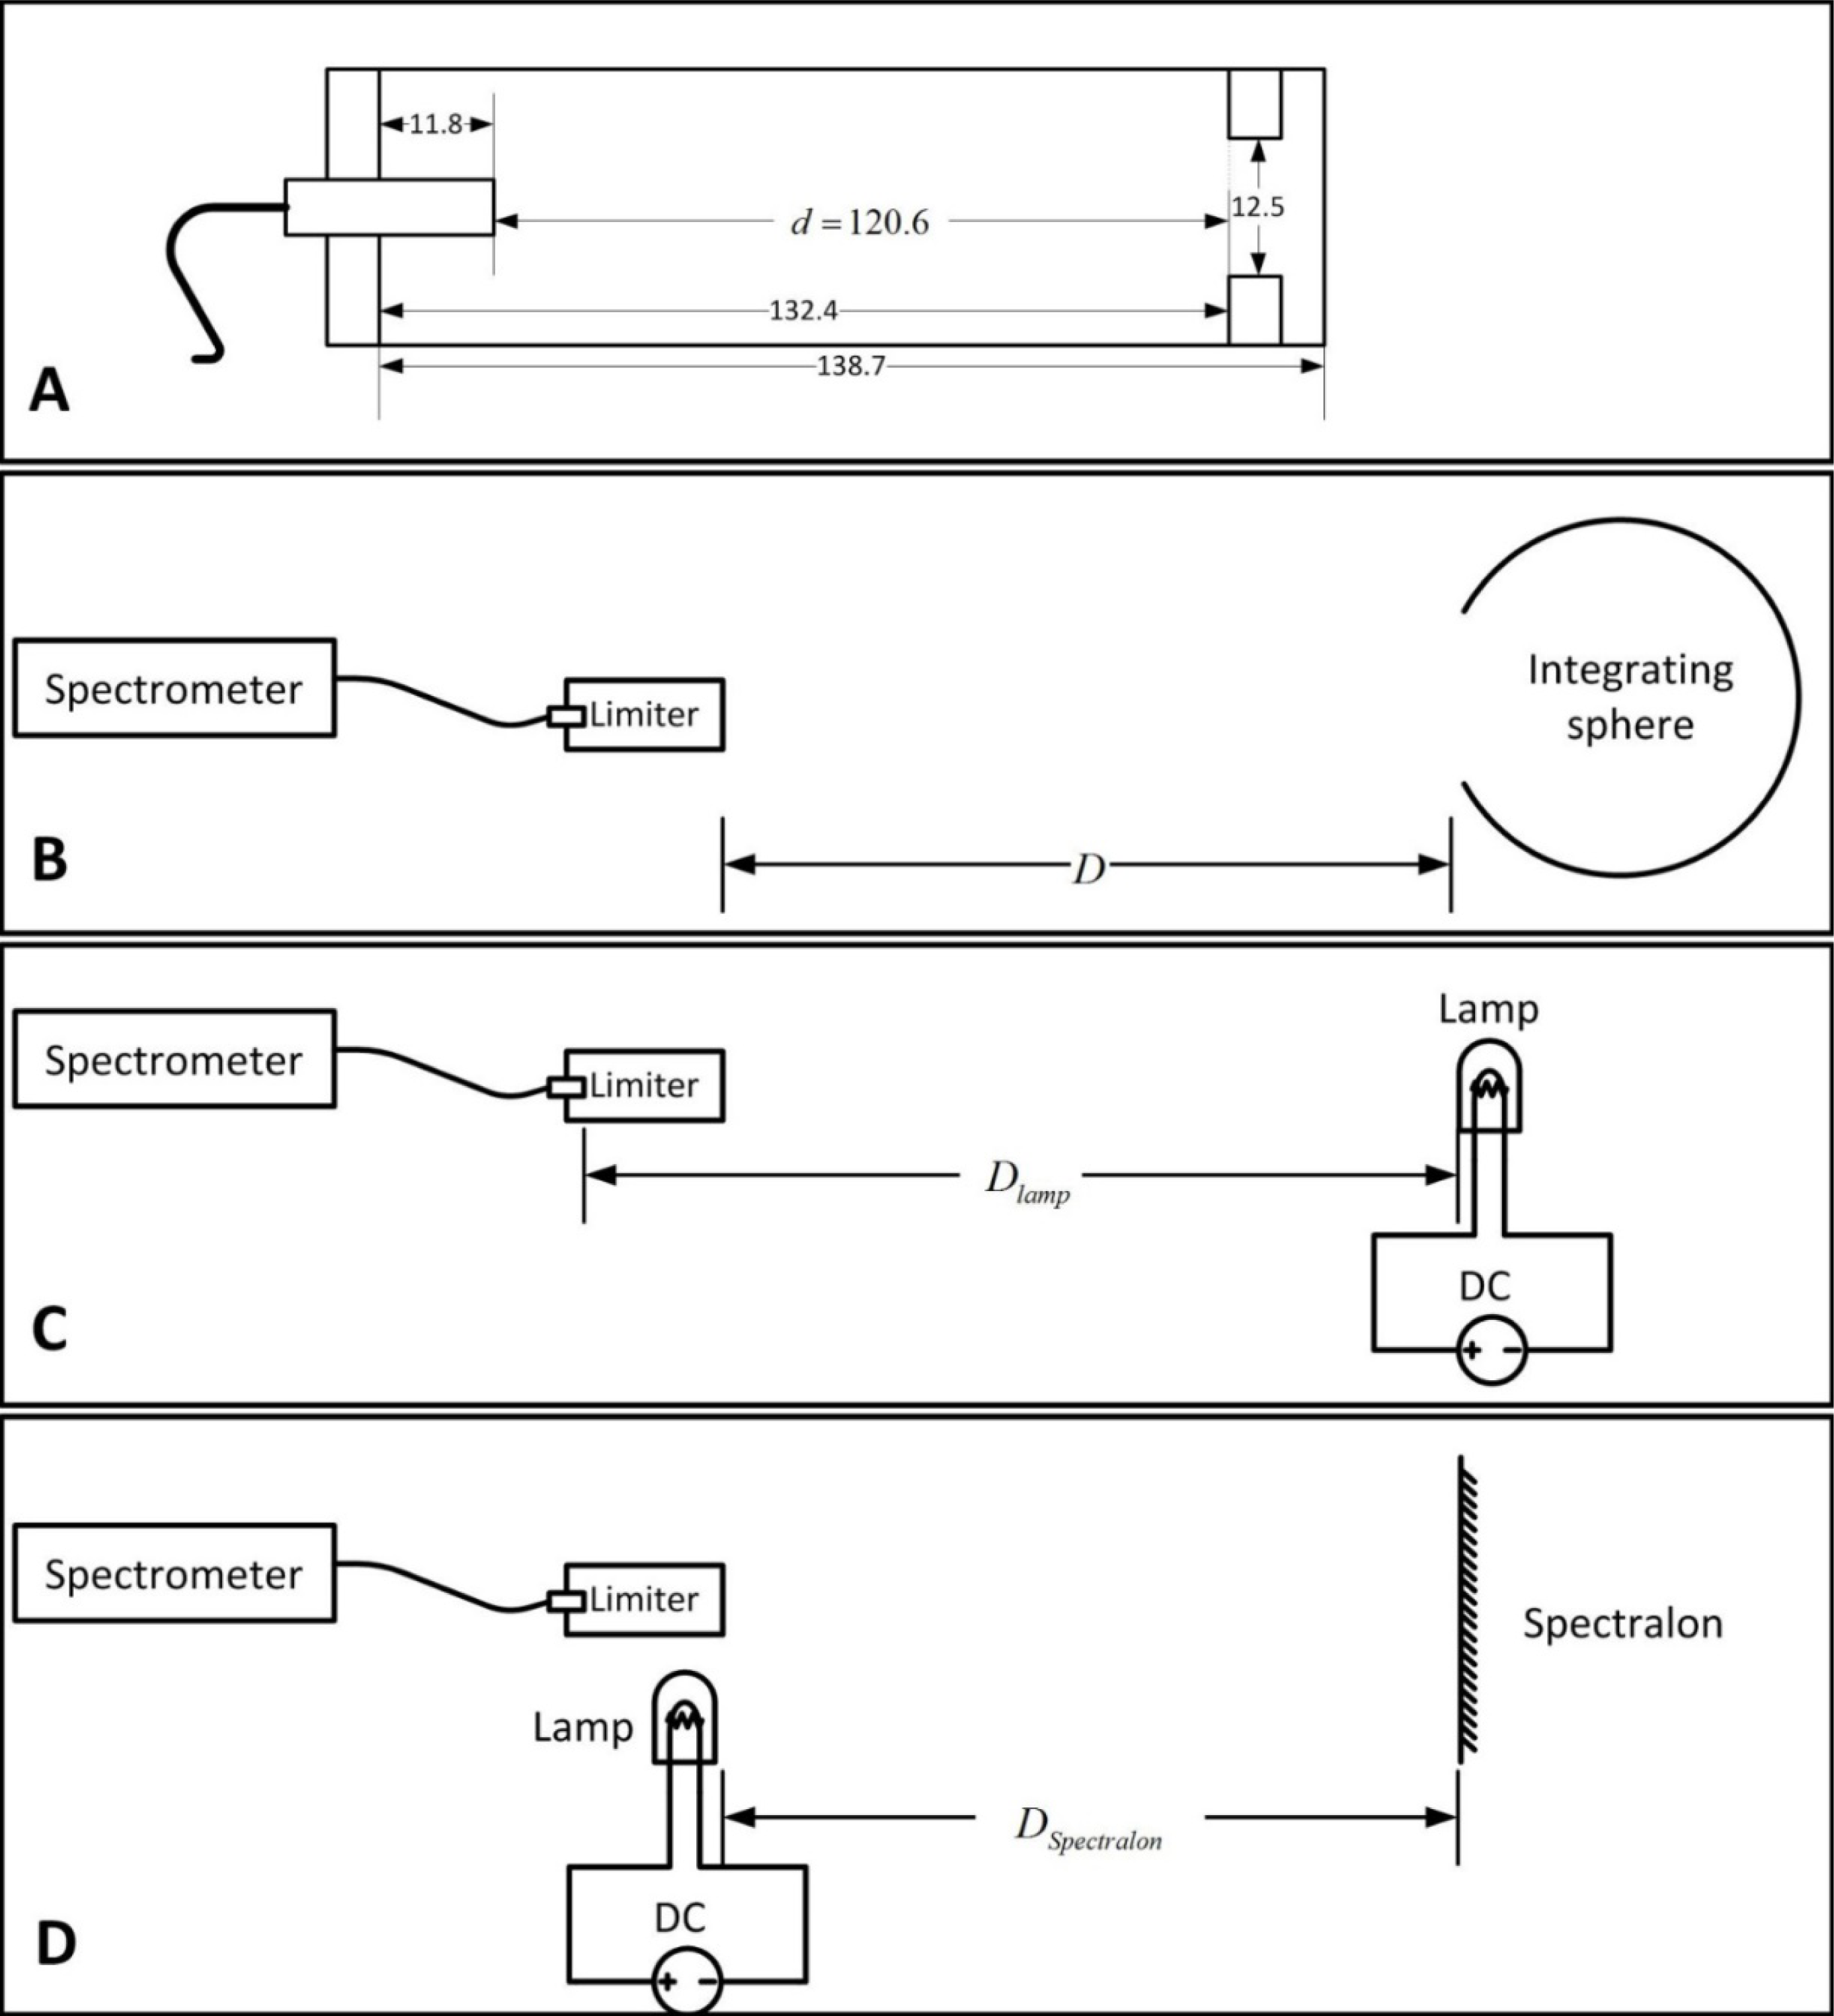
Figure 2B shows the spectral irradiance measurement using an ASD spectrometer fitted with a FOV limiter at a distance D from an integrating sphere. We used a Labsphere Unisource 1200 integrating sphere (S/N001588). The exact value of D is insignificant, as will be explained herein. The integration time was set to 132 msec. The solid angle (Ωaperture) suspended by the FOV limiter is equal to the iris area (A) divided by the square of the distance from the bare fiber end to it (d2):
Ω aperture = A d 2 π 4 × ( 12.5 mm ) 2 ( 120.6 mm ) 2 = 8.44 × 10 3 str
The calibrated value of the spectral radiance of the integrating sphere Lsphere (W·str−1·cm−2·μm−1) is divided by the measured signal, DN, to provide the spectrometer radiance calibration factor Kradiance (W·cm−2·str−1·μm−1·DN−1):
K radiance = L sphere DN
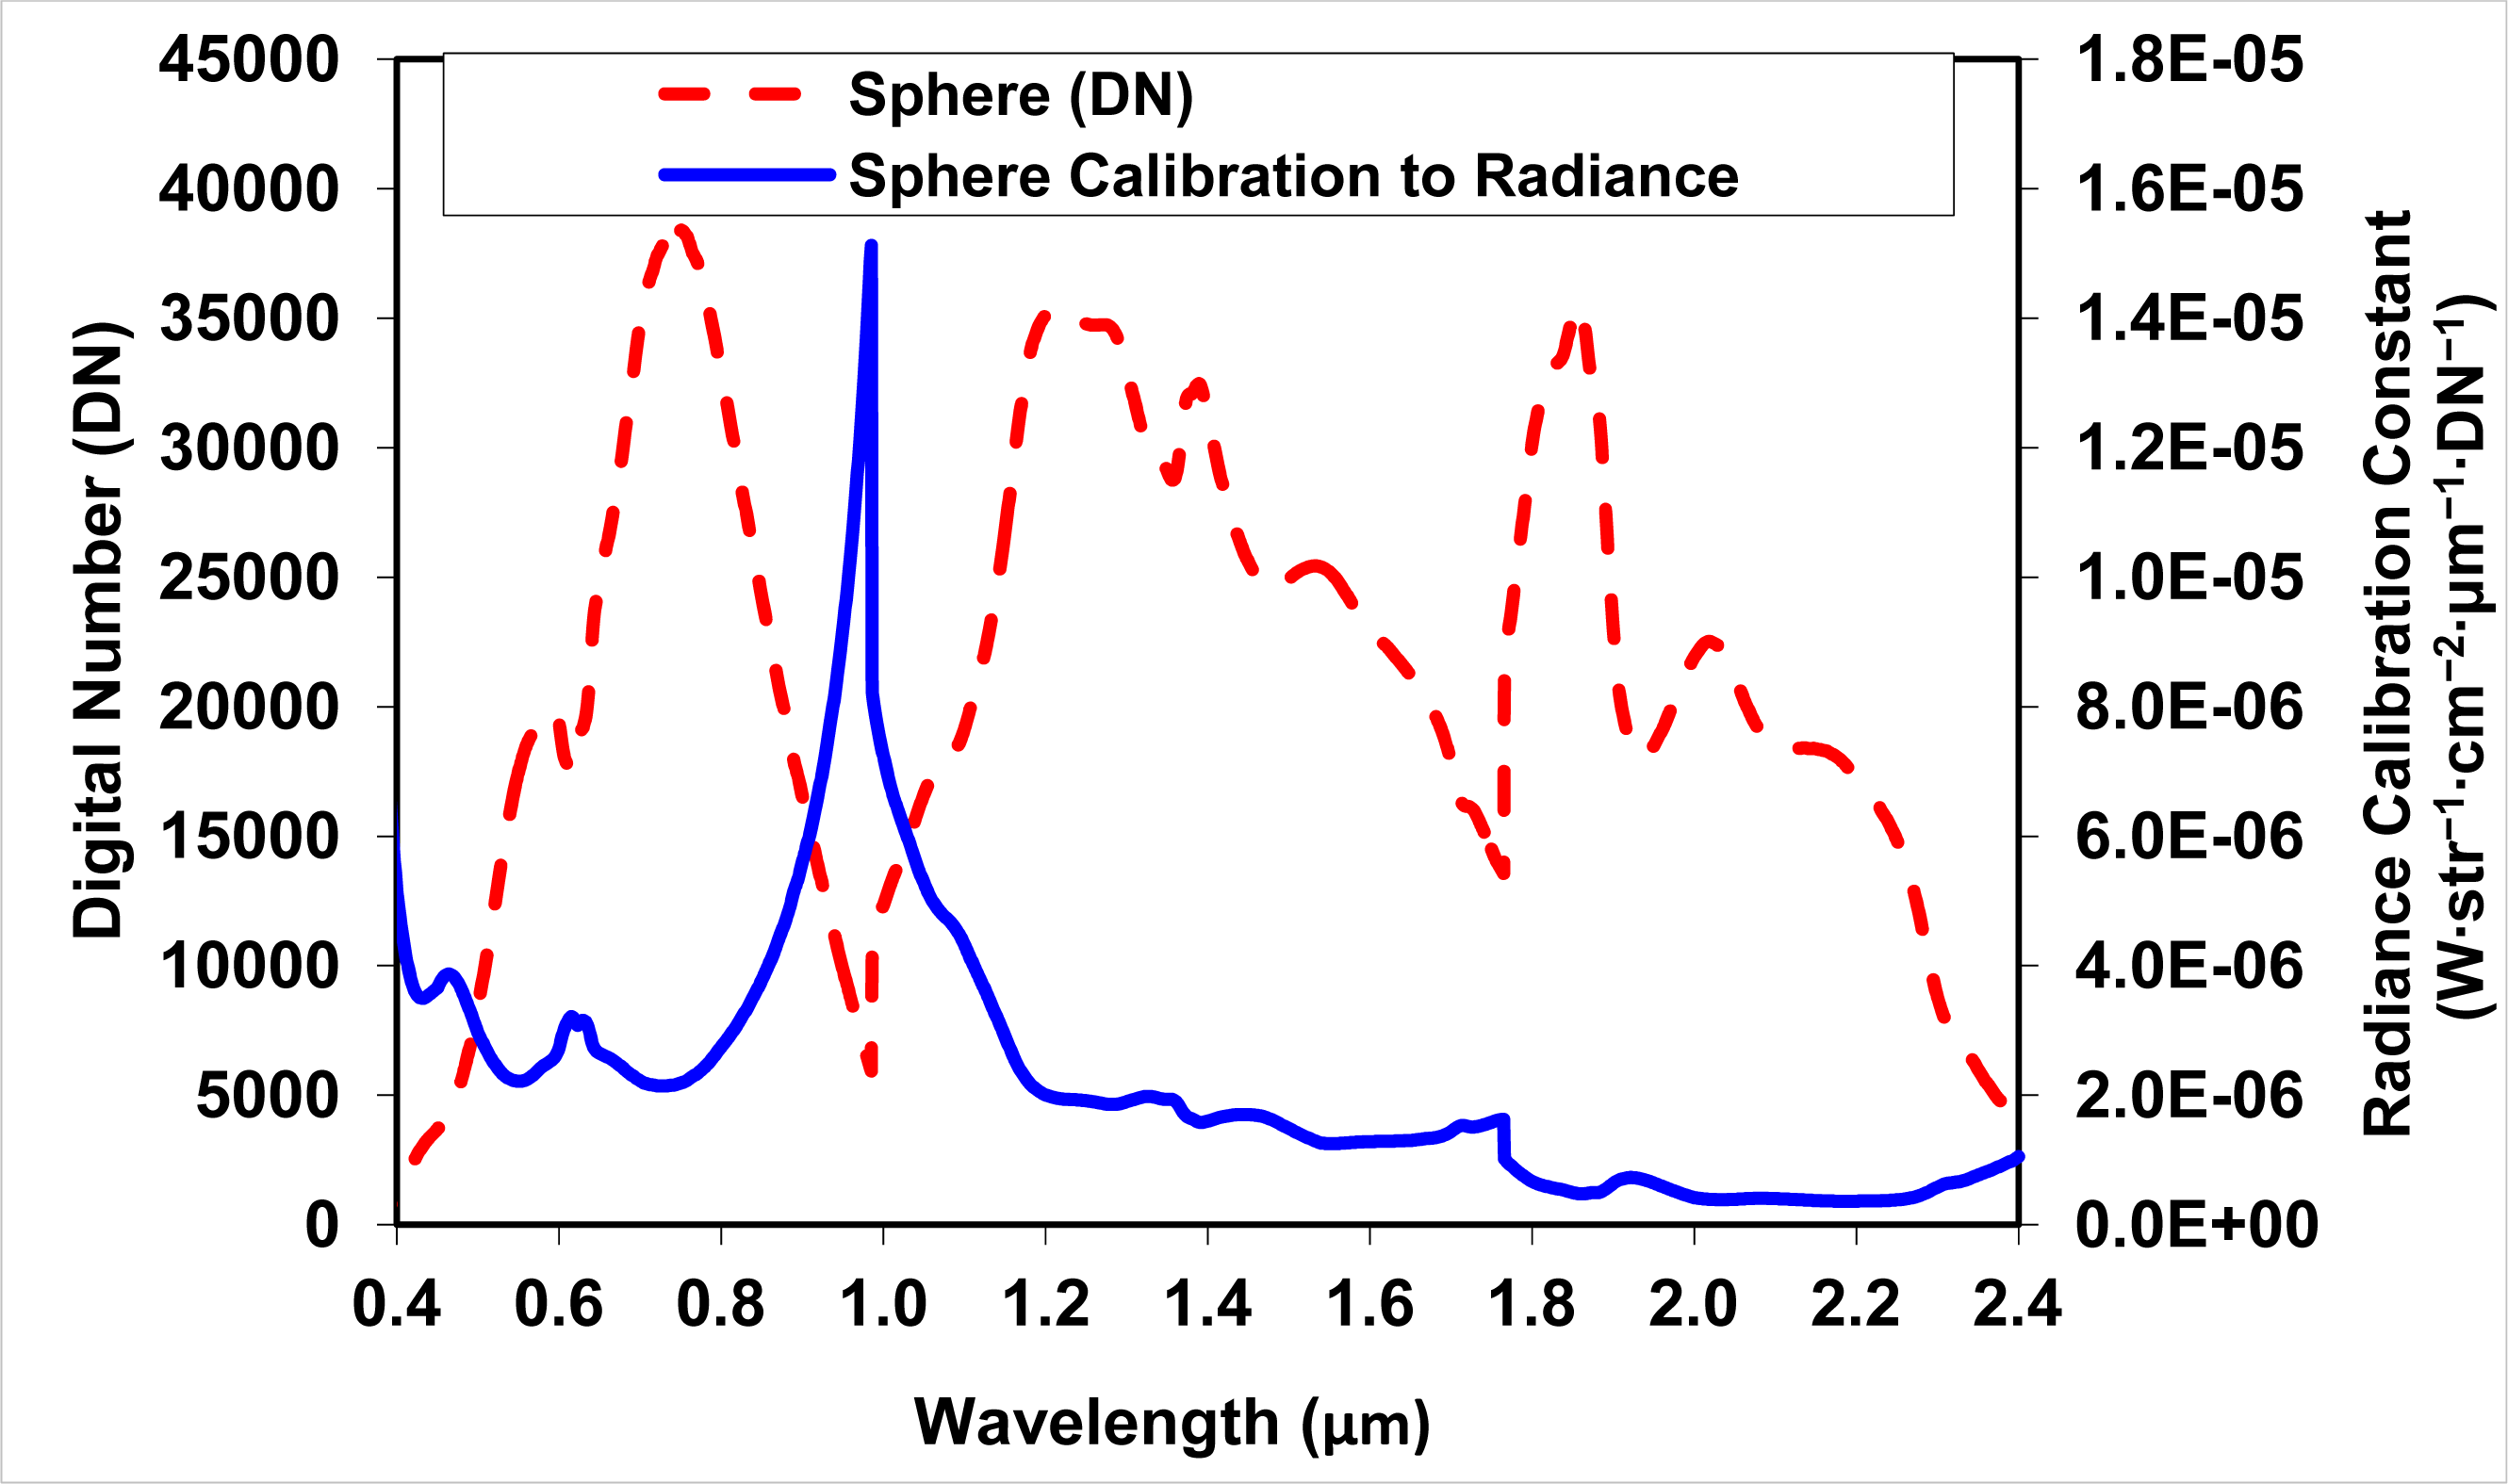
Figure 3 demonstrates the calibration according to the integrating sphere radiance. Note that the three different detector arrays in the spectrometer (350–985, 986–1,765, and 1,766–2,500 nm) are distinct.
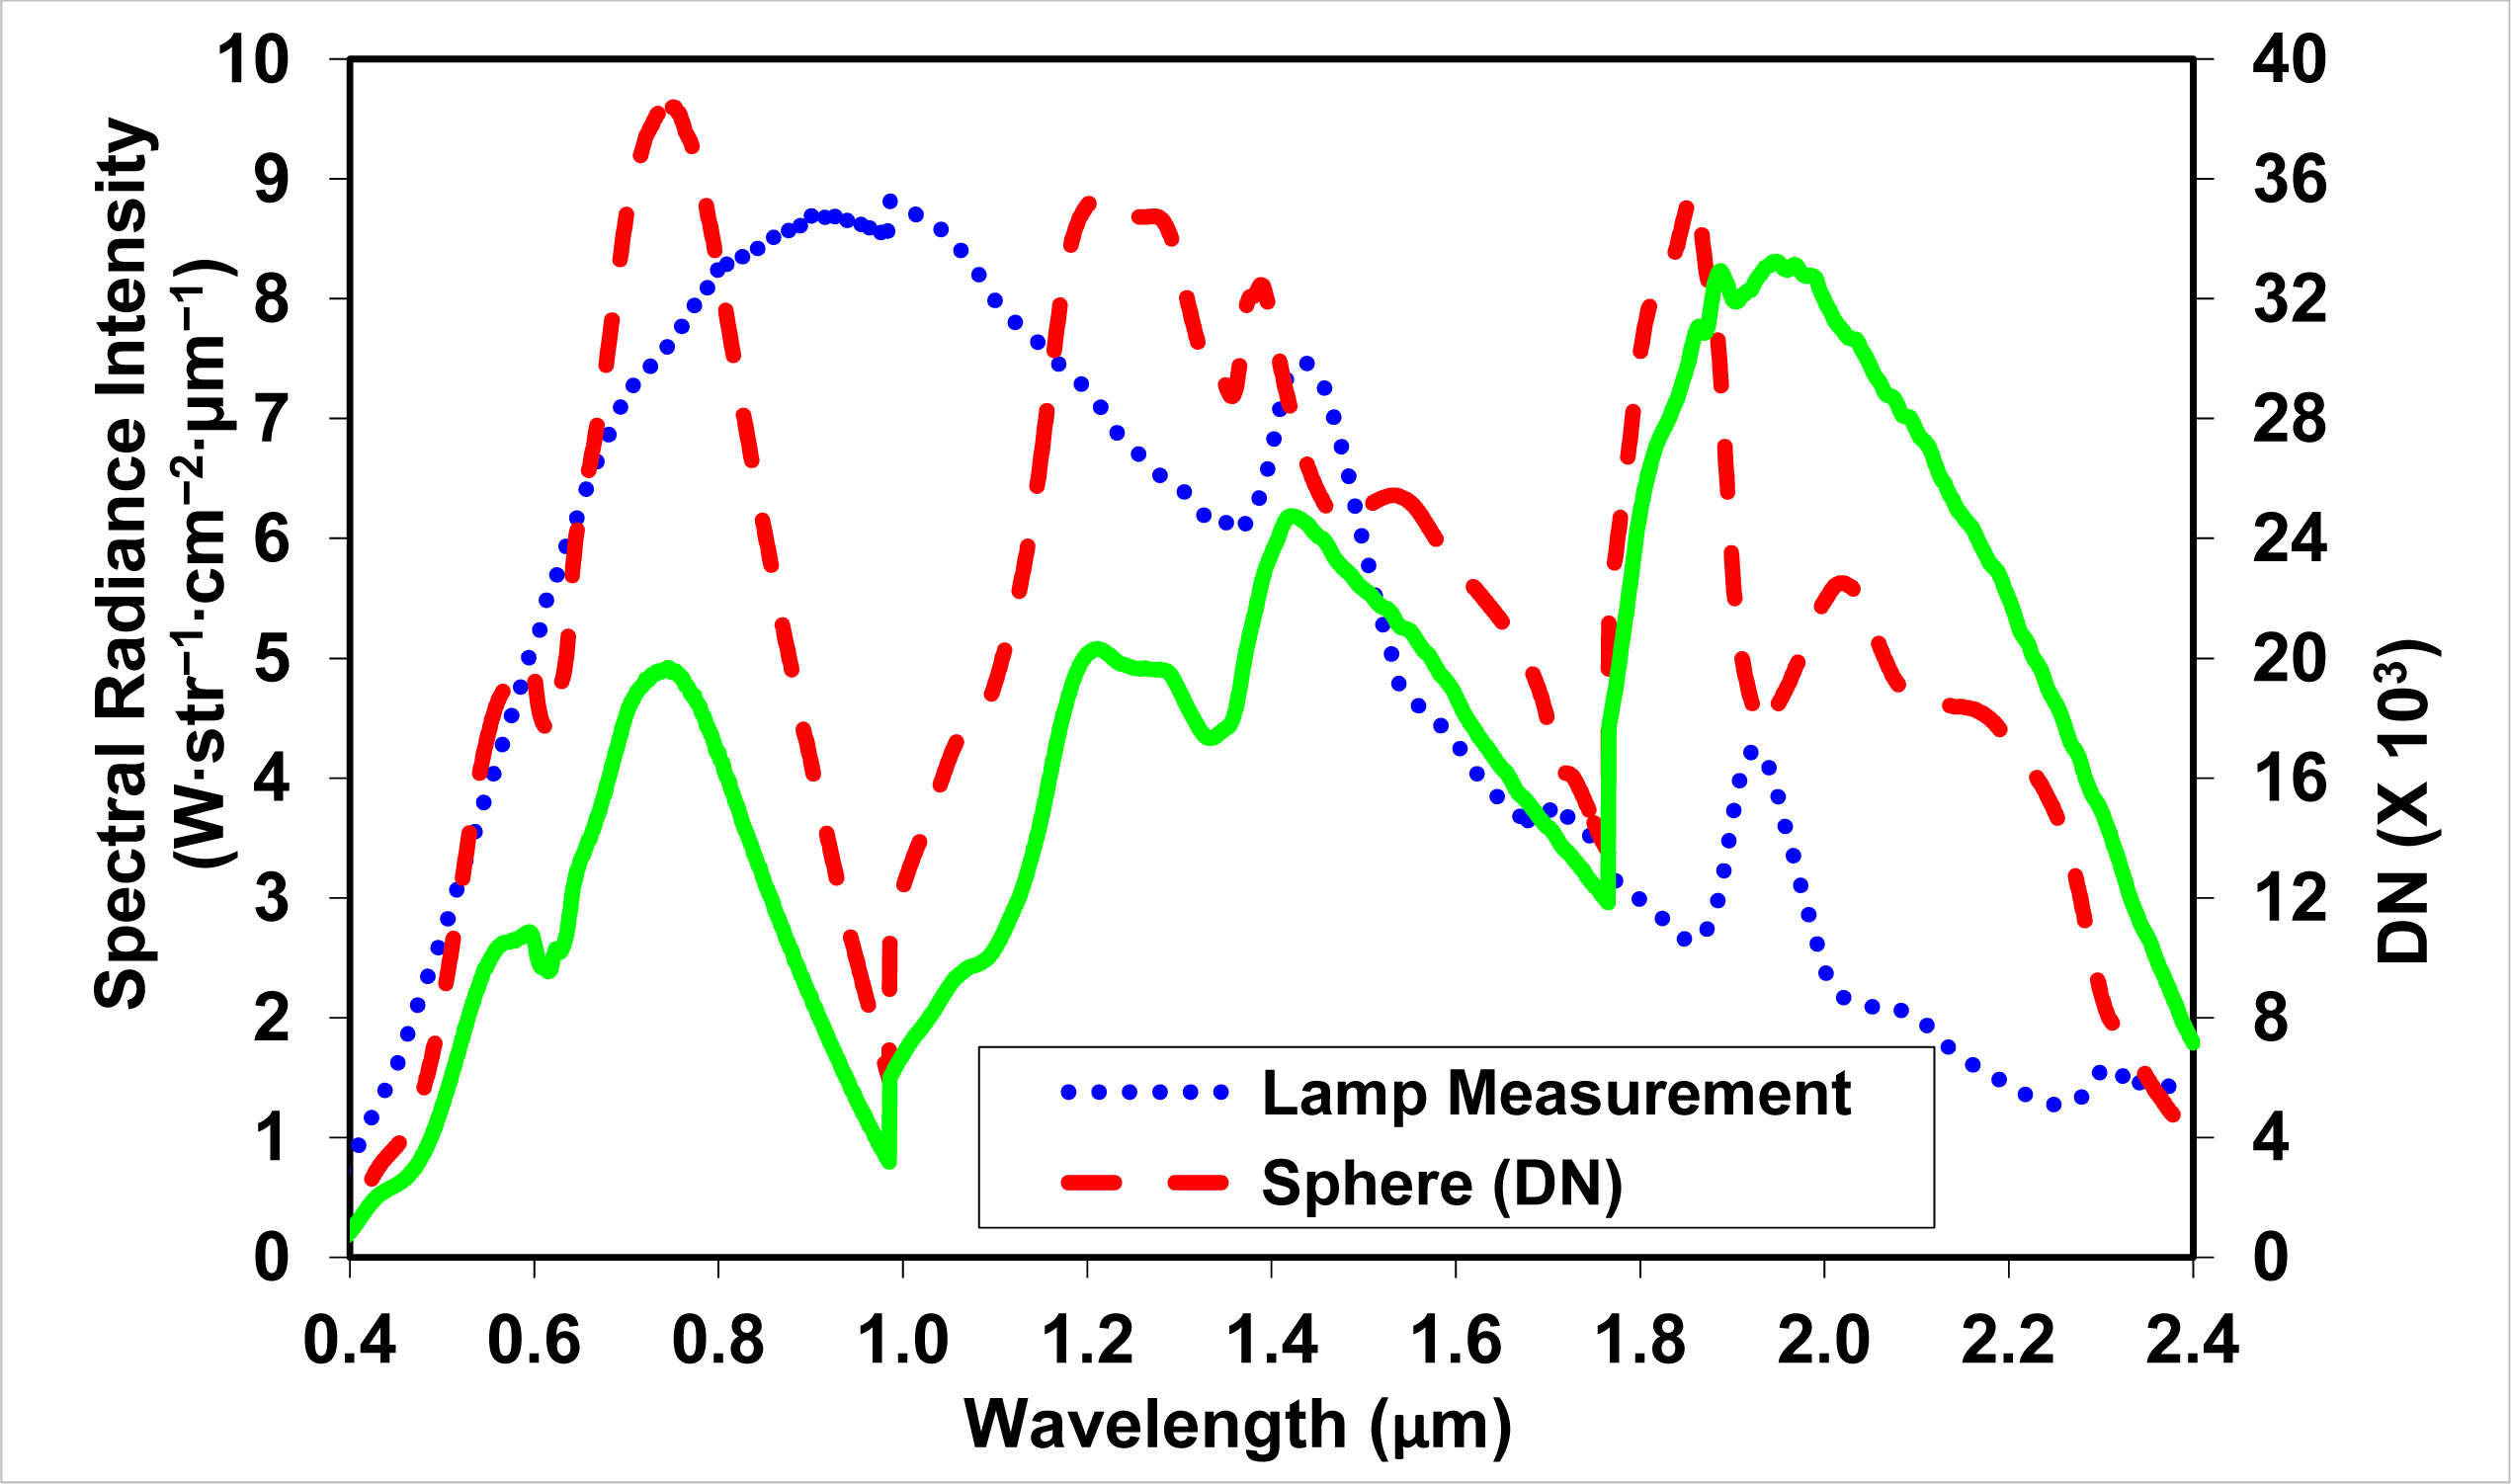
To validate the calibration curve, we used a Gilway L9390 QH lamp (12 V, 100 W) operated by a stabilized current source (Oriel 68735 regulated power supply, 110/220 V, 450 W. The power unit weighs 7.85 kg, and it can be operated in the field by a small portable generator or a 1 kW DC/AC converter) as a gray body [10] (Figure 2C). The spectrometer readout (DN) was multiplied by the calibration curve, thus yielding the spectral radiance of the lamp. However, there is a distinct difference between the two calibration methods: while the aperture of the integrating sphere fills the entire FOV limiter, the filament of the QH lamp is only a point source in it. Therefore, the calibration of the spectrometer should be performed with regard to the spectral irradiance of the aperture of the integrating sphere as measured at the FOV limiter plane Esphere (W·cm−2·μm−1), yielding the irradiance calibration factor: Kirradiance (W·cm−2·μm−1·DN−1). This is done by multiplying the values of the spectral radiance of the integrating sphere (Lsphere) by the area of the sphere aperture that is subtended by the FOV limiter (Ωaperture·D2), and by the solid angle of 1 cm2 at the FOV limiter plane, subtended in relation to the sphere aperture:
E sphere = ( L sphere × Ω aperture × D 2 ) × D 2
K irradiance = E sphere DN = L sphere × Ω aperture DN = K radiance × Ω aperture
It is evident from Equation (3) that the irradiance does not depend on the distance D between the iris of the FOV limiter and the aperture of the integrating sphere. Figure 4 shows the spectral irradiance calibration curve.
When using the spectrometer to measure the irradiance of the lamp (Figure 2C), the irradiance value Elamp is dependent on the distance to the fiber aperture and not to the iris (Dlamp) because the filament of the lamp is a point source. As a result, the lamp spectral radiant intensity (Ilamp (W·str−1·μm−1)) is obtained by multiplying the signal measured by the spectrometer (DN) by the irradiance calibration factor (Kirradiance) and dividing the product by the solid angle that 1 cm2 at the fiber aperture plane subtends in relation to the lamp. This angle is equal to D lamp 2.
I lamp = K irradiance × DN × D lamp 2
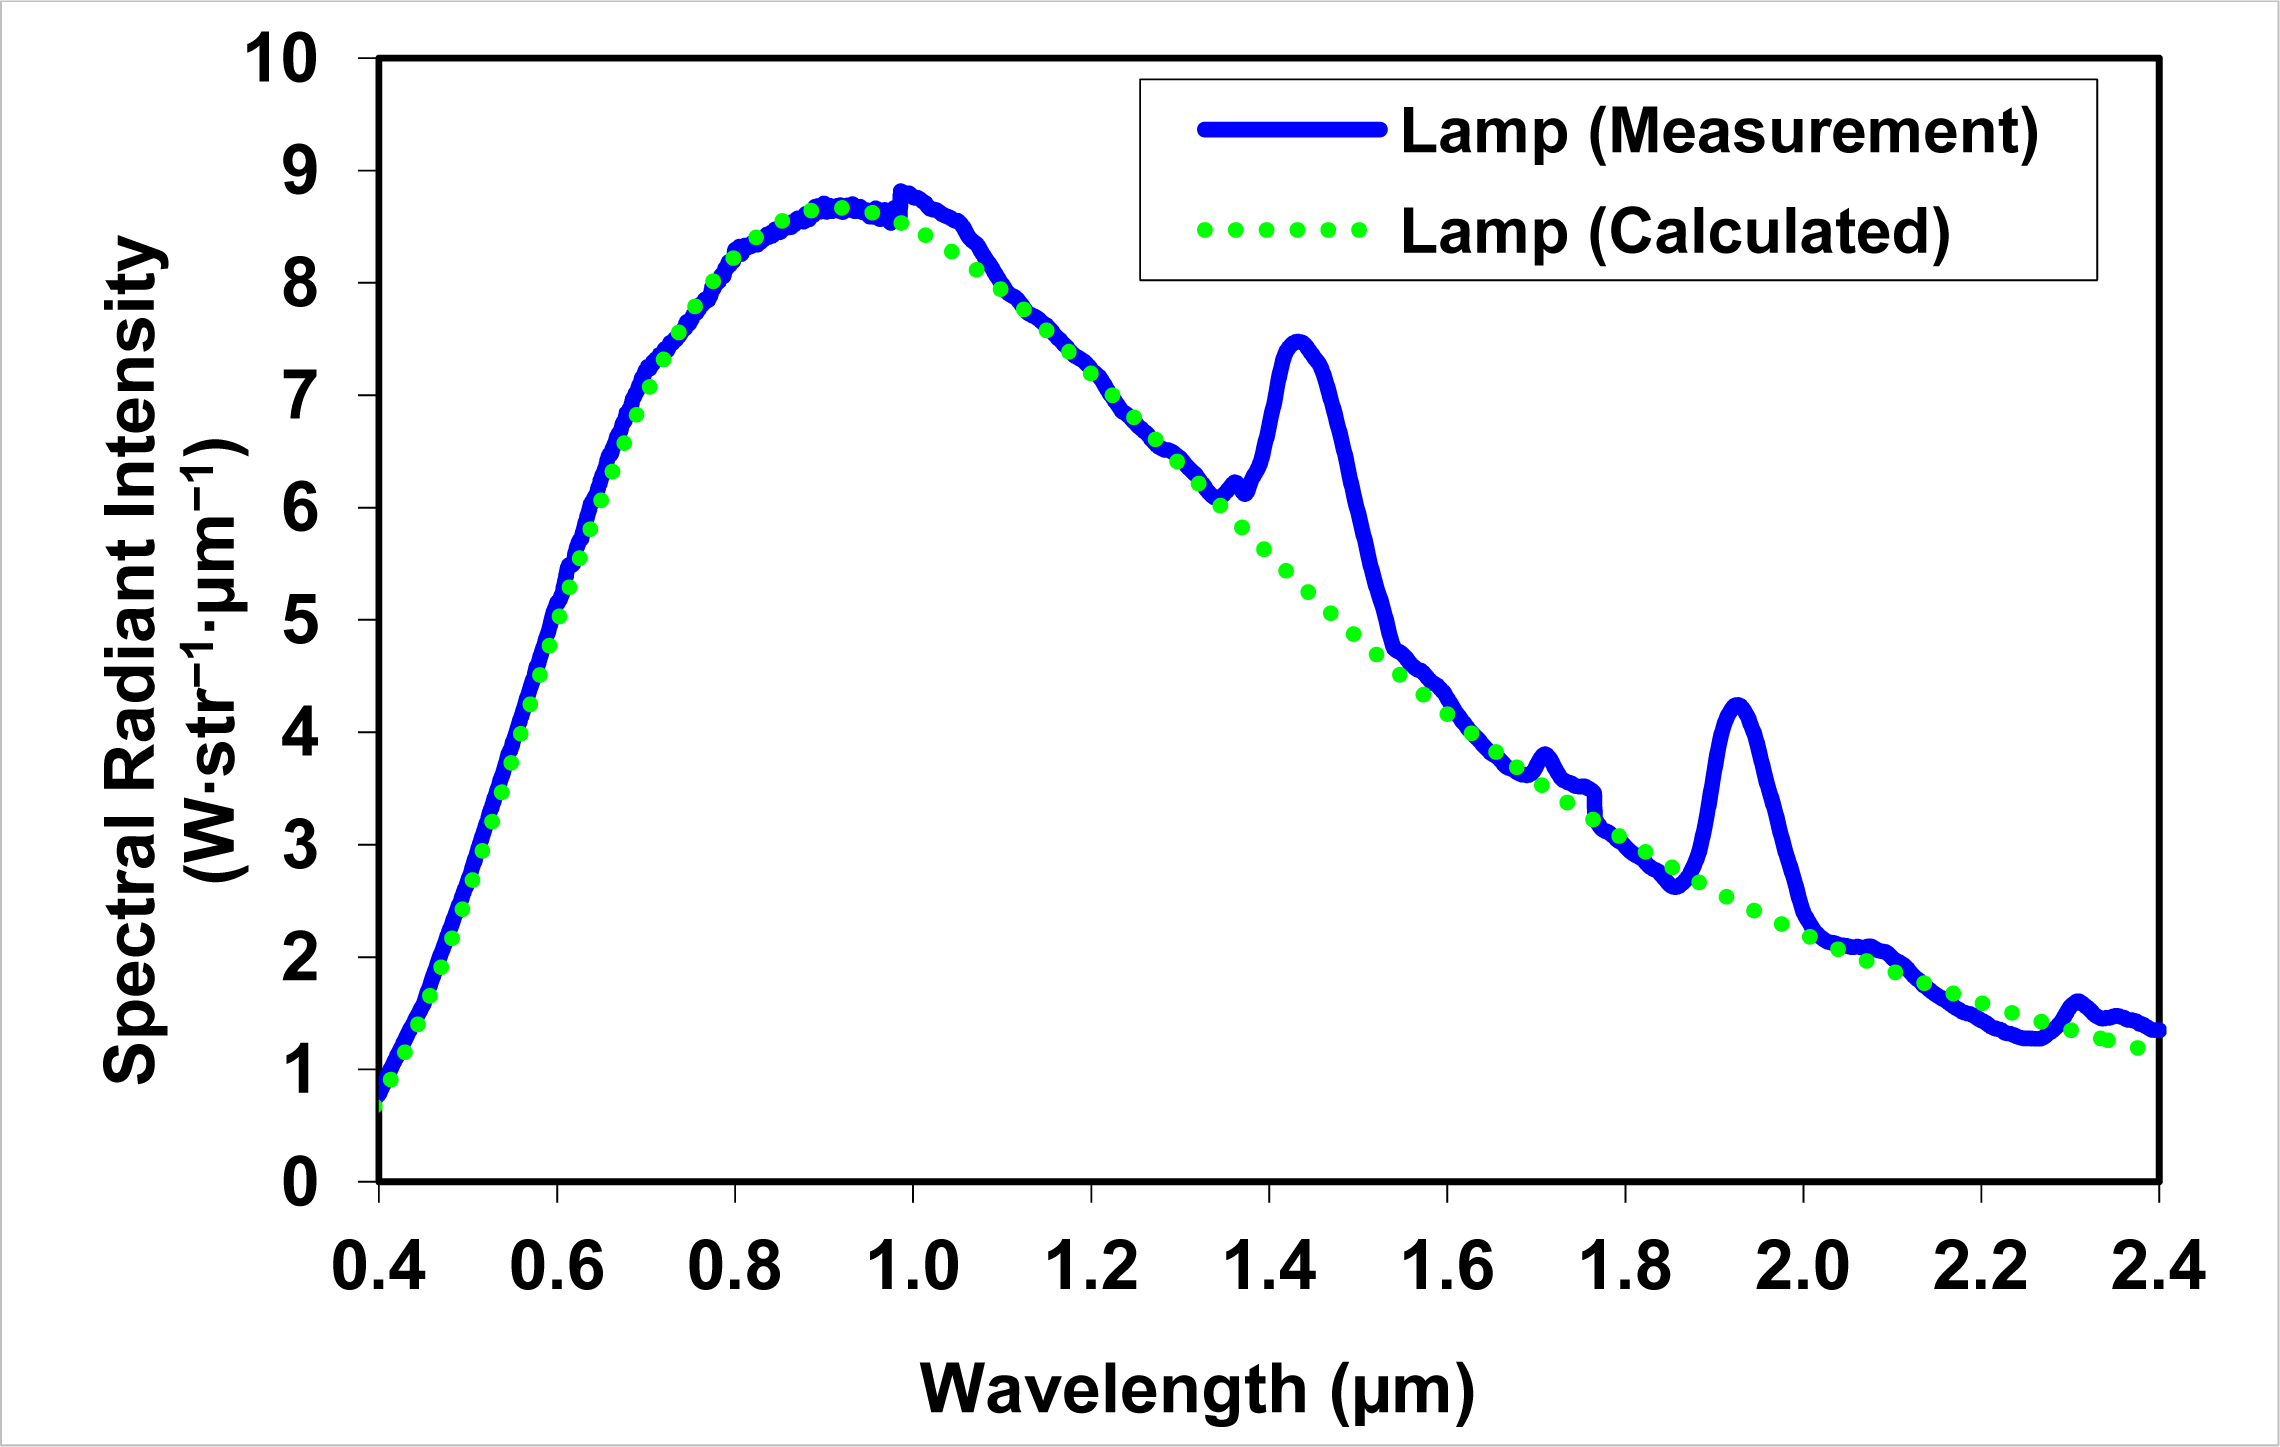
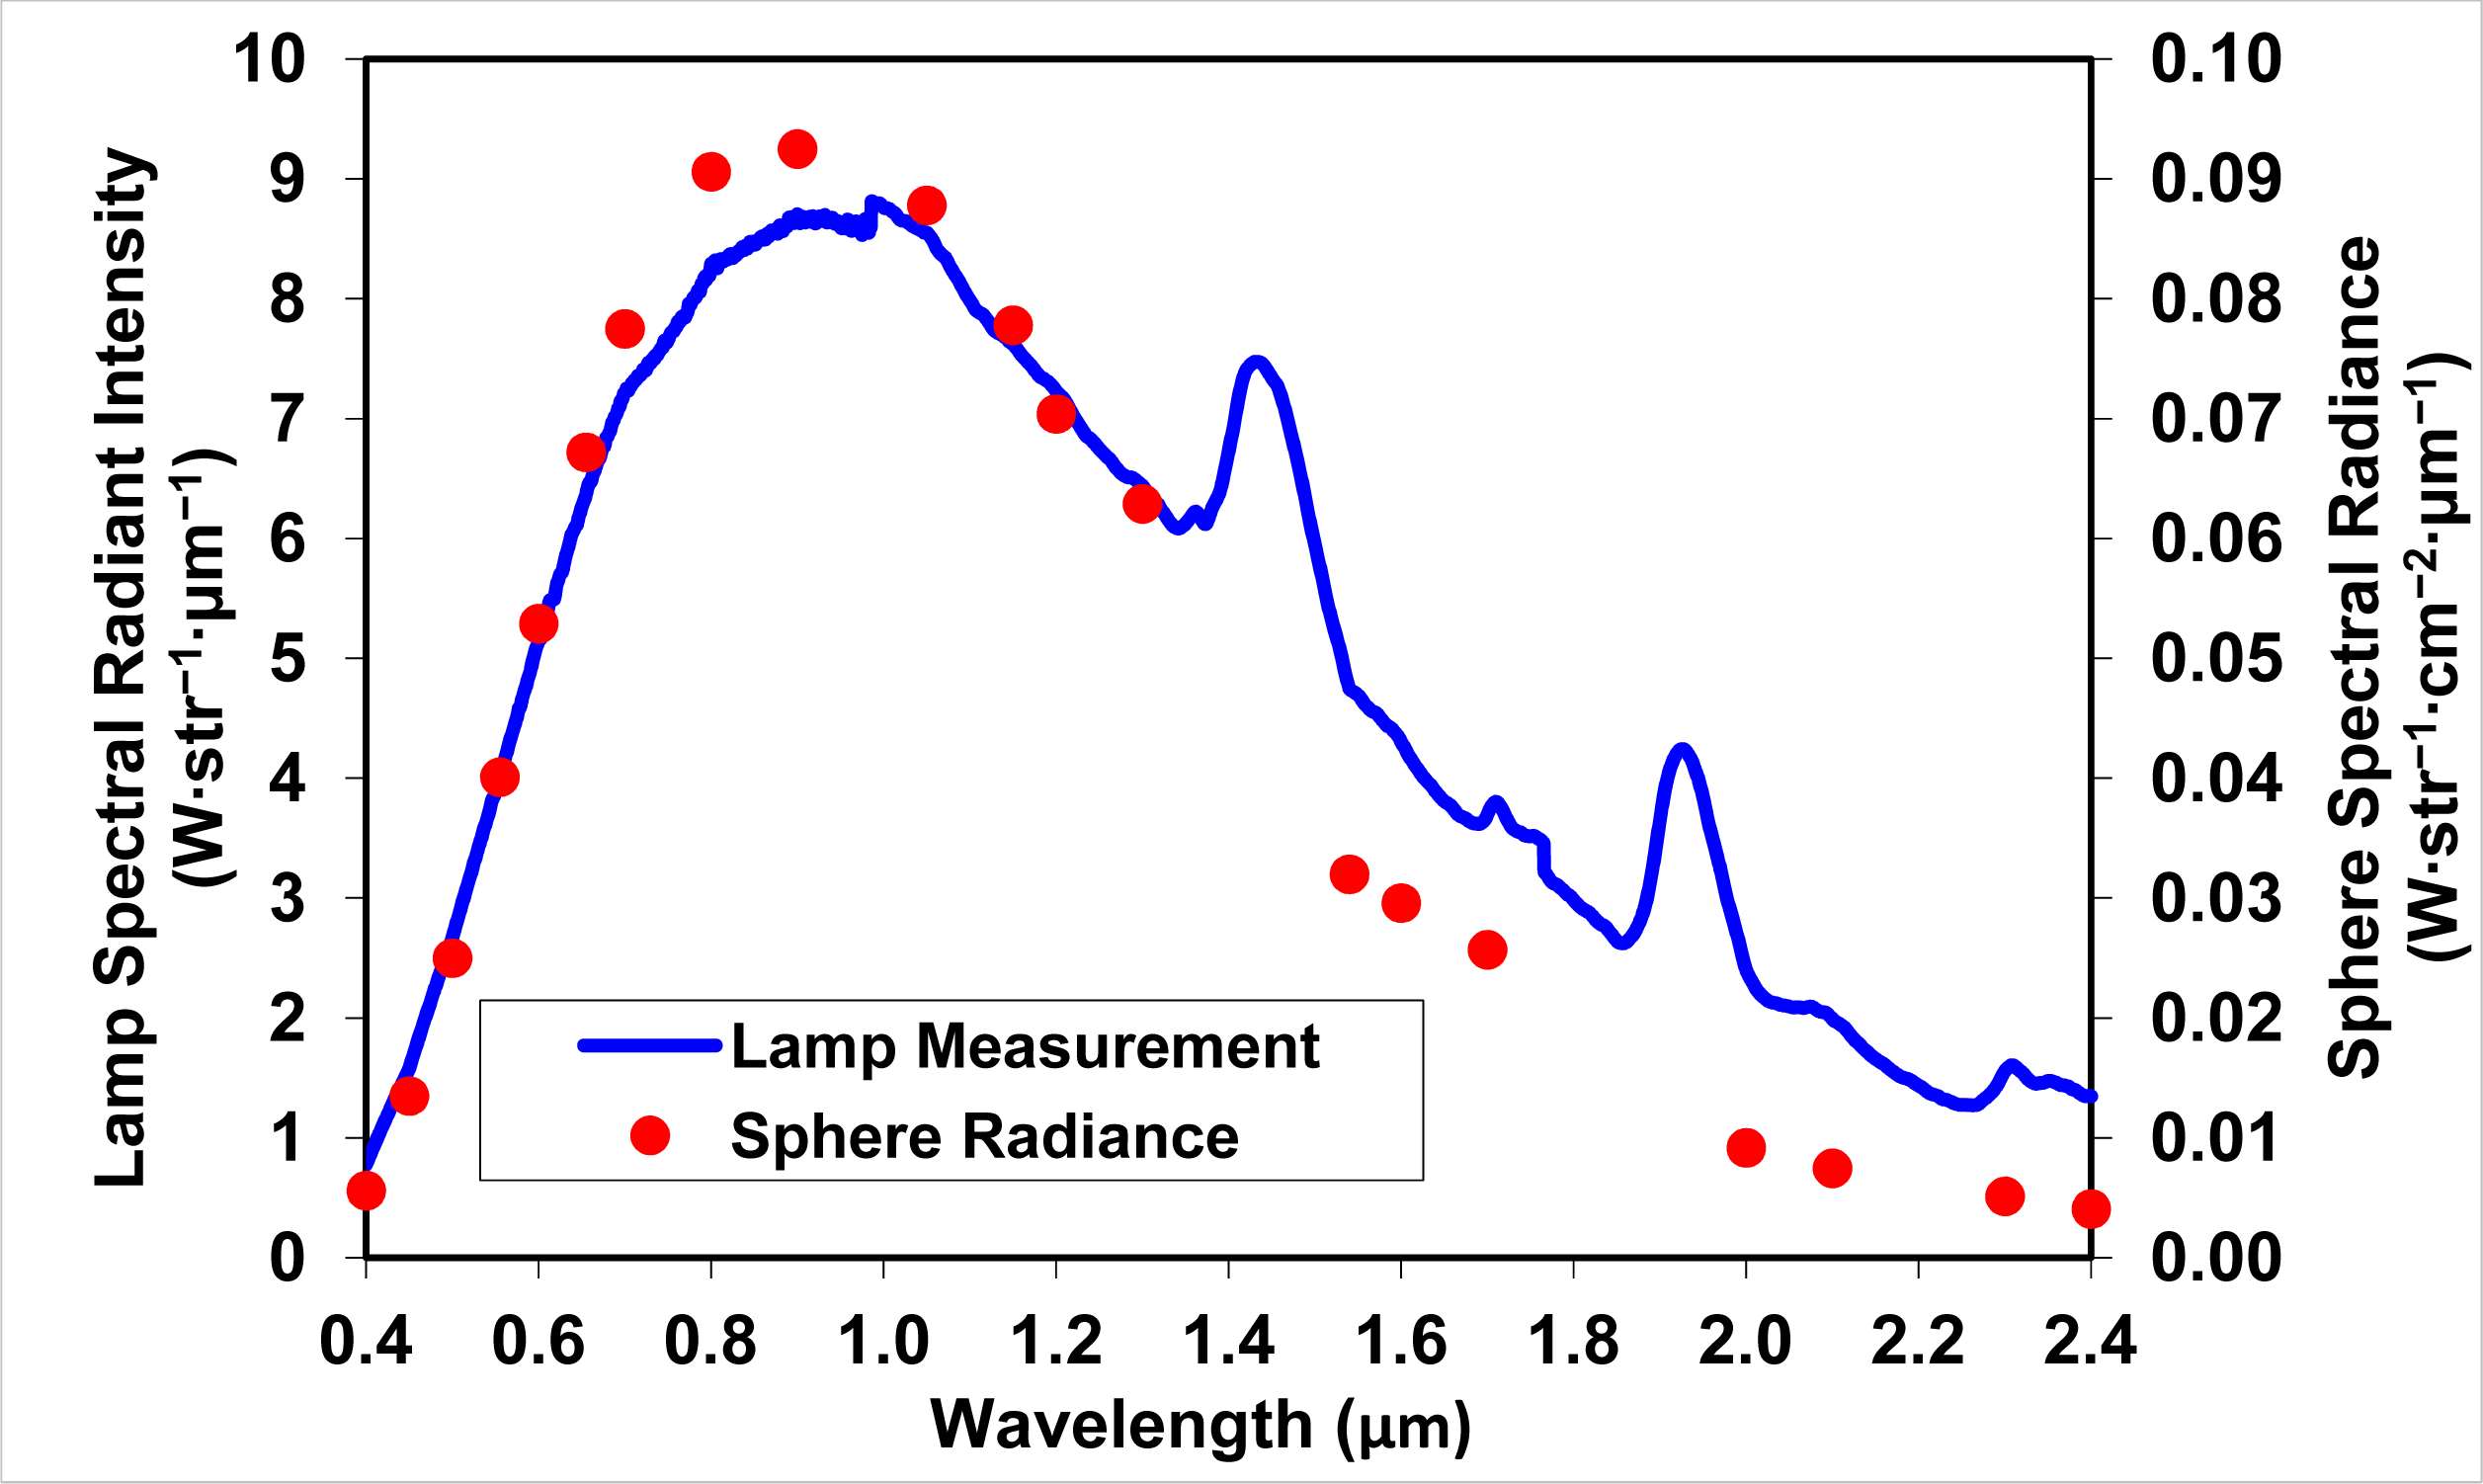
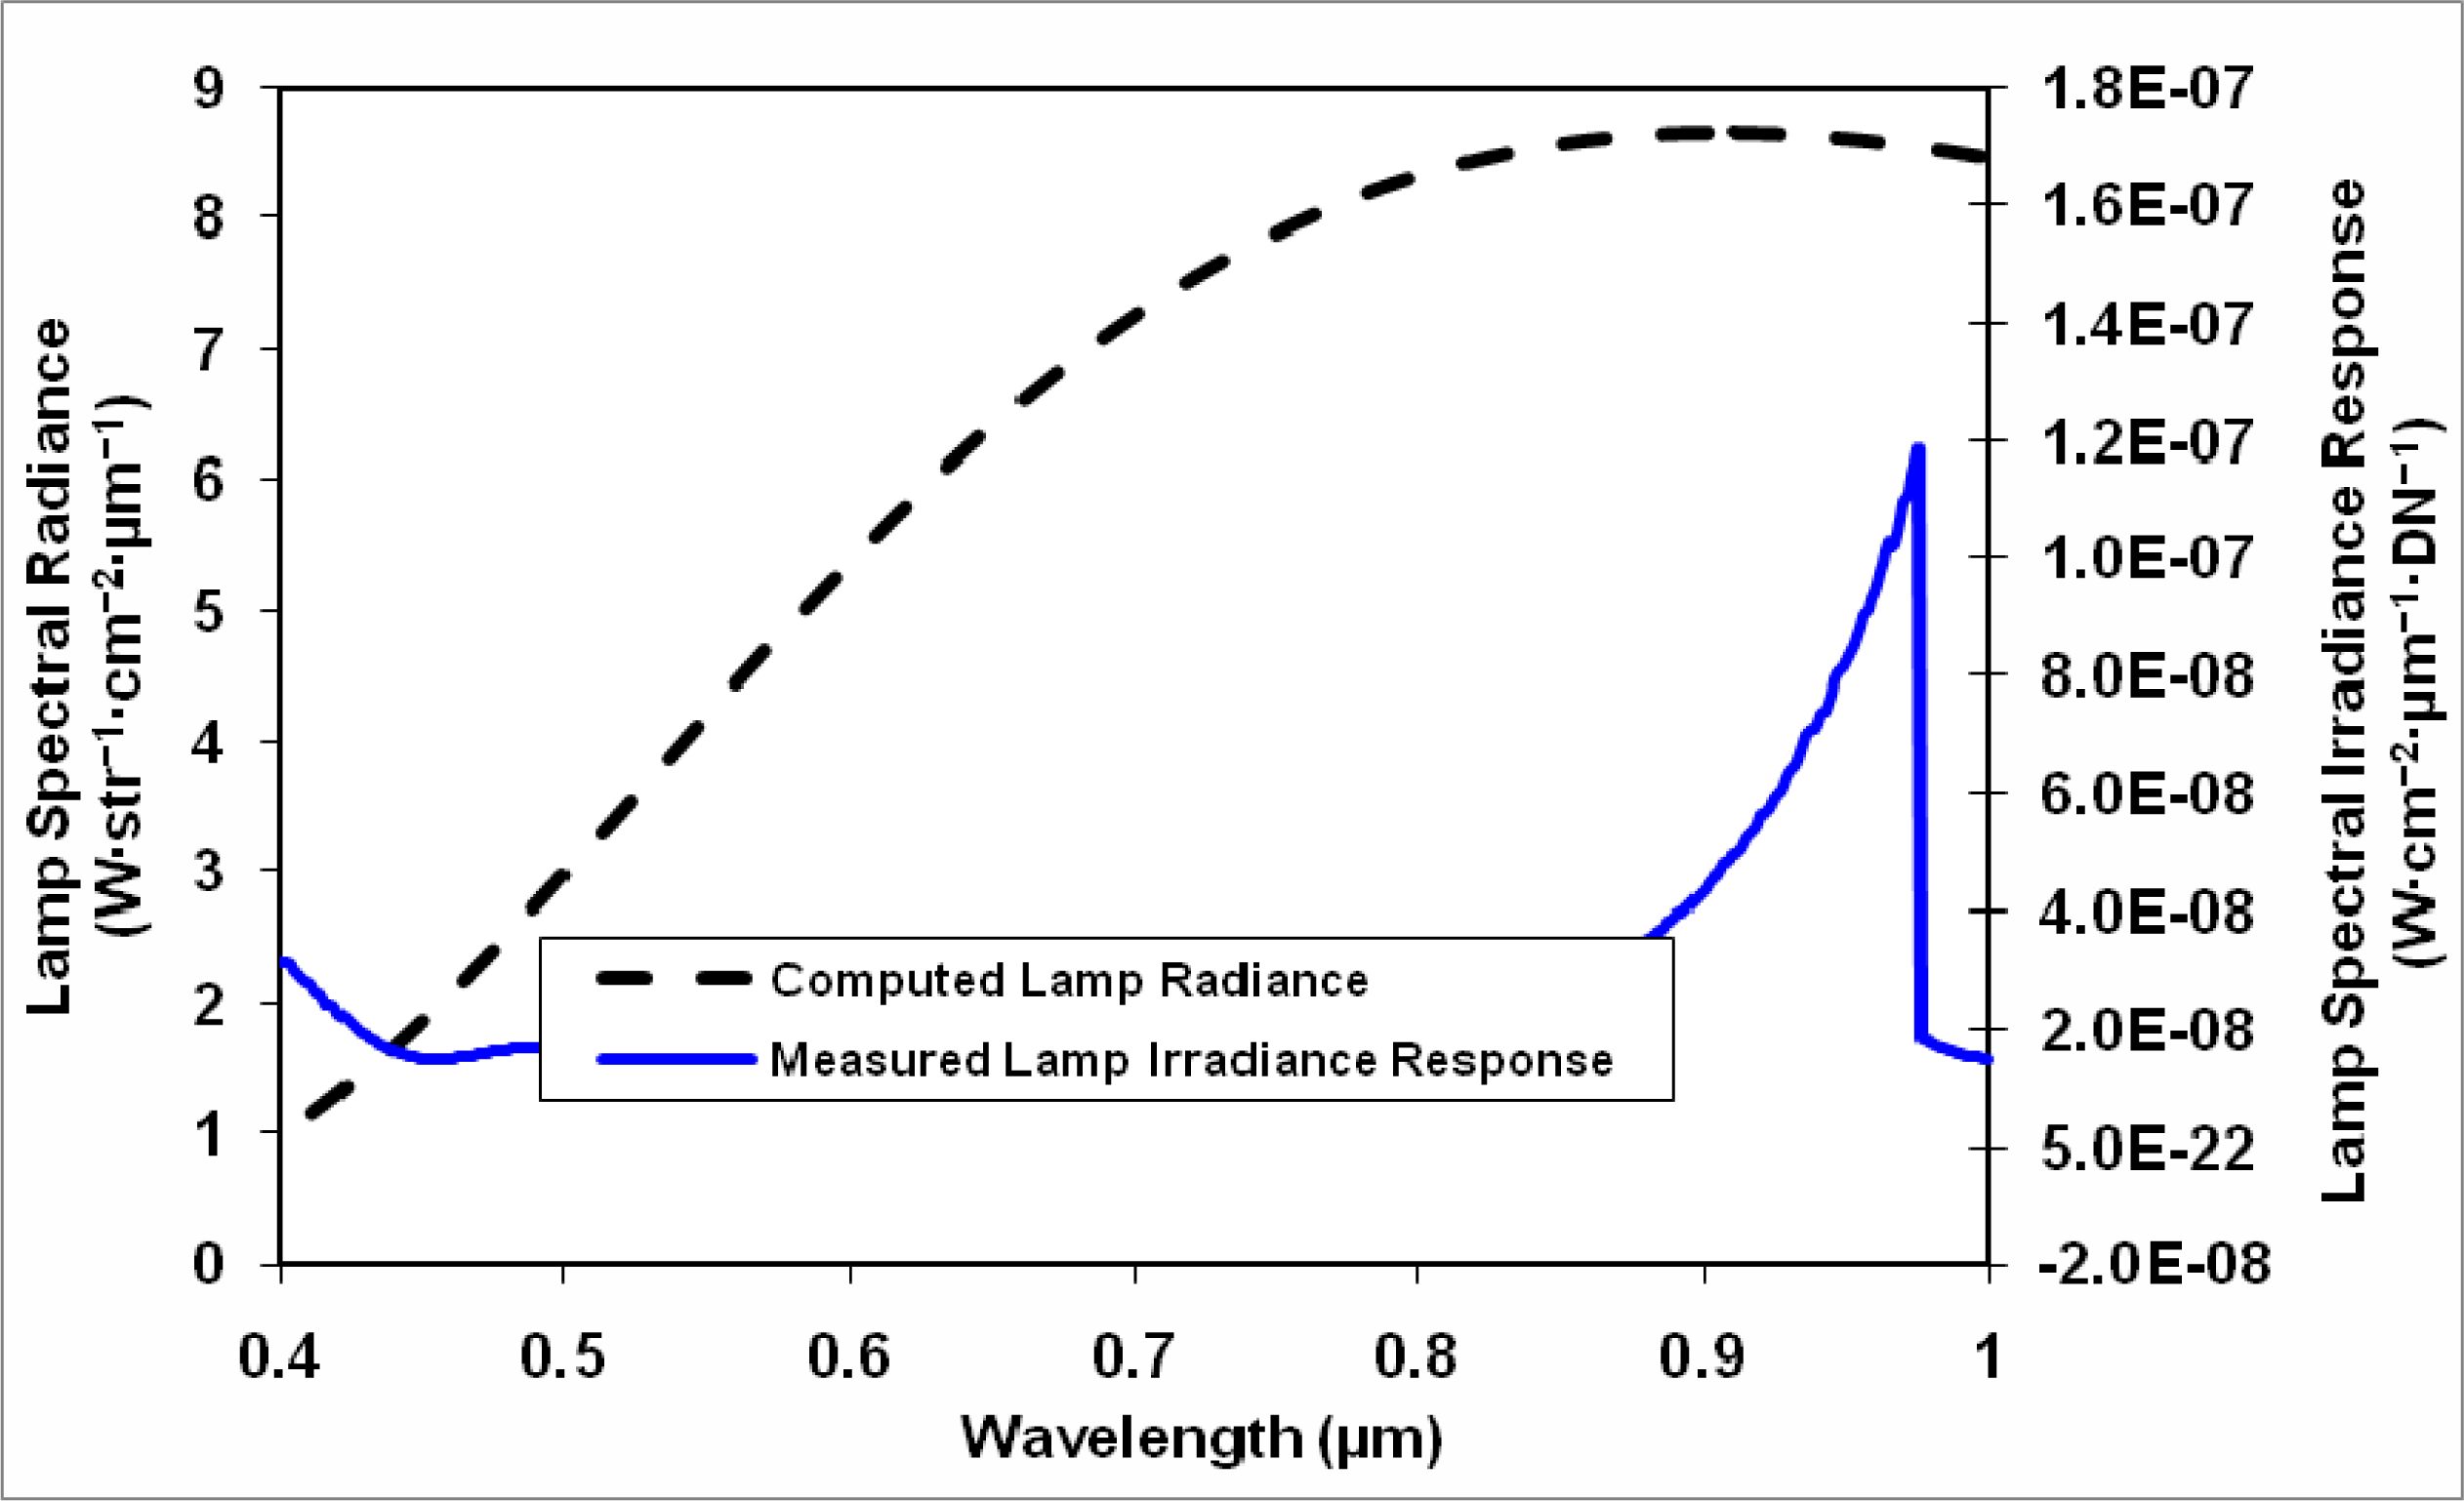
Following this equation, the measured spectral radiant intensity of the lamp (dotted line in Figure 5) does not seem to be a gray body and has a strange wavelength dependence. This can be explained by the visual comparison between the lamp spectral radiant intensity and the spectral radiance of the integrating sphere as shown in Figure 6. From this figure, it is evident that the radiant intensity of the lamp shows spectral offsets from a black (or gray) body curve at those wavelengths where there are no calibration values for the sphere radiance (probably due to the water absorption by the sphere’s BaSO4 coating). This absorption is intensified by multiple reflections of light inside the integrating sphere. By ignoring these artifacts (caused by water absorption bands), we could compare the measured spectral behavior of the lamp with a theoretical gray body according to Planck’s law. As the tungsten filament is not a perfect gray body emitter, we assumed that its emissivity is wavelength dependent. From this, we concluded that for a filament area of 3 × 5 mm (according to the data sheet of this lamp), the spectral radiant intensity of the lamp matches that of a source with a temperature of 3,000 K (Figure 7). Consequently, the wavelength-dependent emissivity (ελ) is defined as:
ɛ λ = 0.745 175 λ
where λ is the wavelength in μm. Without this emissivity correction, there would be a mismatch between the calculated and measured values of the spectral radiant intensity of the lamp [11].

4. Secondary Calibration of an Integrating Sphere

Sometimes, we have an integrating sphere that has no reliable calibration curve or an integrating sphere with a variable inner FOV limiter that varies the illumination intensity at its aperture. For these cases, we can use the QH lamp as a secondary calibration source and, via two calibration methods, get a reliable calibration of the integrating sphere. We will show that both calibration methods yield almost identical results.

4.1. Calibration of the Sphere Using the Reflectance of the QH Lamp from a Spectralon Panel

The calibration of the sphere using the reflectance of the QH lamp from a Spectralon panel is a two-stage method applicable when the spectrometer is equipped with pre-optic attachments (lenses of 1°, 5°, or 10°) used to couple light into the fiber:
(1)
In the first stage, the reflected radiance of the Spectralon was used to calibrate the spectrometer. The Spectralon panel is a Lambertian panel that has a reflectivity value very close to 1 between 350 and 2,500 nm;
(2)
Once the spectrometer was calibrated, it was used to calibrate the second integrating sphere. Figure 2D describes the layout of the equipment.
The Spectralon panel was placed at two distances of Dspectralon = 23.5 and 49.7 cm from the FOV limiter’s aperture. The Gilway L9390 QH lamp was placed close to the FOV limiter. Taking into account the fact that the FOV limiter was 103.6 mrad, the spectrometer measured only the radiance reflected back from the central part of the illuminated Spectralon panel. The spectral radiance reflected from this part of the panel (Lspectralon) was uniform and equal to the panel irradiance divided by π, where the panel irradiance was equal to the known value of the spectral radiant intensity (Ilamp) of the QH lamp divided by D Spectralon 2:
L spectralon = I lamp π × D Spectralon 2
The signal measured by the spectrometer (DNSpectralon) was used to divide the spectral radiance of the Spectralon panel (LSpectralon) to receive the spectrometer calibration factors (or spectral radiance response) in radiance units:
K radiance = L Spectralon DN Spectralon = I lamp π × D Spectralon 2 × DN Spectralon
It should be noted (Figure 8) that the spectral radiance response as obtained at the two distances are almost identical. Next, the integrating sphere with unknown calibration was placed at a distance where the FOV limiter was smaller than the sphere aperture (the absolute value of this distance is not important, as demonstrated in Section 3). The product of the signal measured by the spectrometer (DNsphere) and the spectrometer calibration factor (Kradiance) is the spectral radiance of the integrating sphere (Lsphere):
L sphere = DN sphere × K radiance
As the Spectralon panel is illuminated in a homogeneous fashion, in particular when the QH lamp is far away from it, this method is suitable for the cases in which the spectrometer has pre-optics to couple light into the fiber. Figure 8 shows the sphere spectral radiance in the VIS-NIR as obtained by this method. As it is quite usual that the ASD spectrometer is characterized by a slight uncontrolled shift between acquired spectrum of the three detectors (VIS-NIR and the two SWIR ones), to avoid inaccurate results, the latter two are not presented.

4.2. Calibration of the Sphere Using the QH Lamp Directly

The calibration of the sphere using the QH lamp directly is also a two-stage method applicable when the spectrometer is equipped with bare fiber:
(1)
In the first stage, the irradiance from the lamp was used to calibrate the spectrometer;
(2)
Once the spectrometer was calibrated, it was used to calibrate the second integrating sphere.
For this calibration, the QH lamp was set at a large distance from the FOV limiter aperture of the fiber (Dlamp = 428.4 cm), and its signal was measured directly using the spectrometer (Dlamp). The lamp irradiance was equal to the lamp radiant intensity Ilamp divided by D lamp 2.
E lamp = I lamp D lamp 2
The irradiance reaching the fiber aperture was divided by the measured signal. This division resulted in the calibration factor of the spectrometer in irradiance units.
K irradiance = E lamp DN lamp = I lamp D lamp 2 × DN lamp
Next, the integrating sphere with unknown calibration was placed at a distance small enough from the fiber so that the FOV limiter was smaller than the sphere’s aperture. Again, the absolute value of this distance is not important. The measured signal (DNsphere) was multiplied by the spectrometer irradiance calibration value −Kirradiance, and their product was divided by the solid angle of the FOV limiter aperture (Ωaperture). This provided us the spectral radiance of the integrating sphere (Lsphere) by direct measurement of the QH lamp.
L sphere = K irradiance × DN sphere Ω aperture
Results of the direct calibration of the integrating sphere from the QH lamp are presented in Figure 9. Figure 10 shows the resulting spectral radiance of an un-calibrated integrating sphere as calculated by these two methods. As one can see, these methods gave considerably good results with a difference smaller than 12% between them. The great advantage of this calibration is that it is applied to the entire spectral range of the spectrometer and is based on a calibrated QH lamp (NIST traceable or from a NIST-calibrated integrating sphere).

5. Discussion

We have demonstrated a procedure for the calibration of an ASD spectrometer at absolute irradiance units. This procedure is especially useful when the measurement procedure requires that the spectrometer will be calibrated before or after each measurement. The basis of our method relies on the calibration of a QH lamp prior to going into the field. This part is implemented in the laboratory using a calibrated integrating sphere. The advantage of using the lamp, as opposed to the integrating sphere, is twofold: (1) the QH lamp and the stabilized current source are easily transported to the field, while the integrating sphere is not easily taken out of the laboratory environment; and (2) the QH lamp provides a continuous calibration curve, while in most cases, the integrating sphere is calibrated for discrete wavelengths.
By using a calibrated lamp, the calibration of a spectrometer, in field conditions and on-board an aircraft, is easily performed. One obvious shortcoming of using a QH lamp that is calibrated by us is that we remove ourselves from the NIST standard (according to which the integrating sphere is calibrated), and adding some error to our calibrations. However, this application allows for the calibration to be conducted under similar conditions to those under which the measurements are to be made [12] and in spectral regions where the integrating sphere is not calibrated, thereby reducing another source of error.
It has also been demonstrated that the calibrated lamp could be used for a secondary calibration of an integrating sphere, in cases when the sphere calibration is unknown. Though expensive NIST-traceable calibrated FEL lamps are used as a standard, we chose to demonstrate the application of inexpensive and fairly available QH lamps. We have shown that a relatively accurate calibration can be achieved for the VIS-NIR-SWIR region using these lamps. Currently, several groups in the remote sensing community lack the resources to maintain expensive measurement equipment, which has led to the establishment of an “equipment pool.” One of these is the Field Spectroscopy Facility (FSF) of the UK Natural Environment Research Council (NERC) [13]. Such equipment is often considered infallible despite its calibration not having been maintained since its purchase [2]. The presented method, using standard QH lamps, could contribute to the generation of better quality and more uniform data across research groups. Only one visit to a laboratory with an integrating sphere is required to calibrate several QH lamps. Caution should be taken when using any lamp after transport, as changes in spectral radiance (> 1%) have been documented to occur in one of three FEL lamps during transportation [14,15]. Therefore, it is good practice to calibrate several lamps and compare them from time to time to make sure no great changes to the calibration lamp radiance have occurred. It is advised that no lamp be used for over 100 hours without recalibrating its radiance, even without transport.

6. Conclusions

In the current paper, we presented a pragmatic procedure for in-field calibration of both ground and airborne hyperspectral point spectrometers. The calibration of the spectrometer using this procedure can be performed before and after each field or flight campaign. The use of a quartz halogen (QH) lamp enables a continuous wavelength calibration of any fiber-based field spectrometer. This mode of calibration is more advantageous than the use of an integrating sphere, for which the calibration values are discrete and do not cover the entire spectral range. The calibration protocols shown herein are simple and fit research groups with limited calibration resources. Thus, this paper offers the growing remote sensing community the means to produce reliable spectral field data, and can serve as a prototype for developing tailored-made approaches for in-field absolute calibration of other spectrometers. In addition, the calibrated QH lamp could be used as a standard for a secondary calibration of an integrating sphere in case its calibration is unknown.

Acknowledgments

Offer Rozenstein was supported by the Pratt foundation.
The authors wish to thank the anonymous reviewers for their valuable comments.

Author Contributions

Offer Rozenstein contributed to the experimental work and analysis of the data, reviewed literature, prepared the manuscript and the figures. Adam Devir has conceived the concept of the project and contributed to the experimental work and analysis of the data. Arnon Karnieli supervised and coordinated the research activity. All authors participated in editing and revision of the paper.

Conflicts of Interest

The authors declare no conflict of interest.

References

  1. Milton, E. Review article principles of field spectroscopy. Int. J. Remote Sens 1987, 8, 1807–1827. [Google Scholar]
  2. Milton, E.J.; Schaepman, M.E.; Anderson, K.; Kneubühler, M.; Fox, N. Progress in field spectroscopy. Remote Sens. Environ 2009, 113, S92–S109. [Google Scholar]
  3. Schaepman, M.E.; Ustin, S.L.; Plaza, A.J.; Painter, T.H.; Verrelst, J.; Liang, S. Earth system science related imaging spectroscopy—An assessment. Remote Sens. Environ 2009, 113, S123–S137. [Google Scholar]
  4. Walthall, C.; Williams, D.; Dykes, W.; Young, D. Principles for helicopters as platforms for optical wavelength remote sensing and the NASA GSFC/WFF helicopter remote sensing system. Remote Sens. Rev 2001, 20, 169–205. [Google Scholar]
  5. Schaepman, M.E.; Dangel, S. Solid laboratory calibration of a nonimaging spectroradiometer. Appl. Opt 2000, 39, 3754–3764. [Google Scholar]
  6. Caras, T.; Karnieli, A.; Hedley, J. Exploring field-of-view non-uniformities produced by a hand-held spectroradiometer. J. Spectr. Imaging 2011. [Google Scholar] [CrossRef]
  7. MacArthur, A.; MacLellan, C.J.; Malthus, T. The fields of view and directional response functions of two field spectroradiometers. IEEE Trans. Geosci. Remote Sens 2012, 50, 3892–3907. [Google Scholar]
  8. Knee, P.C. Investigation of the uniformity and ageing of integrating spheres. Anal. Chim. Acta 1999, 380, 391–399. [Google Scholar]
  9. Brown, S.W.; Johnson, B.C. Development of a portable integrating sphere source for the earth observing system’s calibration validation programme. Int. J. Remote Sens 2003, 24, 215–224. [Google Scholar]
  10. Slater, P.N. Remote Sensing: Optics and Optical Systems; Addison-Wesley Publishing Co., Inc.: Reading, MA, USA, 1980; p. 575. [Google Scholar]
  11. Guenther, B. Practical aspects of achieving accurate radiometric field measurements. Remote Sens. Environ 1987, 22, 131–143. [Google Scholar]
  12. Anderson, K.; Milton, E.; Rollin, E. Calibration of dual-beam spectroradiometric data. Int. J. Remote Sens 2006, 27, 975–986. [Google Scholar]
  13. Rollin, E.; Milton, E. The UK Natural Environment Research Council Equipment Pool for Field Spectroscopy(NERC-EPFS). Proceedings of the 5th International Colloquium on Physical Measurements and Signatures in Remote Sensing, Courchevel, France, 14–18 January 1991.
  14. Woolliams, E.R.; Fox, N.P.; Cox, M.G.; Harris, P.M.; Harrison, N.J. Final Report on CCPR K1-a: Spectral irradiance from 250 nm to 2500 nm. Metrologia 2006. [Google Scholar] [CrossRef]
  15. Fox, N. Validated Data and Removal of Bias through Traceability to SI Units. In Post-Launch Calibration of Satellite Sensors; Morain, S.A., Budge, A.M., Eds.; Taylor and Francis: London, UK, 2004; pp. 31–42. [Google Scholar]
Figure 1. The angular dependence of an ASD spectrometer bare optical fiber transmittance. It is apparent that the bare optical fiber has a relatively flat response in the center of the field of view (FOV).
Remotesensing 06 01158f1
Figure 2. Schematic drawing of the measurement equipment: (A) Blowup of the field of view (FOV) limiter. The bare fiber is attached to the left end of the cylinder. Measurements are in mm; (B) The spectrometer attached to the FOV limiter is aligned in front of an integrating sphere; (C) The spectrometer attached to the FOV limiter is aligned in front of the QH lamp operated by a stabilized direct current (DC) source; (D) The spectrometer attached to the field of view (FOV) FOV limiter is aligned in front of Spectralon panel. An incandescent lamp operated by a stabilized current source is placed near the FOV limiter aperture in front of the Spectralon panel.
Remotesensing 06 01158f2
Figure 3. Calibration according to integrating sphere radiance.
Remotesensing 06 01158f3
Figure 4. Calibration according to integrating sphere irradiance.
Remotesensing 06 01158f4
Figure 5. The signal measured in digital numbers (DN) of the lamp (solid line) and the integrating sphere (dashed line). Radiance of the lamp (dotted line) after employing the calibration coefficients derived by interpolating the discrete calibration points of the integrating sphere (shown in Figure 6).
Remotesensing 06 01158f5
Figure 6. Comparison between the integrating sphere calibration (dots: Represent the discrete wavelengths for which the integrating sphere was calibrated) and the measured lamp radiant intensity (solid line: Derived by interpolating the dots to create a calibration curve). Note that this causes great inaccuracies in areas of water absorption by the barium sulfate inner coating of the integrating sphere since there are not enough calibration points in those areas to capture the absorption features.
Remotesensing 06 01158f6
Figure 7. Measured vs. calculated lamp radiant intensity. The mismatch between the measured and calculated lamp radiance is corrected when accounting for the spectral changes of the lamp emissivity. The radiance was calculated assuming a temperature of 3,000 °K, a filament area of 3 × 5 mm and an emissivity defined by ελ = 0.745 − 175λ.
Remotesensing 06 01158f7
Figure 8. Results of integrating sphere calibration by lamp reflectance of a Spectralon panel. The dashed and dotted lines represent calibration curves from two different distances from the lamp to the Spectralon panel (D1 = 23.5 cm, D2 = 49.7 cm). Note that both curves are almost identical, demonstrating that the measuring distance is insignificant. The solid line is the integrating sphere radiance derived by the calibration curve from the last step.
Remotesensing 06 01158f8
Figure 9. Results of integrating sphere direct calibration from a quartz halogen (QH) lamp. The solid line represents the calibration curve obtained by direct calibration from a QH lamp. The dashed curve is the computed lamp radiance.
Remotesensing 06 01158f9
Figure 10. Comparison of integrating sphere calibration using the lamp reflectance of a Spectralon panel (dashed line) and by direct calibration from a lamp (dotted line). Note that the ratio between the two calibrations is smaller than 12% throughout most of the VIS-NIR spectral region (solid line).
Remotesensing 06 01158f10

