1. Introduction
Monitoring of soil freezing and thawing states on large scales with high spatial and temporal resolution is especially important in high latitude ecosystems, as they affect the length of the growth season, the net primary production of organic matter, the carbon balance as well as frost damage on plants [
1–
5]. This requires an effective monitoring system, which is able to map the phase transitions within the soil and to monitor the extent as well as the temporal dynamics of the active layer in permafrost regions [
6].
Investigations on soil states and its transitions started with the availability of ERS-1 C-band images in the early Nineties [
7,
8] and continued with the ENVISAT-mission [
9], where the temporal behavior of single-polarization backscattering intensities were analyzed with respect to soil state changes [
10]. Rignot
et al. discovered a 3dB decrease in early winter, when the soil and vegetation freezes [
5,
8]. Wegmueller
et al. report that frozen bare soil can be treated like dry soils due to the minimum in liquid water content [
7]. However, Park
et al. state that only distinct thaw and freeze-up periods could be monitored by intensity analysis. In addition, scatterometer data in two frequencies (Ku- and C-band) have been used to implement a probabilistic approach for freeze/thaw state determination of the soil with accuracies exceeding 90% for Siberian tundra (excluding rocky regions and areas with high soil moisture dynamics) [
11]. In addition, Naemi
et al. developed a Surface State Flag (SSF) from single-polarization ASCAT scatterometer data using an empirical threshold approach together with soil temperature data from the ECMWF reanalysis model as auxiliary information [
12].
The availability of (fully) polarimetric information increases the ability to interpret and analyze different soil states and relates to the physical properties of the scatterers on ground (e.g., dielectric content of the soil) [
13]. Concerning SAR polarimetry, first experimental studies have been undertaken to understand polarimetric SAR scattering signatures of (snow covered) soils for mapping freeze/thaw states of the soil [
14,
15]. Khaldoune
et al. could allocate volume-type scattering mechanisms to thawed soil conditions, while surface-like scattering could be assigned to frozen soil conditions using airborne C-band data over the Bras d’Henri watershed, Canada [
15]. Additional investigations proposed dual frequency, fully polarimeric SAR data, using PALSAR L-band [
16] and RADARSAT-2 C-band [
17] data, to investigate frozen and thawed soil conditions. In [
17] a preliminary analysis of the canonical Freeman-Durden decomposition indicates dominant surface scattering over frozen soils for three agricultural test sites (Saskatchewan, Ontario, Quebec) in Canada. However, detailed scattering analyses of fully polarimetric data are still missing in order to assess the potential of polarimetric measurements for soil state monitoring.
In the following, a unique time series of RADARSAT-2 acquisitions along an entire winter period (2011/2012), supplemented by manifold in situ measurements, are investigated to evaluate the potential of SAR polarimetry at C-band (5.4 GHz) to identify soil freezing and thawing states. The test site and the experimental data from in situ measurements and SAR acquisitions of RADARSAT-2 are introduced in Section 2. The methodology for identification of soil freezing and thawing states is described in detail in Section 3 together with investigations on the behavior of the dielectric constant under freezing conditions. Results for soil state monitoring at C-band with fully polarimetric RADARSAT-2 data are shown in Section 4 followed by a summary in Section 5 and conclusions in Section 6.
2. Test Site and Experimental Data
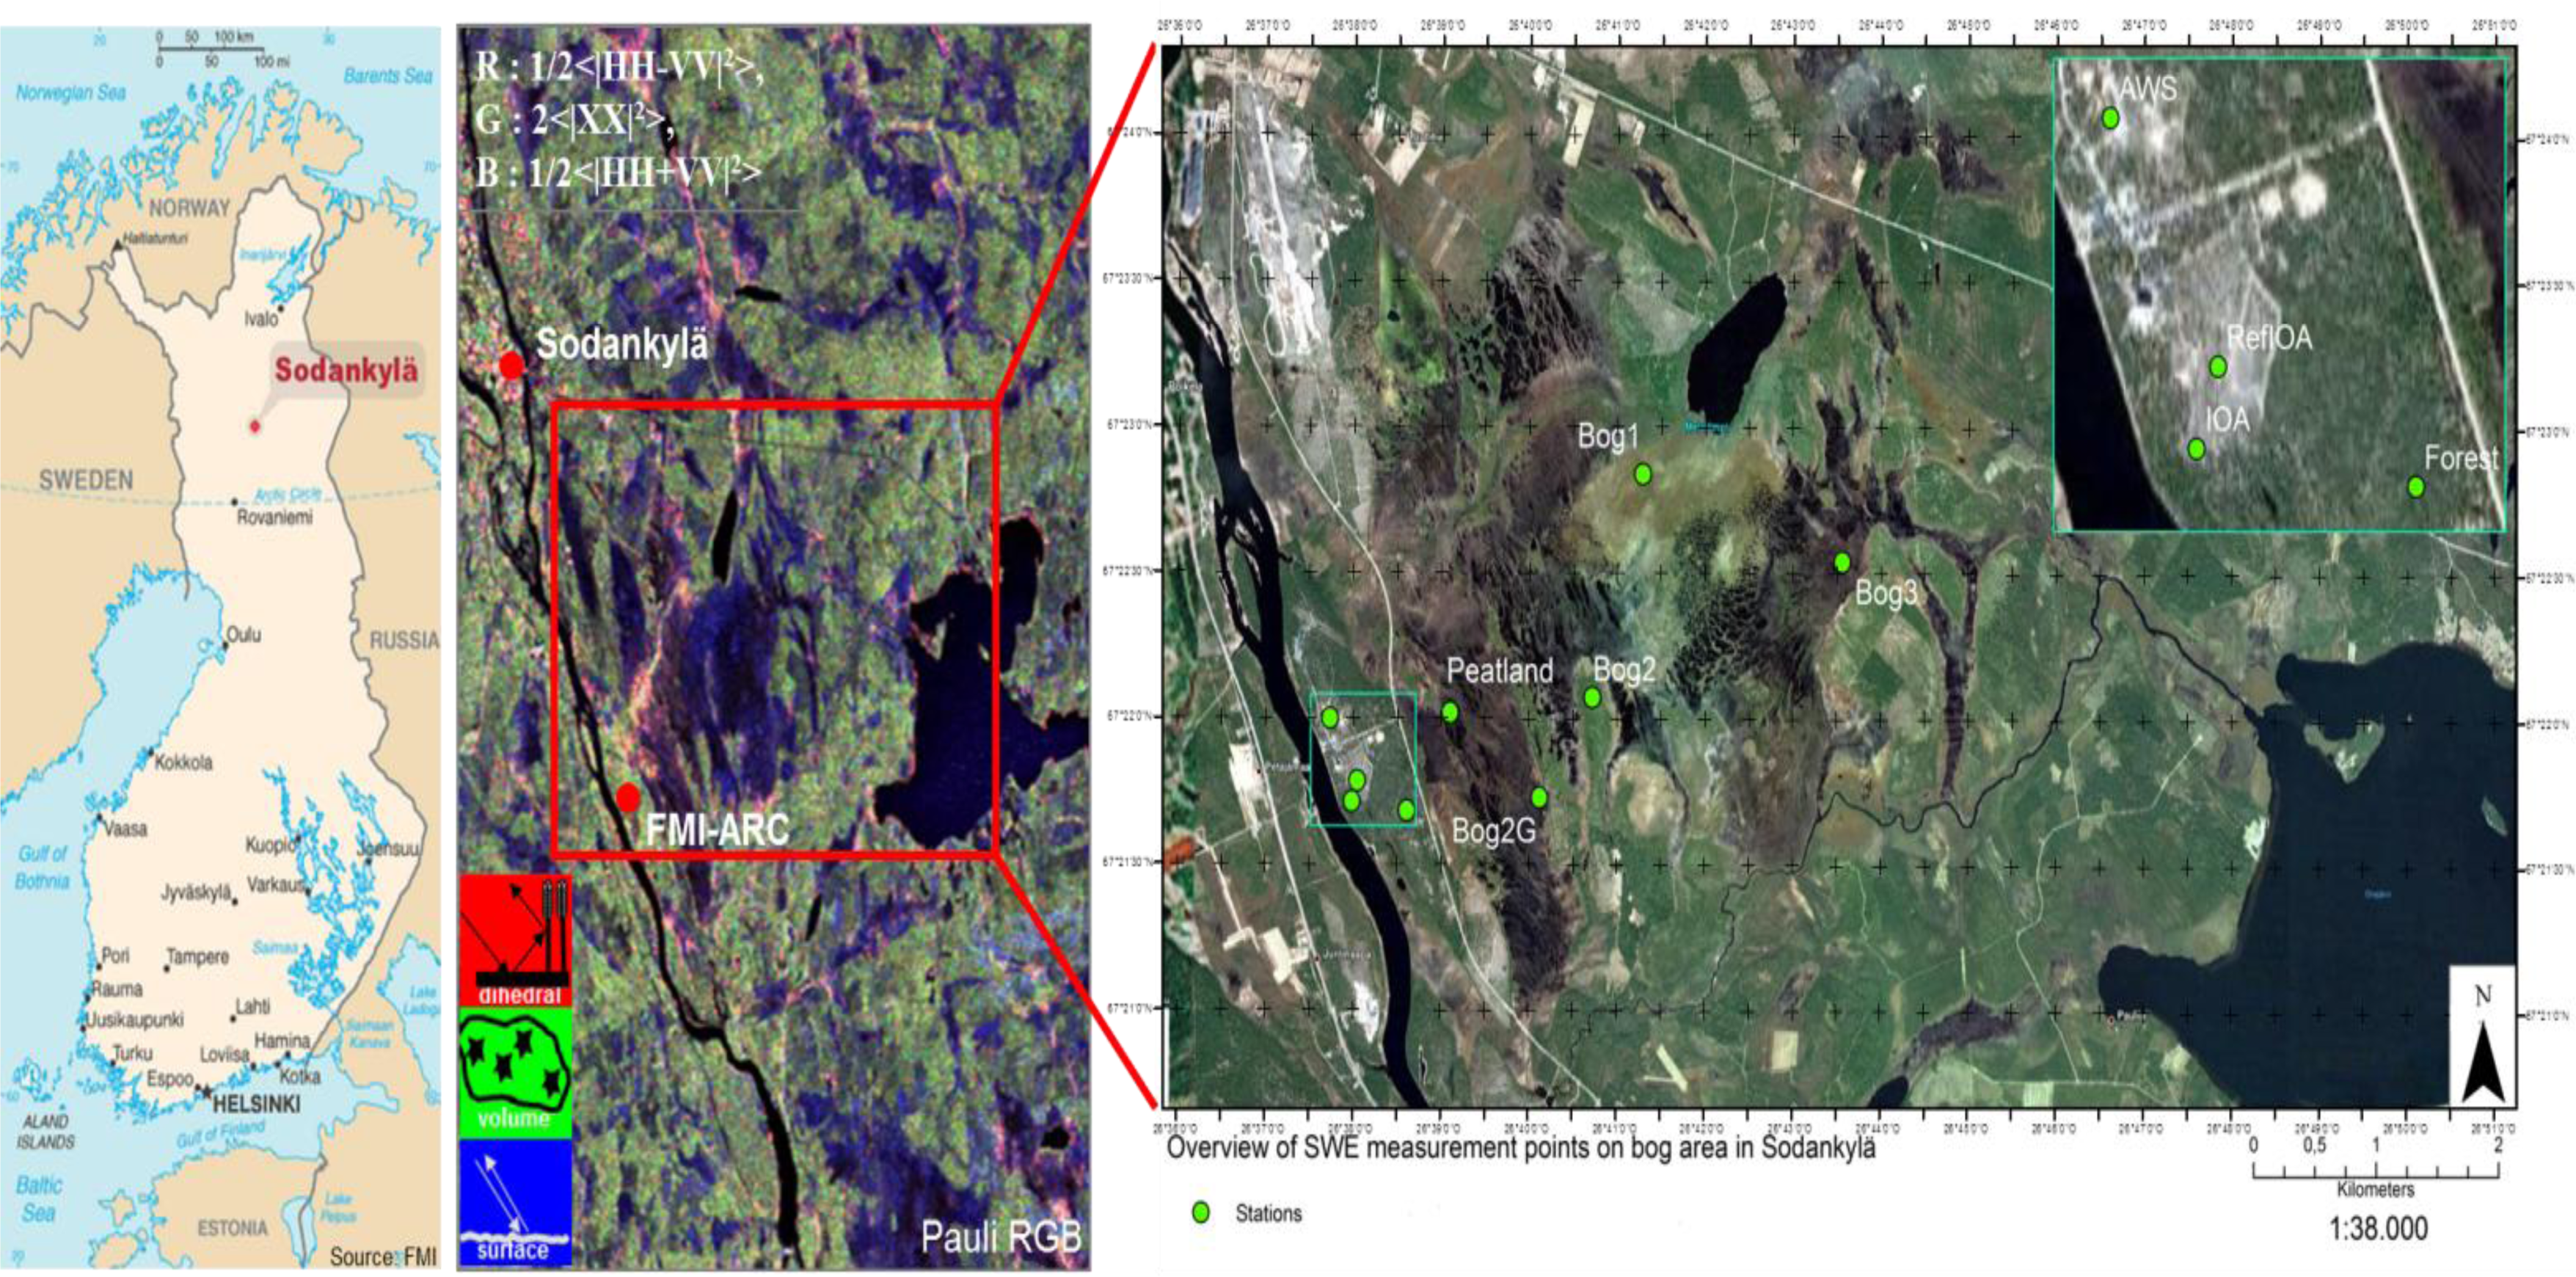
A test site near the city of Sodankylä, northern Finland, at the location of the Finnish Meteorological Institute-ARC was selected, as indicated in
Figure 1 [
18,
19]. The site is located 120 km north of the Arctic Circle and lies in the boreal/subarctic zone, exposed to continental climate. Two main land cover types are present for analysis of snow covered ground: Boreal forest and peatland/bog.
Figure 1 shows the seven ground locations for reference measurements (green circles within the figure: AWS, IOA, RefIOA, Forest, Peatland, Bog1, Bog2, Bog2G, Bog3). For the locations AWS (Automatic Weather Station) and IOA (Intensive Observation Area), automatic recording stations enabled the acquisition of several geo-physical parameters, as for example snow density, soil temperature, air temperature, wind and snow fall [
18,
19].
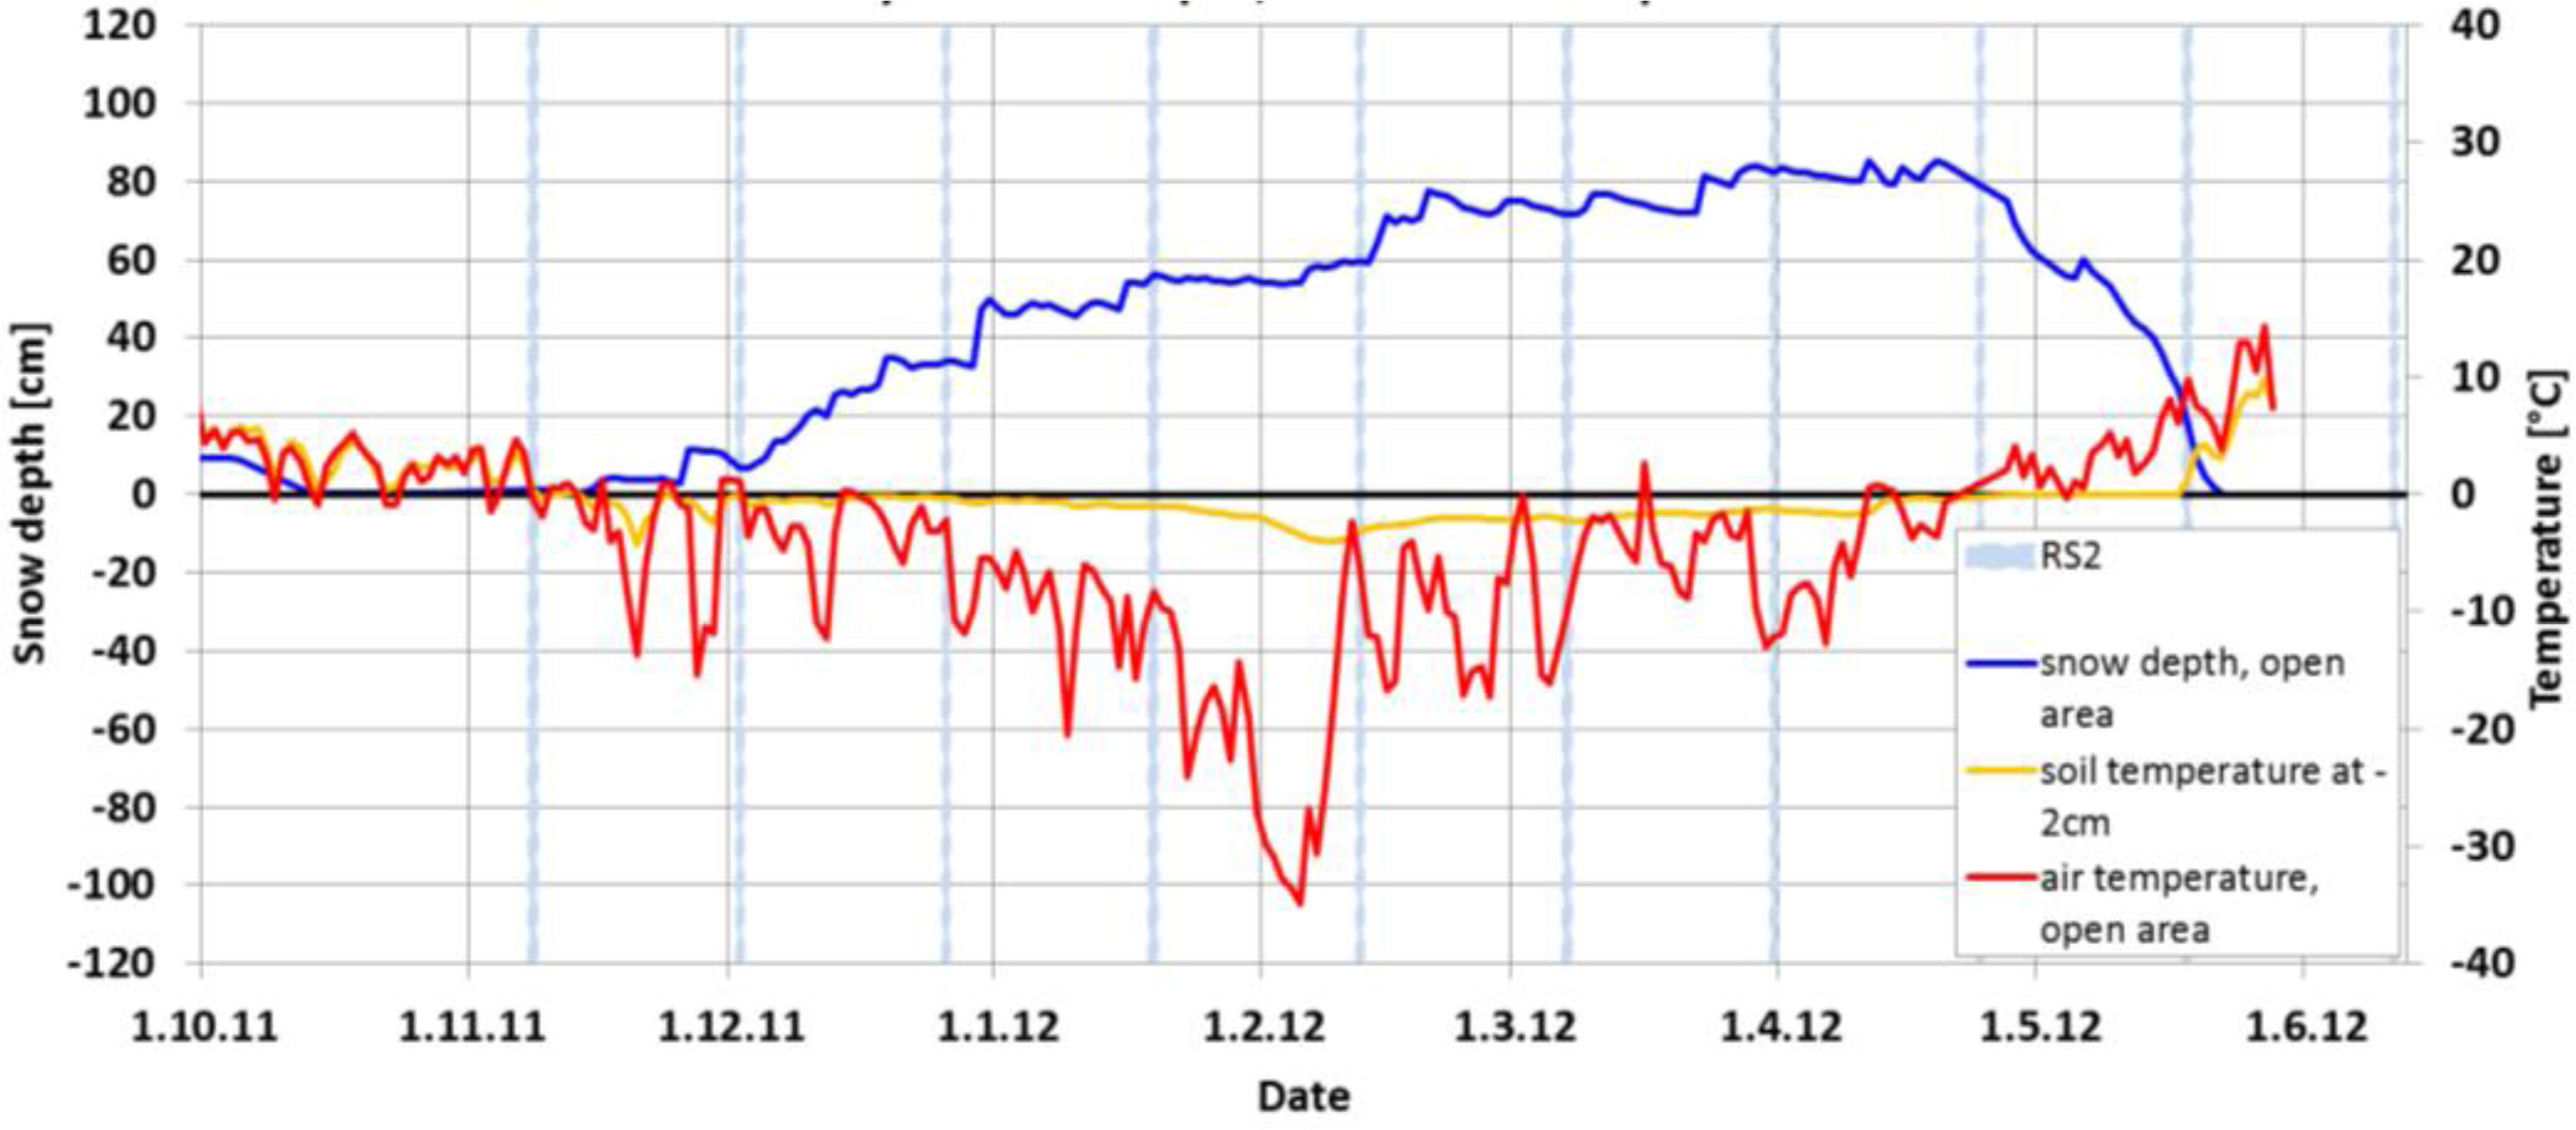
Figure 2 shows, exemplarily for the IOA, the temporal evolution of the snow parameters within the entire winter period 2011/2012 (beginning of November 2011 until middle of June 2012) together with the acquired fine quad-polarimetric RADARSAT-2 data indicated as blue, vertical lines. A distinct snow cover of maximum 100 cm depth developed in the respective winter. The soil started to freeze in the middle of December 2011 (∼15 December 2011, air and soil temperature < 0 °C) and thawed in the beginning of June 2012 (∼18 May 2012, air and soil temperature > 0 °C) (see red and golden lines in
Figure 2).
The air temperature reached down to −30 °C at some days in this winter. This indicates the development of a dry snow cover and a frozen upper soil, which can be characterized by in situ and SAR remote sensing techniques.
For the Sodankylä test site the RADARSAT-2 instrument acquired quad-polarimetric data with a spatial resolution of 5.2 m × 7.6 m (slant range × azimuth) starting from 8th of November 2011. With a repeat cycle of 24 days, a time series of ten fully polarimetric RADARSAT-2 C-band data at 33.2° incidence enabled an investigation of the complete winter period 2011/2012 from snow accumulation to snow melt. The RADARSAT-2 C-band data are complemented with
in situ ground measurements of snow water equivalent (SWE), snow depth, soil moisture, soil and air temperature for analysis and validation [
19].
3. Methodology of Identifying Soil Freezing and Thawing States
The identification of freezing and thawing soil states implies the knowledge of the change in soil moisture and dielectric constant, which can be tracked by polarimetric SAR [
20]. For the change in soil dielectric constant, the phase transition from liquid to frozen water (and back) has to be modeled in order to understand its effect on the polarimetric observables.
3.1. Impact of Phase Transitions on the Dielectric Constant of Soils
For studying the impact of phase transitions on the dielectric constant of soils the well-known semi-empirical dielectric mixing model of Dobson was extended by Zhang
et al. to include freezing conditions (T < 0 °C) [
21,
22]. New terms
mvi and
mvu are introduced in [
22] to account for the ice and unfrozen moisture contribution to the soil dielectric constant. For the range of 1.4 to 18 GHz, the dielectric mixing model for the real
ε′
mf and imaginary part
ε″
mf of the relative complex dielectric constant
εmf are derived from [
21–
23] including also negative soil temperatures:
where
ρb is the bulk density,
ρs is the soil density,
α and
β are empirical coefficients defined in [
21,
22]. The dielectric constant of ice
εi is set to 3.15. The dielectric constant of soil solids
εs is set to 4.7 and
εfw is the dielectric constant of free water.
mvu is the unfrozen volumetric moisture content and
mvi is the volumetric ice content. The real and imaginary parts of the dielectric constant of free water
εfw in
Equations (1) and
(2) are defined in [
23].
mvu and
mvi are given by [
22]:
with A and B being empirical soil texture parameters (see
Table 1) and
T is the absolute soil temperature in Kelvin steering the amount of liquid to frozen water in the soil. For the specific density of water
ρw a value of 1.0 g/cm
3 and for the specific density of ice
ρi a value of 0.9175 g/cm
3 are assumed.
Figure 3 displays modeled phase transitions for different soils from silty clay to sandy loam as well as for different frequencies from C- to Ku-band. As soon as the soil temperature falls below zero degree Celsius, a distinct drop of
ε′
mf occurs for all soil types and all frequencies, which keeps the dielectric level close to the lower physical limit for all freezing states. Hence, this sharp decrease is expected to have an effect on the polarimetric observables to distinguish freezing and thawing states of the soil.
3.2. Polarimetric Eigen-Based Decomposition
In order to investigate and reveal the freezing or thawing state of the soil a polarimetric eigen-based decomposition of the fully polarimetric SAR data is performed. Therefore the coherency matrix [
T] of the fully polarimetric RADARSAT-2 data is formed with an averaging of 9 × 9 pixels resulting in 81 looks and is decomposed afterwards as follows [
24,
25]:
where
λi are the positive, real-valued eigenvalues and
ei the corresponding, complex-valued, normalized eigenvectors.
T* denotes the transpose conjugate.
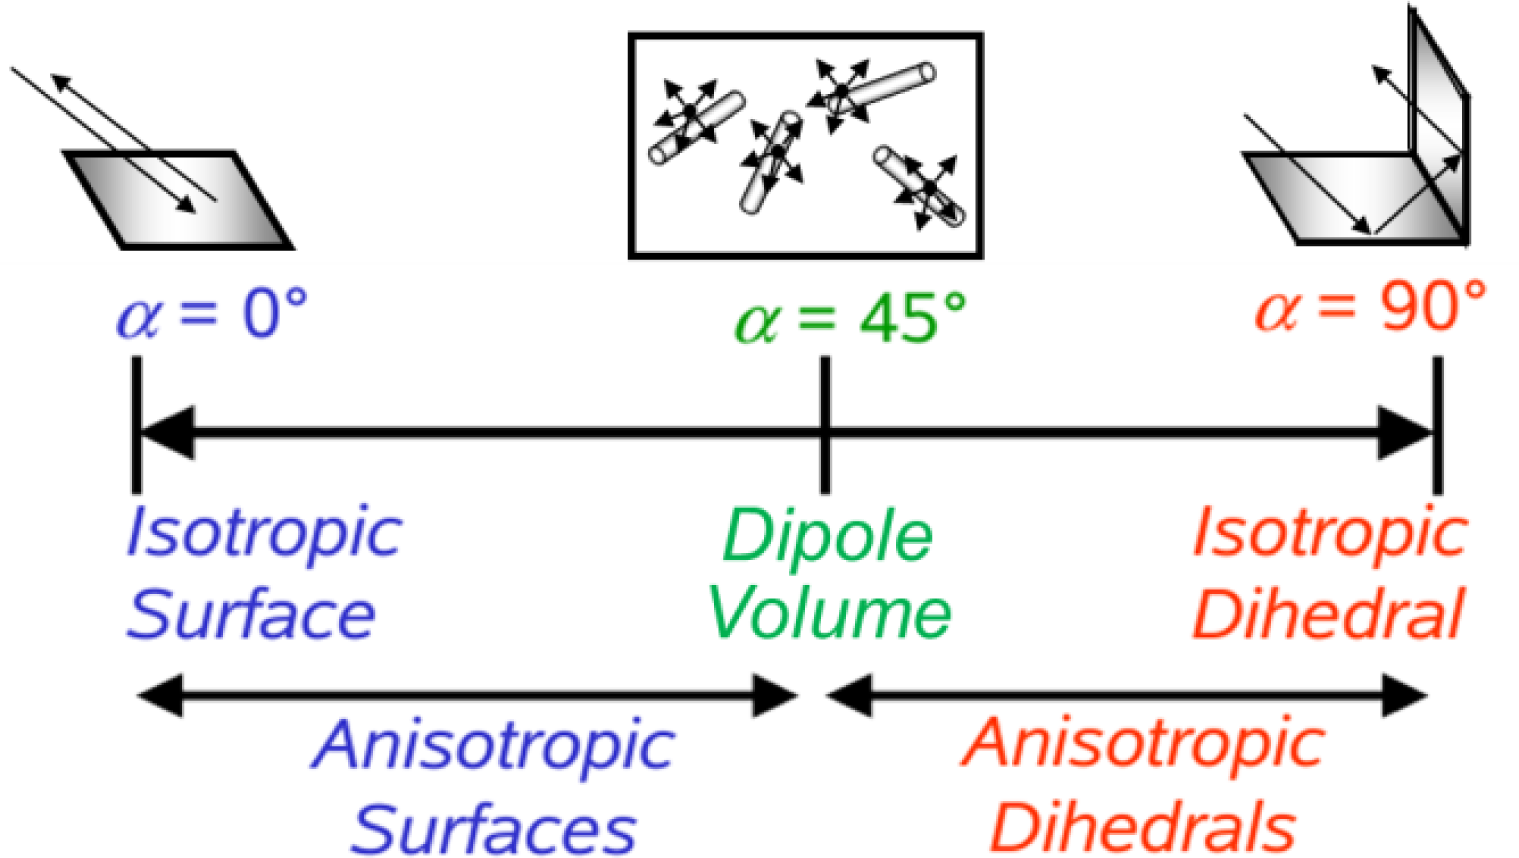
The mean polarimetric scattering alpha angle
α is derived from the normalized eigenvectors of
Equation (5), indicating an intrinsic scattering type ranging from surface scattering (
α = 0) to volume scattering (
α = π/4) until dihedral scattering (
α = π/2) and is calculated as follows [
24,
25]:
Therefore
α relates directly to the dominant physical scattering mechanism of the scatterers in the resolution cell, which is visualized in
Figure 4.
In order to evaluate the statistical disorder and thereby the diversity of scattering mechanisms occurring in the resolution cell, the scattering entropy H is investigated [
24,
25].
where
Pi is a pseudo-probability and
n equals three (for the monostatic RADARSAT-2 system).
The entropy H indicates the depolarization of the acquired microwave signal. An entropy close to zero indicates one (almost deterministic) non-depolarizing scattering process, while an entropy near one represents fully depolarizing, random scattering with several scattering mechanisms involved.
During freezing of the soil, the dielectric constant of the soil decreases distinctively (see
Figure 3). Hence, the polarimetric entropy and the mean scattering alpha angle should tend to lower values indicating a less complex, surface-like scattering due to the low dielectric contrast in all scattering components of the resolution cell.
In contrast, soil thawing will increase the dielectric contrast among the scattering component in the resolution cell, and increase the polarimetric entropy and the mean scattering alpha angle to more complex scattering scenarios of multiple scattering mechanisms. These behaviors will be modelled in a first attempt by the surface scattering model in Section 3.3.
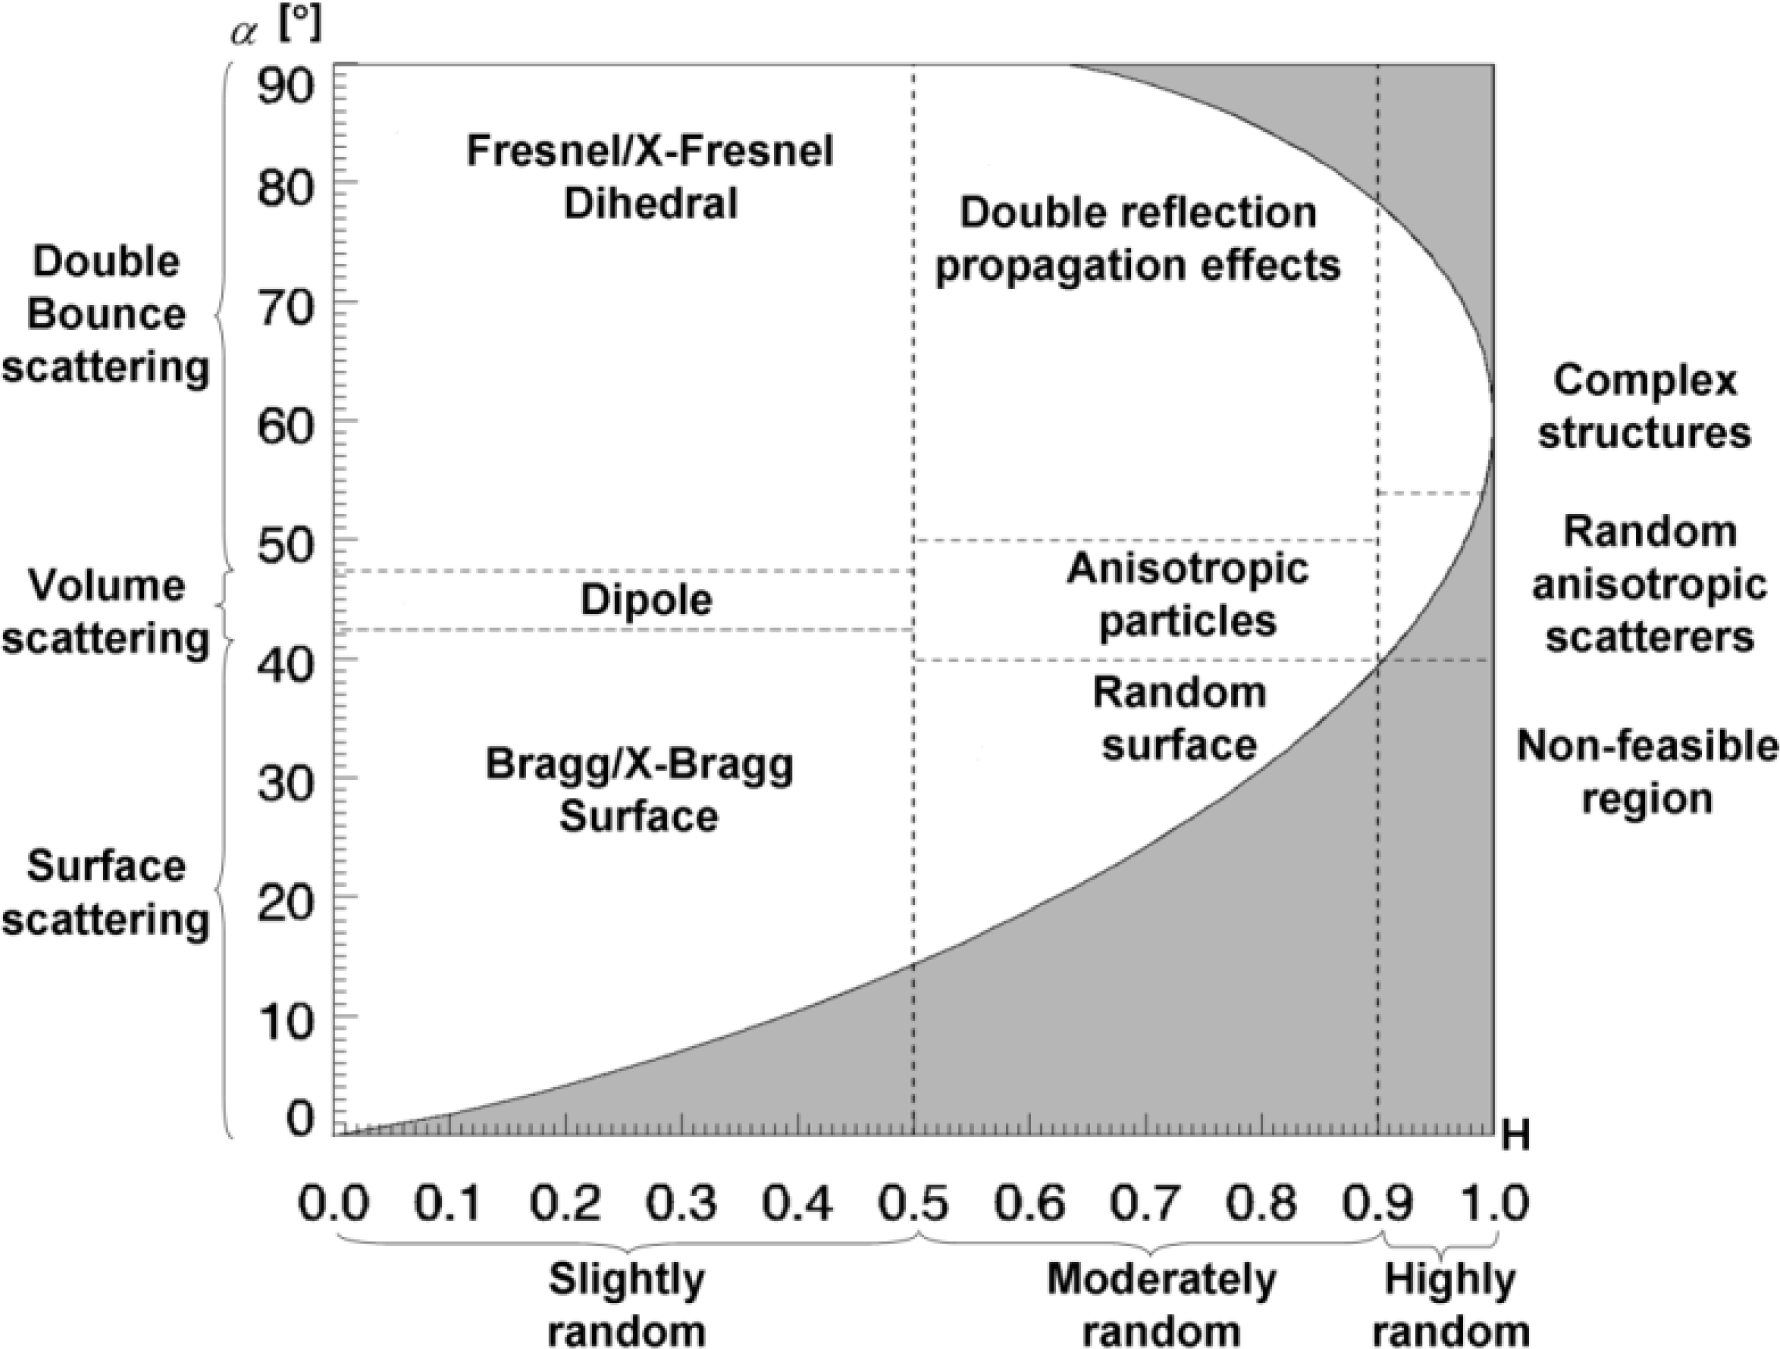
In order to understand the different scattering mechanisms in more detail, Cloude and Pottier developed the following segmentation scheme of the so-called entropy-alpha plane for L-band (see
Figure 5) [
26,
27], which is applied to C-band RADARSAT-2 data in Section 4. It is expected that surface scattering located in the lower left corner for L-band in
Figure 5 will shift to higher entropy values located in the ‘random surface’ segment for C-band.
3.3. Modeling of Soil Surface Scattering from Frozen and Thawed Soils
In order to simulate the surface scattering from freezing and thawing soils, the distinct drop/rise in dielectric constant, when the soil freezes/thaws is included in a first modeling attempt with the extended Bragg (X-Bragg) model. This surface scattering model for bare soils was developed in [
28] and accounts for changes in soil moisture/dielectric constant
ε’
mf and in soil roughness by a depolarization angle
δ [
20]:
This scattering model [
TXB] for rough surfaces consists of a surface scattering intensity
fS and a surface scattering mechanism
β. Both components are modeled by means of the
Bragg scattering coefficients (
RH,
RV), which are function of
ε′
mf and the local incidence angle
θ [
20]:
Hence, this surface scattering model can be driven in a forward sense for a range of reasonable soil moisture (as function of ε′mf from 2 to 41) and soil roughness values (as function of δ from 0° to 90°). Afterwards, the polarimetric eigen-based decomposition can be applied to the modelled [TXB] and the resulting polarimetric entropy and mean scattering alpha angles of the surface scattering can be analyzed and compared with the data-derived counterparts of the two polarimetric parameters. It is important to note that the modelled surface scattering does not include any contribution from a possible vegetation cover.
4. Results for Identification of Different Soil States
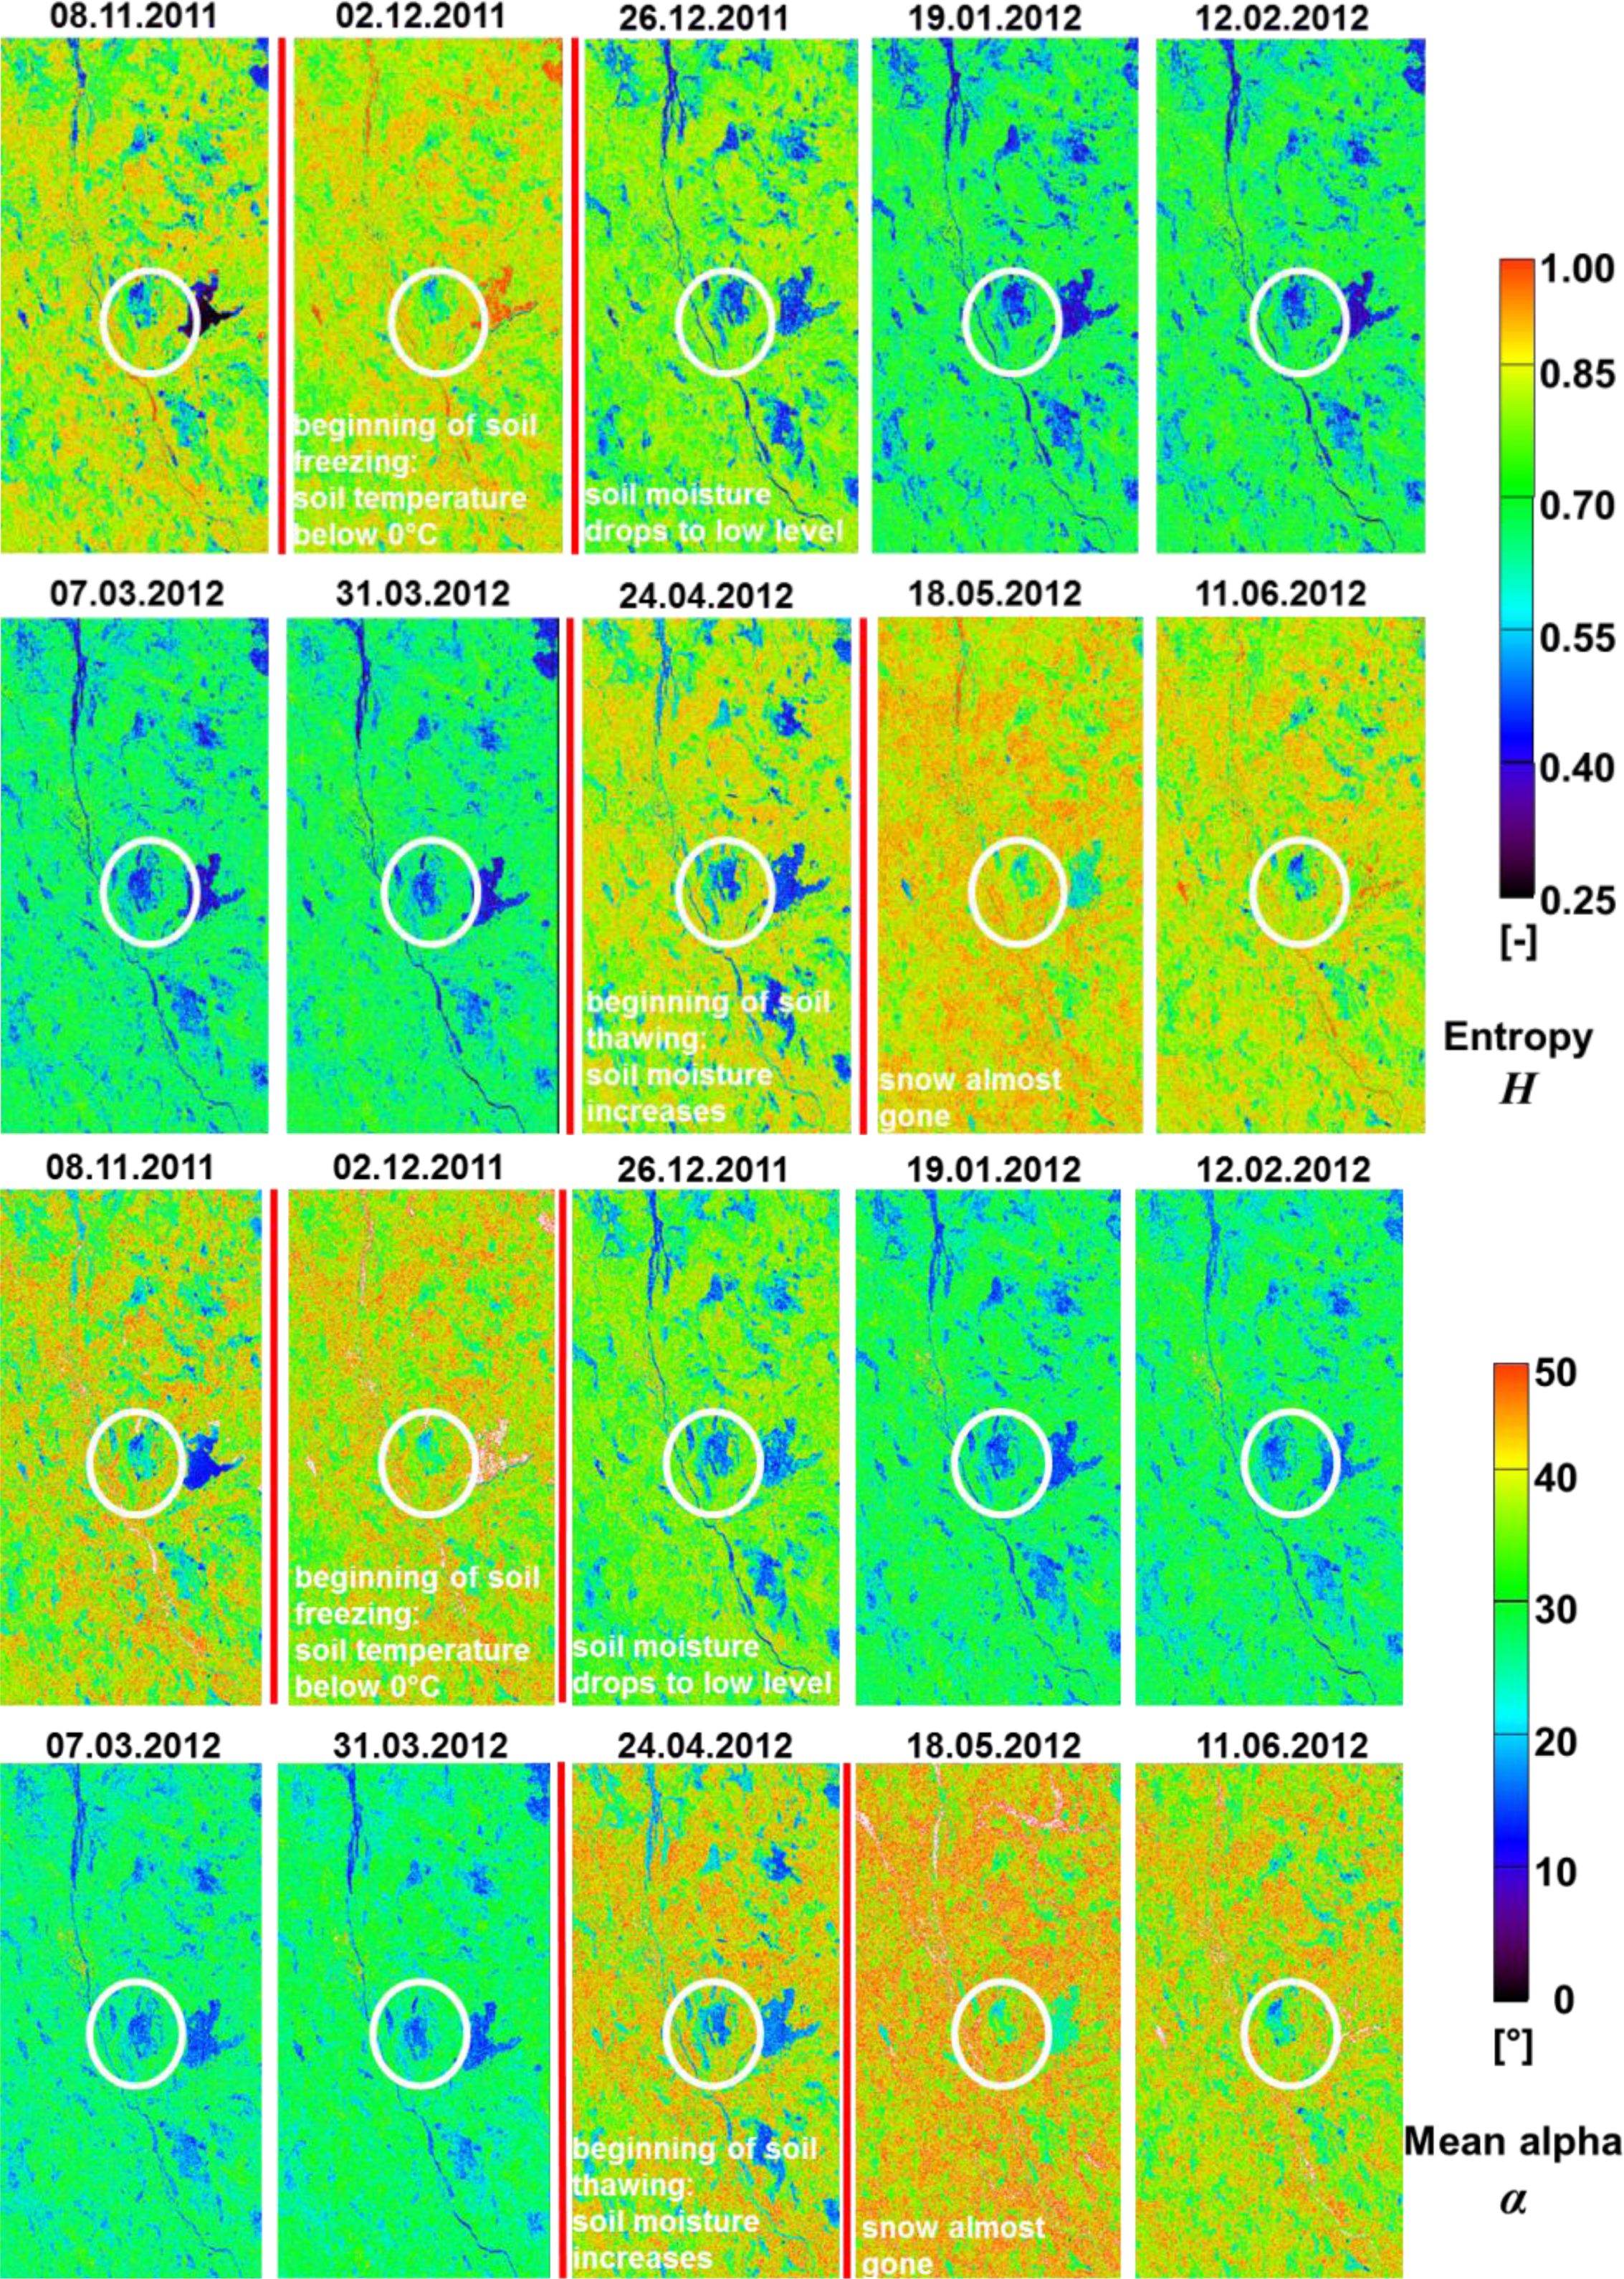
On each of the ten fine quad-polarimetric RADARSAT-2 scenes the polarimetric, eigen-based decomposition was applied for the entire winter period from beginning of November 2011 until middle of June 2012. The scattering entropy
H and mean scattering alpha angle
α have been calculated and are shown in
Figure 6. The red bars indicate the transition periods for the soil towards freezing in the beginning of the winter (end of November/beginning of December 2011) and towards thawing in the end of the winter (April 2012).
Concurrently, a decreasing trend of the eigen-based decomposition parameters during soil phase transition towards freezing (
H→0.4–0.7,
α→15°–30°) and an increasing trend for transition towards thawing (
H→0.7–1.0,
α→30°–50°) is apparent. The white circle in
Figure 6 indicates the Sodankylä test site with similar dynamics.
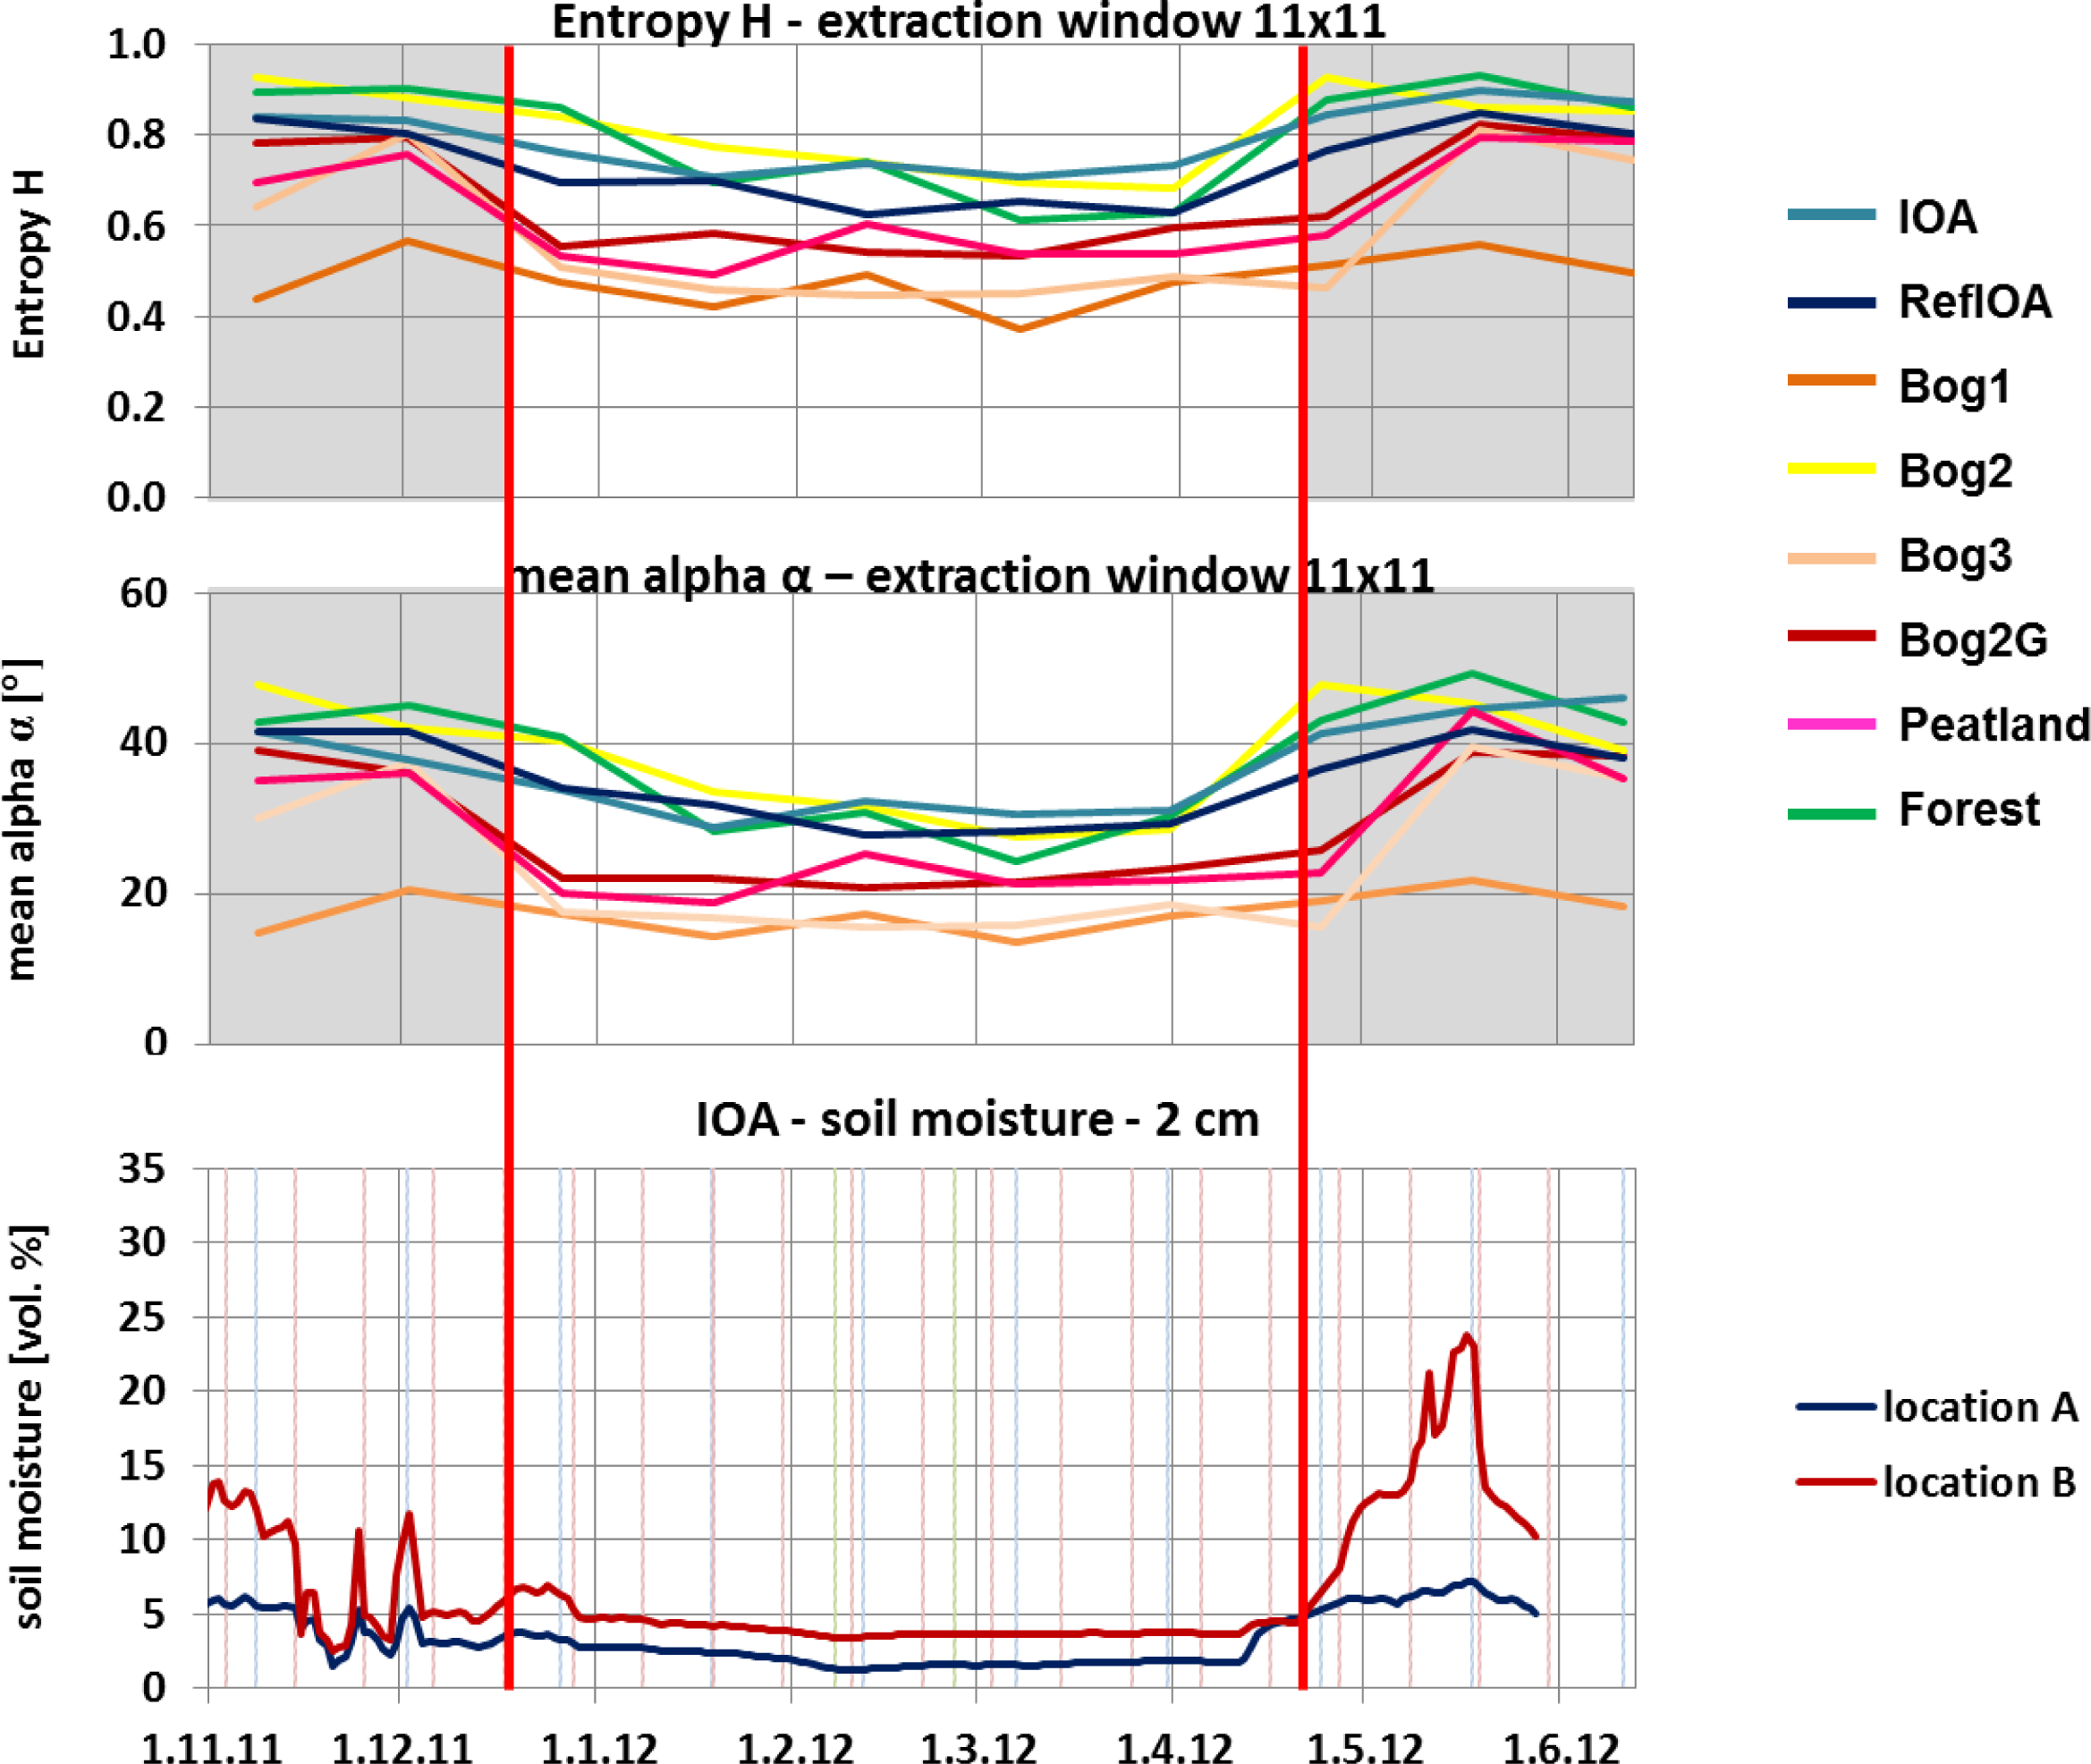
In order to investigate the sensitivity of C-band to state transitions of the soil on the local scale,
Figure 7 reveals the trends of the respective eigen-based parameters for all investigated measurement locations within the test site taking an area of 11 × 11 pixels around each measurement location for analysis. Also the soil moisture measurements at 2 cm depth from two continuously recording moisture sensors of the IOA (at location A and B) are displayed as
in situ reference. Congruent dynamics and trends, compared to
Figure 6, are recognizable for the single locations including areas of different land use (bog, peat, boreal forest). Hence, the comparison of the eigen-based parameters with soil moisture
in situ measurements in
Figure 8 and with the soil and air temperature in
Figure 2 state the connection to the soil freezing and thawing states rather clearly. However, the spatial variation of the polarimetric entropy and mean scattering alpha values at a given date (under either frozen or unfrozen conditions) also exhibit a distinct variation, which can be attributed to the spatially heterogeneous land cover and most probably also to soil types. Unfortunately, only land use information and no detailed soil map or soil profiles are available for the test site area.
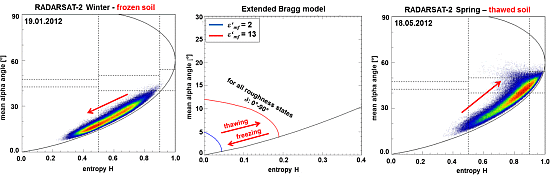
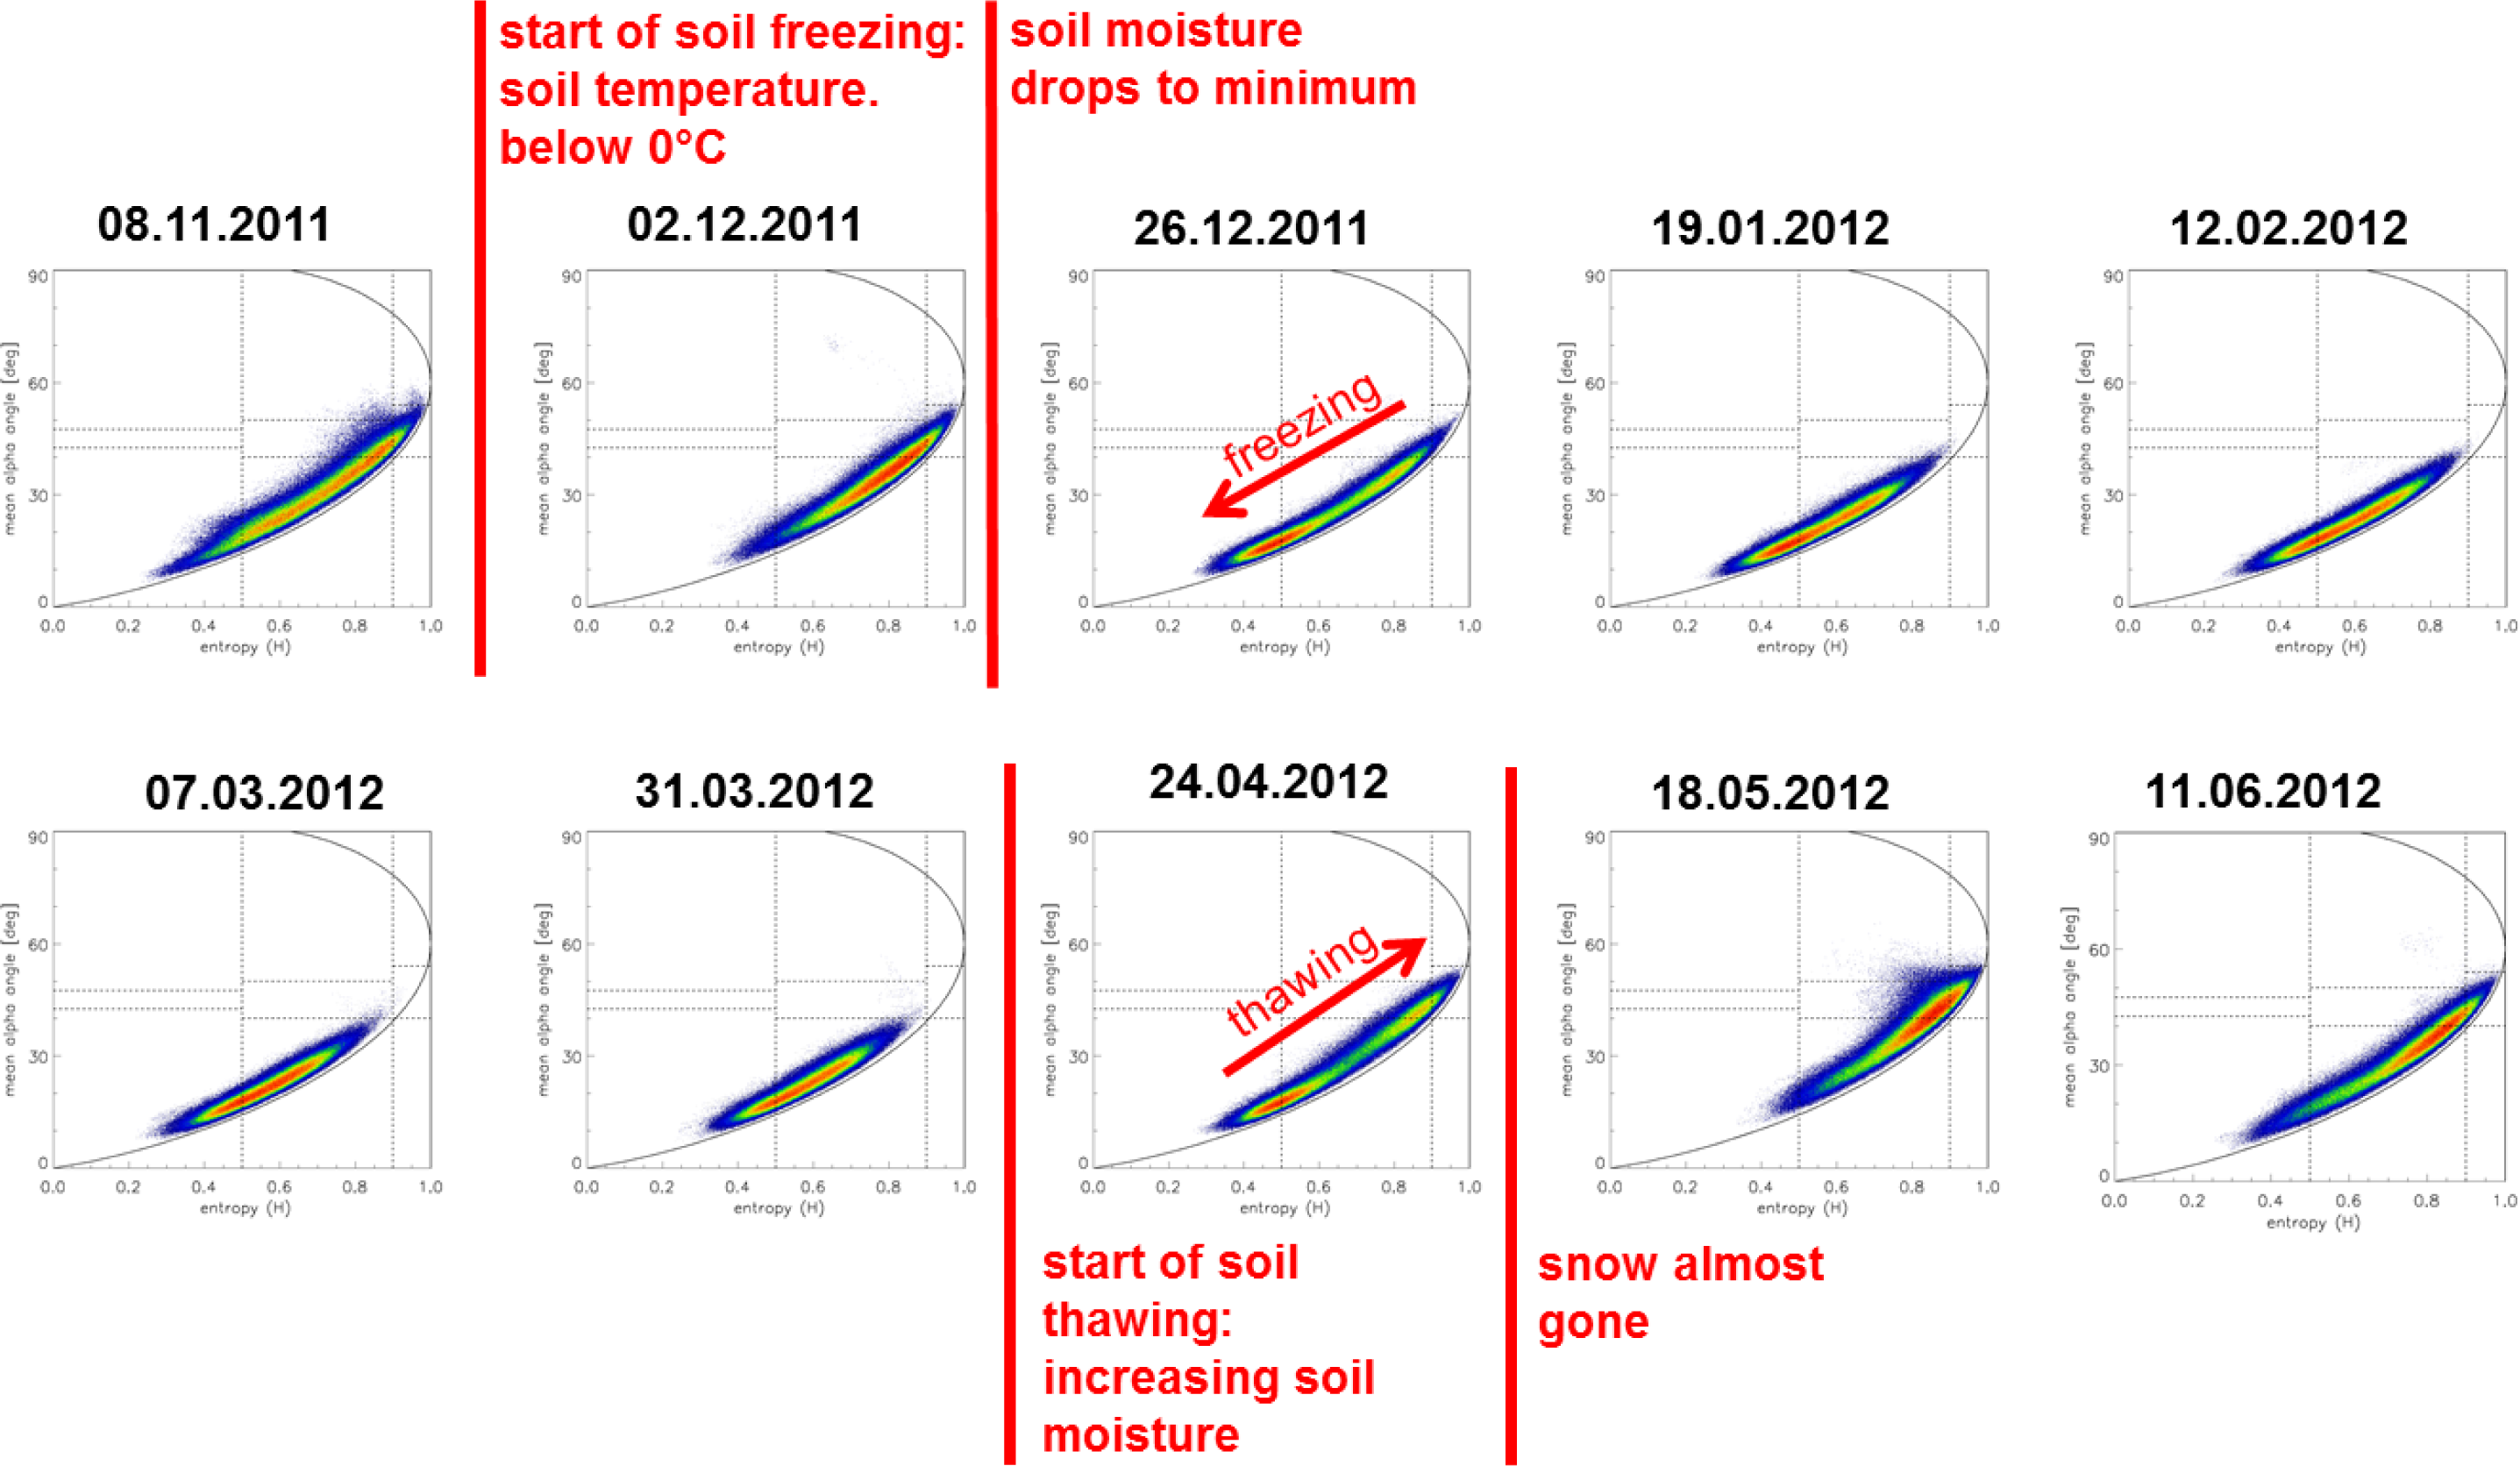
Focusing further on the peatland measurement site assuring no forest or distinct vegetation disturbance
Figure 8 presents two dimensional (2D)-histograms of the polarimetric entropy and the mean scattering alpha angle for the entire time span covering the winter period 2011/2012 (see
Figure 5 for introduction of physical meaning of the 2D-histogram). The majority of
H-
α value couples indicated by the red zone (high counts within the 2D-histogram) confirm the observed dynamics again. The polarimetric entropy and mean scattering alpha values decrease significantly with the occurrence of soil freezing and rise again as soon as thawing conditions occur in the end of the winter in Sodankylä.
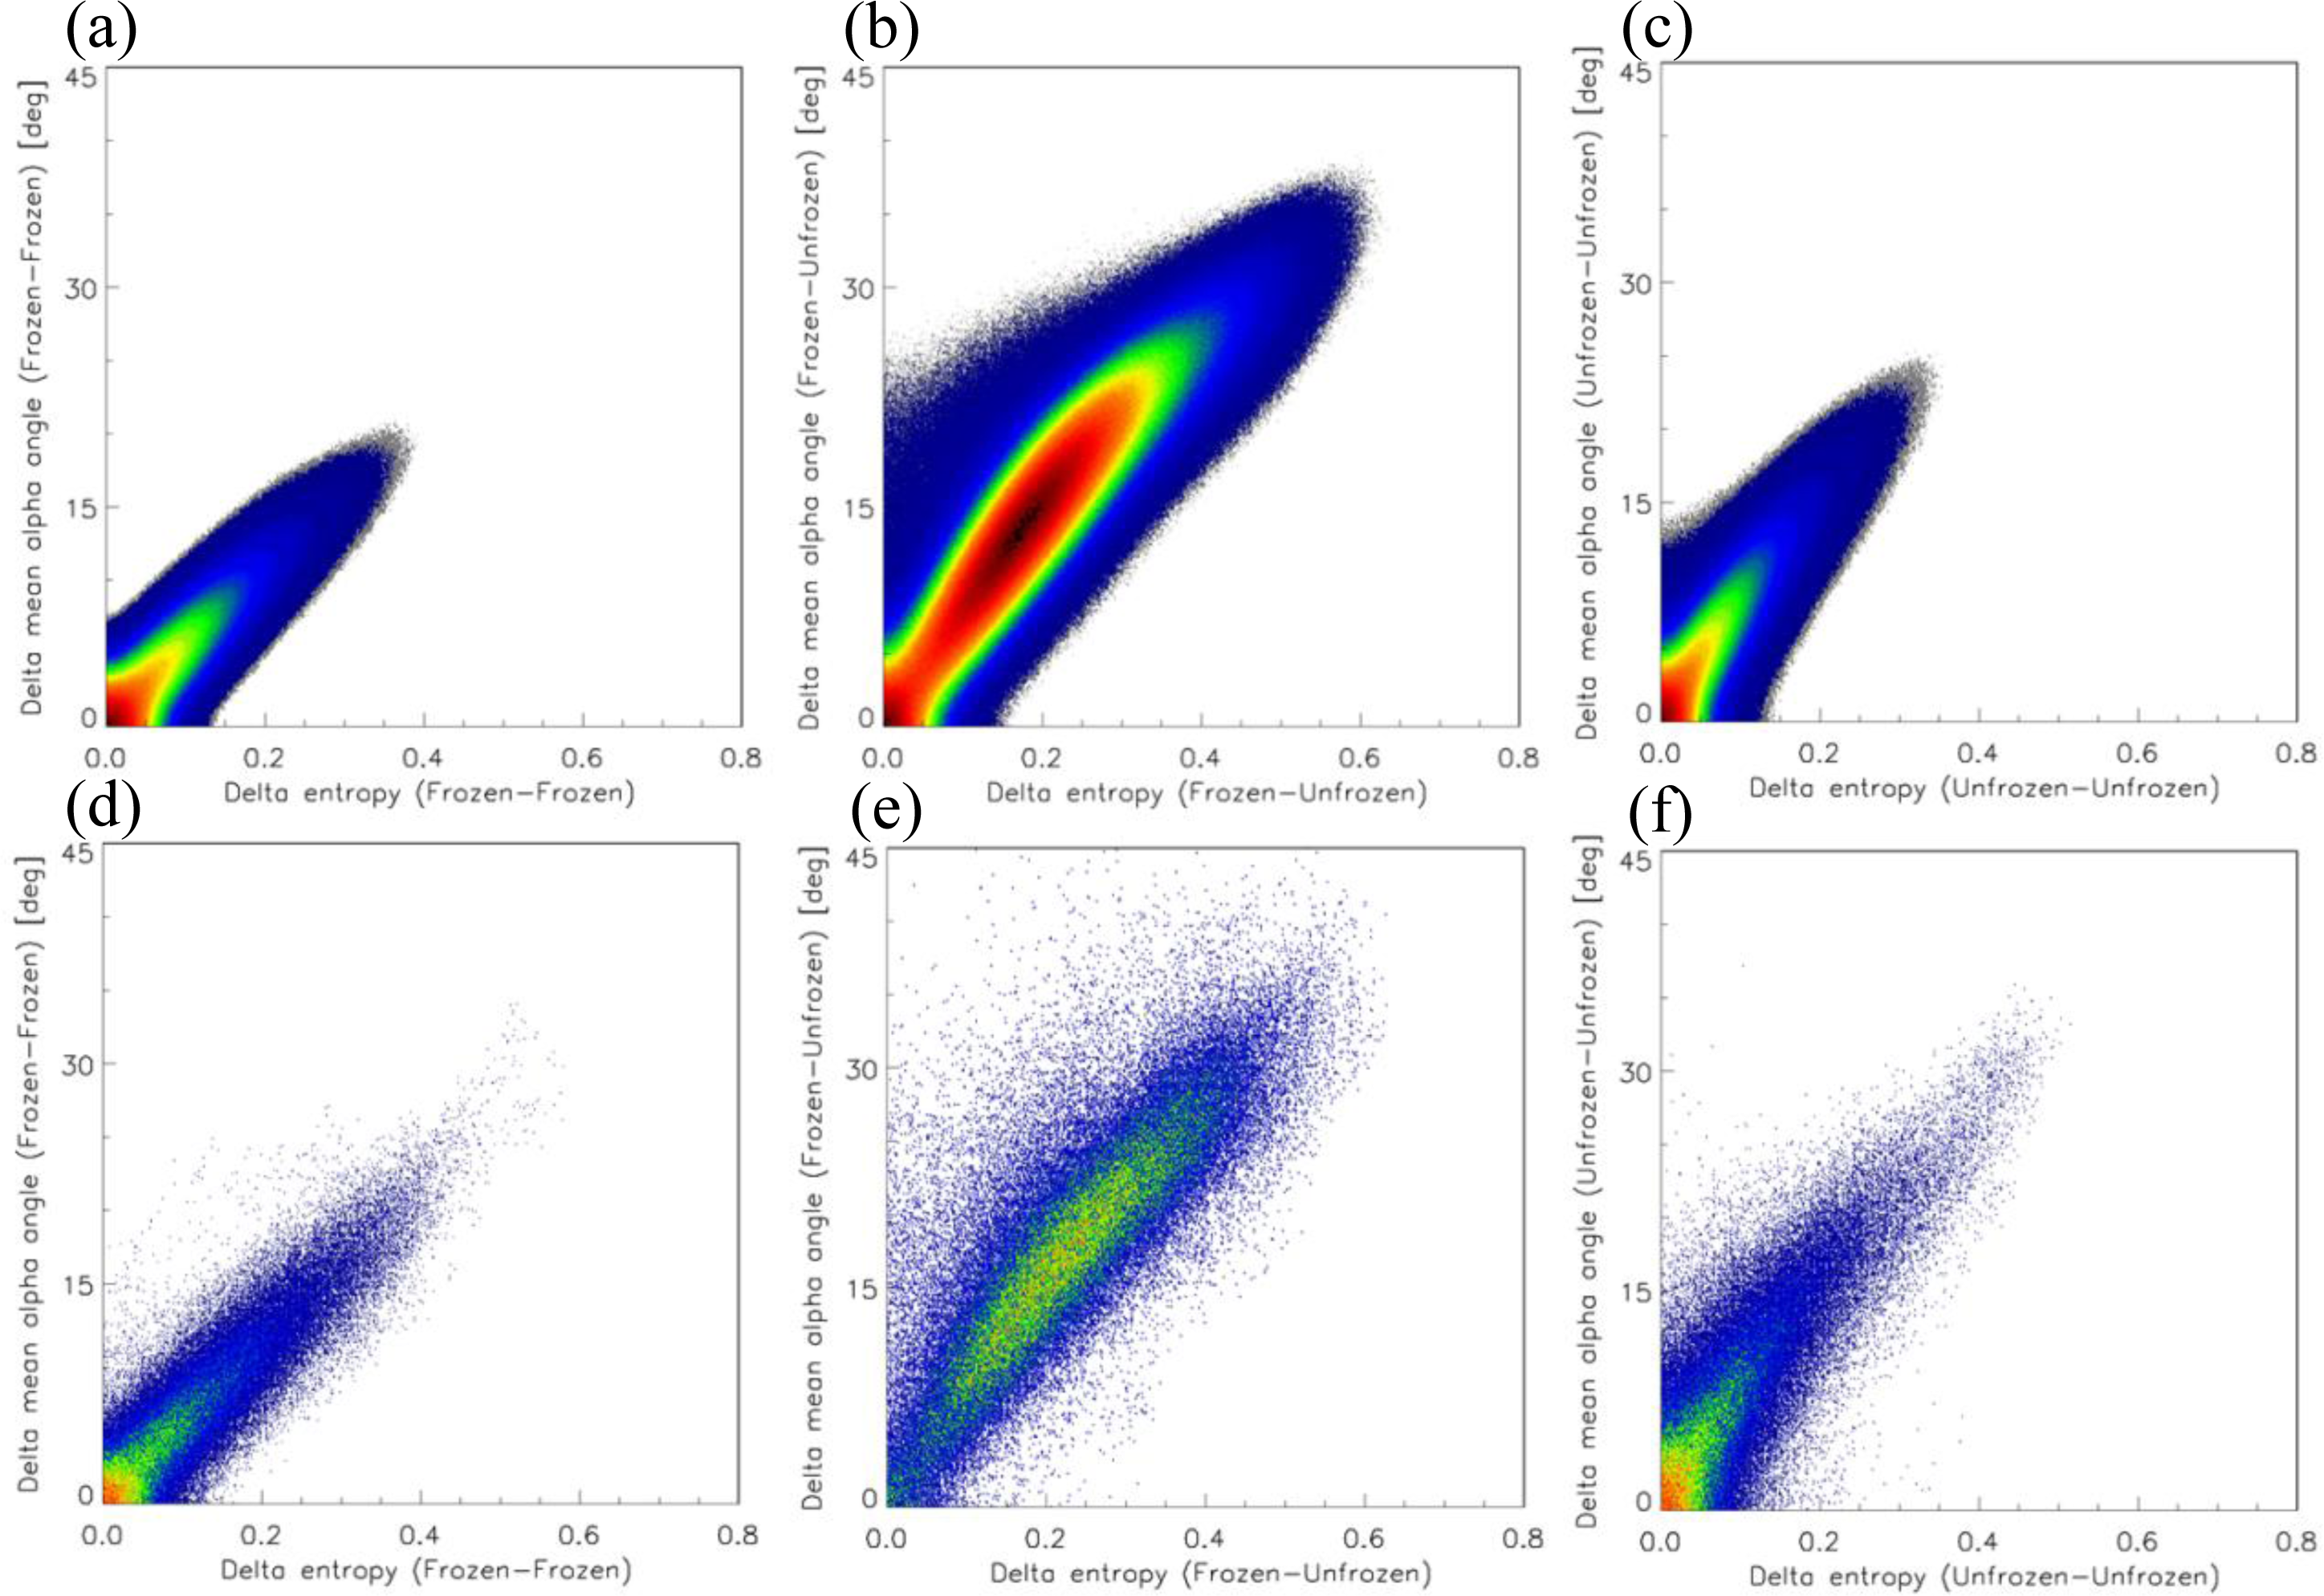
Moreover the absolute difference of polarimetric entropy (delta entropy) and of mean scattering alpha (delta mean alpha angle) values of the entire RADARSAT-2 scene and the peatland measurement site (see
Figure 1 for measurement point) are depicted as three combinations of frozen and unfrozen soil states in
Figure 9:
ΔH/Δα-Case: Comparison of frozen state (19.1.2012) with frozen state (12.2.2012); Absolute differences are small and mainly centered around zero.
ΔH/Δα-Case: Comparison of frozen state (12.2.2012) with unfrozen state (18.5.2012); Absolute differences are large and centered around 0.2/15° for ΔH/Δα.
ΔH/Δα-Case: Comparison of unfrozen state (18.5.2012) with unfrozen state (11.6.2012); Absolute differences are small and mainly centered around zero.
In addition, the analysis with the scattering mechanism classification for these
H-
α planes (dashed lines in
Figures 8 and
10), proposed in [
26] for L-band and shown in
Figure 5, suggests a transition from volume-like scattering to surface-like scattering, when the soil freezes, and back under thawing conditions in April 2012. This confirms the model predictions in the methodology section. But as we are dealing with C-band data, this classification (developed originally for L-band wavelength) should give a first indication of possible physical scattering mechanisms and is still under investigation.
In order to turn to a more quantitative analysis the Extended Bragg scattering model of
Equation (8) was taken and fed with two different real parts of the dielectric constant simulating freezing (
ε′
mf = 2) and thawing (
ε′
mf = 13) upper soil conditions according to the Dobson/Zhang model output in
Figure 3. In addition the soil roughness, represented by the depolarization angle
δ, was varied over the whole range of physically possible roughness states from smooth (
δ = 0°) until very rough (
δ = 90°). Afterwards the polarimetric entropy and mean scattering alpha angle values were calculated for all simulated states.
Figure 10 reports the results of the X-Bragg-modeled and the SAR-derived dynamics of polarimetric entropy and mean scattering alpha angles. Hence, the trend of the shift for both eigen-based parameters (
H,
α) is the same and links the changes in soil state with the behavior of the respective polarimetric parameters. However, a direct inversion of the dielectric content of frozen/unfrozen soils cannot be established for the RADARSAT-2 C-band data, as the applied surface scattering model was initially developed for longer wavelengths and only reproduces the general trends. In addition, the scattering scenario is here modeled in a first attempt neglecting any contributions from the vegetation cover, which is most likely causing the higher entropy-regime in the SAR data-derived values. Hence, a further step will be the inclusion of a bog-like vegetation disturbance in the modeling of the scattering scenario in order to better represent the observed scattering mechanisms. This could be realized by a polarimetric particle scattering model representing the main plant constituents of the bog vegetation cover as introduced in [
25] and investigated in detail for agricultural vegetation in [
27].
6. Conclusions
The presented results in Section 4 state that C-band exhibits sensitivity to soil freezing/thawing states, even under distinct dry snow cover (up to 100 cm), which can be traced by a fully polarimetric, time series analysis using an eigen-based decomposition technique. The different soil states can be clearly detected and also the transition phase can be identified to a first extend (in terms of weeks), as the soil freezing and thawing states directly affect the dynamics of the polarimetric entropy and mean scattering alpha angle.
However, for a precise detection of the beginning and the end of the transition phase (in terms of days), longer time series including several freezing thawing cycles are needed to obtain a broader basis set for a robust statistical analysis of appropriate thresholds. This indicates the need of a short SAR temporal coverage to conveniently identify the start and the length of the transition phase. Fortunately, this will be met by the installation of the RADARSAT constellation to further improve the temporal coverage.
In addition, first modeling attempts using the Extended Bragg soil scattering model justify the observed trends, which indicate surface-like scattering during frozen soil conditions and multiple/volume scattering for thawed soils. However, a direct inversion of the dielectric constant from frozen/thawed soil is not yet possible, as adaptions/extensions of the soil scattering model are necessary. If this can be established, it should be possible to polarimetrically decompose different scattering components coming from the soil and the vegetation as well as directly track the soil dielectric constant for phase transitions and soil states. Hence, these first investigations at C-band foster motivation to work towards a robust polarimetric detection of soil freezing and thawing states as well as their transition phase.


