Article

Airborne Hyperspectral Images and Ground-Level Optical Sensors As Assessment Tools for Maize Nitrogen Fertilization

by
Miguel Quemada
1,*,
Jose Luis Gabriel
1 and
Pablo Zarco-Tejada
2
1
School of Agricultural Engineering, Technical University of Madrid, Avda. Complutense s/n, E-28040 Madrid, Spain
2
Instituto de Agricultura Sostenible (IAS), Consejo Superior de Investigaciones Científicas (CSIC), Alameda del Obispo s/n, E-14004 Córdoba, Spain
*
Author to whom correspondence should be addressed.
Remote Sens. 2014, 6(4), 2940-2962; https://doi.org/10.3390/rs6042940
Submission received: 18 December 2013 / Revised: 9 March 2014 / Accepted: 19 March 2014 / Published: 31 March 2014

Abstract

:
Estimating crop nitrogen (N) status with sensors can be useful to adjust fertilizer levels to crop requirements, reducing farmers’ costs and N losses to the environment. In this study, we evaluated the potential of hyperspectral indices obtained from field data and airborne imagery for developing N fertilizer recommendations in maize (Zea mays L.). Measurements were taken in a randomized field experiment with six N fertilizer rates ranging from zero to 200 kg·N·ha−1 and four replications on two different dates (before the second fertilizer application and at flowering) in 2012. Readings at ground level were taken with SPAD®, Dualex® and Multiplex® sensors, and airborne data were acquired by flying a hyperspectral and a thermal sensor 300 m over the experimental site. The hyperspectral imagery was used to calculate greenness, chlorophyll and photochemical indices for each plot. The Pearson coefficient was used to quantify the correlation between sensor readings and agronomic measurements. A statistical procedure based on the N-sufficient index was used to determine the accuracy of each index at distinguishing between N-deficient and N-sufficient plots. Indices based on airborne measurements were found to be as reliable as measurements taken with ground-level equipment at assessing crop N status and predicting yield at flowering. At stem elongation, the reflectance ratio, R750/R710, and fluorescence retrieval (SIF760) were the only indices that yielded significant results when compared to crop yield. Field-level SPAD readings, the airborne R750/R710 index and SIF760 had the lowest error rates when distinguishing N-sufficient from N-deficient treatments, but error reduction is still recommended before commercial field application.

1. Introduction

Enhancing the sustainability of intensive agricultural production by increasing nutrient efficiency is a major challenge for ensuring food production during this century [1]. In particular, adjusting nitrogen (N) fertilizer application to crop requirements is key for improving fertilizer efficiency, reducing unnecessary input costs to farmers and the environmental impact of N losses [2]. Among the multiple soil and crop tests developed, optical sensors that detect crop N nutritional status may have a great potential for adjusting N fertilizer recommendations [3]. Optical readings are fast to obtain and non-destructive and can be efficiently processed and combined to obtain indices or indicators of crop nutritional status. However, various plant physiological stress conditions can interfere with the readings, and it is not always easy to identify the best indicators of nutritional status [4]. Comparing different technologies and types of equipment may help to identify the strengths and weaknesses of using optical sensors to develop N fertilizer recommendations.
Crop chlorophyll (Chl) concentrations are strongly related to N status and have been used as indicators of N availability [5]. Chlorophyll estimation based on the difference between either the transmittance or the reflectance of two wavelengths has been conducted with leaf clip and tractor-mounted equipment. This technique has been applied to various crops and demonstrated its potential for N fertilizer recommendations; as a result, it is currently used at a commercial level [2,5,6]. Nevertheless, limitations have been reported: readings can be affected by water stress or nutrient deficiencies other than N [5], by non-uniform leaf Chl distribution [7] or by the time of the day when readings are taken [4]. To overcome such constraints, some researchers have proposed complementing Chl estimations with measurements of polyphenol (Phen) concentration in the leaf epidermis [8]. Given that leaves emit fluorescence from Chl under UV excitation and Phen compounds have typical UV absorption peaks, it has been proposed that such compounds can be estimated using UV light [9]. Polyphenolic compounds are secondary metabolites that increase in leaves under many stress conditions and particularly under N deficiency [10]. The Chl/Phen ratio under UV-induced conditions has been proposed as a good indicator of crop N status. It has been reported to be more stable and to overcome some of the constraints derived from a non-uniform leaf Chl distribution [11].
Various remote sensing platforms (e.g., airplanes [12,13], balloons [14]) have been used to obtain field-scale imagery to estimate physiological crop status. They are an alternative to intensive ground-level sampling and can be used to cover large areas and reflect spatial variability. Airborne measurements have additional advantages for use in agricultural management decision-making, as the image-capturing time and distance can be adjusted to better identify crop status. Several indices based on remote sensor readings have been developed to characterize plant canopy structure. Among such indices, the Normalized Difference Vegetation Index (NDVI) is the one most commonly used, with variants to correct for soil or atmospheric effects [15,16]. Other indices based on reflectance changes in the red-edge wavelengths have been developed for detecting Chl content and applied to the study of crop nutritional status [12,17]. Finally, solar-induced Chl fluorescence is difficult to measure from airborne data, but may have a great potential to estimate crop productivity and detect stress conditions. Recent studies have used the in-filling method to quantify fluorescence from high-resolution imagery acquired by a micro hyperspectral imager on board an unmanned aerial vehicle and related such measurements to water stress detection in vineyards [18] and olive orchards [19,20]. However, this method has not been applied to N status assessment yet.
The aim of this study was to evaluate the potential of various ground-level optical sensors and narrow-band indices obtained from airborne hyperspectral images as tools for developing N fertilizer recommendations for maize. The specific objectives were: (i) to compare the relationship between different hyperspectral indices obtained from field data and airborne imagery; and (ii) to determine whether new hyperspectral indices are more reliable than other indices at detecting differences in maize plants treated with different N fertilizer rates.

2. Material and Methods

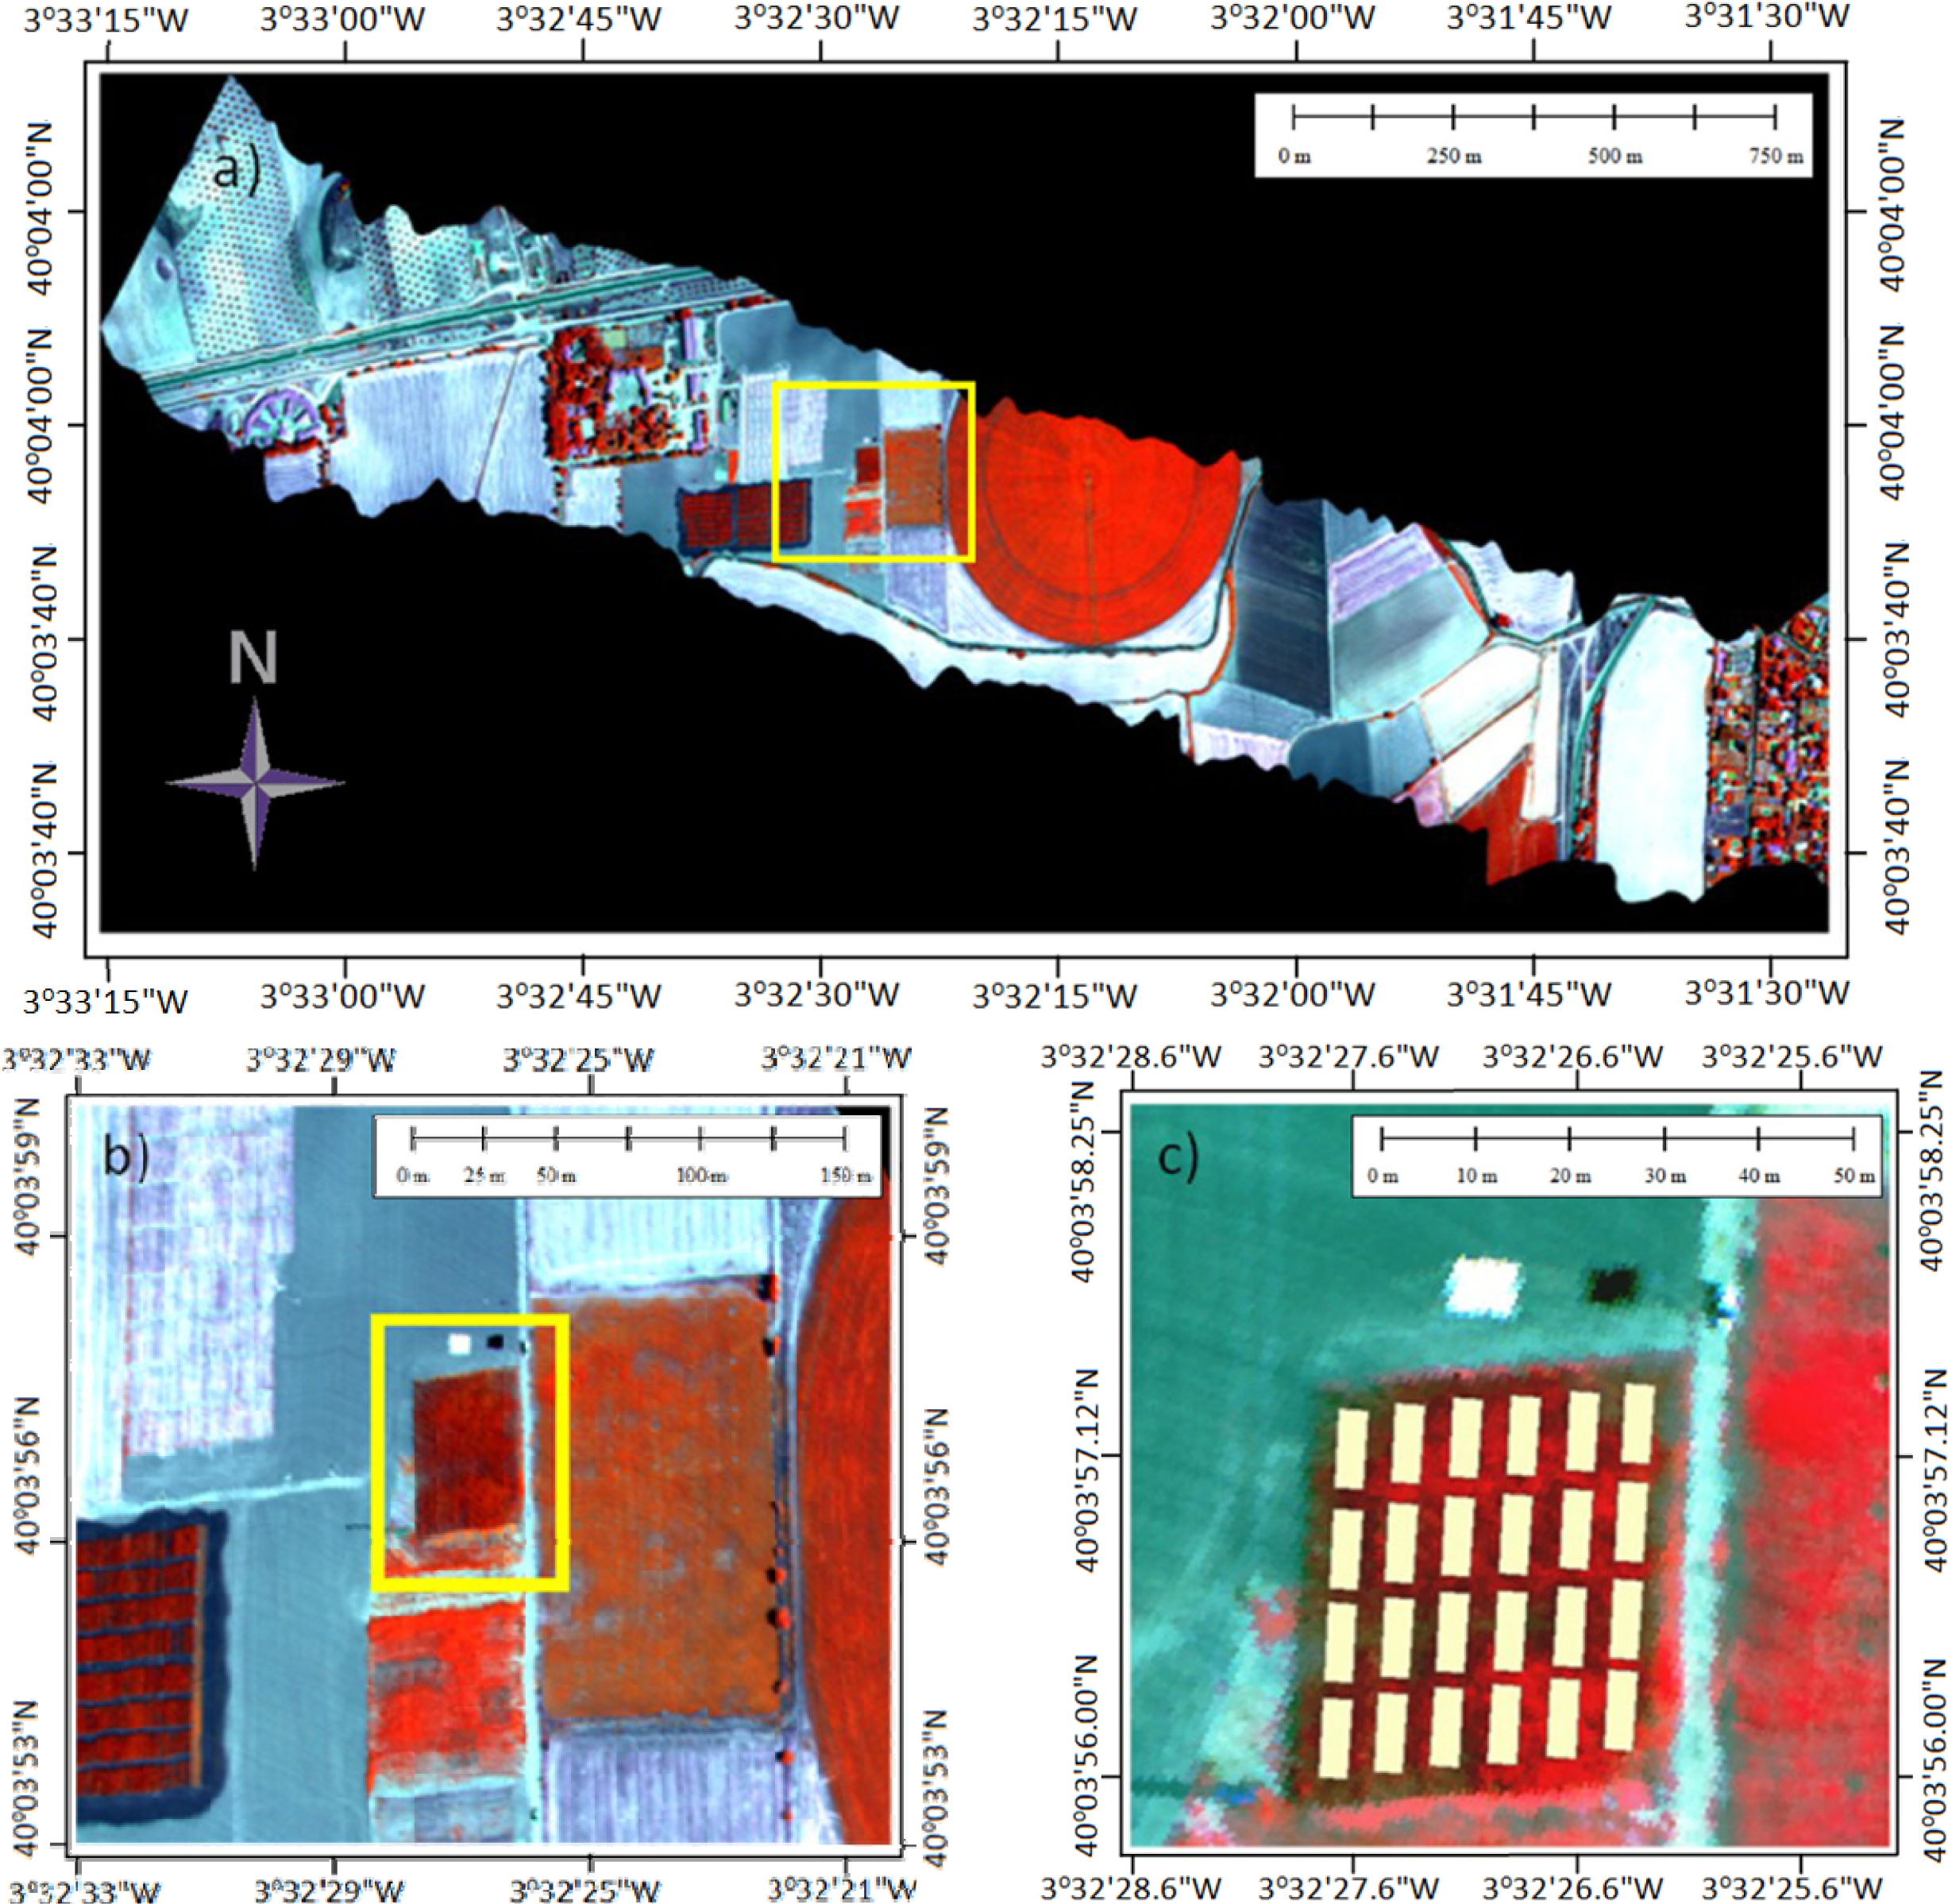
2.1. Experimental Site and Crop Management

The study was conducted in 2012 at La Chimenea field station (40°03′N, 03°31′W, 550 m a.s.l.), which is located in the central Tajo river basin near Aranjuez (Madrid, Spain). The soil at the field site is a silty clay loam (Typic Calcixerept) [21]. It is alkaline, rich in organic matter and has low stone content throughout the soil profile. The area has a Mediterranean semiarid climate [22], with a mean annual temperature of 14.2 °C and an average annual rainfall of 350 mm, summer being the driest period and autumn being the rainiest period. Details on soil and climate conditions can be found elsewhere [23]. The experiment was designed as a randomized complete block with six treatments per block and four replications. The plot size was 6 by 12 m. Treatments consisted of various N fertilizer rates ranging from 0 to 200 kg·N·ha−1, with 40 kg·N·ha−1 increases. The site was sown with maize (Zea mays L.) in early spring (20 April 2012) in rows separated by 0.72 m; maize was spaced 0.17 m within rows, resulting in a plant population density of 80,000 plants·ha−1. Nitrogen fertilizer (i.e., ammonium nitrate) was hand broadcast to plots in two stages: half when the maize had four leaves (23 May 2012) and half when it had eight leaves (26 June 2012). In November (28 November 2012), two 10-m stripes at the center of each plot were harvested with an experimental combiner, and the maize yield was recorded. During the whole maize growing cycle, water was uniformly applied with a sprinkler irrigation system (12 m × 12 m, 9.5 mm·h−1) according to the crop evapotranspiration (ETc) guidelines for computing crop water requirements developed by FAO (the United Nations Food and Agriculture Organization) [24]. The reference evapotranspiration (ETo) was calculated using the Penman–Monteith model, and the crop coefficient was obtained using the ratio for maize in semiarid conditions [25]. Before sowing the maize, 50 kg·P·ha−1 and 70 kg·K·ha−1 were applied to all plots in the form of triple superphosphate and potassium chloride to ensure P and K availability. The experiment was conducted in a field that had been left fallow in the previous year and had not received organic amendments or N fertilizer during four years prior to the beginning of the trial.

2.2. Maize Analysis

At harvest, a 1-m stripe next to the central row was harvested by hand and separated into plant components (grain vs. rest of aboveground biomass), dried in a 65 °C oven, weighed and ground. The harvest index (= grain/(grain + rest of aboveground biomass)) was obtained and used to calculate the rest of the aboveground biomass from the yield recorded in the experimental combiner. A subsample of each plant component was used to determine total N concentration applying the Dumas combustion method (LECO FP-428 analyzer, St. Joseph, MI, USA). For each plot, the N content of each crop component was calculated by multiplying its dry biomass by its N concentration and adding up both to obtain the total crop N content. The leaf area index (LAI) was measured in representative maize plants from each plot using the CI-203 handheld laser leaf area meter (CID Bio-Science, Camas, WA, USA) at both growth stages.

2.3. Ground-Level Optical Determinations

Readings with three different optical sensors were taken at ground level on two different dates. The first date (21 June 2012) was just before the second fertilizer application. The crop had eight fully unfolded leaves and two detectable nodes. Thus, the growth stage was 18/32 according to the growth stage decimal code [26] and will henceforth be referred to as “stem elongation”. The second sampling date (23 July 2012) was at flowering, when the difference between the N applied to the various treatments was expected to be most evident. In the male inflorescence, the full tassel was in flower, and in the female, the stigma had emerged. Thus, the growth stage of the second sampling was 65.
On both sampling dates, 15 measurements were taken from the uppermost fully developed leaf of 15 representative plants in the two central rows of each plot using the SPAD®, Dualex® and Multiplex® handheld optical sensors. Measurements were taken at the leaf longitudinal center, on the upper side and avoiding midribs. The representative value of each plot was obtained as the average of the 15 readings.
The SPAD-502® chlorophyll meter (Konica Minolta Inc., Japan) is a leaf clip sensor that measures the light transmitted by a plant leaf when a red LED (650 nm) and an infrared LED (940 nm) provide illumination in a small (∼1 cm2) dark chamber. The instrument processes the ratio of the light transmitted at these wavelengths and the ratio determined in the absence of a sample to produce a digital reading that is highly correlated with leaf Chl content [27].
The Dualex® Scientific (Force-A, Orsay, France) is also a leaf clip sensor that measures Chl content as the difference between the light transmitted at the red and infrared wavelengths. However, this device also measures leaf flavonoid (FLAV) concentration, which is directly related to the optical absorption of the leaf epidermis under UV light. Chlorophyll fluorescence is induced by a UV (375 nm) and a red LED. Since the epidermis absorbs UV-induced fluorescence, but transmits red light, epidermis absorbance can be determined by comparing both. The Nitrogen Balance Index (NBI), calculated as the ratio between Chl and FLAV content, has been used to assess N nutritional status in wheat and corn [11,28].
The Multiplex® (Force-A, Orsay, France) is a handheld optical fluorescence sensor that takes measurements at a 10-cm distance from the light source in an 8-cm diameter circle. The instrument generates fluorescence in plant tissues using LEDs with four wavelengths: UV (375 nm), blue (450 nm), green (530 nm) and red (630 nm). Three filtered detectors record the fluorescence in the following bands: blue-green (447 nm), yellow (590 nm), red (665 nm) and far-red (735 nm). The combinations of these signals result in 66 fluorescence ratios that are potentially useful for interpreting plant physiological status. The indices with the greatest potential for the assessment of crop N status are the following [9]: the chlorophyll index (SFR_R or SFR_G under red or green excitation, respectively), the flavonoid index (FLAV), the Nitrogen Balance Index (NBI_R or NBI_G under red or green excitation, respectively), the Anthocyanin Content Index (ANTH) and the transformed single-fluorescence excitation anthocyanin relative index (FERARI). The FLAV indices determined by either Dualex® or Multiplex® are highly correlated (R2 > 0.95 in our study) and are based on the same principle. Therefore, we shall only present results regarding Dualex in this article. In our study, the NBI under red excitation was highly correlated with the NBI under green excitation (r > 0.97); thus, we will present only NBI results under green excitation (NBI-G). A definition of these indices following [9] is summarized in Table 1.
At flowering, measurements were also taken from husk leaves following the same procedure described for the uppermost fully developed leaves. The purpose was to determine whether readings from the former, which are usually represented in airborne imagery, were correlated with traditional measurements of nutritional N status at flowering, that is, in husk leaves [6].

2.4. Airborne Campaigns

Data acquisition was conducted on two different dates that were as close as possible to those of the ground-level optical measurements by flying a hyperspectral and a thermal sensor 300 m over the experimental plots. The first flight took place five days after the ground-level measurements; the second airborne campaign was conducted one day after the field measurements. The airborne campaigns were conducted with a micro-hyperspectral imager and a thermal camera on-board a Cessna aircraft operated by the Laboratory for Research Methods in Quantitative Remote Sensing of the Consejo Superior de Investigaciones Científicas (QuantaLab, IAS-CSIC, Spain) [18,29]. The hyperspectral sensor flown was the VNIR micro-hyperspectral imager (Micro-Hyperspec VNIR model, Headwall Photonics, Fitchburg, MA, USA) configured in the spectral mode of 260 bands at 1.85 nm/pixel, 12-bit radiometric resolution and a signal-to-noise ratio (SNR) of 300:1 without binning. It yielded a full-width at half-maximum (FWHM) of 6.4 nm with a 25-micron slit in the 400–885 nm region. The storage rate on board the UAV was 50 fps (frames per second) with an integration time of 18 ms. The 8-mm focal length lens yielded an instantaneous field of view (IFOV) of 0.93 mrad and an angular field of view (FOV) of 49.82°, providing a swath of 317 m at a 31 × 33-cm pixel resolution (resampled to 30 cm) at a 330-m AGL altitude and a 75 km/h ground speed (Figure 1a).
The micro-hyperspectral sensor was radiometrically calibrated in the laboratory using derived coefficients with a calibrated uniform light source (integrating sphere, CSTM-USS-2000C Uniform Source System, LabSphere, North Sutton, NH, USA) at four levels of illumination and six integration times. Ortho-rectification of the hyperspectral imagery acquired with the UAV platforms was conducted using PARGE (ReSe Applications Schläpfer, Wil, Switzerland). This was done using input data acquired with a miniaturized inertial measuring unit (IMU) (MTiG model, Xsens, The Netherlands) installed on-board and synchronized with the micro-hyperspectral imager [18].
The airborne campaigns were conducted over the maize field flying on the solar plane at a time between 8:00 and 9:00 GMT in all campaigns. The flight plan was designed to overfly the site on each flight date. For each flight line acquired over the site, a subset of the experimental area was created (Figure 1b) and the radiance spectra were extracted from each experimental block (Figure 1c).
The high-resolution hyperspectral imagery acquired (30-cm pixel size) made it possible to identify pure vegetation pixels from each experimental block, extracting the pure canopy radiance and reflectance (Figure 2). Pure-vegetation mean radiance spectra acquired from each block were used to calculate narrow-band vegetation indices, as described in the next section. Mean radiance spectra were obtained for each experimental block and later used to quantify fluorescence retrieval at each study site using the O2-A in-filling method. A total of 13 spectral bands were observed within the O2-A feature with the airborne micro-hyperspectral imager [20].

2.5. Airborne Hyperspectral Index Calculation

Aerosol optical measurements were acquired with a Microtops II Sunphotometer (Solar Light, Philadelphia, PA, USA) at the 440, 500, 675, 870 and 936 nm spectral bands. The sun photometer was connected to a GPS (model GPS-12, Garmin, KS, USA) to obtain simultaneous readings of geographic location, altitude and solar geometry at the time of the spectral acquisitions. Narrow-band hyperspectral indices were calculated with regard to: (i) greenness or structural indices; (ii) chlorophyll a + b concentration; (iii) epoxidation state of the xanthophyll cycle (EPS); and (iv) blue/green/red ratio indices (Table 2). The canopy greenness indices calculated were the NDVI [15] and Reformed Difference Vegetation Index (RDVI) [30]. The chlorophyll a + b indices used were the red edge reflectance ratio (R750/R710) index [12] and the Transformed Chlorophyll Absorption in Reflectance Index (TCARI) normalized by the OSAVI (TCARI/OSAVI) [31]. The xanthophyll pigment indices used were the Photochemical Reflectance Index (PRI) [32] and the formulation that normalizes the PRI with structure and chlorophyll content [19]. The blue/green/red ratio indices used were the BGI1 and BGI2 [18,33].
Apart from assessing the seasonal variation of indices sensitive to physiology and structure, leaf Chl fluorescence was estimated from airborne hyperspectral imagery on each flight date. The Fraunhofer Line Depth (FLD) principle was applied to the hyperspectral imagery to quantify the fluorescence signal as in [18,20] using irradiance (E) and radiance (L) data. The total incoming irradiance (E) was measured at the time of the flights using a 0.065-nm full-width half-maximum (FWHM) Ocean Optics HR2000 fiber-optics spectrometer with a CC-3 VIS-NIR cosine corrector-diffuser (Ocean Optics, Dunedin, FL, USA) as described in Zarco-Tejada et al. [20]. The 0.065 nm FWHM HR2000 spectrometer provided spectral measurements in the 680–770 nm range with 2048 channels. Irradiance (E) calibration of the spectrometer attached to the fiber with the cosine corrector diffuser was conducted in the laboratory using an LS-1-CAL calibrated tungsten halogen NIST traceable light source (Ocean Optics, Dunedin, FL, USA). To match the spectral resolution of the radiance imagery acquired by the hyperspectral airborne sensor, the high-resolution irradiance spectra measured with the HR2000 instrument was resampled through Gaussian convolution. Successful results have been obtained in previous studies when retrieving the chlorophyll fluorescence signal using the micro-hyperspectral imager due to the large spectral oversampling (1.85-nm sampling interval) and 6.4 nm bandwidths. Therefore, the Fraunhofer Line Depth (FLD) principle calculated from a total of three bands for the in and out bands (FLD3) was applied to the hyperspectral radiance imagery to quantify the fluorescence signal. In particular, solar-induced fluorescence (SIF760) was quantified using the Lin (L762), Lout (average of L750 and L780 bands), Ein (E762) and Eout (average of E750 and E780 bands) using Equation (1). The SIF760 signal quantified from this airborne sensor has been proven valid for the retrieval of a relative measure of the fluorescence emission related to canopy stress response, as shown in [1820].
SIF 760 = E out L in E in L out E out E in

2.6. Application to N Fertilizer Recommendation

A procedure previously used to test the ability of handheld Chl meters as tools for N fertilizer recommendation was adapted to test the accuracy of the actual indices [2,6]. The N yield response curve was obtained by fitting a linear-plateau model to the observed data using the non-linear regression procedure of PASW Statistics Software®. The optimal N rate was the minimum N rate at which the plateau yield was achieved. The relative grain yield (RY) for a plot was calculated by dividing the average grain yield of the plot by the plateau grain yield for the experiment. To determine the accuracy of each index at distinguishing N-deficient from N-sufficient plots, we calculated the Nitrogen Sufficiency Index (NSI, [34]) as follows:
NSI = Index value   for   TP / Average index value   for   WFRP
where TP is the tested plot and WFRP refers to well-fertilized reference plots (i.e., plots with the optimal N rate). Plots in which the NSI > 1 and RY < 1 corresponded to fertilizer underestimation, and plots where the NSI < 1 and RY > 1 corresponded to overestimation. Both underestimation and overestimation plots were outliers. The accuracy of a crop nutritional status index was reported as the percentage of outliers from the total number of plots.

2.7. Statistical Analysis

To quantify the degree of correlation between sensor readings (either ground or airborne) and agronomic measurements, the Pearson correlation coefficient was calculated between the indices obtained in each measurement campaign. A stepwise regression analysis was used to explore whether a combination of narrow-band indices obtained in each campaign improved yield prediction. A two-variable linear model was fitted to the yield data with the following variables: mean temperature of each plot recorded with the thermal camera (Tc) at stem elongation and at flowering and either each of the narrow-band indices or fluorescence. The linear-plateau model was fitted to the yield obtained by all replications using a nonlinear regression procedure. Statistical analyses were conducted with IBM® SPSS® statistics software.

3. Results and Discussion

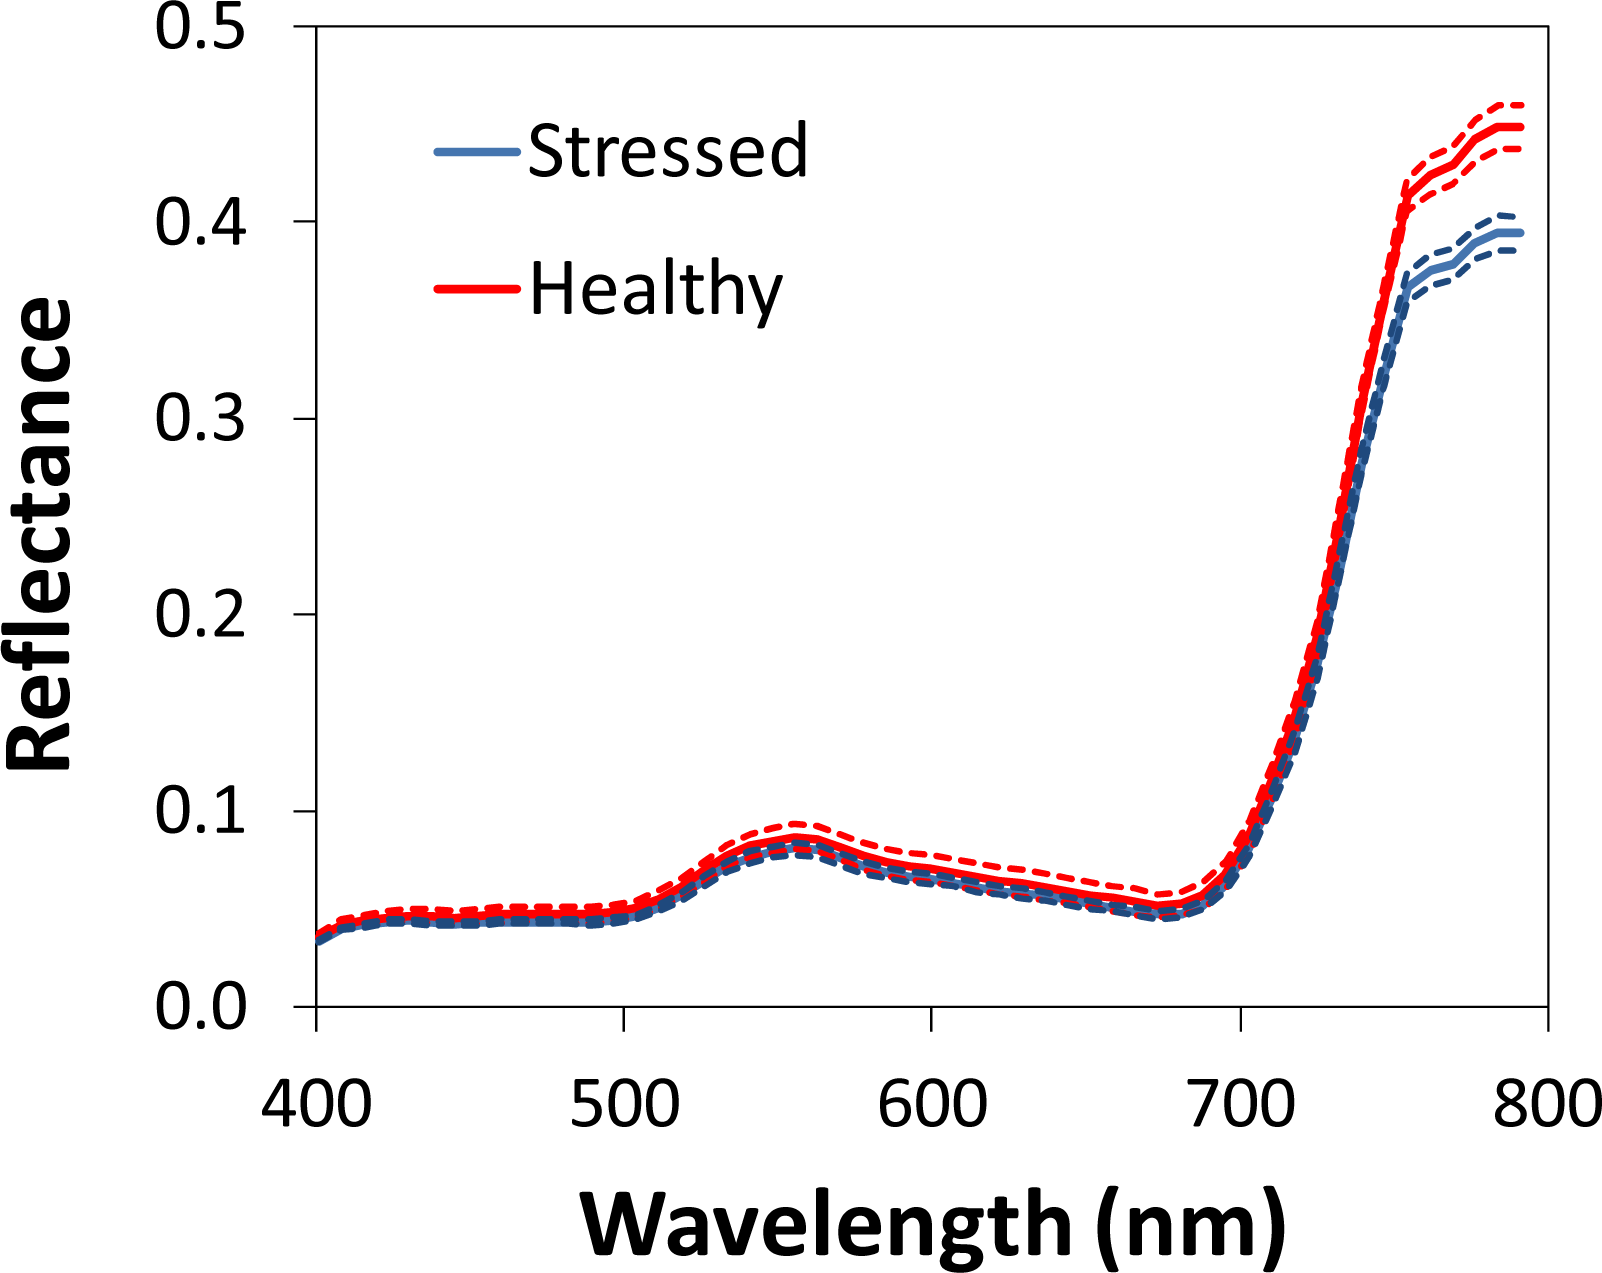
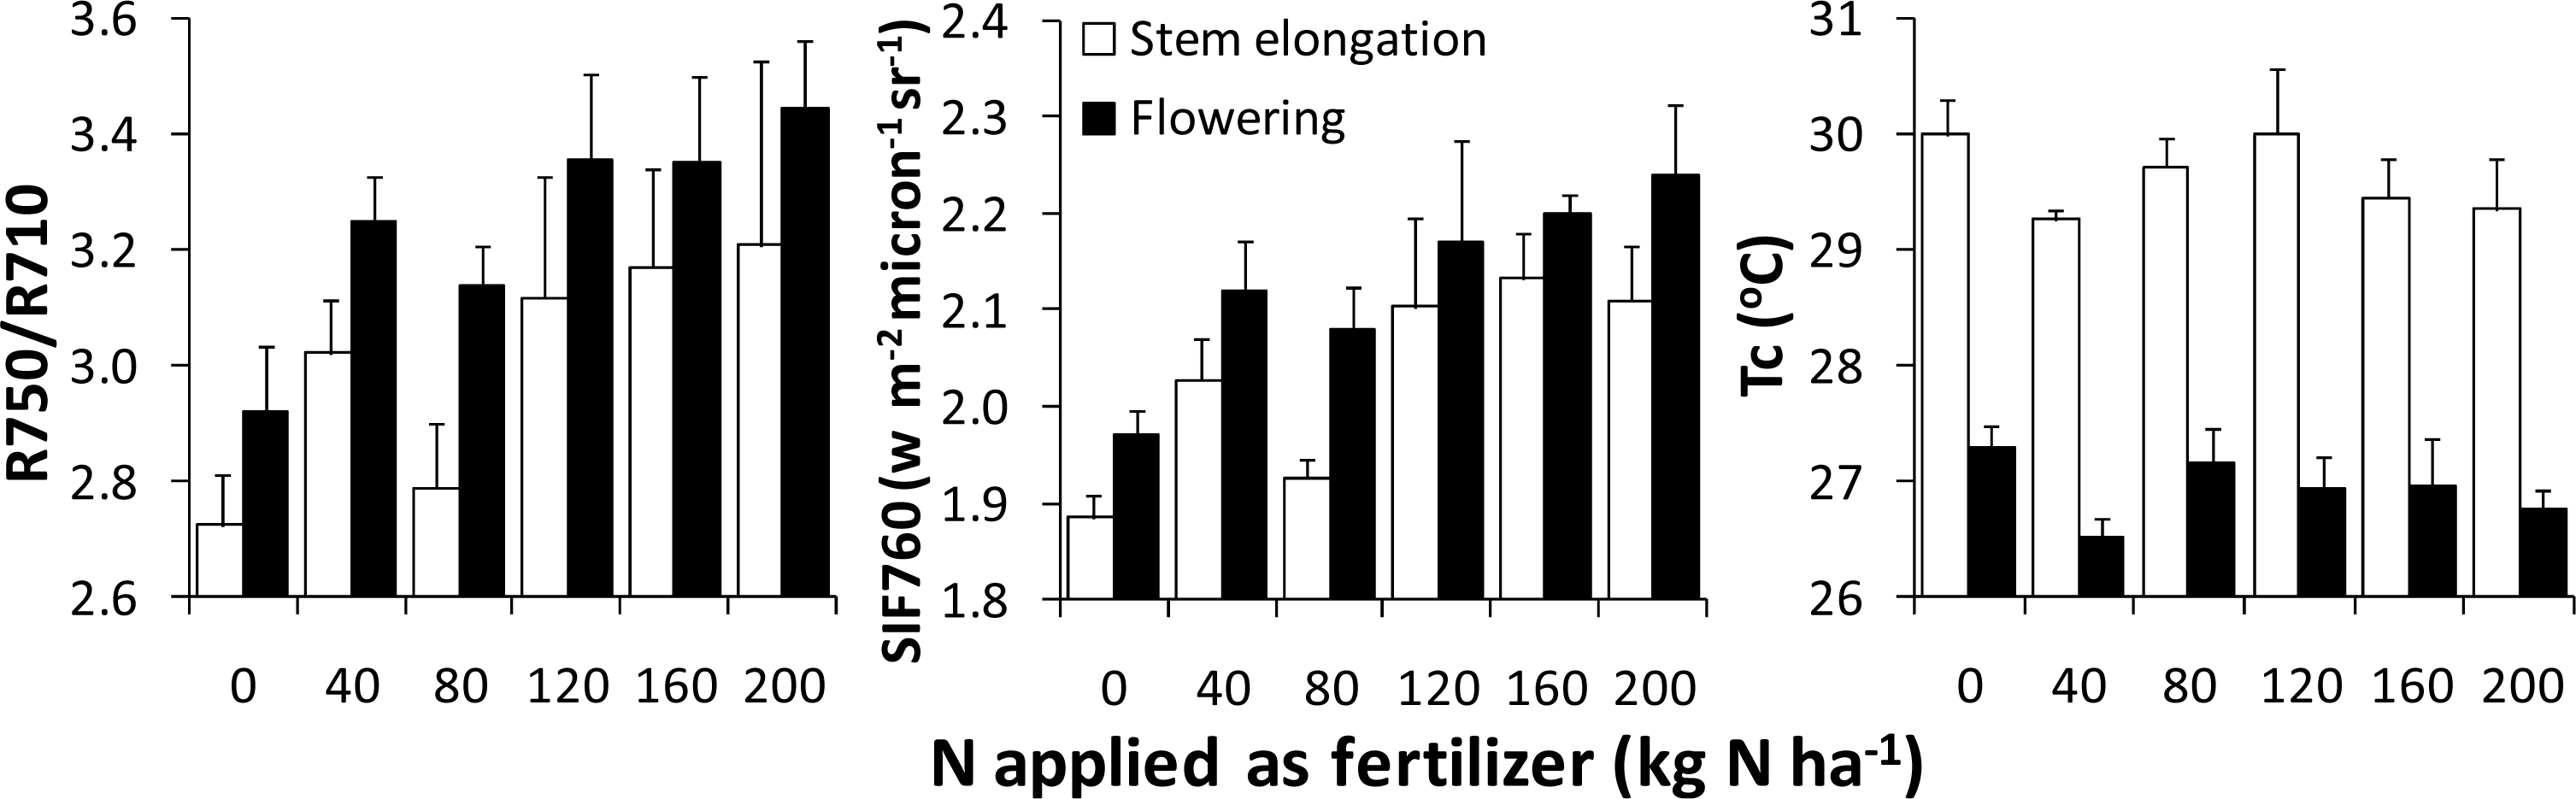
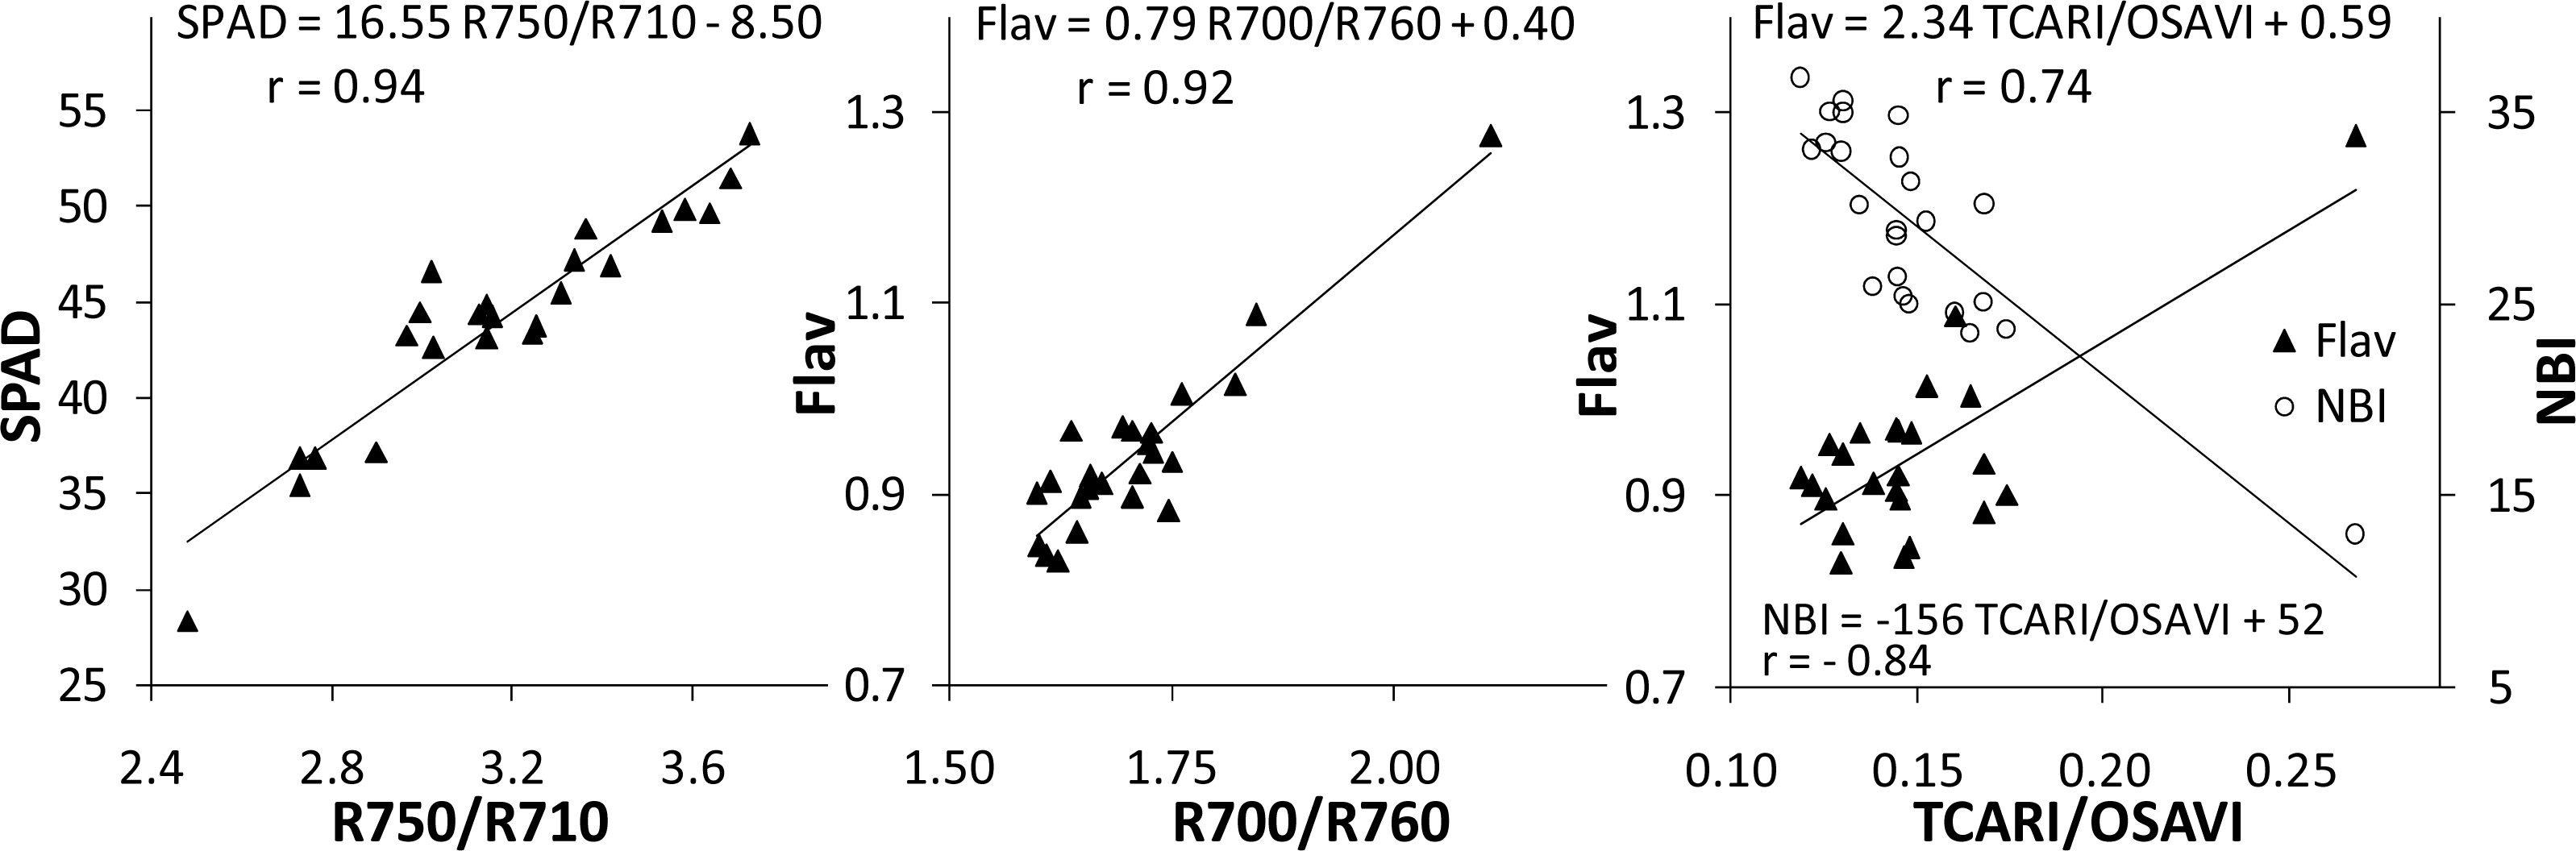
3.1. Optical Ground-Level Measurements

At flowering, chlorophyll (SPAD, Chl Dualex, SFR) and nitrogen balance (NBI, NBI-G) indices tended to increase with the N application rate and showed differences between lower and higher N application treatments (Table 3). FLAV and ANTH tended to decrease with increasing N application treatment, while the FERARI showed no difference between treatments. These results are in agreement with [8,28], who observed that N deficiency reduced Chl content and increased polyphenols. At stem elongation, the same trend was observed for indices obtained from leaf clip sensors, but results were unclear for Multiplex® indices. This could be explained by the low signal intensity of Multiplex® indices at early stages, when the leaf is too narrow to provide a homogenous surface reading [9].
The correlation between SPAD and Chl Dualex® readings was very good (>0.90) at both growth stages (Tables 4 and 5). Interestingly, the slope of the linear correlation was different between both growth stages. At stem elongation, the slope was close to one; at flowering, by contrast, SPAD values were larger than Chl Dualex® values, and the slope was 0.7. The correlation between the NBI and SPAD or Chl Dualex® was significant at both growth stages, but the Pearson coefficient clearly increased at flowering. This means that FLAV concentration was more relevant when the crop was more developed, even if the actual values were lower at flowering (Table 3). These results agree with other studies [28], which have shown a good correlation between SPAD and Chl Dualex® readings in corn at seven different sampling dates.
The linear and the quadratic correlations between SPAD and Chl Dualex® readings were poor for all the indices calculated at stem elongation, but greatly improved at flowering. At stem elongation, the correlations with SPAD and Chl Dualex® were always below 0.5; at flowering, such correlations were very high (∼0.9). Given that Dualex® and Multiplex® FLAV determination is based on the same method, the fact that NBI indices were highly correlated (0.87) at flowering is not surprising. The correlation between Chl readings taken with the leaf clip equipment and ANTH was also very high (∼0.9). Overall, Chl measurements taken with the three types of equipment were highly correlated, with the exception of Multiplex® indices at the early stages, due to a low signal intensity.
Measurements taken at flowering from husk leaves were highly correlated with those taken from the uppermost fully developed leaf. Particularly high correlations were found between Chl determined by either SPAD (R2 > 0.8) or SFR Multiplex® (R2 > 0.9). Polyphenol content, particularly FLAV, was higher in the uppermost fully developed leaf than in husk leaves, but the correlation between readings from both leaves was highly significant (p > 0.01). Indices based on the uppermost fully developed leaf were slightly better correlated with yield and crop N uptake than those based on husk leaves (data not shown). However, we concluded that readings from either the uppermost fully developed leaf or husk leaves could be used to study crop N nutritional status, particularly regarding indices relying on Chl content. In this study, we only present results for the uppermost fully developed leaf, as airborne images of closed canopies are most likely to represent conditions expressed in the upper leaf layers.

3.2. Optical Ground-Level vs. Airborne Measurements

The analysis of the canopy reflectance spectra extracted from airborne images of the control (i.e., no N application) and well-fertilized treatments showed differences in the visible and near-infrared regions (Figure 2). This is in agreement with findings in the literature and with similar canopy reflectance spectra reported for maize with several levels of plant N concentration [35], even though in our experiment, the spectral differences between N levels were more obvious for wavelengths >740 nm than for the visible region. In our study, differences between treatments were particularly relevant at flowering (Figure 3). For this reason, the correlation between vegetation indices calculated from airborne measurements and optical ground-level sensors are presented separately for each growth stage.
At flowering, most chlorophyll and greenness indices showed a dose-dependent response. As an example, R750/R710 and SIF760 tended to increase with the N application rate and showed differences between lower and higher N application treatments (Figure 3). At stem elongation, a similar response was observed for most indices, but results were less clear, probably due to a lower ground cover. Cooler temperatures were obtained for all N treatments, compared to controls, at stem elongation and fully mature flowering canopies (Figure 3).

3.2.1. Flowering

The greenness indices showed significant linear correlations with Chl indices at ground level (Table 5). The coefficient of determination between the NDVI and Chl content was 0.77–0.78 when Chl was measured with either SPAD or Dualex®; by contrast, better results (0.86) were obtained when Chl was measured with SFR Multiplex®. However, the correlation between the NDVI and the NBI was lower, particularly when measured with Multiplex® NBI-G (0.24). This is probably due to the lack of correlation between the NDVI and FLAV. A similar trend was observed for the RDVI, although with a lower coefficient of correlation for either the Chl indices or the NBI.
Airborne and ground-level Chl indices were highly correlated, particularly the R750/R710 and TCARI/OSAVI ratios (p > 0.01). The linear correlations between the R750/R710 and the different indices measured were the following: 0.94 with SPAD (Figure 4), 0.90 with Chl Dualex® and 0.94 with SFR Multiplex®. The R750/710 ratio was a good predictor of Chl content in a forest canopy [12], a vineyard [33] and maize crop [31]. The correlation between both variables was linear in all cases. The slope of the linear model varies between studies (i.e., 22.8 in [33] vs. 16.5 in Figure 4), although it should be noted that the Chl content determination methods also differed (directly measured from leaf samples vs. SPAD). Therefore, the predictive capability of R750/R710 seems consistent and satisfactory, but more research is needed before a unique relationship with Chl content is established. The correlation between the R750/R710 and FLAV was low, but the correlation between the R750/R710 and the NBI determined with either Dualex® or Multiplex® was highly significant
The correlation between the Chl indices of the three ground-level sensors and the TCARI/OSAVI was significant, although with a slightly lower correlation coefficient than the R750/R710. In addition, the TCARI/OSAVI showed a highly significant relationship with FLAV and, therefore, with the NBI as determined with both Dualex® and Multiplex® (Figure 4). The other airborne Chl indices also showed a high relationship with FLAV, particularly the R700/R760 ratio (Figure 4). The TCARI/OSAVI has also been reported to be a good spectral indicator related to plant N nutritional status in corn [35], mainly because of its correlation with chlorophyll activity.
According to the airborne photochemical index, both the PRI and the PRInorm showed a significant correlation with the three types of ground-level equipment. The correlation coefficients were higher than those of the NDVI and lower than those of the R750/R710. The correlation between FLAV and the PRI or the PRInorm was not significant. Among the blue/green/red ratio indices, the BGI1 was found to have a higher correlation with Chl ground-level measurements than the BGI2; however, a high correlation was observed between the BGI2 and FLAV as determined with Dualex®. Fluorescence retrieval yielded significant results when compared to ground-measured SPAD and SFR, but also when compared to Phen content indices, as was the case with the ANTH and FERARI determined with Multiplex® equipment. The photochemical, blue/green/red ratio and SIF760 indices showed a significant correlation with yield, biomass and crop N uptake.

3.2.2. Stem Elongation

Neither the greenness nor the photochemical indices were found to have significant correlations with Chl meter readings, showing a very low predictive power for N nutritional status at medium growth stages. This is important, because in most maize fields, applying the fertilizer at the beginning of stem elongation makes it possible to adjust its levels and therefore reduce excess fertilizer. According to the airborne Chl indices, the R750/R710 and TCARI/OSAVI ratios were significantly correlated with ground-level Chl measurements, although the correlation coefficients were lower at this stage than at flowering. The TCARI/OSAVI ratio was also correlated with FLAV, and the correlation with the NBI was highly significant. In agreement with these results, an index based on reflectance from the 670–700 nm and the 700–720 nm bands showed the best correlation with maize N concentration when the crop had four fully-developed leaves [35]. The index was named the “Double-peak Canopy Nitrogen Index (DCNI)” and also showed significant correlations with wheat N concentration. In the spectra used in our experiment, differences between treatments were not obvious in the visible region peak (Figure 2). This is probably the reason why the R750/R710 was good at representing the correlation between radiance in the infrared and the far-red bands. In the same study [35], the TCARI/OSAVI ratio was also correlated with crop N concentration at early growth stages. In our experiment, there was a five-day delay between ground level and airborne data collection, due to bad weather conditions. As maize canopies change rapidly at stem elongation, the correlation between ground and airborne data may be worsened. Another reason that could explain the low correlation is the small leaf area index at stem elongation (1.13 for the control to 1.86 for the well fertilized treatment), as was observed in previous research [31].

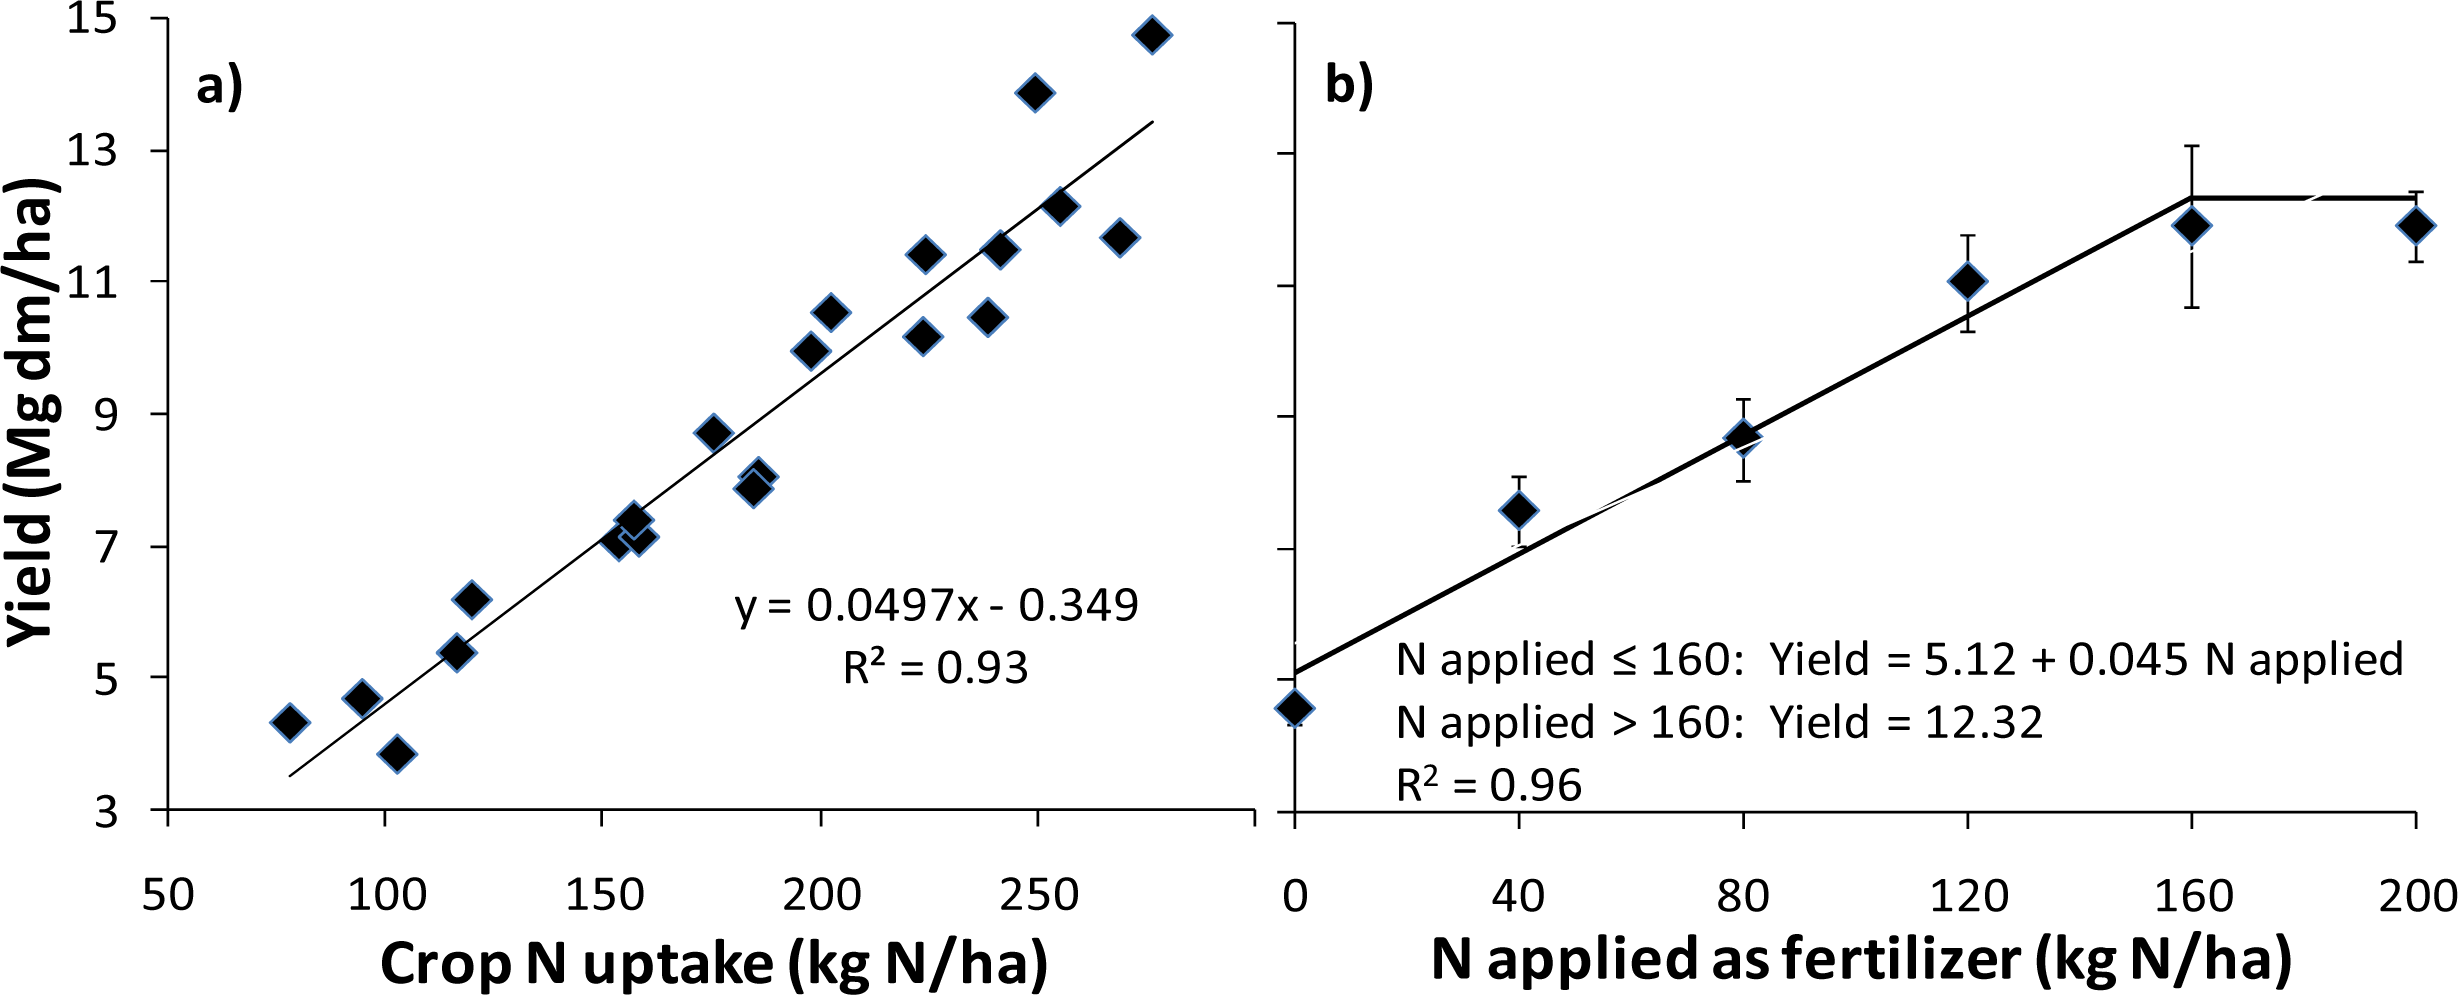
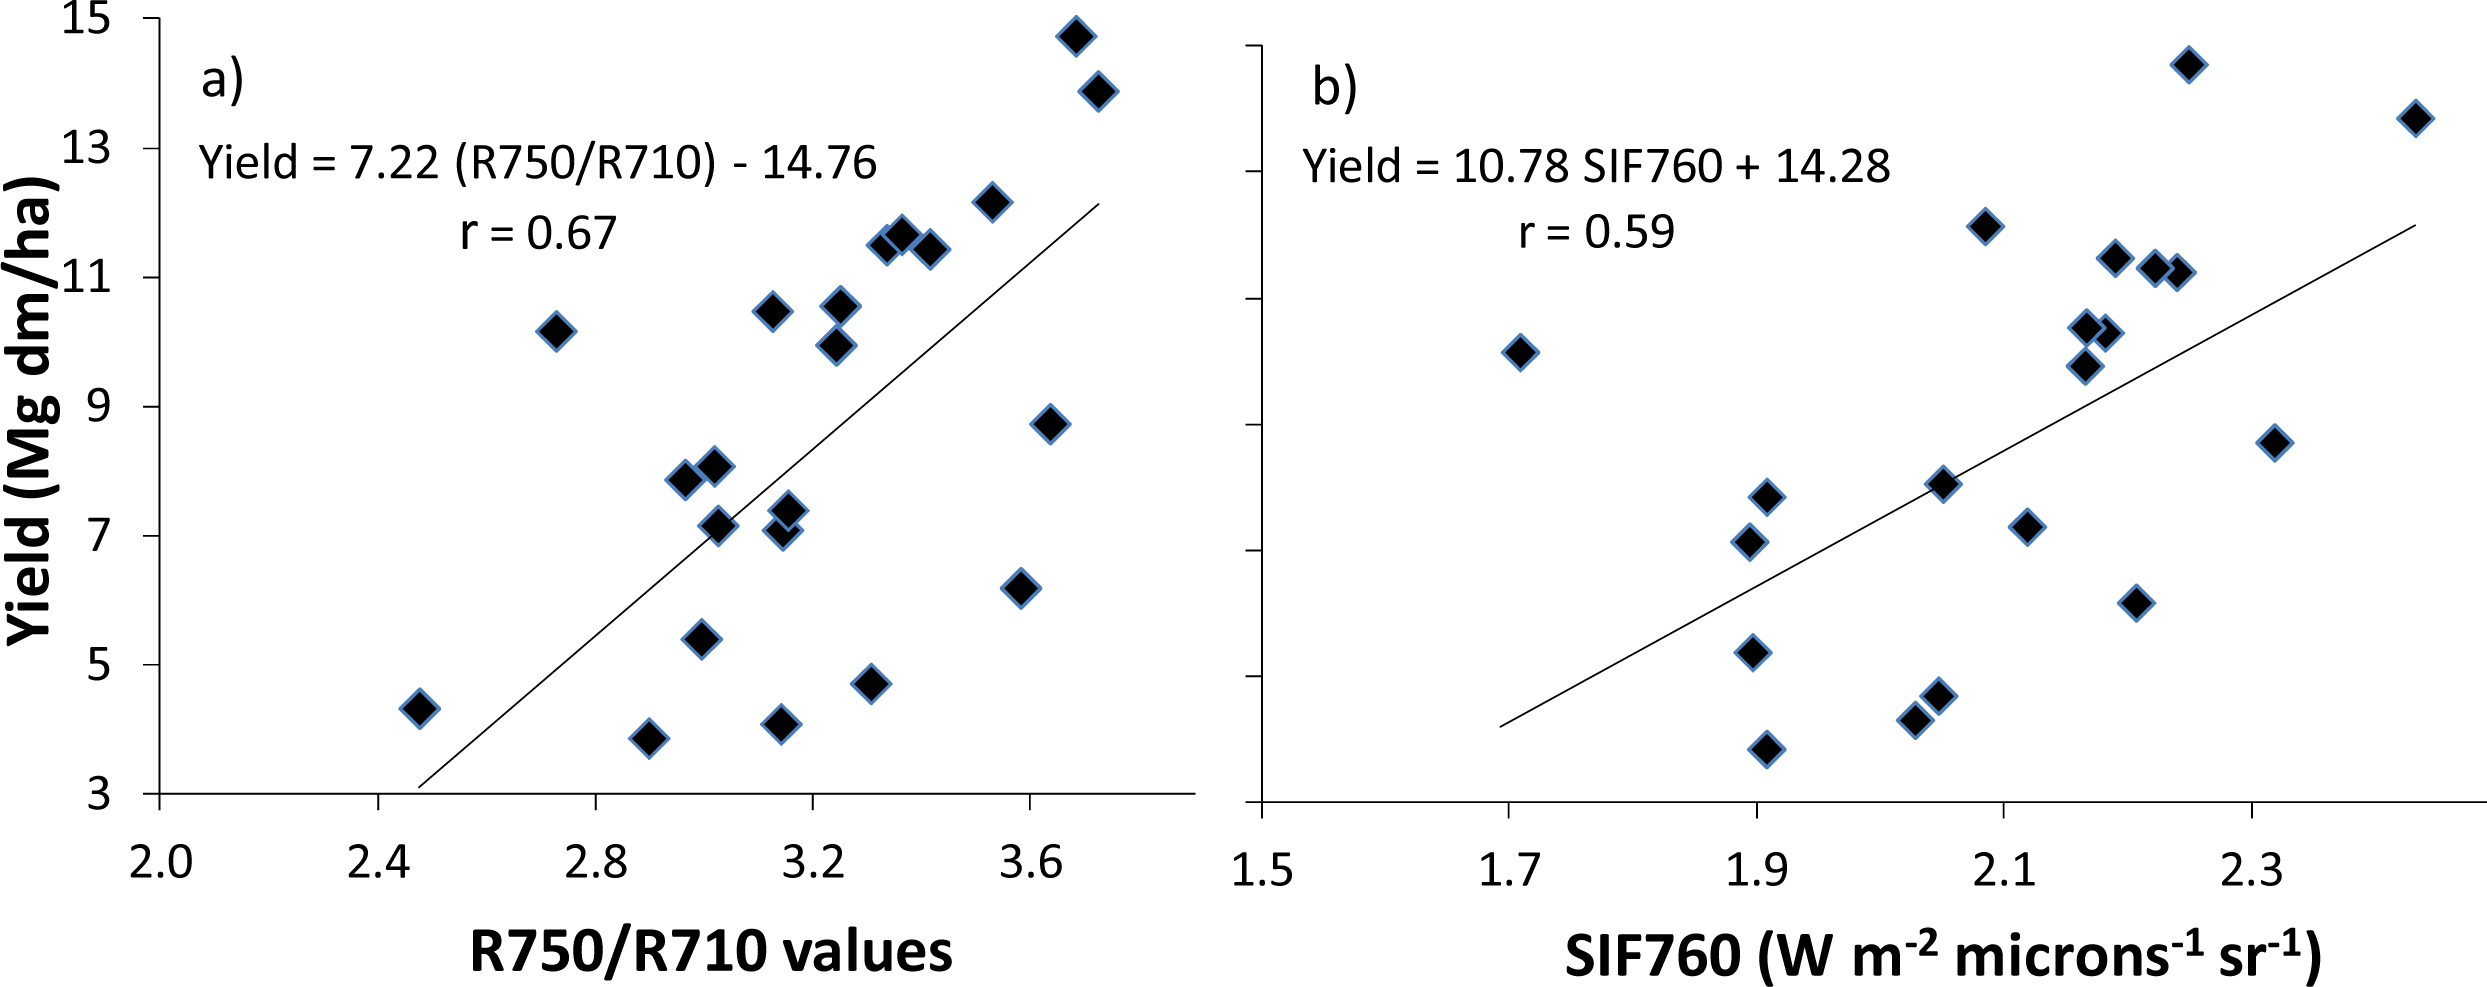
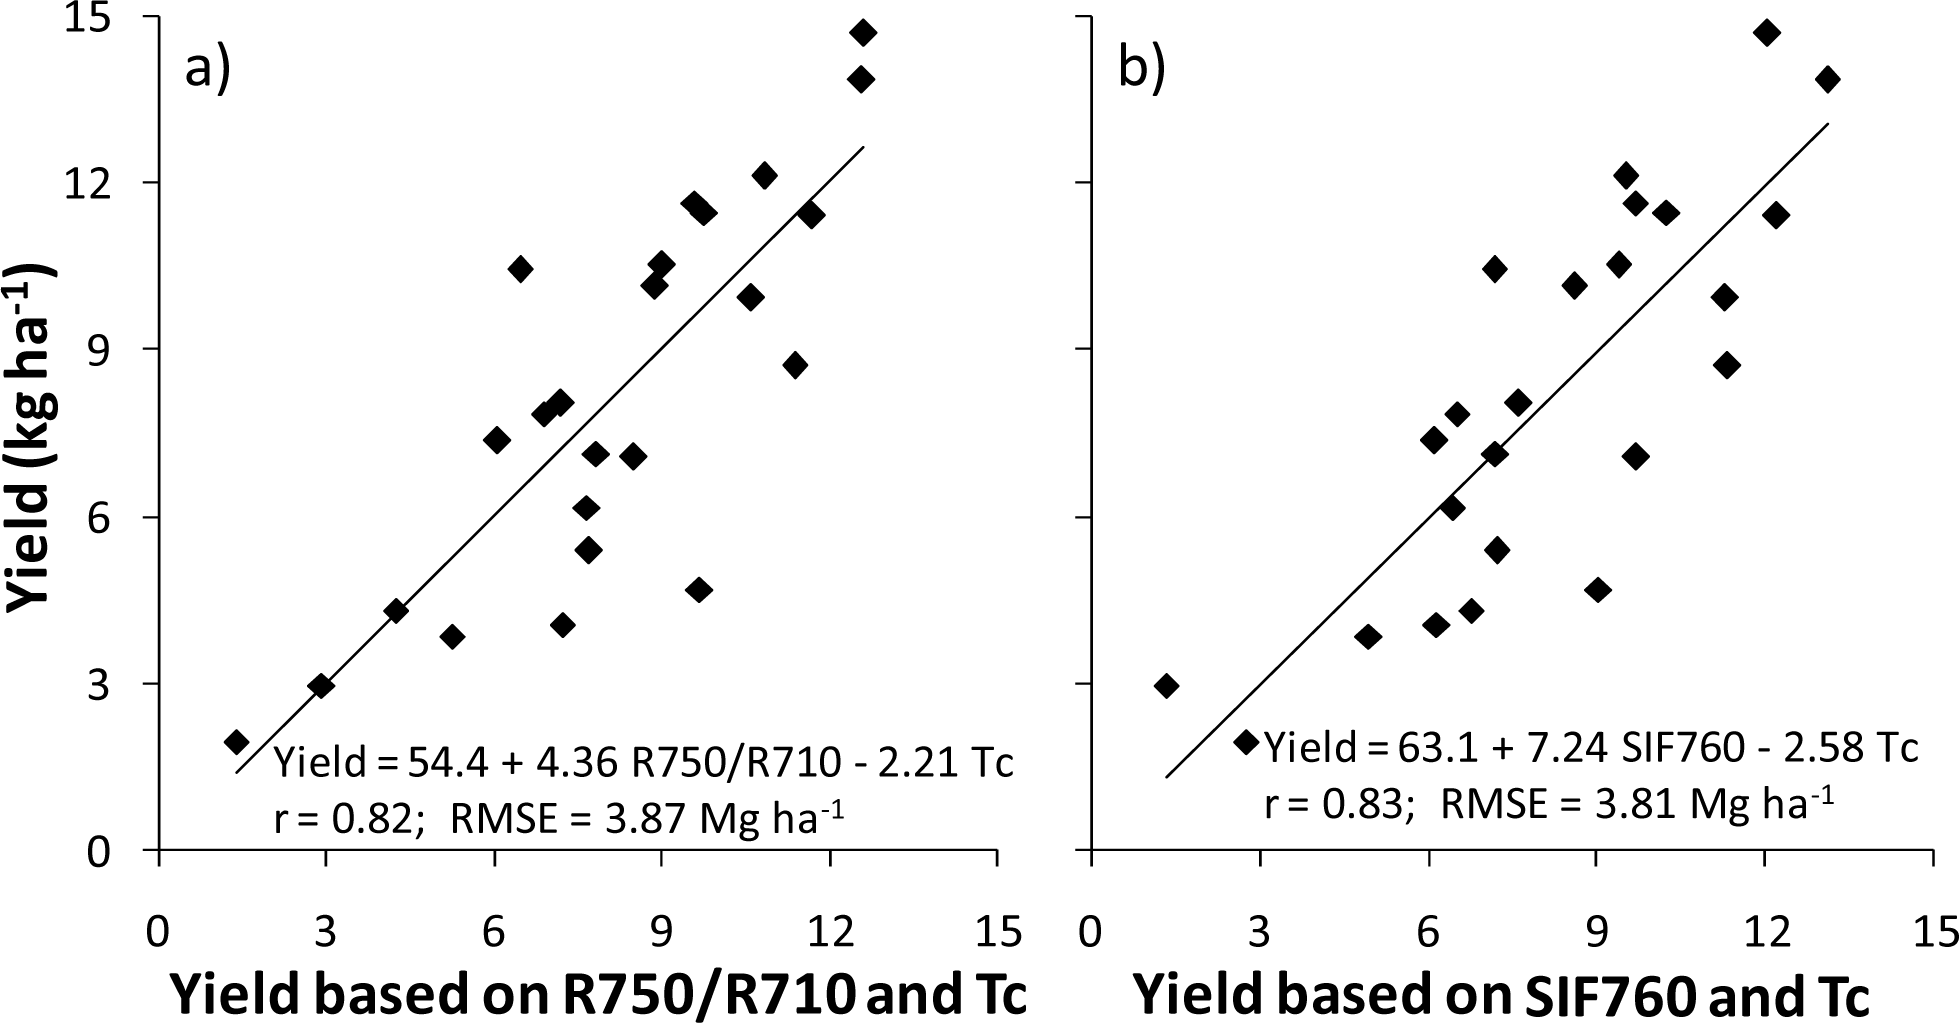
3.3. Application to N Fertilizer Recommendation

The correlation between yield and total crop N uptake was linear and clearly significant (p < 0.001), showing a strong yield response to N uptake (Figure 5a). The mean crop N uptake in control plots was 98 kg·N·ha−1, and in the treatments that received the maximum fertilizer rate, it was 262 kg·N·ha−1. Grain yield was highly correlated with grain N uptake (R2 = 0.94), total crop N uptake (R2 = 0.96) and total aboveground biomass at harvest (R2 = 0.93). The N curve response showed a yield plateau at 12.32 Mg·dm·ha−1, and the optimal N fertilizer rate corresponded to 160 kg·N·ha−1 plots (Figure 5b). This segmented curve response makes the approach based on the NSI particularly interesting, as indices that saturate or lose sensitivity beyond a threshold value will still be reliable, as long as they allow the differentiation of N-sufficient from N-deficient sites.
At flowering, a significant correlation was observed between ground-level Chl measurements and yield (Table 5). The best correlation was observed for SPAD (R = 0.67). The NDVI airborne greenness index and the R750/R710 Chl index also showed a significant correlation with yield. In particular, the correlation coefficient of the R750/R710 ratio was as high as SPAD readings at ground level. In both plots, a comparison of crop yield vs. either the R750/R710 or the SIF760 revealed a group of five dots forming a bow shape in the lower part of the plot in which the expected yield base on the index value was lower than that observed (Figure 6). These results suggest that, in these dots, there was a growth-limiting factor other than N that did not have an effect on the index reading. Previous research has found that reflectance in the red-edge region was useful for identifying N stress in corn [36]. In the absence of other limiting factors, most literature has shown that ratios between red-edge and near-infrared reflectance provide the best correlation with leaf N concentration [35,37]. To detect N deficiency in wheat under different water status, a two-dimensional reflectance-based index combining an indicator of plant cover (NDVI), and an indicator of Chl content has been proposed [38]. However, in our study, a combination of two narrow-band indices did not improve yield prediction. Thermal remote sensing measurements have been shown to be very sensitive at detecting water stress for many agricultural crops [39], and a combination of thermal and spectral indices has successfully been used to examine water and N stress in wheat [40] and cotton [41].
To clarify whether an effect of water was present in our results, a two-variable lineal model, including Tc, and either each of the narrow-band indices or the fluorescence was fitted to the yield data. At flowering, adding the Tc variable to either the R750/710 index or SIF760 improved the model (p < 0.001), and the Pearson coefficient increased to 0.82. The presence of the two variables in the model was significant in both cases (Figure 7). Including Tc improved the correlation between the rest of the narrow-band indices and yield, but the presence of the two variables in the model was not significant (p > 0.01). These results show the need to study crop N status and water stress together and support the idea of developing indices that can distinguish between both effects [42]. In some studies in which ground-level sensors were used [8,28], indices based on ratios between Chl and Phen (NBI, FERARI) were better indicators of N crop status than single Chl indices. This was not the case in our study, perhaps due to an interference between Phen accumulation due to crop water and N status.
At stem elongation, the indices that yielded significant results (p < 0.01) when compared to crop yield were R750/710 and SIF760 (Table 4). Including Tc improved the correlation between the rest of the indices and yield, but the presence of the two variables in the model was not significant (p > 0.01).
In terms of N recommendations, it is interesting for farmers and agricultural advisors to assess crop nutritional status at early growth stages (i.e., stem elongation), because machinery can still enter into the field and apply variable N fertilizer rates to ensure crop growth [43]. The interest in advanced growth stages is limited to cropping systems where N can be supplied using means that are compatible with close canopies, such as fertigation, where N can be supplied in irrigation water [44]. Readings taken at advanced growth stages could also be used to predict yield and grain N content in order to plan harvests and deal with food security issues. For variable rate fertilizer recommendations, even the best correlation coefficient was too low to develop an algorithm that could adjust N fertilizer application to crop requirements. Therefore, more research is needed to clarify the correlation between indices obtained from field or airborne imagery with N fertilizer recommendation, particularly at early growth stages and in the presence of other growth factors that might interfere with the readings.
The error of the indices at distinguishing between N-sufficient and N-deficient treatments, calculated as the percentage of outliers in relation to the total points, ranged between 20% and 50% at stem elongation and between 20 and 40% at flowering (Figure 8). The robustness of the results was confirmed by the similar behavior of the indices for both sampling dates, with the exception of Multiplex® indices, which performed poorly at stem elongation, as discussed above. In SPAD, the R750/R710 or SIF760 were used to identify N-sufficient plots; the percentage of error would be 20% either at stem elongation or at flowering. If the NDVI were used, the error would be 36% at stem elongation and 30% at flowering. In Pennsylvania, an error of 8% was obtained when identifying N-sufficient corn plots using SPAD at the early milk corn stage [6]; however, the authors emphasized the need for earlier predictions if the aim is the application to N fertilization. In northern Spain, a study reported that the percentage of errors in wheat decreases as the crop cycle progresses and that 14% was an acceptable error to identify N-sufficient plots at the beginning of stem elongation [2]. There is not an acceptable error level for field application, but the 20% error observed in our results is too high for decision-making support, confirming that, although there is a potential for the future application of certain indices (particularly ground-level measurements, R750/R710 and SIF760), there is still a need to clarify the interaction with other stress factors.
In this study, hyperspectral measurements were used to calculate narrow-band vegetation indices. The advantage of this approach is that these indices have a physiological meaning, so they are expected to reliably characterize vegetation canopies. The disadvantage is that they present strong collinearity (Tables 4 and 5), because they contain large amounts of redundant information, as the spectral bands that control most of the variability in vegetation canopies are based on a limited number of parameters [45]. Several techniques that deal with the collinearity present in the spectral data have been developed, like the full-spectrum methods widely used in chemometrics [46]. As an example, the partial least squares regression (PLSR) was successfully used to assess Chl canopy content based on vegetation hyperspectral data, and it outperformed an optimized NDVI that was used as a baseline approach [47]. Therefore, techniques that take into account the collinearity should be considered as a complementary method to the vegetation indices when analyzing the canopy spectral data.

4. Conclusions

Despite numerous sources of variation, indices based on airborne measurements were as reliable as ground-level measurements at assessing crop nitrogen (N) status and predicting yield at flowering. At stem elongation, the only indices that yielded significant results when compared to crop yield were the reflectance ratio (R750/R710), and fluorescence retrieval (SIF760). The most reliable ground-level indices to differentiate between maize plants treated with different N fertilizer rates were SPAD readings, Chl Dualex® and SFR Multiplex®. The R750/R710 airborne chlorophyll index and SIF760 were more accurate at differentiating between maize plants treated with different N fertilizer rates than the greenness indices, such as the Normalize Difference Vegetation Index (NDVI).
Although the error of the indices at distinguishing between N-sufficient and N-deficient treatments was too large for field application, certain indices showed high predictive capability and a potential for future application. Specifically, if SPAD, the R750/R710 or SIF760 were used to identify N-sufficient plots, the percentage of error would be 20%. At flowering, including the variable, Tc (i.e., the mean temperature of each plot recorded with the thermal camera), to either the R750/710 index or SIF760 improved the correlation with crop yield. This suggests that further research is needed to account for other sources of variability that may interfere in the identification of N nutritional status.

Acknowledgments

This work was funded by the Spanish Comisión Interministerial de Ciencia y Tecnología (projects AGL 2011-24732 and AGL2012-40053-C03-01), the Regional Government of Madrid (Project AGRISOST, S2009/AGR-1630) and the Belgian Fonds spéciaux de recherche (FSR). We would like to thank the staff of La Chimenea field station (IMIDRA) for their helpful assistance.

Author Contributions

M. Quemada led the study, coordinated field data collection, analyzed the application to N fertilizer recommendation and wrote the manuscript. P. Zarco-Tejada led the airborne campaigns and processed and analyzed these data. J.L. Gabriel participate collecting the field data at ground level and analyzed the correlation between data. P. Zarco-Tejada and J.L. Gabriel contributed to the writing of the manuscript.

Conflicts of Interest

The authors declare no conflict of interest.

References

  1. Tilman, D.; Cassman, K.G.; Matson, P.A.; Naylor, R.; Polasky, S. Agricultural sustainability and intensive production practices. Nature 2002, 418, 671–677. [Google Scholar]
  2. Arregui, L.M.; Lasa, B.; Lafarga, A.; Irañeta, I.; Baroja, E.; Quemada, M. Evaluation of chlorophyll meters as tools for N fertilization in winter wheat under humid Mediterranean conditions. Eur. J. Agron 2006, 24, 140–148. [Google Scholar]
  3. Samborski, S.M.; Tremblay, N.; Fallon, E. Strategies to make use of plant sensors-based diagnostic information for nitrogen recommendations. Agron. J 2009, 101, 800–816. [Google Scholar]
  4. Martínez, D.E.; Guimat, J.J. Distortion of the SPAD 502 chlorophyll meter readings by changes in irradiance and leaf water status. Agronomie 2004, 24, 41–46. [Google Scholar]
  5. Fox, R.H.; Walthall, C.L. Crop Monitoring Technologies to Assess Nitrogen Status. In Nitrogen in Agricultural Systems, Agronomy Monograph 49; Schepers, J.S., Raun, W.R., Eds.; ASA, CSSA, SSSA: Madison, WI, USA, 2008; Chapter 16; pp. 647–674. [Google Scholar]
  6. Piekielek, W.P.; Fox, R.H.; Toth, J.D.; Macneal, K.E. Use of a chlorophyll meter at the early dent stage of corn to evaluate nitrogen sufficiency. Agron. J 1995, 87, 403–408. [Google Scholar]
  7. Monje, O.A.; Bugbee, B. Inherent limitations of nondestructive chlorophyll meters: A comparison of two types of meters. HortScience 1992, 27, 69–71. [Google Scholar]
  8. Cerovic, Z.G.; Ounis, A.; Cartelat, A.; Latouche, G.; Goulas, Y.; Meyer, S.; Moya, I. The use of chlorophyll fluorescence excitation spectra for the non-destructive in situ assessment of UV absorbing compounds in leaves. Plant Cell Environ 2002, 25, 1663–1676. [Google Scholar]
  9. Tremblay, N.; Wang, Z.; Cerovic, Z.G. Sensing crop nitrogen status with fluorescence indicators. A review. Agron. Sustain. Dev 2011, 32, 451–464. [Google Scholar]
  10. Hamilton, J.; Zangerl, A.; De Lucia, E.; Berenbaum, M. The carbon-nutrient balance hypothesis: Its rise and fall. Ecol. Lett 2001, 4, 86–95. [Google Scholar]
  11. Cartelat, A.; Cerovic, Z.G.; Goulas, Y.; Meyer, S.; Lelarge, C.; Prioul, J.L.; Barbottin, A.; Jeuffroy, M.H.; Gate, P.; Agati, G.; et al. Optically assessed contents of leaf polyphenolics and chlorophyll as indicators of nitrogen deficiency in wheat (Triticum. aestivum L.). Field Crop. Res 2005, 91, 35–49. [Google Scholar]
  12. Zarco-Tejada, P.J.; Miller, J.R.; Mohammed, G.H.; Noland, T.L.; Sampson, P.H. Scaling-up and model inversion methods with narrow-band optical indices for chlorophyll content estimation in closed forest canopies with hyperspectral data. IEEE Trans. Geosci. Remote Sens 2001, 39, 1491–1507. [Google Scholar]
  13. Kyveryga, P.M.; Blackmer, T.M.; Pearson, R. Normalization of uncalibrated late-season digital aerial imagery for evaluating corn nitrogen status. Prec. Agric 2012, 13, 2–16. [Google Scholar]
  14. Ritchie, G.L.; Sullivan, D.G.; Vencill, W.K.; Bednarz, C.W.; Hook, J.E. Sensitivities of normalized difference vegetation index and a green/red ratio index to cotton ground cover fraction. Crop Sci 2010, 50, 1000–1010. [Google Scholar]
  15. Rouse, J.W.; Haas, R.H.; Schell, J.A.; Deering, D.W.; Harlan, J.C. Monitoring the Vernal Advancements and Retrogradation of Natural Vegetation; NASA/GSFC: Greebelt, MD, USA, 1974. [Google Scholar]
  16. Pinter, P.J., Jr.; Hatfield, J.L.; Schepers, J.S.; Barnes, E.M.; Moran, M.S.; Daughtry, C.S.; Upchurch, D.R. Remote sensing for crop management. Photogramm. Eng. Remote Sens 2003, 69, 647–664. [Google Scholar]
  17. Reed, J.J.; Tarpley, L.; McKinion, J.M.; Reddy, K.R. Narrow-waveband reflectance ratios for remote estimation of nitrogen status in cotton. J. Environ. Qual 2002, 31, 1442–1452. [Google Scholar]
  18. Zarco-Tejada, P.J.; González Dugo, V.; Berni, J.A.J. Fluorescence, temperature and narrowband indices acquired from a UAV platform for water stress detection using a micro-hyperspectral imager and a thermal camera. Remote Sens. Environ 2012, 117, 322–337. [Google Scholar]
  19. Zarco-Tejada, P.J.; Morales, A.; Testi, L.; Villalobos, F.J. Spatio-temporal patterns of chlorophyll fluorescence and physiological and structural indices acquired from hyperspectral imagery as compared with carbon fluxes measured with eddy covariance. Remote Sens. Environ 2013, 133, 102–115. [Google Scholar]
  20. Zarco-Tejada, P.J.; Catalina, A.; González, M.R.; Martín, P. Relationships between net photosynthesis and steady-state chlorophyll fluorescence retrieved from airborne hyperspectral imagery. Remote Sens. Environ 2013, 136, 247–258. [Google Scholar]
  21. Soil Survey Staff. Keys to Soil Taxonomy, 9th ed.; USDA, Natural Resources Conservation Service: Washington, DC, USA, 2003. [Google Scholar]
  22. Papadakis, J. Climates of the World and Their Agricultural Potentialities; DAPCO: Rome, Italy, 1966. [Google Scholar]
  23. Gabriel, J.L.; Quemada, M. Replacing bare fallow with cover crops in a maize cropping system: Yield, N uptake and fertiliser fate. Eur. J. Agron 2011, 34, 133–143. [Google Scholar]
  24. Allen, R.G.; Pereira, L.S.; Raes, D.; Smith, M. FAO 56 Irrigation and Drainage Paper: Crop Evapotranspiration; Food and Agriculture Organization: Rome, Italy, 1998. [Google Scholar]
  25. Martínez-Cob, A. Use of thermal units to estimate corn crop coefficients under semiarid climatic conditions. Irrig. Sci 2008, 26, 335–345. [Google Scholar]
  26. Lancashire, P.D.; Bleiholder, H.; Langelüddecke, P.; Stauss, R.; van Den Boom, T.; Weber, E.; Witzen-Berger, A. An uniform decimal code for growth stages of crops and weeds. Ann. Appl. Biol 1991, 119, 561–601. [Google Scholar]
  27. Yadava, U.L. A rapid and nondestructive method to determine chlorophyll in intact leaves. Hortscience 1986, 21, 1449–1450. [Google Scholar]
  28. Tremblay, N.; Wang, Z.; Bélec, C. Evaluation of the Dualex for the assessment of corn nitrogen status. J. Plant Nutr 2007, 30, 1355–1369. [Google Scholar]
  29. Berni, J.A.J.; Zarco-Tejada, P.J.; Suárez, L.; Fereres, E. Thermal and narrow-band multispectral remote sensing for vegetation monitoring from an unmanned aerial vehicle. IEEE Trans. Geosci. Remote Sens 2003, 47, 722–738. [Google Scholar]
  30. Rougean, J.L.; Breon, F.M. Estimating PAR absorbed by vegetation from bidirectional reflectance measurements. Remote Sens. Environ 1995, 51, 375–384. [Google Scholar]
  31. Haboudane, D.; Miller, J.R.; Tremblay, N.; Zarco-Tejada, P.J.; Dextraze, L. Integrated narrow-band vegetation indices for prediction of crop chlorophyll content for application to precision agriculture. Remote Sens. Environ 2002, 81, 416–426. [Google Scholar]
  32. Gamon, J.A.; Peñuelas, J.; Field, C.B. A narrow-wave band spectral index that tracks diurnal changes in photosynthetic efficiency. Remote Sens. Environ 1992, 41, 35–44. [Google Scholar]
  33. Zarco-Tejada, P.J.; Berjón, A.; López-Lozano, R.; Miller, J.R.; Marin, P.; Cachorro, V.; González, M.R.; de Frutos, A. Assessing vineyard condition with hyperspectral indices: Leaf and canopy reflectance simulation in a row-structured discontinuous canopy. Remote Sens. Environ 2005, 99, 271–287. [Google Scholar]
  34. Varvel, G.E.; Schepers, J.S.; Francis, D.D. Ability for in season correction of nitrogen deficiency in corn using chlorophyll meter. Soil Sci. Soc. Am. J 1997, 61, 1233–1239. [Google Scholar]
  35. Chen, P.; Haboudane, D.; Tremblay, N.; Wang, J.; Vigneault, P.; Li, B. New spectral indicator assesing the efficiency of crop nitrogen treatment in corn and wheat. Remote Sens. Environ 2010, 114, 1987–1997. [Google Scholar]
  36. Blackmer, T.M.; Schepers, J.S.; Varvel, G.E. Light reflectance compared with other nitrogen stress measurements in corn leaves. Agron. J 1996, 6, 934–938. [Google Scholar]
  37. Tarpley, L; Reddy, K.R.; Sassenrath-Cole, G.F. Reflectance indices with precision and accuracy in predicting cotton leaf nitrogen concentration. Crop Sci 2002, 40, 1814–1819. [Google Scholar]
  38. Rodriguez, D.; Fitzgerald, G.J.; Belford, R. Detection of nitrogen deficiency in wheat from spectral reflectance indices and basic crop eco-physiological concepts. Aust. J. Agric. Res 2006, 57, 781–789. [Google Scholar]
  39. Moran, M.S.; Clarke, T.R.; Inoue, Y.; Vidal, A. Estimating crop water deficit using the relationship between surface air temperature and spectral vegetation index. Remote Sens. Environ 1994, 46, 246–263. [Google Scholar]
  40. Fitzgerald, G.J.; Rodriguez, D.; Christenssen, L.K.; Belford, R.; Sadras, V.O.; Clarke, T.R. Spectral and thermal sensing for nitrogen and water status in rainfed and irrigated wheat environments. Prec. Agric 2006, 1, 1–16. [Google Scholar]
  41. Kostrzewski, M.; Waller, P.; Guertin, P.; Haberland, J.; Colaizzi, P.; Barnes, E.; Thompson, T.; Clarke, T.; Riley, E.; Choi, C. Ground-based remote sensing of water and nitrogen stress. Trans. ASAE 2003, 46, 29–38. [Google Scholar]
  42. El-Shikha, D.M.; Waller, P.; Hunsaker, D.; Clarke, T.; Barnes, E. Ground-based remote sensing for assessing water and nitrogen status of broccoli. Agric. Water Manag 2007, 92, 183–193. [Google Scholar]
  43. Arregui, L.M.; Quemada, M. Strategies to improve nitrogen-use efficiency in winter cereal crops under rainfed Mediterranean conditions. Agron. J 2008, 100, 277–284. [Google Scholar]
  44. Quemada, M.; Baranski, M.; de Lange, M.N.J.; Vallejo, A.; Cooper, J.M. Meta-analysis of strategies to control nitrate leaching in irrigated agricultural systems and their effects on crop yield. Agric. Ecosyst. Environ 2013, 174, 1–10. [Google Scholar]
  45. Jacquemoud, S.; Verhoef, W.; Baret, F.; Bacour, C.; Zarco-Tejada, P.J.; Asner, G.P.; François, C.; Ustin, S.L. PROSPECT + SAIL models: A review of use for vegetation characterization. Remote Sens. Environ 2009, 113, S56–S66. [Google Scholar]
  46. Martens, H.; Naes, T. Multivariate Calibration by Data Compression. In Near-Infrared Technology in Agriculture and Food Industries; Williams, N., Ed.; American Association of Cereal Chemists: St. Paul, MN, USA, 1987; pp. 57–87. [Google Scholar]
  47. Atzberger, C.; Guérif, M; Baret, F; Werner, W. Comparative analysis of three chemometric techniques for the spectroradiometric assessment of canopy chlorophyll content in winter wheat. Comput. Electron. Agric 2008, 73, 165–173. [Google Scholar]
Figure 1. The flight line acquired with the micro-hyperspectral imager over the study site (a); showing the field (b) and the pixels extracted from each treatment for the analysis (c).
Remotesensing 06 02940f1
Figure 2. Airborne hyperspectral spectra from N-stressed and well-fertilized healthy blocks showing differences in the visible and near-infrared regions due to chlorophyll content absorption and canopy scattering variations. Dashed lines are the 95% confidence intervals around the treatment average (continuous lines).
Remotesensing 06 02940f2
Figure 3. Relevant airborne indices at two different maize growth stages for the various N application treatments: the R750/R710 ratio obtained from the high-resolution hyperspectral imagery, solar-induced fluorescence (SIF760) and the temperature recorded with the thermal camera (Tc). Bars are the mean values for each treatment and error bars the standard error.
Remotesensing 06 02940f3
Figure 4. Linear correlations at flowering between selected airborne indices (R750/R710, R700/760 and TCARI/OSAVI ratios obtained from the high-resolution hyperspectral imagery) and ground-level indices (SPAD chlorophyll, flavonoids content (FLAV) and nitrogen balance index (NBI)).
Remotesensing 06 02940f4
Figure 5. Maize yield vs. crop N uptake (a) and N applied as a fertilizer (b). In plot (a), symbols represent single plot values; in plot (b), they represent the treatment mean, and the standard error is presented as error bars. A linear model adjusted to the observed data is represented in plot (a); a linear-linear plateau model is represented in plot (b).
Remotesensing 06 02940f5
Figure 6. Maize yield vs. the R750/R710 values (a) and vs. the Normalized Difference Vegetation Index (NDVI) (b) obtained from hyperspectral airborne images at flowering in maize plots with different N rates.
Remotesensing 06 02940f6
Figure 7. Maize yield observed versus the estimated yield based on a linear correlation of canopy temperature (Tc) and either R750/R710 (a) or SIF760 (b).
Remotesensing 06 02940f7
Figure 8. Error percentage of the various indices tested when distinguishing between N-sufficient and N-deficient plots at maize stem elongation and at flowering.
Remotesensing 06 02940f8
Table 1. Indices calculated from the ground-level sensors used in this study. Chl, chlorophyll; FLAV, flavonoid; NBI-G, Nitrogen Balance Index under green excitation; ANTH, Anthocyanin Content Index.
IndexDefinition
SPADSPAD-502®
Ratio of the transmitted light at the red and infrared wavelengths
Dualex® Scientific
ChlRatio of the transmitted light at two different infrared wavelengths
FLAVLog of the fluorescence emission ratio at the red and UV wavelengths
NBINitrogen Balance Index = Chl/FLAV
Multiplex®
SFR *Simple fluorescence emission ratio at the red and far-red wavelengths
NBI-G Nitrogen Balance Index: ratio between the far-red fluorescence under UV excitation (∼ Chl) and the red fluorescence (∼FLAV)
ANTHLog of the fluorescence emission ratio under red and green excitation
FERARITransformed single-fluorescence excitation anthocyanin relative index
*In our study, SFR indices under red or green excitation were highly correlated (r > 0.99); thus, we will refer to them as SFR without any reference to the excitation wavelength.
In our study, the NBI under red excitation was highly correlated with the NBI under green excitation (r > 0.97); thus, we will present only NBI results under green excitation (NBI-G).
Table 2. Airborne narrow-band hyperspectral optical indices used in this study. FLD, Fraunhofer Line Depth.
IndexEquation
Greenness indices

Normalized Difference Vegetation Index (NDVI)NDVI = (R800 − R670)/(R800 + R670)
Reformed Difference Vegetation Index (RDVI)RDVI = (R800 − R670)/(R800 + R670)°.5

Chlorophyll indices

Red edge optical reflectanceR750/R710
Red to near infrared optical reflectanceR700/R760
Transformed Chlorophyll Absorption in Reflectance Index (TCARI)TCARI = 3 [(R700 − R670) − 0.2 (R700 − R550)/(R700/R670)]
Optimized soil-adjusted vegetation index (OSAVI)OSAVI = (1 + 0.16) × (R800 − R670)/(R800 + R670 + 0.16)
Combined TCARI/OSAVITCARI/OSAVI

Xanthophyll indices

Photochemical Reflectance Index (PRI)PRI = (R570 − R539)/(R570 + R539)
Normalized Photochemical Reflectance Index (PRI norm)PRI norm = (R515 − R531)/(R515 + R531)

Blue/green/red ratio indices

BGI1BGI1 = R400/R550
BGI2BGI2 = R450/R550

Fluorescence retrieval

Fluorescence (SIF760)FLD3 method using 2 reference bands (750; 762; 780)
Table 3. Ground-level sensor indices obtained on two different sampling dates for the various N application treatments. Values expressed as the mean (standard error).
Treatment *SPAD®Dualex®Multiplex®
ChlFLAVNBISFRNBI-GANTHFERARI
First sampling date: stem elongation

045.3 (1.2)45.7 (1.1)1.40 (0.06)34.3 (2.2)6.7 (0.3)5.6 (0.4)0.507 (0.010)1.46 (0.02)
4047.3 (0.9)48.9 (1.0)1.39 (0.04)36.3 (1.4)7.1 (0.5)6.6 (0.5)0.494 (0.006)1.44 (0.02)
8046.6 (0.2)47.4 (0.6)1.29 (0.04)38.3 (1.4)6.0 (0.2)6.3 (0.5)0.486 (0.002)1.35 (0.05)
12049.8 (0.5)50.3 (0.5)1.34 (0.02)38.8 (0.6)7.4 (0.6)6.5 (0.4)0.507 (0.006)1.43 (0.06)
16049.5 (0.4)50.2 (1.1)1.25 (0.04)42.2 (0.3)6.0 (0.2)7.3 (0.5)0.498 (0.007)1.40 (0.04)
20048.0 (1.1)50.9 (0.5)1.19 (0.15)44.3 (5.4)6.3 (0.3)7.2 (1.7)0.478 (0.001)1.37 (0.04)

Second sampling date: flowering

038.9 (2.6)23.7 (1.8)1.02 (0.06)24.3 (2.6)3.7 (0.2)5.4 (0.5)0.489 (0.009)0.68 (0.02)
4044.7 (1.1)27.7 (1.4)1.00 (0.02)27.9 (1.7)4.3 (0.2)5.7 (0.3)0.473 (0.004)0.68 (0.02)
8045.3 (0.6)27.7 (0.7)0.94 (0.02)29.7 (0.9)4.2 (0.1)6.4 (0.1)0.471 (0.003)0.67 (0.02)
12046.9 (2.1)29.0 (1.8)0.90 (0.01)32.2 (1.6)4.3 (0.3)6.6 (0.2)0.471 (0.007)0.68 (0.03)
16046.6 (2.2)29.0 (2.7)0.92 (0.01)31.4 (2.7)4.4 (0.3)7.0 (0.2)0.464 (0.005)0.70 (0.03)
20049.1 (0.3)30.1 (0.1)0.89 (0.04)34.0 (1.4)4.4 (0.2)7.1 (0.4)0.464 (0.002)0.68 (0.02)
*Treatments are referred to as kg·N·ha−1 applied as fertilizer.
Table 4. Pearson correlation coefficients obtained for the linear correlations between optical indices and between optical indices and crop parameters at maize stem elongation.
SPADChlFLAVNBISFRNBI-GANTHFERARINDVIRDVIR750/R710R700/R760TCARITCARI/OSAVIPRIPRI normBGI 1BGI 2SIF 760
Chl0.90 *
FLAV−0.27−0.40
NBI0.580.73−0.90 *
SFR0.410.390.140.09
NBI-G0.440.52−0.680.760.5
ANTH−0.25−0.280.57−0.530.34−0.35
FERARI0.310.190.36−0.190.60.060.17

NDVI0.340.280.2−0.010.480.090.070.67
RDVI0.330.270.22−0.030.470.070.090.660.99 *
R750/R7100.480.450.010.20.520.230.050.60.95 *0.95 *
R700/R7600.140.050.42−0.280.44−0.110.240.750.92 *0.91 *0.8
TCARI−0.11−0.230.61−0.530.25−0.320.250.660.740.750.540.91 *
TCARI/ OSAVI−0.42−0.530.72−0.740.02−0.510.290.460.330.350.080.630.88
PRI−0.34−0.29−0.180.01−0.43−0.06−0.04−0.64−0.96 *−0.96 *−0.95 *−0.89−0.69−0.28
PRI norm−0.27−0.20−0.270.1−0.41−0.01−0.04−0.66−0.99 *−0.99 *−0.92*−0.92*−0.78−0.410.97
BGI10.490.65−0.760.8200.54−0.46−0.210.050.010.24−0.28−0.56−0.80−0.080.01
BGI2−0.040.06−0.510.39−0.420.2−0.32−0.74−0.83−0.83−0.67−0.96*−0.95*−0.740.760.830.44
SIF7600.390.47−0.050.250.430.21−0.450.350.750.840.840.570.390.02−0.72−0.700.23−0.471

Yield0.480.44−0.100.22−0.07−0.100.040.120.460.470.560.330.14−0.17−0.48−0.410.23−0.250.59
Biomass0.430.38−0.180.26−0.09−0.04−0.080.070.430.440.510.280.1−0.20−0.43−0.380.27−0.210.49
Grain N0.490.42−0.020.15−0.04−0.120.040.190.50.520.570.420.24−0.05−0.54−0.30−0.30−0.310.57
N uptake0.50.47−0.180.3−0.09−0.03−0.01−0.010.370.380.480.20−0.29−0.38−0.310.3−0.120.15
Correlations obtained with p < 0.05 or better between different functional groups of the indices are shaded and marked as
*when p < 0.01.
Table 5. Pearson correlation coefficients obtained for linear correlations between optical indices and between optical indices and crop parameters at maize flowering.
SPADChlFLAVNBISFRNBI-GANTHFERARINDVIRDVIR750/R710R700/R760TCARITCARI/OSAVIPRIPRI normBGI1BGI2SIF 760
Chl0.91 *
FLAV−0.37−0.28
NBI0.890.93−0.60
SFR0.880.88−0.050.73
NBI-G0.740.69−0.810.870.53
ANTH−0.87−0.830.41−0.81−0.88−0.76
FERARI0.250.240.510.020.58−0.09−0.36

NDVI0.780.770.230.560.860.24−0.630.58
RDVI0.650.630.360.390.80.14−0.560.750.93 *
R750/R7100.94 *0.90 *−0.180.80.94 *0.61−0.870.450.890.79
R700/R760−0.32−0.230.92 *−0.50−0.09−0.770.490.40.290.39−0.15
TCARI−0.64−0.580.84−0.76−0.42−0.830.70.29−0.140.09−0.530.87
TCARI/OSAVI−0.79−0.720.74−0.84−0.60−0.850.820.12−0.36−0.15−0.710.770.97 *
PRI−0.83−0.840.06−0.70−0.85−0.430.69−0.31−0.86−0.73−0.89−0.020.40.57
PRI norm−0.71−0.73−0.27−0.50−0.82−0.180.55−0.52−0.95 *−0.90 *−0.82−0.350.050.260.92 *
BGI10.660.61−0.660.730.520.72−0.69−0.170.290.030.62−0.70−0.94 *−0.94 *−0.54−0.22
BGI20.460.39−0.90 *0.630.250.82−0.60−0.35−0.10−0.260.33−0.97 *−0.95 *−0.88−0.180.170.85
SIF7600.650.550.10.410.780.35−0.650.740.880.950.770.12−0.07−0.26−0.71−0.820.17−0.021

Yield0.670.62−0.060.540.550.38−0.450.260.610.570.67−0.04−0.29−0.42−0.55−0.520.330.160.58
Biomass0.650.56−0.050.490.520.34−0.420.260.60.560.63−0.04−0.27−0.40−0.53−0.510.30.150.49
Grain N0.640.5900.490.550.3−0.430.310.640.610.660.03−0.23−0.37−0.56−0.12−0.18−0.220.57
N uptake0.650.57−0.170.550.470.42−0.420.150.530.470.61−0.14−0.35−0.46−0.47−0.410.340.24−0.07
Correlations obtained with p < 0.05 or better between different functional groups of the indices are shaded and marked as
*when p < 0.01.

