Article

Detection of Alteration Induced by Onshore Gas Seeps from ASTER and WorldView-2 Data

1
Faculty of Geo-information science and earth Observation (ITC), University of Twente, P.O. Box 6, Enschede 7500 AA, The Netherlands
2
Imperial College London, Silwood Park Campus, Bukhurst Road, Ascot SL5 7PY, Berks, UK
*
Author to whom correspondence should be addressed.
Remote Sens. 2014, 6(4), 3188-3209; https://doi.org/10.3390/rs6043188
Submission received: 3 December 2013 / Revised: 26 March 2014 / Accepted: 27 March 2014 / Published: 10 April 2014

Abstract

:
Hydrocarbon seeps cause chemical and mineralogical changes at the surface, which can be detected by remote sensing. This paper aims at the detection of mineral alteration induced by gas seeps in a marly limestone formation, SW Iran. For this purpose, the multispectral Advance Spaceborne Thermal Emission and Reflection Radiometer (ASTER) and the high spatial resolution WorldView-2 (WV-2) data were utilized for mapping surficial rock alteration. In addition, the potential of Visible Near Infrared (VNIR) bands of the WV-2 and its high spatial resolution for mapping alterations was determined. Band ratioing, principal component analysis (PCA), data fusion and the boosted regression trees (BRT) were applied to enhance and classify the altered and unaltered marly limestone formation. The alteration zones were identified and mapped by remote sensing analyses. Integrating the WV-2 into the ASTER data improved the spatial accuracy of the BRT classifications. The results showed that the BRT classification of the multiple band imagery (created from ASTER and WV-2) using regions of interest (ROIs) around field data provides the best discrimination between altered and unaltered areas. It is suggested that the WV-2 dataset can provide a potential tool along higher spectral resolution data for mapping alteration minerals related to hydrocarbon seeps in arid and semi-arid areas.

1. Introduction

Hydrocarbon seep-induced alteration has been spectrally studied by different researchers around the world because of its potential value for petroleum exploration [17]. Hydrocarbon seepage can affect the Eh/pH of the surrounding geology, leading to mineral alteration effects, such as the loss of ferric oxy-hydroxides (hematite and goethite) and the formation of ferrous-bearing minerals (e.g., magnetite and pyrite), clays and carbonates [8]. The surface information obtained by remote sensing has limitations for understanding the subsurface nature of a petroleum system; however, it is cost effective and could increase the probability of success in exploration [1].
The Advanced Spaceborne Thermal Emission and Reflection Radiometer (ASTER) records solar radiation in 14 spectral bands and has provided geologists with a useful sensor in space [9]. ASTER data have been successfully used for lithological mapping [10,11] and for mineral mapping to aid in exploration [1216]. In the Visible Near Infrared (VNIR) and Short Wave Infrared (SWIR) bands, iron bearing minerals, carbonates, hydrate and hydroxide minerals, such as gypsum and clays, display molecular absorption features related to their overtones and combination tones [17]. Those minerals are some of the most common alteration related minerals induced by hydrocarbon seeps [8].
ASTER data have been successfully applied to mapping such alterations by Petrovic et al. [2], Lammoglia et al. [18,19] and Shi et al. [4]. Although those alterations can be mapped with ASTER data, the spatial scale of alteration zones in some basins is smaller than the spatial resolution of ASTER data (less than 30 m of the SWIR bands). High spatial resolution imagery, such as IKONOS, QuickBird and the relatively new WorldView2 (WV-2), provides the opportunity to map mineral variation at small scales.
The WV-2 data have eight spectral bands in the VNIR with 2-m resolution and one panchromatic band with 0.5-m resolution. This new dataset has not yet been applied for lithological and/or mineralogical mapping. With eight bands in VNIR wavelength ranges, the WV-2 can provide important information about transition elements, especially iron, and about elemental sulphur. The use of WV-2 imagery poses a new challenge in minerals mapping, because some minerals, such as carbonates, hydroxides, such as gypsum, and some clays do not exhibit diagnostic spectral responses in VNIR wavelength ranges. However, WV-2 data have the potential to allow the detection of the bleaching effect of hydrocarbon seeps in sediments.
Although spectral resolution is the main support in image classification of surface materials, spatial resolution is the main factor for the provision of the spatial context of target minerals identified with image classification techniques. In areas with spare ground data, it is difficult to assess the spatial correspondence of minerals identified from imagery with field measurements, because these measurements may only cover a few pixels of the moderate spatial resolution imagery, such as ASTER. One approach in image classification is integrating high spectral resolution data with high spatial resolution data to solve the challenging task of detailed mineral mapping using both datasets. The integration of ASTER and WV-2 data for mineral classification would allow us to determine if the addition of the high spatial resolution of WV-2 and its multispectral bands in VNIR will improve the classification of target minerals.
This study examines the potential of high spatial resolution WV-2 satellite imagery and relatively high spectral resolution ASTER in the SWIR region for identifying gas-induced alteration in the Dezful Embayment, SW Iran (Figure 1). There are many locations in the Dezful Embayment where escaped hydrocarbons from the subsurface reservoirs induced alterations mostly in evaporites and marly limestones [20]. An area of the marly limestones affected by the gas seep has been chosen for this study. The studied area is located in an arid environment and without vegetation cover.
For this study, ASTER data was first used to map alteration related minerals, such as gypsum, and non-alteration minerals, such as clay and calcite; then, the potential of WV-2 imagery for highlighting the bleaching effect of the gas seep was assessed. In addition, the effect of combining the data of the two sensors on improving the classification of target minerals was investigated. The prime objectives of this study are: (1) to map gas-induced alterations in marly limestones by ASTER and WV-2; and (2) to explore the potential of using high spatial resolution WV-2 imagery for enhancing alteration zones and improving the spatial accuracy of alteration mapping. The latter focuses on integrating the WV-2 VNIR bands into the ASTER VNIR-SWIR bands to discriminate alteration zones from unaltered areas.

2. Geological Setting and Alteration-Related Minerals

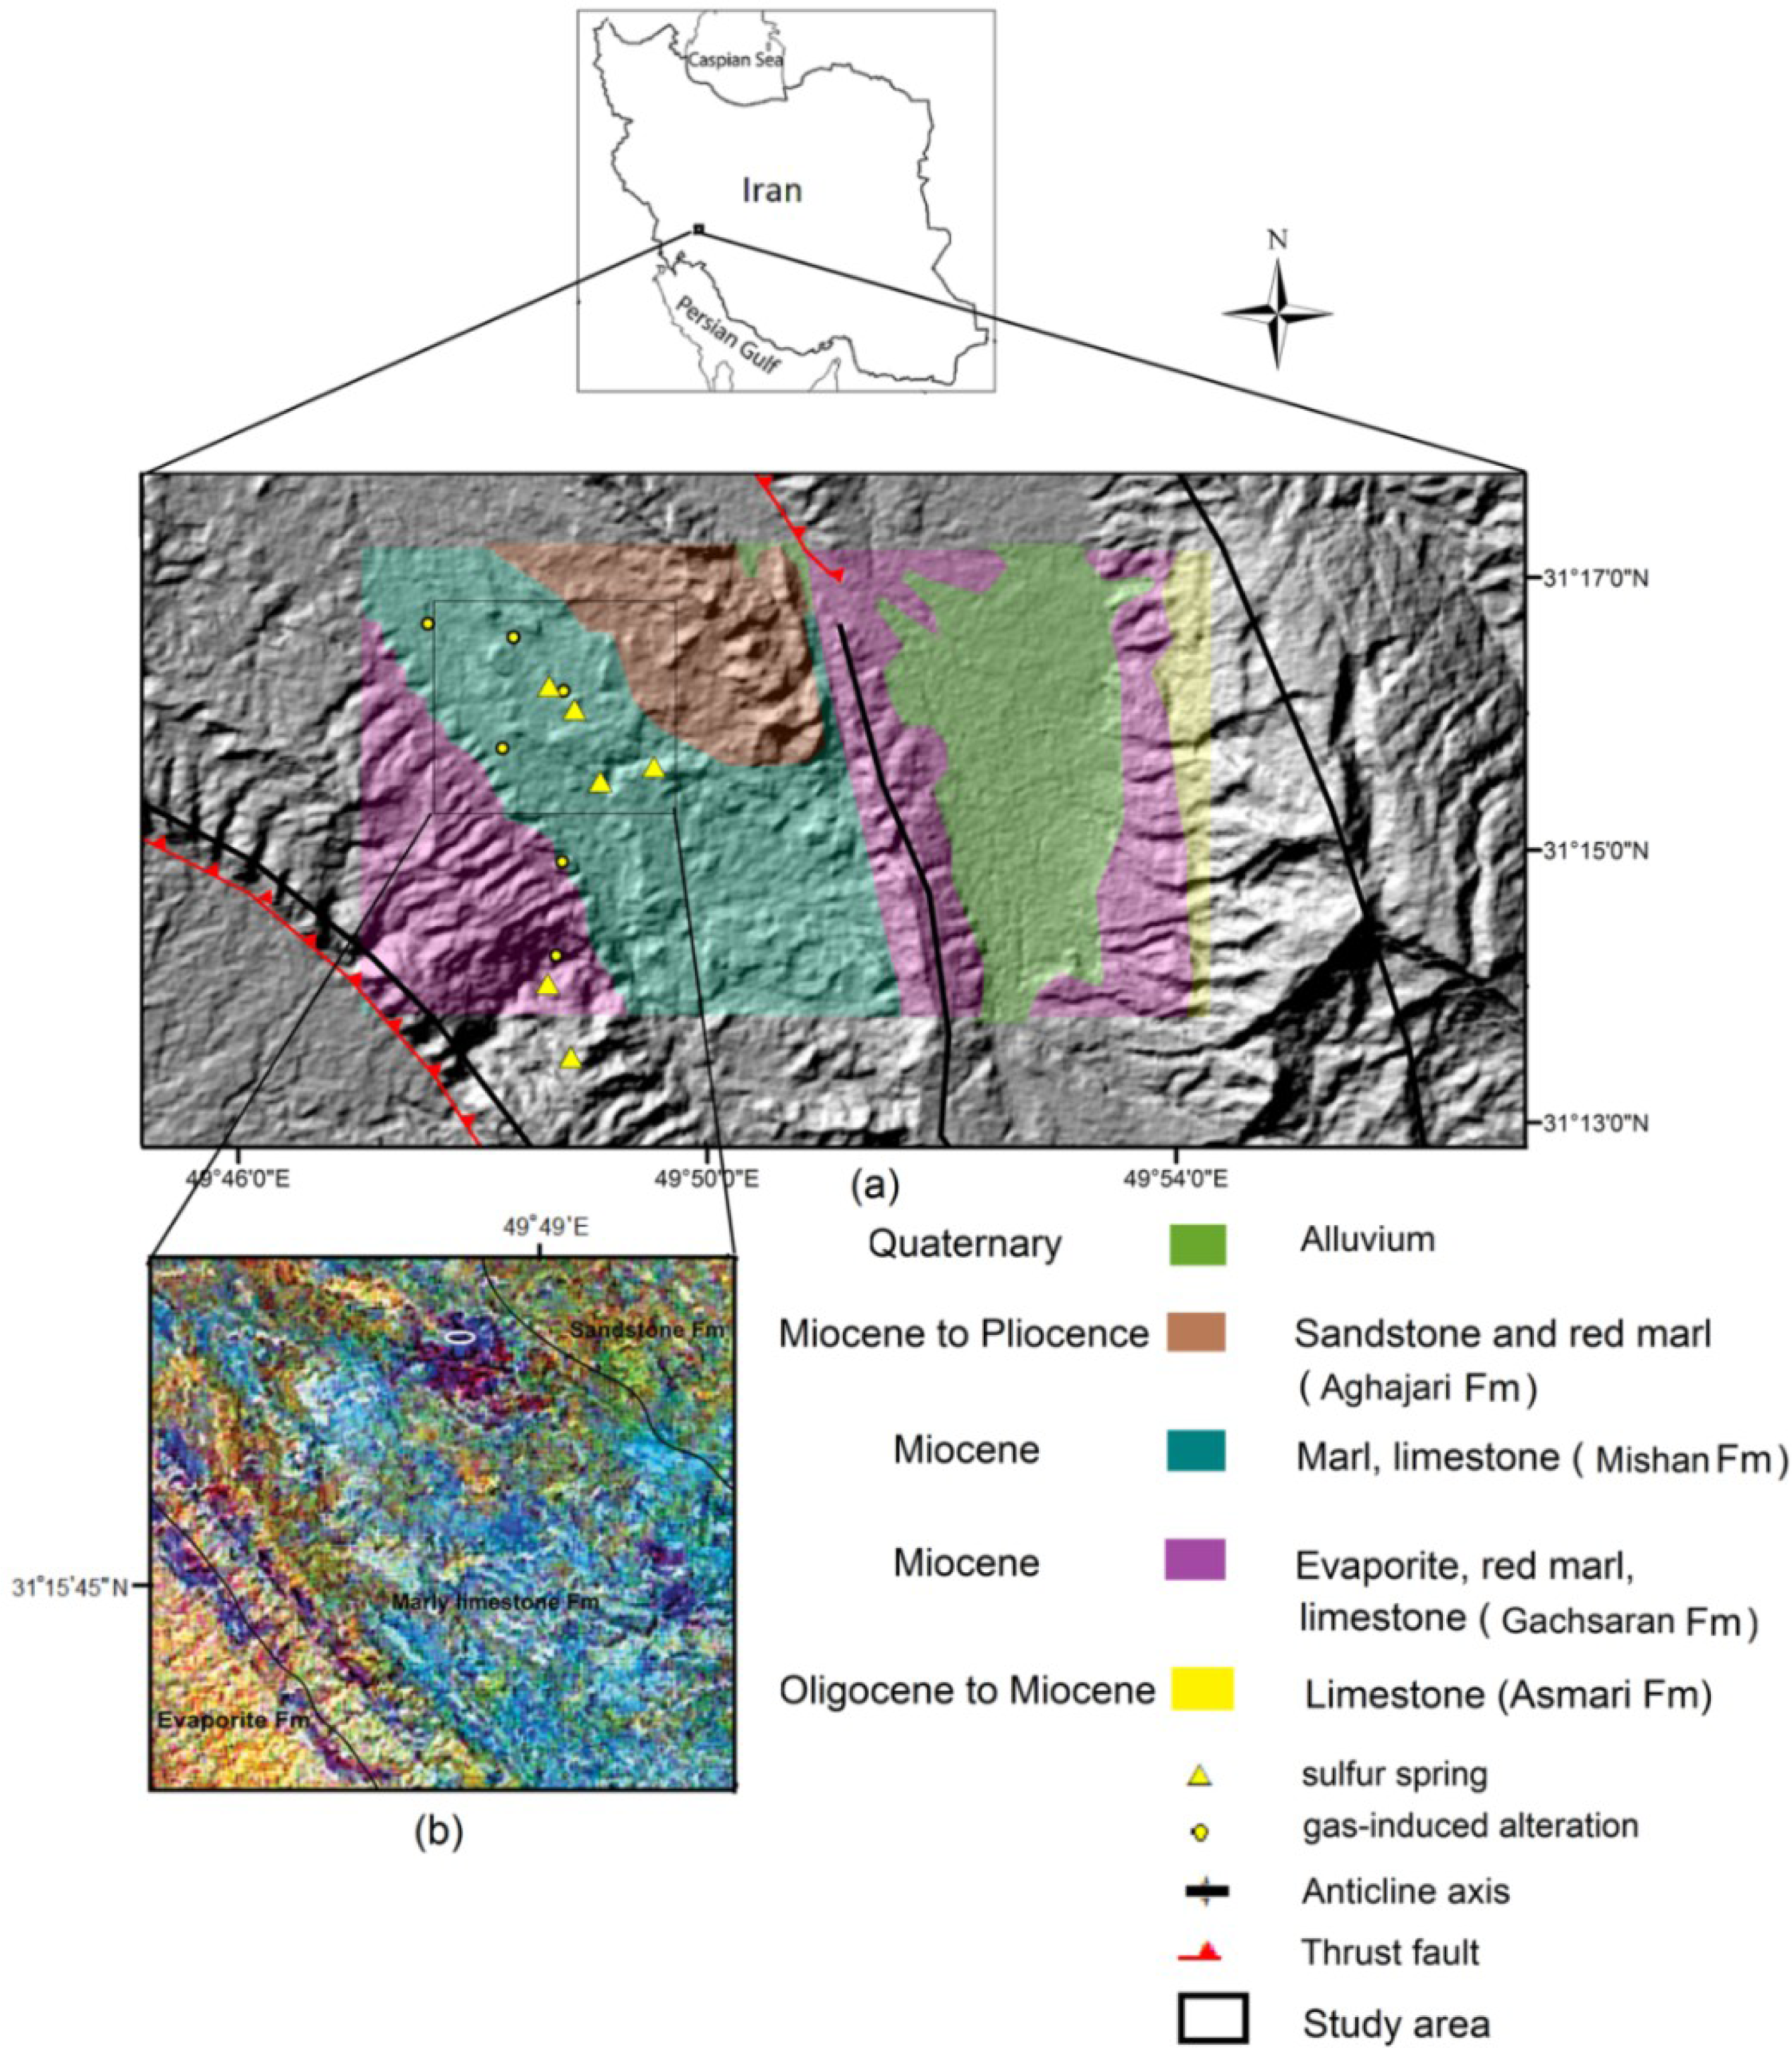
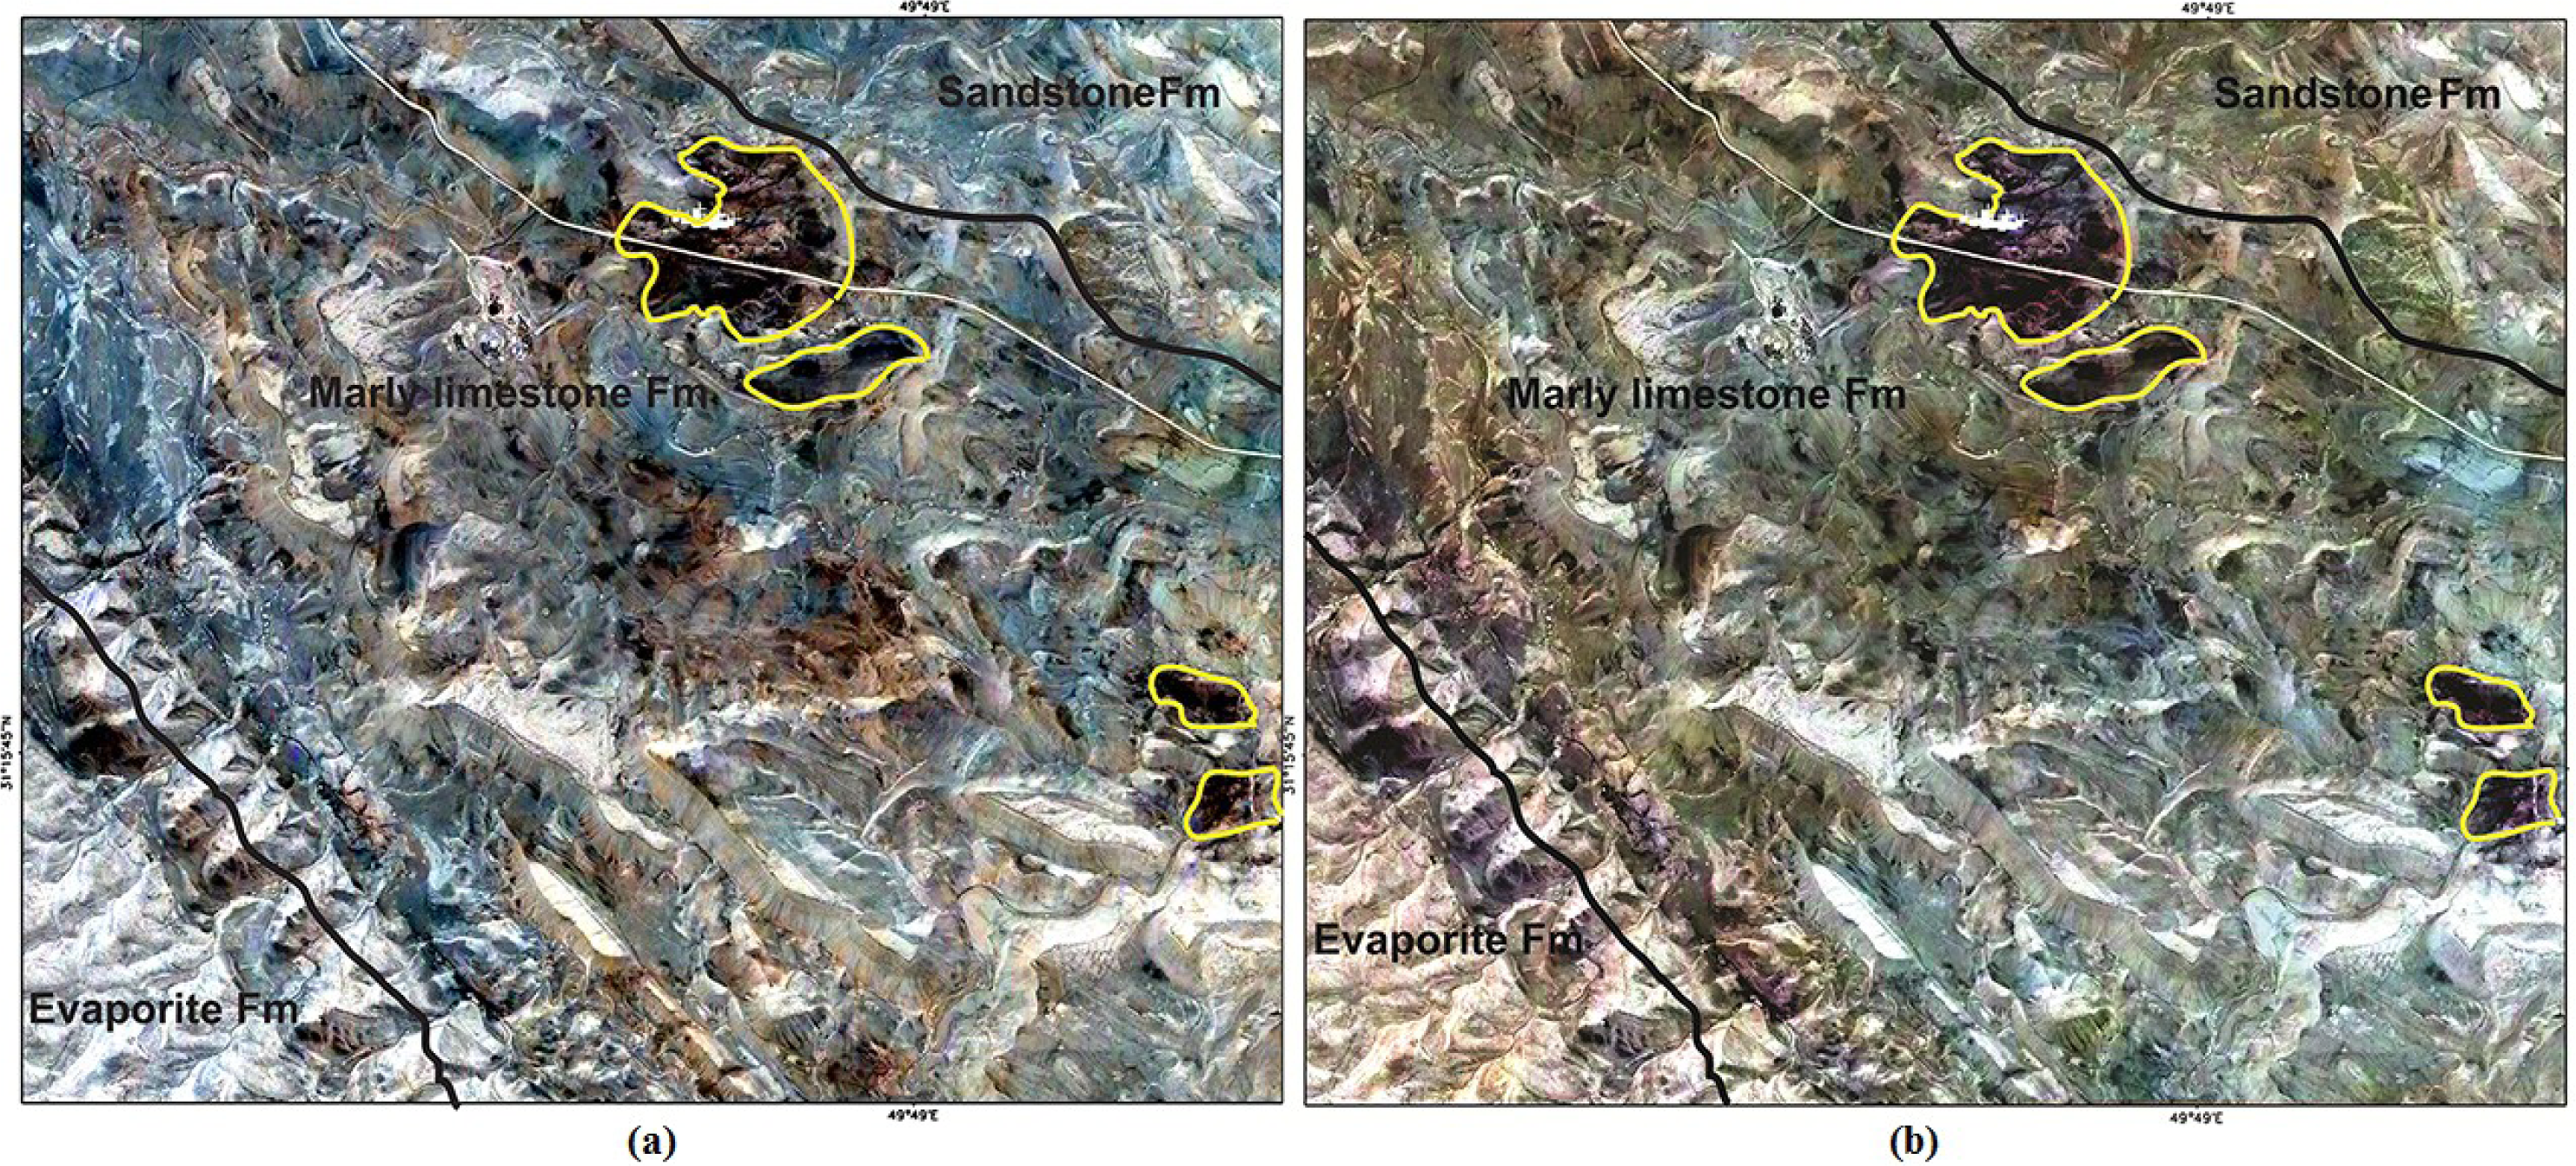
2.1. Geological Setting

The study area is situated north of the Dezful Embayment, SW Iran. The Dezful Embayment hosts most of the onshore petroleum reservoirs in Iran (Figure 1). This Cretaceous to Early Miocene shallow petroleum system comprises two different source rocks, including the Kazhdumi (shale and limestone) and the Pabdeh (shale, marl and limestone) Formations, two reservoirs, including the Asmari and the Sarvak Formation, and two seals, including the Gachsaran and the Gurpi Formations. The Asmari limestone reservoir is sealed by the Gachsaran Formation. The Gachsaran cap rock predominantly consists of evaporites, with additional marl and thin limestone, and it underlies the Mishan Formation (Figure 1) [21]. The area is an arid region without any vegetation cover.

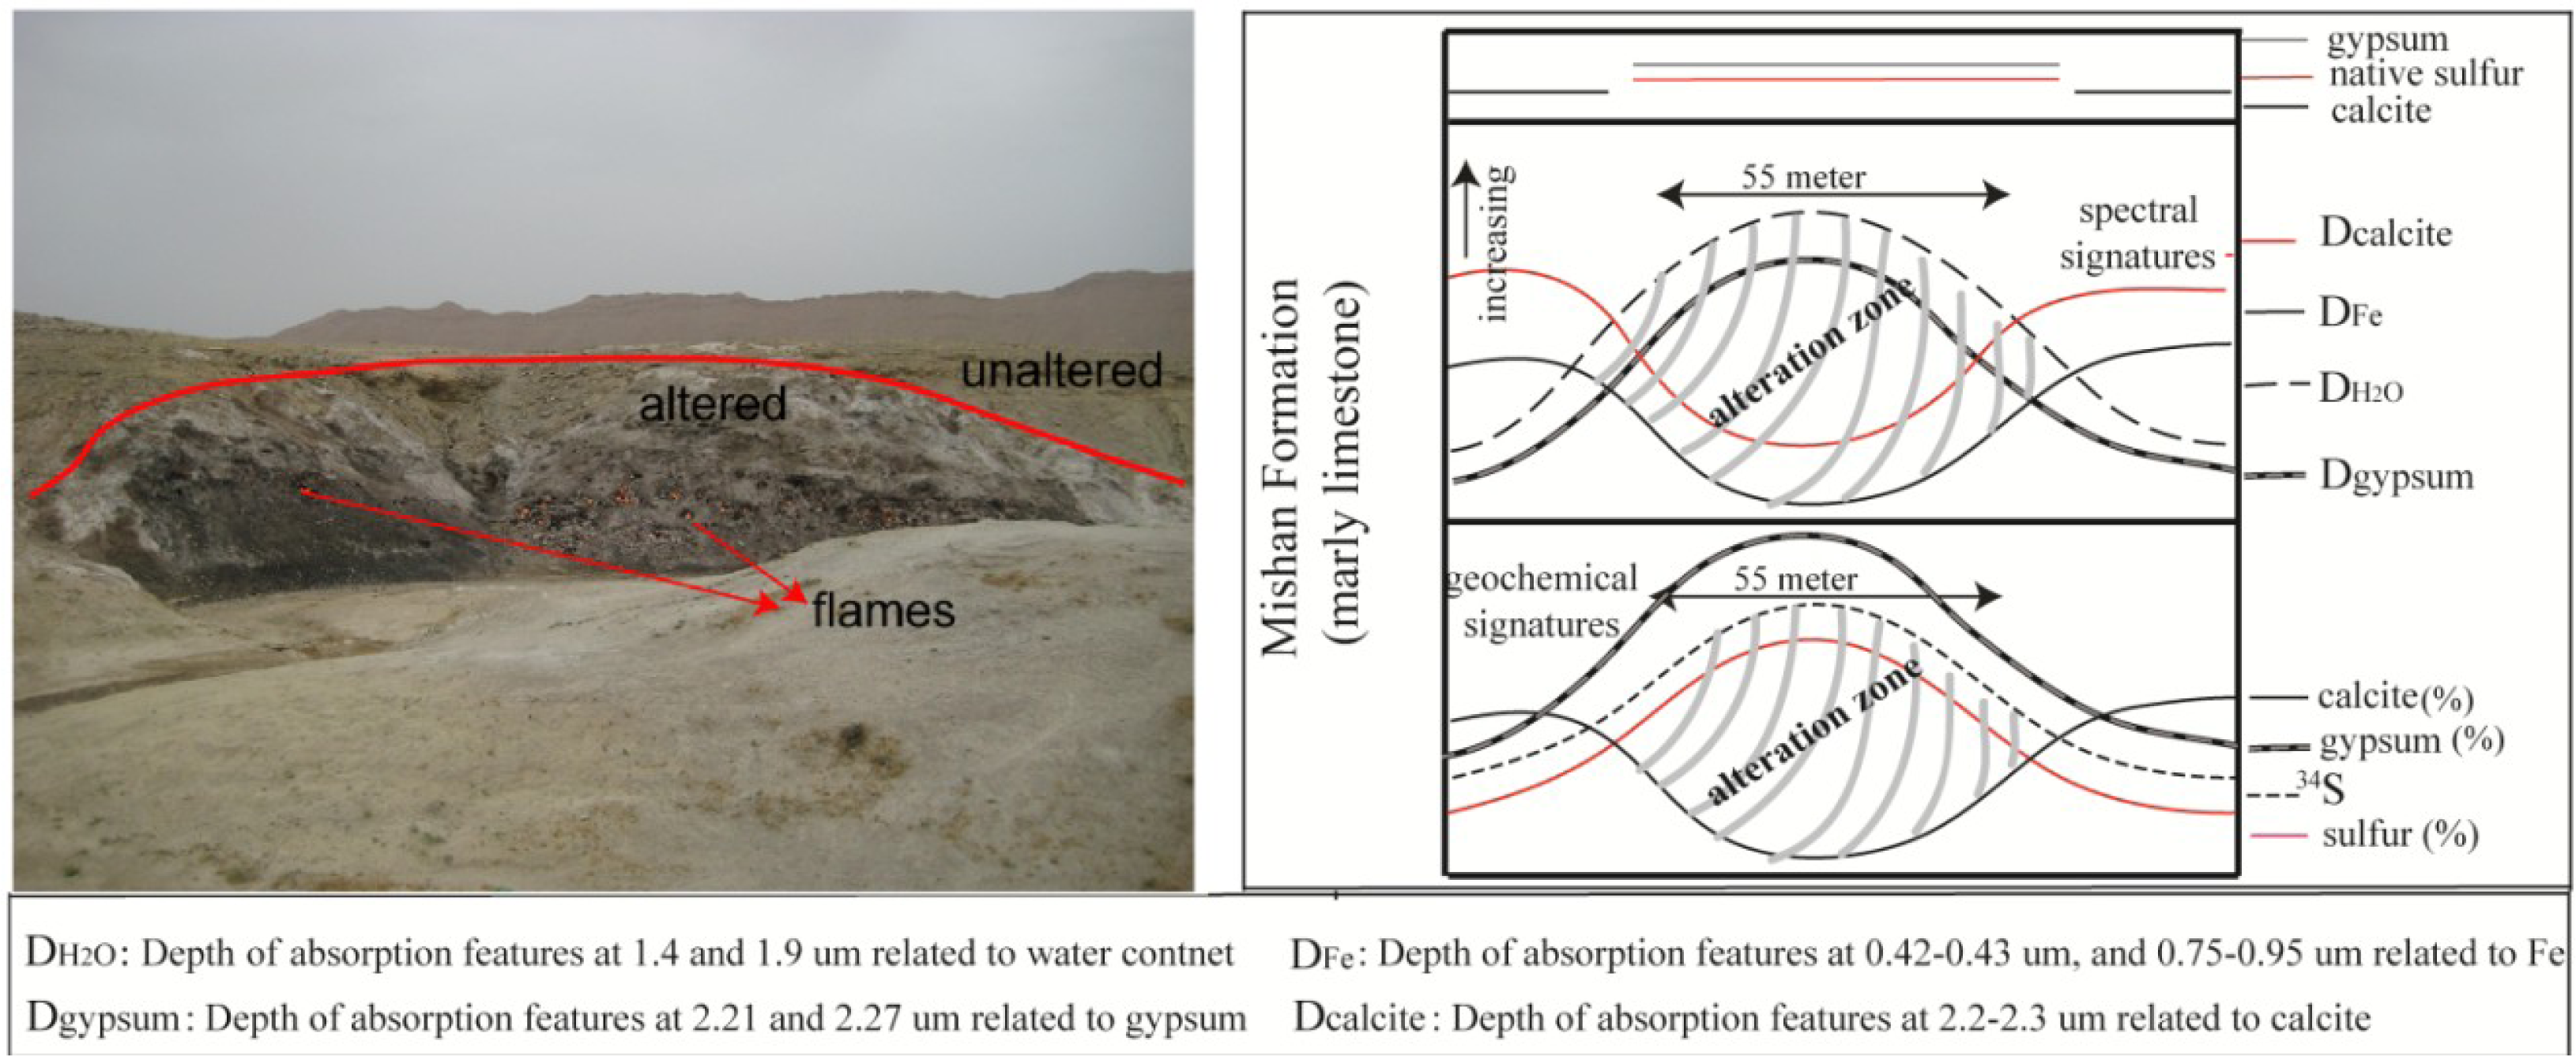
2.2. Hydrocarbon Seeps-Related Alteration Model in the Mishan Marly Limestone

Onshore hydrocarbon seep-induced alterations in the Zagros belt are poorly studied. Thomas [22] used the term Gach-e-tursh for one of the products of the alterations induced by hydrocarbon seep in the Zagros. In the Persian language, Gach means chalk and tursh means sour. Thomas [22] mentioned that the Gach-e-tursh represents an association of oxidizing petroleum seep, gypsum, jarosite, sulphuric acid and sulphur. Salati et al. [23] proposed generalized models of spectral and geochemical alterations in the Dezful Embayment. In this petroleum basin, hydrocarbon seeps and their associated alterations are spatially associated with the Gachsaran cap rock and the Mishan Formation [20]. In the present study, an area within the Mishan Formation (the Mamatin area) that was affected by macro gas seeps was chosen to be investigated by multispectral ASTER and WV-2 remote sensing. The alteration zone studied by Salati et al. [23] covers an area of about 55 m × 20 m within the marly limestone formation (Figure 2). Within this formation, gas-induced alterations have distinctive spectral and geochemical signatures [23]. The reaction between H2S and calcite lead to the precipitation of gypsum and native sulphur. The H2S originates from bacterial reductions of sulphate minerals in the Gachsaran cap rock underlying the Mishan Formation. Gas-induced alterations were spectrally characterized by the presence of gypsum, while unaltered marly limestones showed spectra that are typical of calcite [23].
Unaltered samples were spectrally characterized by: (a) the presence of absorption features near 2.35 μm, diagnostic of calcite; (b) the presence of absorption features near 0.4–0.45 and 0.8–0.9 μm, indicative of iron bearing minerals; and (c) the presence of absorption features at 2.2 μm and between 2.34 and 2.44 μm, indicating the presence of Al-OH containing clays. Altered samples were spectrally characterized by: (a) a sharp decrease in the reflectance gradient between the visible red and the visible green-blue, due to bleaching effects; (b) the presence of absorption features at around 1, 1.4, 1.75, 1.9, 2.215, and 2.27 μm, diagnostic of gypsum; (c) the absence of absorption features near 2.35 μm, typical of calcite, which is the dominant absorption feature in unaltered rocks; and (d) a decrease in the absorption intensities of iron bearing mineral absorption features at around 0.4–0.45 and 0.8–0.9 μm [23].

3. Remote Sensing Data

3.1. ASTER Data

ASTER measures radiation in three bands from 0.52 to 0.86 μm (VNIR) and in six bands between 1.6 and 2.43 μm with 15-m and 30-m resolution, respectively. In addition, ASTER has a back-looking VNIR telescope with 15-m resolution and five thermal bands measured at 90-m resolution in 8.125–11.65 μm [24]. Unaltered marly limestone and altered rocks composed of gypsum can be discriminated and mapped in the SWIR in the range of 1.6 to 2.43 μm. The three VNIR bands provide information about the presence of iron-bearing minerals. A cloud-free ASTER image in Level 1B (radiance at sensor) acquired on 4 July 2004, was obtained for the study area. The Level 1B ASTER data were geometrically and radiometrically corrected and converted to radiance at the sensor using the radiometric coefficients of the sensor.

3.2. WorldView-2 Data

WorldView-2 (WV-2) (DigitalGlobe) data has a high spatial resolution and offers 8 multispectral bands (MS) along with a panchromatic (PAN) band. The satellite launched in October 2009, records images at a spatial resolution of 0.5 m in the PAN band and 2 m in the MS bands. The MS bands include: coastal blue (400–450 nm; Band 1), blue (450–510 nm; Band 2), green (510–580 nm; Band 3), yellow (585–625 nm; Band 4), red (630–690 nm; Band 5), red edge (705–745 nm; Band 6), NIR1 (770–895 nm; Band 7), and NIR2 (860–1040 nm; Band 8). The PAN band records radiation between 450 nm and 800 nm [25]. The orthorectified WV-2 satellite imagery was acquired on 24 August 2011, for the study area.

4. Methods

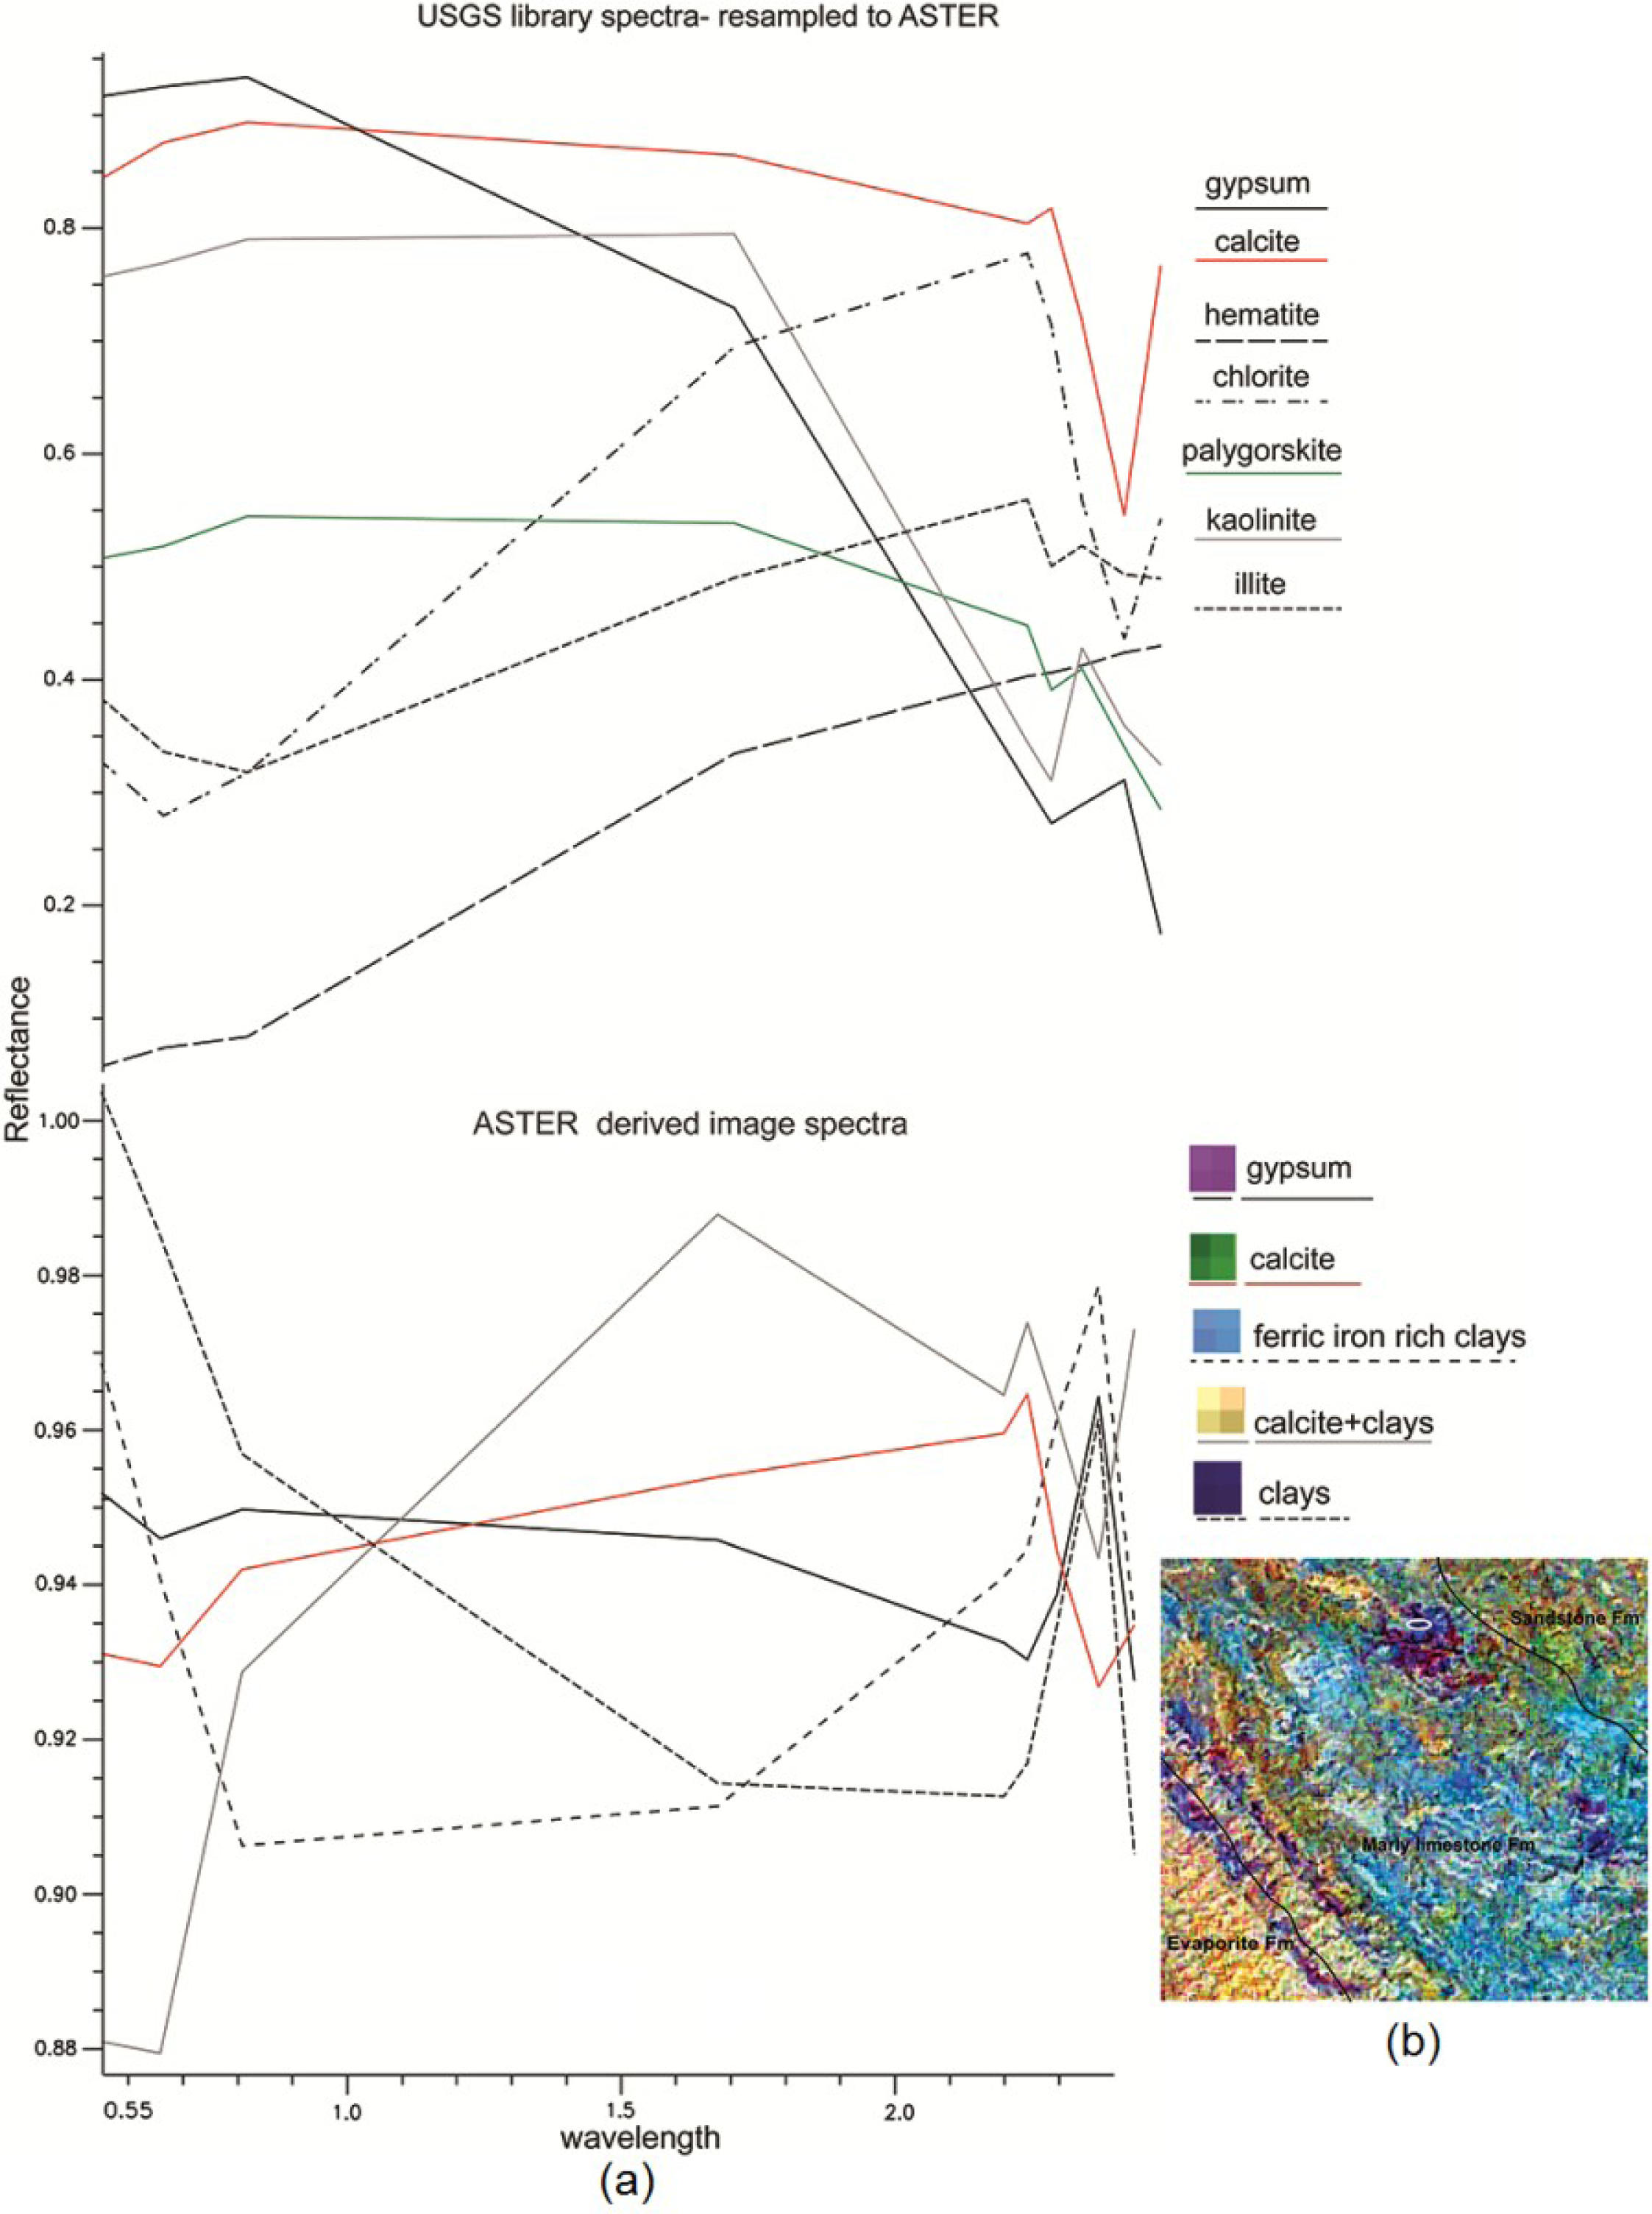
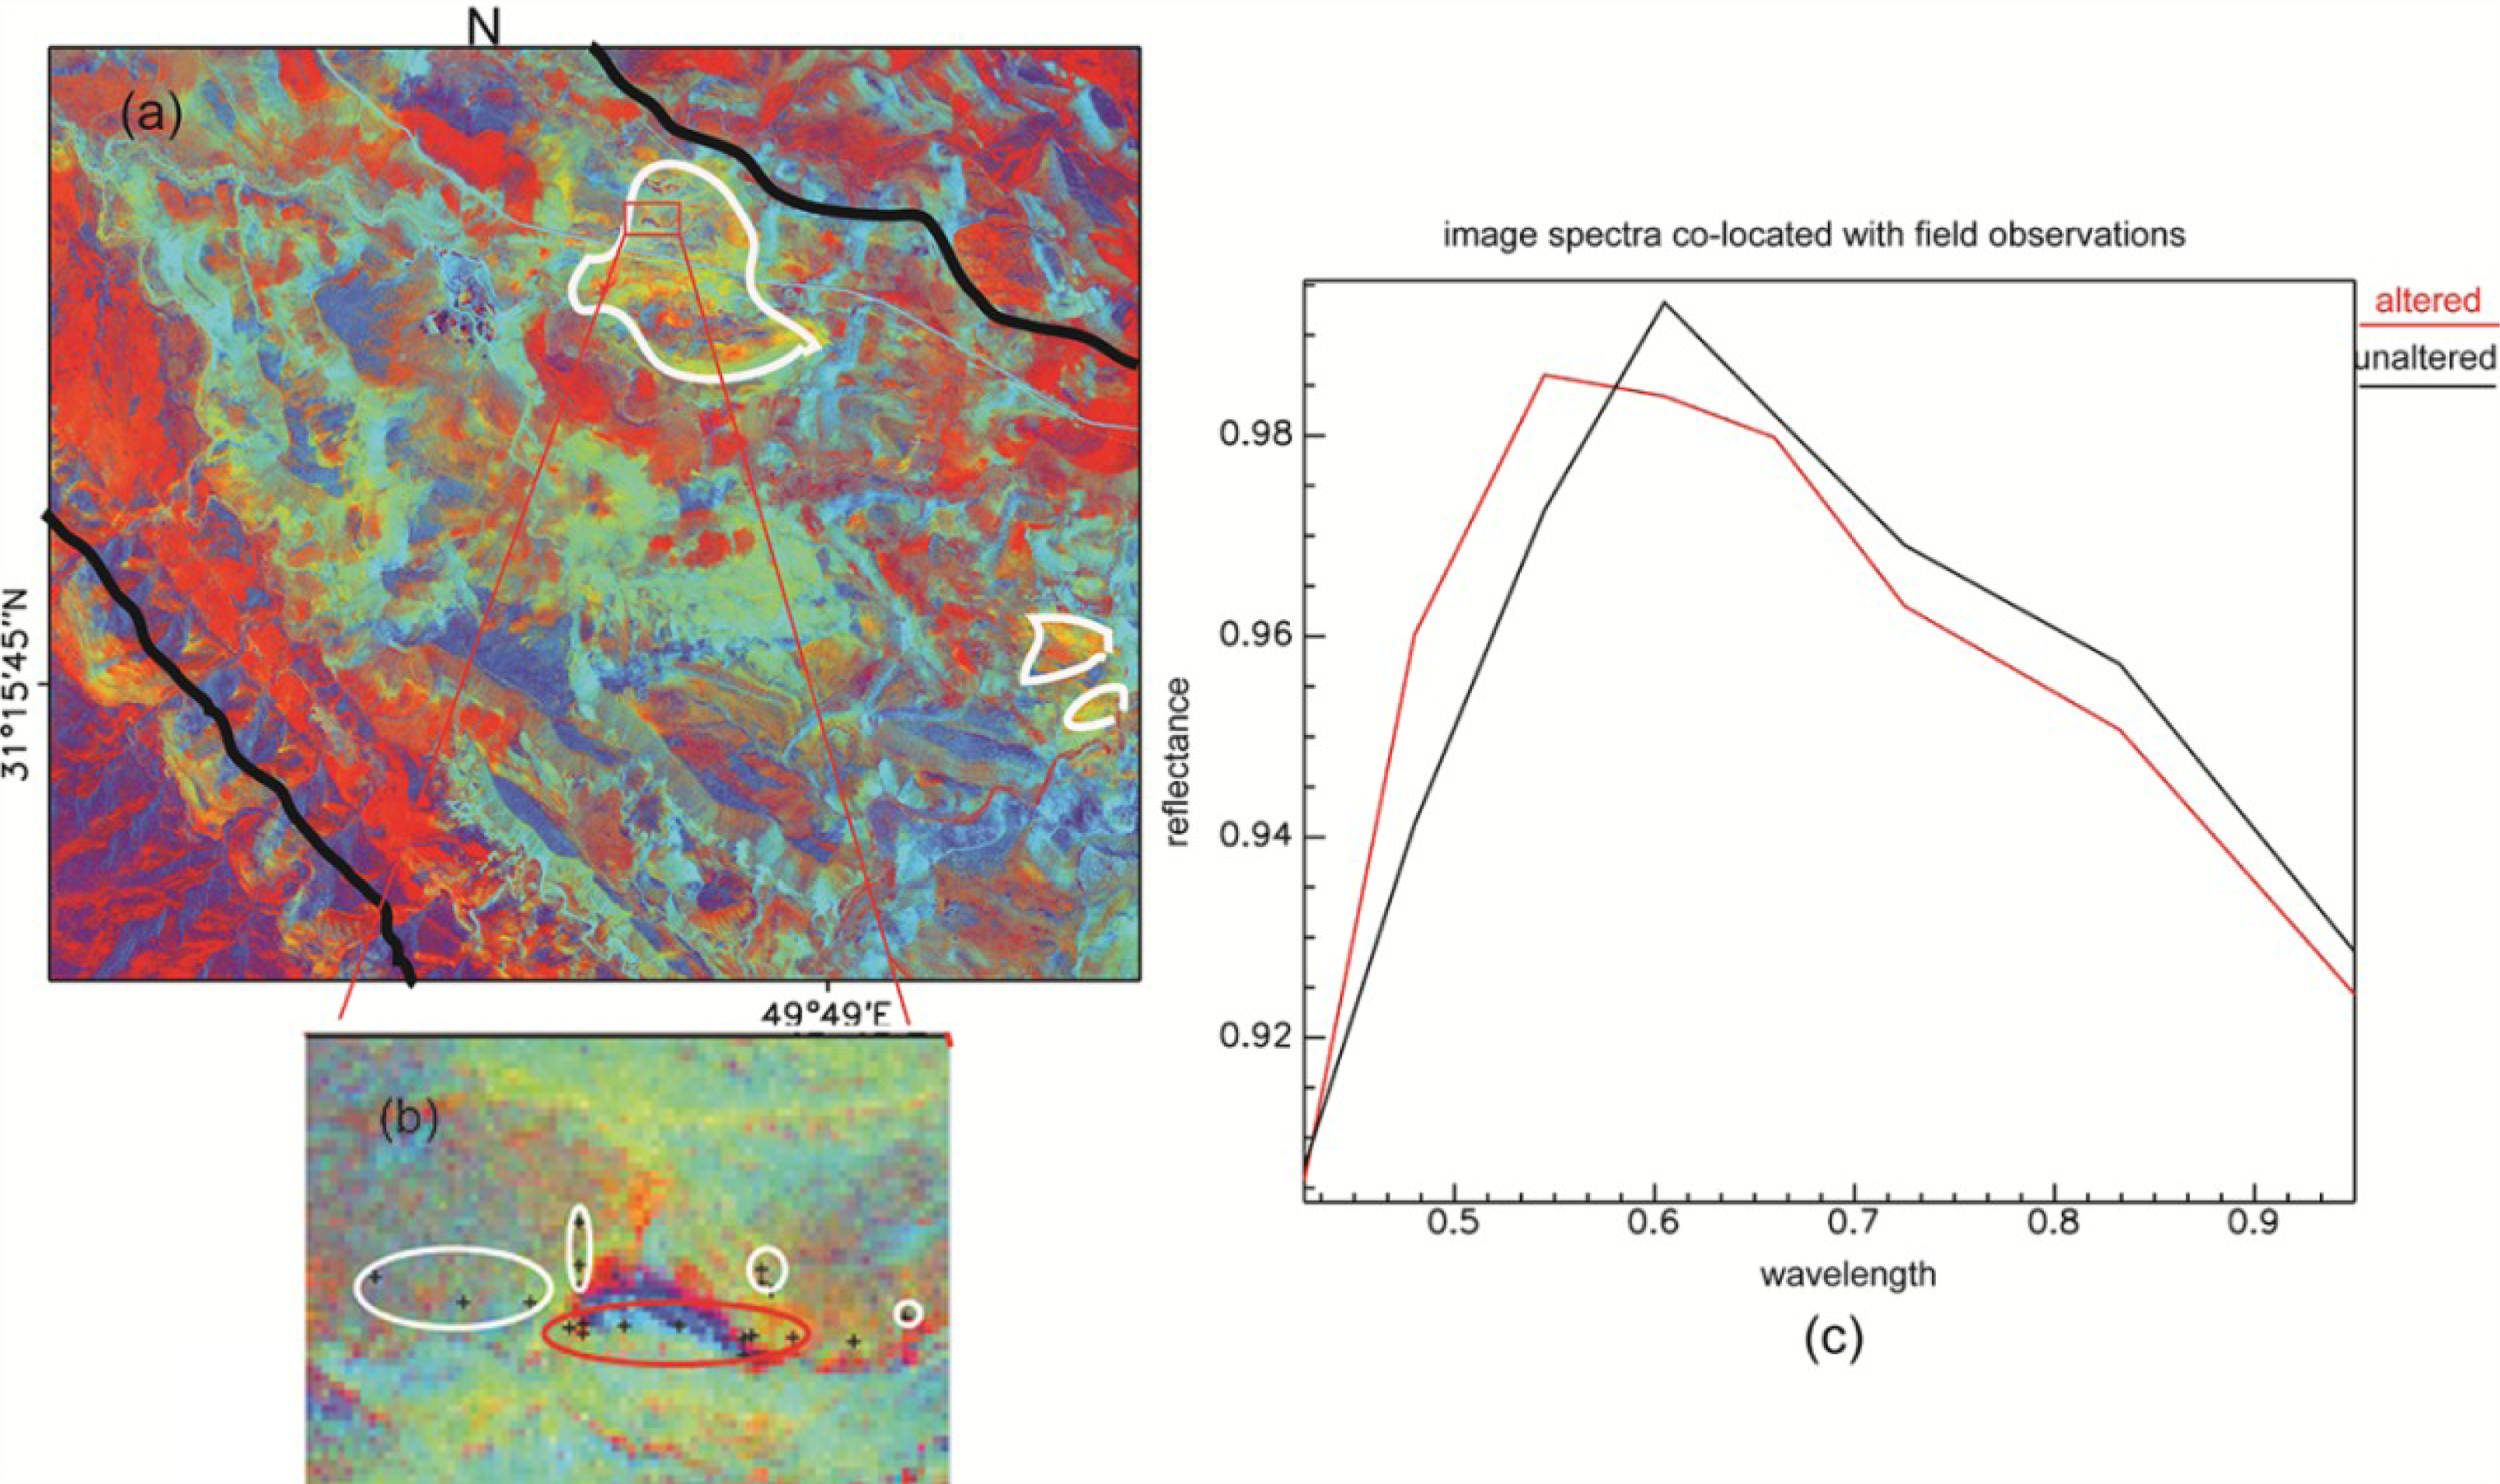
4.1. Spectral Measurements

Field samples were collected from the alteration zone and the surrounding unaltered rock, previously described by [23]. Reflectance spectra from rock samples were measured in the laboratory using an ASD FieldSpec with a 450- to 2500-nm wavelength range at 3–10-nm resolution and a contact probe as the fore-optic. Raw spectra were corrected using the ViewSpecPro (splice correction) and then converted to an ASCII format file to create a spectral library using Environment for Visualization Image (ENVI) software. The spectral reflectance of altered and unaltered samples taken from the field was resampled to the ASTER scene, and the spectral reflectance curves of the ASTER pixels co-located with sampling points were derived and compared with laboratory data.

4.2. ASTER Data Processing

The 30-m SWIR bands (cross-talk corrected) and 15-m VNIR data were corrected for atmospheric effects on surface reflectance using the Log Residuals Method [26], and then, the SWIR bands were resampled to the VNIR data. The VNIR-SWIR ASTER bands were processed using three steps. The spectral characteristics of altered and unaltered rocks were first analysed to identify minerals from the ASTER imagery and to compare ASTER image spectra with ASD spectral reflectance. A false colour composite of relative absorption-band depth (RBD) [27] and ratio images were used to select spectral categories of gas-induced alterations and unaltered rocks. RBD images are used for highlighting CO3, Al-O-H, Mg-O-H and SO4 absorption intensities prior to spectral analysis [10]. Table 1 shows ASTER band ratios used for enhancing mineral features in the study area.
With digital image classification, image pixels are assigned to classes based on similarities between the spectral signatures of each image pixel and the spectral signatures of end-members. Reference spectra were extracted from spectral measurements of field samples (resampled to the ASTER) and from ASTER image pixels. The known alteration zone (55 m) covers 3–4 ASTER pixels (with 30-m resolution); therefore, pure image pixels having similar spectral characteristics with pixels co-located with the target alteration zone were selected to derive end-members.
To enhance the visualization of the spectral features of minerals, ASTER bands were pan-sharpened with WorldView- 2 panchromatic images using PC spectral pan-sharpening. Pan sharpening can be used as a pixel-level fusion technique to increase the spatial resolution of multispectral image (MS) [28]. In pan sharpening techniques, a pan (single band) image is used to sharpen an MS image while preserving spectral information. The PC Spectral Sharpening method [28] was applied to sharpen the VNIR-SWIR bands of the ASTER with the high spatial resolution WV-2 panchromatic image (0.5-m resolution) in order to spectrally and spatially enhance the alteration zone. In this technique, the principal component transformation is performed on multispectral ASTER data, which are then resampled to high-resolution WV-2 pan data.

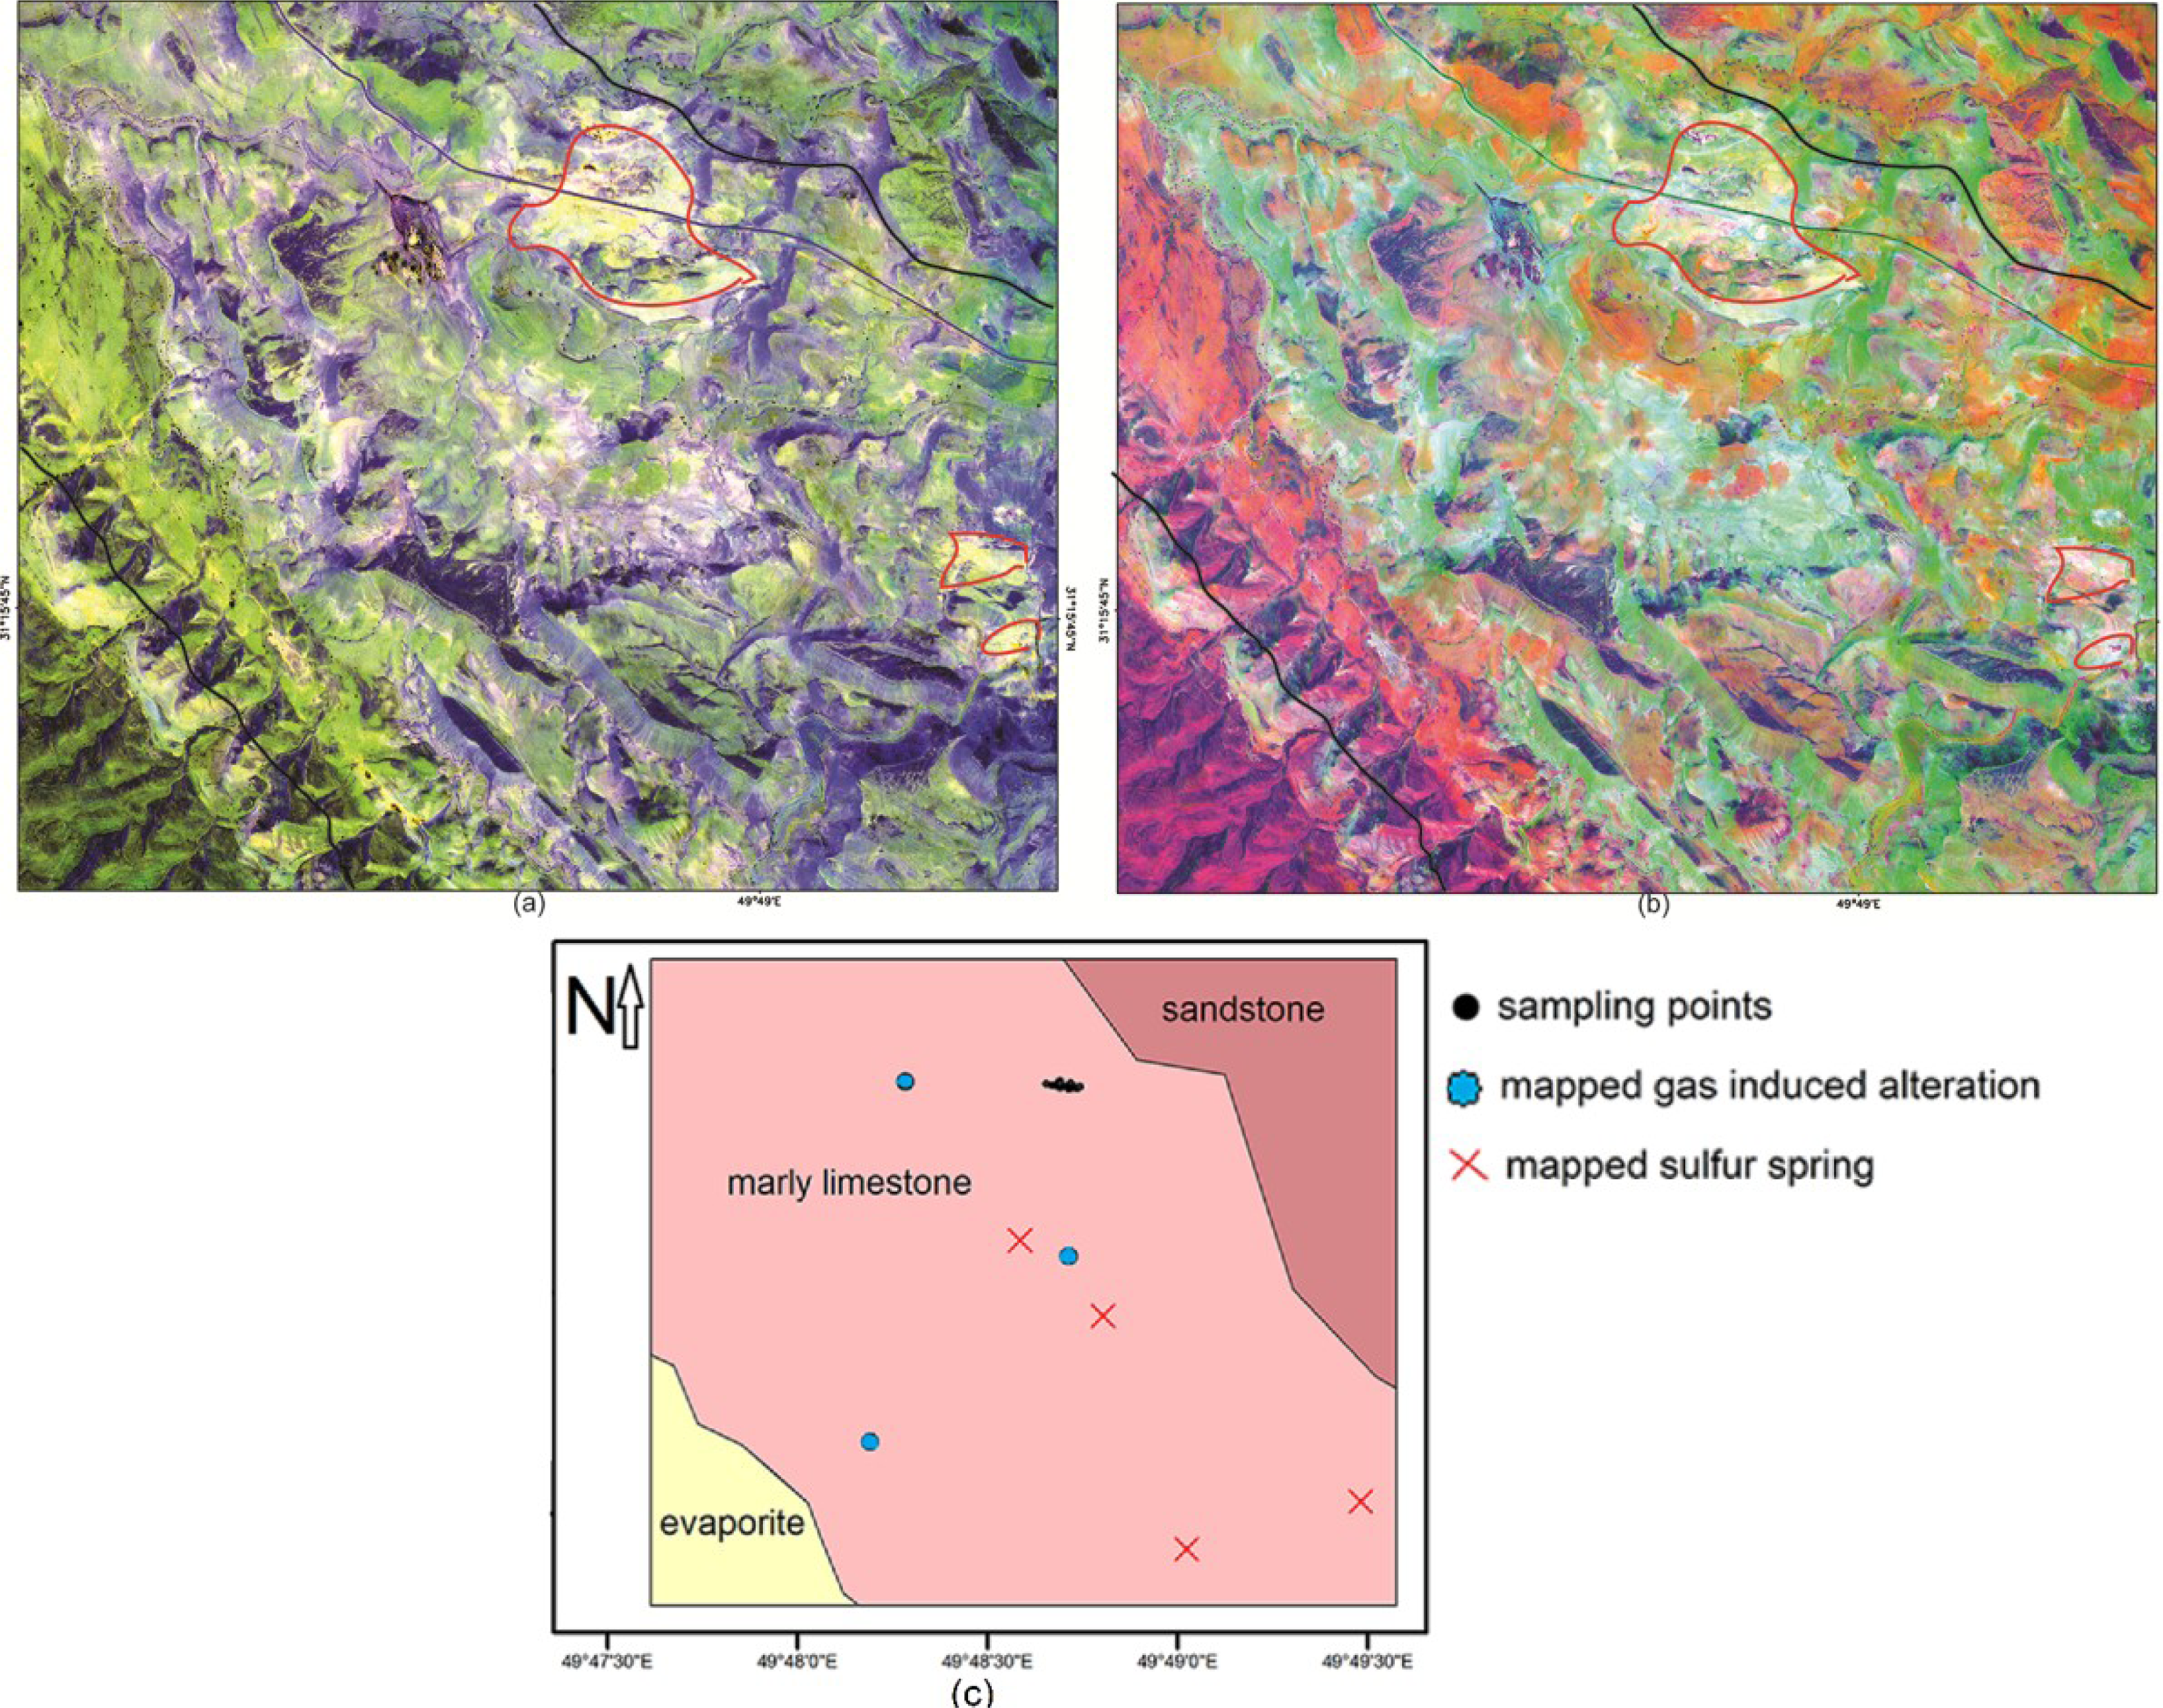
4.3. WorldView-2 Data Analysis

The WV-2 Geo Tiff data was converted to WV-2 radiance in ENVI 4.8 software (Exelis Visual Information Solution, Inc., Boulder, CO, USA). The WV-2 bands were corrected for atmospheric effects on pseudo surface reflectance using the Log Residuals Method [26]. Pan-sharpened WV-2 images were created by fusing the MS WV-2 imagery (with a spatial resolution of 2 m) with 0.5 m pan WV-2 imagery using the method of Gramm-Schmidt (GS) Spectral Sharpening. The GS spectral sharpening technique has been successfully used for mapping land cover [29] and urban tree species [30]. The GS algorithm uses the spectral response function of a given sensor to estimate what the panchromatic data look like (WV-2 panchromatic). The GS pan sharpening is spectrally stronger than other sharpening techniques for the fusion of multispectral bands of WV-2 with the panchromatic band [29]. The pan-sharpened imagery was used in ratioing, principal component analysis (PCA) and classification analyses.

4.4. Data Integration

The high-resolution, multispectral WV-2 data and the multispectral ASTER data were integrated and treated as independent multiple band imagery in order to carry out the boosted regression trees (BRT) classification. The new multiple band imagery has the same spatial resolution as the fused WV-2 (0.5 m) and contains 17 spectral bands of WV-2 (8 bands in VNIR) and of ASTER (3 bands in VNIR and 6 bands in SWIR).

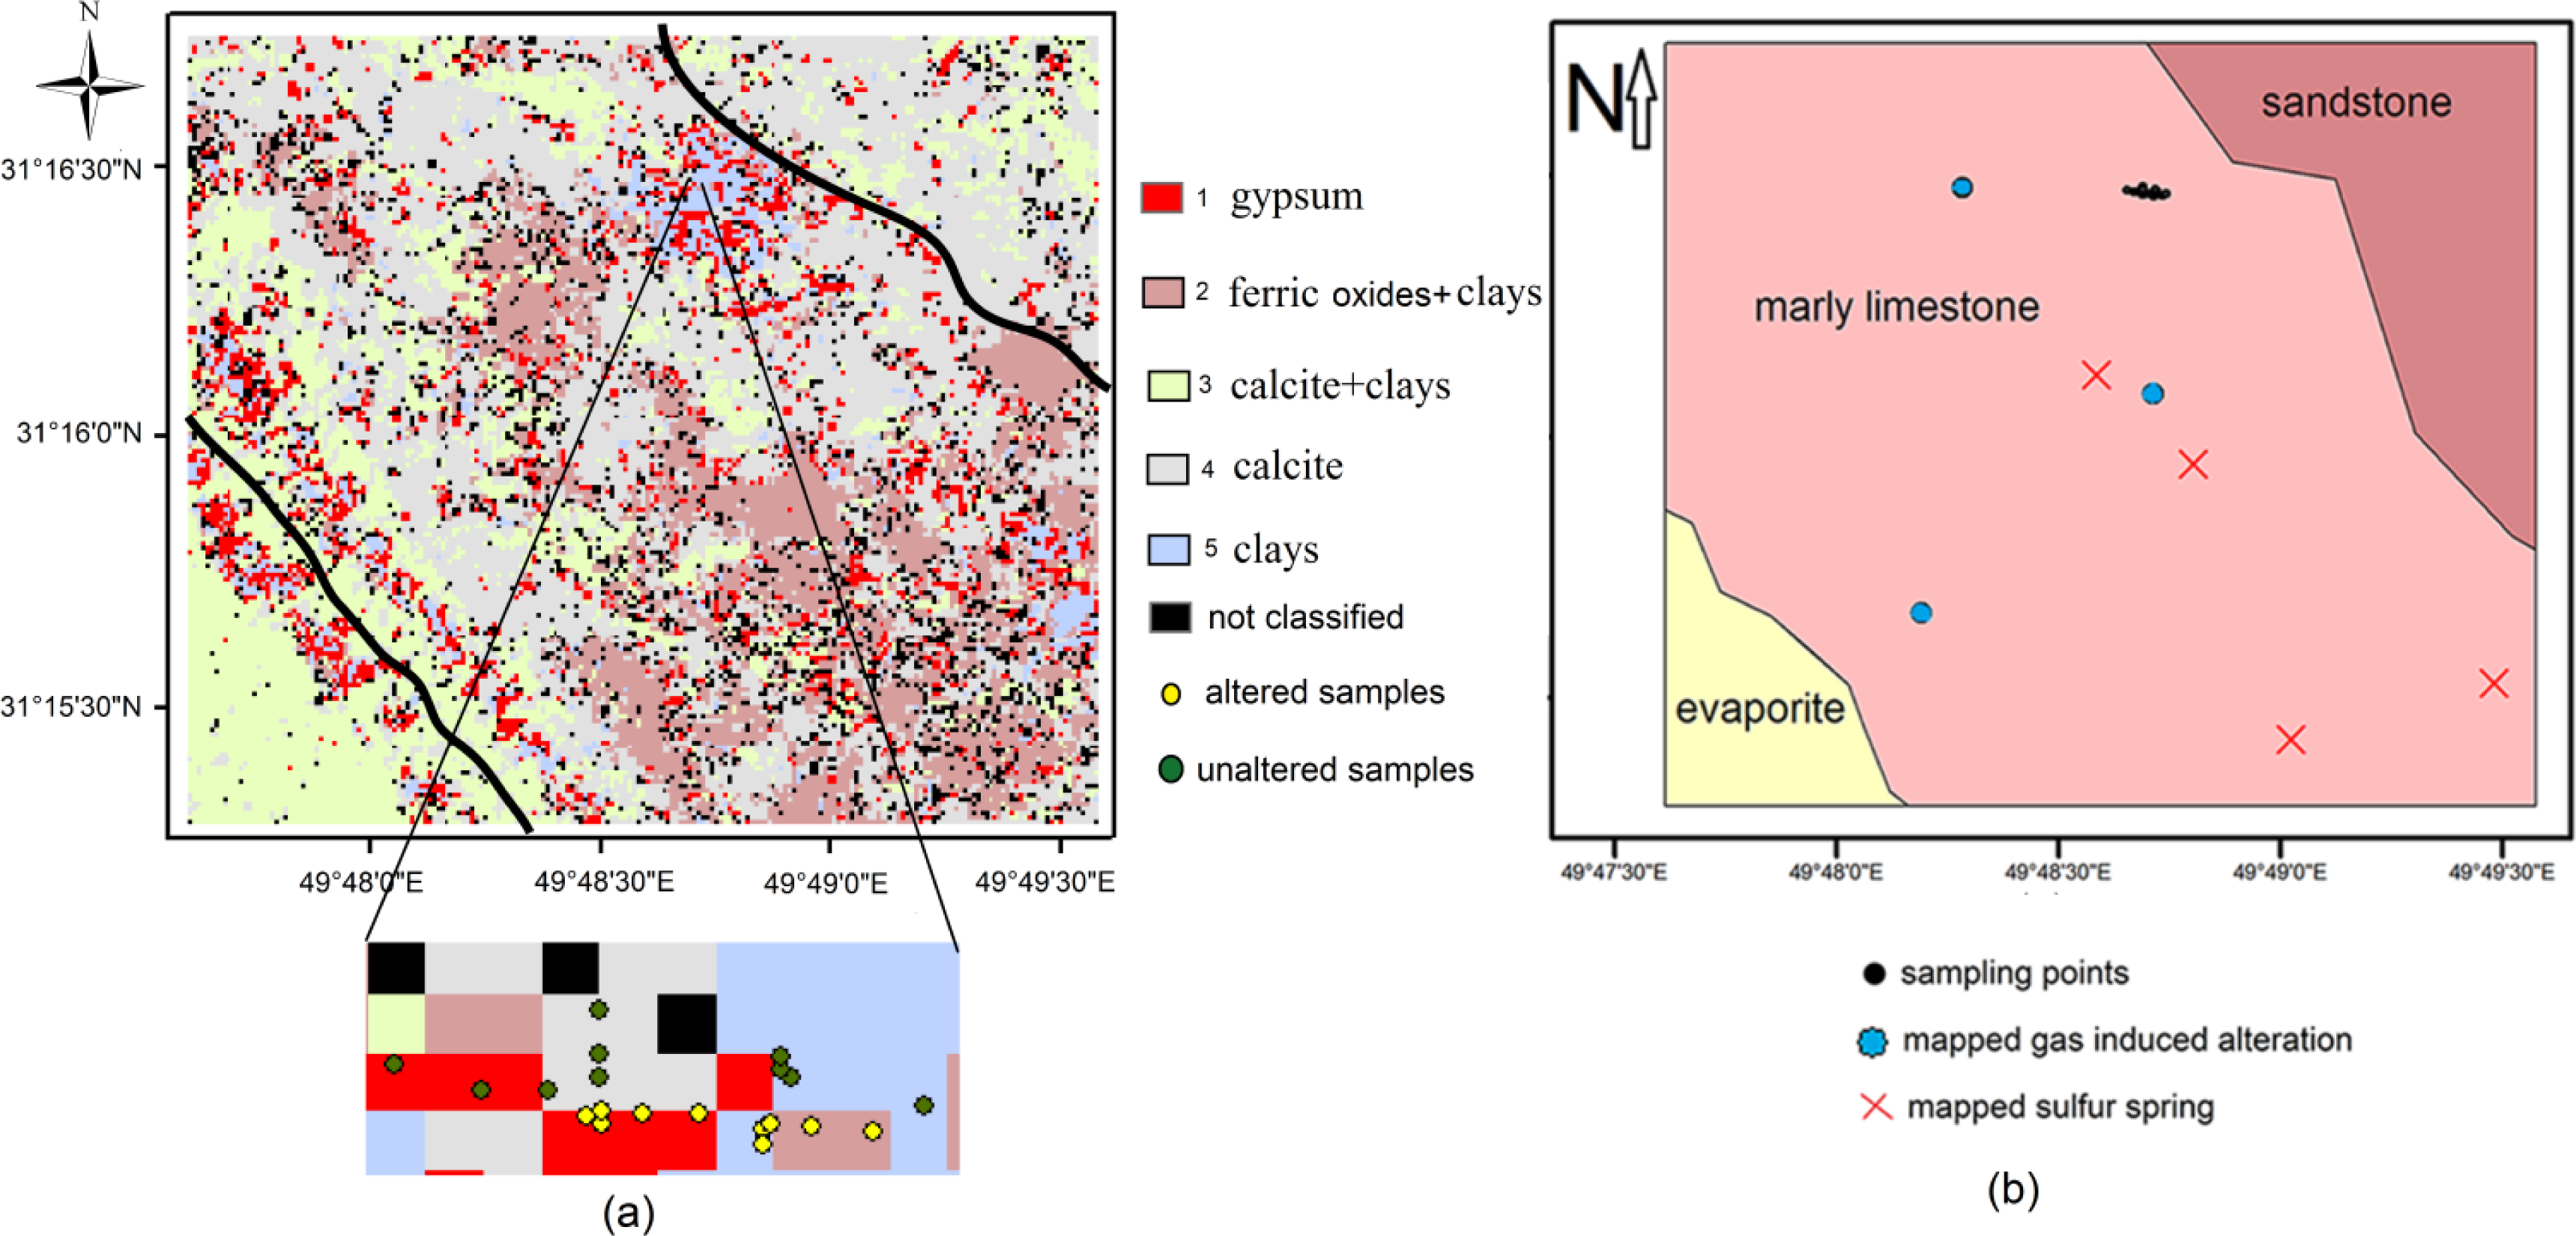
4.5. Boosted Regression Trees Classification (BRT)

Boosted regression tree (BRT) [31] is a nonparametric supervised classification (and regression) algorithm that fits a complex nonlinear relationship by combining two algorithms for classification and regression tree (CART) [32] and boosting. In the BRT technique, the CART algorithm relates the response to the predictor variables (spectral bands) by recursive binary splits, and the boosting method combines large numbers of simple tree models (generated by iteratively varying the training sample) to improve predictive performance [33]. The conventional CART algorithm itself has been used successfully for the classification of remote sensing images, e.g., [34,35]. Boosting is one of the ensemble of classification methods that can be applied in conjunction with supervised classification algorithms and improves classification accuracy [36]. A combination of these two techniques (i.e., BRT) has been shown to be effective in improving the accuracy of satellite image classifications [36,37]. This method estimates local probabilities of class membership for the classified map and has several advantages, including: (a) it represents information in a way that is easy to visualize; (b) the preparation of predictors is simple, and they can be of any type (numeric, binary, categorical, etc.) with any type of distribution (normal and non-normal); (c) irrelevant predictors are seldom selected; and (d) trees are insensitive to outliers [33]. This method has also been successfully applied for predictions in the other fields, such as economics [38], computer sciences [39] and ecology [33]. A working guide on the BRT analysis can be found in Elith et al. [33]. In this study, the BRT algorithm was used to classify the ASTER, WV-2 and multiple band imagery created from the ASTER and WV-2 datasets to detect alteration minerals related to the gas seeps. Six scenarios were defined for the BRT classifications based on three datasets and three selected groups of regions of interest (ROIs):
(a)
The ASTER imagery using a group of ROIs, which were chosen from the purest pixels of ASTER imagery.
(b)
The WV-2 imagery using: (1) a group of ROIs selected from the purest pixels of the WV-2; and (2) a group of ROIs chosen from imagery pixels co-located with ground measurements.
(c)
The new multiple band imagery using: (1) ROIs co-located with the purest pixels of the ASTER; (2) ROIs co-located with the purest pixels of the WV-2; and (3) ROIs chosen from imagery pixels co-located with ground measurements.
The BRT classification using a group of ROIs co-located with ground measurements was not possible for the ASTER imagery, because these measurements only cover a few pixels of the ASTER, which cannot provide adequate samples for the classification.
The models were fitted in R version 2.15.3 [40], using generalized boosted regression models (gbm) package version 2.0-8 [41]. The learning rate and number of trees are two important parameters controlling prediction errors. The learning rate shrinks the contribution of each tree as it is added to the model. The lower learning rate and 1000 trees were used to deal with the over fitting of BTR for a small number of samples [33].
One of the most important outputs of the BRT algorithm is the relative influence of predictors, which is measured based on the number of times a variable is selected for splitting, weighted by the squared improvement to the model as a result of each split and averaged over all trees [31]. This output is a valuable measure to investigate the potential impact of WV-2 VNIR bands on the classification of the image. The main purpose of the classification was detecting target minerals and evaluating the spatial correspondence between classified areas and field measurements; thus, an accuracy method involving the field measurements was applied to evaluate the spatial allocation of the categories. The classification accuracy performance was evaluated by the area under the curve (AUC) of a receiver operating characteristic (ROC) plot, (hereafter, AUC [42]). This provides a provision of spatial correspondence between field measurements and classification results. An ROC curve is constructed from false positive rates (x-axis) and true positive rates (y-axis) for all thresholds, which reclassify the estimated local probability of a class into binary values (the presence and absence of the class). The AUC is a threshold-independent method and provides a single measure of model performance (accuracy) varying from 0 to 1. An AUC score of 1 shows the best model (perfect discrimination); a score of 0.5 indicates random predictive discrimination, and a score of less than 0.5 indicates discrimination worth less than chance. Based on laboratory spectral and geochemical analysis, sampling points were classified into two groups; altered and non-altered. Then, the accuracy of the BRT classification in distinguishing altered areas was evaluated using the AUC method.

5. Results

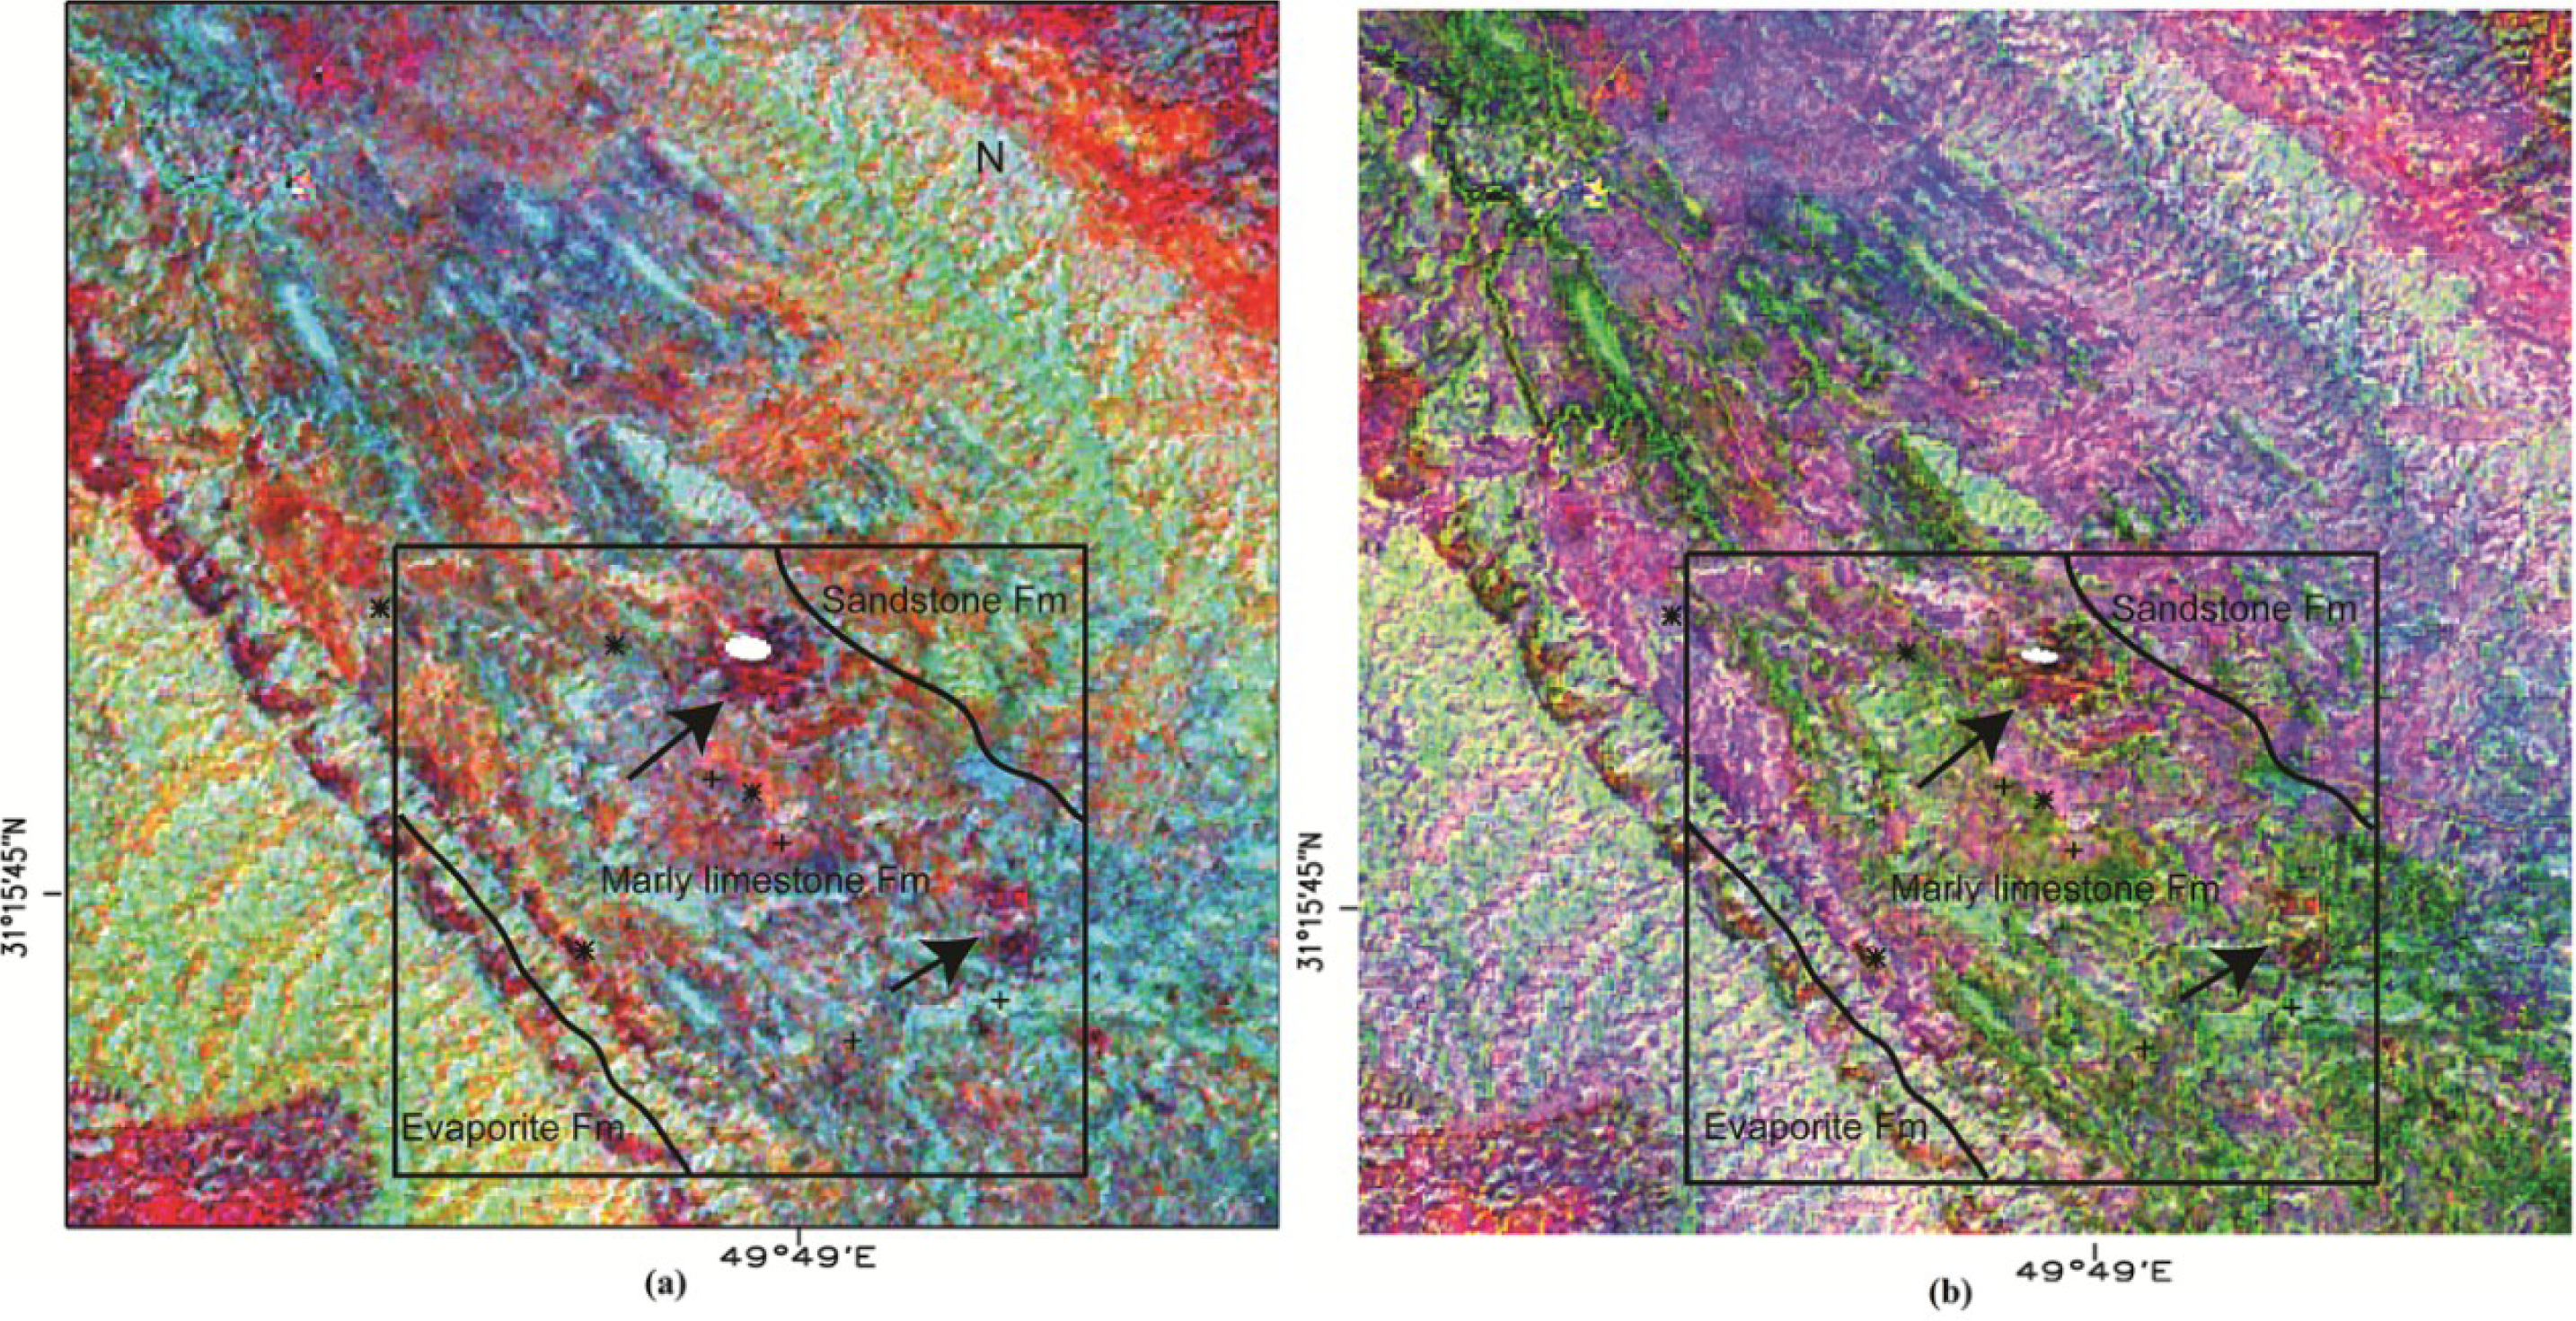
5.1. ASTER Data Processing

There are some differences between the laboratory spectra of unaltered marly limestone and image-derived spectra (Figure 3a). The laboratory spectra of all unaltered samples displayed absorption features at around 2.3 μm to 2.35 μm, indicative of the presence of calcite. However, reflectance spectra derived from ASTER imagery pixels co-located with field sampling points do not show any absorption features indicative of calcite, but illustrate absorption features at 0.8 μm, 2.15 μm and 2.2 μm, indicating the presence of iron bearing minerals and clays. This difference, however, is because of the spatial scale of the data.
Since the analysis of the reflectance spectra revealed that the predominant gas seep alteration related mineral in the marly limestone formation is gypsum, the image-derived spectra indicative of the presence of calcite, gypsum and clay spectra were chosen for the classification (Figure 4). Gypsum has been used as an index mineral to enhance gas seep-induced alterations in the marly limestone formation, while calcite and clays have been used to map unaltered marly limestone formation.
Band ratios were created to spectrally enhance gypsum in the marly limestone formation. Figure 5 shows the surface manifestations of hydrocarbon seeps that the band ratios emphasized. The results (Figure 5) illustrate a consistent correlation between the gas seeping area and areas rich in ferrous iron and gypsum, lacking of carbonates and with low amounts of clays. The results agree with the generalized spectral and geochemical model, which was proposed by analysing field data.
To spatially enhance gas-induced alterations, the VNIR-SWIR bands of ASTER were pan-sharpened with the 0.5-m panchromatic band of WV-2 (Figure 6) by PC spectral sharpening. The fusion of both datasets was used in order to determine if further spatial differentiation of the alteration zones were possible. The alteration zones in the marly limestone (consisting of gypsum) can be identified as dark brown in pan-sharpened ASTER VNIR (Figure 7a) and purple in pan-sharpened ASTER SWIR bands (Figure 6b).

5.2. WorldView-2

A false colour composite of the WV-2 image was created for Band 6 (red), Band 3 (green) and Band 2 (blue) and overlaid with lithological boundaries and field observation points (Figure 7a,b). Spectral reflectance curves of pixels co-located with sampling points were derived from WV-2 imagery (Figure 7c). There are subtle differences between the spectra of the altered zone and unaltered zone in VNIR bands of the WV-2. The reflectance spectra of altered marly limestone show a subtle absorption feature in the range of 0.4–0.5 μm, which could be related to the presence of elemental sulphur and/or ferric iron bearing minerals (Figure 7c). Sulphur has a diagnostic feature in the VNIR wavelength range. It shows a strong decrease in reflectance in the 0.4–0.5 μm range towards shorter wavelengths. This results from the semiconductor behaviour of sulphur, which creates a strong absorption at higher level energies [43]. The spectra of image pixels covering the altered area have shallow absorption features around 0.720 μm, indicating the presence of iron bearing minerals in the Mishan Formation. The prominent Fe2+ absorption bands occur near 0.9–1.2 μm [44]. The presence of absorption bands near 0.9–0.95 μm is indicative of Fe2+ bearing minerals in image pixels covering field data.
Based on the spectral features of unaltered marly limestone and the alteration zone (Figure 7c), two band ratios and one RBD image were created to enhance the alteration minerals in the Mishan marly limestone. The band ratio 2/1 (0.480 μm/0.420 μm) can be used to enhance native sulphur, and band ratio 4/8 (0.660 μm /0.950 μm) can be used to detect the distribution of ferrous iron bearing minerals. To enhance the distribution of ferric iron bearing minerals, an RBD image was created from Band 5 (0.660 μm) + Band 3 (0.545 μm)/Band 1 (0.420 μm). The false colour composite (FCC) of RBD and ratio images shows the distribution of pixels with an absorption by native sulphur (in red), ferric iron bearing minerals (in green) and ferrous iron bearing minerals (in blue) (Figure 8a). The alteration zones are exposed in a whitish yellow colour, which shows the presence of sulphur and ferric bearing minerals. The altered areas appear in bright colour in PCA results, because of the high reflected radiance of the bleached areas (Figure 8b).

5.3. The BRT Classification

Figure 9 shows the classification of the ASTER dataset obtained with the BRT method. The predicted power of the classification is fair; the AUC has mean values of 0.62 (Table 2, Scenario 1). The results show that the BRT is able to classify altered areas using ROIs of the purest pixels of the ASTER imagery, indicating gypsum (the gas-induced alteration product in marly limestone is in red colour), calcite, clays and iron bearing minerals. There are some misclassifications for image pixels co-located with field samples, because of the different scale of field measurements and the pixel size of the ASTER. Each of the field samples is only indicative of one point on the ground and does not represent the mixed nature of a pixel. ASTER SWIR Bands 4 (1.6–1.7 μm), 8 (2.295–2.365 μm), 5 (2.145–2.185 μm) and 6 (2.185–2.225 μm), indicative of the presence of gypsum and calcite, have the most contributions in distinguishing the alteration zone (Table 2, Scenario 1). The VNIR bands of ASTER showed less contribution to the classification of the altered area.
In the southwestern quadrant of the image, there are some areas close to the lithological boundary between evaporite and marly limestone formations containing gypsum, which was transported by erosion, mainly by streams, from the higher elevation of the evaporite Fm toward the lower elevations of the marly limestone Fm.
Results of the BRT classification of the WV-2 using ROIs of pure pixels of the WV-2 and ROIs co-located with sampling points are shown in Figure 10a,b. It is notable that the classification is only based on the spectral features of pixels in the VNIR wavelength range. The predicted power of the classification using ROIs of pure pixels is fair; the AUC has mean values of 0.68 (Table 2, Scenario 2). Bands 3 (0.54 μm), 5 (0.66 μm), 8 (0.95 μm), 4 (0.6 μm) and 1 (0.42 μm) have the most contributions to the classification of pixels co-located with the ground-truth (Table 2, Scenario 2). Bands 3, 5 and 4 indicate the presence of ferric iron bearing minerals, while Band 8 can be related to the presence of ferrous iron bearing minerals. The importance of Band 1 (0.42 μm) can be related to the sharp fall of the spectra at this wavelength range related to Fe-OH. Class 1 (red colour) is indicative of alterations related to gas seeps, which mostly represents bleached areas. Some of the image pixels co-located with altered samples have not been classified in Class 1. The reason is that these pixels are co-located with areas near the gas flames covered by ash and are darker than bleached areas. Class 3 does not only indicate areas having iron bearing minerals, but it also shows roads, roofs and asphalts, and Class 5, with no distinct absorption features, can be related to shadow (Figure 10a).
Figure 10b shows the results of BRT classification using ROIs around sampling points. Altered (red colour) and unaltered pixels linked to the ground-truth have been successfully classified based on their absorption features in VNIR of the WV-2. The predicted power of the classification using ROIs of pixels co-located with the ground-truth is very good; the AUC has mean values of 0.93 (Table 2, Scenario 3).
Bands 3 (0.54 μm), 1 (0.42 μm), 4 (0.6 μm), 2 (0.480), 8 (0.95 μm) and 5 (0.66 μm) have the most contributions to the classification of pixels co-located with the ground-truth (Table 2, Scenario 3). The classification was also successful in highlighting other altered areas displayed in the geological map as indications of gas seeps [45]. Classes 1, 2 and 4 are classified as unaltered areas. Image pixels co-located with altered samples were classified as Class 3 (red colour). Since the spectral features of these pixels showed the presence of ferric iron bearing minerals (Figure 7c), Class 3 represents ferric iron bearing minerals in Figure 10b. Bands 6 (0.725) and 7 (0.835) have the lowest contribution in distinguishing classes, because most classes show very shallow absorption depth at 0.725 μm and do not have any distinct feature at 0.835 μm.
The result of the BRT classification of the multiple band imagery is shown in Figure 11. Three sets of ROIs were used for the classification of the multiple band imagery: classification using ROIs co-located with the purest pixels of ASTER (Figure 11a), classification using ROIs co-located with the purest pixels of the WV-2 (Figure 11b) and classification using ROIs co-located with ground-truths (Figure 11c). The idea of using three ROIs for the BRT classification of multiple band imagery was to learn which ROIs altered and unaltered areas can be better distinguished and to what degree the spatial resolution of the WV-2 and its multispectral VNIR bands improve the classification of alteration. Class 1 displays the alteration zones in Figure 11a,b, and Class 3 is indicative of the altered areas in Figure 11c.
The predicted power of the classification using the ROIs of pixels co-located with the purest pixels of the ASTER is fair; the AUC has mean values of 0.62 (Table 2, Scenario4). Two VNIR bands of the WV-2 and four SWIR bands of ASTER have the most contribution to the classification of altered areas. Using ROIs co-located with the purest pixels of the WV-2, the predicted power of the classification is fair; the AUC has mean values of 0.7 (Table 2, Scenario5). The best discrimination among altered and unaltered areas was obtained by the BRT classification using ROIs co-located with ground-truths. The predicted power of this classification is excellent; the AUC has mean values of one (Table 2, Scenario 6).
The SWIR bands of ASTER have higher contributions to three sets of classifications of alteration zones than the WV-2 VNIR bands. Gypsum (shown in red colour) is the alteration product of gas seep and the marine marly limestone formation composites of calcite and clays, which have diagnostic features in the SWIR range. This might be the reason why the SWIR bands of ASTER have more influences on the classifications. However, sharp decreasing in the reflectance gradient between the visible red and the visible green-blue due to bleaching effects could be classified by the VNIR bands of the WV-2. It is worthwhile to comment that WV-2 Bands 1 (0.425 μm) and 3 (0.545 μm) show high importance in all three classifications. The importance of Band 1 (0.42 μm) can be related to a sharp fall of the spectra at this wavelength range related to Fe-OH, and the importance of Band 3 can be related to the bleaching effects of the gas seep.

6. Discussion

The affected areas by the gas seep showed a larger extension in the satellite imagery than field observations. The results obtained by the BRT classification of ASTER using ROIs co-located with the purest pixels of ASTER (Figure 9) showed a fair match with altered sampling points. Nevertheless, assessing the spatial correspondence between alterations mapped by image analyses of ASTER and the ground-truth is problematic, because of the low spatial resolution of ASTER.
This research showed that SWIR bands of ASTER have been successful in mapping alteration minerals, such as gypsum; however, the WV-2 would increase the accuracy of such mapping (Figure 11) by enhancing the bleaching effect of hydrocarbon seeps (brightness) and providing detailed information about the presence of iron bearing minerals. Even though there are subtle differences among the WV-2 spectral features of image pixels covering altered and unaltered samples, the classification accuracy can still be improved by integrating this dataset with higher spectral resolution. Among the VNIR bands of WV-2, Bands 2 (0.480 μm), 6 (0.725 μm) and 7 (0.835 μm) showed the lowest influence on the classification of the multiple band imagery (Table 2). As some other objects on the ground have similar spectral features as iron bearing minerals, the results of the WV-2 classification should be interpreted with a detailed study of the land cover of an area of interest. In this research, the study area is without vegetation cover, and roads, asphalt roofs, bituminous soil and shadow are the objects that could be confused with target minerals. Image pixels covering altered samples (from field data) were classified as Class 1 in the BRT classification of WV-2 using ROIs of the purest pixels of the imagery (Table 2, Scenario 2) and classified as Class 3 in the BRT classification of WV-2 using ROIs co-located with sampling points (Table 2, Scenario 3). Class 1 in the former classification represents the brightness (bleaching effects in seeps area), and Class 3 in the latter classification illustrates the presence of ferric iron bearing minerals. Thus, those classes are not unique to the alteration zone.
WV-3 is planned for launch in 2014 with eight spectral bands in VNIR (similar to WV-2) and an additional eight bands in the SWIR [46]. Four bands of SWIR WV-3 would range from 1.2 μm to 1.7 μm and another four bands would range from 2.165 μm to 2.33 μm [47]. As many alteration minerals have diagnostic features in SWIR, particularly between 2 and 2.5 μm, geologists would get more benefits from this unique dataset with more bands in this wavelength range. WV-3 can compensate for the site-specific limitations of hyperspectral airborne data capture and provides geologists with a super-efficient dataset in space for mineral mapping. This study showed that few VNIR bands of the WV-2 are useful in the classification of alteration minerals. There is a decreased capability to define the key spectra of alteration minerals with decreasing spectral resolution. If the spectral bands are inadequate, neither spatial resolution matters for mineral mapping. It is expected that the SWIR bands of WV-3 can potentially improve geological applications of remote sensing.
In practice, ground-truths and geological maps are two traditional ways of obtaining information about the accuracy of a classification with geological purposes. However, geological maps are limited to the general information of geological formations and do not provide detailed information about the highly heterogeneous nature of lithological units. Ground-truths are usually collected around a site of interest and do not provide complete coverage of entire areas. It is significant to note that in geological applications, such as studying alterations, assessing the local spatial correspondence between ground-truths and identified minerals by image analysis provides geologists a better understanding of the potential of a specific technique for mapping the spatial distributions of target minerals. Therefore, the classifications of this research were assessed using the AUC technique, which take into account the spatial correspondence between ground-truths and the classified imagery.

7. Conclusions

This research utilized remote sensing techniques to detect alterations related to gas seeps and to explore the potential of the WV-2 for enhancing the bleaching effects of seeps. The results of this study demonstrated that alterations related to the gas seeps in the Mamatin area can be mapped by ASTER and WV-2 imagery. In addition, altered areas displayed in the geologic map and two other new areas with similar spectral features of the alteration product (gypsum) in the marly limestone formation were identified by remote sensing techniques. The integrating of the WV-2 into the ASTER improved the spatial accuracy of alterations mapping. It is suggested that the WV-2 dataset can provide a potential tool along with higher spectral resolution data for mapping alteration minerals related to hydrocarbon seeps in arid and semi-arid areas.
The study of alterations often focuses on the local scale, and a method for estimating the accuracy of classified areas against ground-truths has more benefits for geologists than evaluating the accuracy of the entire imagery. The AUC accuracy assessment method provided us with a statistic measure to evaluate the correctness of classified alterations. The BRT classification of the multiple band imagery using ROIs around field observations showed the perfect discrimination. It is expected that the coming WV-3 dataset would be a promising dataset in studying hydrocarbon seep-induced alterations, particularly in places where alterations cover small areas.

Acknowledgments

This research was funded by the University of Twente, Faculty of Geo-Information Science and Earth Observation (ITC), The Netherlands. We acknowledge DigitalGlobe for providing us the WorldView-2 image.

Author Contributions

Sanaz Salati compiled and processed the data and designed the study. She wrote the draft of the manuscript. Frank van Ruitenbeek and Freek van der Meer assisted with the interpretation of the results and contributed to the study design and manuscript writing in all stages. Babak Naimi assisted in writing scripts and analyses in R software. All authors checked and revised the manuscript and contributed to the results.

Conflicts of Interest

The authors declare no conflict of interest.

References

  1. Saunders, D.; Burson, K.; Thompson, C. Model for hydrocarbon microseepage and related near-surface alterations. AAPG Bull 1999, 83, 170–185. [Google Scholar]
  2. Petrovic, A.; Khan, S.D.; Chafetz, H.S. Remote detection and geochemical studies for finding hydrocarbon-induced alterations in Lisbon Valley, Utah. Mar. Pet. Geol 2008, 25, 696–705. [Google Scholar]
  3. Khan, S.; Jacobson, S. Remote sensing and geochemistry for detecting hydrocarbon microseepages. Geol. Soc. Am 2008, 120, 96–105. [Google Scholar]
  4. Shi, P.; Fu, B.; Ninomiya, Y.; Sun, J.; Li, Y. Multispectral remote sensing mapping for hydrocarbon seepage-induced lithologic anomalies in the Kuqa Foreland Basin, South Tian Shan. J. Asian Earth Sci 2012, 46, 70–77. [Google Scholar]
  5. Abrams, M. Significance of hydrocarbon seepage relative to petroleum generation and entrapment. Mar. Pet. Geol 2005, 22, 457–477. [Google Scholar]
  6. Van der Meer, F.; van Dijk, P.; van der Werff, H.; Yang, H. Remote sensing and petroleum seepage: A review and case study. Terra Nova 2002, 14, 1–17. [Google Scholar]
  7. Petrovic, A.; Khan, S.D.; Thurmond, A.K. Integrated hyperspectral remote sensing, geochemical and isotopic studies for understanding hydrocarbon-induced rock alterations. Mar. Pet. Geol 2012, 35, 292–308. [Google Scholar]
  8. Schumacher, D. Hydrocarbon-Induced Alteration of Soils and Sediments. In Hydrocarbon Migration and Near Surface Expression: AAPG Memoir 66; Schumacher, D., Abrams, M.A., Eds.; AAPG: Houston, TX, USA, 1996; pp. 71–89. [Google Scholar]
  9. Etiope, G.; Klusman, R.W. Microseepage in drylands: Flux and implications in the global atmospheric source/sink budget of methane. Glob. Planet. Chang 2010, 72, 265–274. [Google Scholar]
  10. Rowan, L.C.; Mars, J.C. Lithologic mapping in the mountain pass, California area using Advanced Spaceborne Thermal Emission and Reflection Radiometer (ASTER) data. Remote Sens. Environ 2003, 84, 350–366. [Google Scholar]
  11. Rowan, L.C.; Mars, J.C.; Simpson, C.J. Lithologic mapping of the Mordor, NT, Australia ultramafic complex by using the Advanced Spaceborne Thermal Emission and Reflection Radiometer (ASTER). Remote Sens. Environ 2005, 99, 105–126. [Google Scholar]
  12. Mars, J.C.; Rowan, L.C. Spectral assessment of new ASTER SWIR surface reflectance data products for spectroscopic mapping of rocks and minerals. Remote Sens. Environ 2010, 114, 2011–2025. [Google Scholar]
  13. Khan, S.D.; Mahmood, K. The application of remote sensing techniques to the study of ophiolites. Earth Sci. Rev 2008, 89, 135–143. [Google Scholar]
  14. Hubbard, B.E.; Crowley, J.K.; Zimbelman, D.R. Comparative alteration mineral mapping using visible to shortwave infrared (0.4–2.4 μm) Hyperion, ALI, and ASTER imagery. IEEE Trans. Geosci. Remote Sens 2003, 41, 1401–1410. [Google Scholar]
  15. Hewson, R.D.; Cudahy, T.J.; Mizuhiko, S.; Ueda, K.; Mauger, A.J. Seamless geological map generation using ASTER in the Broken Hill-Curnamona Province of Australia. Remote Sens. Environ 2005, 99, 159–172. [Google Scholar]
  16. Gomez, C.; Delacourt, C.; Allemand, P.; Ledru, P.; Wackerle, R. Using aster remote sensing data set for geological mapping, in Namibia. Phys. Chem. Earth Parts ABC 2005, 30, 97–108. [Google Scholar]
  17. Hunt, G.R. Spectral signatures of particulate minerals in the visible and near infrared. Geophysics 1977, 42, 501–513. [Google Scholar]
  18. Abrams, M. Distribution of Subsurface Hydrocarbon Seepage in Near-Surface Marine Sediments. In Hydrocarbon Migration And Near Surface Expression: AAPG Memoir 66; Schumacher, D., Abrams, M.A., Eds.; AAPG: Houston, TX, USA, 1996; pp. 1–14. [Google Scholar]
  19. Lammoglia, T.; Filho, C.; Filho, R. Characterization of hydrocarbon microseepages in the Tucano Basin (Brazil) through hyperspectral classification and neural network analysis of Advance Spaceborne Thermal Emission and Reflection Radiometer (ASTER) data. Int. Photogramm. Remote Sens. Spat. Inf. Sci 2008, 38, 1195–1200. [Google Scholar]
  20. Salati, S.; van Ruitenbeek, F.J.A.; Carranza, E.J.M.; van der Meer, F.D.; Tangestani, M.H. Conceptual modeling of onshore hydrocarbon seep occurrence in the Dezful Embayment, SW Iran. Mar. Pet. Geol 2013, 43, 102–120. [Google Scholar]
  21. James, G.A.; Wynd, J.G. Stratigraphic nomenclature of Iranian oil consortium agreement area. AAPG Bull 1965, 49, 2182–2245. [Google Scholar]
  22. Thomas, A.N. “Gach-i-turush” and associated phenomena in Southwest Persia. Proceedings of VII Convegno Nazionale del Metano e del Petrolio, Taormina, Italy, 21–24 April 1952. preprint.
  23. Salati, S.; van Ruitenbeek, F.; de Smeth, J.B.; van der Meer, F. Spectral and chemical characterization of hydrocabon seeps-induced alteration in the Dezful Embayment, SW Iran. AAPG Bull 2014, in press. [Google Scholar]
  24. Fujisada, H. Design and performance of ASTER instrument. Proc. SPIE 1995, 2583, 16–25. [Google Scholar]
  25. DigitalGlobe. The Benefits of the 8 Spectral Bands of Worldview-2. Available online: http://worldview2.digitalglobe.com/docs/WorldView-2_8-Band_Applications_Whitepaper.pdf (accessed on 1 March 2009).
  26. Green, A.A.; Craig, M.A. Analysis of Aircraft Spectrometer Data with Logarithmic Residuals. Proceedings of Airborn Imaging Spectromete Data Anal. Workshop, Pasadena, CA, USA, 8–10 April 1985; pp. 111–119.
  27. Crowley, J.K.; Brickey, D.W.; Rowan, L.C. Airborne imaging spectrometer data of the ruby mountains, montana: Mineral discrimination using relative absorption band-depth images. Remote Sens. Environ 1989, 29, 121–134. [Google Scholar]
  28. Chavez, J.; Stuart, C.; Anderson, J.A. Comparison of three different methods to merge multiresolution and multispectral data: Landsat TM and SPOT panchromatic. Photogramm. Eng. Remote Sens 1991, 57, 295–303. [Google Scholar]
  29. Padwick, C.; Deskevich, M.; Pacifici, F.; Smallwood, S. Worldview-2 Pan-Sharpening: ASPRS 2010. Proceedings of the ASPRS 2010 Annual Conference, San Diego, CA, USA, 26–30 April 2010.
  30. Pu, R.; Landry, S. A comparative analysis of high spatial resolution IKONOS and Worldview-2 imagery for mapping urban tree species. Remote Sens. Environ 2012, 124, 516–533. [Google Scholar]
  31. Friedman, J.H.; Meulman, J.J. Multiple additive regression trees with application in epidemiology. Stat. Med 2003, 22, 1365–1381. [Google Scholar]
  32. Breiman, L.; Friedman, J.H.; Olshen, R.A.; Stone, C.G. Classification and Regression Trees; Wadsworth in-Ternational Group: Belmont, CA, USA, 1984. [Google Scholar]
  33. Elith, J.; Leathwick, J.R.; Hastie, T. A working guide to boosted regression trees. J. Anim. Ecol 2008, 77, 802–813. [Google Scholar]
  34. Friedl, M.A.; Brodley, C.E. Decision tree classification of land cover from remotely sensed data. Remote Sens. Environ 1997, 61, 399–409. [Google Scholar]
  35. Lawrence, R.L.; Wright, A. Rule-based classification systems using classification and regression tree (Cart) analysis. Photogramm. Eng. Remote Sens 2001, 67, 1137–1142. [Google Scholar]
  36. McIver, D.K.; Friedl, M.A. Estimating pixel-scale land cover classification confidence using nonparametric machine learning methods. IEEE Trans. Geosci. Remote Sens 2001, 39, 1959–1968. [Google Scholar]
  37. Lawrence, R.; Bunn, A.; Powell, S.; Zambron, M. Classification of remotely sensed imagery using stochastic gradient boosting as a refinement of classification tree analysis. Remote Sens. Environ 2004, 90, 331–336. [Google Scholar]
  38. Schonlau, M. Boosted regression (Boosting): An introductory tutorial and a stata plugin. Stata J 2005, 5, 330–354. [Google Scholar]
  39. Tyree, S.; Weinberger, K.Q.; Agrawa, K. Parallel boosted regression trees for web search ranking. Proceedings of the International World Wide Web Conference Comittee (IW3C2), Hyderabad, India, 28 March–1 April 2011.
  40. R Developement Core Team, R version 2.15.3; R Foundation for Statistical Computing: Vienna, Austria, 2006.
  41. Ridgeway, G. Generalized Boosted Regression Model. Documentation on the R Package “gbm”. Version 1: 5–7; 2006. Available online: http://www.i-pensieri.com/gregr/gbm.shtml (accessed on 1 March 2008).
  42. Fielding, A.H.; Bell, J.F. A review of methods for the assessment of prediction errors in conservation presence/absence models. Environ. Conserv 1997, 24, 38–49. [Google Scholar]
  43. Gleeson, D.F.; Pappalardo, R.T.; Grasby, S.E.; Anderson, M.S.; Beauchamp, B.; Castaño, R.; Chien, S.A.; Doggett, T.; Mandrake, L.; Wagstaff, K.L. Characterization of a sulfur-rich arctic spring site and field analog to Europa using hyperspectral data. Remote Sens. Environ 2010, 114, 1297–1311. [Google Scholar]
  44. Crowley, J.K.; Williams, D.E.; Hammarstrom, J.M.; Piatak, N.; Chou, I.M.; Mars, J.C. Spectral reflectance properties (0.4–2.5 μm) of secondary Fe-oxides, Fe hydroxide, and Fe-sulfate-hydrate minerals associated with sulfide bearing mine wastes. Geochemical Explor. Environ. Anal 2003, 3, 219–228. [Google Scholar]
  45. Setudenhnia, A.; OB Perry, J.T. Gachsaran, Masjid Soleyman, Agha Jari, Asmari, Banar-e-Deylam, Haft Kel, and Lali Geological Compilation Maps 1:100,000 Scale (sheet 20641 e); Iranian Oil Operating Companies (IOOC), Center National de la Researche Scientifique: Paris, France, 1966. [Google Scholar]
  46. Kruse, F.; Perry, S. Mineral mapping using simulated Worldview-3 short-wave-infrared imagery. Remote Sens 2013, 5, 2688–2703. [Google Scholar]
  47. Worldview-3. Available online: https://www.Digitalglobe.Com/downloads/worldview3-ds-wv3-web.Pdf (accessed on 24 May 2013).
Figure 1. Study area (a) Geological map of the study area overlaid on the hill-shaded Advance Spaceborne Thermal Emission and Reflection Radiometer (ASTER) GDEM; (b) an ASTER (RGB: 468) false colour composite image of the study area.
Remotesensing 06 03188f1
Figure 2. A photo of the studied area shows the alteration zone and unaltered marly limestone and the generalized model of the spectral and geochemical signatures of gas-induced alterations in the Mishan Formation ([23]; reprinted by permission of the American Association of Petroleum Geologists (AAPG), whose permission is required for further use).
Remotesensing 06 03188f2
Figure 3. (a) Spectral reflectance curves for selected marly limestone and altered marly limestone from the Mishan Formation resampled to the ASTER imagery and pseudo reflectance spectra of ASTER pixels co-located with field sampling points; (b) false colour composite (FCC) of the ASTER overlaid by lithological boundaries (the band combination used is (RGB) 4-6-8); (c) enlargement showing the location of field measurements. The red ellipse displays pixels co-located with samples, which were identified as alterations, with field spectral and geochemical measurements, and the white ellipse illustrates pixels co-located with samples, which were identified as being unaltered, with field measurements.
Remotesensing 06 03188f3
Figure 4. (a) Mean spectra derived from ASTER imagery compared to the USGS (US Geological Survey) spectral library re-sampled to the ASTER; (b) FCC image created from ASTER bands. The band combination used is (RGB) 4-6-8.
Remotesensing 06 03188f4
Figure 5. (a) A false colour composite created from relative absorption-band depth (RBD) and band ratios: b4/(b6 + b9) in red for enhancing gypsum, (b7 + b9)/b8 in green for enhancing calcite and (b5 + b7)/b6 in blue for enhancing clays; (b) false colour composite created from b4/(b6 + b9) for enhancing gypsum (red), b4/b3 for enhancing ferric iron (green) and b3/b1 for enhancing ferrous iron (blue). The black arrows point to the alteration zone in the Mishan marly limestone formation. The black box shows the extension of the region of interest (ROI) selected for ASTER classification and WV-2 image processing, and the arrows point to alterations induced by gas in the marly limestone formation. The white circles show field observations. The asterisks and plus symbols show the gas seep indications in the geological map of the study area.
Remotesensing 06 03188f5
Figure 6. (a) False colour composite created from pan-sharpened ASTER VNIR bands (15-m resolution) with the WV-2 0.5-m panchromatic image; (b) false colour composite created from ASTER SWIR bands with the WV-2 0.5-m panchromatic image. The band combination used in (a) is (RGB) 1-2-3 and in (b) is (RGB) 4-6-8. Yellow polygons show alteration zones enhanced by fusion (the extension of this image is shown as a black box in Figure 5).
Remotesensing 06 03188f6
Figure 7. (a) Colour composite image (R: 6; G: 3; B: 2) created from WV-2 imagery; (b) enlargement showing the location of field measurements. Black crosses indicate the locations of samples; a red ellipse surrounds samples that were identified as altered by field measurements, and white ellipses are around samples identified as unaltered by field measurements; (c) the mean spectra derived from image pixels covering field data.
Remotesensing 06 03188f7
Figure 8. (a) FCC image created from Band 2/Band 1 (in red), Band 5 + Band 3/Band 1 (in green), and Band 4/Band 8 (in blue); (b) an FCC of PCA123 (principal component analysis (PCA)) from the WV-2 bands. Red ellipses surround alteration zones, and black lines display lithological boundaries. (c) The geological map of the study area.
Remotesensing 06 03188f8
Figure 9. Results obtained by the boosted regression trees (BRT) classification with end-members extracted from the purest image pixels of ASTER.
Remotesensing 06 03188f9
Figure 10. (a) Results obtained by the BRT classification with end-members extracted from the purest image pixels of WV-2; and (b) BRT classification using ROIs co-located with ground samples.
Remotesensing 06 03188f10
Figure 11. The results obtained by BRT classification of multiple band imagery created from ASTER and WV-2. (a) The BRT classification using ROIs co-located with the purest pixels of ASTER. (b) The BRT classification using ROIs co-located with the purest pixels of WV-2. (c) The BRT classification using ROIs co-located with sampling points. (d) The geological map of the study area.
Remotesensing 06 03188f11
Table 1. ASTER band ratios for enhancing mineral features.
Mineral FeatureASTER Band Combinations
Ferric iron2/1
Ferric oxide4/3
Ferrous iron1/2
Calcite(7 + 9)/8
Clays(7 + 5)/6
Gypsum4/(9 + 6)
Table 2. Relative contributions (%) of predictor variables and area under curve (AUC) values for the BRT classifications of various scenarios.
Classification ScenarioDatasetROIsPredictor Variables with Their Relative Contributions (%)AUC (%)
1 (Figure 9)ASTERROIs co-located with the purest pixels of the ASTERb4 (42), b8 (22), b5(8), b6 (7.7), b2 (5.3), b9 (5.3), b3 (5), b1 (3), b7 (1.5)62
2 (Figure 10a)WV-2ROIs co-located with the purest pixels of the WV-2b3 (33), b5 (25), b8 (22), b4 (10), b1 (9.5),68
3 (Figure 10b)WV-2ROIs co-located with ground samplesb3 (34), b1 (29), b4 (15), b2 (9), b8 (7), b5 (5.4)93
4 (Figure 11a)ASTER-WV-2ROIs co-located with the purest pixels of the ASTERWVb4 (38), WVb8 (16), ASb8 (12.5), ASb2 (8), ASb5 (7), ASb4 (5.8), ASb6 (4), WVb1 (2.5), WVb3 (2.5), ASb3 (2)62
5 (Figure 11b)ASTER-WV-2ROIs co-located with the purest pixels of the WV-2WVb3 (27.5), WVb8 (19), ASb9 (18), WVb5 (17.8), ASb6 (5), WVb4 (4), WVb1 (3.5), ASb2 (1.4),70
6 (Figure 11c)ASTER-WV-2ROIs co-located with ground samplesASb4 (25.5), ASb1 (22), ASb5 (20), ASb2 (11.11), ASb9 (9.4), ASb6 (5.3), WVb3 (3.6), WVb1 (2)100
AS, ASTER; WV, WV-2; b, band; numbers inside parenthesis show the relative contributions (%) of the variables.

