Critical Metadata for Spectroscopy Field Campaigns


Abstract
: A field spectroscopy metadata standard is defined as those data elements that explicitly document the spectroscopy dataset and field protocols, sampling strategies, instrument properties and environmental and logistical variables. Standards for field spectroscopy metadata affect the quality, completeness, reliability, and usability of datasets created in situ. Currently there is no standardized methodology for documentation of in situ spectroscopy data or metadata. This paper presents results of an international experiment comprising a web-based survey and expert panel evaluation that investigated critical metadata in field spectroscopy. The survey participants were a diverse group of scientists experienced in gathering spectroscopy data across a wide range of disciplines. Overall, respondents were in agreement about a core metadataset for generic campaign metadata, allowing for a prioritization of critical metadata elements to be proposed including those relating to viewing geometry, location, general target and sampling properties, illumination, instrument properties, reference standards, calibration, hyperspectral signal properties, atmospheric conditions, and general project details. Consensus was greatest among individual expert groups in specific application domains. The results allow the identification of a core set of metadata fields that enforce long term data storage and serve as a foundation for a metadata standard. This paper is part one in a series about the core elements of a robust and flexible field spectroscopy metadata standard.
1. Introduction
1.1. The Importance of Field Metadata
Field spectroscopy metadata consists of those data elements that explicitly document the spectroscopy dataset and field protocols, sampling strategies, instrument properties and environmental and logistical variables. Spectroscopy metadata is integral to the fitness-for-purpose of the spectral measurements. Standards for field spectroscopy metadata affect the quality, completeness, reliability, and usability of datasets created in situ. Intercomparison and interoperability of field spectral datasets are therefore dependent upon the standards defined by the remote sensing community and implemented by field operators. Any metadata standard for in situ field spectroscopy adopted by national or international bodies must address the unique aspects and impact of field metadata on any datasets derived from it.
Field spectroscopy serves as a fundamental stage for primary research into remote sensing practice and operational applications, such as for calibration and validation [1–3]. Spectroscopy protocols practiced worldwide record metadata relating to the instrument properties, illumination and viewing angles, reference standards and general project information on an ad hoc basis [4–6] in a variety of formats including logsheets, and occasionally, databases. It is widely acknowledged that instrument and study design influence the spectral measurements obtained and should be documented to identify their impact in the experiments and allow intercomparison of datasets [7–11]. The impact of these variables across datasets has not yet been fully identified within the remote sensing community nor can it be properly quantified in many instances. Understanding these variations requires recording adequate metadata to ensure intercomparability and reliability of field spectroscopy data.
While most users recognize that the time invested in metadata collection is surpassed by its benefits in reducing system bias and variability [12], standards and techniques to facilitate easy recording of this data are required. NASA’s ESDIS (Earth Science Data and Information System) Project and Australia’s TERN (Terrestrial Ecosystem Research Network) are continually investigating new ways of overcoming the challenges of effectively integrating, modeling, and sharing Earth observation data from a broad of range of sensors, a component of which are in situ sensors and their associated metadata.
The completeness and quality of metadata are central to designing a common platform for the exchange and sharing of in situ datasets within the remote sensing community on a global basis. Metadata can be recorded before, during, and after a campaign is implemented, depending on the time-sensitive nature of the metadata, and whether it is practical to record concurrent with a measurement campaign (rather than being input from an existing database post-campaign).
A standardized methodology for defining and storing metadata must be closely aligned to in situ data collection practices, but currently, there is no agreement on methodology for documenting in situ spectroscopy metadata. To address the requirements for efficient and viable intercomparison and fusibility of datasets generated from quantitative field observations, it is necessary to identify and describe the unique conditions under which each field spectroscopy campaign operates. The aim of this paper is to define the critical metadata for field spectroscopy campaigns that will support any in situ field spectroscopy metadataset.
1.2. The Unique Metadata Requirements for Field Spectroscopy Campaigns
An inclusive, flexible, and practical metadata standard must encompass both generic and application-specific requirements for each in situ campaign. The variability in spectroscopy protocols practiced worldwide is not sufficient to guarantee consistent measurement and output, even when the target is a controlled variable. For example, consider a simple scenario with a single non-variant object, in which fifteen spectroscopy laboratories using the same instrument, targets, and a consistent instrument calibration protocol recorded the spectral reflectance of the targets [13]. A marked variation in output reflectance was measured, suggesting the possibility of differences in interpretation among the different spectral libraries in which the measurement is stored. These results demonstrate the effect of inconsistent sampling and measurement protocols and when these protocols remain undocumented through metadata, valid intercomparison of datasets is compromised. In such cases metadata does not guarantee mitigation of the effects of sampling protocol on the spectral measurements as practiced by one laboratory versus another, but can serve to provide information on the source of inconsistencies between datasets.
1.3. Current Metadata Archiving Activities within the Field Spectroscopy Community
The absence of a central archiving apparatus either for a specific campaign or on an international scale is a barrier to the efficient archiving of metadata by field spectroscopy scientists. Popular avenues for storage include excel files, text documents, and sometimes the metadata is automatically generated by the instrument itself, such as the binary files containing instrument make and model, detector, bandwidth, and spectral range information. Recent developments in relational spectral databases include the publicly accessible DLR Spectral Archive [14] and SPECCHIO [15], as well as others designed in-house for organizations engaged in field spectroscopy research; these have allowed a more structured storage for spectral measurements and their associated metadata [12,16]. They support the storage of a subset of metadata elements intended for a specific range of campaigns (such as vegetation or mineralogy) according to de facto standards. None, however, have a full suite of standard metadata definitions.
1.4. Relevance of Metadata Data Standard Initiatives to Field Spectroscopy
Metadata modelling techniques and standards have been proposed by numerous bodies overseeing and advising the geospatial sciences but fail on several fronts to address the relevant aspects of field spectroscopy datasets. Many are based on the ISO 191—standard family relating to storage, encoding, and quality evaluation of geographic data. OGC (Open Geospatial Consortium) and INSPIRE (Infrastructure for Spatial Information in the European Community) have both adopted architecture and data interoperability protocols for geospatial metadata based on EN ISO 19115 and EN ISO 19119 [17,18]. Although providing general guidelines, neither of these explicitly address the metadata requirements of field spectroscopy, or the ontologies and data dependencies required to model the complex interrelationships among the observed phenomena as data and metadata entities. Weaknesses in field spectroscopy data collection and their implication for the need for a metadata standard have been identified by both users and providers of spectroscopy data, particularly in the European remote sensing community; these include a lack of quality assurance and calibration information for sensors; no real capability to define accuracy or validation for data processing; and a lack of agreed standards in data processing [19]. To solve these problems, a survey of experts in the field is a suitable initial step towards the solution.
2. Methods
2.1. Asking the Experts
To define a common set of metadata standards, we canvassed the opinion of the field spectroscopy science community. We convened an expert panel to help guide us through the process. To establish membership in this group we ensured that one, or more, of the following criteria was met by each participant: (1) be an established investor in the quality of the spectroscopic metadata; (2) have experience in, and possess understanding of theory and methods of spectroscopic data capture; and, (3) express an interest in developing techniques for increased sharing and intercomparison of their datasets with other remote sensing research groups. The group was representative and comprised a broad spectrum of expertise, but was not comprehensive.
A pilot survey was introduced to a group of remote sensing scientists at the 7th EARSeL (European Association of Remote Sensing Laboratories) workshop in Edinburgh, Scotland, in 2011. Refinements to the survey were made based on the response from the test group and an improved and expanded online survey was launched later in 2011 in the form of a user-needs analysis for field spectroscopy metadata. The purpose of the survey was to determine, based on the input of experts in the field, the metadata fields that are critical for creating valid and reliable field spectroscopic datasets, with enough integrity to generate datasets for long-term cataloguing and data exchange across a range of campaigns. The audience was an international panel of scientists with expertise in in situ field spectroscopy, who were asked to respond on an anonymous basis. The survey was completed by 90 participants from organizations and institutes with a history of research on the relevant topics and included the NERC FSF (National Environment Research Council Field Spectroscopy Facility, Edinburgh,UK), DLR (German Aerospace Center, Berlin, Germany), CSIRO (Commonwealth Scientific and Industrial Research Organisation, Canberra, Australia), RSL (Remote Sensing Laboratories, Zurich, Switzerland), EPA (Environmental Protection Agency, Washington, DC, USA), and numerous other North American and European university research labs and participants from the commercial sector.
Each participant assessed the criticality of several categories of metadata fields, and could propose additional metadata fields that they believed could enhance the quality of a hyperspectral dataset generated in the field. Open-ended comments were possible throughout the survey for further input in each metadata category. Respondents had the option of participating in the categories of their choice, and were also asked to nominate themselves as experts in one or more areas of field spectroscopy application. This self-nomination of area of expertise did not in any way limit the categories available to each participant, and primarily served the purpose of informing analysis between a participant’s area of expertise and their assessment of metadata criticality. The range of group sizes sampled required both parametric and non-parametric statistical methods to analyze the results.
The metadata fields (approximately 200 in the survey) are closely aligned with common ad hoc field spectroscopy protocols [4–6] practiced by remote sensing communities around the world. Table 1 is a listing of the generic and application-specific metadata categories included in the survey.
Metadata fields presented in the survey could be given one and only one ranking, each defined accordingly:
“critical” (required metadata field for a field spectroscopy campaign; without this data the validity and integrity of the associated spectroscopy data is fundamentally compromised);
“useful” (not required, but enhances the overall value of the campaign);
“not useful now but has legacy potential” (not directly relevant to the associated field spectroscopy data but potentially has use for a related hyperspectral product);
“not applicable” (this metadata is not relevant)
These four rankings were chosen to inform a prioritization model for criticality for a metadata standard.
2.2. Building a Core Metadataset
For each subset of metadata, whether in the generic or application specific categories, a criticality index of four measures (“critical”/“useful”/“not useful now but has legacy potential”/“not applicable”) was used by each respondent. The ordinal criticality rankings were standardized to numerical values (ranging from 0 for “N/A” to 3 for “critical”) to permit statistical analysis of variance. The ordinal and non-parametric nature of the data necessitated a suitable suite of tests that could adjust for the scale of measurements in each metadata category and permit repeatability and intercomparison for all categories. To determine which metadata fields in each category should be included in a metadata standard, two phases of analysis were required. The first phase of analysis was conducted using a stringent test for calculating the likelihood of a dichotomous outcome—either a field must be included in a metadata standard (the “critical” fields extracted from the responses) or it is excluded—and this was achieved via binomial analysis. The second phase identified additional metadata fields that demonstrated ranking aberrant to the other fields in the category; this was accomplished via scale statistics for describing internal consistency and interrelation between items in a given category; in other terms, the usefulness of every metadata item being in that particular category. Scale statistics examined those items that generated relatively extreme values for Corrected Item-Total Correlation and Cronbach’s Alpha, or a strong effect on the scale mean and variance if they were deleted. Cronbach’s Alpha, α, is a reliability coefficient that is a useful measure of internal consistency of inter-rater agreement [20,21] on the metadata fields in each category, and ranges from 0 ≤ α < 6 for unacceptable and/or poor internal consistency and any value α ≥ 0.9 is considered excellent. Identifying those metadata fields that have the strongest effect on the inter-rater agreement levels by their effect on Cronbach’s Alpha if they are removed warrants investigation as to why they exhibit a trend of rating different from other metadata fields in that category, and invites consideration for their exclusion from the category or potentially being assigned a status more important than the other items. Levels of agreement between respondents were measured using the intraclass correlation coefficient (ICC) [22]. This method was most amenable to the ordinal rankings and adjusted for the scale of measurement, which varied across the metadata categories.
3. Results and Discussion
Figure 1 identifies the areas of expertise of the participants. Each respondent was asked to designate themselves as experts in one or more fields. Areas of spectroscopy research beyond this scope, as stated by the respondents, included atmospheric studies, calibration and validation activities for airborne sensors, and wetlands and peatlands research (all grouped within the “other” category). The largest groups of experts were from agriculture (40), forest/woodland (39), and soils (27). The smallest sample was from the snow research area (2).
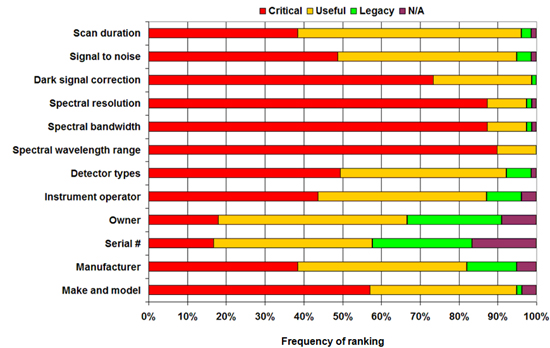
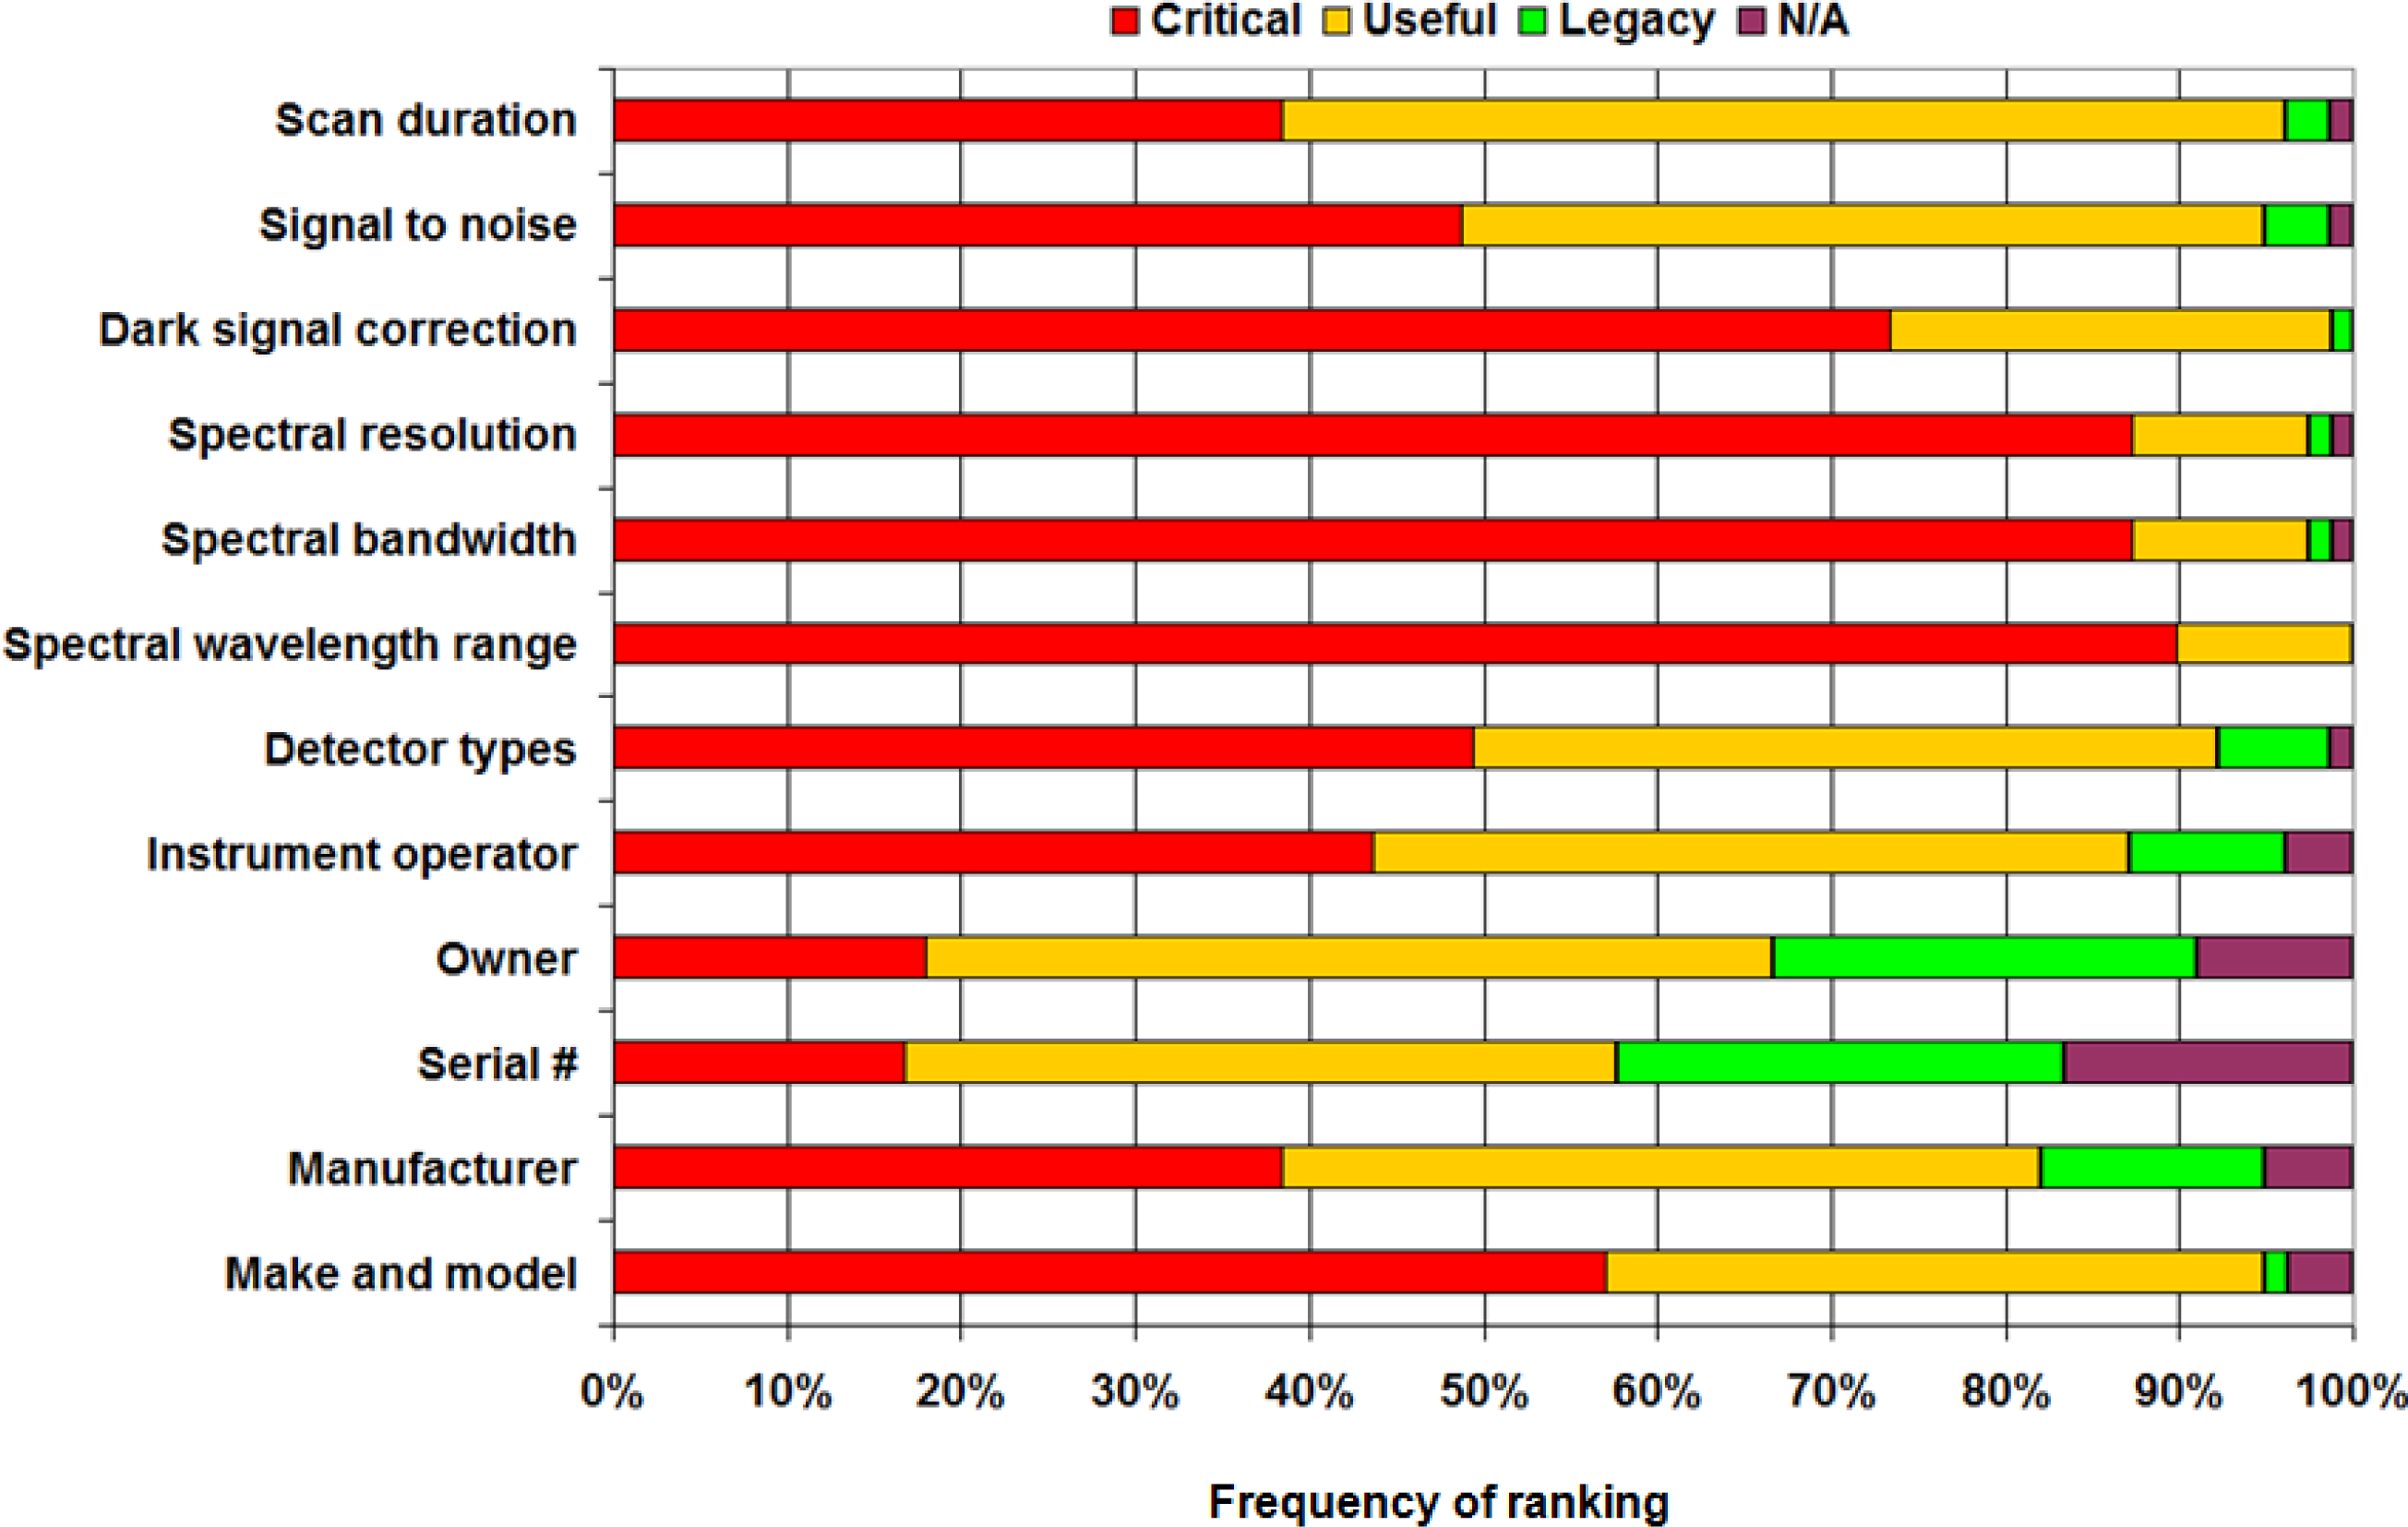
The survey was divided into two main metadata categories—generic and application specific (Table 1). Generic campaign metadata refers to subsets of metadata common to all campaigns, regardless of the target or purpose for collection and includes, for example: instrument (Figure 2), calibration (Figure 3), reference standards, and viewing geometry information. Application specific metadata is associated with the purpose of the campaign and the type of target being measured; this category is separated into subsets including vegetation, snow, soil, mineral exploration and marine targets. Variation in ranking of criticality varied for each metadata category. As examples, Figures 2 and 3 depict the frequency of ranking for two subsets of generic campaign metadata fields in the “instrument” (2) and “calibration” (3) metadata categories, responded to by the scientists.
In the “instrument” category, assignment of “critical” to a given metadata field ranges from 90% for “spectral wavelength range” to less than 20% for (instrument) “serial number”. The former field is highlighted as the only one with no “N/A” or “legacy potential” ranking, suggesting that it is regarded as a fundamentally crucial metadata field and warrants inclusion in all in situ metadata protocols. The latter field, “serial number” implies that it is not perceived as important to respondents, despite its crucial role in databases and other information systems in tracking the history of use and calibration of an instrument.
In the “calibration” category, there is a lower disparity in assignment of “critical” ranking across the fields with a range between 70% (“radiance”) to 32% (“stray light”). This implies a greater degree of consensus opinion on the influencing factors of calibration activities on both the hyperspectral data and the end-products for which the data and metadata will be utilized, e.g., end-member retrieval, land cover classification, satellite sensor validation and BRDF modelling. It must be noted that different interpretations of a given metadata element as well as the number of metadata elements provided in a category may influence their ranking by some respondents.
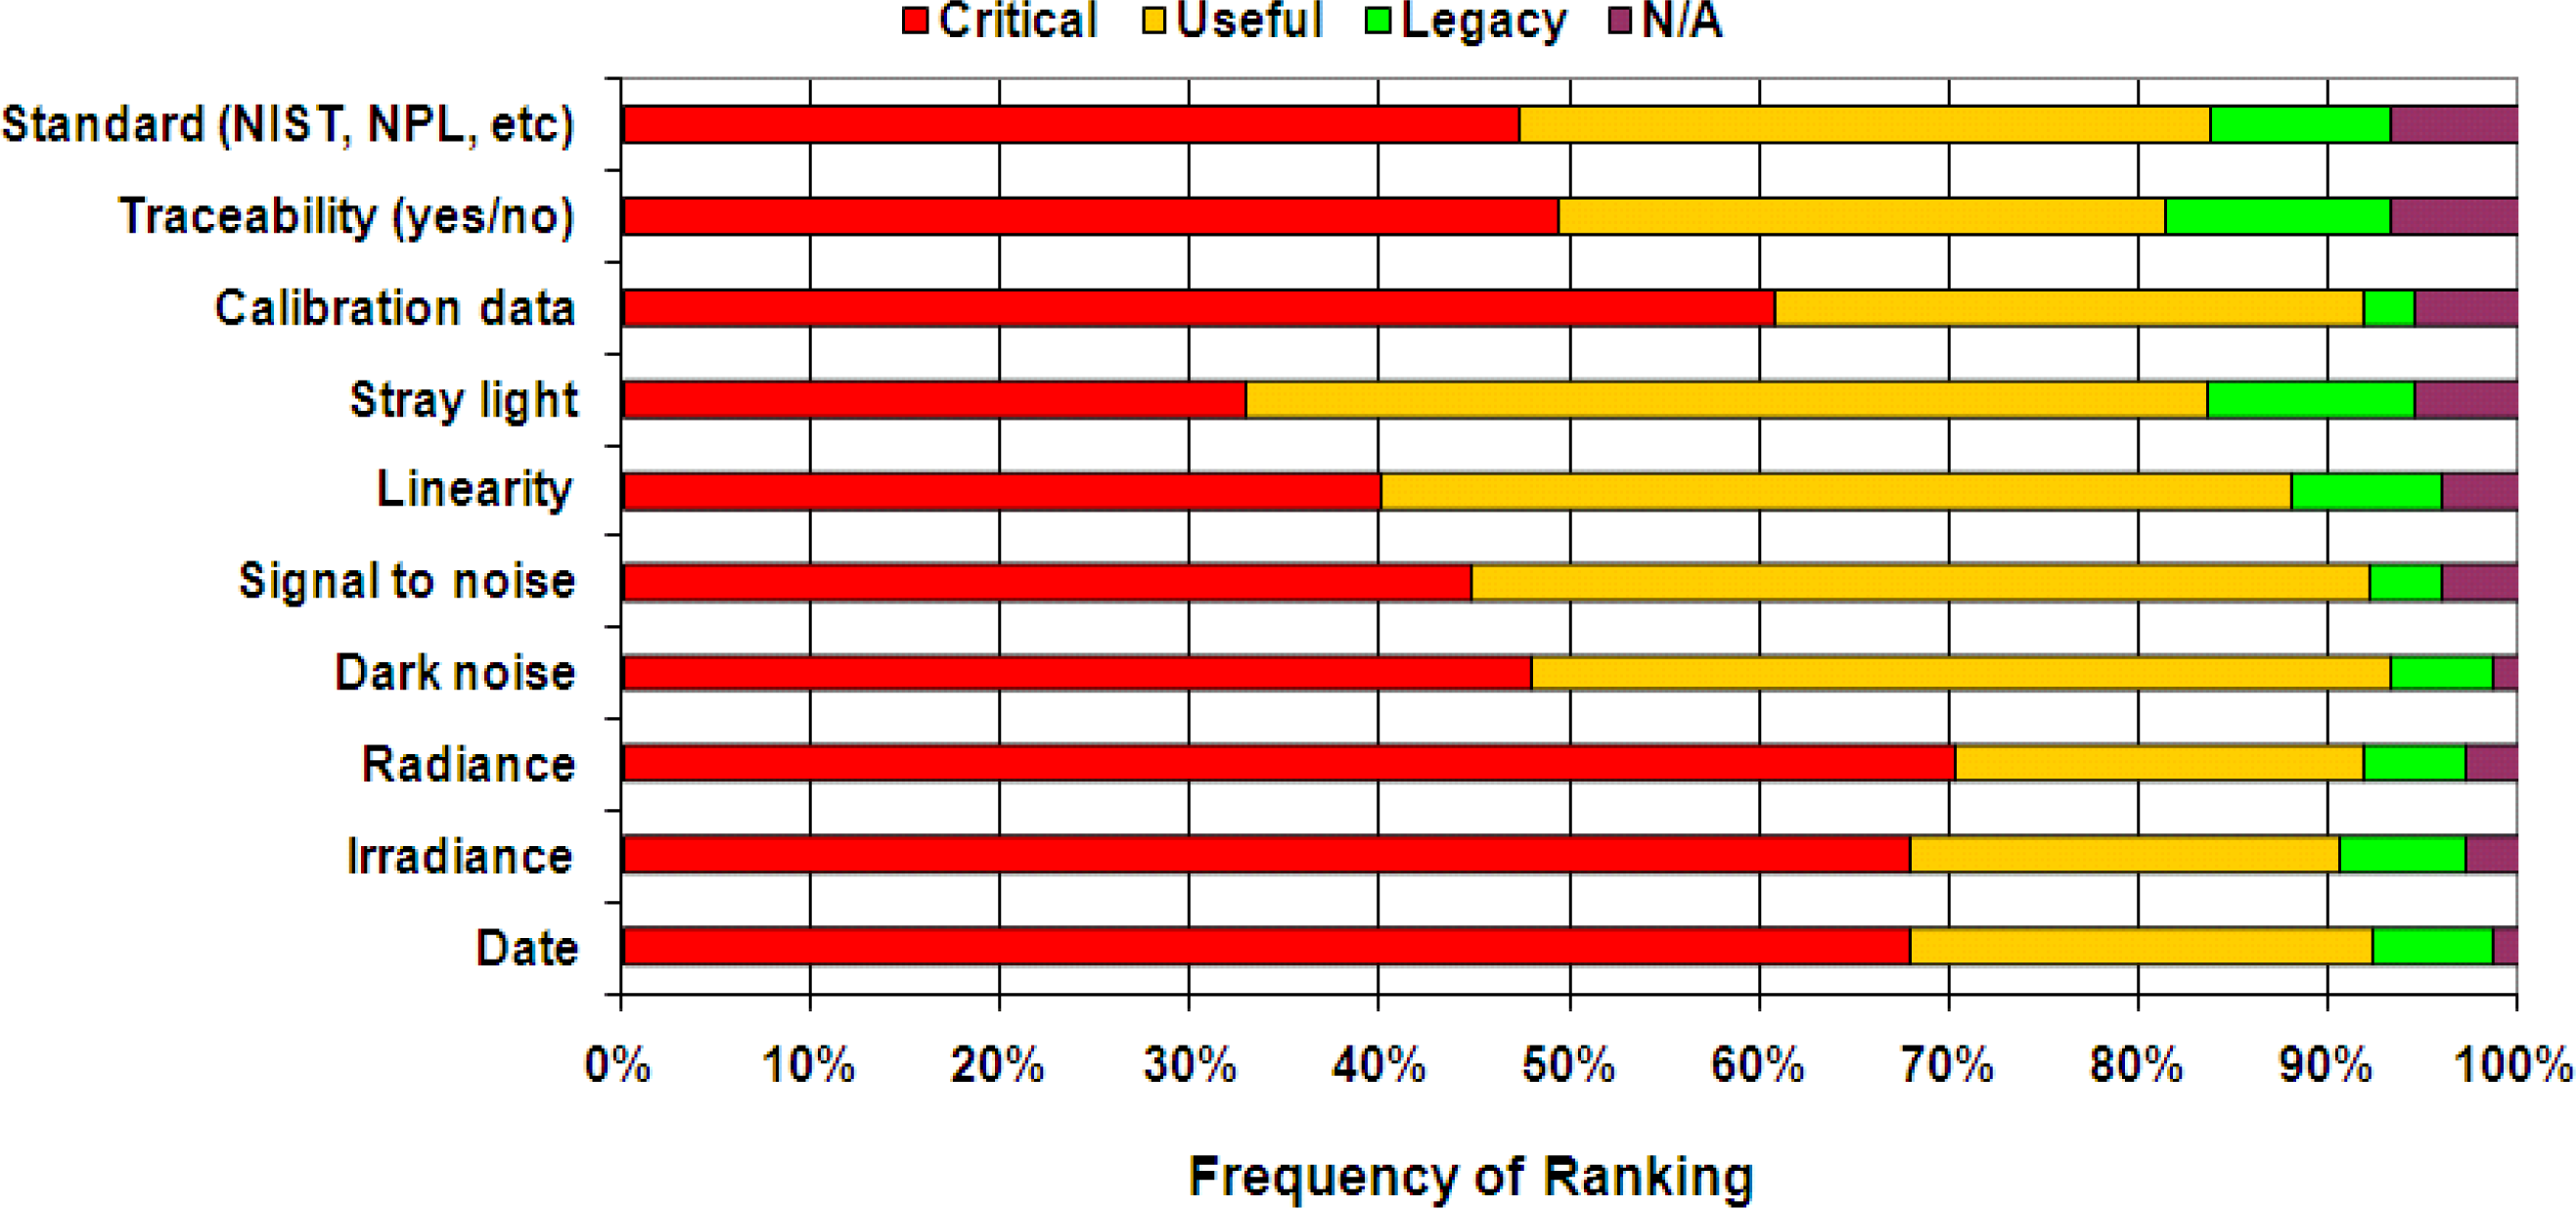
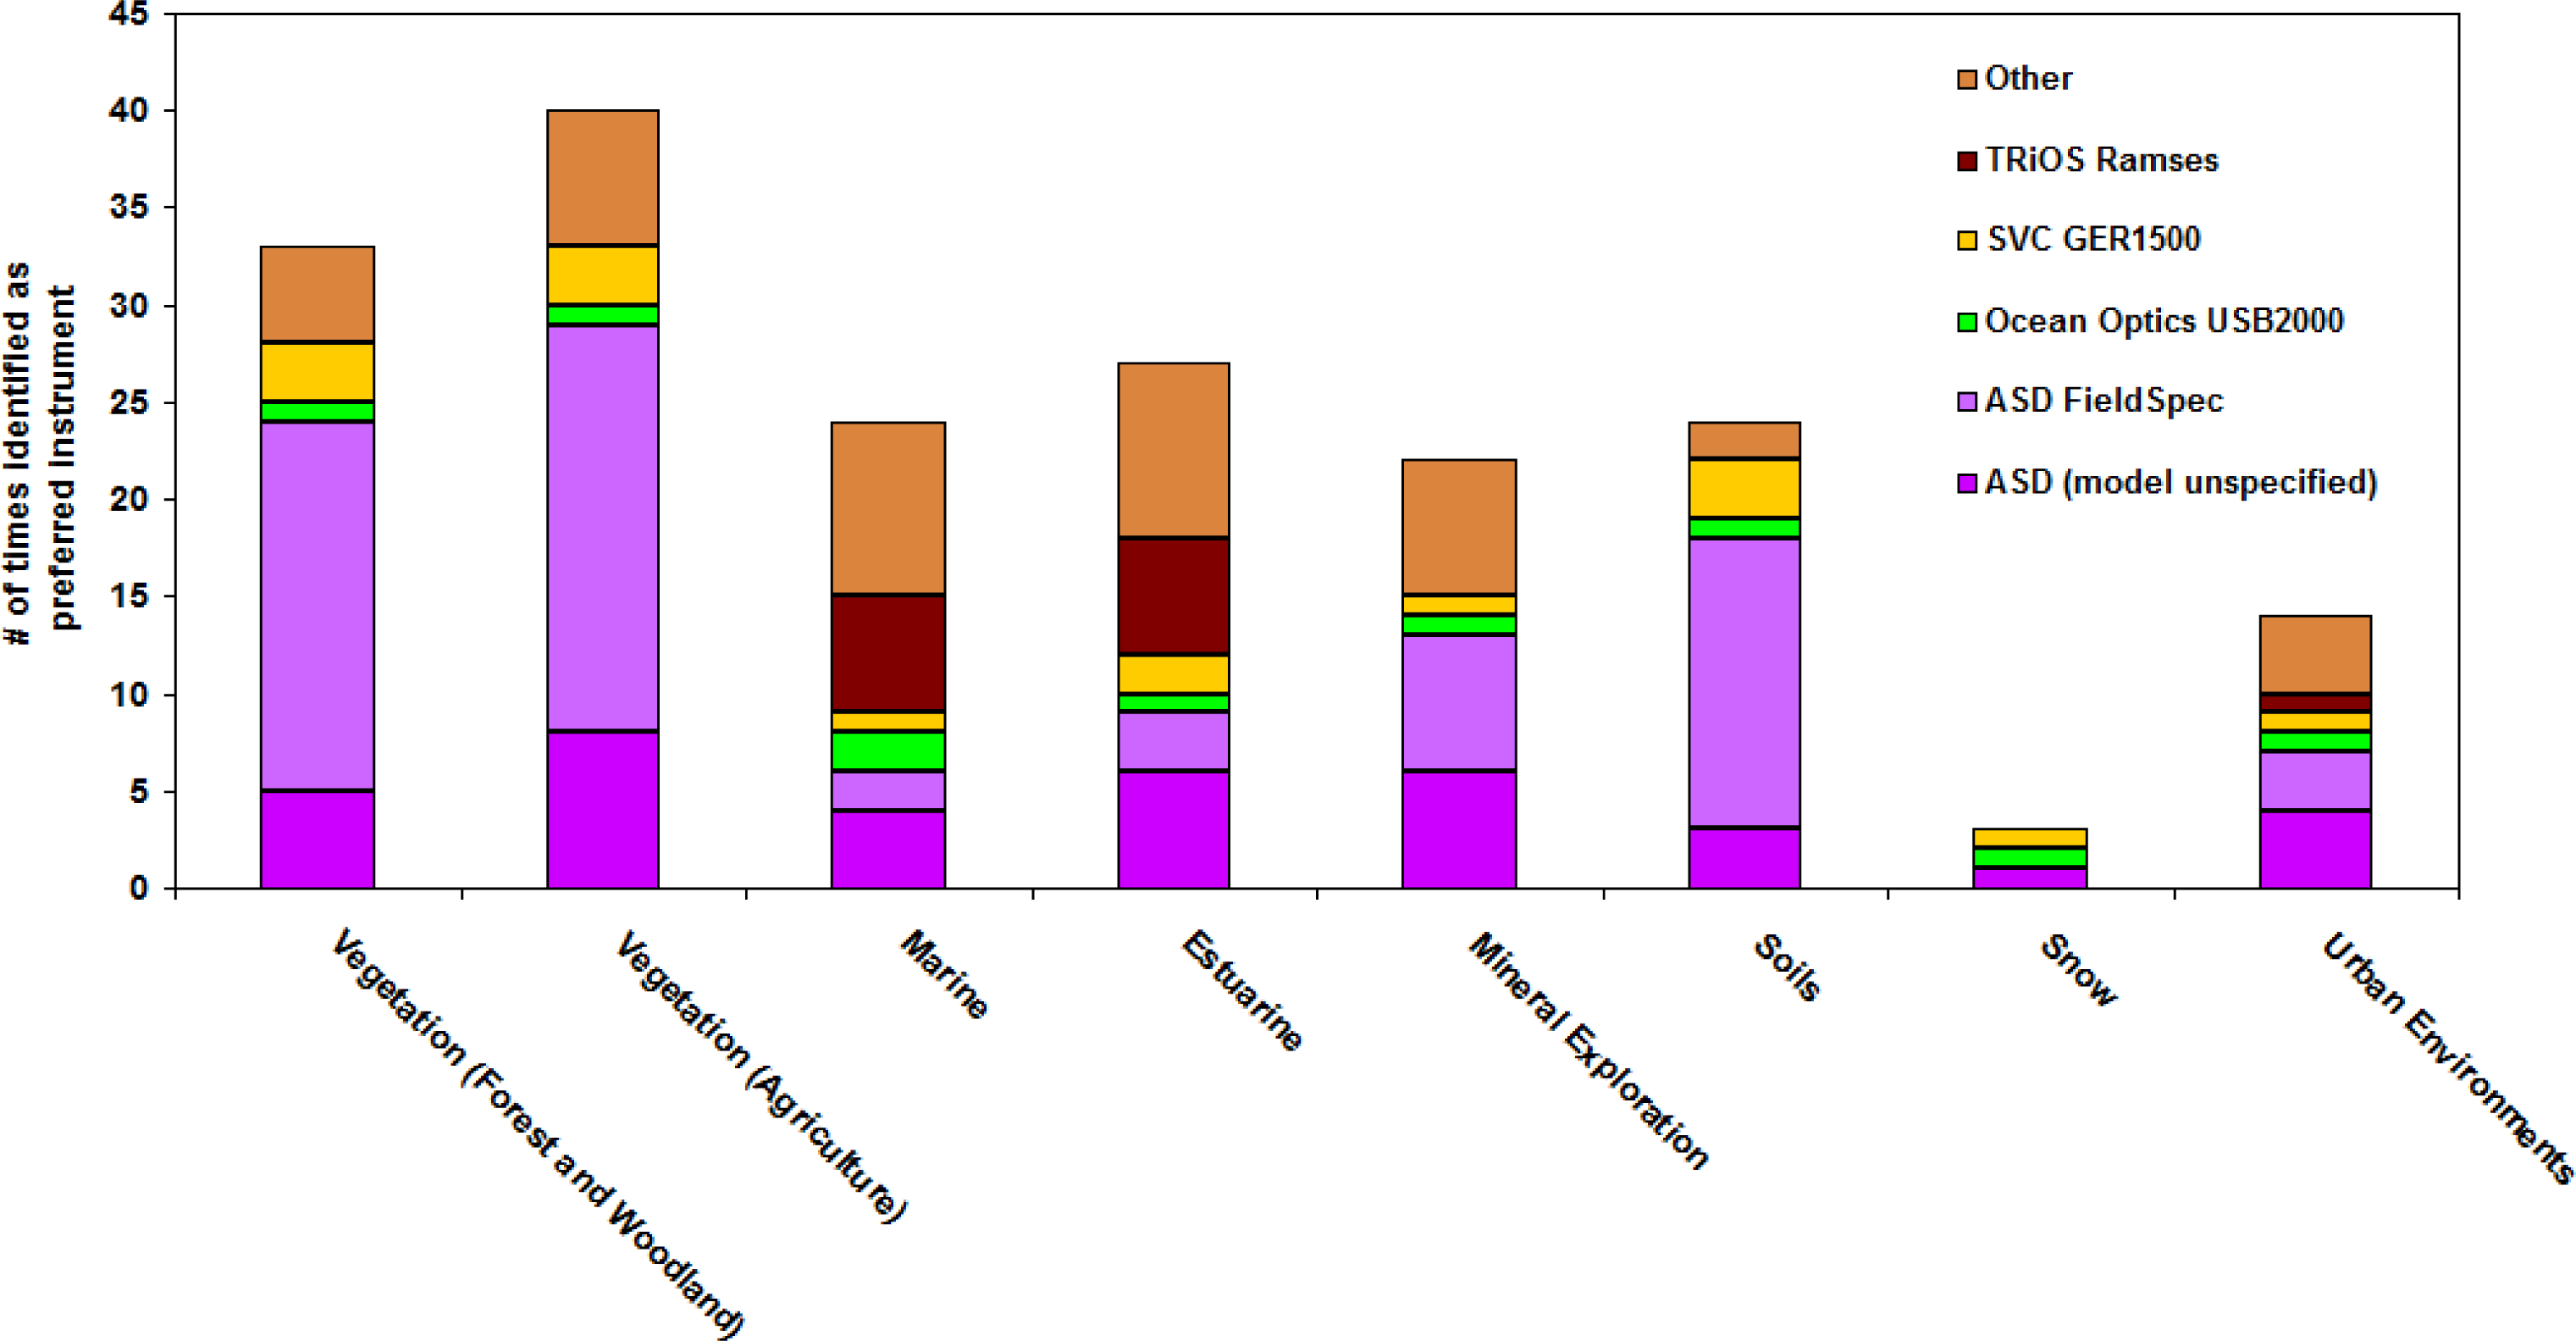
Some of the variation in the “instrument” category may be accounted for by the choice of instrument listed by the participants of the survey; more than twenty different instruments were identified as being commonly used for in situ campaigns, with the top four being ASD models, Ocean Optics USB2000, SVC GER1500, and TRiOS Ramses, in addition to others designed in-house. Figure 4 shows preferred instruments by expert group. The unique technical aspects of each instrument may have a bearing on the particular metadata fields that an operator chooses to include in their metadataset; these may include instrument housing (for extreme weather conditions or non-terrestrial campaigns), the degree to which an instrument has been customized for a particular application and whether it is a prototype, and sensor behavior affected by manufacturer designs.
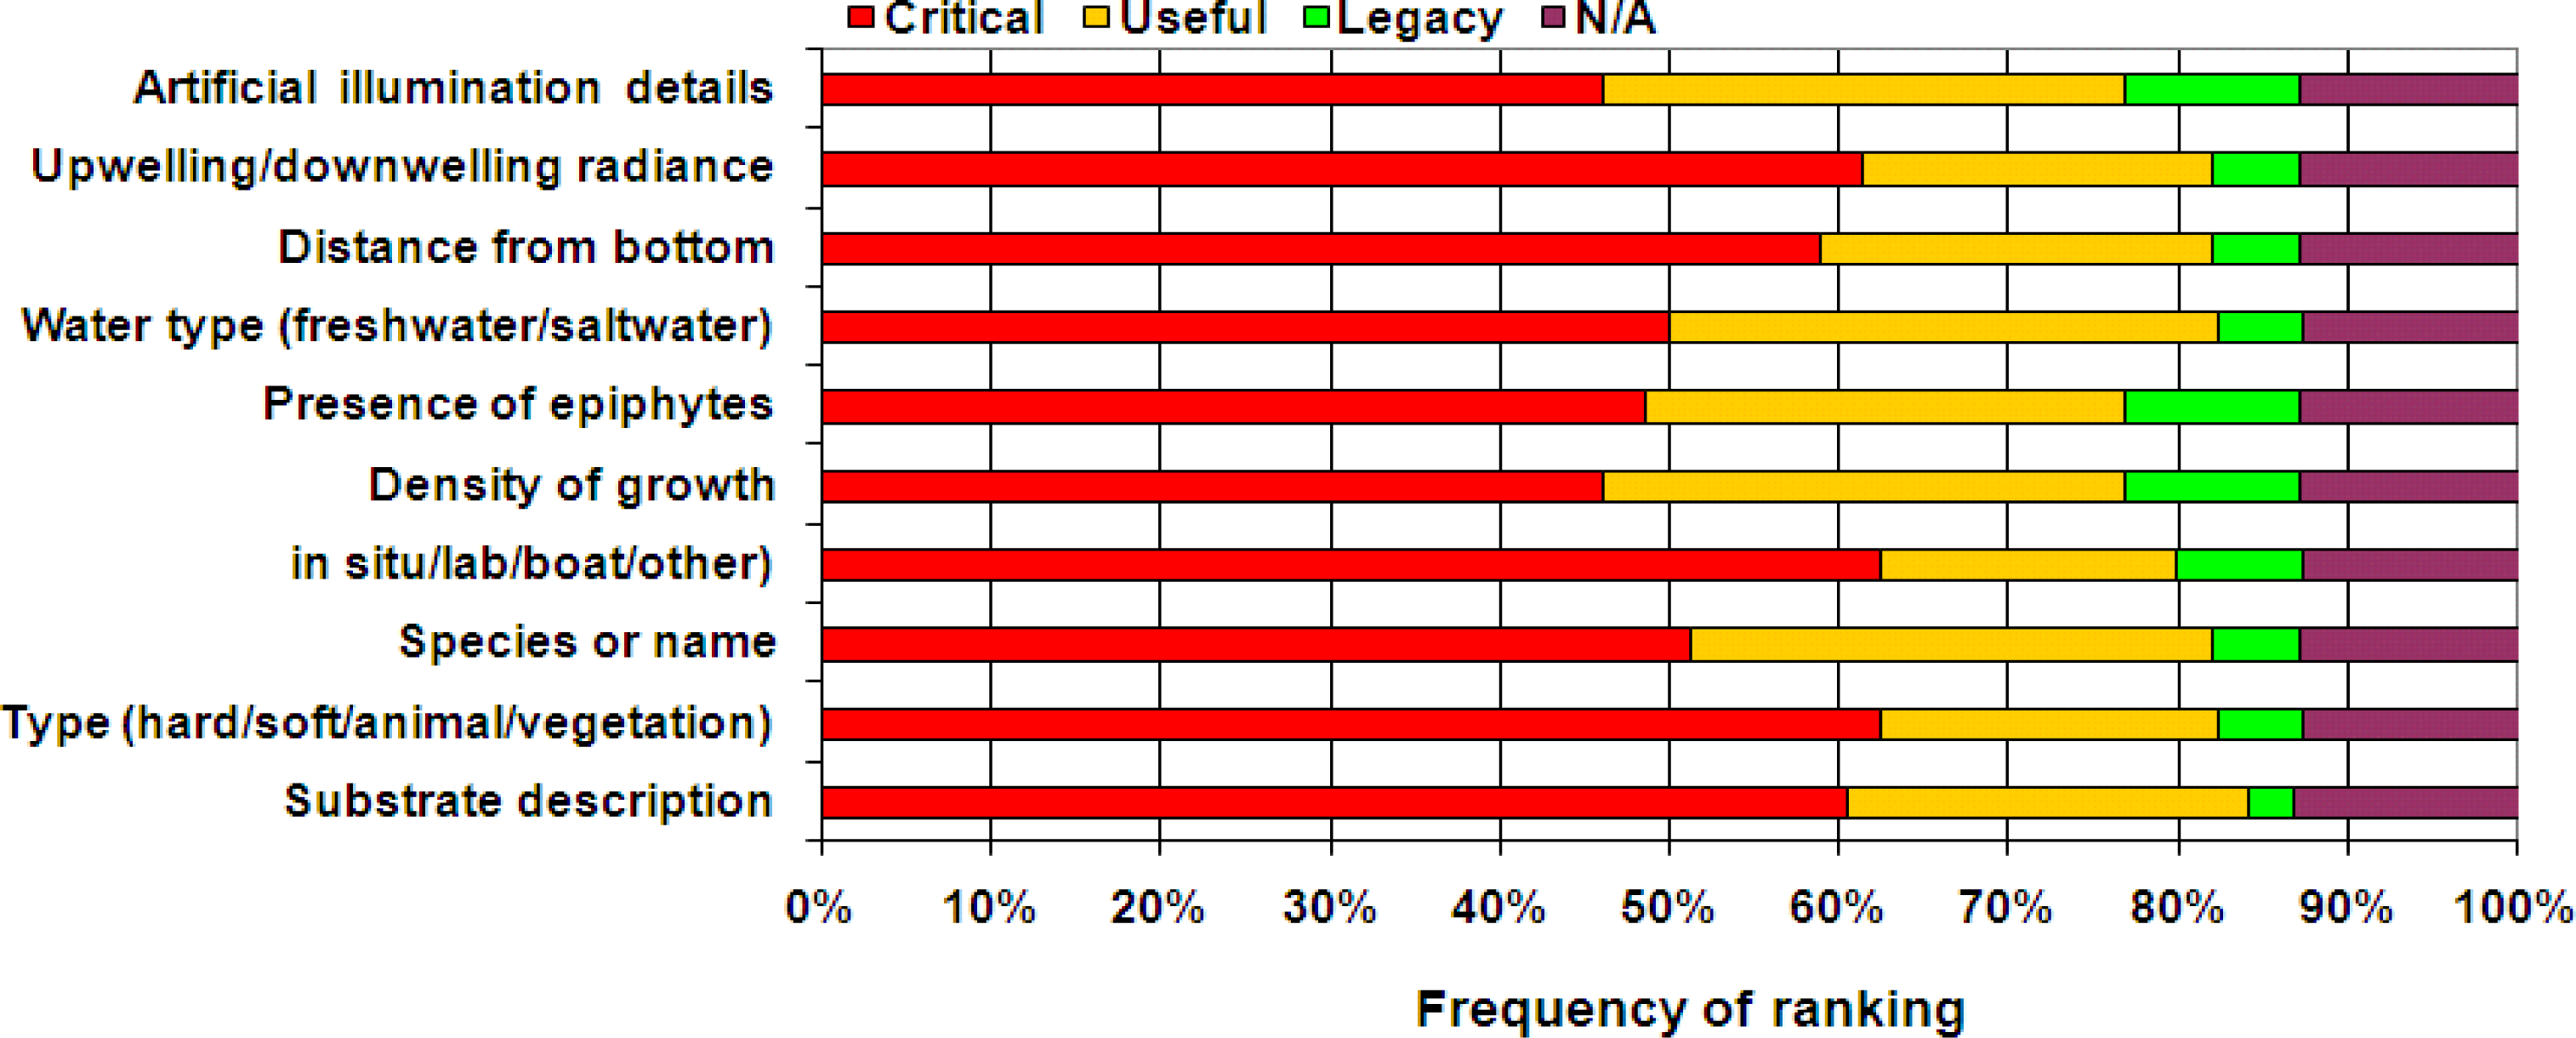
Figure 5 depicts the frequency of ranking for marine “substratum target” metadata which was responded to by a smaller population of scientists (40). The substratum target metadata category most commonly refers to submerged biological marine targets such as seagrass and corals, but can include any target on a submerged surface. For all fields in this category, there was a greater consensus between the four available rankings than in the non-specialized metadata categories, and further investigation revealed that most of the “N/A” rankings were assigned by respondents whose primary expertise lay outside of the marine sciences. Among the metadata fields presented throughout the survey, from generic campaign to specialized campaign categories, every field was designated as “critical” by at least a small subset of respondents, regardless of their area of expertise.
The results also indicate that group membership has an impact on the degree of variance in response. Variance in response among expert groups is demonstrated in generic metadata categories relevant to all application areas, and increases in specialized and application-specific metadata categories. An example among the marine and estuarine scientists demonstrates the variability in their responses from the other expert groups, with group differences between the two being amplified in the marine-specific metadata categories. In the viewing geometry metadata category, group means ranged between “useful” and “critical” for both the marine and non-marine scientists. The non-marine scientists rated “distance from target”, “distance from ground” and “area of target in FOV” as “critical” more often than the marine group. There was more agreement in the metadata fields relating to solar and sensor angles, suggesting that regardless of a respondent’s area of expertise, metadata relating directly to reflectance anisotropy, either in the atmosphere, water column, or due to the target surface properties, is of equal importance to all campaigns. Variance in criticality ranking for viewing geometry metadata was consistently higher among non-marine scientists, implying that there exists greater consensus among field spectroscopy scientists from the same expert group.
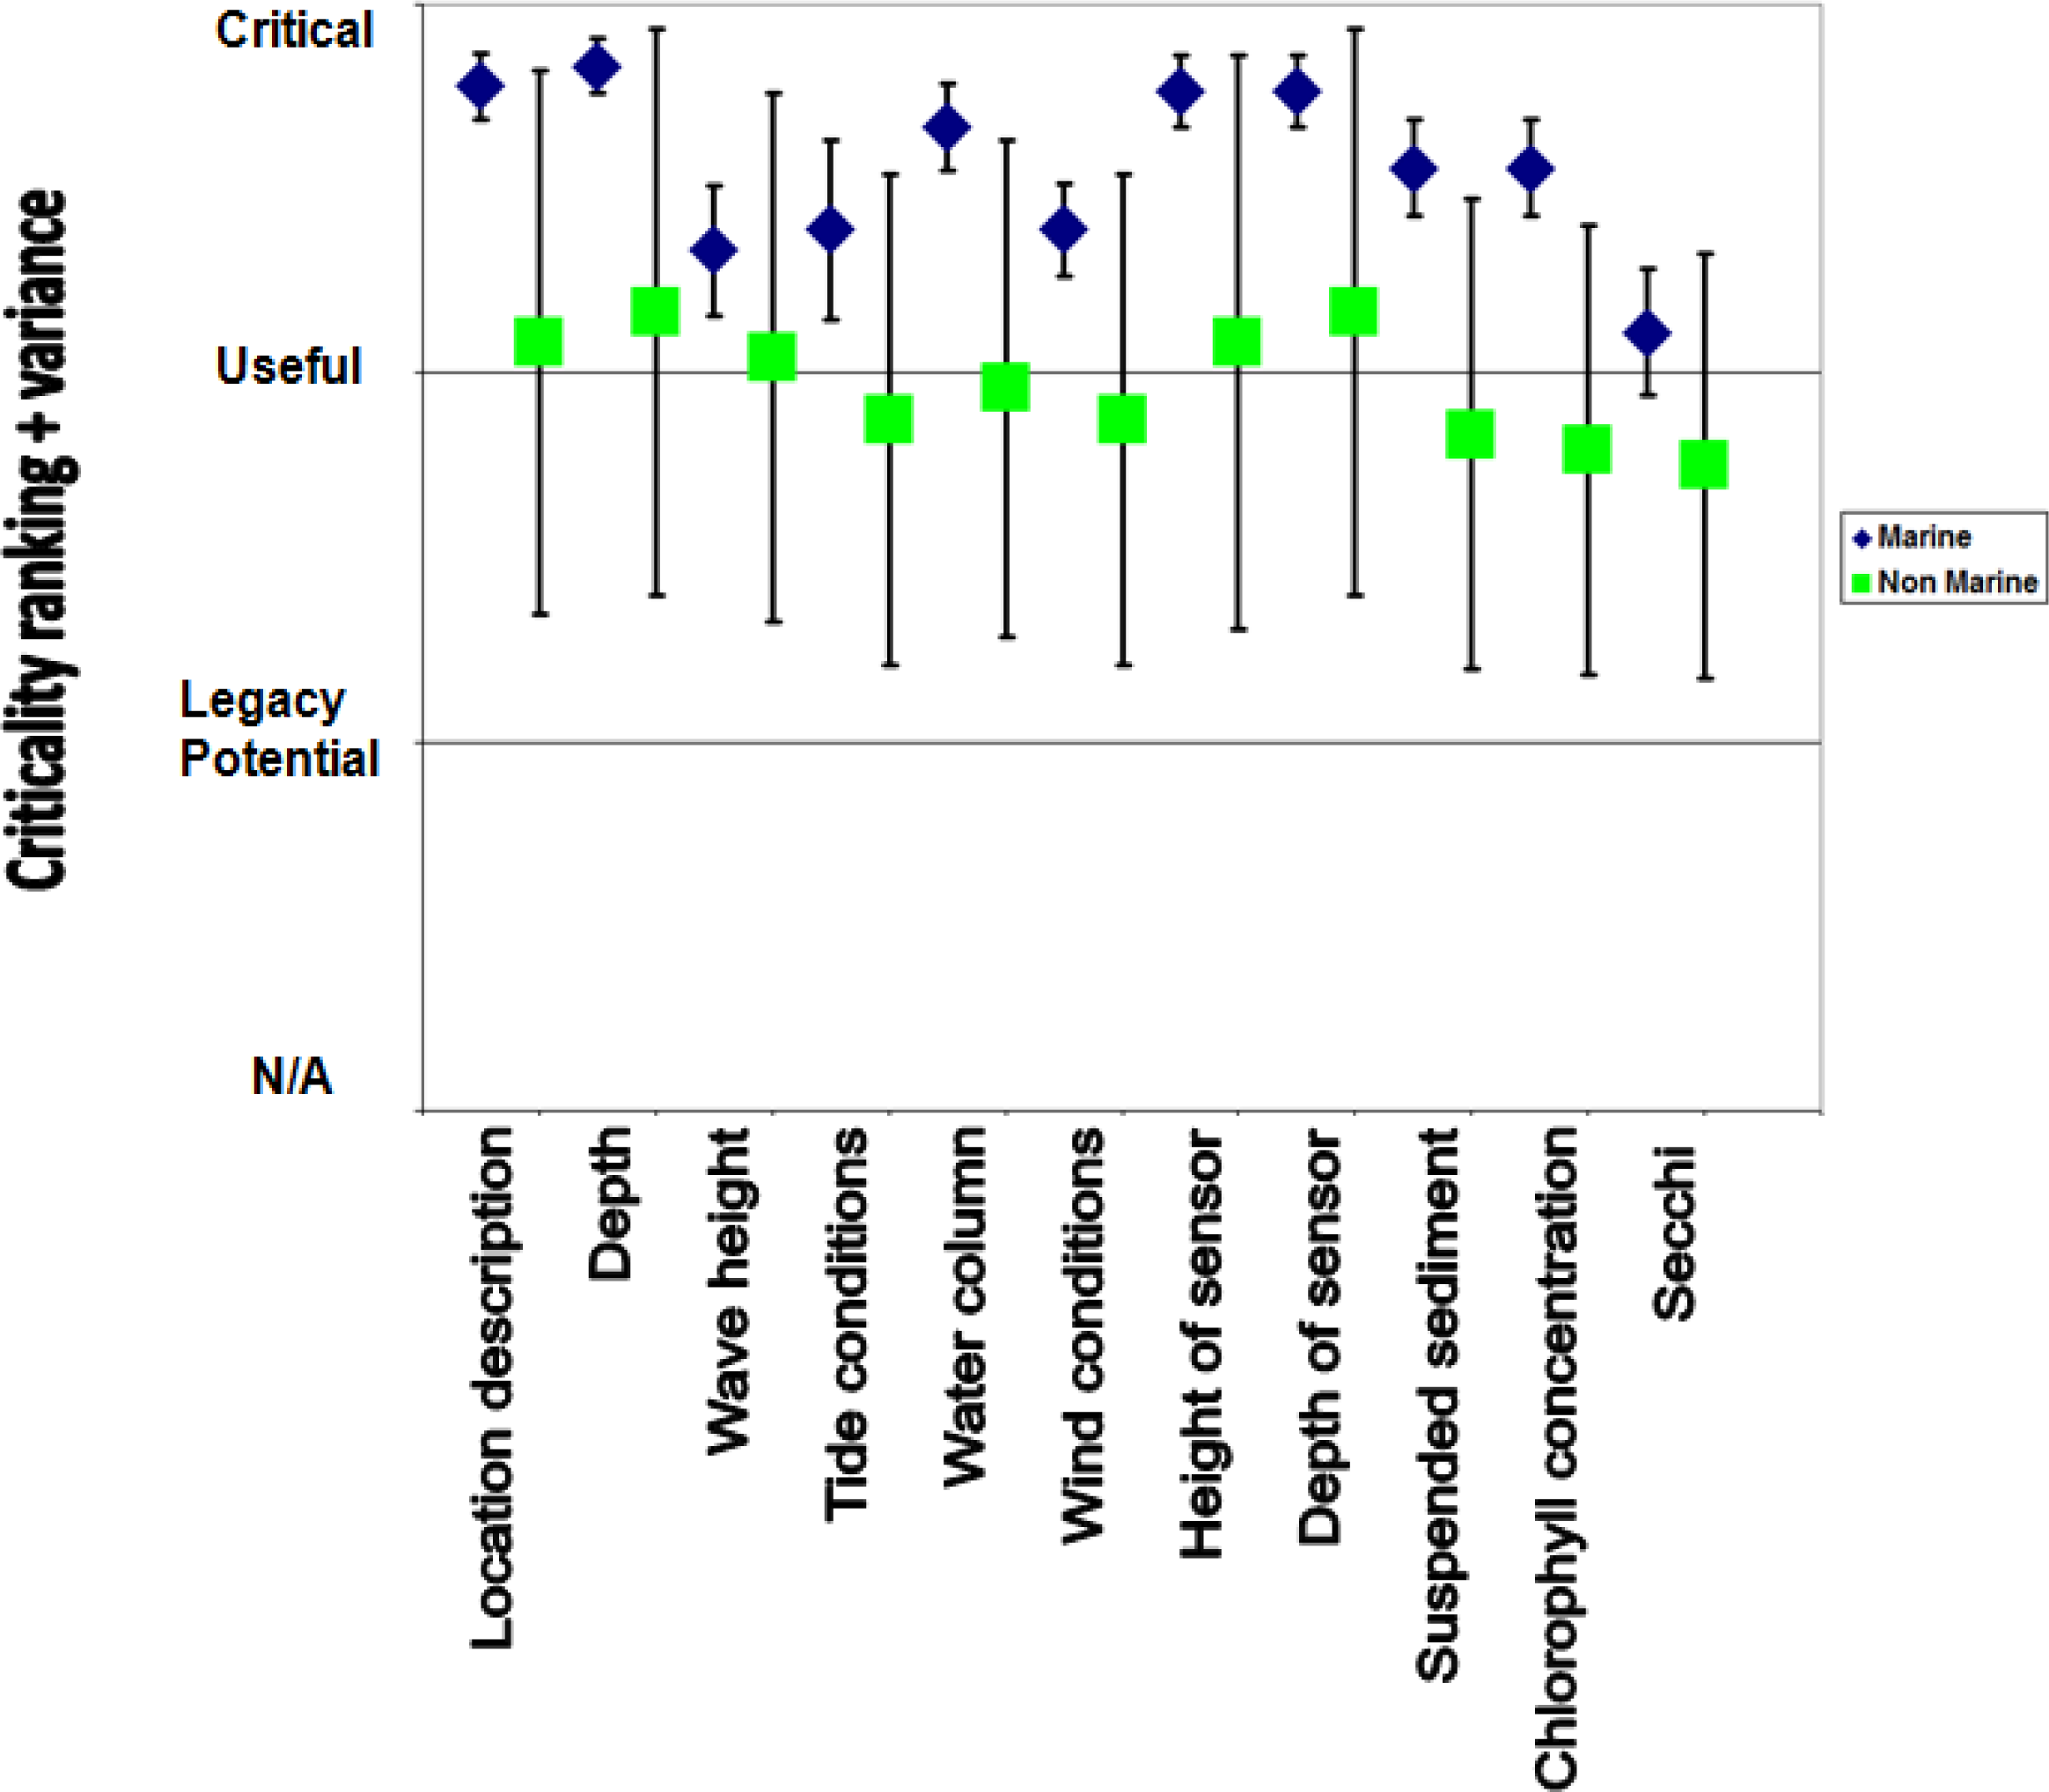
Figure 6 illustrates group means and group variances for criticality rankings in the “marine and estuarine environmental conditions” metadata category. This is a more specialized campaign category, where it can be justifiably assumed that the marine scientists have a better informed opinion as to the metadata that most impacts the validity and reliability of in situ marine datasets. The group mean rankings for marine scientists were uniformly higher for all metadata fields in this category, and variance was uniformly lower than for rankings assigned by non-marine scientists. Underwater campaigns can vary in terms of the application of the data being investigated and the protocol necessary to capture the required data. Targets can include seagrass, macro-algae, corals and sponges and spectral measurements may be taken above surface or below surface: opinions differ on how inclusive a metadataset must be to document environmental and target properties [4,23]. The unique complexities of measuring targets and controlling influencing variables in a marine environment can be understood best by the scientists with in-field expertise. These considerations and the results of the survey strengthen the implication that consensus and agreement are dependent upon the respondents’ area of expertise.
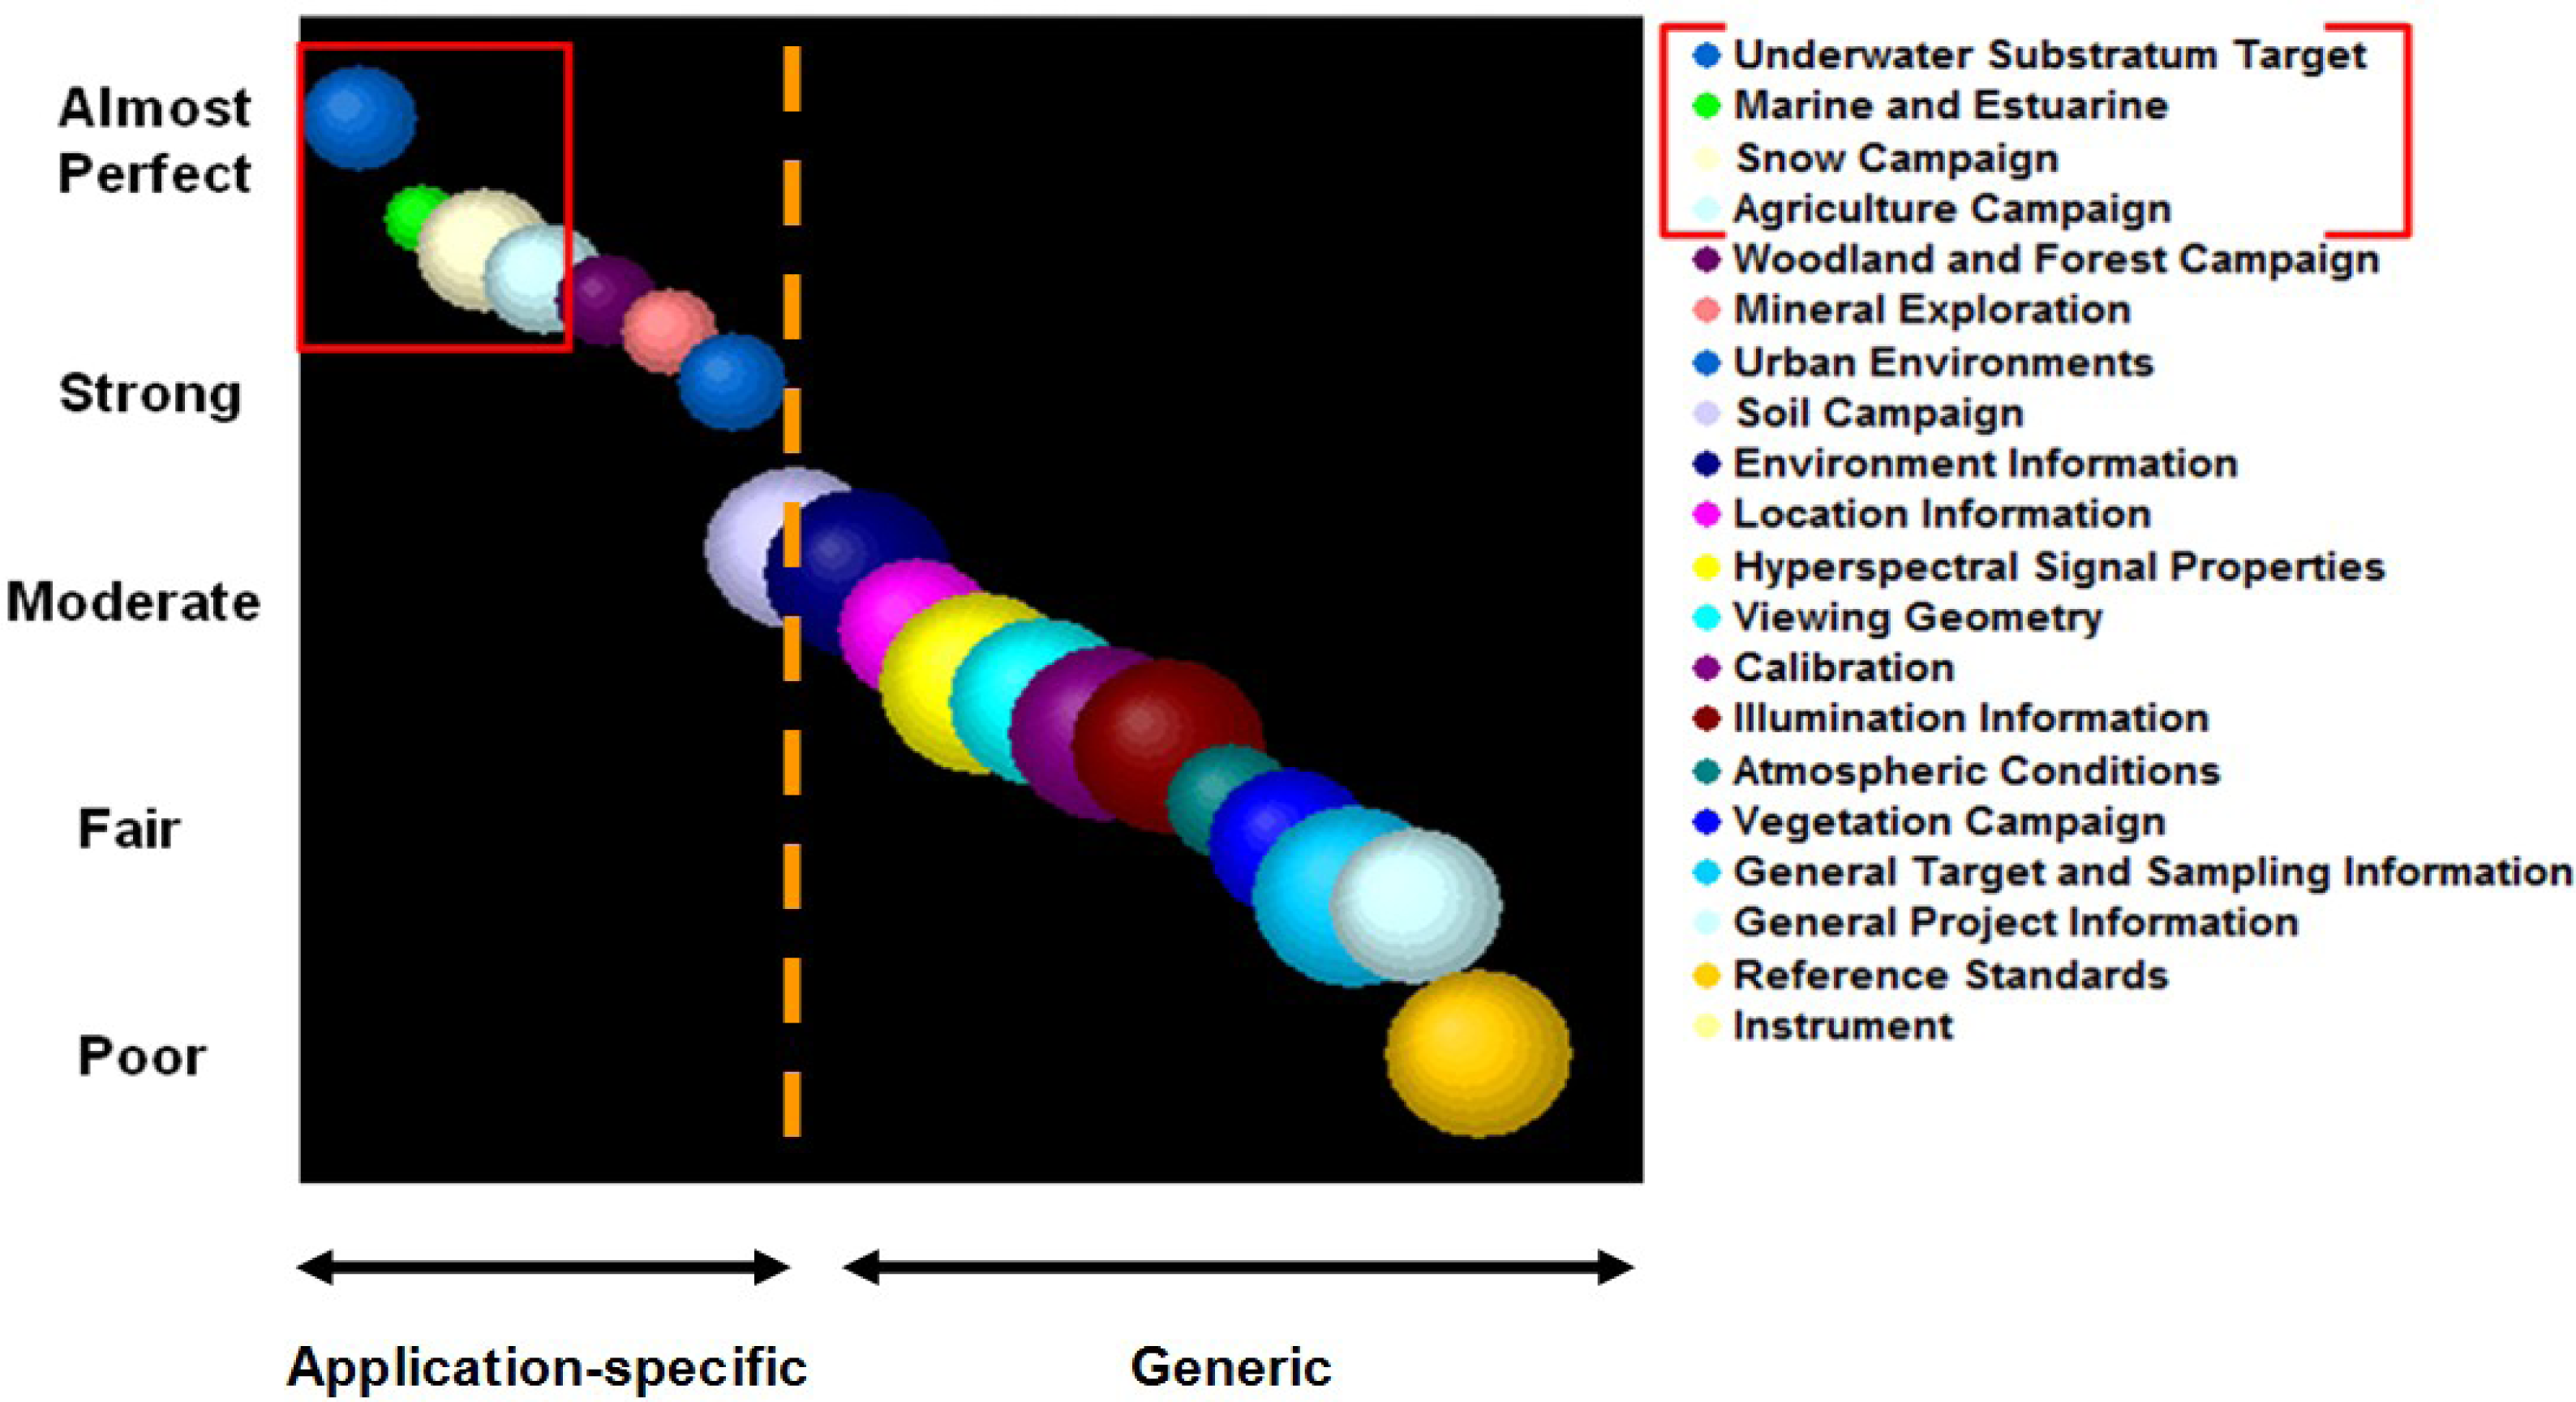
Figure 7 shows a measure of consensus among the respondents (ICC), from highest to lowest, across the metadata categories. The results of consensus analysis reveal that the overall trend for consensus is determined mostly by the population size and composition of the respondents for each group. Generally, the smaller and more specialized the expert group and the more specialized the metadata category, the higher the degree of consensus within it. The four metadata category groups with almost perfect consensus (highlighted in red) were “Underwater Substratum Target” (ICC = 0.922), “Marine and Estuarine” (ICC = 0.847), “Snow Campaign” (ICC = 0.824), and “Agriculture Campaign” (ICC = 0.802) (highlighted in red). The “Vegetation Campaign” metadata category is the only application-specific category that exhibits “Fair” consensus (ICC = 0.381).
An optimal standard that would meet basic requirements for practical implementation, flexibility, and longevity of a dataset, would be constructed using the most essential (“critical”) fields that are common to all campaigns. Such a standard would need to accommodate variation in response by expert groups across the metadata categories, as well as the logistics, aims, and goals inherent to each campaign. To explore this we determined thresholds for inclusion of a metadata field in a protocol based on its criticality. This was accomplished using binomial analysis and scale statistics (explained in more detail in the methods section).
Table 2 shows the binomial test results and scale statistics analysis on calibration metadata where the frequency of critical rankings were compared to the non-critical (“useful”/“legacy potential”/“NA”). The binomial tests were conducted such that the proportion of “critical” ratings were compared with a baseline proportion of 0.5. Metadata fields that have been designated as critical more than 50% of the time through binomial testing have been highlighted in bold. They comprise half of the metadata fields within the category and include “Date”, “Dark Noise”, “Signal to Noise”, “Stray Light” and “Calibration Data”. Scale statistics examined those items that generated relatively extreme values for Corrected Item-Total Correlation and Cronbach’s Alpha, or a strong effect on the scale mean and variance if they were deleted; these also have been highlighted in Table 2. In the “Calibration” category, “Standard” is a field not previously identified through binomial testing but indicates the need for further study into this metadata field as to the causes for its impact on the degree of agreement among respondents. It is closely correlated with the results for “Traceability”. This implies that for most of the survey participants, documenting frequency and results of calibration is important, but the details of the reference standard less so. The survey data permits speculation only at this point but the reason for choosing not to document the reference standard may arise from the level of significance a scientist assigns to the instrument itself being a factor in the recorded spectra, and the extent to which they are willing to collect and analyze ancillary calibration data to mitigate any spectral discrepancies resulting from the instrument. Similar results from all metadata categories illustrate the ambiguity presented by fields that lie below or near the threshold, therefore not being representative of the majority of respondents but having been identified as “critical” frequently enough to support inclusion in a customized metadata standard for given campaigns.
A foundation for a standard can be established by including those metadata categories with high overall rankings of criticality and internal consistency. Table 3 illustrates ranking, from highest to lowest, of metadata categories in terms of field ranking means, variances, and analysis of variance between fields. A Friedman Test was run against non parametric data to measure variability in ordinal criticality rankings in each category. The Friedman Test measures the difference between the observed rankings per respondent for each metadata category against a baseline of uniform rankings between respondents with α = 0.05 and the results show that for each category the differences between respondents is statistically significant for values p < 0.05.
All generic (non-target-specific) metadata categories that surpassed the threshold mean (2.0) for inclusion in the model metadata standard (ten categories were identified) have been highlighted in bold. A mean greater than 2.0 for a given category means that on average, the fields in that category have a minimum overall ranking exceeding “useful” (2.0) and a maximum overall ranking of “critical” (3.0).
It can be assumed that for any given campaign, an ideal or model metadata standard would include both the generic campaign metadata (up to eleven categories) and at least one application-specific category, creating a total of 12 metadata categories. The item mean for a given category incorporates the compound measure of the frequency of “critical”, “useful”, “legacy potential”, and “N/A” rankings. The more often that given fields in the metadata category were ranked “critical” or “useful”, the higher the item means values for that category. This accounts for metadata categories with low inter-item consensus between respondents, such as “Reference Standards” (ICC = 0.224) and “Instrument” (ICC = 0.185) but high overall rankings for the metadata fields in that category. The threshold mean for inclusion of a metadata category in the model standard was set at 2.0, meaning that the fields within the category measured against this threshold were given a minimum ranking of “useful” by a maximum of all respondents, and a maximum ranking of “critical” by one or more respondents. All generic campaign metadata categories surpassed this threshold, except for “Environment Information”, with a mean criticality ranking of 1.822. Therefore, those metadata categories necessary for inclusion in the model metadata standard are (in order of mean criticality ranking): “Viewing Geometry”, “Location Information”, “General Target and Sampling Information”, “Illumination Information”, “Instrument”, “Reference Standards”, “Calibration”, “Hyperspectral Signal Properties”, “Atmospheric Conditions”, and “General Project Information”.
Additional Qualitative Feedback
Designing a standard benefits from both the quantitative data and the recommendations provided by the respondents. Some of the suggestions and comments from the participants included:
“the context of inquiry must be specific enough to address the variety of type of radiometric data (reflectance, radiance, irradiance, transmission, etc.) and the purpose of the measurements (field survey, algorithm development)”
“regardless [of] the applications of the field spectroscopy, metadata should contain sufficient information for users (1) to repeat the sampling (or in the least to imagine the measurements and its surrounding condition); (2) to cite and pinpoint the dataset for the reference; and (3) to explore the data as much flexible as possible, even beyond its original purpose”
“depending on the campaign and available budget and instrumentation different (metadata) points become critical and other(s) useful or negligible”
“there’s a need for an integrated “quality flag” so that people can rapidly assess whether to utilise the data or not”
“there is no end to metadata!”
More than fifty additional metadata fields across many categories were suggested by the respondents. They provide a strong ancillary set of data to the quantitative results for informing design of a robust standard capable of accommodating a broad selection of campaigns in field spectroscopy.
4. Recommendations
Establishing a Core Metadataset
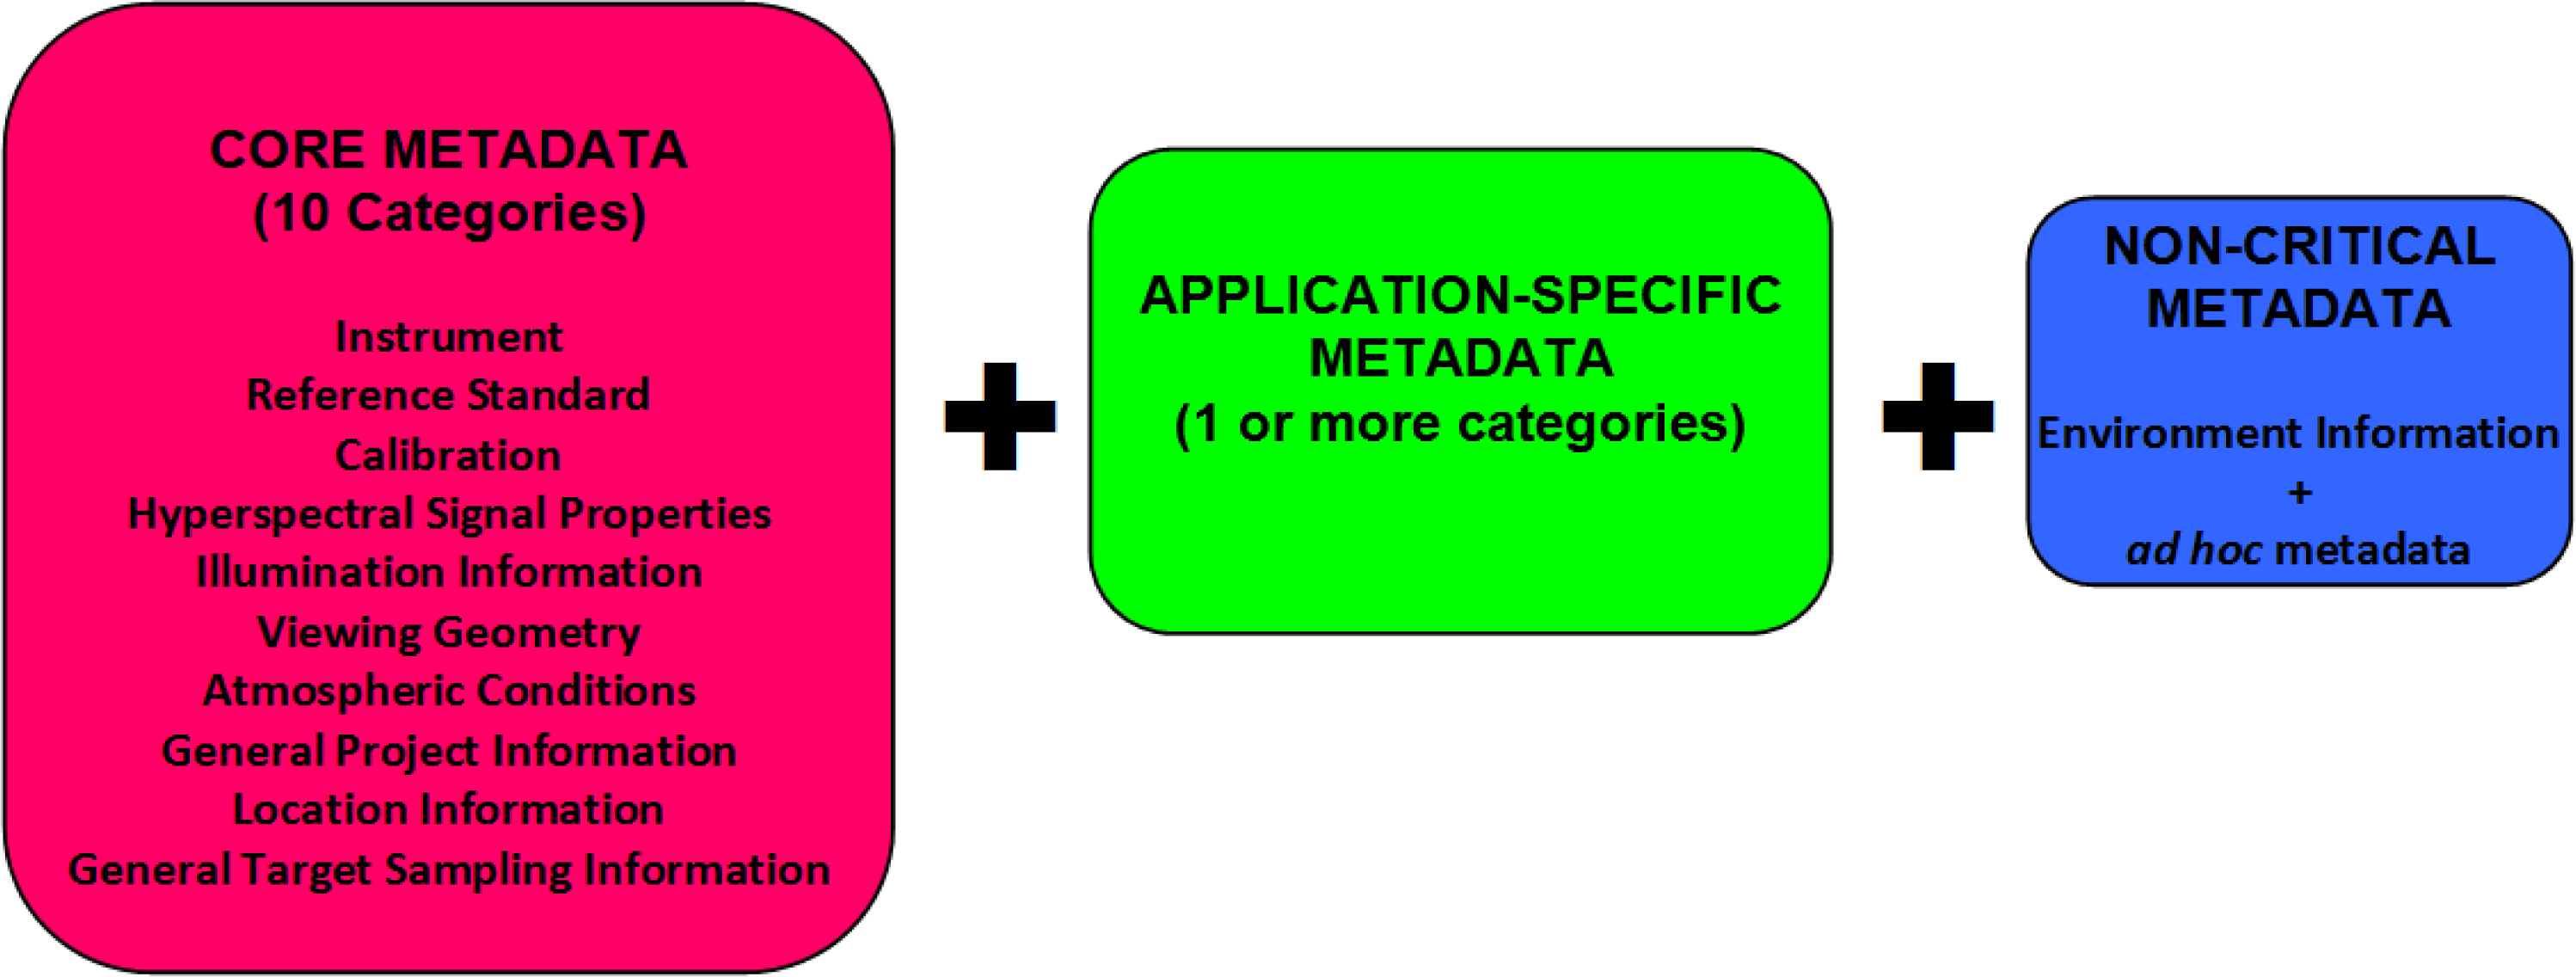
A practical standard consisting of a core metadataset must incorporate those categories and fields identified as critical most often by the respondents. The results indicate that the categories meeting this criteria are “Viewing Geometry”, “Location Information”, “General Target and Sampling Information”, “Illumination Information”, “Instrument”, “Reference Standards”, “Calibration”, “Hyperspectral Signal Properties”, “Atmospheric Conditions”, and “General Project Information”. Consequently, the core metadataset must include the minimum ten generic campaign metadata categories and at least one application-specific category, for a total of eleven (Figure 8). Other categories, within both the generic and application specific metadata divisions, may be included to enhance the usefulness and legacy potential of the in situ metadataset.
Table 4 is an example of a generic campaign category within the core metadataset, “Reference Standard” with critical and optional fields within it, with only two metadata elements (“Serial number”, “Cosine receptor”) not designated as critical overall by the respondents.
Table 5 is an example of metadata elements for an application-specific category, in this case, “Vegetation”. The critical fields comprise nearly 40% of the metatadaset fields proposed to the respondents within the “Vegetation” category.
For both common and application-specific categories, there are subsets of critical metadata fields, identified by both binomial analysis and scale statistics, and ambiguously ranked metadata fields that warrant further investigation as to their inclusion or exclusion. Establishing what the data is being collected for (activities such as population of a spectral library, calibration and validation) may help determine whether protocols must be streamlined for fitness-for-use within each campaign. This may be especially useful for those fields that have been designated as both “critical” and “N/A” in almost equal proportion. The versatility of a metadataset can be increased by including both the critical fields and those difficult to identify as critical. Group membership is an influencing factor on criticality rankings within a metadata category. Consensus is highest among expert groups for those categories directly related to their area of specialization, as exemplified by the high consensus and low variance for the marine scientists in the “marine conditions” category. This indicates that a metadata standard designed for specific applications is best informed by the expert group most closely associated with research involving those applications. Future investigation is required to determine a more comprehensive list of critical elements of application-specific metadata that is beyond the scope of the survey presented here. This can be accomplished through continued engagement with scientists with the requisite expertise in application domains (snow, marine, soils, etc.). Overall the results provide an informed and detailed summary of what is required across many campaigns, with the fields identified as critical most often by respondents being the core metadata set that must be including in all standards.
5. Conclusions
The survey results provides a framework for metadata prioritization that can be applied to any in situ field spectroscopy metadata standard that is practical, flexible enough to suit the purpose for which the data is being collected, and/or has sufficient legacy potential for long-term sharing and interoperability with other datasets. The survey respondents helped to identify a core metadataset critical to all in situ campaigns, as well as recommend additional metadata to increase the versatility of a metadataset, both for application-specific metadata and generic campaign metadata.
A core metadataset must include “Viewing Geometry”, “Location Information”, “General Target and Sampling Information”, “Illumination Information”, “Instrument”, “Reference Standards”, “Calibration”, “Hyperspectral Signal Properties”, “Atmospheric Conditions”, and “General Project Information” and at least one application-specific metadata category, depending on the type of target being sampled. The inclusion of additional categories, relating to both generic and application specific metadata, serve to enhance the robustness of the dataset. The composition of each category is a factor of those metadata fields that were easily identified as critical (through binomial analysis in the “Calibration” category, for example) and those that are difficult to designate.
Consensus is highest among experts within the same field, and within categories most closely related to their area of knowledge. This was illustrated by marine scientists who showed lower variance in response and higher overall criticality rankings in the “Marine and Estuarine Environmental Conditions” metadata category than did their non-marine counterparts in the same category. The trend for consensus amongst all categories, measured using the intraclass correlation coefficient, demonstrates that application specific metadata with smaller but more specialized groups of experts have the highest level of agreement between respondents on the criticality rankings for each field.
The survey results and subsequent analysis provide answers to the problem of establishing critical field spectroscopy metadata by identifying generic metadata categories that have the highest overall criticality rankings, the impact of group membership on determination of what is critical in a given metadata category, and consensus trends among groups in both generic and application specific metadata categories. The next phase of this research is identifying a more comprehensive set of application-specific metadata elements with the input of domain experts to increase the robustness of the field spectroscopy metadata model. Adapting the core metadataset as a standard for facilitation in data exchange is the best way forward for ensuring interoperability, intercomparison, and wide-scale sharing of high quality in situ metadata. This is the ideal solution to the problem of absent or ill-defined geospatial metadata standards currently in place that do not address the specific needs of in situ spectroscopy scientists.
Acknowledgments
We are grateful to the anonymous survey participants who generously gave their time and expertise to complete the survey. This work was partly supported by the Terrestrial Ecosystem Research Network (TERN, Australia).
Author Contributions
Barbara Rasaiah is the main author who created both the pilot and online surveys, extended the original field spectroscopy metadataset supplied by Tim Malthus, and performed statistical data analysis and interpretation of results. Simon Jones and Chris Bellman contributed to compiling the list of online survey recipients, input on survey design, and provided guidance on interpretation of results and editorial input for the article. Tim Malthus provided the original metadataset that served as the major component of both surveys, assisted in introducing the pilot survey at EARSeL 2011, compiled a large component of the online survey recipient list, contributed to input on the survey design, and provided editorial input for the article.
Conflicts of Interest
The authors declare no conflict of interest.
References
- Mazel, C.H. In situ measurement of reflectance and fluorescence spectra to support hyperspectral remote sensing and marine biology research. Oceans 2006, 2006, 1–4. [Google Scholar]
- Milton, E.J.; Schaepman, M.E.; Anderson, K.; Kneubühler, M.; Fox, N. Progress in field spectroscopy. Remote Sens. Environ 2009, 113, 92–109. [Google Scholar]
- Viscarra Rossel, R.A.; Walvoort, D.J.J.; McBratney, A.B.; Janik, J.L.J.; Skjemstad, O. Visible, near infrared, mid infrared or combined diffuse reflectance spectroscopy for simultaneous assessment of various soil properties. Geoderma 2006, 131, 59–75. [Google Scholar]
- Dekker, A.G.; Brando, V.E.; Anstee, J.M.; Botha, A.J.; Park, Y.J.; Daniel, P.; Malthus, T.J.M.; Phinn, S.R.; Roelfsema, C.M.; Leiper, I.A.; et al. A Comparison of Spectral Measurement Methods for Substratum and Benthic Features in Seagrass and Coral Reef Environments. Proceedings of the ASD and IEEE GRS; Art, Science and Applications of Reflectance Spectroscopy Symposium, Boulder, CO, USA, 23–25 February 2010.
- Mac Arthur, A. Field Guide for the ASD FieldSpec Pro—White reference Mode: Version 2, NERC FSF; 2007. Available online: http://fsf.nerc.ac.uk/resources/guides/pdf_guides/asd_guide_v2_wr.pdf (accessed on 3 January 2014).
- Pfitzner, K.; Bartolo, R.; Carr, G.; Esparon, E.; Bollhöfer, A. Standards for Reflectance Spectral Measurement of Temporal Vegetation Plots; Supervising Scientist Report 195; Uniprint NT: Darwin, NT, Australia, 2011. [Google Scholar]
- Ben-Dor, E. Variation and Stability of Soil Reflectance Measurements with Different ASD Spectrometers under Different Conditions. Proceedings of the ASD and IEEE GRS; Art, Science and Applications of Reflectance Spectroscopy Symposium, Boulder, CO, USA, 23–25 February 2010.
- Duggin, M.J. Factors limiting the discrimination and quantification of terrestrial features using remotely sensed radiance. Int. J. Remote Sens 1985, 6, 3–27. [Google Scholar]
- Kerekes, J.P. Error Analysis of Spectral Reflectance Data from Imaging Spectrometer Data. Proceedings of 1998 IEEE International Geoscience and Remote Sensing Symposium, IGARSS ’98, Seattle, WA, USA, 6–10 July 1998; 5, pp. 2697–2701.
- McCoy, R.M. Field Methods in Remote Sensing; The Guilford Press: New York, NY, USA, 2005. [Google Scholar]
- Stuckens, J.; Somers, B.; Verstraeten, W.W.; Swennen, R.; Coppin, P. Normalization of illumination conditions for ground based hyperspectral measurements using dual field of view spectroradiometers and BRDF corrections. Proceedings of 2009 IEEE International Geoscience and Remote Sensing Symposium, IGARSS 2009, Cape Town, South Africa, 12–17 July 2009; 3, pp. 279–282.
- Pfitzner, K.; Bollhöfer, A.; Carr, G. A standard design for collecting vegetation reference spectra: Implementation and implications for data sharing. Spat. Sci 2006, 52, 79–92. [Google Scholar]
- Jung, A.; Götze, C.; Gläßer, C. White reference tour 2009. A round-robin test for better spectral libraries. DGPF Tagungsband 2010, 19, 433–439. [Google Scholar]
- DLR Spectral Archive. Available online: http://cocoon.caf.dlr.de (accessed on 1 January 2012).
- SPECCHIO. Available online: http://www.specchio.ch (accessed on 20 February 2011).
- Hueni, A.; Nieke, J.; Schopfer, J.; Kneubühler, M.; Itten, K.I. The spectral database SPECCHIO for improved long term usability and data sharing. Comput. Geosci 2009, 35, 557–565. [Google Scholar]
- INSPIRE, European Commission Joint Research Center (2009). INSPIRE Metadata Implementing Rules: Technical Guidelines Based on EN ISO 19115 and ENSO19119 V. 1.1. Available online: http://inspire.jrc.ec.europa.eu/reports/ImplementingRules/metadata/MD_IR_and_ISO_20090218.pdf (accessed on 17 March 2010).
- Open Geospatial Consortium. OGC Sensor Observations Service Interface Standard V. 2.0. 2012. Available online: https://portal.opengeospatial.org/files/?artifact_id=47599 (accessed on 3 January 2014). [Google Scholar]
- Reusen, I. HYRESSA Team. Towards an Improved Access to Hyperspectral Data across Europe. Proceedings of the ISIS Meeting, Hilo, HI, USA, 1–17 November 2007.
- Bland, J.M.; Altman, D.G. Statistics notes: Cronbach’s alpha. BMJ 1997, 314. [Google Scholar] [CrossRef]
- Santos, J.R.A. Cronbach’s alpha: A tool for assessing the reliability of scales. J. Ext 1999, 37, 1–5. [Google Scholar]
- Tabachnick, B.G.; Fidell, L.S. Using Multivariate Statistics, 5th ed.; Pearson Education: New York, NY, USA, 2007. [Google Scholar]
- Bhatti, A.M.; Rudnquist, D.; Schalles, J.; Ramirez, L.; Nasu, S. A comparison between above-water surface and subsurface spectral reflectances collected over inland waters. Geocarto Int 2009, 24, 133–114. [Google Scholar]


| Generic Campaign Metadata | Application-Specific Metadata |
|---|---|
| instrument | vegetation |
| reference standards | woodland and forest |
| calibration | agriculture |
| spectral signal properties | soil |
| illumination information | mineral exploration |
| viewing geometry | snow |
| environment information | urban environments |
| atmospheric conditions | marine and estuarine |
| general project information | underwater substratum targets |
| location information | |
| general target and sampling information |
| Metadata Category | Observed Prop. | p-Value | Scale Variance if Item Deleted | Corrected Item-Total Correlation | Cronbach’s Alpha if Item Deleted | |
|---|---|---|---|---|---|---|
| Date | Critical | 0.68 | 0.002 | 26.443 | 0.596 | 0.888 |
| Non-critical | 0.32 | |||||
| Irradiance | Critical | 0.32 | 0.002 | 25.786 | 0.649 | 0.885 |
| Non-critical | 0.68 | |||||
| Radiance | Critical | 0.30 | 0.001 | 25.909 | 0.660 | 0.885 |
| Non-critical | 0.70 | |||||
| Darknoise | Critical | 0.52 | 0.818 | 26.210 | 0.686 | 0.884 |
| Non-critical | 0.48 | |||||
| Signal to Noise | Critical | 0.55 | 0.422 | 26.638 | 0.579 | 0.890 |
| Non-critical | 0.45 | |||||
| Linearity | Critical | 0.40 | 0.105 | 25.623 | 0.636 | 0.886 |
| Non-critical | 0.60 | |||||
| Stray Light | Critical | 0.67 | 0.005 | 25.063 | 0.660 | 0.884 |
| Non-critical | 0.33 | |||||
| Calibration Data | Critical | 0.61 | 0.081 | 25.416 | 0.620 | 0.887 |
| Non-critical | 0.39 | |||||
| Traceability (yes/no) | Critical | 0.49 | 1 | 24.547 | 0.631 | 0.887 |
| Non-critical | 0.51 | |||||
| Standard (NIST/NPL, etc.) | Critical | 0.47 | 0.728 | 24.097 | 0.723 | 0.880 |
| Non-critical | 0.53 | |||||
| Metadata Category | Item Means | Item Variances (Mean) a | ANOVA between Item Means for Respondents per Metadata Category | ||
|---|---|---|---|---|---|
| df | Friedman Test | p-Value | |||
| Environment Information | 1.822 | 0.597 | 4 | 17.704 | 0.001 |
| Mineral Exploration | 1.822 | 0.841 | 15 | 189.355 | <0.001 |
| Snow Campaign | 1.890 | 1.183 | 10 | 58.645 | <0.001 |
| Soil Campaign | 2.057 | 0.657 | 20 | 192.433 | <0.001 |
| Woodland and Forest Campaign | 2.068 | 0.705 | 8 | 40.058 | <0.001 |
| General Project Information | 2.103 | 0.469 | 5 | 146.004 | <0.001 |
| Atmospheric Conditions | 2.153 | 0.425 | 6 | 117.125 | <0.001 |
| Urban Environments | 2.189 | 0.866 | 10 | 116.875 | <0.001 |
| Marine and Estuarine | 2.199 | 1.014 | 10 | 69.282 | <0.001 |
| Underwater Substratum Target | 2.216 | 1.139 | 9 | 28.481 | 0.001 |
| Vegetation Campaign | 2.231 | 0.462 | 15 | 159.044 | <0.001 |
| Agriculture Campaign | 2.242 | 0.690 | 8 | 84.810 | <0.001 |
| Hyperspectral Signal Properties | 2.352 | 0.561 | 18 | 294.364 | <0.001 |
| Calibration | 2.379 | 0.605 | 9 | 54.067 | <0.001 |
| Reference Standards | 2.388 | 0.628 | 6 | 79.651 | <0.001 |
| Instrument | 2.393 | 0.484 | 18 | 310.47 | <0.001 |
| Illumination Information | 2.420 | 0.474 | 5 | 86.771 | <0.001 |
| General Target and Sampling Information | 2.477 | 0.446 | 13 | 105.327 | <0.001 |
| Location Information | 2.489 | 0.464 | 7 | 53.578 | <0.001 |
| Viewing Geometry | 2.571 | 0.358 | 6 | 12.624 | 0.049 |
aKendall’s coefficient of concordance ranged from 0.007 to 0.215.
| Reference Standard Metadata | |
|---|---|
| Critical Fields | Optional Fields |
| No reference standard used | Serial number |
| Reference (panel, cosine) | Cosine receptor |
| Reference material | |
| Time interval for reference measurement | |
| Calibration standard | |
| Vegetation Campaign Metadata | |
|---|---|
| Critical Fields | Optional Fields |
| Common name | Class |
| Species | Subclass |
| Type | LAI |
| Leaf/Canopy | Chlorophyll content |
| Height of leaf/canopy from ground | Biomass |
| Background (soil/other) | Moisture content |
| Leaf angle distribution | |
| Visible vegetation stress conditions (water, sunlight, heat) | |
| Visible vegetation stress conditions | |
| Evidence of disturbance | |
© 2014 by the authors; licensee MDPI, Basel, Switzerland This article is an open access article distributed under the terms and conditions of the Creative Commons Attribution license (http://creativecommons.org/licenses/by/3.0/).
Share and Cite
Rasaiah, B.A.; Jones, S.D.; Bellman, C.; Malthus, T.J. Critical Metadata for Spectroscopy Field Campaigns. Remote Sens. 2014, 6, 3662-3680. https://doi.org/10.3390/rs6053662
Rasaiah BA, Jones SD, Bellman C, Malthus TJ. Critical Metadata for Spectroscopy Field Campaigns. Remote Sensing. 2014; 6(5):3662-3680. https://doi.org/10.3390/rs6053662
Chicago/Turabian StyleRasaiah, Barbara A., Simon. D. Jones, Chris Bellman, and Tim J. Malthus. 2014. "Critical Metadata for Spectroscopy Field Campaigns" Remote Sensing 6, no. 5: 3662-3680. https://doi.org/10.3390/rs6053662