Detection and Characterization of Hedgerows Using TerraSAR-X Imagery

Abstract
: Whilst most hedgerow functions depend upon hedgerow structure and hedgerow network patterns, in many ecological studies information on the fragmentation of hedgerows network and canopy structure is often retrieved in the field in small areas using accurate ground surveys and estimated over landscapes in a semi-quantitative manner. This paper explores the use of radar SAR imagery to (i) detect hedgerow networks; and (ii) describe the hedgerow canopy heterogeneity using TerraSAR-X imagery. The extraction of hedgerow networks was achieved using an object-oriented method using two polarimetric parameters: the Single Bounce and the Shannon Entropy derived from one TerraSAR-X image. The hedgerow canopy heterogeneity estimated from field measurements was compared with two backscattering coefficients and three polarimetric parameters derived from the same image. The results show that the hedgerow network and its fragmentation can be identified with a very good accuracy (Kappa index: 0.92). This study also reveals the high correlation between one polarimetric parameter, the Shannon entropy, and the canopy fragmentation measured in the field. Therefore, VHSR radar images can both precisely detect the presence of wooded hedgerow networks and characterize their structure, which cannot be achieved with optical images.1. Introduction
Hedgerows are important features in many landscapes of the world [1]. They are linear features composed of trees and/or shrubs of various species, managed by people as fences or for the provision of wood. Therefore, they have very different structures at tree and hedgerow scales in different landscapes [2]. They fulfill ecological, as well as cultural functions, such as control of soil erosion, microclimatic effects, landscape beautification, wood production, and water quality [3]. A dense hedgerow network plays a key role in habitat connectivity for some species and thus influences the degree of fragmentation of the landscape [4].
However, hedgerows have different structures according to their species composition, vegetation density and management regime. Most hedgerow functions depend upon hedgerow structure [5] and hedgerow network patterns. The windbreak function is one of the most analyzed with physical models based on a qualitative characterization of hedgerows. The windbreak effect is the most straightforward process to relate to hedgerow or shelterbelt structure. Torita and Satou (2007) [6] showed that the product of the width and the total area density (the projected area of leaf, branch and stem per unit ground area divided by the crown length) is a good predictor of the windbreak effect. Hedgerows also provide habitat and landscape connectivity for species. Hedgerows with dense tree and shrub layers harbor more forest dwelling species than hedgerows with scattered trees [7]. For Hinsley and Bellamy (2000) [8], “The two most important factors positively associated with species richness and abundance of breeding birds in hedgerows are hedge size (height/width/volume) and the presence/abundance of trees”. Thus, the linear fragmentation of hedgerow networks and canopy fragmentation (Figure 1) influence landscape properties such as landscape connectivity and the degree of landscape fragmentation.
In many ecological studies, information on the fragmentation of hedgerow networks and canopies is often retrieved in the field using accurate ground surveys [9]. Most of the time, hedgerow structure is only described for small areas from field measurements because this process is too time-consuming; hedgerow structure is estimated over landscapes in a semi-quantitative manner (e.g., [10]), which is approximate.
Nowadays, remotely sensed data offer a unique opportunity to map and characterize hedgerow networks at a landscape scale. Some studies conducted in different disciplines as geology [11] or medical imaging [12] aimed to develop methodologies to extract linear features. Though remote sensing images are widely used to characterize landscapes [13], only a few articles address the detection and characterization of linear features. Regarding hedgerow network detection, most studies use aerial photograph interpretation for hedgerow mapping [14]. Accurate mapping of linear hedgerows can be problematic due to their small areal extent and fragmented nature [15]. Due to the appearance of very high spatial resolution (VHSR) sensors, remotely sensed data can now be used to automatically map hedgerows in agricultural landscapes [16–18]. Lausch and Herzog (2002) [19] suggested that the spatial resolution should be below 5 m to capture linear features in a landscape. Fauvel et al. (2012) [20] developed a method based on the waveform recognition theory applied to VHSR optical images to detect hedgerows as linear landscape elements composed of trees, distinct from forest patches. Deng et al. (2013) [21] conducted belt continuity recognition and determined that belt gaps less than 10 m were not reliably detected using SPOT 5 images. Although the resolution of VHSR allows for the extraction of small elements and this device does not depend on weather conditions, there is only one study, to our knowledge, that has evaluated radar images to extract the linear hedgerow network; Bargiel (2013) [22] used textural features computed from the images of the backscattering coefficients derived from a high resolution satellite radar image to detect semi-natural habitats including hedgerows. However, in this case, only the intensity of the backscattering signal was considered, whereas it could be interesting to consider polarimetric indicators which take into account the number and nature of backscattering mechanisms for hedgerow extraction.
Although some studies have aimed at extracting hedgerows automatically, few studies address the issue of hedgerow characterization. Wiseman et al. (2009) [23] applied an object-oriented method to detect shelterbelt in a Canadian prairie, and studied the spectral features of the species composition of hedgerows using SPOT 5 imagery. Czerepowicz et al. (2012) [24] explained over 70% of the variance in aboveground shelterbelt biomass using spatial and spectral attributes extracted from Quickbird imagery. Until now, there have been no studies aimed at characterizing canopy fragmentation. Such a study could help to improve our knowledge of different hedgerow functions such as ecological functions, considering hedgerows as a landscape connector for species dispersion. The hedgerow structure is difficult to describe using passive optical sensors. Although many models have been developed to describe canopy structure using VIS-NIR imagery, varied vegetation types such as grasses, shrubs, trees reflect similarly, especially when leaf-on, and some reflectance based indices saturate above LAI of about 4 [25]. Other remotely sensed data, such as SAR (Synthetic Aperture Radar) and LIDAR (Light Detection and Ranging) data, offer a new opportunity to characterize hedgerows in a whole landscape. Indeed, LIDAR remote sensing has the ability to acquire three dimensional measurements of a study site, at a fine scale, which is useful for estimating a variety of tree features (tree height, volume, biomass) [26–28]. However, LIDAR data are generally acquired in one shot because each data acquisition is very costly. Radar SAR data are easier to acquire and allow a priori to access to the inner structure of the hedgerows when the radar signal interacts with the tree structure. To our knowledge, radar images have not been evaluated to characterize canopy fragmentation. In this study, we therefore investigated whether the spatial resolution of VHSR radar data like TerraSAR-X images allows the canopy structure to be taken into consideration.
The aim of this study was to address the issue of evaluating VHSR radar SAR images to (i) detect hedgerows in order to characterize hedgerow networks; and (ii) characterize the canopy structure at the hedgerow scale.
2. Material and Methods
2.1. Study Site
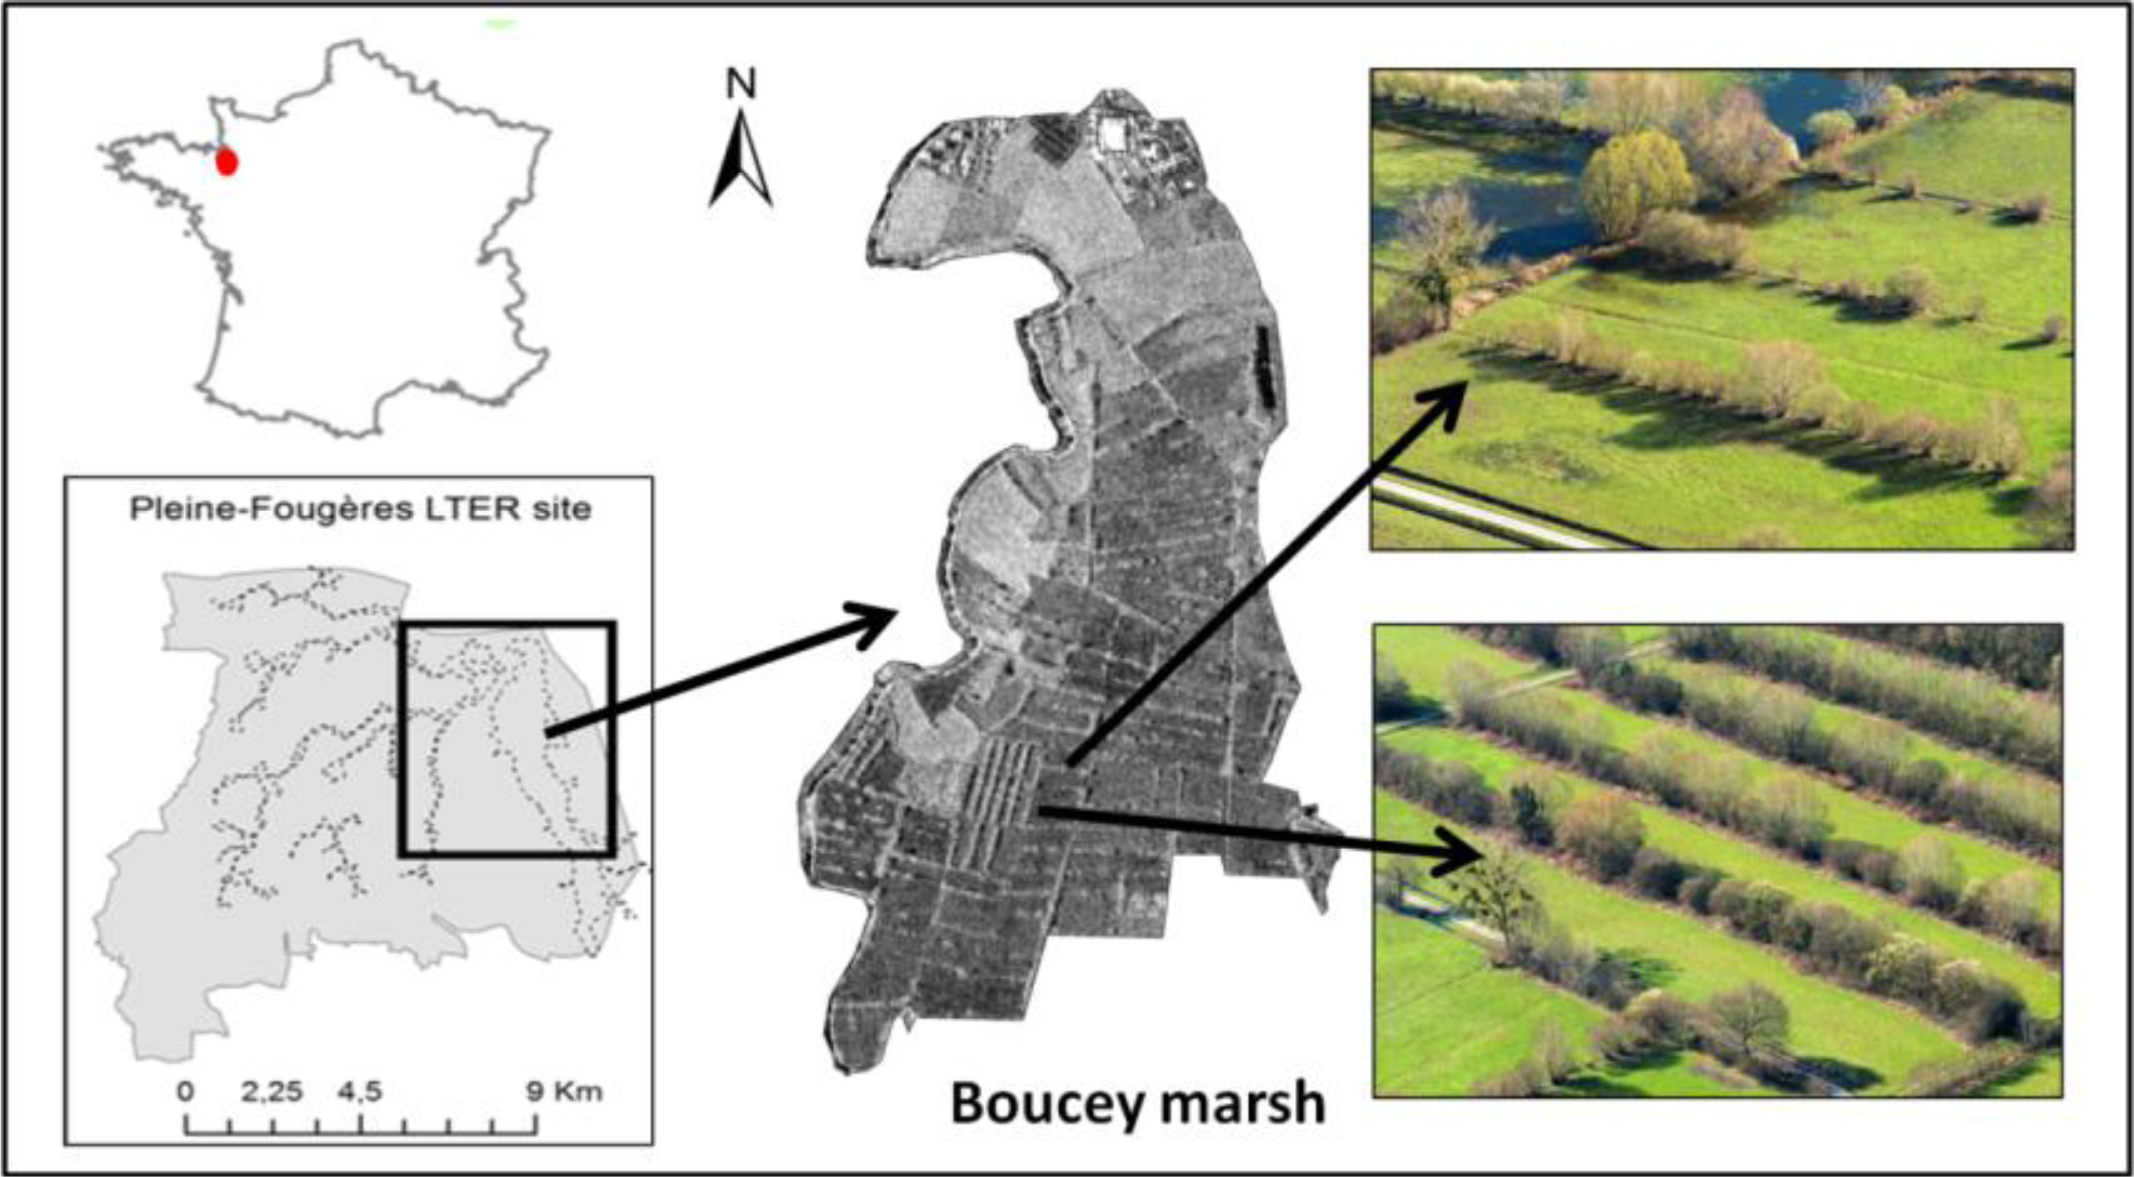
The investigated area is a Long Term Ecological Research site named “Pleine Fougères” (130 km2), located on the southern part of the Bay of the Mont-Saint-Michel, France ( http://osur.univ-rennes1.fr/za-armorique/) (Figure 2). It is referenced in the LTER-Europe (lterEurope.net) and the ILTER networks. This study focuses on the Sougeal marsh which is part of the Couesnon river floodplain. It is a flat area, mostly composed of agricultural plots intended for growing grassland and maize without wooded areas. Grazing and mowing are the two main grassland management practices. The agricultural plots are surrounded by a dense wooded hedgerow network. The hedgerows offer contrasted structures while being dominated by Salix sp.
2.2. Field Data
2.2.1. Field Data Acquisition
Ground surveys were conducted during the image acquisition to estimate the canopy structure of hedgerows under different amounts of canopy branch cover and clumping. At the date of image acquisition, the trees were leafless as shown by the hemispherical photographs taken the same day (Figure 3). A series of 55 hemispherical photographs distributed over 15 hedgerows were taken in April 2012 using a Canon EOS 7D camera with a Circular Fisheye for APS-C sensor (with a focal length of 10 mm, a diagonal angle of view approximately 180° and a minimum opening of F22). Each hemispherical photograph was geolocated using differential GPS (GeoXH Trimble, accuracy 0.10 m). Figure 3 presents different canopy fragmentation patterns encountered on the study site with more or less dense cover, showing different branch layouts, since at this period of the year the trees had no leaves.
2.2.2. Field Data Processing
The hemispherical photographs were classified into two classes, “Branches” and “Sky” (Figure 3), using the Contrast Split Segmentation algorithm implemented in eCognition. This algorithm segments the image into dark and bright image objects based on a threshold value that maximizes the contrast between them [29]. Initially it executes a chessboard segmentation at different scales and then performs the split on each square. The parameters used here were as follows: “Chessboard Tile Size” of 100,000, a threshold ranging from 150 to 200 applied on the “Green layer” and a step size of 1.
The number of pixels is strictly identical from one picture to another, since the size of the hemispherical photographs is the same. At the end of the process, the heterogeneity structure index developed by Burel and Baudry (2003) [30] was calculated (Figure 3) in order to quantify the canopy structure heterogeneity of the field plots using the following equtation:
With Pc the occurrence proportion of the couples c of adjacent pixels of different classes (“branches/sky”, branch/branch, sky/sky) and nnh the number of types of couples.
This metric has high values for complex canopy structures, when the density of branches is high and they are interwoven. Conversely, a simple structure of straight branches for example, yields a low value. HS index values increase with the proportion of “branch/sky” interfaces. Thus, the increase of HS values highlights an increase of the canopy fragmentation and also of its canopy cover rate relative to sky background. In addition to the HS index we tested others metrics (preliminary tests not included in this article) as the number of interfaces “branch/sky” or the grain (adapted from Vannier et al., 2011 [31]) which highlight the size of the canopy gap. The HS index was selected because it showed the best correlation with the parameters derived from the radar image (σ° HH, σ° VV, Single Bounce, Double Bounce, and Shannon entropy).
2.3. Satellite Data
One dual-polarization TerraSAR-X image was acquired 19 April 2012 in High Resolution Spotlight mode with HH and VV polarizations, a ground spatial resolution of 1.5 m and an azimuth resolution of 2.2 m. An incidence angle of 37 degrees was chosen to maximize the vegetation penetration. Generally we consider that small angles are more sensitive to ground surfaces [32,33] and higher/medium angles are more sensitive to vegetation roughness [34].
The TerraSAR-X image was acquired during leaf-off period. Indeed, it should be not possible to characterize the hedgerow structure during summer as X band cannot penetrate the vegetation foliage to access the inner structure of hedgerows.
2.3.1. Image Pre-Processing
2.3.1.1. Backscattering Coefficients
TerraSAR images were firstly radiometrically calibrated according to the following equation [35]:
Ks is the calibration constant
DN is the digital number of each pixel (amplitude of the backscattering signal)
NEBN is the Noise Equivalent Beta Naught (sensor noise)
θ is the radar incidence angle
This equation transforms the digital number of each pixel into a backscattering coefficient on a linear scale.
A Lee refined filter [36] was then applied using a window of 3 × 3 pixels to reduce speckle noise. The image was then geocoded using the Shuttle Radar Topography Mission (SRTM) data to correct the topographic deformations. The images were also geometrically corrected to the Lambert-RGF93/IGN-69 system using 55 ground control points selected from orthophotoplan images with a 0.5 m resolution. The geometric correction accuracy is less than one pixel (i.e., 1 m). The backscattering coefficients σ° HH and σ° VV were then calculated in decibels (dB):
2.3.1.2. Polarimetric Parameters
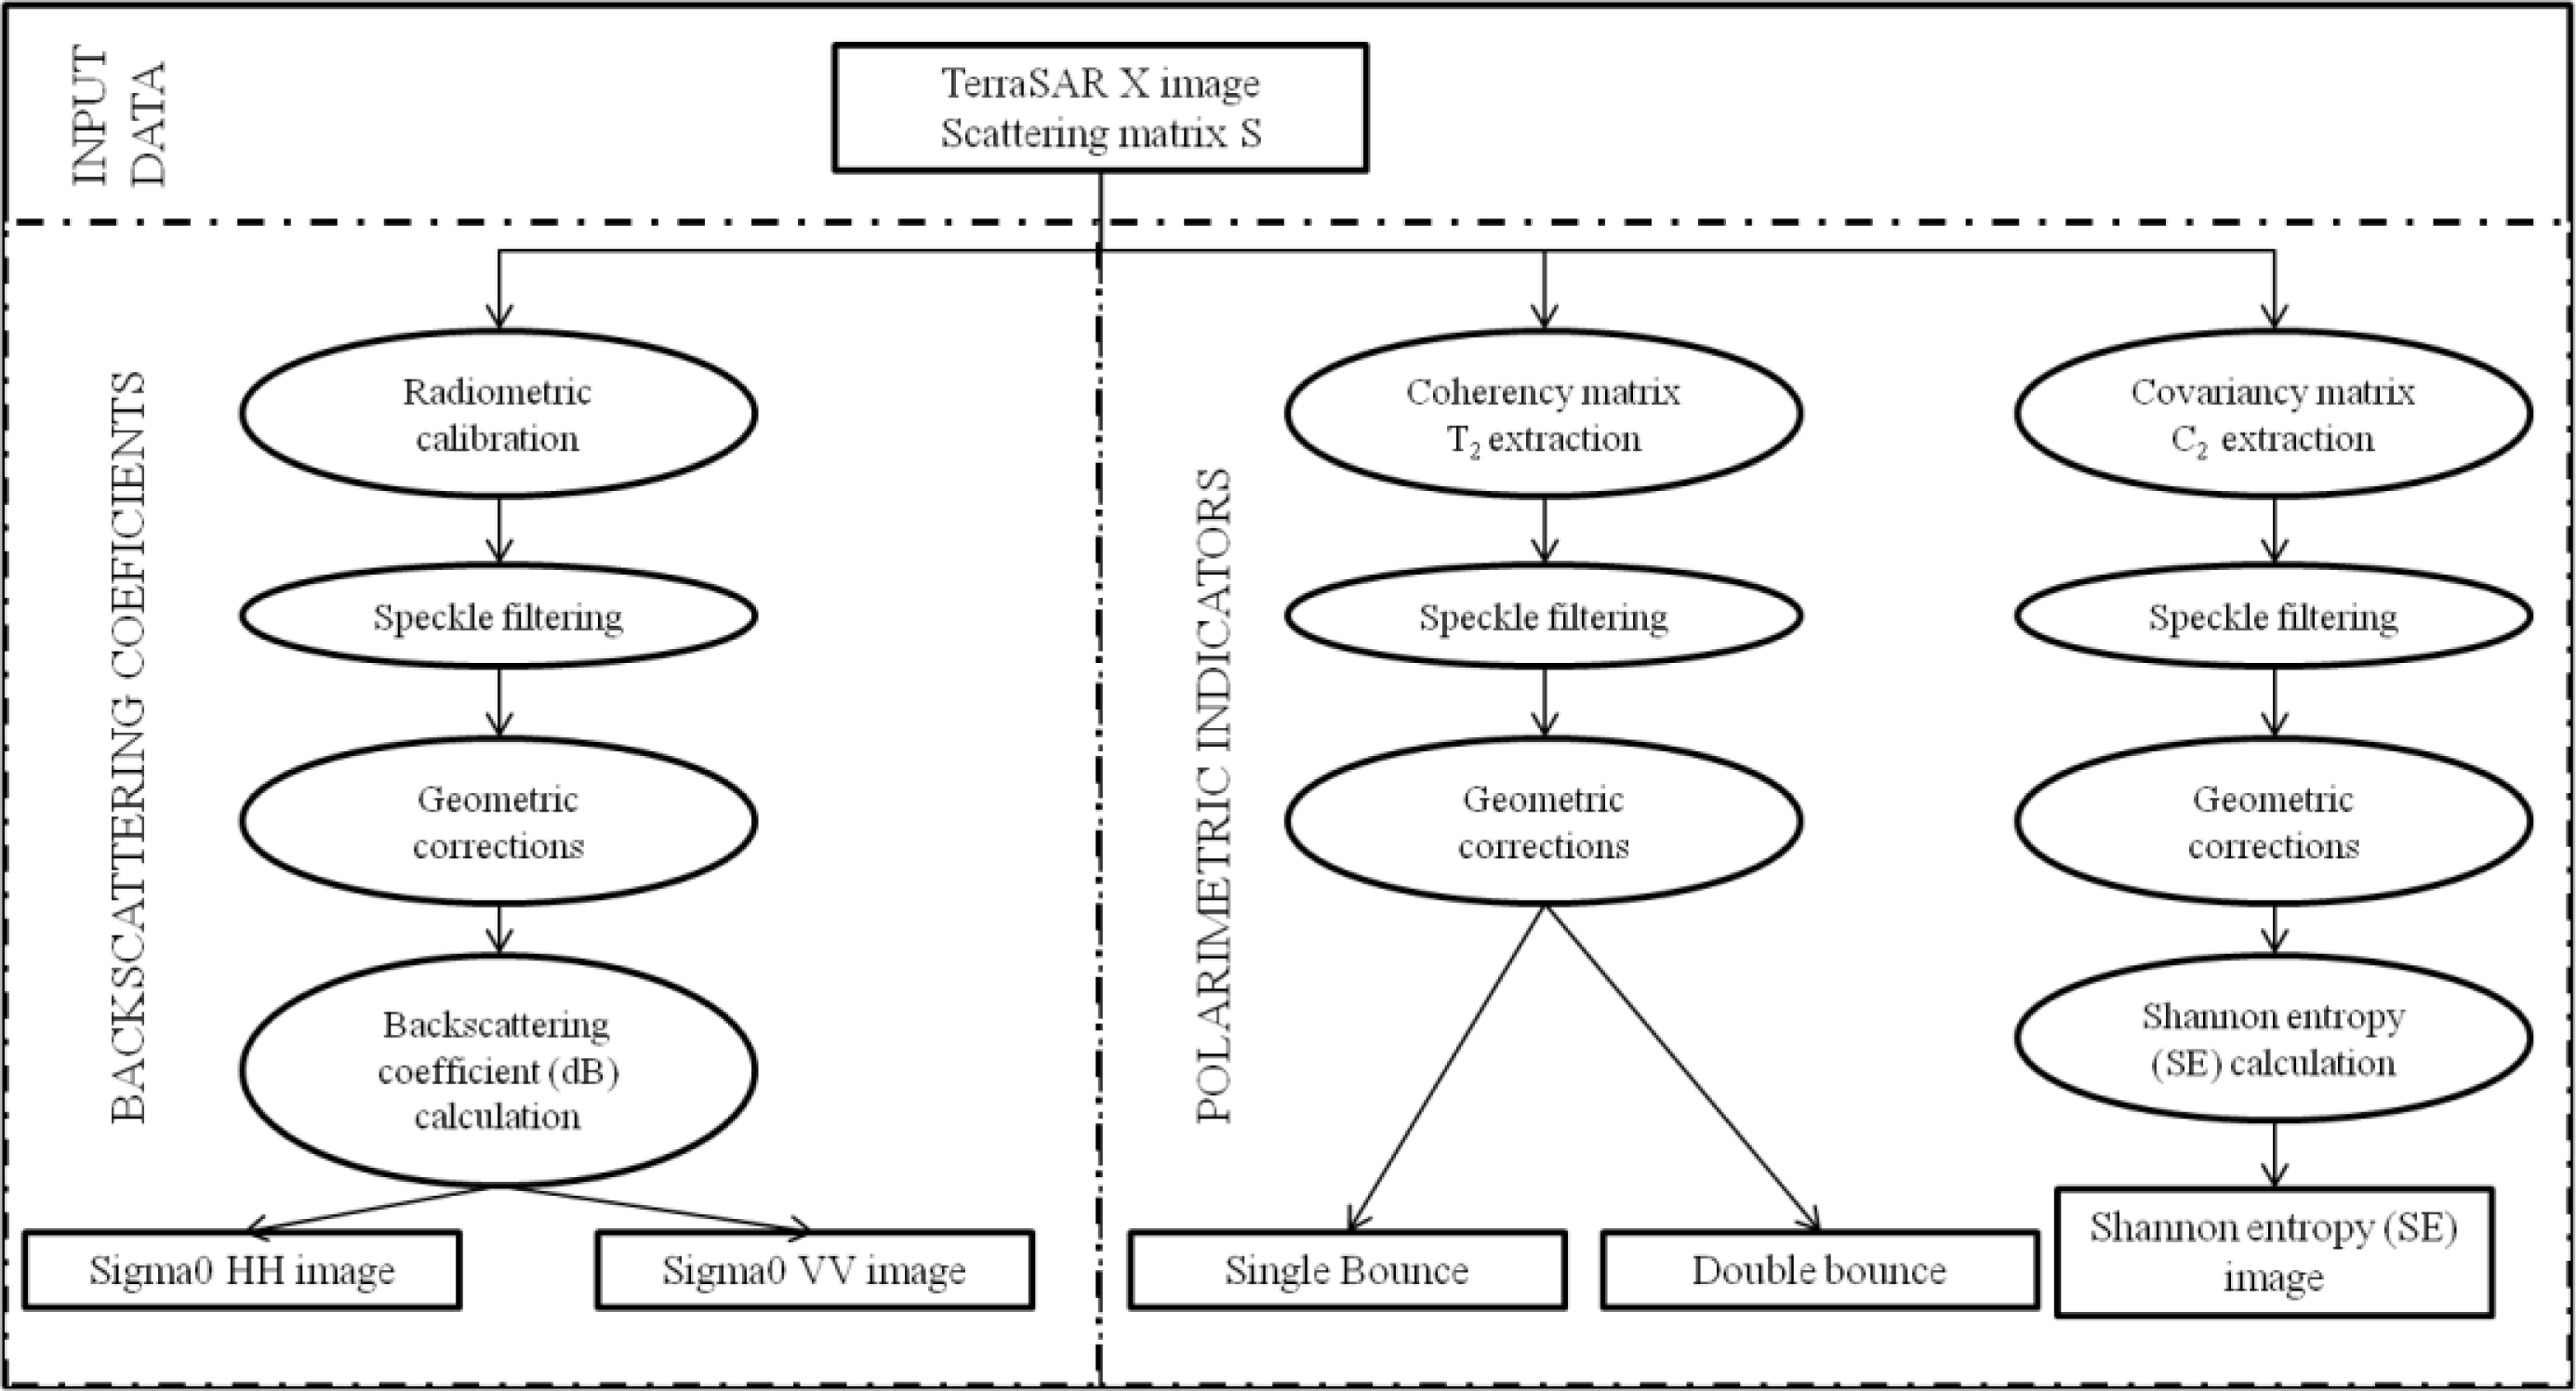
A 2 × 2 covariance (C2) matrix was firstly extracted from the scattering matrix images (Figure 4) using PolSARpro v4.0 software (Polarimetric SAR Data Processing and Educational Toolbox) [37]. A Lee refined filter [36] was applied using a window of 3 × 3 pixels to reduce speckle noise. The geocoding process was in this case directly applied on the elements of the 2 × 2 C2 matrix which are independent of the polarimetric absolute phase [38].
The Shannon entropy (SE), which corresponds to the sum of two contributions related to the intensity and the degree of polarization [38], was then calculated from the 2 × 2 covariance matrix C2. SE measures the disorder encountered in polarimetric SAR images. Each pixel of the TerraSAR-X images is defined as a complex 2D target vector k that follows a 2D circular Gaussian process with a zero mean and a covariance C2 matrix [38]:
The intensity (IC) and the degree of polarization (PC) can be defined from the averaged covariance matrix C2 using the following expressions:
The Shannon Entropy SE is defined, for a general density function, by:
In parallel a 2 × 2 coherency (T2) matrix was extracted from the scattering matrix S using the Pauli spin elements kT [38]:
The first element of the diagonal T11 |SHH + SVV |2 and the second one T22 |SHH − SVV |2 were used to study the single bounce and double bounce, respectively.
2.3.2. Image Processing
2.3.2.1. Extraction of Hedgerows
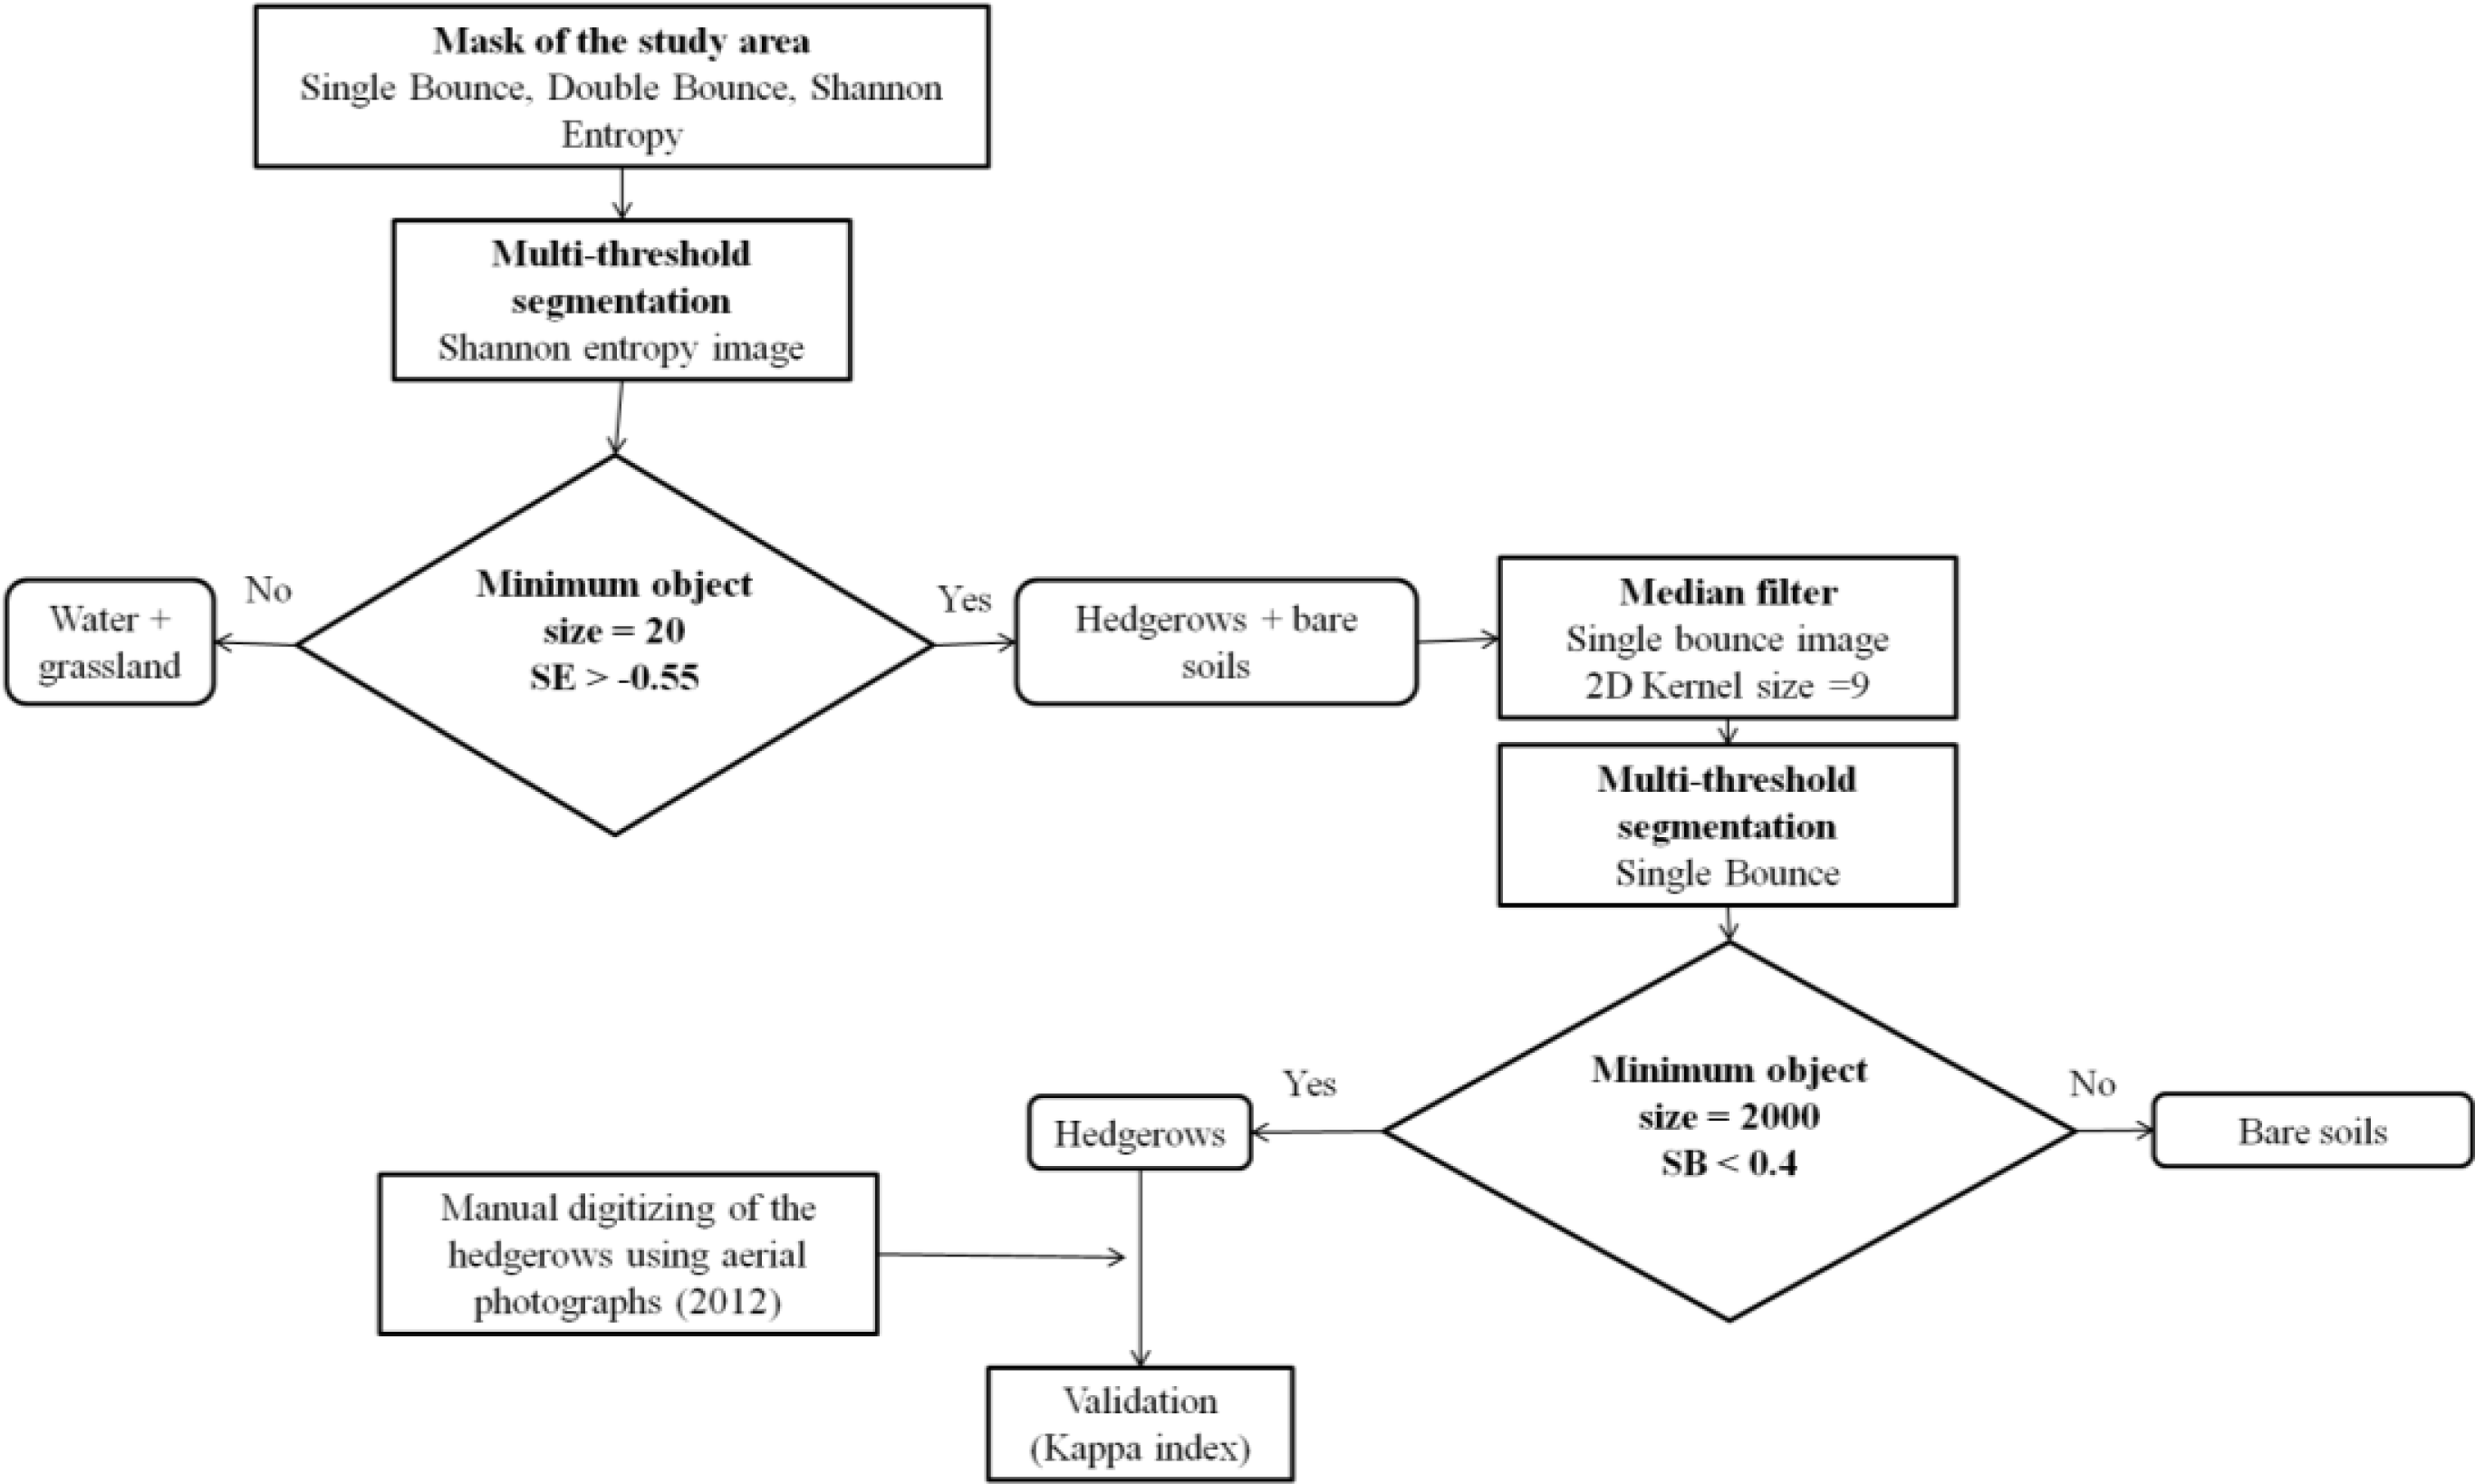
Figure 5 shows the general classification scheme applied to extract hedgerows. An object-oriented approach was used to classify the Shannon entropy and the single bounce (HH + VV) layers using eCognition Developer V 8 software [29].
The first step aimed to segment and extract objects with high SE values in order to extract the hedgerows using the multi-threshold segmentation technique implemented in eCognition Developer V 8 software [29]. This algorithm segments the image into objects based on a threshold value that splits the image object domain and classifies the resulting image objects based on a defined pixel value threshold. This threshold can be user-defined, dividing the selected set of pixels into two subsets so that heterogeneity is increased to a maximum. In general, radar backscattering is lower for an open water body than for other surfaces because the single bounce scattering mechanism that is due to specular reflection from the water surface is dominant. Moreover, grassland present lower backscattering coefficients in spring period than other crops [40,41]. A threshold value was applied to the SE image to eliminate open water and grassland [42]. Indeed, open water and grassland present a number of backscattering mechanisms lower than that associated with hedgerows or plowed bare soil.
The second step of the classification process aimed to eliminate plowed bare soil. The single bounce image was used for this purpose because this scattering mechanism is higher for this surface condition than for hedgerows for which volume and double bounce mechanisms are dominant.
The accuracy of the classification was defined using a Kappa index which expresses the proportional reduction in error generated by a classification process compared with the error of a completely random classification [43]. This index is commonly used for the assessment of prediction errors in conservation presence/absence models [44]. Seventy-nine GPS points were taken in hedgerows, hedgerow gaps and grassland agricultural plots on the study site to evaluate the efficiency of radar SAR images to detect linear hedgerow fragmentation.
2.3.2.2. Assessment of Hedgerow Structure
First, the centre of each hemispherical photograph (assessed using a DGPS) was identified on the radar image. Circular buffers with 4 m radii were then formed around each centre point of field sample plots to collect SAR features. The size of the buffer was chosen in such a way to correspond to the maximum hedgerow width encountered on the study site. Buffers were then intersected with hedgerows to eliminate the values of the radar image from adjacent plots. Then, the mean values of the polarimetric parameters and of the backscattering coefficients were extracted for each buffer area.
Finally, linear regressions were performed between the SAR parameter mean values and the heterogeneity structure index measured from the field hemispherical photographs. Model fit was assessed using the coefficient of determination (R-squared) and p-values. For the best model, model robustness was assessed by the calculation of confidence intervals for the R-squared, slope, Root Mean Square Error (RMSE), average absolute error and average mean error using the bootstrap sampling technique (100,000 runs) [45]. Bootstrapping provides a realistic estimate of the predictive performance of a model [46]. In this method, the coefficients and statistics of a high number of samples taken from the available data set are calculated. First a sample with random points (picked with replacement, i.e., the same number can be picked more than one time) is selected. The “bootstrap sample” has the same size as the data set (i.e., 55). Linear regression is performed using the bootstrap sample, and the coefficients and statistics are stored. In our case the process was repeated 100,000 times. Thus, using the stored values it is possible to calculate RMSE, average absolute error and average mean error to evaluate if the model could be used to predict or assess hedgerow canopy structure. All statistics were performed with R statistical software, version 2.7.0 ( www.r-project.org).
3. Results
3.1. Extraction of Hedgerows
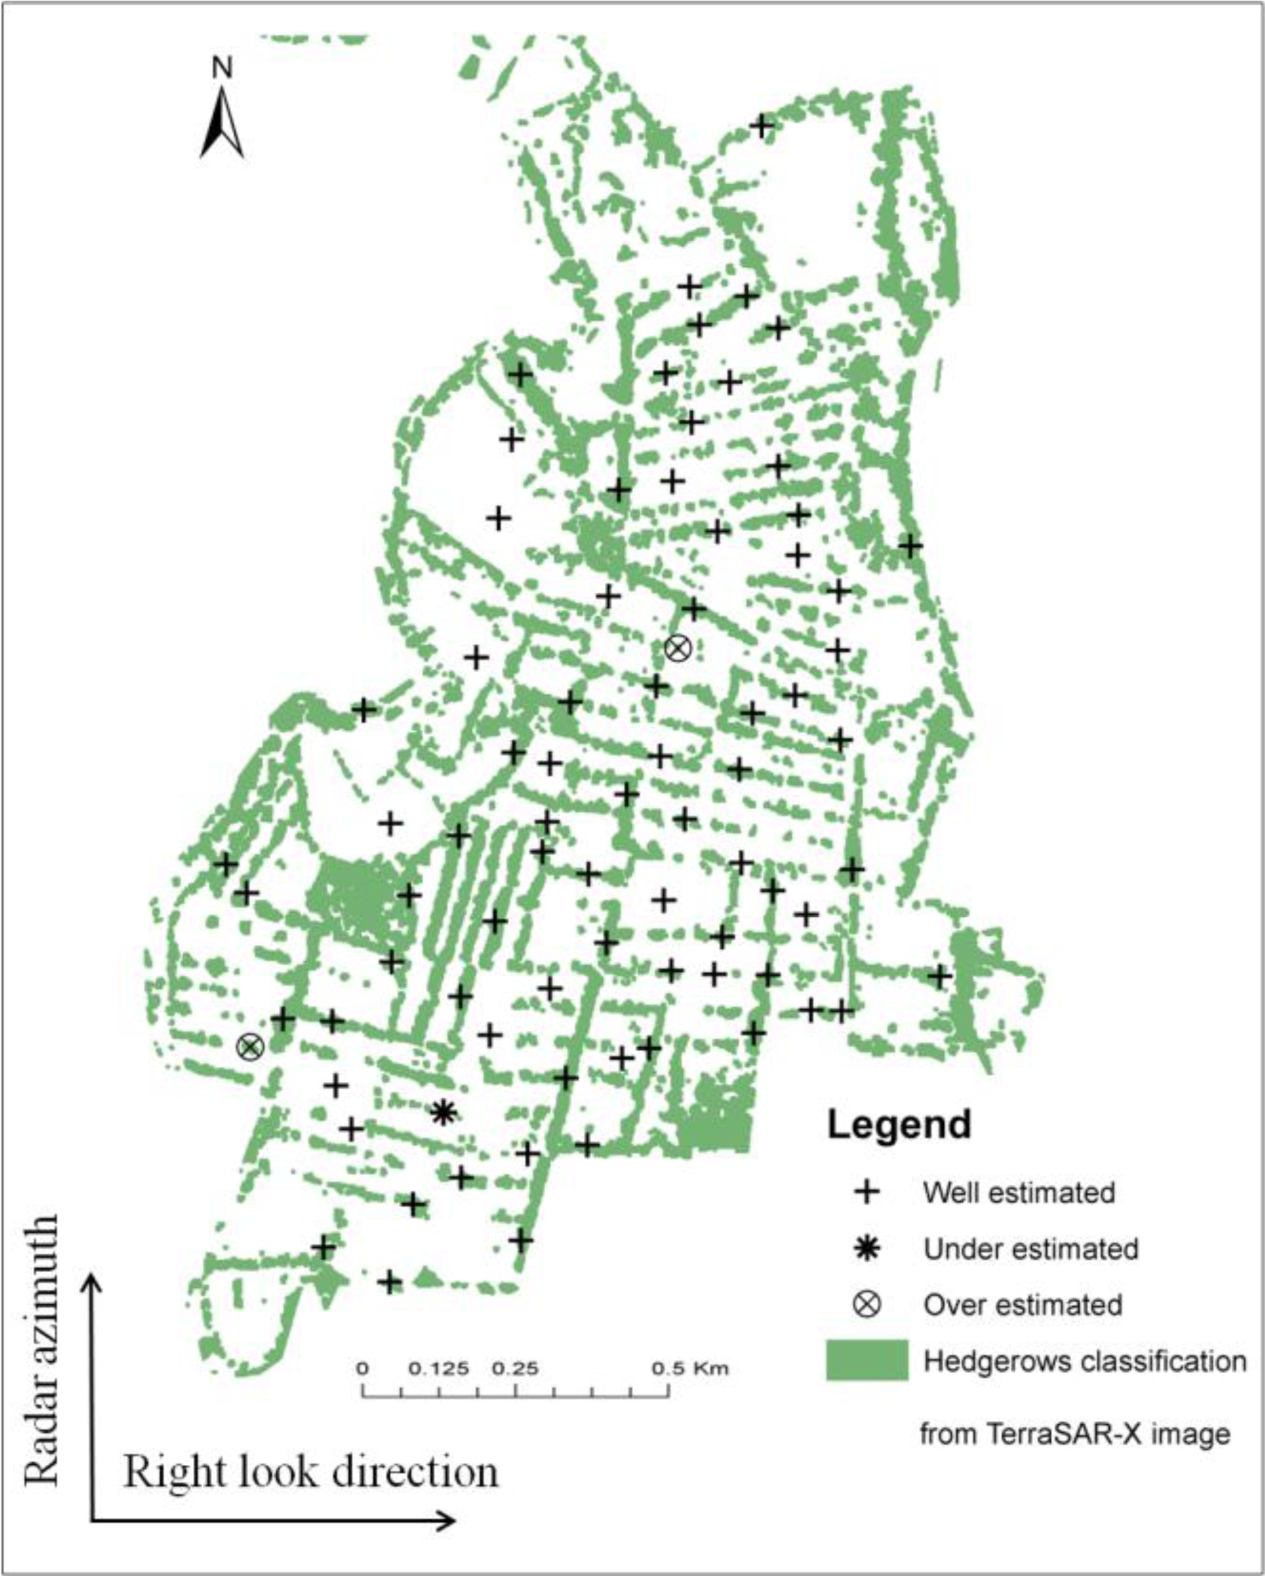
The accuracy of the hedgerow network classification is very high, with an overall agreement of 96% and a Kappa Index of 0.92 (Table 1). This means that the classification process avoided at least 92% of the errors that were generated by a completely random classification. The analysis of the map that shows the classification of the validation points highlights that only 3 out of 79 points were misclassified (Figure 6). Underestimation error (1 point) was due to the fact that very narrow hedges (<1 m) cannot be extracted because of the spatial resolution of the images, while overestimation errors (2 points) can be explained the layover artefacts in radar imaging mainly for hedgerows which were perpendicular to the radar azimuth.
3.2. Hedgerows Structure Assessment
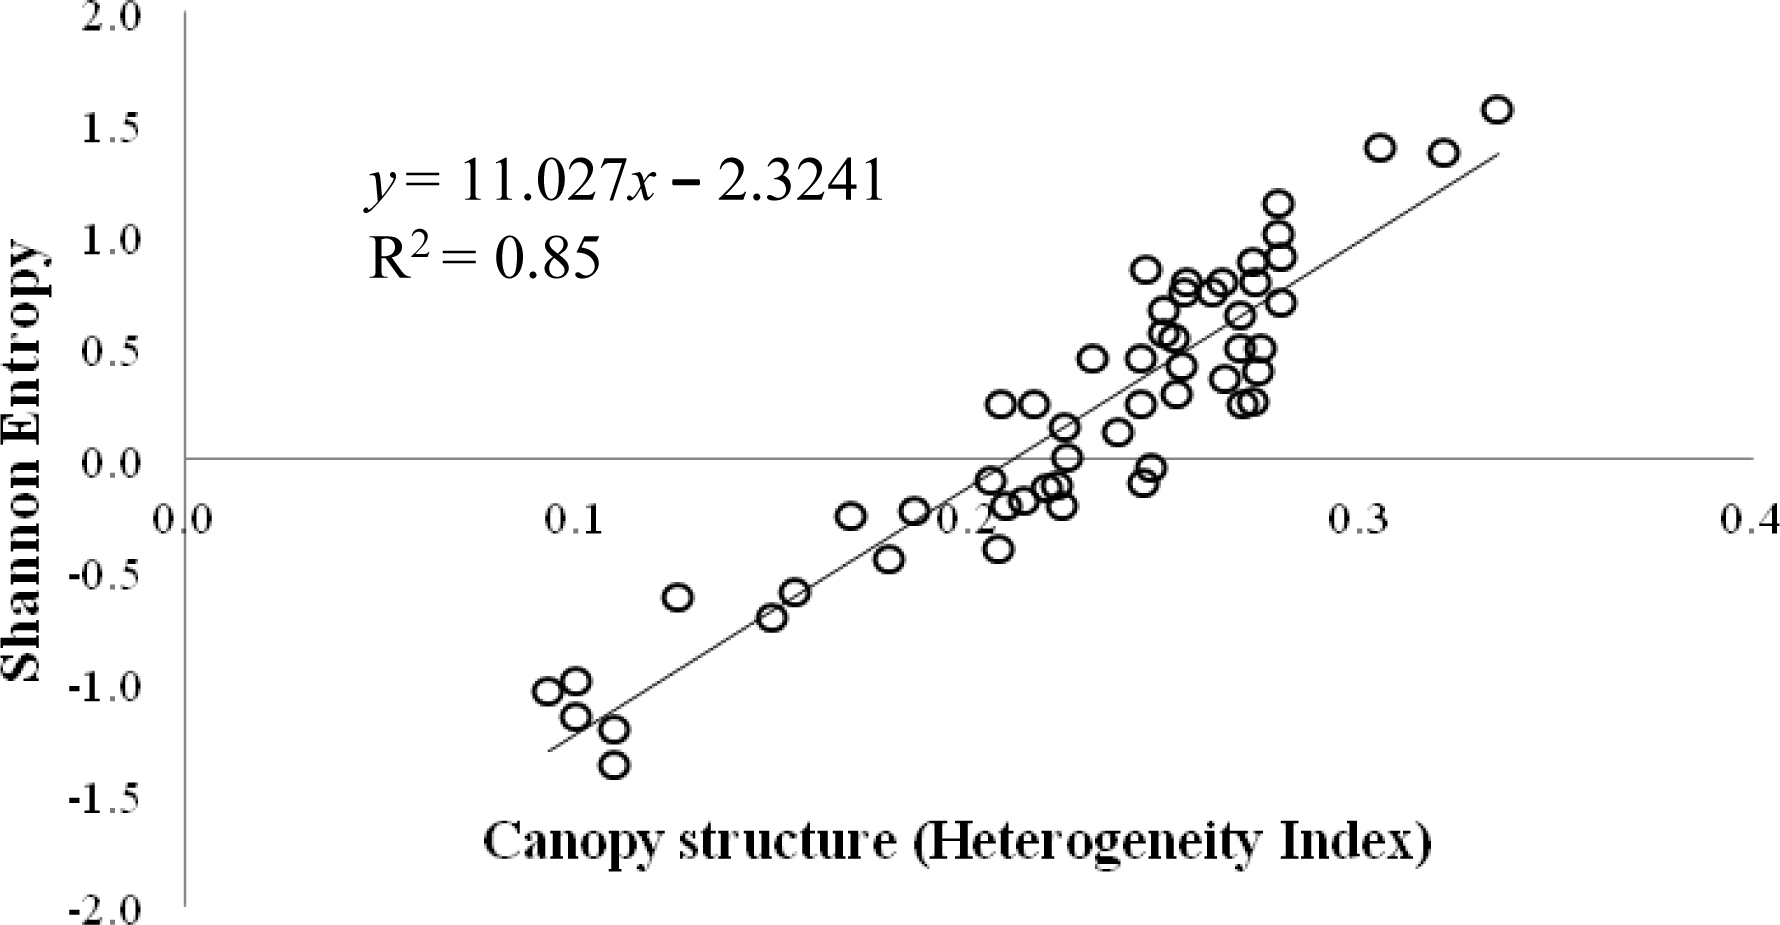
When analyzing the relationship between the polarimetric parameters and the backscattering coefficients extracted from the SAR image and the heterogeneity structure index extracted from the field measurements, it can be seen that (1) three of these regressions are significant (p-value < 0.05) and two of them present a good goodness-of-fit (R-squared = 0.4 for the double bounce parameter and R-squared = 0.85 for the Shannon entropy index); and (2) the Shannon entropy index is the most correlated variable with field data (Table 2 and Figure 7).
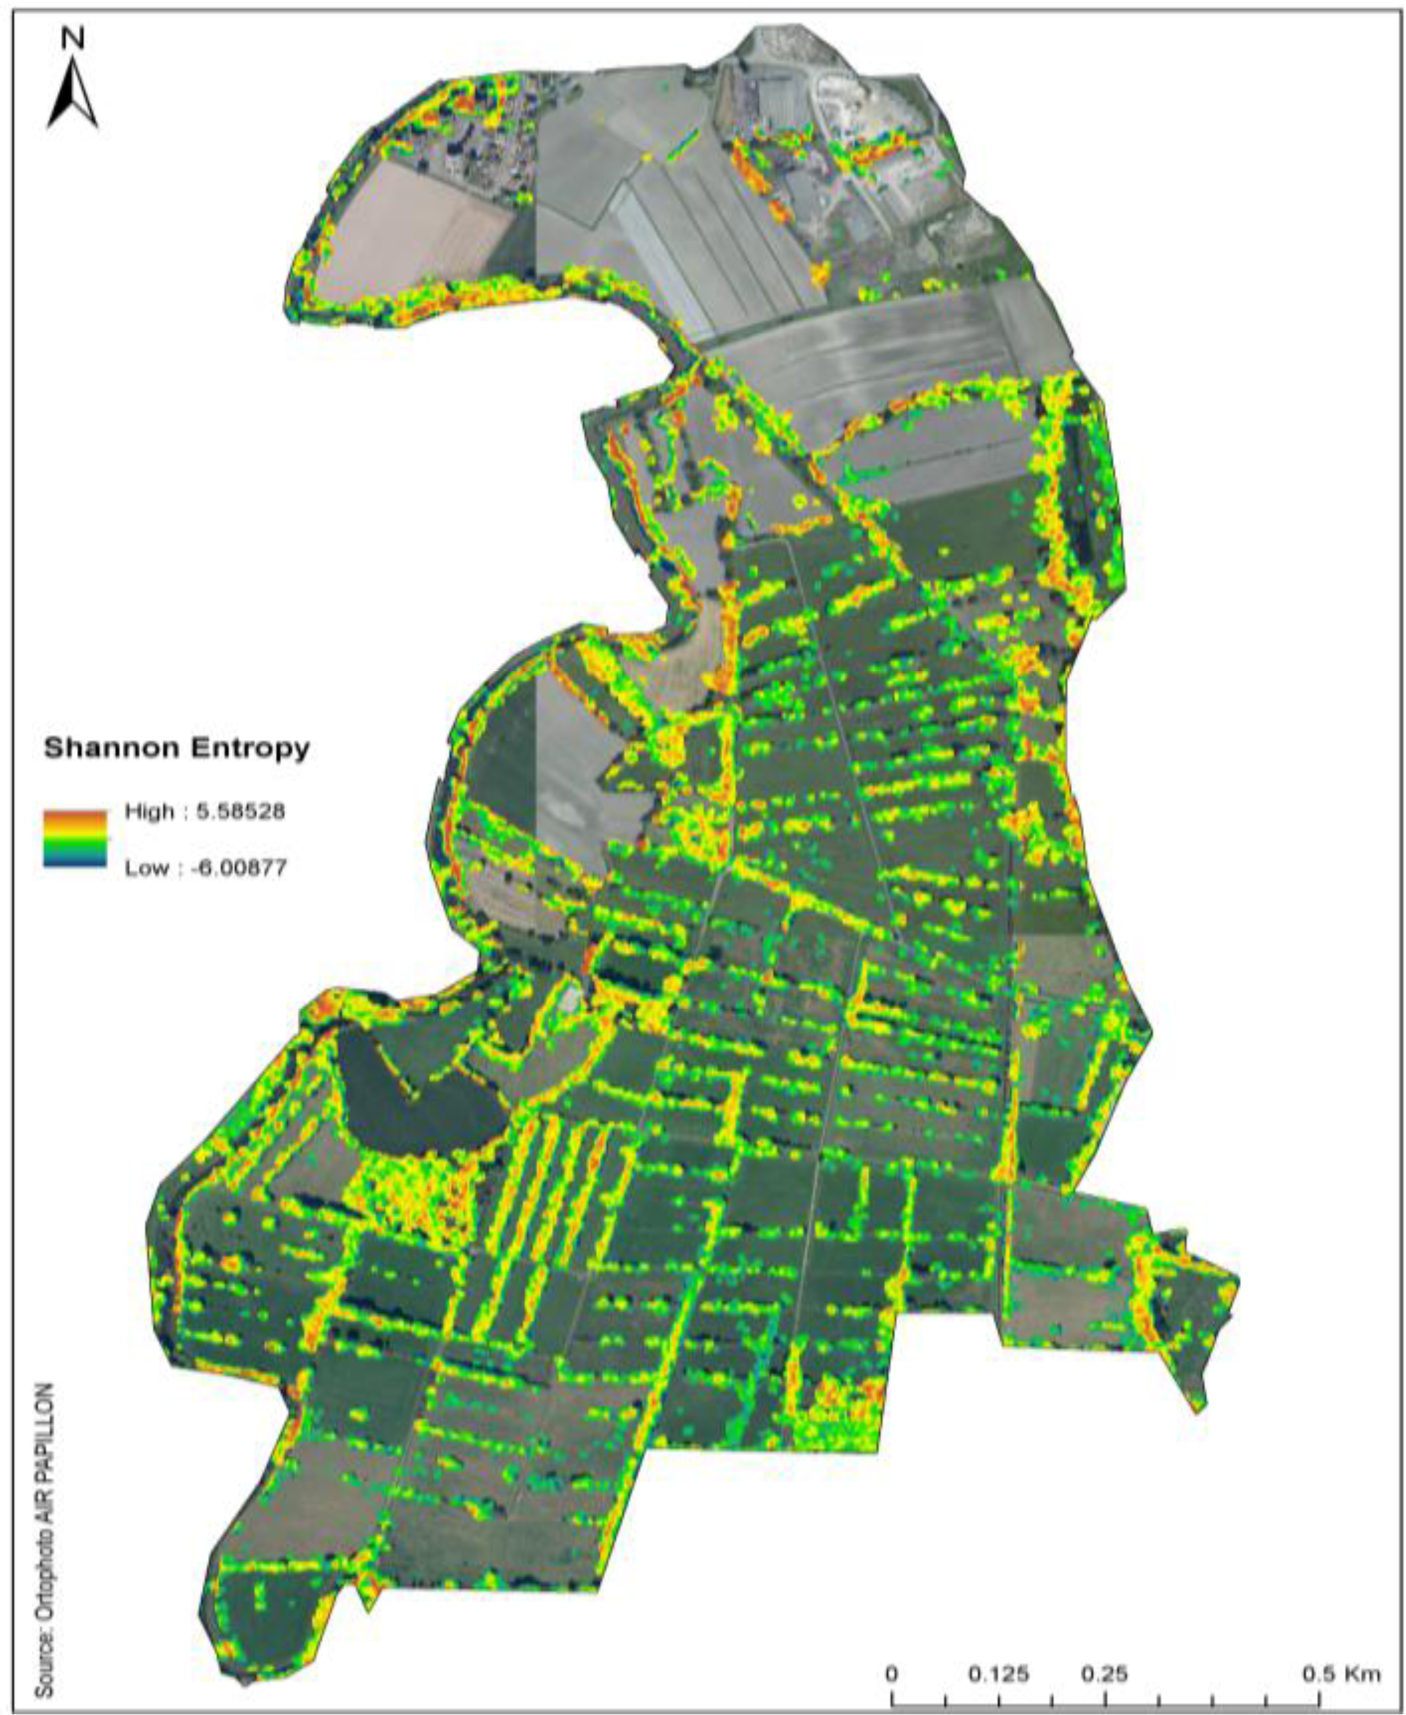
The analysis of the Shannon entropy index associated with the hedgerows extracted from TerraSAR-X shows a quite large range of values (from −6 to +5), and a wide spatial variability which highlights the heterogeneity of the hedgerow network structure (Figure 8).
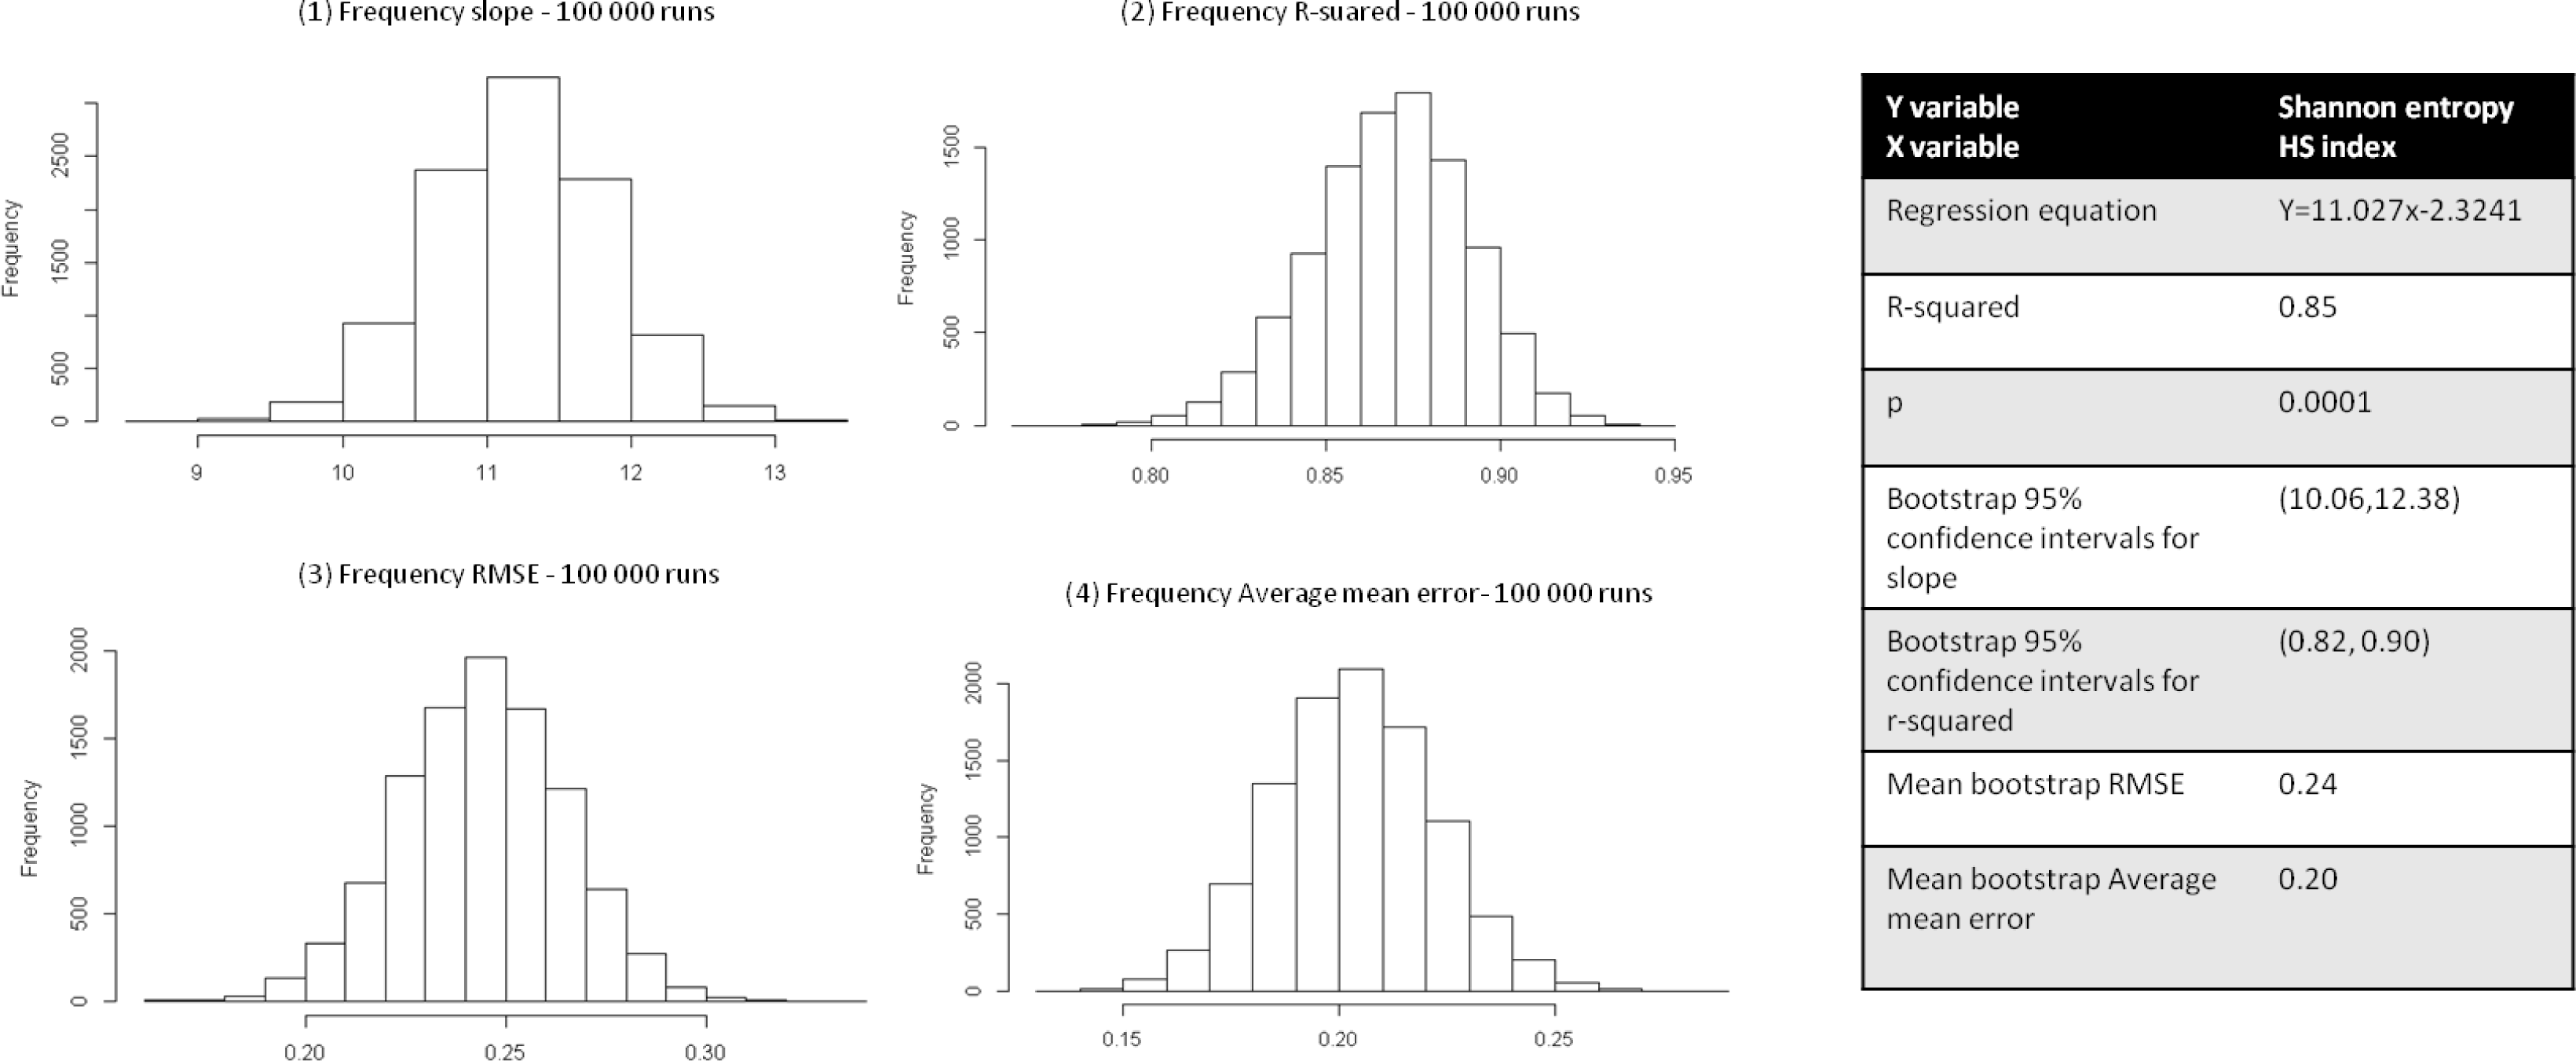
The evaluation statistics derived from the bootstrap analysis (Figure 9) indicates a good agreement between HS index and Shannon entropy estimated through the subsampling with R-squared values ranging between 0.82 and 0.90. The interval of RMSE and average mean error is low (0.10) and the average mean error is equal to 1.4. We can also notice that the slope is significantly different from zero (p < 0.05) for the 100,000 bootstrap samples with confident intervals comprise between 10.06 and 12.38.
4. Discussion
This study is the first to describe the inner structure of woody linear features such as hedgerows using SAR images. This study provides a methodology to detect hedgerow networks using polarimetric parameters. Moreover, the results show that one polarimetric parameter, i.e., the Shannon entropy, is highly sensitive to the canopy structure.
The extraction of hedgerow networks was achieved with an object-oriented method using two polarimetric parameters: the single bounce parameter and the Shannon entropy index derived from one TerraSAR-X image. As proved in this study, SAR imagery can be used to identify hedgerows in agricultural landscapes, the accuracy of hedgerow classification being over 90% (KIA = 0.92). These results are comparable to those from similar studies that aimed to develop methods to automatically extract linear landscape features such as hedgerows from VHRS optical data using object-oriented [16,21,22]; hybrid pixel-based and object-oriented [47], or waveform recognition-based [21] classification algorithms. Bargiel (2013) [22] detected semi-natural habitats and hedges composed of trees and shrubs with a global accuracy of 70.4% using textural indexes calculated from backscattering coefficients derived from a TerraSAR-X time series. Bargiel (2013) [22] and the present study provide good results for the detection of hedgerows. Because of the different approaches adopted, the results cannot be compared directly. Indeed the presented study use only one TerraSAR-X image and Bargiel et al. [22] used a supervised classification of multi-temporal TerraSAR-X data. The results of this study shows that polarimetric parameters derived from TerraSAR-X imagery allow good identification of hedgerow networks. Hedgerow orientation relative to radar azimuth does not affect the ability of SAR sensors to detect hedgerows. Indeed, hedgerow discontinuity (Figure 6) is mainly due to the presence of gaps in hedgerows (as shown on the picture in Figure 1). These gaps are due to the presence of pastured grasslands on either side of hedgerows. This point is interesting because compared to optical data mostly acquired in summer during cloudless periods when trees have leaves that hide gaps in hedgerows, radar data should have better detect hedgerow discontinuities which is a reliable information to study species distribution patterns [14].
Regarding the spatial behavior of radar signal in hedgerow structure assessment, the results of this study show that only the Shannon entropy index presents a very good correlation with the heterogeneity structure index that reflects the canopy fragmentation. Regarding the σ° HH and σ° VV parameters, i.e., the single and double bounces, the correlations are low (respectively NS and 0.4 for the double bounce parameter). This result is in accordance with radar theory because even if the double bounce mechanism is higher than the single bounce in vegetation cover [38], it is not the dominant backscattering mechanism. Indeed, volume scattering (HV polarization) is generally more sensitive to the tree structure [38]. This was not studied here because the TerraSAR-X image we used presented only HH and VV polarizations. In spotlight mode, only HH-VV dual pol TerraSAR-X data are available with a very high spatial resolution (1 m to 2 m). HV images in dual pol mode are only delivered in stripmap mode [48] with a lower spatial resolution which is not compatible with the extraction of hedgerow networks.
This approach was applied on a TerraSAR-X image acquired at the beginning of the spring period. At this period, the maize agricultural plots were at a plowed bare soil stage on the study site. The rule set developed to automatically extract hedgerows was adapted to this particular period but would need to be adapted for a SAR image acquired during another period for instance in summer. Indeed, the surface statuses vary across the seasons with vegetation growth, for example the maize crop is at sowing stage in spring and harvest stage in late summer. In this particular case, the double bounce image could be used to identify crops especially at the beginning of their growth, because the double bounce mechanisms increase due to the interactions between the radar pulse, the vegetation stems and the underlying surface [34]. Regarding the hedgerow structure characterization, it is important to note that the TerraSAR-X image used was acquired during a leaf-off period. This study could not have been conducted at another time period, because the X-band is not able to penetrate a dense crown cover. We can also notice that the orientation of hedgerows relative to the radar azimuth is an important feature for the canopy fragmentation interpretation. Indeed, layover has to be considered when hedgerows are perpendicular to radar azimuth, since they increase the number of mixed pixels within hedgerows.
By revealing the capability of TerraSAR-X images for the classification of hedgerows and the detection of their inner canopy structure, the present study supplies interesting information about the possibilities for the determination of ecological metrics based on remote sensing data. In further work, it would be interesting to calculate landscape metrics such as for instance the landscape grain [31] or to quantify the linear hedgerow fragmentation. These metrics should be used to study the spatial distribution of species and could help to understand how some species use hedgerows for their dispersion and how far species immigrate into them. Indeed the identification and characterization of hedgerows are often required in landscape ecology studies to evaluate the response of some species to landscape structure, composition and configurations [49,50]. Different studies [51,52] have also considered the potential of hedgerows as ecological corridors for the movement of plants and animals in shady (forest like) conditions, thus, with a dense canopy structure. Therefore, determining the linear fragmentation of the hedgerow network is essential for hedgerow management for biodiversity [53]. The windbreak function is also highly dependent on the continuity of hedgerow networks and hedgerow canopy cover.
5. Conclusions
This paper explores the use of radar SAR imagery to (i) detect hedgerow networks; and (ii) describe hedgerow canopy heterogeneity using TerraSAR-X imagery. The results show that the hedgerow network and its fragmentation can be identified with a very good accuracy. This study also reveals the importance of the use of one polarimetric parameter, the Shannon entropy, to study the canopy fragmentation, which cannot be achieved with optical images. Therefore, VHSR radar images can both accurately detect the presence of wooded hedgerow networks and characterize their structure.
This information can be exploited for landscape ecology studies, for example in calculating landscape metrics in order to analyze the function of hedgerows as dispersal corridors of forest species.
Acknowledgments
This work was supported by the DIVA 3-AGRICONNECT program, the CNES (PhD grant to J. Betbeder) and the DLR by providing TerraSAR-X imagery, and the Zone Atelier Armorique. Air Papillon took the aerial photos.
Author Contributions
All authors contributed extensively to the work presented in this paper. Julie Betbeder and Eric Pottier processed the radar images; Julie Betbeder, Jean Nabucet and Jacques Baudry developed the field methodology and led an interpretation of the results. Laurence Hubert-Moy initiated the project. Julie Betbeder and Laurence Hubert-Moy drafted the manuscript, which was revised by all authors. All authors read and approved the final manuscript.
Conflicts of Interest
The authors declare no conflict of interest.
References
- Forman, R.T.T.; Baudry, J. Hedgerows and hedgerow networks in landscape ecology. Environ. Manag 1984, 8, 495–510. [Google Scholar]
- Larcher, F.; Baudry, J. Landscape grammar: A method to analyse and design hedgerows and networks. Agrofor. Syst 2013, 87, 181–192. [Google Scholar]
- Baudry, J.; Bunce, R.G.; Burel, F. Hedgerows: An international perspective on their origin, function and management. J. Environ. Manag 2000, 60, 7–22. [Google Scholar]
- Burel, F. Effect of landscape structure and dynamics on species diversity in hedgerow networks. Landsc. Ecol 1992, 6, 161–174. [Google Scholar]
- Brandle, J.R.; Hodges, L.; Zhou, X.H. Windbreaks in North American Agricultural Systems. In New Vistas in Agroforestry; Nair, P.K.R., Rao, M.R., Buck, L.E., Eds.; Springer Netherlands: Dordrecht, The Netherlands, 2004; pp. 65–78. [Google Scholar]
- Torita, H.; Satou, H. Relationship between shelterbelt structure and mean wind reduction. Agric. For. Meteorol 2007, 145, 186–194. [Google Scholar]
- McCollin, D.; Jackson, J.; Bunce, R.G.; Barr, C.; Stuart, R. Hedgerows as habitat for woodland plants. J. Environ. Manag 2000, 60, 77–90. [Google Scholar]
- Hinsley, S.; Bellamy, P. The influence of hedge structure, management and landscape context on the value of hedgerows to birds: A review. J. Environ. Manag 2000, 60, 33–49. [Google Scholar]
- Baudry, J.; Burel, F.; Thenail, C.; le Cœur, D. A holistic landscape ecological study of the interactions between farming activities and ecological patterns in Brittany, France. Landsc. Urban Plan 2000, 50, 119–128. [Google Scholar]
- Defra. In Hedgerow Survey Handbook. A Standard Procedure for Local Surveys in the UK; Defra: London, UK, 2007.
- Karnieli, A.; Meiseis, A.; Fisher, L.; Arkin, Y. Automatic extraction and evaluation of geological linear features from digital remote sensing data using a hough transform. Photogramm. Eng. Remote Sens 1996, 62, 525–531. [Google Scholar]
- Li, L.; Mao, F.; Qian, W.; Clarke, L.P. Wavelet Transform for Directional Feature Extraction in Medical Imaging. Proceedings of the International Conference on Image Processing 1997, Santa Barbara, CA, USA, 26–29 October 1997; 3, pp. 500–503.
- Mulder, V.L.; de Bruin, S.; Schaepman, M.E.; Mayr, T.R. The use of remote sensing in soil and terrain mapping—A review. Geoderma 2011, 162, 1–19. [Google Scholar]
- Burel, F.; Baudry, J. Structural dynamic of a hedgerow network landscape in Brittany France. Landsc. Ecol 1990, 4, 197–210. [Google Scholar]
- Lechner, A.M.; Stein, A.; Jones, S.D.; Ferwerda, J.G. Remote sensing of small and linear features: Quantifying the effects of patch size and length, grid position and detectability on land cover mapping. Remote Sens. Environ 2009, 113, 2194–2204. [Google Scholar]
- Vannier, C.; Hubert-Moy, L. Wooded Hedgerows Characterization in Rural Landscape Using Very High Spatial Resolution Satellite Images. Proceedings of the 2010 IEEE International Geoscience and Remote Sensing Symposium (IGARSS), Austin, TX, USA, 13–18 June 2010; pp. 347–350.
- Aksoy, S.; Akcay, G.; Cinbis, G.; Wassenaar, T. Automatic Mapping of Linearwoody Vegetation Features in Agricultural Landscapes. Proceedings of the IEEE International Geoscience and Remote Sensing Symposium (IGARSS), Boston, MA, USA, 7–11 July 2008; 4, pp. IV–403–IV–406.
- Tansey, K.; Chambers, I.; Anstee, A.; Denniss, A.; Lamb, A. Object-oriented classification of very high resolution airborne imagery for the extraction of hedgerows and field margin cover in agricultural areas. Appl. Geogr 2009, 29, 145–157. [Google Scholar]
- Lausch, A.; Herzog, F. Applicability of landscape metrics for the monitoring of landscape change: Issues of scale, resolution and interpretability. Ecol. Indic 2002, 2, 3–15. [Google Scholar]
- Fauvel, M.; Sheeren, D.; Chanussot, J.; Benediktsson, J.A. Hedges Detection Using Local Directional Features and Support Vector Data Description. Proceedings of the IEEE International Geoscience and Remote Sensing Symposium (IGARSS), Munich, Germany, 22–27 July 2012; pp. 2320–2323.
- Deng, R.X.; Li, Y.; Wang, W.J.; Zhang, S.W. Recognition of shelterbelt continuity using remote sensing and waveform recognition. Agrofor. Syst 2013, 87, 827–834. [Google Scholar]
- Bargiel, D. Capabilities of high resolution satellite radar for the detection of semi-natural habitat structures and grasslands in agricultural landscapes. Ecol. Inform 2013, 13, 9–16. [Google Scholar]
- Wiseman, G.; Kort, J.; Walker, D. Quantification of shelterbelt characteristics using high-resolution imagery. Agric. Ecosyst. Environ 2009, 131, 111–117. [Google Scholar]
- Czerepowicz, L.; Case, B.S.; Doscher, C. Using satellite image data to estimate aboveground shelterbelt carbon stocks across an agricultural landscape. Agric. Ecosyst. Environ 2012, 156, 142–150. [Google Scholar]
- Jacquemoud, S.; Verhoef, W.; Baret, F.; Bacour, C.; Zarco-Tejada, P.J.; Asner, G.P.; François, C.; Ustin, S.L. PROSPECT + SAIL models: A review of use for vegetation characterization. Remote Sens. Environ 2009, 113, S56–S66. [Google Scholar]
- Popescu, S.C.; Zhao, K. A voxel-based lidar method for estimating crown base height for deciduous and pine trees. Remote Sens. Environ 2008, 112, 767–781. [Google Scholar]
- Véga, C.; Durrieu, S. Multi-level filtering segmentation to measure individual tree parameters based on Lidar data: Application to a mountainous forest with heterogeneous stands. Int. J. Appl. Earth Obs. Geoinf 2011, 13, 646–656. [Google Scholar]
- Heinzel, J.; Koch, B. Exploring full-waveform LiDAR parameters for tree species classification. Int. J. Appl. Earth Obs. Geoinf 2011, 13, 152–160. [Google Scholar]
- DEFINIENS. In Ecognition Professional: User Guide 4; Definiens Imaging Gmbh: Munich, Germany, 2004.
- Burel, F.; Baudry, J. Landscape Ecology: Concepts, Methods, and Applications; Science Publishers: Boca Raton, FL, USA, 2003. [Google Scholar]
- Vannier, C.; Vasseur, C.; Hubert-Moy, L.; Baudry, J. Multiscale ecological assessment of remote sensing images. Landsc. Ecol 2011, 26, 1053–1069. [Google Scholar]
- Ulaby, F.T. Radar Polarimetry for Geoscience Applications; Artech House Inc: Norwood, MA, USA, 1990. [Google Scholar]
- Corgne, S.; Magagi, R.; Yergeau, M.; Sylla, D. An integrated approach to hydro-geological lineament mapping of a semi-arid region of West Africa using Radarsat-1 and GIS. Remote Sens. Environ 2010, 114, 1864–1875. [Google Scholar]
- Baghdadi, N.; Boyer, N.; Todoroff, P.; El Hajj, M.; Bégué, A. Potential of SAR sensors TerraSAR-X, ASAR/ENVISAT and PALSAR/ALOS for monitoring sugarcane crops on Reunion Island. Remote Sens. Environ 2009, 113, 1724–1738. [Google Scholar]
- TerraSAR-X Ground Segment. Level 1b Product Format Specification. Available online: http://www2.astrium-geo.com/files/pmedia/public/r460_9_030201_level-1b-product-format-specification_1.3.pdf (accessed on 17 April 2014).
- Lee, J.-S. Speckle analysis and smoothing of synthetic aperture radar images. Comput. Graph. Image Process 1981, 17, 24–32. [Google Scholar]
- Pottier, E. Recent Advances in the Development of the Open Source Toolbox for Polarimetric and Interferometric Polarimetric SAR Data Processing: The PolSARpro v4.1.5 Software. Proceedings of the 2010 IEEE International Geoscience and Remote Sensing Symposium (IGARSS), Honolulu, HI, USA, 25–30 July 2010; pp. 2527–2530.
- Lee, J.-S.; Pottier, E. Polarimetric Radar Imaging: From Basics to Applications; CRC Press: Boca Raton, FL, USA, 2009. [Google Scholar]
- Réfrégier, P.; Morio, J. Shannon entropy of partially polarized and partially coherent light with Gaussian fluctuations. J. Opt. Soc. Am. A 2006, 23, 3036–3044. [Google Scholar]
- Bargiel, D.; Herrmann, S.; Lohmann, P.; Sörgel, U.; Wagner, W.; Szekely, B. Land Use Classification with High-resolution Satellite Radar for Estimating the Impacts of Land-Use Change on the Quality of Ecosystem Services. Proceedings of the ISPRS TC VII Symposium—100 Years ISPRS Advancing Remote Sensing Science (ISPRS), Vienna, Austria, 5–7 July 2010; pp. 68–73.
- Schuster, C.; Ali, I.; Lohmann, P.; Frick, A.; Förster, M.; Kleinschmit, B. Towards detecting swath events in Terrasar-x time series to establish natura 2000 grassland habitat swath management as monitoring parameter. Remote Sens 2011, 3, 1308–1322. [Google Scholar]
- Marechal, C.; Pottier, E.; Hubert-Moy, L.; Rapinel, S. One year wetland survey investigations from quad-pol RADARSAT-2 time-series SAR images. Can. J. Remote Sens 2012, 38, 240–252. [Google Scholar]
- Congalton, R.G. A review of assessing the accuracy of classifications of remotely sensed data. Remote Sens. Environ 1991, 37, 35–46. [Google Scholar]
- Fielding, A.H.; Bell, J.F. A review of methods for the assessment of prediction errors in conservation presence/absence models. Environ. Conserv 1997, 24, 38–49. [Google Scholar]
- Hastier, T.; Tibshirani, R.; Friedman, J. The Elements of Statistical Learning—Data Mining, Inference, and Prediction, 2nd ed; Springer Series in Statistics: New York, NY, USA, 2009. [Google Scholar]
- Potts, J.M.; Elith, J. Comparing species abundance models. Ecol. Model 2006, 199, 153–163. [Google Scholar]
- Sheeren, D.; Bastin, N.; Ouin, A.; Ladet, S.; Balent, G.; Lacombe, J.-P. Discriminating small wooded elements in rural landscape from aerial photography: A hybrid pixel/object-based analysis approach. Int. J. Remote Sens 2009, 30, 4979–4990. [Google Scholar]
- Roth, A.; Eineder, M.; Schättler, B. TerraSAR-X: A New Perspective for Applications Requiring High Resolution Spaceborne SAR Data. Proceedings of the Joint ISPRS 6 EarSel Workshop on High Resolution Mapping from Space 2003, Hannover, Germany, 6–8 October 2003; pp. 1–4.
- Ouin, A.; Sarthou, J.-P.; Bouyjou, B.; Deconchat, M.; Lacombe, J.-P.; Monteil, C. The species-area relationship in the hoverfly (Diptera, Syrphidae) communities of forest fragments in southern France. Ecography 2006, 29, 183–190. [Google Scholar]
- Balent, G.; Courtiade, B. Modelling bird communities/landscape patterns relationships in a rural area of South-Western France. Landsc. Ecol 1992, 6, 195–211. [Google Scholar]
- Hill, C.J. Bandas de lineales vegetación de selvas tropicales como potenciales corredores dispersores para insectos de la selva tropical. Conserv. Biol 1995, 9, 1559–1566. [Google Scholar]
- Tischendorf, L.; Irmler, U.; Hingst, R. A simulation experiment on the potential of hedgerows as movement corridors for forest carabids. Ecol. Model 1998, 106, 107–118. [Google Scholar]
- Baudry, J.; Jouin, A. Institut National de la Recherche Agronomique (France). In De la haie aux Bocages Organisation, Dynamique et Gestion; Institut National de la Recherche Agronomique: Paris, France, 2003. [Google Scholar]


| Classification | Validation | ||||
|---|---|---|---|---|---|
| Code | 1 | 2 | Total | Over-Detection (%) | |
| Hedgerows | 1 | 38 | 2 | 40 | 5 |
| No hedgerows | 2 | 1 | 38 | 39 | 2.5 |
| Total column | 39 | 40 | |||
| Under-detection (%) | 2.5 | 5 | |||
| Kappa index | 0.92 | ||||
| Overall accuracy | 0.96 | ||||
| Radar | R2 | p-value |
|---|---|---|
| σ° HH | NS | |
| σ° VV | NS | |
| Single Bounce | 0.1 | 0.001 |
| Double Bounce | 0.4 | <0.0001 |
| Shannon Entropy | 0.85 | <0.0001 |
© 2014 by the authors; licensee MDPI, Basel, Switzerland This article is an open access article distributed under the terms and conditions of the Creative Commons Attribution license (http://creativecommons.org/licenses/by/3.0/).
Share and Cite
Betbeder, J.; Nabucet, J.; Pottier, E.; Baudry, J.; Corgne, S.; Hubert-Moy, L. Detection and Characterization of Hedgerows Using TerraSAR-X Imagery. Remote Sens. 2014, 6, 3752-3769. https://doi.org/10.3390/rs6053752
Betbeder J, Nabucet J, Pottier E, Baudry J, Corgne S, Hubert-Moy L. Detection and Characterization of Hedgerows Using TerraSAR-X Imagery. Remote Sensing. 2014; 6(5):3752-3769. https://doi.org/10.3390/rs6053752
Chicago/Turabian StyleBetbeder, Julie, Jean Nabucet, Eric Pottier, Jacques Baudry, Samuel Corgne, and Laurence Hubert-Moy. 2014. "Detection and Characterization of Hedgerows Using TerraSAR-X Imagery" Remote Sensing 6, no. 5: 3752-3769. https://doi.org/10.3390/rs6053752