Review

Rapid Damage Assessment by Means of Multi-Temporal SAR — A Comprehensive Review and Outlook to Sentinel-1

German Remote Sensing Data Center (DFD), German Aerospace Center (DLR), D-82234 Oberpfaffenhofen, Germany
Remote Sens. 2014, 6(6), 4870-4906; https://doi.org/10.3390/rs6064870
Submission received: 29 March 2014 / Revised: 20 May 2014 / Accepted: 20 May 2014 / Published: 28 May 2014

Abstract

:
Fast crisis response after natural disasters, such as earthquakes and tropical storms, is necessary to support, for instance, rescue, humanitarian, and reconstruction operations in the crisis area. Therefore, rapid damage mapping after a disaster is crucial, i.e., to detect the affected area, including grade and type of damage. Thereby, satellite remote sensing plays a key role due to its fast response, wide field of view, and low cost. With the increasing availability of remote sensing data, numerous methods have been developed for damage assessment. This article gives a comprehensive review of these techniques focusing on multi-temporal SAR procedures for rapid damage assessment: interferometric coherence and intensity correlation. The review is divided into six parts: First, methods based on coherence; second, the ones using intensity correlation; and third, techniques using both methodologies combined to increase the accuracy of the damage assessment are reviewed. Next, studies using additional data (e.g., GIS and optical imagery) to support the damage assessment and increase its accuracy are reported. Moreover, selected studies on post-event SAR damage assessment techniques and examples of other applications of the interferometric coherence are presented. Then, the preconditions for a successful worldwide application of multi-temporal SAR methods for damage assessment and the limitations of current SAR satellite missions are reported. Finally, an outlook to the Sentinel-1 SAR mission shows possible solutions of these limitations, enabling a worldwide applicability of the presented damage assessment methods.

1. Introduction

1.1. Why Rapid Damage Assessment Is Crucial after a Disaster

Table 1 shows the ten most important natural disasters in the time period between 1980 and 2012 sorted by the number of fatalities. Earthquakes and tropical storms are among the most dangerous natural hazards for human life.
According to Seneviratne et al. [1], global change will cause an increase of both frequency and intensity of heavy rainfall, hurricanes and cyclones leading to an increase of floods and destructions. In addition secondary effects, such as landslides triggered by heavy rainfall, will occur more often. To enable fast crisis response, e.g., to support rescue, humanitarian and reconstruction operations in the crisis area, damage mapping is very important. The areas affected by the destruction have to be identified and it is also crucial to detect which roads, railroads, airports and ports are still intact to be used for the crisis support [2,3]. The same is also vital for crisis response after other types of natural disasters, such as earthquakes and volcanic eruptions.
Remote sensing plays a key role in the support of fast disaster response. Space-borne sensors enable the monitoring of a wide field of view (tens of km to more than 100 km) at low costs with a regular revisit time (several days, depending on the orbit altitude). Furthermore, satellites have the great advantage of fast response capacities. However, it could take up to several days until a specific polar orbiting satellite with a Synthetic Aperture Radar (SAR) sensor onboard flies on a track which enables the recording of the area affected by the disaster. Constellations of satellites (e.g., COSMO-SkyMed [4], or the upcoming Radarsat constellation [5], and Sentinel-1 cf. Section 5) and the synergetic exploitation of different SAR platforms (e.g., TerraSAR-X [6] with COSMO-SkyMed) strongly reduce the response times.
Using Earth Observation (EO) data, the rescue teams could directly concentrate on the most damaged areas without the need of first checking the entire crisis area on the ground [3,710].
A very important cooperation which should be mentioned in this regard is the International Charter of Space and Major Disasters [11], an international cooperation of space agencies that aims to support fast crisis response by providing EO data free of charge to those affected by a natural or man-made disaster [12].
Moreover, founded by the European Commission the Copernicus (former Global Monitoring for Environment and Security—GMES [13]) Emergency Management Service (GIO EMS [14]) covers a wide range of emergency situations resulting from man-made or natural disasters. Before becoming an operational service in April 2012, GIO EMS was prepared by the pre-operational GMES precursor project Services and Applications for Emergency Response (SAFER [15]).
The United Nations Institute for Training and Research (UNITAR) Operational Satellite Applications Programme (UNOSAT) [16] concentrates its rapid mapping actions especially at Third World countries.
Furthermore, Sentinel Asia, an international cooperation for monitoring natural disasters using EO data, focuses especially at the Asian and Pacific region [17].
Additional to the aforementioned international co-operations, national services such as the Center for Satellite Based Crisis Information (ZKI) operated by the German Aerospace Center DLR [12,18] or the French SErvice Régional de Traitement d’Image et de Télédétection (SERTIT [19]) provide rapid mapping capacities to support response to national and international disasters.
This paper is structured as follows: After showing the necessity of rapid damage assessment after a crisis, Section 1.2 gives a brief introduction into SAR and its advantages compared to optical sensors. Section 1.3 shows the principle on SAR interferometry (InSAR). Section 2 describes the multi-temporal SAR damage assessment methods this paper focuses on: interferometric coherence and SAR intensity correlation. This section also includes an investigation of the factors influencing the coherence (de-correlation).
Section 3 gives a literature review and comparison of interferometric coherence and intensity correlation: First, damage assessment procedures using the coherence are reviewed. Second, the ones using intensity correlation and third, techniques using both methodologies combined are presented. Section 3.4 reports studies using additional data (e.g., GIS and optical imagery) to support the damage assessment and increase its accuracy. Section 3.5 summarizes the achieved accuracies of the damage assessment methods reviewed in the Sections 3.1–3.4. Sections 3.6 and 3.7 show selected post-event SAR damage assessment techniques and examples of other applications of the interferometric coherence, respectively.
Section 4 presents the preconditions for a successful worldwide application of multi-temporal SAR methods for damage assessment and the limitations of current SAR satellite missions. Next, Section 5 gives an outlook to the Sentinel-1 SAR mission showing possible solutions of these limitations to enable worldwide applicability of the reported damage assessment methods. Finally, concluding the article, Section 6 focuses especially on challenges for future research on multi-temporal SAR data based damage assessment methods and provides possible solutions hereof.

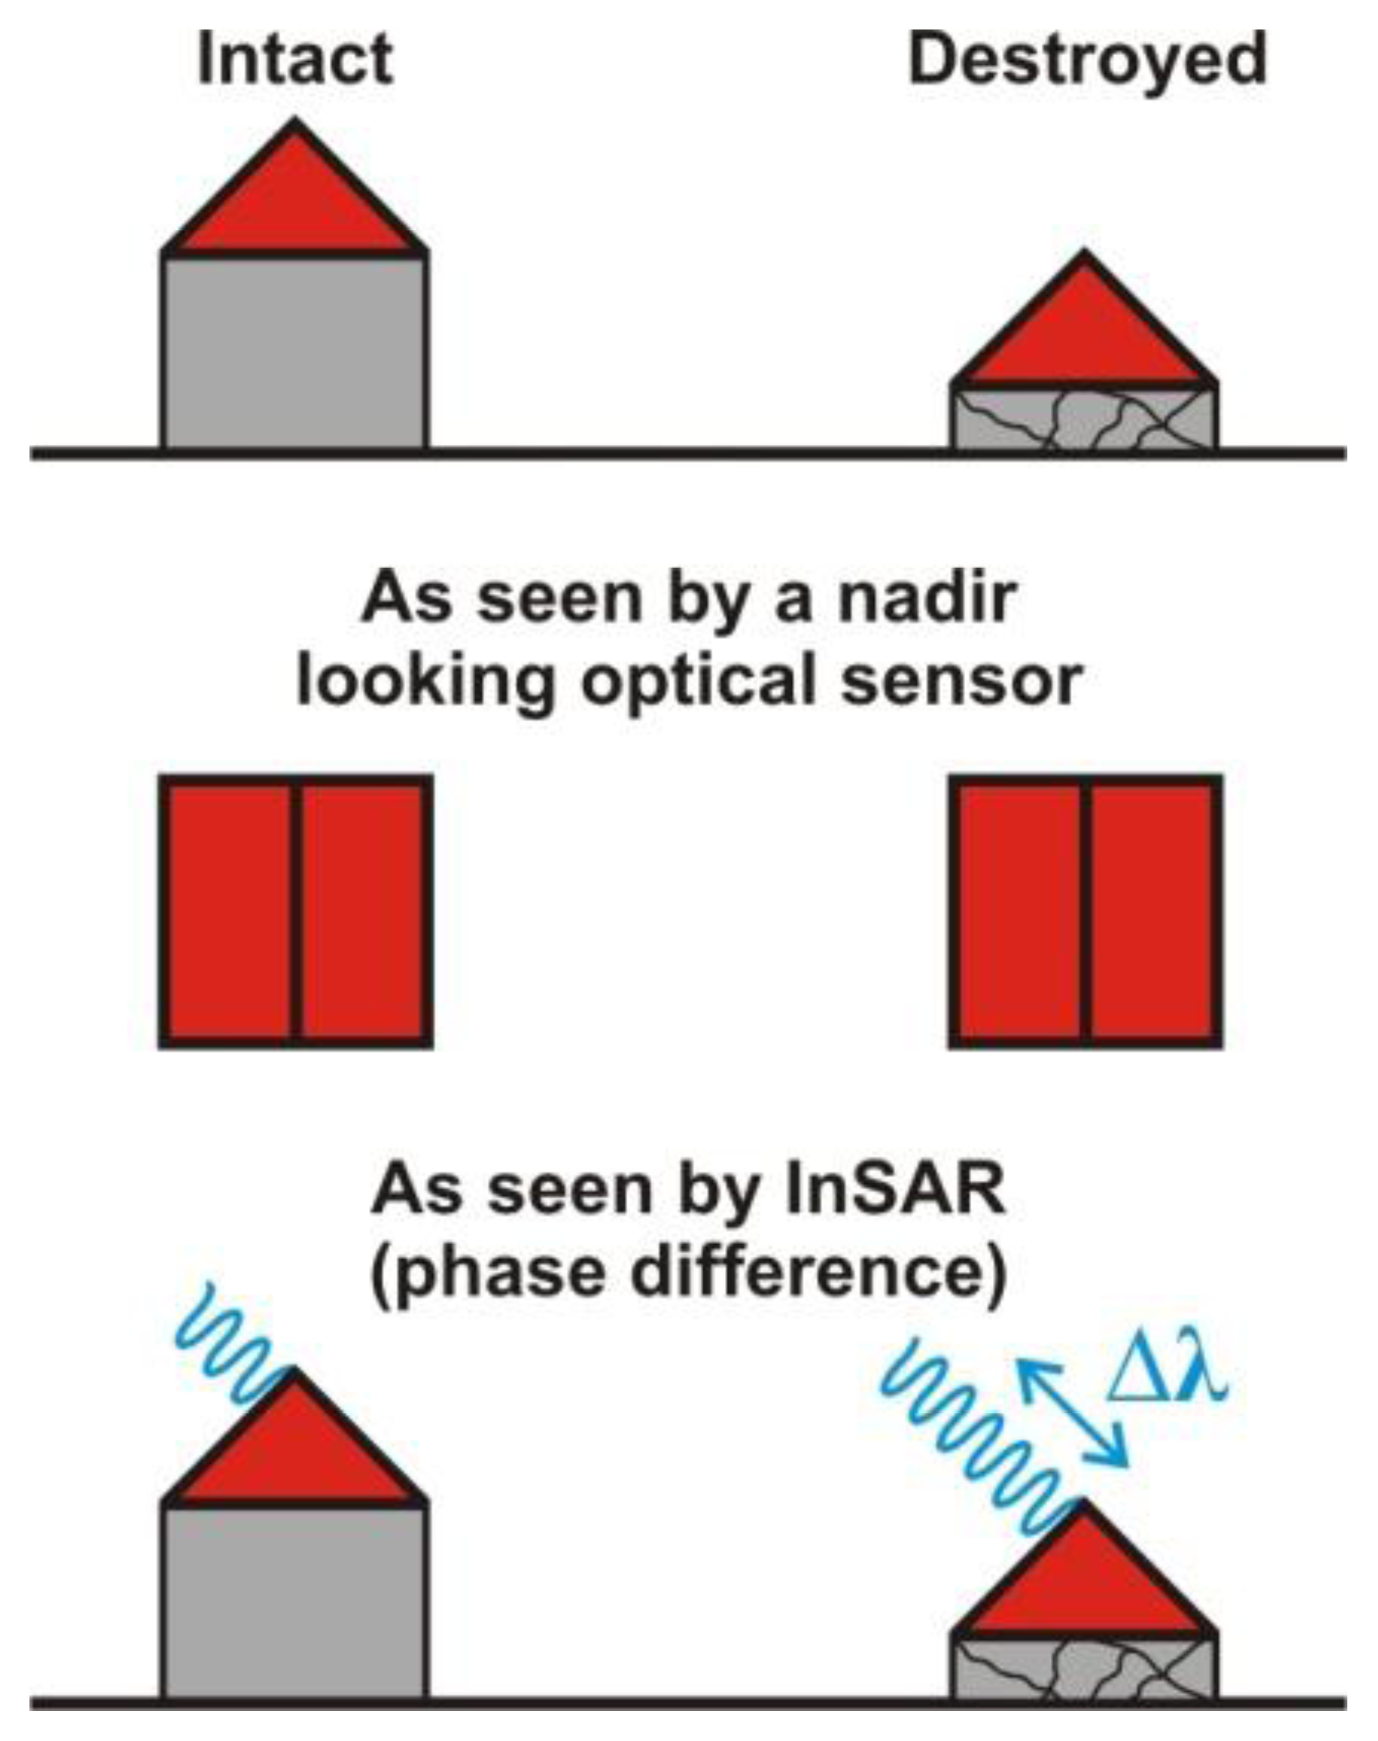
1.2. Brief Description of SAR and Its Advantages Compared to Optical Sensors

The most frequently used EO data for damage mapping after a natural disaster is high spatial resolution optical satellite imagery. However, due to frequent occurrence of clouds, smog, fog, etc.—especially in the equatorial region—optical EO data is not always useful [8,21]. SAR has several advantages compared to optical sensors. First, as an active sensor SAR is independent of day and night, while passive optical sensors use the solar radiation. Second, due to its larger wavelength (λ: mm to dm) SAR is almost an all-weather technique as only larger atmospheric changes in the time between the radar acquisitions have a big influence on interferometric (InSAR) applications. Compared to this, optical sensors (λ: 0.4 μm to 1 mm) are using the visible and infrared part of the electromagnetic spectrum which is much more influenced by e.g., atmospheric water vapor [22]. In most cases, SAR EO data of the crisis area is earlier available than cloud free optical imagery. Therefore, SAR damage assessment methods enable faster disaster response. However, for both optical and SAR sensors, the revisit time of the satellite has to be taken into account (see Section 1.1). Table 2 gives an overview of the SAR missions which are relevant in this review article.
Furthermore, the larger wavelength of SAR sensors enables the investigation of the physical characteristics of the objects on the ground, i.e., SAR is sensitive to the surface roughness, its moisture content and for geometric structures. Especially the last aspect is very critical for damage assessment [8]. Contrary to this, optical sensors are more sensitive to the chemical structure of the ground targets, due to their definitely smaller wavelength.
The following example shows another advantage of SAR. A damaged building with destroyed or heavily damaged walls and still more or less intact roof is often difficult to identify when using optical imagery, especially in the near nadir region. Data from nadir-looking aerial and space-borne sensors provides information about the status of the building’s roof and the presence/absence of debris next to the building, but not direct information about the status of building walls [24,25]. A solution to this problem is high spatial resolution side-looking optical sensors [26], but with these sensors ground referencing is more complicated and they are less frequently available than nadir-looking sensors. Moreover, even non-nadir-looking very high spatial resolution sensors enable only the identification of major cracks in the wall. Slighter damage levels can only detected from in situ investigations.
The advantage of SAR is the use of the phase difference at SAR interferometric analysis (the latter is explained in detail in Section 1.3). Therefore, using SAR and especially the interferometric phase, there is a higher possibility to detect also apparently intact buildings as damaged ones (Figure 1)—presumed high enough spatial resolution of the SAR sensor and visibility of the building within the SAR image. Due to the side-looking imaging geometry of the SAR system, layover and shadowing effects greatly influence the visibility of a certain object within the SAR image [27].

1.3. SAR Interferometry

SAR interferometry uses two SAR acquisitions recorded at slightly different positions [2832]. The phase φ of the chromatic radar wave is directly proportional to the 2R travel way of the signal (double travel path from the sensor to the ground and back). Both sensors receive slightly different phase signals as the distance from the second SAR sensor to the object on the ground is by the amount of ΔR larger than the corresponding distance from the first SAR (Figure 2):
φ 1 = - 4 π λ R s + φ s c a t t 1
φ 2 = - 4 π λ ( R s + Δ R ) + φ s c a t t 2
ΔR depends on the perpendicular baseline B between the two SAR sensors and on the angle ϕ, which is the angle between the absolute and perpendicular baseline (Figure 2):
Δ R = B tan ϕ
Assuming constant backscattering properties at both acquisition times (φscatt1 = φscatt2), the interferometric phase φint is:
φ i n t = φ 1 - φ 2 = 4 π λ Δ R
The temporal baseline Bt, the time delay between both SAR acquisitions, is an important factor for successful InSAR applications, as with increasing of Bt the probability of backscattering property changes due to wind induced movement of trees or growth of vegetation increases [33].
Besides the use for damage assessment—which will be described in detail in Section 2—SAR interferometry (InSAR) is used for two main applications: (I) generation of digital elevation models (DEM) of the Earth’s surface [2832] and (II) measurement and analysis of terrain motion (differential SAR interferometry—DInSAR). For DEM generation φint is used to derive the terrain height of the object on the ground as represented in Figure 2. DInSAR measures the deformation in the time between the SAR acquisitions with sub-centimeter accuracy [3437]. It has been applied to study earthquakes [3841], volcanoes [4244], subsidence [4555], landslides [5469]), soil consolidation [70], and tectonic deformation [71,72].

2. Methods

This paper focuses on the use of SAR EO data for rapid damage assessment after a natural disaster, such as an earthquake, a tsunami, a storm, etc. According to Matsuoka and Yamazaki [73], a “simple” pre- and post-disaster SAR amplitude image comparison is often not very useful, as the SAR amplitude both decreases and increases after a disaster. Buildings could be reduced to debris after a disaster (e.g., an earthquake) increasing the SAR backscatter especially in the former darker neighborhood of the building. On the other hand, a tsunami or flood could wash the entire building away or the debris of the building may be cleared by reconstruction activities leading to a decrease of the SAR backscatter.
Therefore, this article concentrates on two kinds of multi-temporal SAR based damage assessment techniques, interferometric coherence and intensity correlation, being much better suited for damage assessment than a “simple” pre- and post-disaster SAR amplitude image comparison.
Common for all the damage assessment procedures based on either SAR intensity correlation or interferometric coherence is the use of at least three SAR images. Two pre-disaster SAR images acquired in the ideal case shortly before the event happened and at least one post-disaster image recorded shortly after the event are required (Figure 3; The temporal baseline will be explained in detail in the Sections 2.1 and 4). Hereby, all three SAR images have to be acquired at the same imaging geometry (same incidence angle, beam, relative orbit, pass direction (ascending/descending), imaging mode, wavelength, etc.).
First, all three (or more) SAR images, fulfilling the requirements mentioned above, are co-registered to one common master image and resampled to its reference grid (Figure 4). Additionally, a common band filtering ensures that only the overlapping parts of the spectrums are used. Thereby, the spatial de-correlation effect (see Section 2.1.) is reduced [74]. In the next step, interferograms between the master and the two slave images are generated: One pre-disaster InSAR pair (t1 and t2) and one co-disaster InSAR pair (t2 and t3). Then, for both InSAR pairs the coherence is computed according to Equation (5) (see Section 2.1). Moreover, as described by Equation (9), also two SAR intensity correlations are computed using again the co-registered pre- (t1 and t2) and co-disaster (t2 and t3) intensity image pairs [8]. The damage caused by the natural disaster is then assessed by detecting the change between the corresponding image pairs (see Section 2.3 for more details).

2.1. SAR Interferometric Coherence

The first method is based on a by-product of SAR interferometry, the coherence, which is here used for another application: fast disaster mapping of damaged buildings and infrastructure. Coherence is a measure of correlation and describes the preservation of the phase in an interferogram generated by two SAR images [75]. Coherence can be used to test the quality of an interferogram, e.g., for DEM generation or displacement mapping (see Section 1.3), as low coherence (de-correlation) corresponds to noisy interferograms, which often makes phase unwrapping complicated.
The coherence γ ranging from 0 to 1 is calculated according to Equation (5) [7678]:
γ = E c 1 c 2 * E c 1 c 1 * E c 2 c 2 *
where c1 and c2 are the corresponding complex pixel values of the two acquisition dates t1 and t2, c* is the complex conjugate of c, and E indicates the expected value. Both, the coherence, as well as the intensity correlation defined in Equation (9), are calculated over a certain window of pixels.
There are several types of de-correlation (loss of coherence [79]):
γ = γ t h e r m a l γ m i s s r e g γ s p a t γ d o p p γ a t m γ t e m p
  • Thermal de-correlation γthermal is caused by uncorrelated noise inside the radar sensor itself [80].
  • Miss-registration de-correlation γmissreg is due to inaccurate registration of the two SAR images [29].
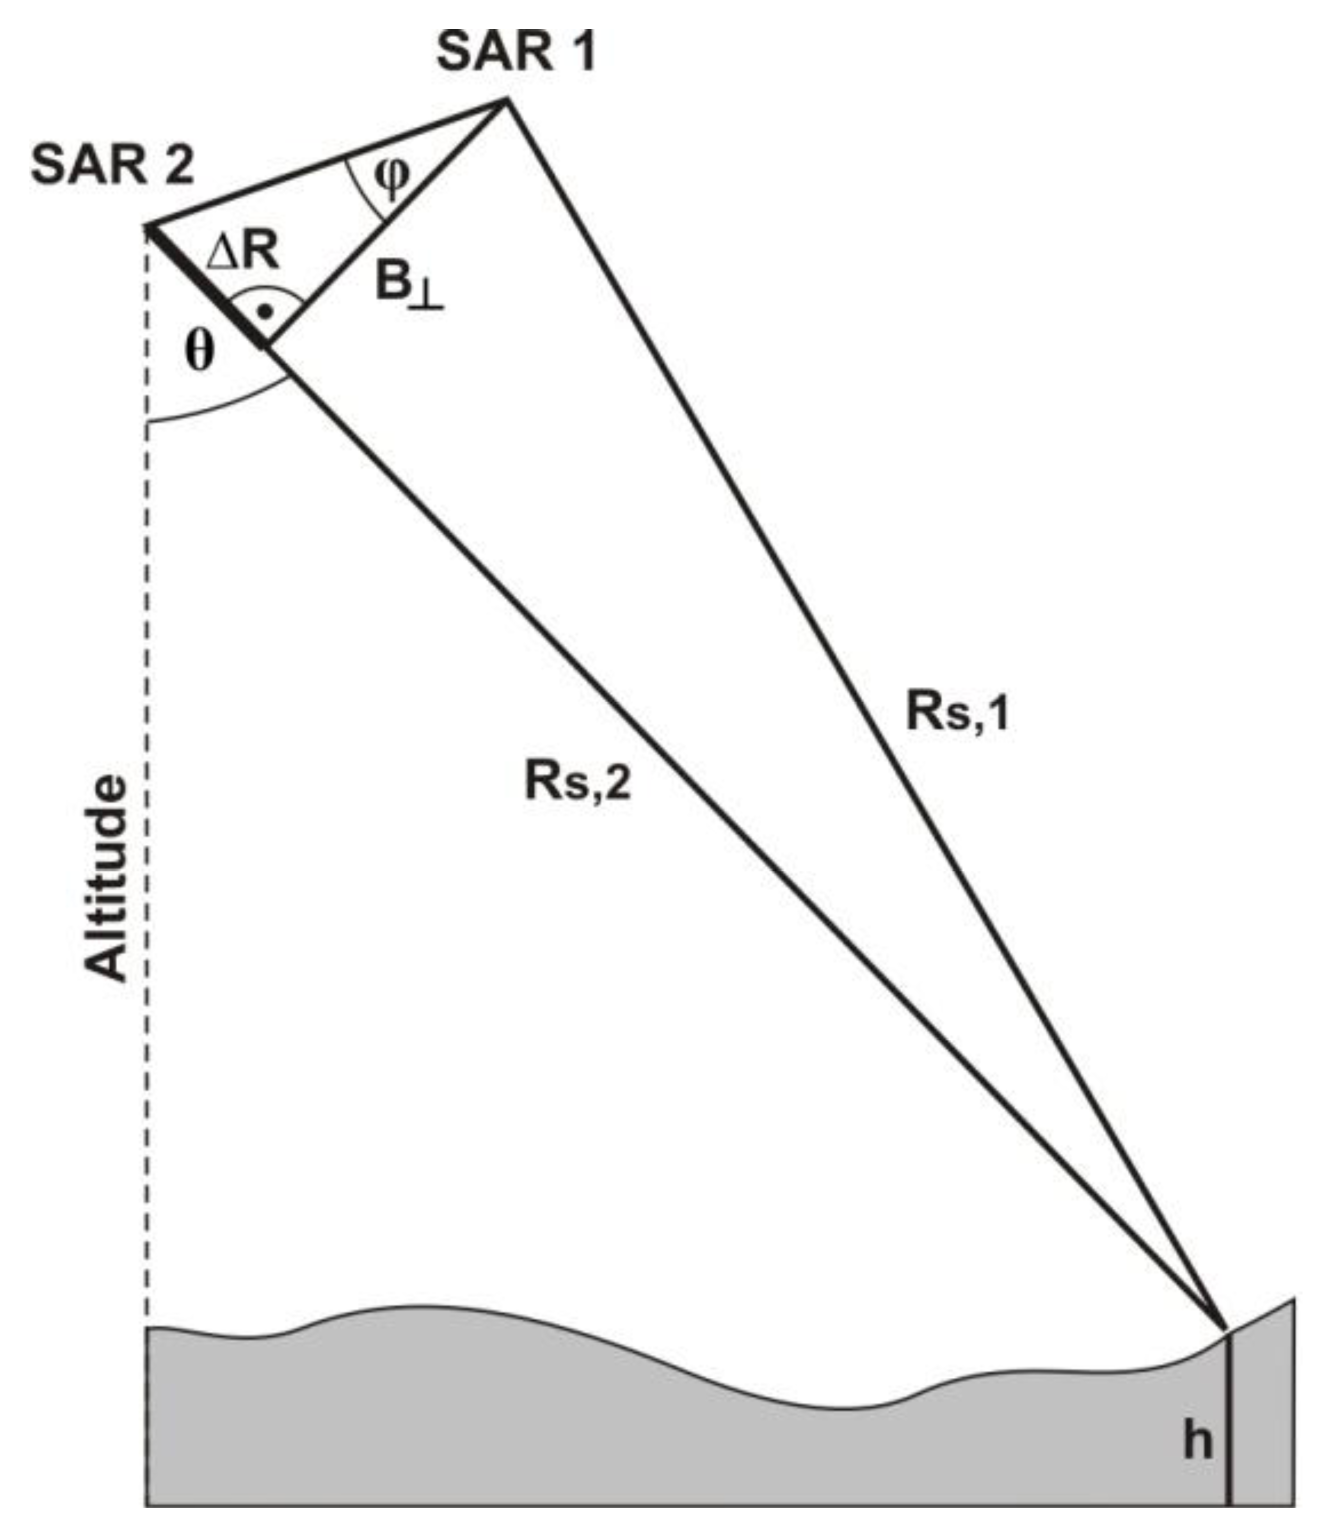
  • Spatial de-correlation γspat occurs for too large baselines [74]. For B > Bcritical the difference of the incidence angle θ (see Figure 2) at both acquisitions becomes too large. This leads to a de-correlation of the SAR echoes from both SAR sensors, i.e., the coherence strongly reduces (Equation (7) [81]). Furthermore, γspat also depends on the topography of the area of interest (AoI). Especially slopes facing the SAR sensor show strong de-correlation with increasing slope angle (foreshortening and layover effect). At flat terrain, common band filtering (usage of overlapping parts of the spectrums) corrects for the effect of γspat. However, this correction reduces the range resolution [74].
    B c r i t i c a l = λ R s 2 r ( cos  θ ) 2
    with r representing the SAR sensor’s spatial range resolution. For instance, Bcritical of the European Remote Sensing (ERS) satellite is ca. 1100 m [82]. Therefore, shorter baselines are preferable for SAR interferometric applications [8], e.g., [83,84] suggest B < 300 m when using ERS data. Modern SAR sensors such as TerraSAR-X have a larger bandwidth and the effect of γspat is therefore nowadays less important compared to the early SAR missions [85].
  • Doppler centroid de-correlation γdopp, which is similar to spatial de-correlation, is caused by too large differences of the squint angle between both radar acquisitions. According to Franceschetti and Lanari [29], this effect can be avoided by a proper antenna steering. Moreover, range adaptive azimuth common band filtering mitigates the effect of γdopp.
  • Different atmospheric conditions γatm, i.e., delays caused by different water vapor contents at both acquisition times of the SAR images may cause artifacts in the interferogram [22,82].
  • Temporal de-correlation γtemp is caused by changes on the ground in the time between the SAR acquisition dates [22,62,74]. The Earth’s surface changes by frost and dew cycles, snow and ice cover or melting, respectively. Areas bare of vegetation such as urban areas and rocks have high coherence values even between SAR image pairs separated by three to four years [56,60,80,83], whereas areas covered by vegetation, especially forests [33,79,81], lose coherence within a few days, especially due to wind and in the long-term also due to plant growth [36,8690]. Therefore, coherence is also a very good indicator for separating urban and non-urban areas in land cover mapping [79,83,84] (regarding the temporal baseline: cf. also Section 4).

2.2. SAR Intensity Correlation

Contrary to the interferometric coherence, the intensity correlation is not based on the phase of the SAR signal, but on its intensity I, which is the square of the SAR amplitude value A:
I = A 2 = R e 2 + I m 2
with Re and Im representing the real and imaginary part of the complex SAR value, respectively.
The SAR intensity, i.e., the SAR backscattering, is influenced by the imaging geometry of the SAR sensor (e.g., orbit direction (ascending/descending), incidence angle and polarization) as well as by the orientation, size, shape, construction material (especially its dielectric properties) of the object observing on the ground.
The intensity correlation ρ, ranging from 0 to 1 is defined by [76,78]:
ρ = E I 1 I 2 E I 1 2 E I 2 2
where I1 and I2 are the corresponding pixel values for the intensity of the two acquisition dates t1 and t2, respectively.

2.3. Change Detection—Damage Assessment

Several damage assessment methods by means of the interferometric coherence and/or intensity correlation have been described in the literature (Section 3). Common for all is a certain comparison of the pre-disaster and co-disaster coherence and/or intensity correlation values to detect the change, i.e., the damage caused by the disaster. Lu et al. [91] gives a general review on change detection.
For instance, first, the coherence is calculated using the pre-event InSAR pair (t1 and t2). This enables the identification of urban areas and areas dominated by man-made structures, which are characterized by their relatively high coherence values compared to e.g., vegetated areas. Second, the coherence of the co-event InSAR pair t2 and t3 is computed. For damage assessment applications we make use of the temporal de-correlation γtemp. The concept of the method is that events causing extensive structural damage, such as earthquakes, storms, floods, etc., dominate the de-correlation of the interferometric coherence (and also of the intensity correlation) computed from SAR EO imagery spanning a short time period including the event [74]. Therefore, by comparing the pre-disaster coherence and the co-disaster coherence, one is able to determine the damage caused by the event. As mentioned above, only urban areas show high coherence values over a longer time period, whereas vegetated areas de-correlate within a few days. Consequently, only at areas dominated by urban structures the damage can be assessed. However, especially these regions are our area of interest.
For damage assessment normalized differences ND (Equation (10)), similar to the well-known normalized difference vegetation index NDVI were proposed by several authors, e.g., including [8,77,84,92]:
N D = X p r e - X c o X p r e + X c o
with Xpre representing the pre-disaster SAR image pair (t1 and t2 in Figure 3) and Xco representing a pre- and a post-disaster image pair including the event (t2 and t3 in Figure 3). The normalized differences approach can be applied to both, the interferometric coherence NDγ and the intensity correlation NDρ:
N D γ = γ p r e - γ c o γ p r e + γ c o
N D ρ = ρ p r e - ρ c o ρ p r e + ρ c o
Crucial for all change detection techniques is the selection and determination of a useful threshold to distinguish between damaged and undamaged buildings or to determine different grades of damage classes [93].
Hoffmann [74] concentrated on the use of interferometric coherence for damage assessment and introduced a coherence change index τ, where γpre is the coherence of the pre-disaster SAR image pair (t1 and t2 in Figure 3) and γco is the coherence calculated from a pre- and a post-disaster image pair including the event (t2 and t3 in Figure 3):
τ = γ p r e γ c o
The coherence index is calculated for each pixel of the area of interest. Thereby, one has to consider that the coherence is estimated over several windows, causing a reduction of the spatial resolution compared to the original SAR imagery. However, damage assessment is much more practical at coarser units such as administrative boundaries or building codes than at the pixel values [94] (as averaging over several pixels reduces the influence of the speckle effect). The spatial resolution of the SAR sensor predetermines the minimum size of the ground target to be analyzed at the damage assessment procedure. It ranges from single buildings for the availability of very high spatial resolution SAR data (e.g., High Resolution SpotLight TerraSAR-X imagery, ca. 1.0 m spatial resolution) to city blocks if data from lower spatial resolution SAR sensors is available (e.g., ERS, ENVISAT ASAR, ca. 30 m spatial resolution; cf. Table 2).
In the absence of geographical information data, pre-event optical EO data can be used to identify the important segments of the AoI (e.g., city blocks). Hoffmann [74] proposed three damage classes, which were calculated on the average coherence change index for each segment. The author reported good visual correlation with damage maps based on IKONOS data.

3. Literature Review and Comparison of Interferometric Coherence and Intensity Correlation

This chapter gives a literature review on damage assessment focusing on coherence and intensity correlation based approaches. First, methods based on the interferometric coherence will be reviewed. Then, the focus is on approaches using SAR amplitude data, especially intensity correlation techniques. After that the review concentrates on procedures using both intensity correlation and coherence, enabling a comparison of both approaches. Then, references using additional data (e.g., GIS or optical imagery) to improve SAR data-based damage assessment techniques are reviewed. Additionally, selected examples of damage assessment procedures based only on post-event SAR data are shown. Finally, the review closes with some highlights of other applications based on interferometric coherence.
Table 3 [95121] gives an overview of some of the most severe earthquakes of the last two decades and the related published research on damage assessment based on SAR imagery (focus on interferometric coherence and intensity correlation).

3.1. Interferometric Coherence

This Section gives a review of studies on damage assessment methods based on the coherence (cf. Section 2.1). Ito et al. [95], and Ito and Hosokawa [96] applied the coherence ratio to assess the building damage of the 1995 Kobe Earthquake (also known as the Hyogokon-Nanbu Earthquake), Japan. Ito et al. [95] used both pre- and post-disaster C-band ERS-1 and L-band Japanese Earth Resources Satellite (JERS-1) SAR imagery for their damage assessment approach. The authors found that due to the longer wavelength of JERS-1 its average coherence is higher (with also higher contrast) than that of ERS-1. In Ito et al. [95] the change (i.e., the damage) was detected by using a neural network classification approach. Furthermore, Ito et al. [103] proposed a post-earthquake damage estimation model based on the coherence ratio. They applied their approach to investigate the damage of the 1999 Kocaeli Earthquake, Turkey, according to the European Macro Scale 1998 (EMS-98) [122].
Yonezawa et al. [98] investigated damage assessment of urban area based on coherence using a normalized difference approach (see Equation (10)). They investigated the 1995 Hygokon-Nanbu Earthquake, Japan, using JERS-1 SAR data and the 2001 Gujrat Earthquake, India.
As already mentioned above, based on pre- and post-event ENVISAT Advanced Synthetic Aperture Radar (ASAR) data, Hoffmann [74] proposed a coherence change index to determine the damage of the 2003 Bam (Iran) Earthquake at the block level (Equation (13)).
In Fielding et al. [107] a visual interpretation of the interferometric coherence (computed from pre- and post-disaster ENVISAT ASAR imagery) is described to assess the damage after the 2003 Bam Earthquake. The assessment results were compared with ground-truth maps.
The level of detail of the damage assessment is predefined by the spatial resolution of the SAR sensor used, which is for the methods reviewed in this Section 3.1 the L-band JERS-1 and the C-band ERS and ENVISAT ASAR. The spatial resolution of these SAR sensors is 18 or 30 m, respectively (see Table 2, Section 1.2). Therefore, all aforementioned methods enable damage assessment at the block level. For analysis at this scale we also emphasize the higher contrast of the coherence based on L-band SAR imagery compared to data acquired at C-band [95], which makes change detection (i.e., damage detection) a bit easier. As mentioned in Section 2.3, Hoffmann [74] reported good visual correlation of the detected damage with damage maps based on very high spatial resolution optical imagery. However, no quantitative validations of the reviewed damage assessment methods of Section 3.1 were reported.

3.2. SAR Amplitude Data with Focus on Intensity Correlation

After reviewing the coherence based damage assessment methods in the previous chapter, this section gives an overview on methodologies, which use the SAR amplitude, especially the intensity correlation (cf. Section 2.2). The different appearance of undamaged and damaged buildings in SAR imagery was investigated by [97,123]. By comparing pre- and post-event ERS and JERS SAR intensity data of the 1995 Hyogoken-Nanbu Earthquake, Japan, Matsuoka and Yamazaki [97] found out that the SAR backscatter value decrease with increasing damage. In general, artificial structures show comparatively high backscatter values due to double bouncing effects (building wall—ground). Contrary to this, open space and damaged areas are characterized by diffuse scattering of lower intensity values. The authors reported a good match of their damage assessment results with analysis retained from optical satellite imagery (Landsat).
The 1999 Kocaeli (Turkey) and the 2001 Gujarat (India) Earthquakes were analyzed by Matsuoka and Yamazaki [102] using a procedure combining SAR intensity correlation and backscatter coefficient approaches. The extracted damage distributions were in good agreement with the actual situations investigated by field surveys. For the analysis of the Gujarat Earthquake a pre- and post-disaster Radarsat-1 image pair (fine mode, 8 m spatial resolution) was used. The temporal and spatial baseline were with more than 400 days and 6 km, respectively, too large for successful application of coherence based damage assessment methods (cf. Section 2.1). However, as reported in Matsuoka and Yamazaki [102] SAR intensity based methodologies are suited even for these “extreme” conditions.
Comparing pre- and post-disaster ERS SAR imagery, Matsuoka and Yamazaki [99] identified notable lower intensity correlation values and backscattering coefficients for damaged areas. Based on their investigations, Matsuoka and Yamazaki [99] developed an automated technique for damage area detection, which showed relatively good agreements with field survey based damage mapping results. In Matsuoka and Yamazaki [100,109], the authors improved their method to be more suitable for the 2003 Bam Earthquake, Iran, and to be able to detect lower damage classes at the 2006 Mid Java Earthquake using the Advanced Land Observing Satellite (ALOS) Phased Array type L-band Synthetic Aperture Radar (PALSAR) and C-band ENVISAT ASAR imagery, respectively (cf. Table 2, Section 1.2). Although the ENVISAT data covered a longer period—which might cause many temporal surface changes not belonging directly to the earthquake—damage assessments using data of both wavelengths showed good agreement in between each other and with field survey reports and visual damage interpretation using high spatial resolution optical imagery.
Matsuoka and Yamazaki [100] used the backscattering coefficient of ASAR data to map damaged areas of the 1995 Kobe Earthquake, Japan. The results were compared with interpretation of satellite imagery and field data and showed a relatively good match.
Mansouri et al. [124] investigated the change of pre- and post-disaster SAR intensity imagery and reported an increase of the intensity values with increasing damage.
To determine surface changes (subsidence and uplift) caused by the 2004 Indonesia Earthquake, Chini et al. [9] used ERS and ENVISAT ASAR data to apply the SAR intensity correlation coefficient and SAR backscattering as basis for visual interpretation (RGB combinations of pre- and post-event intensity correlation or backscatter images, respectively). The results were compared with GPS station data. The authors reported a higher accuracy of their damage assessment when combining both SAR backscattering and intensity correlation compared to the usage of either SAR backscattering or intensity correlation.
Wang and Jin [111] used pre- and post-disaster amplitude imagery of the L-band ALOS PALSAR sensor for damage assessment of the 2008 Wenchuan Earthquake, China. Their procedure achieved good match with public damage reports and aerial photo analysis.
For the 2008 Wenchuan Earthquake Pan and Tang [113] investigated the relationship between building damage level and the differences of the backscattered SAR intensity values in pre- and post-disaster ALOS PALSAR imagery. They were able to distinguish three damage classes ranging from slightly to moderately and extremely destroyed. The authors mentioned that due to the long repeat cycle of the space-borne SAR missions rapid changes on the ground (i.e., damages) caused by a series of aftershocks cannot be separated. Only the summary of all changes that occurred in the time period between two repeat cycles can be detected. This is especially true for the ALOS PALSAR data (repeat cycle 44 days, cf. Table 2), which was used by Pan and Tang [113].
Matsuoka and Nojima [101] proposed a building damage ratio estimation model for L-band SAR imagery. They adapted a former procedure based on C-band SAR data to L-band using pre- and post-event JERS-1 data from the 1995 Kobe Earthquake, Japan, as training. Then, they applied their model to the 2007 Chincha Earthquake, Peru, using ALOS PALSAR imagery. Comparison of their damage assessment results with field survey data showed a qualitatively good agreement of the distribution of the building damage, especially for seriously and severely damaged buildings.
Based on ENVISAT ASAR data, Chini et al. [121] investigated the 2011 Tohoku Earthquake, Japan, and reported a decrease of the SAR backscattering in damaged urban area caused by the decrease of the double bounce effect. However, one has to take into account that the tsunami, which reached the coast shortly after the Earthquake, washed numerous buildings away. This effect also strongly reduced the SAR backscatter.
For the damage assessment of the 2009 L’Aquila Earthquake, Italy, Guida et al. [114] investigated changes of double bounce features using co-registered and calibrated (sigma naught) pre- and post-event COSMO-SkyMed imagery. The authors reported good agreement of their damage assessment results with visual analysis of optical imagery. Based on the developments reported in [114], Brett and Guida [118] developed an unsupervised damage detection technique based on amplitude data of very high spatial resolution SAR sensors (e.g., TerraSAR-X and COSMO-SkyMed) acquired at similar imaging geometry (see also Section 2). Curvilinear features are extracted from the pre-event imagery. Next, double-bounce candidates are selected to derive a simplified geometrical building model. The damage is detected by comparison with post-event SAR data. This method is suited for analysis of single buildings. However, as the method focuses on the analysis of double bounce features (i.e., building walls), at several circumstances the damage level of the building is either under- or overestimated. For instance, at their test site Port-au-Prince, Haiti (Earthquake 2010), the authors reported an underestimation of the damage level for buildings with collapsed roofs, but still intact walls. On the other hand, the damage level is overestimated for slightly damaged buildings where only one part collapsed. However, due to its strong double bouncing this part has a strong influence on the derived building model. In general, this method is a good approach for damage assessment of single buildings. Combination with other techniques will provide more accurate results.
Summarizing Section 3.2 we can distinguish between methods suited for damage assessment at the block level [9,97,121] and procedures enabling the damage analysis at the scale of single buildings [114,118]. The former is based on SAR data with a spatial resolution ranging from 8 to 30 m and coarser (Radarsat-1, ERS, ENVISAT, JERS and ALOS PALSAR, cf. Table 2), while the latter uses X-band SAR missions with very high spatial resolution of 1–3 m (e.g., COSMO-SkyMed and TerraSAR-X).
Furthermore, it was shown that the highest accuracy was achieved at damage assessment procedures, which combine both SAR backscatter analysis and intensity correlation (compared to the application of only one of these approaches). All reviewed damage assessment methodologies reported only a qualitative validation based on comparison of their damage assessment results with (I) high spatial resolution optical imagery, (II) damage maps derived from optical data and (III) information from field survey. However, no quantitative accuracy assessment is reported. The most detailed validation data is (III) field survey information. Unfortunately, such information is not always available.
Moreover, procedures using the SAR intensity correlation can also be successfully applied to imaging constellations which do not completely fulfill the requirements of the damage assessment procedures which are based on the coherence (reviewed in Section 3.1), i.e., the SAR intensity correlation can also be applied at larger temporal and spatial baselines [102]. In addition, at small SAR wavelength (such as X-band) areas fully or partly covered with vegetation (e.g., discontinuous urban fabric) show strong de-correlation within a short time frame, which reduces the applicability of coherence based damage assessment for SAR missions of longer repeat cycles [118] (cf. Section 4).

3.3. Combination of Interferometric Coherence and Intensity Correlation and Comparison of Both

The application of both techniques coherence and intensity correlation at the same test site enables a comparison of both techniques. Yonezawa and Takeuchi [84] applied interferometric coherence and SAR intensity correlation to detect damaged areas after the 1995 Kobe Earthquake, Japan, using ERS imagery. The comparison of both techniques showed that the de-correlation of the intensity and of the interferometric coherence behave similar. For instance, generally urban areas show high correlation values, while water surfaces are characterized by very low values. Farmland is in-between both. Moreover, the authors emphasized the requirement of short spatial baselines (e.g., <139 m for ERS) to reduce spatial de-correlation effects (cf. also Section 2.1).
Using C-band ERS SAR imagery, Matsuoka and Yamazaki [73] found that the coherence is more useful to distinguish slight to moderate damage levels, while the SAR intensity correlation is more sensitive to large surface changes, i.e., caused by stronger damage. These authors investigated the damage caused by the 1999 Kocaili Earthquake, Turkey, and compared it with information from field survey.
For the 1999 Chi-Chi Earthquake (also named Great Taiwan Earthquake) Tacheuchi et al. [77] used ERS-2 SAR imagery to apply both SAR intensity and the interferometric coherence. They found out that the normalized coherence (see Equation (11), Section 2.3.) is much better suited for damage assessment than the normalized intensity correlation (see Equation (12)), as the former enables much better differentiation between damaged and still intact urban constructions.
Suga et al. [92] also investigated the 1999 Chi-Chi Earthquake using ERS-2 SAR imagery. They confirmed the better usability of SAR interferometric coherence compared to the SAR intensity approach for damage assessment. Furthermore, the authors used the pre- and post-event SAR data to derive the land displacement caused by the earthquake using differential SAR interferometry (cf. Section 1.3).
Yonezawa and Takeuchi [84] used coherence and intensity correlation for assessment of urban damage caused by the 1995 Hyogoken-Nanbu Earthquake, Japan. Damaged areas were detected by using the normalized differences approach explained in Equations (11) and (12). They found out that the similarity of the de-correlation of both aforementioned methods indicates that the major factor of the de-correlation is closely related to interferometric processes, i.e., the change of speckle patterns in the complex intensity images.
Stramondo et al. [78] applied SAR intensity correlation and the coherence focusing on the 1999 Izmit Earthquake, Turkey, as well as on the 2003 Bam Earthquake, Iran. Their research was based on ERS-1/2 and ENVISAT ASAR data, respectively. They reported that the size of the averaging window to calculate coherence and intensity correlation affects the sensitivity of the change detection. The best-suited results were achieved by using a 5 (azimuth) × 1 (range) pixel window for multi-looking and a 3 × 3 window for the coherence calculation, which summarizes to a spatial resolution of ca. 140 m × 140 m. Intensity correlation was found to be best suited at a 7 × 7 window (ca. 140 m × 140 m spatial resolution). Stramondo et al. [78] found out that the intensity correlation and the coherence detect different kinds of changes on the ground. While the intensity correlation is dominated by changes in the intensity (magnitude) of the SAR backscatter in the time between the two SAR acquisitions, the coherence influenced by differences of the phase between the SAR acquisitions is dominated by changes of the location of scatterers within a pixel, i.e., possible displacements due to an event (e.g., an earthquake). Due to their different behavior, both interferometric coherence and intensity correlation have their advantages: The coherence provides additional independent information which cannot be detected from optical imagery, i.e., the coherence of a pre-post-event SAR image pair is useful information to support damage analysis derived from optical data. However, short spatial and temporal baselines are required (cf. Section 4). On the other hand, at larger spatial baseline cases, SAR intensity correlation still provides useful information on changes on the ground. As reference for the validation of the damage assessment procedure, the authors derived different land cover classes (including damaged and undamaged areas) from optical imagery of the Indian Remote Sensing (IRS) satellite. The authors reported an overall accuracy (and Kappa coefficient) of ca. 49% (0.35), 55% (0.38) and 60% (0.46) for the application of damage assessment methods based on the coherence, the SAR intensity correlation and the combination of both methods together with the analysis of the SAR intensity, respectively.
Arciniegas [106] compared SAR intensity correlation and coherence for the assessment of damage and reported slightly higher sensitivity of coherence to detect changes on the ground. According to Arciniegas [106], the differentiation into different levels of damage is very hard; valid for both intensity correlation and coherence. Arciniegas et al. [8] applied both interferometric coherence and intensity correlation for damage assessment after the 2003 Bam Earthquake in Iran by using ENVISAT ASAR imagery. As reference for the validation a damage distribution map based on ground observation was used. The authors found better results for coherence differences (overall accuracy: 45%) than for absolute amplitude changes (overall accuracy 41%). The combination of both aforementioned techniques increased the overall accuracy to 52%.
Summarizing Section 3.3, the most important statements are (I) combination of different methodologies strongly increases the accuracy of the damage assessment (e.g., [8,9,78,106]) and (II) coherence and SAR intensity correlation provide different kind of information. The former is better suited for the analysis of smaller changes (e.g., better differentiation of slightly damaged and undamaged areas), while the latter is more sensitive to larger changes on the ground (i.e., higher damage levels) and is also less influenced by the spatial baseline of the SAR image pair.

3.4. Improvement of SAR Data Based Damage Assessment Techniques by Additional Data

Several authors reported a significant improvement of the damage assessment accuracy by using other data additional to pre- and post-event SAR data such as optical imagery and GIS data (e.g., administrative information, city parcel boundaries, etc.).
Bignami et al. [7] used for the damage assessment of the 1999 Izmit Earthquake, Turkey, the coherence, intensity change and correlation calculated from ERS SAR images and combined them with optical imagery of the IRS satellite. Thereby, they were able to increase the overall accuracy (Kappa coefficient) of the damage assessment approach from 48.4% (0.35) or 54.8% (0.38) (based on only SAR coherence or SAR intensity correlation, respectively) to 88.6% (0.83) (combined with optical data). The overall accuracy (Kappa coefficient) of the damage assessment using only the optical data was 81.9% (0.81). As reference ground truth data from a macroseismic survey campaign was used. For the 2003 Bam Earthquake, Iran, the authors also used SAR intensity correlation and interferometric coherence for damage mapping. Thereby, the damage map produced by the International Charter of Space and Major Disasters [11] (based on optical Satellite Pour l’Observation de la Terre (SPOT), IRS and IKONOS imagery) was used to derive training data for the developed SAR data-based damage assessment procedure.
Stramondo et al. [78] reported an increase of the overall accuracy (Kappa coefficient) of their damage area detection methods from 60% to 61% (0.36–0.46) (using only SAR data) up to 77%–89% (0.59–0.83) (fusing SAR and optical imagery). For comparison, the accuracy of the damage assessment method using only the high spatial resolution optical data was 70%–82% (0.46–0.73). The lower accuracy numbers are valid for the Bam 2003 Earthquake using ENVISAT ASAR and the optical ASTER (Advanced Spaceborne Thermal Emission and Reflection Radiometer) imagery (15 m spatial resolution), while the higher accuracy values were reported for the case study of the 1999 Izmit Earthquake, Turkey, using ERS-1/2 SAR and IRS1-C optical imagery (5 m spatial resolution).
For the aforementioned approach based on both SAR intensity correlation and interferometric coherence for damage assessment of the 2003 Bam Earthquake, Iran, by Arciniegas et al. [8] (cf. Section 3.3), the overall accuracy was 52%. It could be increased to ca. 56% by excluding vegetated areas using optical ASTER imagery.
For earthquake risk assessment in Teheran, Iran, Mansouri et al. [125] used additional to SAR images GIS data such as building height information.
Investigating the 2003 Bam Earthquake, Iran, Gamba et al. [94] developed a rapid earthquake damage assessment approach for urban areas by combining pre- and post-disaster ENVISAT ASAR imagery with GIS data (i.e., administrative city parcel information). The validation of the proposed method was based on ground survey information. With the additional use of GIS data the user’s accuracy (i.e., the percentage of correctly detected damaged areas) was considerably increased from ca. 19%–46% (based on only the SAR data) to ca. 66%–78% (with GIS data).
Trianni and Gamba [2] executed a statistical analysis of SAR coherence and intensity to differ between damaged and undamaged buildings at the block level. Their procedure uses neuro-fuzzy per-pixel and Markov random field spatial model classifiers. The authors investigated the 2003 Boumerdes, Algeria, and the 2007 Pisco, Peru, Earthquakes using ERS-2 and ALOS/PLASAR data, respectively. The damage assessment procedure proposed by Trianni and Gamba [2] is supported by ancillary data such as GIS layers of city parcels borders in urban area. Thereby, the overall accuracy was increased from ca. 63% (based on SAR data) to ca. 81% (additional use of GIS data). Possible sources for this geodata are (I) local GIS, (II) Internet maps or (III) interpretation and classification of pre-disaster optical imagery.
Trianni and Gamba [105] applied the aforementioned approach to the 1999 Izmit, Turkey Earthquake using ERS SAR imagery. Furthermore, they reported an unsupervised procedure, which uses both the interferometric coherence, as well as the SAR intensity as input for the statistical analysis of a city block of the urban area of the AoI. According to Trianni and Gamba [105], the lognormal distribution is best suited in urban areas applications as this distribution best adapts to abrupt changes in the intensity caused by the high density of strong scatters in urban area.
Trianni et al. [104] applied the aforementioned unsupervised methodology additionally to the 1999 Gölcük (Turkey) and the Bam 2003 (Iran) Earthquakes using pre- and post-event ERS-1/2 and ENVISAT ASAR imagery, respectively. The authors reported a good similarity between the damage patterns achieved by the SAR amplitude, intensity correlation and the coherence based statistical analysis with a slightly increase of the overall accuracy for the combination of intensity correlation and coherence analysis. Furthermore, the authors found out that the interferometric coherence is better suited for the detection of slightly damaged areas in comparison to the SAR intensity.
Additionally to the aforementioned (Section 3.2) SAR backscattering investigation of the 2008 Wenchuan Earthquake in China by Pan and Tang [113], the authors used optical FORMOSAT-2 and ASTER imagery to increase the information content of their damage assessment.
To detect damaged buildings after the Haiti Earthquake (2010), Uprety and Yamazaki [10] used pre- and post-disaster SAR data of TerraSAR-X. Their SAR backscattering and intensity correlation based damage assessment approach is supported by building polygons derived from the post-disaster need assessment (PDNA) survey atlas. The PDNA atlas was produced by the UNTAR/UNOSAT collaboration with several agencies, such as the World Bank [126]. Furthermore, vegetated areas were excluded before the damage assessment processing using pre-disaster (Quickbird) optical imagery. Their procedure achieved an overall accuracy of ca. 74%, with a user’s and producer’s accuracy for the damaged buildings of ca. 67% or 41%, respectively.
Investigating the 2009 L’Aquila, Italy, Earthquake, Dell’Acqua et al. [115] (described in more detail in Section 3.6) improved the accuracy of their damage assessment from 65.5% (using only the SAR data of COSMO-SkyMed) up to 81% when fusing the information derived from SAR and optical (Quickbird and IKONOS) data.
In conclusion, this section clearly demonstrated the surplus value of additional data such as optical imagery and GIS data to increase the accuracy and usability of damage assessment based on SAR imagery. Thereby, (I) pre-event optical imagery can be used to mask out vegetated areas, which would disturb the damage analysis results (temporal de-correlation of vegetated areas) [8,10]; or (II) an image pair of pre- and post-event optical imagery can directly be incorporated into the damage assessment together with the SAR imagery [7,78,113,115]. Besides to increasing the accuracy of the damage assessment by the additional use of GIS data [2,104,105,125], such information also enables the generation of damage maps, which are more suited to the user, as the damage levels are presented at meaningful distributions (e.g., city parcel boundaries, building blocks, etc.).
Moreover, as already mentioned in Section 3.2, with the availability of very high spatial resolution (1–3 m) SAR sensors such as TerraSAR-X and COSMO-SkyMed (both launched in 2007), the analysis of more recent earthquakes with this SAR data enabled more detailed analysis [10,115]. Contrary to this, studies of natural disasters happened before 2007 rely on data from SAR missions with coarser spatial resolution such as ERS, ENVISAT ASAR, and ALOS PALSAR (cf. Table 2). This enables damage assessment at the block level or at the scale of city parcels.

3.5. Summary of Achieved Accuracies of the Methods Reviewed in Sections 3.1–3.4

In this section the accuracies of the aforementioned damage assessment methods (Sections 3.1–3.4) are briefly summarized (see also Section 6). The reviewed publications on interferometric coherence (Section 3.1) and SAR intensity correlation (Section 3.2) based damage assessment only presented qualitative validation. The validations are based on visual comparison of the results of the damage assessment with (I) high spatial resolution optical imagery [78,100,109,111,114]; (II) damage maps derived from optical data [74] or from (III) field survey information [7,8,73,94,99,100,107,109,111].
Damage assessment procedures, exclusively based on the coherence or the SAR intensity correlation, achieved overall accuracies of ca. 45%–49% or 41%–55%, respectively (Sections 3.3 and 3.4). Methods which combine the interferometric coherence and the SAR intensity correlation showed higher values of the overall accuracy of ca. 52%–60%. The Kappa coefficient for the damage assessment techniques based on the coherence, the intensity correlation and the combination of both approaches reached values of ca. 0.35, 0.38 and 0.46, respectively [7,8,78]. The increases of the Kappa coefficient and of the overall accuracy clearly demonstrate the advantage of damage assessment methods, which combine both coherence and intensity correlation.
Adding optical imagery to the SAR damage assessment methodologies significantly increased the overall accuracy (and Kappa coefficient) values from ca. 48%–60% (0.35–0.46) (based on only SAR data) up to ca. 77%–88% (0.59–0.83) (based on data fusion) [7,78,115]. Moreover, the additional GIS data also increased the reported accuracy. For example the overall accuracy (user’s accuracy) was increased from ca. 63% (19%–46%) (based on only SAR imagery) to ca. 81% (66%–78%) (additional use of GIS data) [2,94].

3.6. Post-Event Methods for SAR Data Based Damage Assessment

Up to today, the multi-temporal data approach for damage assessment can only be applied for the specific case of the availability of suitable pre-event SAR data (cf. Section 2), which according to Brunner et al. [108] is not often the case. Therefore, several authors concentrated their research on the development of SAR damage assessment methods based on only post-event data. However, damage detection using only post-disaster imagery is much more complicated and its accuracy is much lower compared to accuracy achieved by multi-temporal data approaches [3]. As this article concentrates on the multi-temporal SAR data—interferometric coherence and SAR intensity correlation—approaches for damage assessment, this section only shows selected examples for post-disaster damage detection techniques.
Balz et al. [110] mapped damaged bridges and dams after the 2008 Wenchuan Earthquake, China, using post-disaster high spatial resolution TerraSAR-X and COSMO-SkyMed imagery and SAR simulation approaches. Balz and Liao [112] used the decrease of the corner reflections of damaged buildings to distinguish between damaged and undamaged buildings. However, this approach was only useful to detect strong damages. Slight damages were very difficult to detect.
Brunner et al. [108] developed an approach based on post-disaster SAR data of TerraSAR-X and COSMO-SkyMed and the comparison of them with SAR simulations based on very high spatial resolution optical pre-disaster data. In their procedure, the simulated SAR signature of undamaged buildings is compared with the real (post-event) SAR imagery to detect undamaged (good match of simulation and real SAR image) and damaged areas (strong differences between both). The reported overall accuracy of this procedure is ca. 90%.
Jin et al. [120] describe a comparison of post-event high spatial resolution X-band airborne SAR data with pre-event optical imagery based on manual interpretation. This approach was successfully applied at the Magnitude 7.1 Yushu County Earthquake, China, which happened in April 2010.
Dell’Acqua et al. [115] used COSMO-SkyMed SAR data to study the 2009 L’Aquila, Italy, Earthquake and focused on changes in texture statistics and SAR reflectivity for damage assessment at the block level (to compensate the speckle effect; cf. also Section 3.4). In [117], Dell’Acqua et al. improved their aforementioned SAR texture based damage assessment technique by including information of the physical vulnerability of buildings in their approach. The achieved overall accuracy was ca. 56%.
Moreover, Cossu et al. [116] investigated the relationship between textural features and the degree of damage by using SAR imagery with different spatial resolution.

3.7. Other Applications for SAR Interferometric Coherence

The interferometric coherence and its temporal decrease (de-correlation) are also used for other applications than damage assessment of urban area after a natural disaster such as an earthquake, tsunami, storm, etc. This section reports a few examples.
The interferometric coherence and the backscattering intensity of a series of ERS SAR data were used by Strozzi et al. [79] to distinguish between different land cover classes. Grey et al. [83] developed an automated procedure to map change over time within urban area (e.g., due to the construction of buildings) based on ERS interferometric coherence data.
Flood detection by the difference calculation of two coherence images is reported by [127].
SAR coherence is also used for damage assessment caused by forest fires [128]. Tanase et al. [129] reported a similar approach where the coherence is related to the burn severity. Coherence is also useful for the monitoring of post-fire forest regrowth [130].
Furthermore, Wright et al. [131] proposed the use of the interferometric coherence for battle damage assessment.
Christophe et al. [21] used a time-series of L-band ALOS PALSAR imagery for interferometric coherence based landslide detection. A similar approach is reported by Kawamura et al. [119] who detected landslides after the 2009 Sumatra Earthquake, Indonesia, based on post-event TerraSAR-X imagery. The interferometric coherence was used to distinguish between forest areas (low coherence values) and possible landslides characterized by bare soil areas (high coherence values).
Zhao et al. [132] used ALOS PALSAR backscattering intensity changes to estimate the area of a catastrophic rockslide debris flow event in the Jiweishange range, Chongqing, China. In addition, the pre-failure acceleration of the landslide was investigated using DInSAR. Moreover, a post-slide DEM was generated by the InSAR technique (Section 1.3) to assess the height surface changes.

4. Preconditions and Current Limitations of Multi-Temporal SAR Methods

Theoretically, the methods described in Section 2 and reviewed in Section 3 work very well for a fast and accurate damage assessment, which is crucial to a fast crisis response (e.g., to support rescue, humanitarian and reconstruction operations in the crisis area). However, as already mentioned in Section 3.6, for the multi-temporal data based approaches interferometric coherence and SAR intensity correlation several preconditions have to be fulfilled:
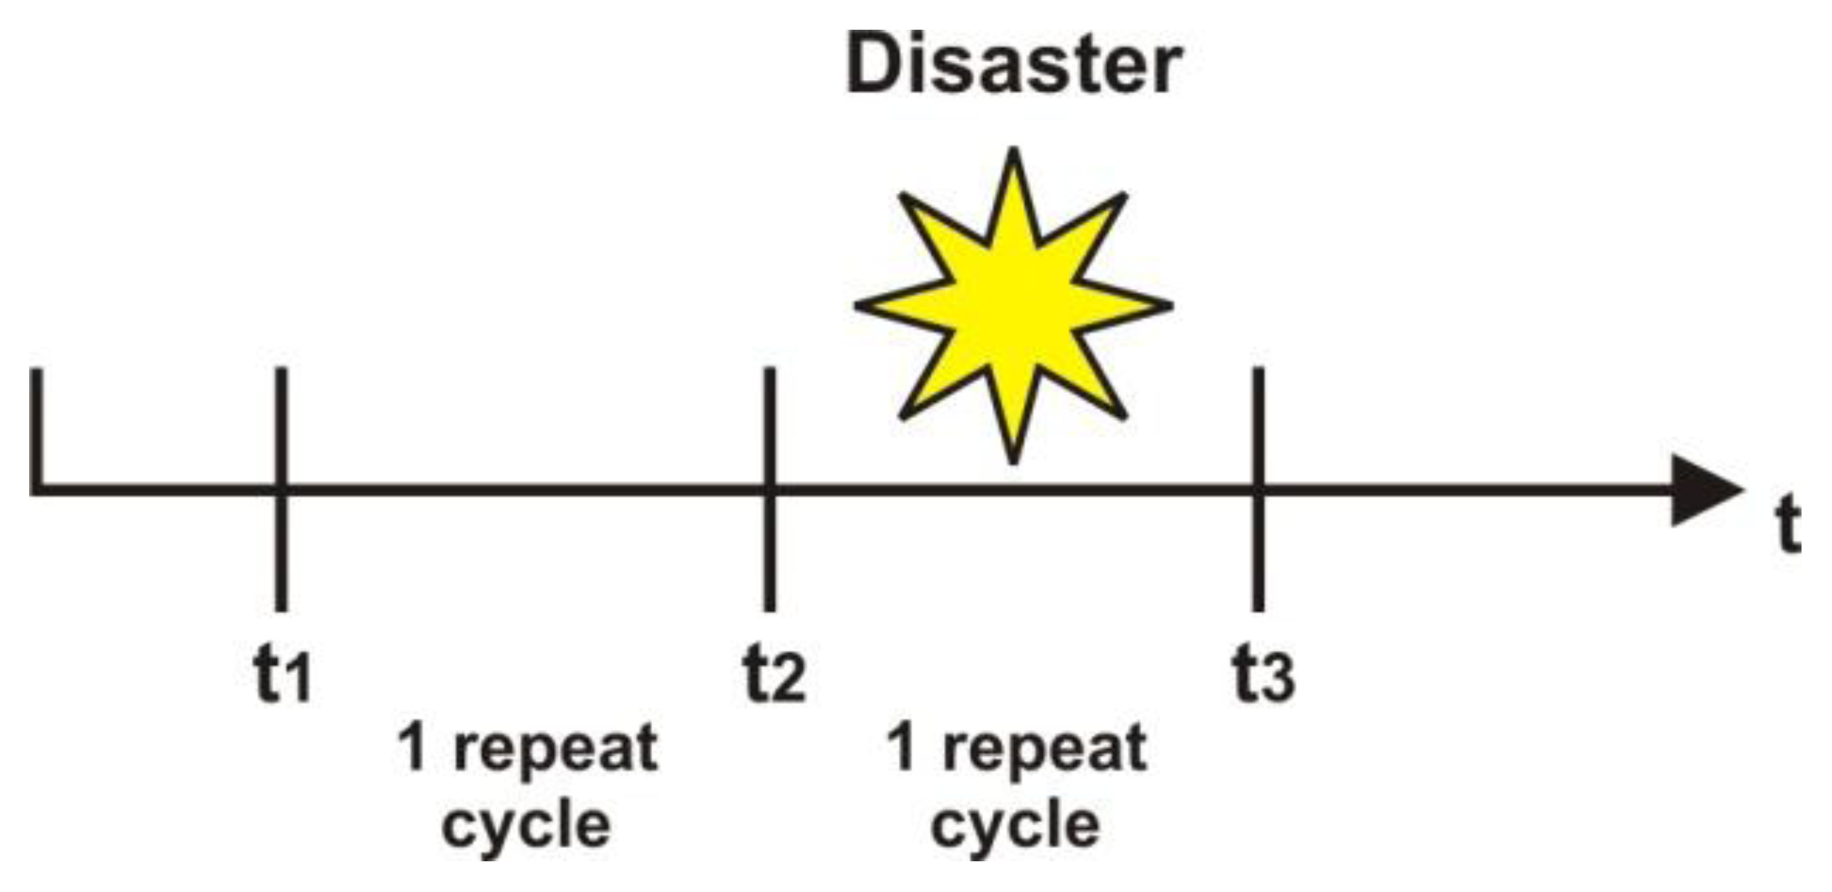
  • At least three SAR images, more precisely two pre- and one post-disaster image(s), are required (see also Section 2, Figure 3).
  • All three images have to be acquired at the same imaging geometry (i.e., same pass direction (ascending/descending), incidence angle, relative orbit, imaging mode and SAR wavelength).
  • As most natural disasters are not predictable (especially earthquakes), a continuous monitoring of the affected AoI is required.
  • The pre-disaster image pair should be recorded shortly before the event and the post-disaster image shortly after the event. The temporal baseline between all acquisitions should be as small as possible to decrease the influence of temporal de-correlation not caused by the natural disaster. The repeat cycle of the SAR mission is the controlling key factor of the temporal baseline (cf. Table 2, Section 1.2). The repeat cycle ranges from 4 to 6 days for modern constellations of 2–4 satellites (e.g., Sentinel-1 and COSMO-SkyMed) to 35–46 days for older SAR missions (e.g., ERS-1/2, ENVISAT, JERS and ALOS PALSAR). To analyze which repeat cycle is useful for the presented damage assessment methods (see Section 2), we also have to consider the wavelength of the SAR sensors. At shorter wavelength, such as X-band (λ = 3.1 cm; e.g., TerraSAR-X and COSMO-SkyMed) or C-band (λ = 5.6 cm), the coherence is more affected by temporal de-correlation than at the longer L-band (λ = 23.6 cm) [79,81,118]. Fortunately, this effect was also considered in the design of the SAR missions, as the X-band missions are characterized by shorter repeat cycles (e.g., TerraSAR-X: 11 days, COSMO-SkyMed constellation: 4 days) compared to the L-band missions (e.g., ALOS PALSAR and JERS), which compensate their longer repeat orbit of 44 or 46 days, respectively, with in general a higher coherence over a longer time period. The repeat cycle of the C-band SAR missions (e.g., Radarsat-1/2, ERS-1/2, and ENVISAT ASAR) is with 24–35 days in-between the aforementioned values. As urban area is characterized by long-term high coherence values (e.g., over several months [79,81]), data from all reported SAR missions is usable for the damage assessment methods presented in Section 2. In general one can recommend to use SAR image pairs of less than 3–5 repeat cycles between the single acquisitions (especially valid for single satellite missions). However, there exists no critical value for a maximum number of repeat cycles. The number of repeat cycles between the pre-disaster and the pre-post-disaster image pair, respectively, should be as low as possible to avoid influences of temporal changes which were not caused by the natural disaster (e.g., clearing of the debris after the event, or construction activities, etc.). Sentinel-1 with its two-satellite-constellation will image every part of the global landmass every 6 days, providing a solution to the temporal baseline problem—especially for damage assessment at the block level (see Section 5).
  • The destruction caused by the natural disaster should dominate the temporal de-correlation effect of the AoI. Urban area and especially continuous urban fabric is characterized by long temporal coherence values [79,81] and therefore very well suited for the application of the damage assessment methods based on the interferometric coherence and the SAR intensity correlation. However, at discontinuous urban fabric with its higher percentage of green spaces (covered with vegetation), the applicability of the aforementioned methods is less suited, as vegetated areas lose correlation within several days.
  • Flat areas are best suited for the application of the interferometric damage assessment methodologies as rough topographic relief has strong negative influences or even prohibits the use of the SAR images for InSAR applications (keywords: spatial de-correlation (cf. Section 2.1) and layover and shadow effects [27,74]).
  • According to Hoffmann [74], a useful damage assessment requires pre-defined regions to assess the damage level.
  • For each important area of interest exposed to natural hazards, a geodatabase containing useful GIS data (e.g., boundaries of city parcels, water bodies, parks, and important infrastructure such as hospitals or shelters) should be set up and continuously updated.
According to Trianni and Gamba [2], possible sources for the required GIS data to support the damage assessment procedure (points VII and VIII) are (a) local GIS, (b) internet maps or (c) interpretation and classification of pre-disaster optical imagery. The availability, topicality and quality of the GIS data strongly differ from country to country. In general, in industrial countries much more detailed and up-to-date GIS data is available than in Third World countries. Also the coverage and topicality of open GIS data such as OpenStreetMap (OSM [133]) data strongly varies from place to place. Additional geodata is provided by Web Mapping Services (WMS) such as the ESRI base maps [134] and Internet maps (e.g., Bing Maps [135], Google Maps [136]/Earth [137]). At several gazetteer web sites (e.g., the United States Census Bureau [138], or GeoScience Australia [139]) additional reference data is available.
Currently, the Global Earthquake Model [140] works on the set-up of a Global Exposure Database (GED), which will contain information on buildings and people form the country-level down to individual buildings. The first version of the GED will contain aggregated information on population, number of buildings and percentage of built area at a spatial resolution of 1 km. The level of detail as well as the information content will be increased in future.
Regarding the points I to IV: Nowadays useful archive SAR imagery shortly recorded before the crisis is in most cases not available. Two pre-disaster images recorded with the same imaging geometry as the post-disaster image are very rarely available. Modern very high spatial resolution SAR missions such as TerraSAR-X, COSMO-SkyMed or Radarsat-2 are not able to provide worldwide coverage within a short time period—i.e., no archive image recorded shortly before the event (especially not with the same imaging geometry within a certain AoI, which is required for interferometric applications and hereon based damage assessment procedures). Regarding these interferometric applications, these satellites are only useful to investigate and monitor a limited number of selected AoIs, as these very high spatial resolution SAR sensors are only able to image small parts of the Earth. Consequently, these SAR missions usually record the crisis area only after the event happened [24]. Therefore, in most cases the described multi-temporal data based damage assessment methods cannot be applied so far.

5. Possible Solutions of Current Limitations—The Sentinel-1 Mission

The SAR satellites Sentinel-1 A and B launched on 3 April 2014 (satellite A) and planned to be launched 18 month later (B unit), respectively, fulfill the aforementioned required preconditions I to IV very well (see Section 4). Sentinel-1 is a polar orbiting two-satellite-constellation developed by the European Space Agency (ESA). This SAR mission belongs to the Space Component of the Global Monitoring for Environment and Security (Copernicus, former GMES) program. Sentinel-1 operating in C-band (center frequency 5.405 GHz) is a successor of the European C-band SAR missions ERS-1/2 and ENVISAT ASAR [141].
Sentinel-1 will monitor the Earth on a pre-planned and conflict-free observation plan using in most cases a fix incidence angle range. This fulfills the requirement II in Section 4 (“same imaging geometry of all SAR acquisitions”). In general case, the so-called Interferometric Wide swath (IW) mode with 250 km swath width and 5 m × 20 m spatial resolution will be used to monitor land areas [141]. In the IW and in the Extra Wide swath (EW) mode (extension of IW up to 400 km swath width), Sentinel-1 uses the so-called Terrain Observation by Progressive Scan (TOPSAR) operation [142].
The Strip Map mode (SM) with higher spatial resolution (5 m × 5 m) will be used in exceptional cases, e.g., to support emergency services [143]. However, as this imaging mode will not be used regularly, no useful archive data will be available at a global coverage. Therefore, the Strip Map data will only be useful in very exceptional cases (cf. requirements I and II in Section 4).
Table 4 shows the characteristics of the two Sentinel-1 modes, which are important for damage assessment procedures.
The aforementioned spatial resolution of the Sentinel-1 standard imaging mode over land areas (IW mode: 5 m × 20 m) limits the application of damage assessment to the block level (encompassing several buildings per block). The damage analysis of single houses would require meter to sub-meter spatial resolution.
The repeat cycle of a single satellite is 12 days. This will be reduced to 6 days with the launch of the B unit, as both satellites will fly on the same orbit plane with 180° phased to each other [141]. Therefore, Sentinel-1 fulfills the required preconditions of a constant imaging geometry (II) and a short temporal baseline (IV) (cf. Section 4). Sentinel-1 enables the coverage of the entire globe (to be more precisely, the entire land mass) within 12 days (only Sentinel-1 A), or even 6 days with Sentinel-1 A and B. For high priority areas, such as Europe and Canada, the coverage will be even more frequent up to 4 to 2 days. However, as the interferometric applications require identical imaging geometries for all SAR images (same orbit, incidence angle, pass direction, etc.), only the 12 days (or 6 days with two satellites) repeat cycle acquisitions are useful.
After the launch of Sentinel-1 A on 3 April 2014 and the In-Orbit Commissioning Review, a 6 months ramp-up phase is planned, for which ESA has developed an observation plan which focuses on following areas of interest (Please note that this list contains only the aspects which are of interest for damage assessment of natural disasters on land areas. They will be monitored using the IW mode [144]):
-
Europe & French oversea territories.
-
Volcanoes at global level.
-
Major tectonic areas and geo-hazard supersites worldwide (concentrating on the major subduction and continental collision zones, e.g., the “Pacific Ring of Fire”, the Himalaya, but also important rifting zones, such as the Afar Region).
-
Worldwide collection of reference data to support flood monitoring.
After the 6-month ramp-up phase of Sentinel-1 A and especially after the launch of Sentinel-1 B (planned for the end of 2015) there is the capacity to extend this acquisition plan to worldwide coverage with a repeat orbit reduced to 6 days (at the two-satellite-constellation).
The new data policy “free and open access to users” will increase and improve the usability of the Sentinel data, as the EO data will be disseminated at no charge and without the need for an ordering process. Rapid damage assessment to support fast crisis response is supported by the systematic acquisition and online access mode of the EO data [141,143].
Sentinel-1 will provide an unprecedented opportunity for fast and accurate damage assessment after a natural disaster. This will increase and improve the support to fast crisis response.

6. Conclusions

Fast crisis response after a natural or man-made disaster is crucial to support rescue, humanitarian and reconstruction operations in the affected area. Rapid damage mapping provides important information about the affected area, including the grade and type of damage. Satellite remote sensing plays a key role in rapid damage assessment due to its quick response and fast monitoring of large areas at low costs. Optical sensors rely on a cloud free sky to provide useful imagery, while synthetic aperture radar (SAR) sensors are almost completely weather independent. Therefore, SAR sensors are in general able to provide useful imagery within a much shorter time frame than optical sensors.
A comprehensive review on damage assessment techniques using multi-temporal SAR procedures, such as the interferometric coherence and SAR intensity correlation (Sections 3.1–3.4) was presented.
Comparison of pre- and post-disaster SAR amplitude images for damage assessment is in most cases not very useful, as after a disaster the SAR amplitude both increases (e.g., due to debris) and decreases (e.g., due to floods, clearing activities, etc.).
Contrary to this, both interferometric coherence, as well as the SAR intensity correlation, show a decrease of their values with increasing damage level, as the intensity as well as the phase of the complex SAR backscatter changes due to damage on the ground. Coherence is more sensitive to smaller changes on the ground than the SAR intensity correlation. Therefore, the former is better suited to detect lower damage levels as well as to better differentiate between slightly damaged and still intact buildings. On the other hand, the intensity correlation is more sensitive to larger changes caused by stronger damages. Moreover, the intensity correlation procedure still provides useful information at spatial baselines, which are too large for a useful coherence application (see also Sections 2.1 and 3.2).
Unchanged (i.e., undamaged) areas show higher coherence values over a longer time period at longer SAR wavelengths such as L-band compared to the shorter C or X-band, which also leads to a better coherence contrast between damaged and undamaged areas and therefore to a better differentiation of both.
Challenges for future research on multi-temporal SAR based damage assessment methods can be divided into two main categories:
(I)
The requirement of fast, easy-to-use, worldwide applicable damage assessment procedures with high accuracy.
(II)
The availability of at least two pre-disaster SAR images acquired shortly before the event at the same imaging geometry as the post-event SAR acquisition (see Figure 3).
Regarding challenge (I), a possible solution to increase the accuracy of the damage assessment is the usage of other data additional to pre- and post-event SAR data such as high spatial resolution optical imagery and GIS data (see Section 3.4). For instance by fusing SAR and optical imagery the accuracy of the damage assessment methods was improved from about 41%–60% (based on only SAR intensity correlation and/or coherence) up to ca. 77%–88% (Table 5). GIS data (i.e., administrative information, city parcel boundaries, etc.) allows the focus of the damage assessment to be directed to the most important areas of interest, i.e., densely build-up urban areas, and to assess the damage at pre-defined meaningful boundaries. Therefore, for each important area of interest exposed to natural hazards, a geodatabase containing useful GIS data (e.g., boundaries of city parcels and critical infrastructure such as hospitals or shelters) may be set up and continuously updated (cf. Section 4).
The most crucial and also difficult step in damage assessment is the detection of the damage and quantifying its severity. Several methods have been reported in the literature for change detection, i.e., detection of the damage. Most of the reviewed studies use either the interferometric coherence, the SAR intensity correlation or both correlations as input for the damage assessment (see Section 3). The reported change detection techniques range from e.g., visual interpretation of the coherence and visual interpretation of RGB combinations of pre- and post-event intensity correlation and backscatter images, to more automated procedures e.g., applying the normalized differences of the coherence and the intensity correlation or coherence based change indexes. Other studies make use of more sophisticated change detection approaches such as neural network classification based on the coherence, or neuro-fuzzy per-pixel and Markov random field spatial model classifiers. Especially the differentiation between undamaged and slightly damaged buildings using current remote sensing sensors (even with very high spatial resolution optical sensors) is still not satisfactorily solved so far.
Time is a very crucial consideration in disaster response. Therefore, the processing time of the damage mapping procedure is as important as its accuracy. Consequently, future research in this field should also address the development of faster and more automated damage assessment procedures. Time-consuming manual interaction may be reduced by focusing on unsupervised classifiers. Moreover, to enable the worldwide applicability of the damage mapping procedures at an operational level, easy-to-use methodologies are required.
Up to today, the multi-temporal SAR data approach for damage assessment can only be applied for very limited case studies, where suitable pre-event SAR imagery is available (see Section 4). Current SAR missions (e.g., TerraSAR-X, Radarsat-2 and COSMO-SkyMed) are not able to provide worldwide coverage within a short time frame. However, damage detection using only post-disaster data (e.g., employing SAR simulation and analysis of SAR texture statistics) is much more complicated and its accuracy is not as high compared to multi-temporal data methodologies (Section 3.6).
The upcoming European SAR mission Sentinel-1 is a promising solution of the aforementioned challenge (II), which states the worldwide availability of useful pre-event SAR data recorded shortly before the event. Sentinel-1, with its two-satellite-constellation, will be characterized by a high swath width of 250 km (Interferometric Wide swath—IW, standard mode over land), fast repeat cycle (12 days with one satellite/6 days with two satellites) and relatively high spatial resolution. The SAR imagery of Sentinel-1 will provide a very good opportunity for a successful worldwide application of the aforementioned SAR interferometric damage assessment techniques (see Section 5). However, the spatial resolution of ca. 5 m × 20 m for the Sentinel-1 IW mode limits the application of damage assessment to the block level.

Acknowledgments

The author would like to thank the four anonymous reviewers for their very constructive remarks.

Conflicts of Interest

The author declares no conflict of interest.

References

  1. Seneviratne, S.I.; Nicholls, N.; Easterling, D.; Goodess, C.M.; Kanae, S.; Kossin, J.; Luo, Y.; Marengo, J.; McInnes, K.; Rahimi, M.; et al. Changes in Climate Extremes and their Impacts on the Natural Physical Environment. In Managing the Risks of Extreme Events and Disasters to Advance Climate Change Adaptation; A Special Report of Working Groups I and II of the Intergovernmental Panel on Climate Change (IPCC); Field, C.B., Barros, V., Stocker, T.F., Qin, D., Dokken, D.J., Ebi, K.L., Mastrandrea, M.D., Mach, K.J., Plattner, G.-K., Allen, S.K., et al., Eds.; Cambridge University Press: Cambridge, UK; New York, NY, USA, 2012; pp. 109–230. [Google Scholar]
  2. Trianni, G.; Gamba, P. Damage detection from SAR imagery: Application to the 2003 Algeria and 2007 Peru earthquakes. Int. J. Navig. Obs 2008, 2008, 762378:1–762378:8. [Google Scholar]
  3. Dong, L.; Shan, J. A comprehensive review of earthquake-induced building damage detection with remote sensing techniques. ISPRS J. Photogramm. Remote Sens 2013, 84, 85–99. [Google Scholar]
  4. COSMO-SkyMed. Available online: http://www.cosmo-skymed.it/en/index.htm (accessed on 30 April 2014).
  5. RADARSAT Constellation. Available online: http://www.asc-csa.gc.ca/eng/satellites/radarsat/ (accessed on 30 April 2014).
  6. TerraSAR-X. Available online: http://www.dlr.de/eo/en/desktopdefault.aspx/tabid-5725/9296_read-15979/ (accessed on 30 April 2014).
  7. Bignami, C.; Chini, M.; Pierdicca, N.; Stramondo, S. Comparing and Combining the Capability of Detecting Earthquake Damages in Urban Areas Using SAR and Optical Data. Proceedings of the IEEE IGARSS, Anchorage, AK, USA, 20–24 September 2004; pp. 55–58.
  8. Arciniegas, G.A.; Bijker, W.; Kerle, N.; Tolpekin, V.A. Coherence- and amplitude-based analysis of seismogenic damage in Bam, Iran, using ENVISAT ASAR data. IEEE Trans. Geosci. Remote Sens 2007, 45, 1571–1581. [Google Scholar]
  9. Chini, M.; Bignami, C.; Stramondo, S.; Pierdicca, N. Uplift and subsidence due to the 26 December 2004 Indonesian earthquake detected by SAR data. Int. J. Remote Sens 2008, 29, 3891–3910. [Google Scholar]
  10. Uprety, P.; Yamazaki, F. Use of High-Resolution SAR Intensity Images for Damage Detection from the 2010 Haiti Earthquake. Proceedings of the IEEE IGARSS, Munich, Germany, 22–27 July 2012; pp. 6829–6832.
  11. The International Charter of Space and Major Disasters. Available online: http://www.disasterscharter.org/ (accessed on 25 March 2014).
  12. Voigt, S.; Kemper, T.; Riedlinger, T.; Kiefl, R.; Scholte, K.; Mehl, H. Satellite image analysis for disaster and crisis-management support. IEEE Trans. Geosci. Remote Sens 2007, 45, 1520–1528. [Google Scholar]
  13. Copernicus. Available online: http://www.copernicus.eu (accessed on 30 April 2014).
  14. GIO Emergency Management Service. Available online: http://emergency.copernicus.eu/mapping/ems/emergency-management-service (accessed on 30 April 2014).
  15. Services and Applications for Emergency Response (SAFER). Available online: http://www.zki.dlr.de/project/162 (accessed on 1 May 2014).
  16. United Nations Institute for Training and Research (UNITAR) Operational Satellite Applications Programme (UNOSAT). Available online: http://www.unitar.org/unosat/ (accessed on 1 May 2014).
  17. Sentinel Asia. Available online: http://global.jaxa.jp/article/special/sentinel_asia/index_e.html (accessed on 30 April 2014).
  18. Center for Satellite Based Crisis Information (ZKI). Available online: http://www.zki.dlr.de/ (accessed on 2 May 2014).
  19. Service Régional de Traitement d’Image et de Télédétection (SERTIT). Available online: http://sertit.u-strasbg.fr/index_en.htm (accessed on 1 May 2014).
  20. Munich Re Significant Natural Catastrophes 1980–2012. Available online: http://www.munichre.com/de/reinsurance/business/non-life/georisks/natcatservice/signifycant_natural_catastrophes.aspx (accessed on 31 January 2014).
  21. Christophe, E.; Chai, A.S.; Yin, T.; Kwoh, L.K. Earthquakes in Sumatra: The Use of L-band Interferometry in a SAR-Hostile Environment. Proceedings of the IEEE IGARSS, Honolulu, HI, USA, 25–30 July 2010; 2009; pp. 1202–1205. [Google Scholar]
  22. Gupta, R.P. Remote Sensing Geology; Springer: Heidelberg, Germany, 2003. [Google Scholar]
  23. ITC Database of Satellites and Sensors. Available online: http://www.itc.nl/research/products/sensordb/AllSatellites.aspx (accessed on 5 May 2014).
  24. Dell’Acqua, F.; Gamba, P. Remote sensing and earthquake damage assessment: Experiences, limits and perspectives. Proc. IEEE 2012, 100, 2876–2890. [Google Scholar]
  25. Voigt, S.; Schneiderhan, T.; Twele, A.; Gähler, M.; Stein, E.; Mehl, H. Rapid damage assessment and situation mapping: Learning from the 2010 Haiti earthquake. Photogramm. Eng. Remote Sens 2011, 77, 923–931. [Google Scholar]
  26. Gerke, M.; Kerle, N. Automatic structural seismic damage assessment with airborne oblique Pictometry® imagery. Photogramm. Eng. Remote Sens 2011, 77, 885–898. [Google Scholar]
  27. Plank, S.; Singer, J.; Minet, C.; Thuro, K. Pre-survey suitability evaluation of the differential synthetic aperture radar interferometry method for landslide monitoring. Int. J. Remote Sens 2012, 33, 6623–6637. [Google Scholar]
  28. Schwäbisch, M. Die SAR-Interferometrie zur Erzeugung Digitaler Geländemodelle; Forschungsbericht 1995–25; Deutsches Zentrum für Luft- und Raumfahrt: Köln, Germany, 1995. (In German) [Google Scholar]
  29. Franceschetti, G.; Lanari, R. Synthetic Aperture Radar Processing; CRC Press: Boca Raton, FL, USA, 1999. [Google Scholar]
  30. Rosen, P.A.; Hensley, S.; Joughin, I.R.; Li, F.K.; Madsen, S.N.; Rodriguez, E.; Goldstein, R.M. Synthetic aperture radar interferometry. Proc. IEEE 2000, 88, 333–382. [Google Scholar]
  31. Rabus, B.; Eineder, M.; Roth, A.; Bamler, R. The shuttle radar topography mission—A new class of digital elevation models acquired by spaceborne radar. ISPRS J. Photogramm. Remote Sens 2003, 57, 241–261. [Google Scholar]
  32. Ferretti, A.; Massonnet, D.; Monti-Guarnieri, A.; Prati, C.; Rocca, F. Guidelines for SAR Interferometry—Processing and Interpretation. InSAR Principles; Fletcher, K., Ed.; ESA Publications Division: Noordwijk, The Netherlands, 2007. Available online: http://www.esa.int/About_Us/ESA_Publications/InSAR_Principles_Guidelines_for_SAR_Interferometry_Processing_and_Interpretation_br_ESA_TM-19 (accessed on 26 May 2014).
  33. Bamler, R.; Hartl, P. Synthetic aperture radar interferometry. Inverse Probl 1998, 14, 1–54. [Google Scholar]
  34. Gabriel, A.K.; Goldstein, R.M.; Zebker, H.A. Mapping small elevation changes over large areas: Differential radar interferometry. J. Geophys. Res 1989, 94, 9183–9191. [Google Scholar]
  35. Massonnet, D.; Feigl, K.L. Radar interferometry and its application to changes in the earth’s surface. Rev. Geophys 1998, 36, 441–500. [Google Scholar]
  36. Chen, Y.; Zhang, G.; Ding, X.; Li, Z. Monitoring earth surface deformation with InSAR technology: Principle and some critical issues. J. Geospatial Eng 2002, 2, 3–21. [Google Scholar]
  37. Zhou, X.; Chang, N.B.; Li, S. Applications of SAR interferometry in earth and environmental science research. Sensors 2009, 9, 1876–1912. [Google Scholar]
  38. Massonnet, D.; Rossi, M.; Carmona, C.; Adragna, F.; Peitzer, G.; Feigl, K.; Rabaute, T. The displacement field of the Landers earthquake mapped by radar interferometry. Nature 1993, 364, 138–142. [Google Scholar]
  39. Meyer, B.; Armijo, R.; Massey, C.I.; de Chablier, J.B.; Delacourt, C.; Rügg, J.C.; Achache, J.; Papatastassiou, D. Results from combining tectonic observations and SAR interferometry for the 1995 Greneva earthquake: A summary. J. Geodyn 1998, 26, 255–259. [Google Scholar]
  40. Raucoules, D.; Ristori, B.; de Michele, M.; Briole, P. Surface displacement of the Mw 7 Machaze earthquake (Mozambique): Complementary use of multiband InSAR and radar amplitude image correlation with elastic modelling. Remote Sens. Environ 2010, 114, 2211–2218. [Google Scholar] [Green Version]
  41. Tronin, A.A. Satellite remote sensing in seismology. A review. Remote Sens 2010, 2, 124–150. [Google Scholar]
  42. Manzo, M.; Ricciardi, G.P.; Casu, F.; Ventura, G.; Zeni, G.; Borgström, S.; Berardino, P.; del Gaudio, C.; Lanari, R. Surface deformation analysis in the Ischia Island (Italy) based on spaceborne radar interferometry. J. Volcanol. Geotherm. Res 2006, 151, 399–416. [Google Scholar]
  43. Cong, X.; Eineder, M.; Gernhardt, S.; Minet, C. Diverse Methods to Monitoring Volcanic Deformation Based on SAR Interferometry. Proceedings of the IEEE IGARSS, Honolulu, HI, USA, 25–30 July 2010; pp. 661–664.
  44. Hooper, A.; Prata, F.; Sigmundsson, F. Remote sensing of volcanic hazards and their precursors. Proc. IEEE 2012, 100, 2908–2930. [Google Scholar]
  45. Carnec, C.; Delacourt, C. Three years of mining subsidence monitored by SAR interferometry, near Gardanne, France. J. Appl. Geophys 2000, 43, 43–54. [Google Scholar]
  46. Chatterjee, R.S.; Fruneau, B.; Rudant, J.P.; Roy, P.S.; Frison, P.-L.; Lakhera, R.C.; Dadhwal, V.K.; Saha, R. Subsidence of Kolkata (Calcutta) City, India during the 1990s as observed from space by Differential Synthetic Aperture Radar Interferometry (D-InSAR) technique. Remote Sens. Environ 2003, 102, 176–185. [Google Scholar]
  47. Kirchner, M. Analyse Flächenhafter Senkungserscheinungen in Sedimentären Gebieten mit den Neuen Techniken der Radarfernerkundung; Forschungsbericht DLR 2005-01; Deutsches Zentrum für Luft- und Raumfahrt: Köln, Germany, 2005. (In German) [Google Scholar]
  48. Worawattanamateekul, J. The Application of Advanced Interferometric Radar Analysis for Monitoring Ground Subsidence: A Case Study in Bangkok. Ph.D. Dissertation, Technische Universität München, Munich, Germany, 2006. [Google Scholar]
  49. Ketelaar, V.B.H. Satellite Radar Interferometry—Subsidence Monitoring Techniques; Springer: New York, NY, USA, 2009. [Google Scholar]
  50. Tosi, L.; Teatini, P.; Carbognin, L.; Brancolini, G. Using high resolution data to reveal depth-dependent mechanism that drive land subsidence: The Venice coast, Italy. Tectonophysics 2009, 474, 271–284. [Google Scholar]
  51. Hung, W.-C.; Hwang, C.; Chen, Y.-A.; Chang, C.-P.; Yen, J.-Y.; Hooper, A.; Yang, C.-Y. Surface deformation from persistent scatterers SAR interferometry and fusion with levelling data: A case study over the Choushui River Alluvial Fan, Taiwan. Remote Sens. Environ 2011, 115, 957–967. [Google Scholar]
  52. Heleno, S.I.N.; Oliveira, L.G.S.; Henriques, M.J.; Falcão, A.P.; Lima, J.N.P.; Cooksley, G.; Ferretti, A.; Fonseca, A.M.; Lobo-Ferreira, J.P.; Fonseca, J.F.B.D. Persistent Scatterers Interferometry detects and measures ground subsidence in Lisbon. Remote Sens. Environ 2011, 115, 2152–2167. [Google Scholar]
  53. Cigna, F.; Osmanğlu, B.; Cabral-Cano, E.; Dixon, T.H.; Aacute;vila-Olivera, J.A.; Garduño-Monroy, V.H.; Demets, C.; Wdowinski, S. Monitoring land subsidence and its induced geological hazard with Synthetic Aperture Radar interferometry: A case study in Morelia, Mexico. Remote Sens. Environ 2012, 117, 146–161. [Google Scholar]
  54. Chen, J.; Wu, J.; Zhang, L.; Zou, J.; Liu, G.; Zhang, R.; You, B. Deformation trend extraction based on multi-temporal InSAR in Shanghai. A review. Remote Sens 2013, 5, 1774–1786. [Google Scholar]
  55. Del Ventisette, C.; Ciampalini, A.; Manunta, M.; Calò, F.; Paglia, L.; Ardizzone, F.; Mondini, A.C.; Reichenbach, P.; Mateos, R.M.; Bianchini, S.; et al. Exploitation of large archives of ERS and ENVISAT C-band SAR data to characterize ground deformations. Remote Sens 2013, 5, 3896–3917. [Google Scholar]
  56. Fruneau, B.; Achache, J.; Delacourt, C. Observation and modelling of the Saint-Etienne-de-Tinée landslide using SAR interferometry. Tectonophysics 1996, 265, 181–190. [Google Scholar]
  57. Colesanti, C.; Ferretti, A.; Novali, F.; Prati, C.; Rocca, F. SAR monitoring of progressive and seasonal ground deformation using the permanent scatterers technique. IEEE Trans. Geosci. Remote Sens 2003, 41, 1685–1701. [Google Scholar]
  58. Squarzoni, C.; Delacourt, C.; Allemand, P. Nine years of spatial and temporal evolution of the La Valette landslide observed by SAR interferometry. Eng. Geol 2003, 68, 53–66. [Google Scholar]
  59. Catani, F.; Farina, P.; Moretti, S.; Nico, G.; Strozzi, T. On the application of SAR interferometry to geomorphological studies: Estimation of landform attributes and mass movements. Geomorphology 2005, 66, 119–131. [Google Scholar]
  60. Metternicht, G.; Hurni, L.; Gogu, R. Remote sensing of landslides: An analysis of the potential contribution to geo-spatial systems for hazard assessment in mountainous environments. Remote Sens. Environ 2005, 98, 284–303. [Google Scholar]
  61. Bovenga, F.; Nutricato, R.; Refice, A.; Waswoski, J. Application of multitemporal differential interferometry to slope instability detection in urban/peri-urban areas. Eng. Geol 2006, 88, 218–239. [Google Scholar]
  62. Colesanti, C.; Wasowski, J. Investigation landslides with space-borne Synthetic Aperture Radar (SAR) interferometry. Eng. Geol 2006, 88, 173–199. [Google Scholar]
  63. Cascini, L.; Peduto, D.; Fornano, G.; Lanari, R.; Zeni, G.; Guzzetti, F. Spaceborne Radar Interferometry for Landslide Monitoring. Proceedings of the 1st Italian Workshop on Landslides, Naples, Italy, 2009; pp. 138–144.
  64. Lauknes, T.R.; Piyush Shanker, A.; Dehlis, J.F.; Zebker, H.A.; Henderson, I.H.C.; Larsen, Y. Detailed rockslide mapping in northern Norway with small baseline and persistent scatterer interferometric SAR time series methods. Remote Sens. Environ 2010, 114, 2097–2109. [Google Scholar]
  65. Tofani, V.; Raspini, F.; Catani, F.; Casagli, N. Persistent Scatterer Interferometry (PSI) technique for landslide characterization and monitoring. Remote Sens 2013, 5, 1045–1065. [Google Scholar]
  66. Tantianuparp, P.; Shi, X.; Zhang, L.; Balz, T.; Liao, M. Characterization of landslide deformations in three gorges area using multiple InSAR data stacks. Remote Sens 2013, 5, 2704–2719. [Google Scholar]
  67. Bianchini, S.; Herrera, G.; Mateos, R.M.; Notti, D.; Garcia, I.; Mora, O.; Moretti, S. Landslide activity maps generation by means of persistent scatterer interferometry. Remote Sens 2013, 5, 6198–6222. [Google Scholar]
  68. Chen, F.; Lin, H.; Hu, X. Slope superficial displacement monitoring by small baseline SAR interferometry using data from L-band ALOS PALSAR and X-band TerraSAR: A case study of Hong Kong, China. Remote Sens 2014, 6, 1564–1586. [Google Scholar]
  69. Wasowski, J.; Bovenga, F.; Nitti, D.O.; Nutricato, R. Investigating Landslides with Persistent Scatterers Interferometry (PSI): Current Issues and Challenges. In Landslides and Engineered Slopes, Protecting Society through Improved Understanding; Eberhardt, E., Froese, C., Turner, A.K., Leroueil, S., Eds.; Taylor & Francis Group: London, UK, 2012; pp. 1295–1301. [Google Scholar]
  70. Tosi, L.; Teatini, P.; Bincoletto, P.; Simonini, P.; Strozzi, T. Integrating geotechnical and interferometric SAR measurements for secondary compressibility characterization of coastal soils. Surv. Geophys 2012, 33, 907–926. [Google Scholar]
  71. Massironi, M.; Zampieri, D.; Bianchi, M.; Schiavo, A.; Francheschetti, A. Use of PSInSAR™ data to infer active tectonics: Clues on the differential uplift across the Giudicarie belt (Central-Eastern Alps, Italy). Tectonophysics 2009, 476, 297–303. [Google Scholar]
  72. Vilardo, G.; Ventura, G.; Terranova, C.; Matano, F.; Nardò, S. Ground deformation due to tectonic, hydrothermal, gravity, hydrogeological, and anthropic processes in the Campania Region (Southern Italy) from Permanent Scatterers Synthetic Aperture Radar Interferometry. Remote Sens. Environ 2009, 113, 197–212. [Google Scholar]
  73. Matsuoka, M.; Yamazaki, F. Characteristics of Satellite SAR Images in the Areas Damaged by Earthquakes. Proceedings of the IEEE IGARSS, Honolulu, HY, USA, 24–28 July 2000; pp. 2693–2696.
  74. Hoffmann, J. Mapping damage during the Bam (Iran) earthquake using interferometric coherence. Int. J. Remote Sens 2007, 28, 1199–1216. [Google Scholar]
  75. Löffler, E.; Honecker, U.; Stabel, E. Geographie und Fernerkundung. Eine Einführung in Die Geographische Interpretation von Luftbildern und Modernen Fernerkundungsdaten; Borntraeger; Berlin, Germany, 2005. (In German) [Google Scholar]
  76. Yonezawa, C.; Takeuchi, S. Detection of Urban Damage Using Interferometric SAR Decorrelation. Proceedings of the IEEE IGARSS, Hamburg, Germany, 28 June–2 July 1999; pp. 925–927.
  77. Takeuchi, S.; Suga, Y.; Yonezawa, C.; Chen, A.J. Detection of Urban Disaster Using InSAR—A Case Study for the 1999 Great Taiwan Earthquake. Proceedings of the IEEE IGARSS, Honolulu, HI, USA, 24–28 July 2000; pp. 339–341.
  78. Stramondo, S.; Bignami, C.; Chini, M.; Pierdicca, N.; Tertulliani, A. Satellite radar and optical remote sensing for earthquake damage detection: Results from different case studies. Int. J. Remote Sens 2006, 27, 4433–4447. [Google Scholar]
  79. Strozzi, T.; Dammer, P.B.G.; Wegmüller, U.; Martinez, J.-M.; Askne, J.I.H.; Beaudion, A.; Hallikainen, M.T. Landuse mapping with ERS SAR interferometry. IEEE Trans. Geosci. Remote Sens 2000, 38, 766–775. [Google Scholar]
  80. Lu, Z. InSAR imaging of volcanic deformation over cloud-prone areas—Aleutian Islands. Photogramm. Eng. Remote Sens 2007, 73, 245–257. [Google Scholar]
  81. Zebker, H.A.; Villasenor, J. Decorrelation in interferometric radar echoes. IEEE Trans. Geosci. Remote Sens 1992, 30, 950–959. [Google Scholar]
  82. Gens, R.; van Genderen, J.L. Review article SAR interferometry—Issues, techniques, applications. Int. J. Remote Sens 1996, 17, 1803–1835. [Google Scholar]
  83. Grey, W.M.F.; Luckman, A.J.; Holland, D. Mapping urban change in the UK using satellite radar interferometry. Remote Sens. Environ 2003, 87, 16–22. [Google Scholar]
  84. Yonezawa, C.; Takeuchi, S. Decorrelation of SAR data by urban damages caused by the 1995 Hyogoken-nanbu earthquake. Int. J. Remote Sens 2001, 22, 1585–1600. [Google Scholar]
  85. Moreira, A.; Prats-Iraola, P.; Younis, M.; Krieger, G.; Hajnsek, I.; Papathanassiou, K.P. A tutorial on synthetic aperture radar. IEEE Mag. Geosci. Remote Sens 2013, 1, 6–43. [Google Scholar]
  86. Wegmüller, U.; Werner, C.L. SAR interferometric signatures of forest. IEEE Trans. Geosci. Remote Sens 1995, 33, 1153–1161. [Google Scholar]
  87. Rosin, P.L.; Hervás, J. Remote sensing image thresholding methods for determining landslide activity. Int. J. Remote Sens 2005, 26, 1075–1092. [Google Scholar]
  88. Rott, H.; Nagler, T. The contribution of radar interferometry to the assessment of landslide hazards. Adv. Space Res 2006, 37, 710–719. [Google Scholar]
  89. Ahmed, R.; Siqueira, P.; Hensley, S.; Chapman, B.; Bergen, K. A survey of temporal decorrelation from spaceborne L-Band repeat-pass InSAR. Remote Sens. Environ 2011, 115, 2887–2896. [Google Scholar]
  90. Cartus, O.; Santoro, M.; Schmullius, C.; Li, Z. Large area forest stem volume mapping in the boreal zone using synergy of ERS-1/2 tandem coherence and MODIS vegetation continuous fields. Remote Sens. Environ 2011, 115, 931–943. [Google Scholar]
  91. Lu, D.; Mausel, P.; Brondízio, E.; Moran, E. Change detection techniques. Int. J. Remote Sens 2004, 25, 2365–2401. [Google Scholar]
  92. Suga, Y.; Takeuchi, S.; Oguro, Y.; Chen, A.J.; Ogawa, M.; Konishi, T.; Yonezawa, C. Application of ERS-2/SAR data for the 1999 Taiwan earthquake. Adv. Space Res 2001, 28, 155–163. [Google Scholar]
  93. Tzeng, Y.C.; Chiu, S.H.; Chen, D.; Chen, K.S. Change Detections from SAR Images for Damage Estimation Based on a Spatial Chaotic Model. Proceedings of the IEEE IGARSS, Barcelona, Spain, 23–27 July 2007; pp. 1926–1930.
  94. Gamba, P.; Dell’Acqua, F.; Trianni, G. Rapid damage detection in the Bam area using multitemporal SAR and exploiting ancillary data. IEEE Trans. Geosci. Remote Sens 2007, 45, 1582–1589. [Google Scholar]
  95. Ito, Y.; Hosokawa, M.; Lee, H.; Liu, J.G. Extraction of damaged regions using SAR data and neural networks. Int. Arch. Photogramm. Remote Sens 2000, XXXIII, 156–163. [Google Scholar]
  96. Ito, Y.; Hosokawa, M. Damage Estimation Model Using Temporal Coherence Ratio. Proceedings of the IEEE IGARSS, Toronto, ON, Canada, 24–28 June 2002; pp. 2859–2861.
  97. Matsuoka, M.; Yamazaki, F. Characteristics of Satellite Images of Damaged Areas Due to the 1995 Kobe Earthquake. Proceedings of the 2nd Conference on the Applications of Remote Sensing and GIS for Disaster Management, Honolulu, HI, USA, 24–28 July 1999; The George Washington University: Washington, DC, USA, 1999. (CD-ROM). [Google Scholar]
  98. Yonezawa, C.; Tomiyama, N.; Takeuchi, S. Urban Damage Detection Using Decorrelation of SAR Interferometric Data. Proceedings of the IEEE IGARSS, Toronto, Canada, 24–28 June 2002; pp. 2051–2053.
  99. Matsuoka, M.; Yamazaki, F. Use of satellite SAR intensity imagery for detecting building areas damaged due to earthquakes. Earthq. Spectra 2004, 2, 975–994. [Google Scholar]
  100. Matsuoka, M.; Yamazaki, F. Building damage mapping of the 2003 Bam, Iran, earthquake using Envisat/ASAR intensity imagery. Earthq. Spectra 2005, 21, 285–294. [Google Scholar]
  101. Matsuoka, M.; Nojima, N. Building damage estimation by integration of seismic intensity information and satellite L-band SAR imagery. Remote Sens 2010, 2, 2111–2126. [Google Scholar]
  102. Matsuoka, M.; Yamazaki, F. Application of the Damage Detection Method Using SAR Intensity Images to Recent Earthquakes. Proceedings of the IEEE IGARSS, Toronto, ON, Canada, 24–28 June 2002; pp. 2042–2044.
  103. Ito, Y.; Hosokawa, M.; Matsuoka, M. A. Degree Estimation Model of Earthquake Damage Using Temporal Coherence Ratio. Proceedings of the IEEE IGARSS, Toulouse, France, 21–25 July 2003; pp. 2410–2412.
  104. Trianni, G.; Lisini, G.; dell’Acqua, F.; Gamba, P. Fusion of GIS and Statistical Features of Satellite SAR Images for Earthquake Damage Mapping at the Block Scale. In Machine Interpretation of Patterns, Image Analysis and Data Mining, World Scientific; De, R.K., Mandal, D.P., Ghosh, A., Eds.; World Scientific: Singapore, 2010; pp. 195–206. [Google Scholar]
  105. Trianni, G.; Gamba, P. Fast damage mapping in case of earthquakes using multitemporal SAR data. J. Real-Time Image Process 2009, 4, 195–203. [Google Scholar]
  106. Arciniegas, G.A. Earthquake-Induced Urban Damage Analysis Using Interferometric SAR Data. M.Sc. Thesis, International Institute for Geo-Information Science and Earth Observation, Enschede, The Netherlands, 2005. [Google Scholar]
  107. Fielding, E.J.; Talebian, M.; Rosen, P.A.; Nazari, H.; Jackson, J.A.; Ghorashi, M.; Walker, R. Surface ruptures and building damage of the 2003 Bam, Iran, earthquake mapped by satellite synthetic aperture radar interferometric correlation. J. Geophys. Res 2005, 110, B03302:1–B03302:15. [Google Scholar]
  108. Brunner, D.; Bruzzone, L.; Lemoine, G. Change Detection for Earthquake Damage Assessment in Built-up Areas Using very High Resolution Optical and SAR Data. Proceedings of the IEEE IGARSS, Honolulu, HI, USA, 25–30 July 2010; pp. 3210–3213.
  109. Matsuoka, M.; Yamazaki, F. Use of SAR Imagery for Monitoring Areas Damaged due to the 2006 Mid Java, Indonesia Earthquake. Proceedings of the 4th International Workshop on Remote Sensing for Post-Disaster Response, Cambridge, UK, 25–26 September 2006.
  110. Balz, T.; Perissin, D.; Soergel, U.; Zhang, L.; Liao, M. Post-Seismic Infrastructure Damage Assessment Using High-Resolution SAR Satellite Data. Proceedings of the 2nd International Conference on Earth Observation for Global Change, Chengdu, China, 25–29 May 2009; Available online: http://wenku.baidu.com/view/e7644919a216147917112860.html (accessed on 26 May 2014).
  111. Wang, H.; Jin, Y.-Q. Statistical Analysis to Assess Building Damage in 2008 Wenchuan Earthquake from Multi-Temporal SAR Images. Proceedings of the IEEE IGARSS, Cape Town, South Africa, 12–17 July 2009; pp. 121–123.
  112. Balz, T.; Liao, M. Building-damage detection using postseismic high-resolution SAR satellite data. Int. J. Remote Sens 2010, 31, 3369–3391. [Google Scholar]
  113. Pan, G.; Tang, D. Damage information derived from multi-sensor data of the Wenchuan Earthquake of May 2008. Int. J. Remote Sens 2010, 31, 3509–3519. [Google Scholar]
  114. Guida, R.; Iodice, A.; Riccio, D. Monitoring of Collapsed Built-up Areas with High Resolution SAR Images. Proceedings of the IEEE IGARSS, Honolulu, HI, USA, 25–30 July 2010; pp. 2422–2425.
  115. Dell’Acqua, F.; Bignami, C.; Chini, M.; Lisini, G.; Polli, D.A.; Stramondo, S. Earthquake damages rapid mapping by satellite remote sensing data: L’Aquila 6 April 2009 event. IEEE Trans. Geosci. Remote Sens 2011, 4, 935–943. [Google Scholar]
  116. Cossu, R.; dell’Acqua, F.; Polli, D.A.; Rogolino, G. SAR-based seismic damage assessment in urban areas: Scaling down resolution, scaling up computational performance. IEEE Trans. Geosci. Remote Sens 2012, 5, 1110–1116. [Google Scholar]
  117. Dell’Acqua, F.; Lanese, I.; Polli, D.A. Integration of EO-based vulnerability estimation into EO-based seismic damage assessment: A case study on L’Aquila, Italy, 2009 earthquake. Nat. Hazards 2013, 68, 165–180. [Google Scholar]
  118. Brett, P.T.B.; Guida, R. Earthquake damage detection in urban areas using curvilinear features. IEEE Trans. Geosci. Remote Sens 2013, 51, 4877–4884. [Google Scholar]
  119. Kawamura, M.; Tsujino, K.; Tsujiko, Y.; Tanjung, J. Detection Method of Slope Failures Due to the 2009 Sumatra Earthquake by Using TerraSAR-X Images. Proceedings of the IEEE IGARSS, Vancouver, BC, Canada, 24–29 July 2011; pp. 4292–4295.
  120. Jin, D.; Wang, X.; Dou, A.; Dong, Y. Post-earthquake building damage assessment in Yushu using airborne SAR imagery. Earthq. Sci 2011, 24, 463–473. [Google Scholar]
  121. Chini, M.; Piscini, A.; Cinti, F.R.; Amici, S.; Nappi, R.; de Martini, P.M. The 2011 Tohoku (Japan) Tsunami inundation and liquefaction investigated through optical, thermal, and SAR data. IEEE Trans. Geosci. Remote Sens 2013, 10, 347–351. [Google Scholar]
  122. European Macroseismic Scale 1998; EMS-98; Grünthal, G.; Musson, R.M.W.; Schwarz, J.; Stucchi, M. (Eds.) European Seismological Commission: Luxemburg, Luxemburg, 1998.
  123. Shinozuka, M.; Loh, K. Remote Sensing with the Synthetic Aperture Radar (SAR) for Urban Damage Detection. Proceedings of the 9th International Conference Engineering, Construction, Operations in Challenging Environments, League City/Houston, TX, USA, 7–10 March 2004; pp. 223–230.
  124. Mansouri, B.; Shinozuka, M.; Huyck, C.; Houshmand, B. Earthquake-induced change detection in the 2003 Bam, Iran, earthquake by complex analysis using Envisat ASAR data. Earthq. Spectra 2005, 21, 275–284. [Google Scholar]
  125. Mansouri, B.; Shinozuka, M.; Nourjou, R. SAR Remote Sensing for Urban Damage Assessment for Teheran. Proceedings of the 5th International Workshop Remote Sensing Application Natural Hazards, Washington, DC, USA, 10–11 September 2007; Available online: http://www.gwu.edu/~spi/assets/docs/Babak%20-%20SAR%20Remote%20Sensing%20for%20Urban%20Damage%20Assessment%20for%20Tehran.pdf (accessed on 26 May 2014).
  126. United Nations Institute for Training and Research (UNITAR); Operational Satellite Applications Programme (UNOSAT); European Commission (EC); Joint Research Centre (JRC); The World Bank. Atlas of Building Damage Assessment: Haiti earthquake 12 January 2010 in support to Post Disaster Needs Assessment and Recovery Framework (PDNA). 2010. Available online: http://www.geo.uzh.ch/fileadmin/files/content/abteilungen/rsl1/newspress/various_files/100317_Atlas_damage_assessment.pdf (accessed on 26 May 2014).
  127. Giordano, F.; Goccia, M.; Dellpiane, S. Segmentation of Coherence Maps for Flood Damage Assessment. Proceedings of the IEEE IGARSS, Seoul, Korea, 25–29 July 2005; pp. 233–236.
  128. Takeuchi, S.; Yamada, S. Monitoring of Forest Fire Damage by Using JERS-1 InSAR. Proceedings of the IEEE IGARSS, Toronto, ON, Canada, 24–28 June 2002; pp. 3290–3292.
  129. Tanase, M.A.; Santoro, M.; Wegmüller, U.; de la Riva, J.; Pérez-Cabello, F. Properties of X-, C- and L-band repeat-pass interferometric SAR coherence in Mediterranean pine forests affected by fires. Remote Sens. Environ 2010, 114, 2182–2194. [Google Scholar]
  130. Tanase, M.A.; de la Riva, J.; Santoro, M.; Pérez-Cabello, F.; Kasischke, E. Sensitivity of SAR data to post-fire forest regrowth in Mediterranean and boreal forests. Remote Sens. Environ 2011, 115, 2075–2085. [Google Scholar]
  131. Wright, P.; Macklin, T.; Willis, C.; Rye, T. Coherent Change Detection with SAR. Proceedings of the Radar Conference EURAD 2005, Paris, France, 6–7 October 2005; pp. 17–20.
  132. Zhao, C.; Zhang, Q.; Yin, Y.; Lu, Z.; Yang, C.; Zhu, W.; Li, B. Pre-, co-, and post- rockslide analysis with ALOS/PALSAR imagery: A case study of the Jiweishan rockslide, China. Nat. Hazards Earth Syst. Sci 2013, 13, 2851–2861. [Google Scholar]
  133. Open Street Map. Available online: http://download.geofabrik.de/ (accessed on 2 May 2014).
  134. ESRI Base Maps. Available online: http://www.esri.com/software/arcgis/arcgisonline/maps/maps-and-map-layers (accessed on 2 May 2014).
  135. Bing Maps. Available online: http://www.bing.com/maps/ (accessed on 2 May 2014).
  136. Google Maps. Available online: https://maps.google.de/ (accessed on 2 May 2014).
  137. Google Earth. Available online: http://earth.google.de/ (accessed on 2 May 2014).
  138. United States Census Bureau. Available online: https://www.census.gov/geo/maps-data/data/gazetteer.html (accessed on 2 May 2014).
  139. GeoScience Australia. Available online: http://www.ga.gov.au/search/index.html#/ (accessed on 2 May 2014).
  140. Global Earthquake Model, Global Exposure Database (GED). Available online: http://www.globalquakemodel.org (accessed on 2 May 2014).
  141. Torres, R.; Snoeij, P.; Geudtner, D.; Bibby, D.; Davidson, M.; Attema, E.; Potin, P.; Rommen, B.; Floury, N.; Brown, M.; et al. GMES Sentinel-1 mission. Remote Sens. Environ 2012, 120, 9–24. [Google Scholar]
  142. De Zan, F.; Monti Guarnieri, A.M. TOPSAR: Terrain observation by progressive scans. IEEE Trans. Geosci. Remote Sens 2006, 44, 2352–2360. [Google Scholar]
  143. Aschbacher, J.; Milagro-Peréz, M.P. The European Earth monitoring (GMES) programme: Status and perspectives. Remote Sens. Environ 2012, 120, 3–8. [Google Scholar]
  144. ESA. Sentinel High Level Operations Plan, 1st ed 2013. Available online: https://sentinel.esa.int/documents/247904/351367/Sentinel+High+Level+Operations+Plan/530fd782-6386-4d26-9e05-36970bf91b85 (accessed on 25 March 2014).
Figure 1. First row: Intact building (left) and destroyed building with roof still intact (right); Second row: Using optical imagery it is very difficult to distinguish between the intact and the destroyed building with still intact roof (especially in the near nadir region); Third row: Interferometric analysis uses the phase difference between the pre- and post-disaster SAR acquisition enabling the distinction between both buildings.
Remotesensing 06 04870f1
Figure 2. Principle of InSAR. As the distance from SAR 2 to the object on the ground is by the amount of ΔR longer than the distance from SAR 1 to the object (Rs,2 = Rs,1 + ΔR), two different phase signals are recorded at the two SAR acquisitions. This phase difference can be used to determine the topographic height h of the object on the ground.
Remotesensing 06 04870f2
Figure 3. Three SAR images are required for the damage assessment methods interferometric coherence and SAR intensity correlation: Two images acquired before the event (time t1 and t2) and at least one SAR acquisition shortly after the disaster at time t3. In the optimum case the temporal baseline between each acquisition is only one repeat cycle (cf. also Section 4).
Remotesensing 06 04870f3
Figure 4. Schematic flow chart of the two methods used for damage assessment: At least three SAR acquisitions are required: Two images acquired before the event (time t1 and t2) and at least one SAR acquisition shortly after the disaster at time t3 (as described in Figure 3). First, all images are co-registered to one common master (here image t2 is selected as master image). Then, both slave images are resampled to the master’s reference grid. For both, the SAR intensity correlation, as well as for the coherence (calculated from the interferograms), two image pairs are generated: one pre-event (t1 and t2) and one co-event (t2 and t3) image pair. The damage is assessed by detecting the change between the corresponding image pairs (see Section 2.3).
Remotesensing 06 04870f4
Table 1. The ten deadliest natural disaster events (1980–2012) [20].
YearType of DisasterCountryFatalities
12 January 2010EarthquakeHaiti222,570
26 December 2004Earthquake/TsunamiIndonesia, Thailand, India, Sri Lanka, Myanmar, Malaysia, Maldivians222,000
2–5 May 2008Cyclone Nargis, storm surgeMyanmar140,000
29–30 April 1991Tropical cyclone, storm surgeBangladesh139,000
8 October 2005EarthquakePakistan, India, Afghanistan88,000
12 May 2008EarthquakeChina84,000
July/August 2003Heat wave, DroughtFrance, Germany, Italy, Portugal, Romania, Spain, UK70,000
July/September 2010Heat waveRussia56,000
20 June 1990EarthquakeIran40,000
26 December 2003EarthquakeIran: Bam26,200
Table 2. Synthetic Aperture Radar (SAR) missions relevant for this review paper (modified after [23]).
SAR MissionLaunchOut of ServiceBand *Spatial Resolution (Azmiuth and Ground Range) (m) **Repeat Cycle (Days)
ERS-119912000C3035
ERS-219952011C3035
ENVISAT/ASAR20022012C3035
Radarsat-119952013C8–10024
Radarsat-22007C2–16024
Sentinel-12014C5–4012 (6 ***)
J-ERS-119921998L1846
ALOS/PALSAR20062011L10–10044
COSMO-SkyMed2007X1–3016 (4 ****)
TerraSAR-X2007X1–4011
*X-band: λ = 3.1 cm; C-band: λ = 5.6 cm; L-band: λ = 23.6 cm;
**Depending on the imaging mode;
***With Sentinel-1 B, the repeat cycle will be reduced to 6 days (see also Section 5);
****Using all satellites of the four-satellite-constellation, the repeat cycle of COSMO-SkyMed reduces to 4 days.
Table 3. Severe earthquakes and published research focusing on SAR imagery.
YearEarthquakeCountryStudies
1995Kobe/Hyogokon-NanbuJapanIto et al. 2000 [95], Yonezawa and Takeuchi 1999 [76], Yonezawa and Takeuchi 2001 [84], Ito and Hosokawa 2002 [96], Matsuoka and Yamazaki 1999 [97], Matsuoka and Yamazaki 2000 [73], Yonezawa et al. 2002 [98], Matsuoka and Yamazaki 2004 [99], Matsuoka and Yamazaki 2005 [101], Matsuoka and Nojima 2010 [101]
1999Kocaeli/GölcükTurkeyMatsuoka and Yamazaki 2000 [73], Matsuoka and Yamazaki 2002 [102], Ito et al. 2003 [103], Trianni et al. 2010 [104]
1999IzmitTurkeyBignami et al. 2004 [7], Stramondo et al. 2006 [78], Trianni and Gamba 2009 [105], Trianni et al. 2010 [104]
1999Chi-Chi/Great TaiwanTaiwanTakeuchi et al. 2000 [77], Suga et al. 2001 [92]
2001GujaratIndiaMatsuoka and Yamazaki 2002 [102], Yonezawa et al. 2002 [98]
2003BoumerdesAlgeriaTrianni and Gamba 2008 [2]
2003BamIranBignami et al. 2004 [7], Arciniegas 2005 [106], Fielding et al. 2005 [107], Matsuoka and Yamazaki 2005 [100], Stramondo et al. 2006 [78], Arciniegas et al. 2007 [8], Gamba et al. 2007 [94], Hoffmann 2007 [74], Brunner et al. 2010 [108], Trianni et al. 2010 [104]
2004SumatraIndonesiaChini et al. 2008 [9]
2006Mid JavaIndonesiaMatsuoka and Yamazaki 2004 [99], Matsuoka and Yamazaki 2006 [109], Brunner et al. 2010 [108]
2007PiscoPeruTrianni and Gamba 2008 [2]
2007ChinchaPeruMatsuoka and Nojima 2010 [101]
2008WenchuanChinaBalz et al. 2009 [110], Wang and Jin 2009 [111], Balz and Lia 2010 [112], Pan and Tang 2010 [113]
2009L’AquilaItalyGuida et al. 2010 [114], Dell’Acqua et al. 2011 [115], Cossu et al. 2012 [116], Dell’Acqua and Gamba 2012 [24], Dell’Acqua et al. 2013 [117], Brett and Guida 2013 [118]
2009SumatraIndonesiaChristophe et al. 2010 [21], Kawamura et al. 2011 [119]
2010HaitiHaitiUprety and Yamazaki 2012 [10], Brett and Guida 2013 [118]
2010Yushu CountyChinaJin et al. 2011 [120]
2011TohokuJapanChini et al. 2013 [121]
Table 4. Characteristics of the Sentinel-1 modes Interferometric Wide swath and Strip Map—the important modes for damage assessment applications (modified after [141,144]).
ParameterInterferometric Wide Swath Mode (IW)Strip Map Mode (SM)
PolarizationHH + HV, VV + VH, HH, VVHH + HV, VV + VH, HH, VV
Incidence angle range29°–46°20°–45°
Azimuth resolution20 m5 m
Ground range resolution5 m5 m
Swath width250 km80 km (6 swathes)
Table 5. Advantages of the damage assessment approaches reviewed in Sections 3.1–3.4.
SectionMethod (General)AdvantagesAchieved Accuracies *
3.1Interferometric coherenceEnables better differentiation of slightly damaged and undamaged areas.ca. 45%–49%
3.2SAR intensity correlationMore sensitive to larger changes (stronger damages) on the ground.
Provides still useful information at spatial and temporal baselines, which are too large for useful coherence application.
ca. 41%–55%
3.3Combination of coherence and intensity correlation (and SAR backscatter)Strong increase of the damage assessment accuracy compared to the application of only interferometric coherence or intensity correlation, respectively.ca. 52%–60%
3.4Use of additional data (e.g., optical imagery and GIS data)Additional increase of the damage assessment accuracy (compared to Section 3.3).
Presentation of the damage level at meaningful distribution (e.g., city parcel boundaries, building blocks, etc.) enables the generation of damage maps more suited to the user.
ca. 77%–88%
*Overall accuracy values (cf. Section 3.5).

