Article

Mapping Oil Palm Plantations in Cameroon Using PALSAR 50-m Orthorectified Mosaic Images

1
College of Information & Electrical Engineering, China Agricultural University, Beijing100083, China
2
Department of Microbiology and Plant Biology, Center for Spatial Analysis, University of Oklahoma, Norman, OK 73019, USA
3
Institute of Agricultural Research for Development (IRAD), Regional Center for Agricultural Research Nkolbisson (CRRANK), P.O. Box 2123, Yaoundé, Cameroon
*
Author to whom correspondence should be addressed.
Remote Sens. 2015, 7(2), 1206-1224; https://doi.org/10.3390/rs70201206
Submission received: 13 September 2014 / Accepted: 14 January 2015 / Published: 23 January 2015

Abstract

:
Oil palm plantations have expanded rapidly. Estimating either positive effects on the economy, or negative effects on the environment, requires accurate maps. In this paper, three classification algorithms (Support Vector Machine (SVM), Decision Tree and K-Means) were explored to map oil palm plantations in Cameroon, using PALSAR 50 m Orthorectified Mosaic images and differently sized training samples. SVM had the ideal performance with overall accuracy ranging from 86% to 92% and a Kappa coefficient from 0.76 to 0.85, depending upon the training sample size (ranging from 20 to 500 pixels per class). The advantage of SVM was more obvious when the training sample size was smaller. K-Means required the user’s intervention, and thus, the accuracy depended on the level of his/her expertise and experience. For large-scale mapping of oil palm plantations, the Decision Tree algorithm outperformed both SVM and K-Means in terms of speed and performance. In addition, the decision threshold values of Decision Tree for a large training sample size agrees with the results from previous studies, which implies the possible universality of the decision threshold. If it can be verified, the Decision Tree algorithm will be an easy and robust methodology for mapping oil palm plantations.

Graphical Abstract

1. Introduction

Oil palm (Elaeis guineensis Jacq.) is one of the most productive vegetable oil crops in the world. It was reported that oil palm plantations have an average annual production of 3.5 tons of edible oil per hectare [1] in the humid tropical lowland rainforest regions of the world. In addition, the development of high-yield varieties has made oil palm planting a lucrative and profitable agricultural pursuit. Such significant economic value is attractive, and has driven extensive land cover change in the humid forest zones of Cameroon. The southwest, south and littoral areas of Cameroon have been the most attractive regions for investors. After drastic price drops for cocoa and coffee in Cameroon, many small- and medium-sized farms invested in palm oil production, and it was reported [2] that the area of oil palm plantations had steadily increased over the period of 2003–2010. The area of oil palm plantations owned by small and medium farms increased from 50,000 ha in 2003 to 98,000 ha in 2010; the area of oil palm plantation owned by large-scale agro-industrial estates increased from 115,000 ha to 170,000 ha [2].A recent survey reported a total area of 190,000 ha and a total production of 230,000 tons of crude palm oil in Cameroon [3]. Because of the increasing global demand and good bioclimatic conditions in some parts of Cameroon for high production of oil palm, it is likely that the area of oil palm plantations will continue to increase in Cameroon in the next few decades.
Oil palm plantation expansion is directly related to deforestation, which can result in a series of negative impacts [4] such as forest estate loss, social costs, alternative revenue loss, biodiversity and ecological connectivity decrease, and greenhouse gas emissions [5,6]. Despite these unintended consequences, the government policy favors expansion of oil palm plantations, due to the belief that increased plantation area reduces costs associated with forest loss [3]. If planned carefully, the expansion of oil palm production can fully develop local economies and reduce rural poverty [3]. If not, it may harm the local society, economy, and environment, and threaten sustainable development. To assess both its positive and negative effects and to provide scientific data to support planning for the expansion of oil palm plantations, size and location of oil palm plantations are necessary. Thus, it is very important to map the existing plantations to provide all these information.
Satellite remote sensing provides continuous observations of land surface and has been used to map oil palm plantations in many studies [7,8,9,10]. Optical data based methods which are commonly used can be divided into two broad categories: image-based approaches and phenology-based approaches. Image-based approaches use spectral signatures (image statistics) to delineate oil palm trees, for example, Thenkabail et al. [11] used certain spectral class thresholds combined with texture measures to separate oil palm plantations from other West African land use/land cover (LULC) categories in both wet and dry seasons IKONOS images. Shafri et al. [12] implemented the spectral angle mapper (SAM) classifier using high spatial resolution, airborne imaging spectrometer data in 2004 to extract oil palm trees in Selangor, Malaysia. However, whether using certain spectral class thresholds or implementing spectral angle mapper classifier, image-based methods are challenging because of the rapidly developed canopy that makes oil palm plantations spectrally similar to other land cover types [13,14]. Phenology-based methods usually rely on the temporal signals of optical sensors to identify oil palm plantations. For example, Gutierrez-Velez et al. [15] analyzed temporal changes in vegetation greenness using MODIS data to map the area deforested by industrial-scale high-yield oil palm expansion in the Peruvian Amazon from 2000 to 2010. For the same area, Gutierrez-Velez [16] used the 16 day composite EVI (Enhanced Vegetation Index) from MODIS to detect the oil palm expansion at a coarse scale and applied a temporal categorical filter to an ALOS-PALSAR scene from September 2010 and Landsat TM/ETM+ images for every year from 2000 to 2011 to map the area converted into oil palm plantations at a fine scale. Phenology-based methods usually use MODIS data, which have a relatively coarse spatial resolution (250–500 m), and are thus not ideal methods due to the distribution of oil palm plantations in fragmented landscapes. In addition, saturation of the optimal images caused by canopy closure will also reduce the possibility of detecting structural characteristics [12]. In moist tropical regions, frequent cloud cover makes it impossible to acquire cloud-free optical satellite images to monitor large-scale oil palm plantations. In comparison, Synthetic Aperture Radar (SAR) is all-weather and all-time capable. Therefore, many researchers turn to SAR data for monitoring in tropical areas [17,18]. SAR data have successfully shown potential and suitability for oil palm mapping [13,14,19].
The Phased Array L-band Synthetic Aperture Radar (PALSAR) carried by the Advanced Land Observing Satellite (ALOS), which was launched on 24 January 2006 and was declared non-functional in orbit on 12 May 2011, used an L-band microwave (wavelength, 23.6 cm, corresponding center frequency, 1270 MHz) that is suitable for mapping forests. Several studies have used PALSAR data for forest monitoring and classification [17,20,21,22,23,24,25,26,27,28,29]. PALSAR data are often combined with optical images such as Landsat and MODIS. For oil palm identification with PALSAR data, backscatter characteristics of individual bands (HH, HV, and HH-HV) were used [30], and texture features of HH and HV bands were also taken into account [26]. All these previous studies reported that the PALSAR data are valuable for forest mapping, and especially suitable for oil palm monitoring, but their accuracies varied, dependent upon classification methods.
The objective of this study is twofold: (1) to evaluate the potential of PALSAR imagery to map oil palm plantations in Cameroon and (2) to evaluate the effectiveness of various classification methods in the use of PALSAR data. We implemented Support Vector Machine (SVM), K-Means, and Decision Tree methods to map oil palm plantations in a small region in Cameroon. To assess the performance of various classification methods, we randomly selected training samples of different sample sizes from a large set of training points. We aimed to provide feasible algorithm selection reference of oil palm plantation mapping with PALSAR data [31].

2. Materials and Methods
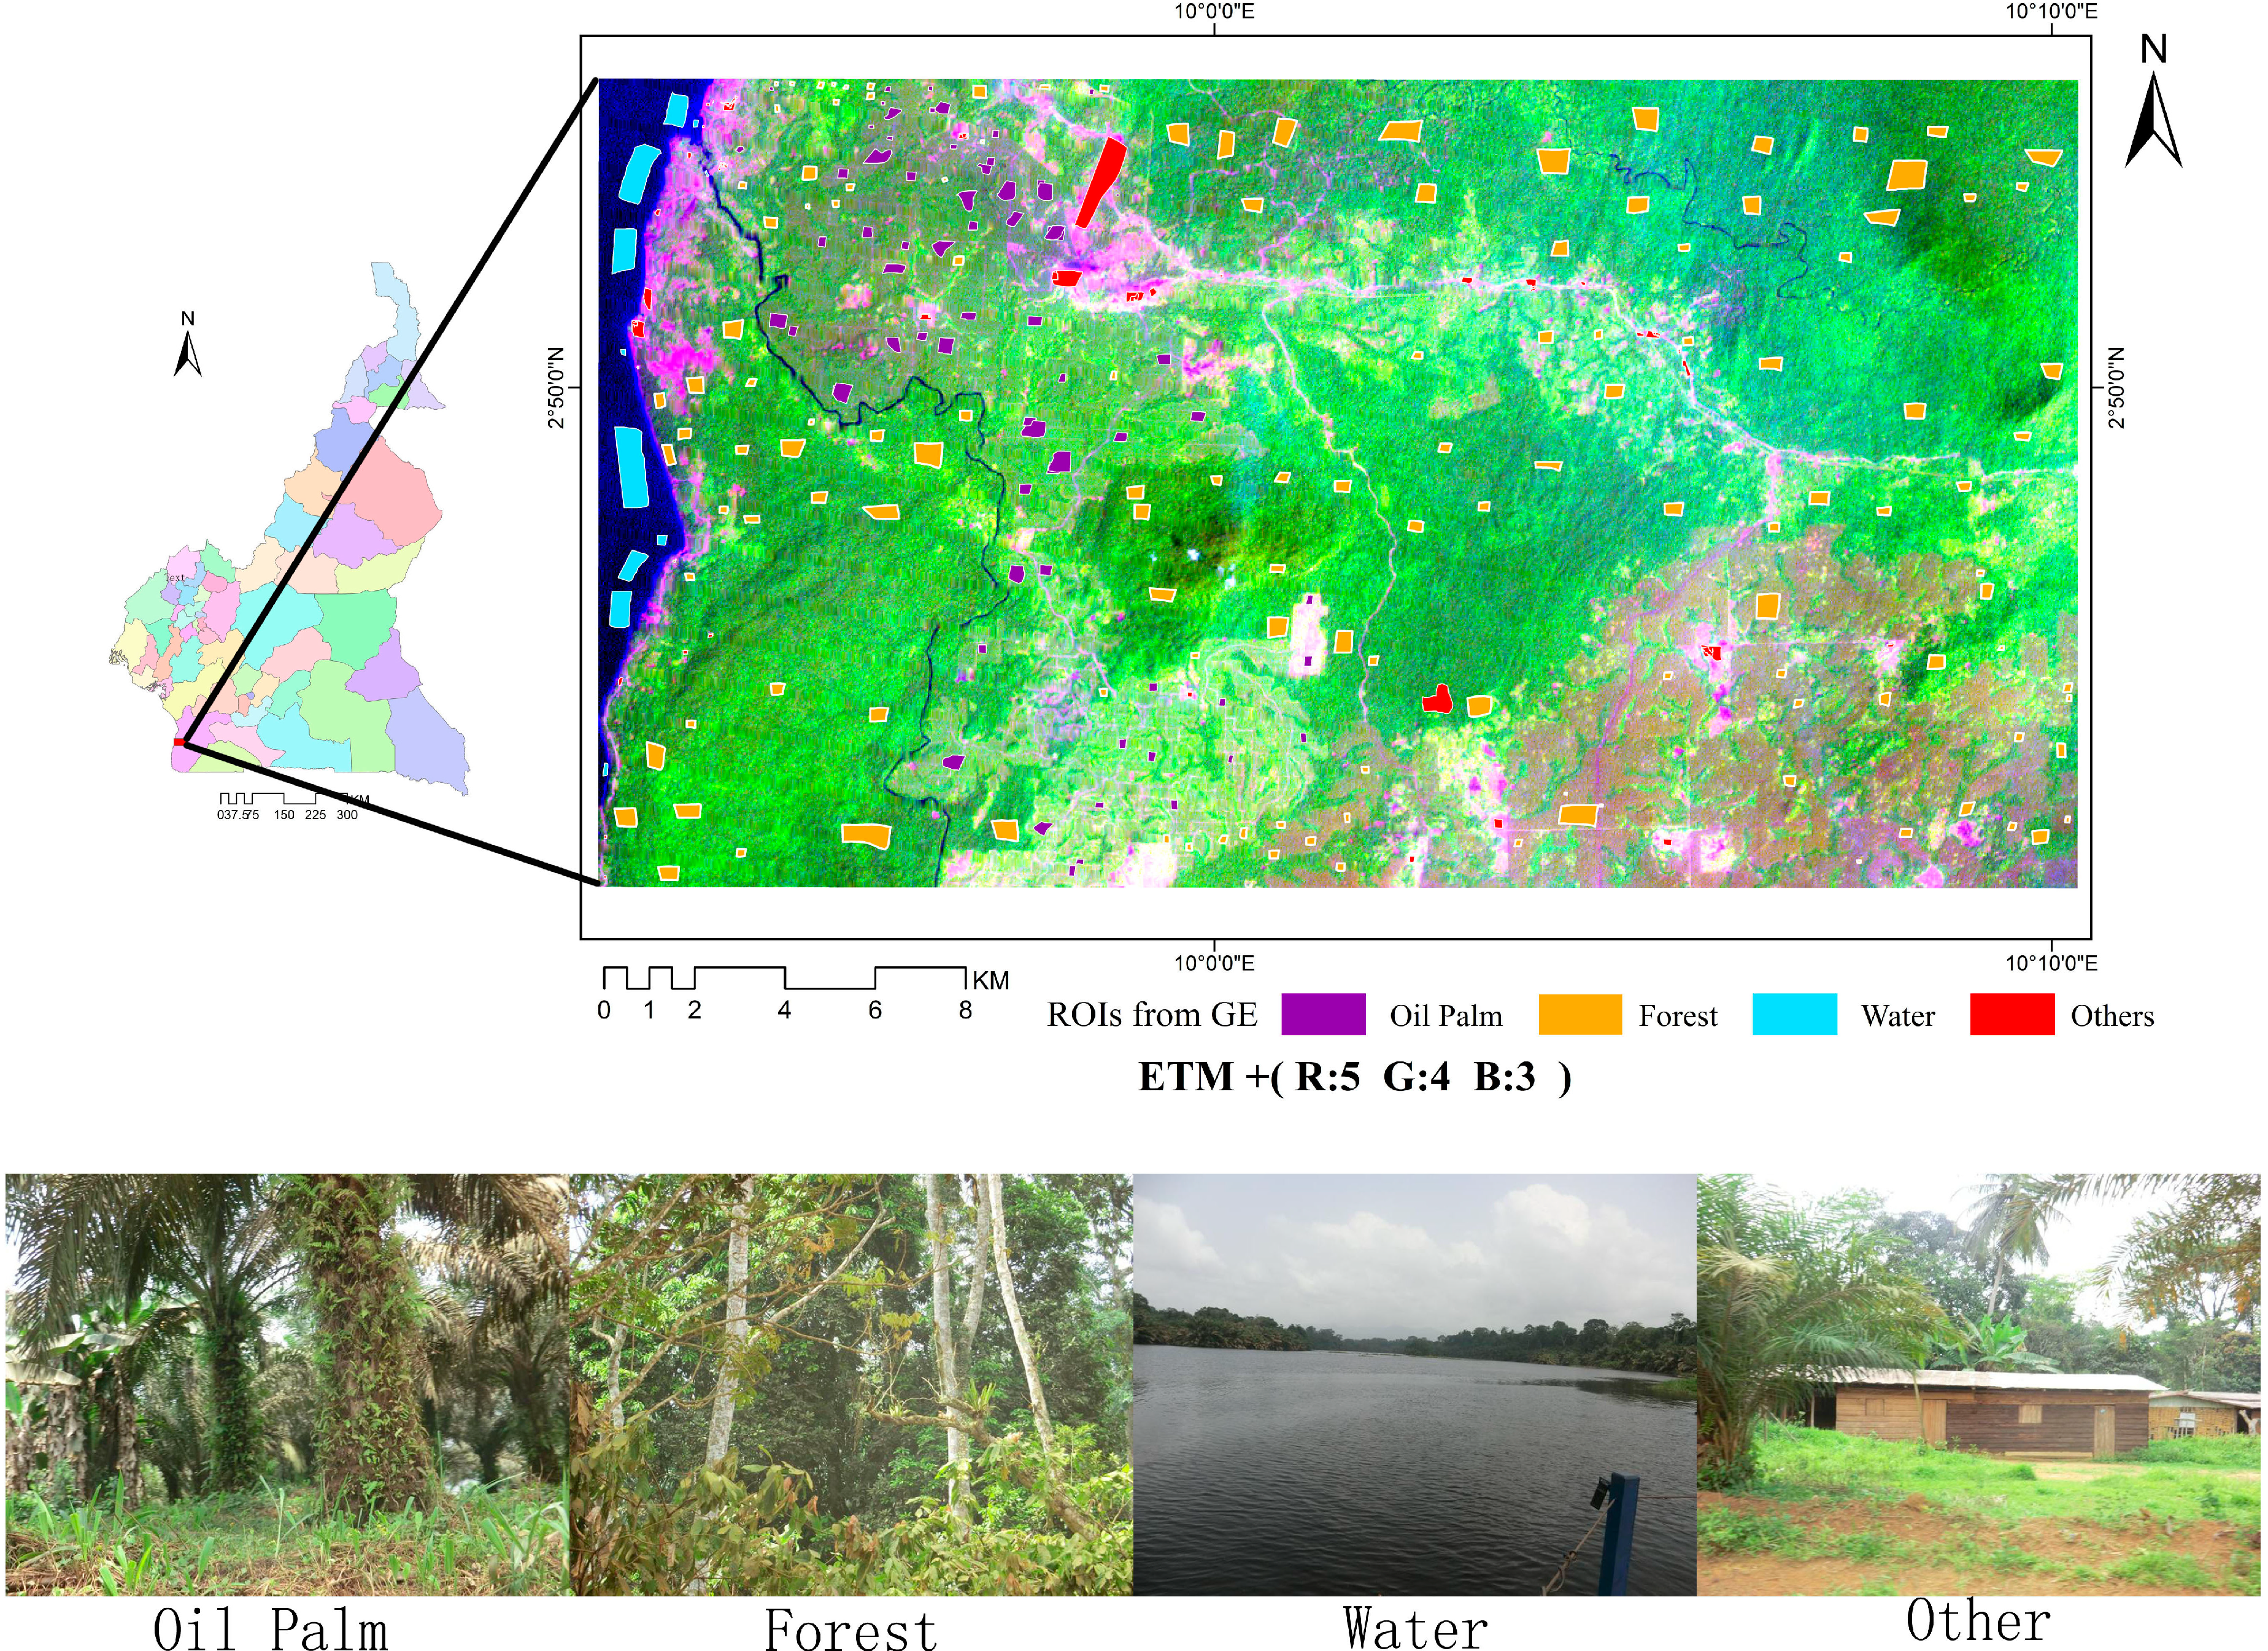
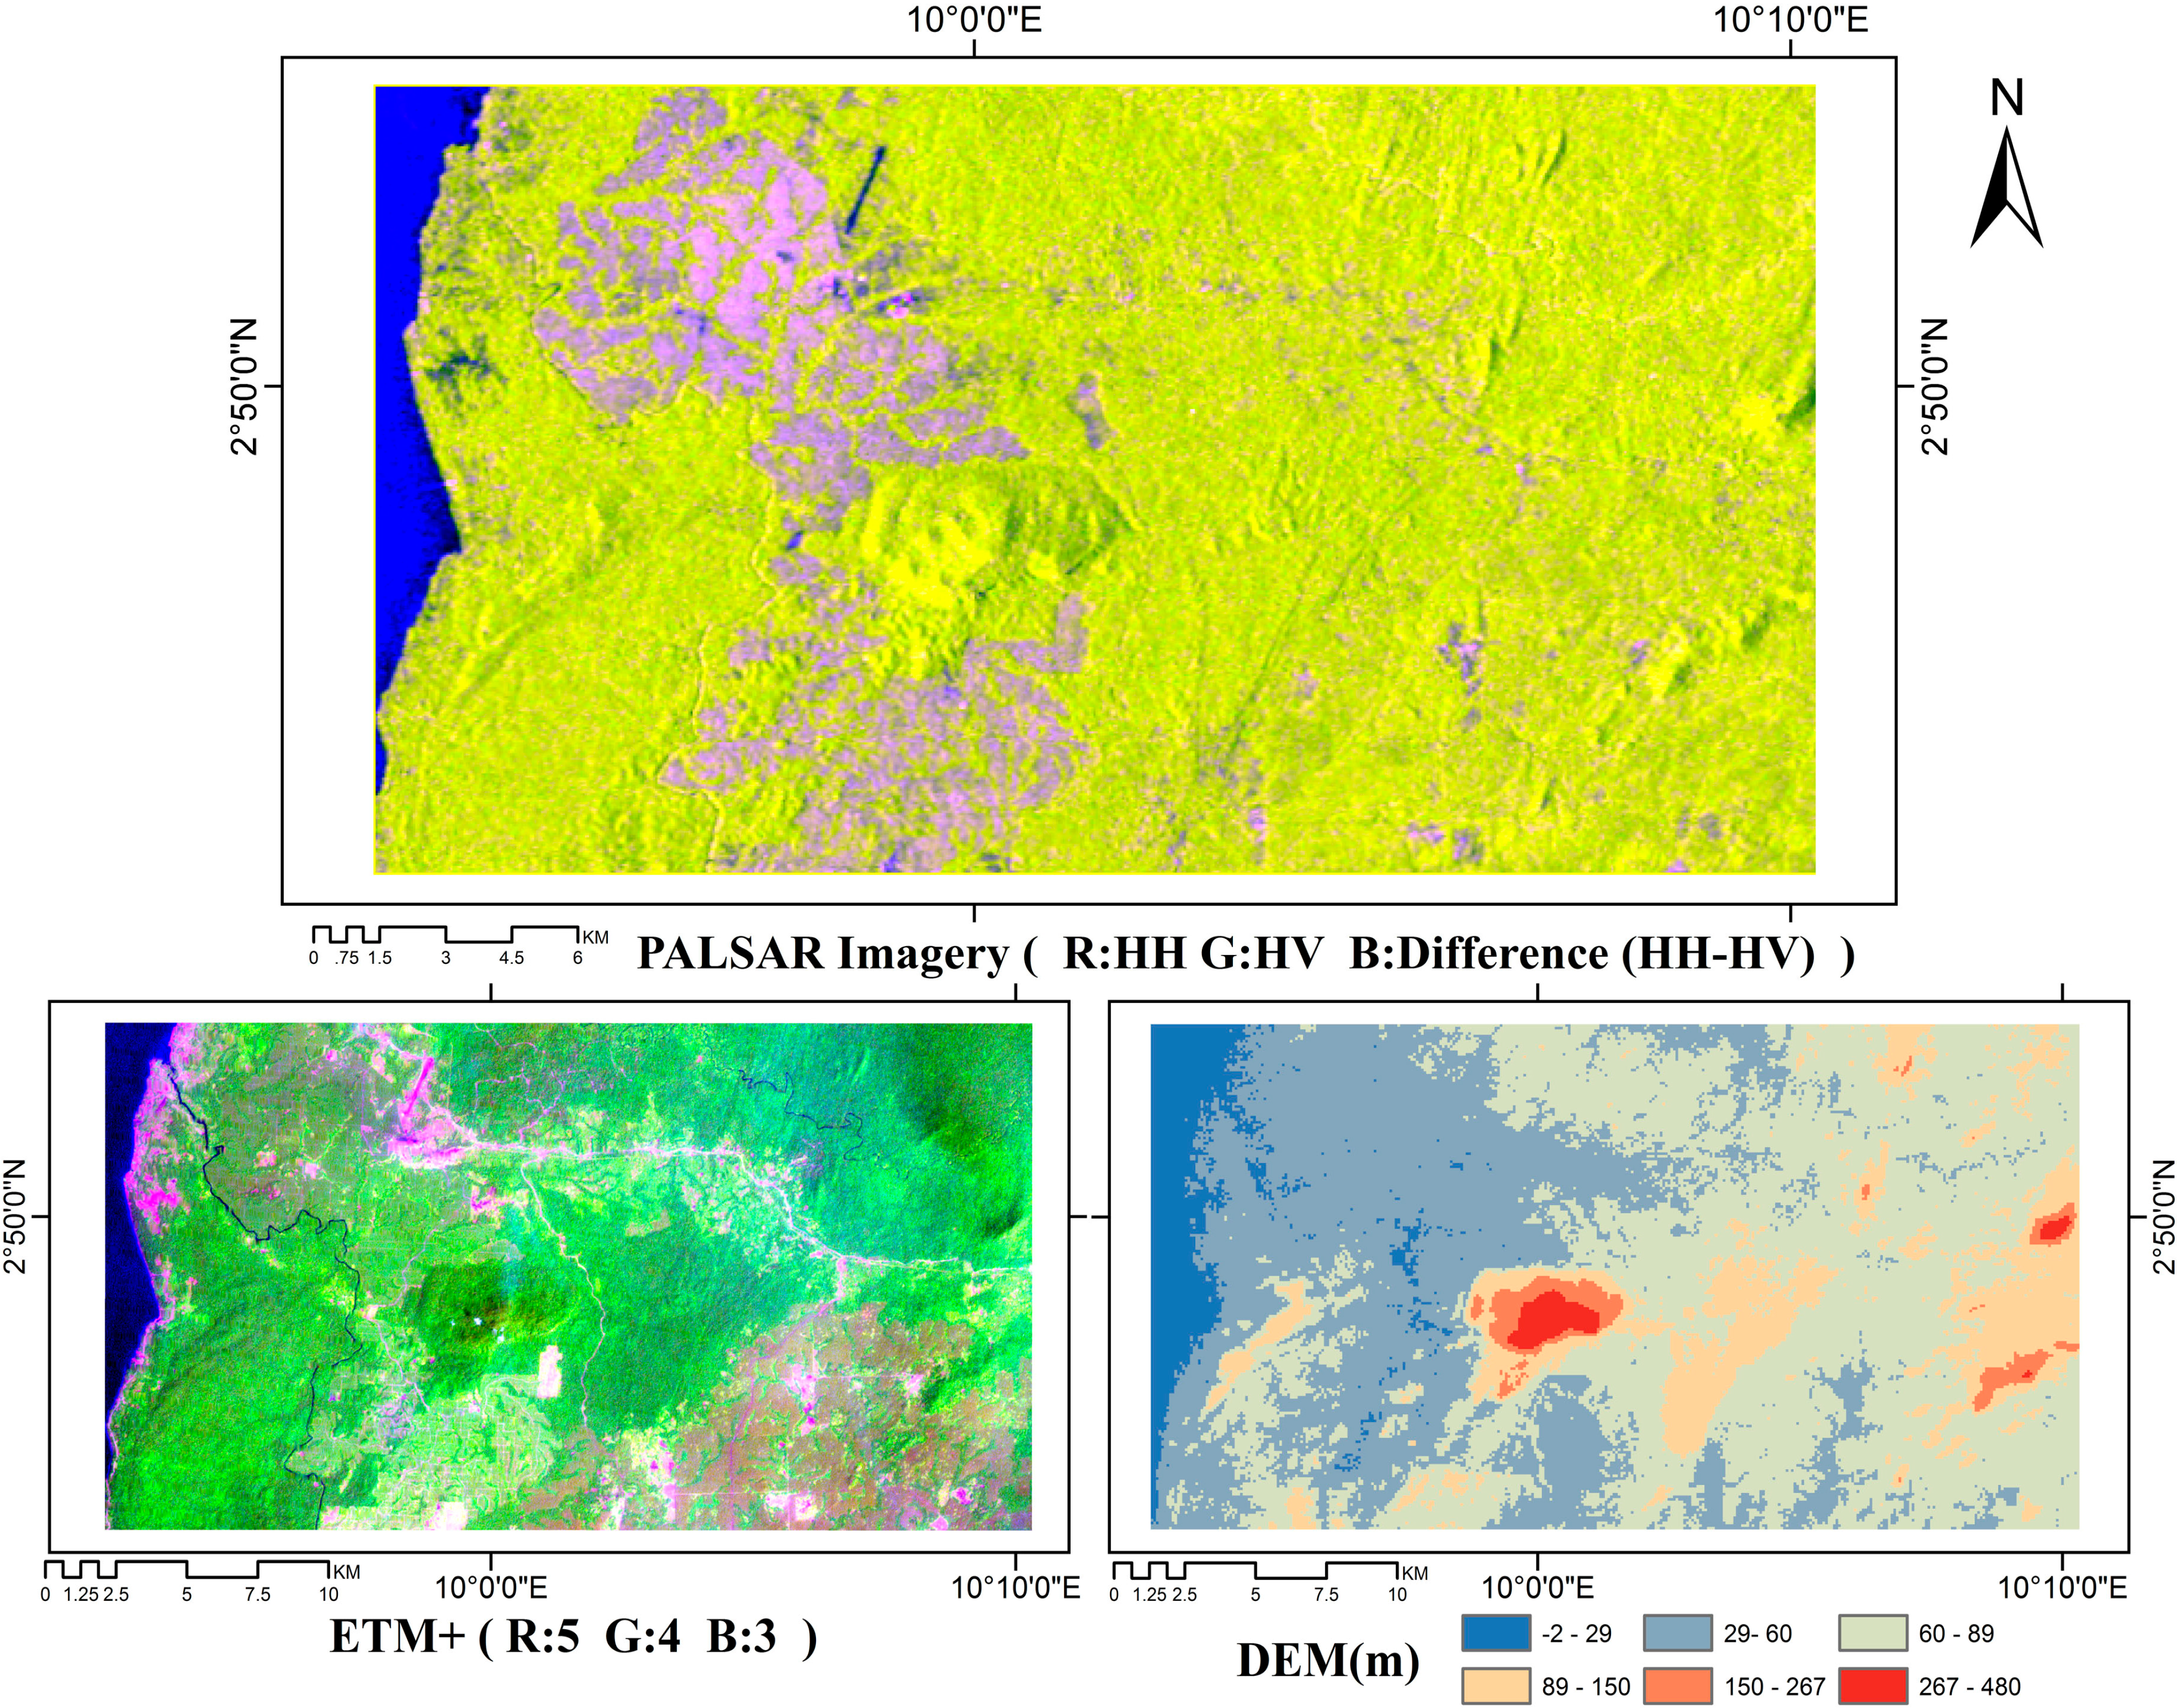
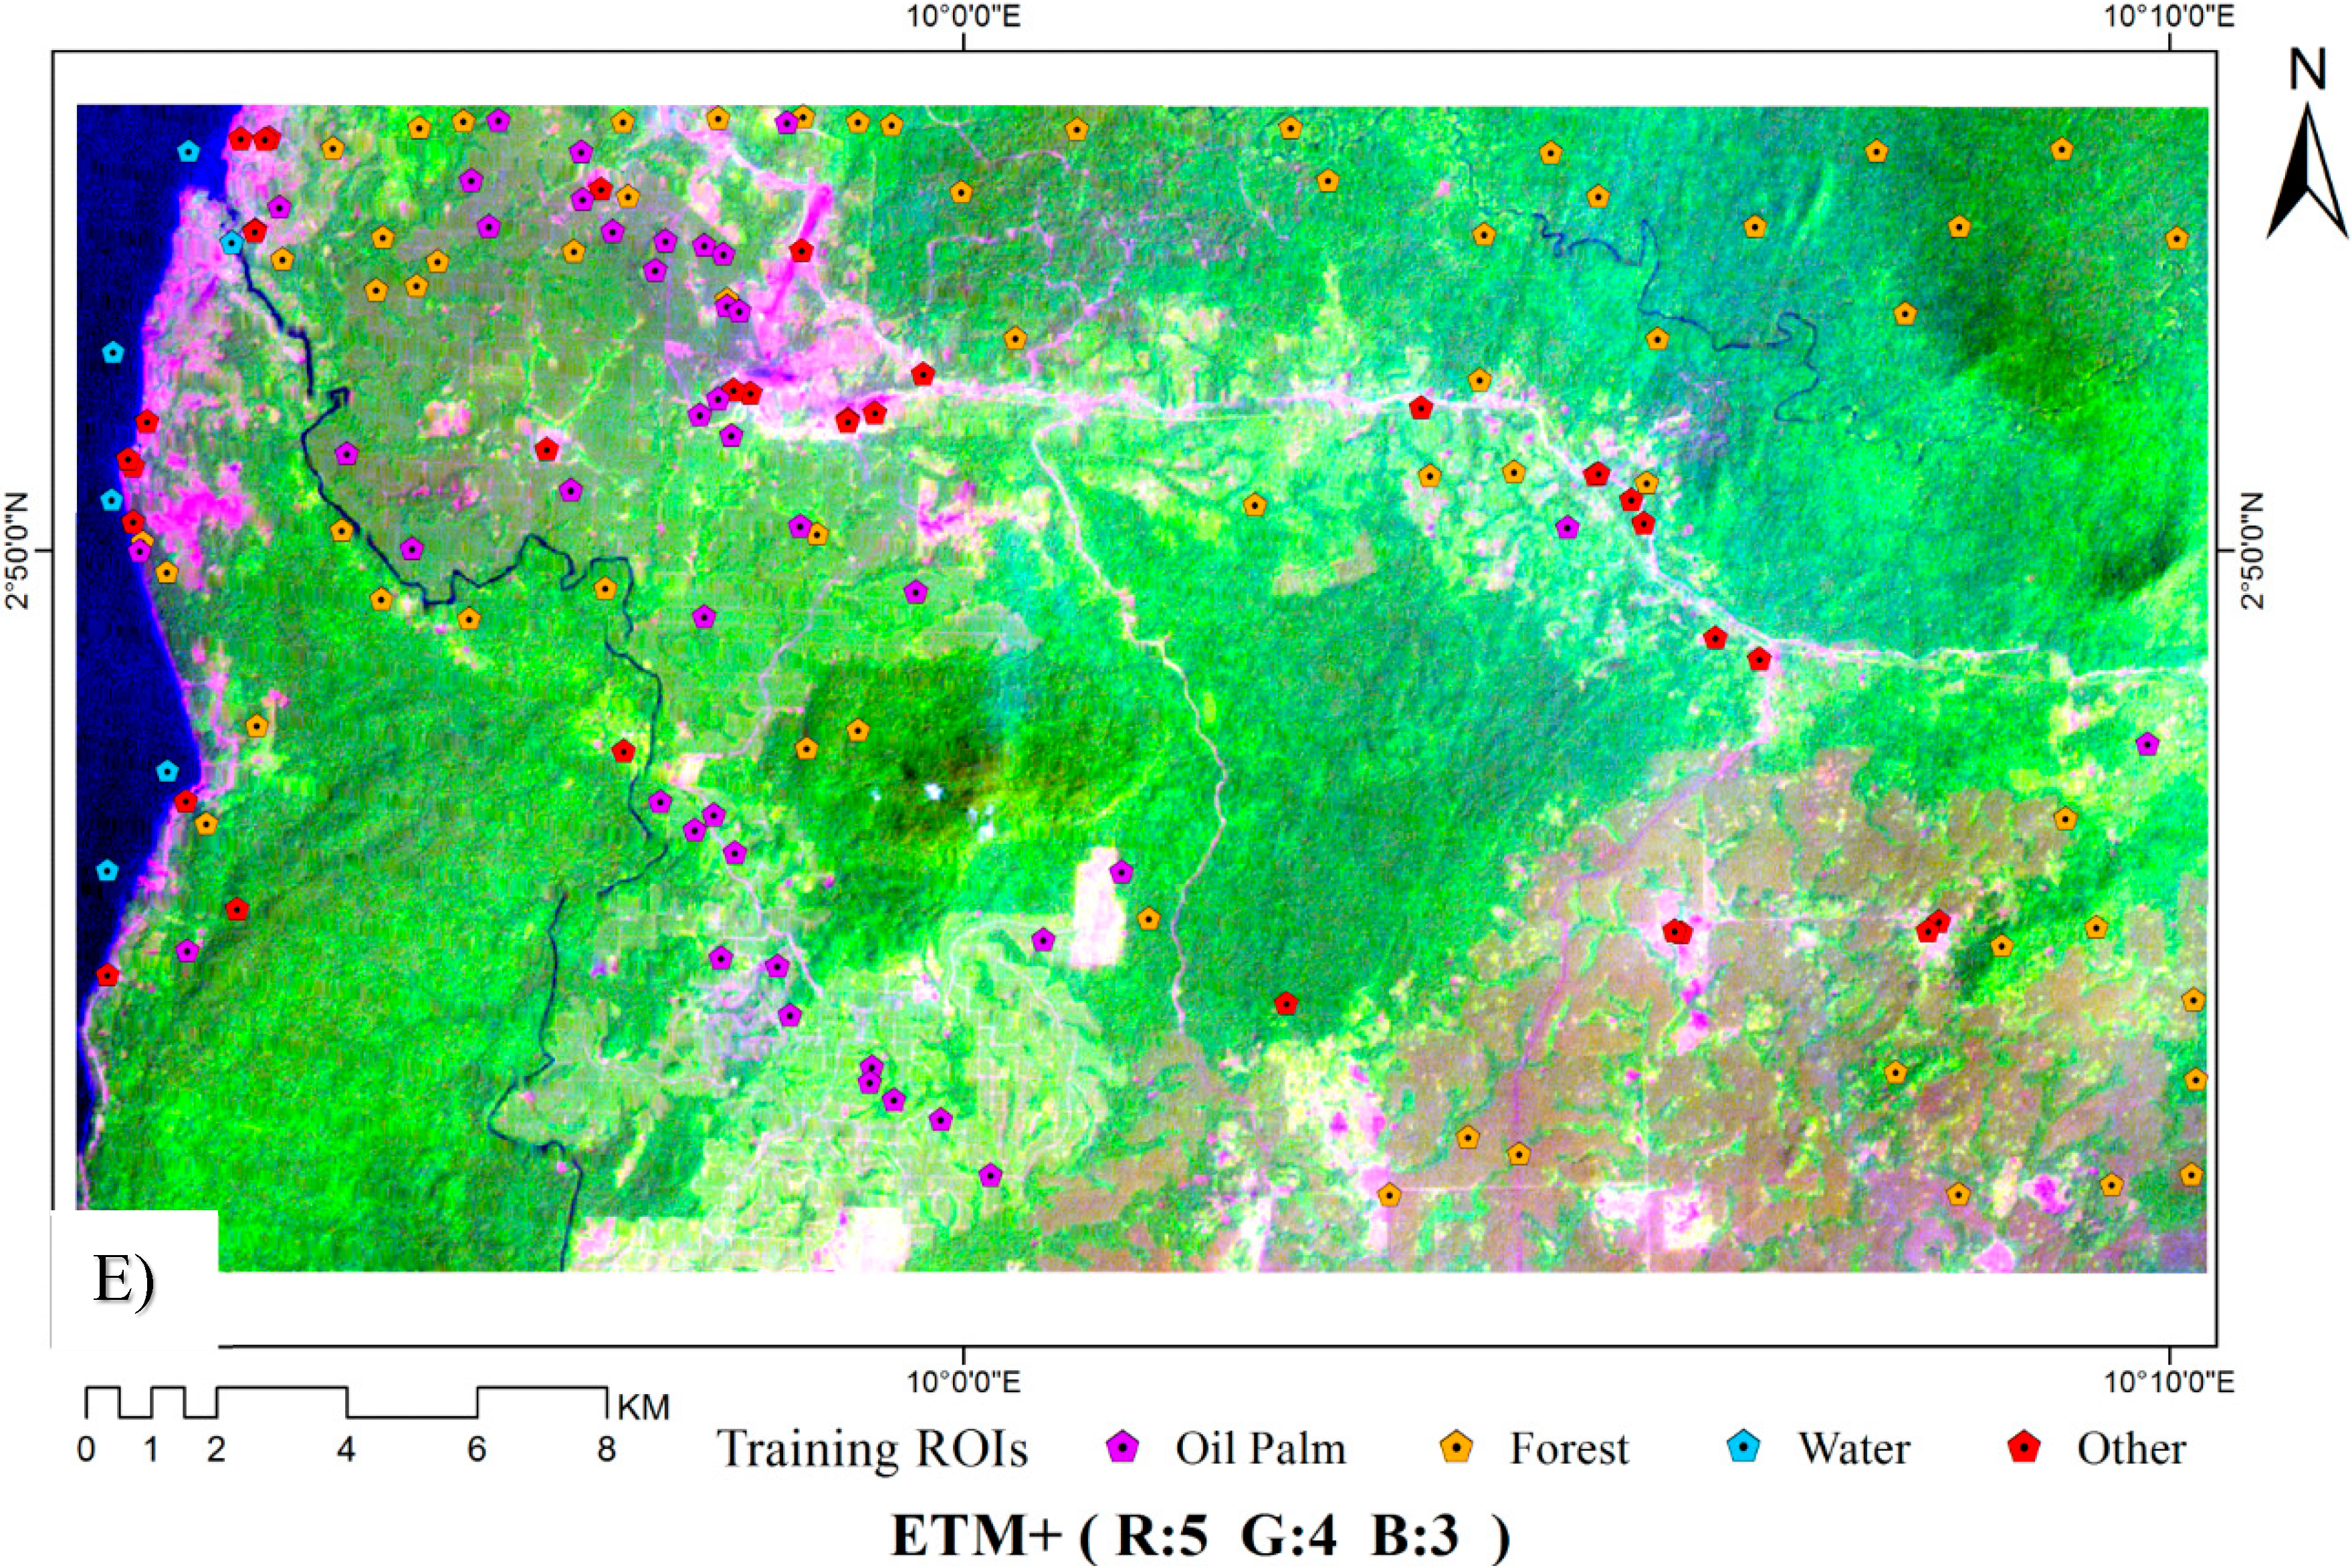
2.1. Study Area

The study area is located in the Sud Province of the Republic of Cameroon from 2°44′N to 2°53′N and 9°52′E to 10°11′E (Figure 1). Annual precipitation ranges from 1500mm to 2000mm in the interior and from 2000 mm to 3000 mm in the coastal zone. Annual temperature is about 25 °C. The humid, equatorial climate is suitable for oil palm plantations, and oil palm has become one of the major cash crops in the region. The elevation of Sud in Cameroon increases gradually from sea level at the west coast to 300–600 m above sea level in the Kribi-Douala basin at the east of Sud. Our study area is relatively flat.
Figure 1. The location of the study area in Cameroon.
Remotesensing 07 01206 g001

2.2. PALSAR 50-m Orthorectified Mosaic Image Data and Preprocessing

ALOS-PALSAR launched by the Japan Aerospace Exploration Agency (JAXA) is the first civilian spaceborne fully polarimetric synthetic aperture radar (SAR) to use L-band horizontally (H) and vertically (V) polarized electromagnetic waves for transmission and reception. We selected ALOS-PALSAR 50-m orthorectified mosaic images with fine beam dual (FBD) polarization (HH and HV) data to map oil palm plantations. The data were acquired in the ascending path from 13 June 2009 to 17 November 2009. This time period can be considered as the dry season in the South Province of Cameroon. The off-nadir angle is 34.3°. The pixel spacing of the PALSAR images was 50 m. The PALSAR data were downloaded from the ALOS Kyoto and Carbon Initiative official website [32] at no cost.
The PALSAR images were pre-processed in the following steps: cross-track illumination correction, geometrical correction, and geo-referencing to geographical latitude and longitude coordinates. Geometrical rectification was implemented using a 90-m digital elevation model (DEM) in the form of the Shuttle Radar Topography Mission (SRTM) DEM [33]. Tominimize location error, bi-linear interpolation was used to resample 90-m SRTM DEM pixels to 50-m and then one can align raster grids of resampled data with PALSAR 50-m mosaic data. Pre-processing methods including calibration and validation were documented in previous publications by Shimada et al [34,35] and Touzi et al. [36]. The HH and HV normalized radar backscattering coefficients ( σ 0 in decibels (dB)) were converted from digital number (DN) values with the following equation [37]:
σ 0 ( dB ) = 10 × log 10 D N 2 + C F
where CF represents the absolute calibration factor of −83 dB for both HH and HV. Two other composited images seemed to be valuable for land cover classification [30,38] and were converted in this way: the ratio image of HH and HV (Ratio = HH/HV) and the difference image between HH and HV (Difference = HH − HV). The false color image composed of HH, HV, and the difference image is shown in Figure 2.
Figure 2. A sample of false color composites of PALSAR imagery in the study area in Cameroon. Two small maps show the false color map of ETM and topography from 30 m digital elevation data.
Remotesensing 07 01206 g002

2.3. Regions of Interest (ROIs) for Algorithm Training and Product Validation

As we focused on oil palm plantation mapping in this study, we used a simple classification scheme. The samples were divided into four main land cover types: water, oil palm, forest, and other land cover type such as buildings and crops. We digitized ROIs from high spatial resolution imagery in Google Earth, data that was obtained from 2009–2010 for algorithm training and validation of land classification [23,39,40,41,42]. The ROI polygons were created in the middle of individual land cover patches and distributed in the study area as widely as possible. All these ROIs geo-linked with Google Earth were saved in KML format. The Jeffries-Matusita (J-M) distance between two ROIs [21] was computed to determine the separability scores of the ROIs. The J-M distance of all the ROI pairs in our study was greater than 1.9, which is commonly used as a threshold value to judge whether the separability between two classes is sufficient [43].
The resultant ROIs in KML format were converted to shape files with ArcGIS. Considering the image data, phenology, and ROIs size, we used a total of 662 polygon ROIs (about 12,405 pixels, 4.9% of total pixels), including 181 oil palm ROIs (2895 pixels), 349 forest ROIs (7342 pixels), 8 water ROIs (1249 pixels), and 124 other ROIs (919 pixels). Training ROIs and validation ROIs were obtained by randomly dividing these ROIs. To assess the classification performance of various sample sizes, differently sized samples were randomly selected from this ROI pool. To examine the performance with a confusion matrix, 92 oil palm ROIs (1298 pixels), 227 natural forest ROIs (4889 pixels), 5 water ROIs (785 pixels), and 76 ROIs (562 pixels) for other land cover types were included.

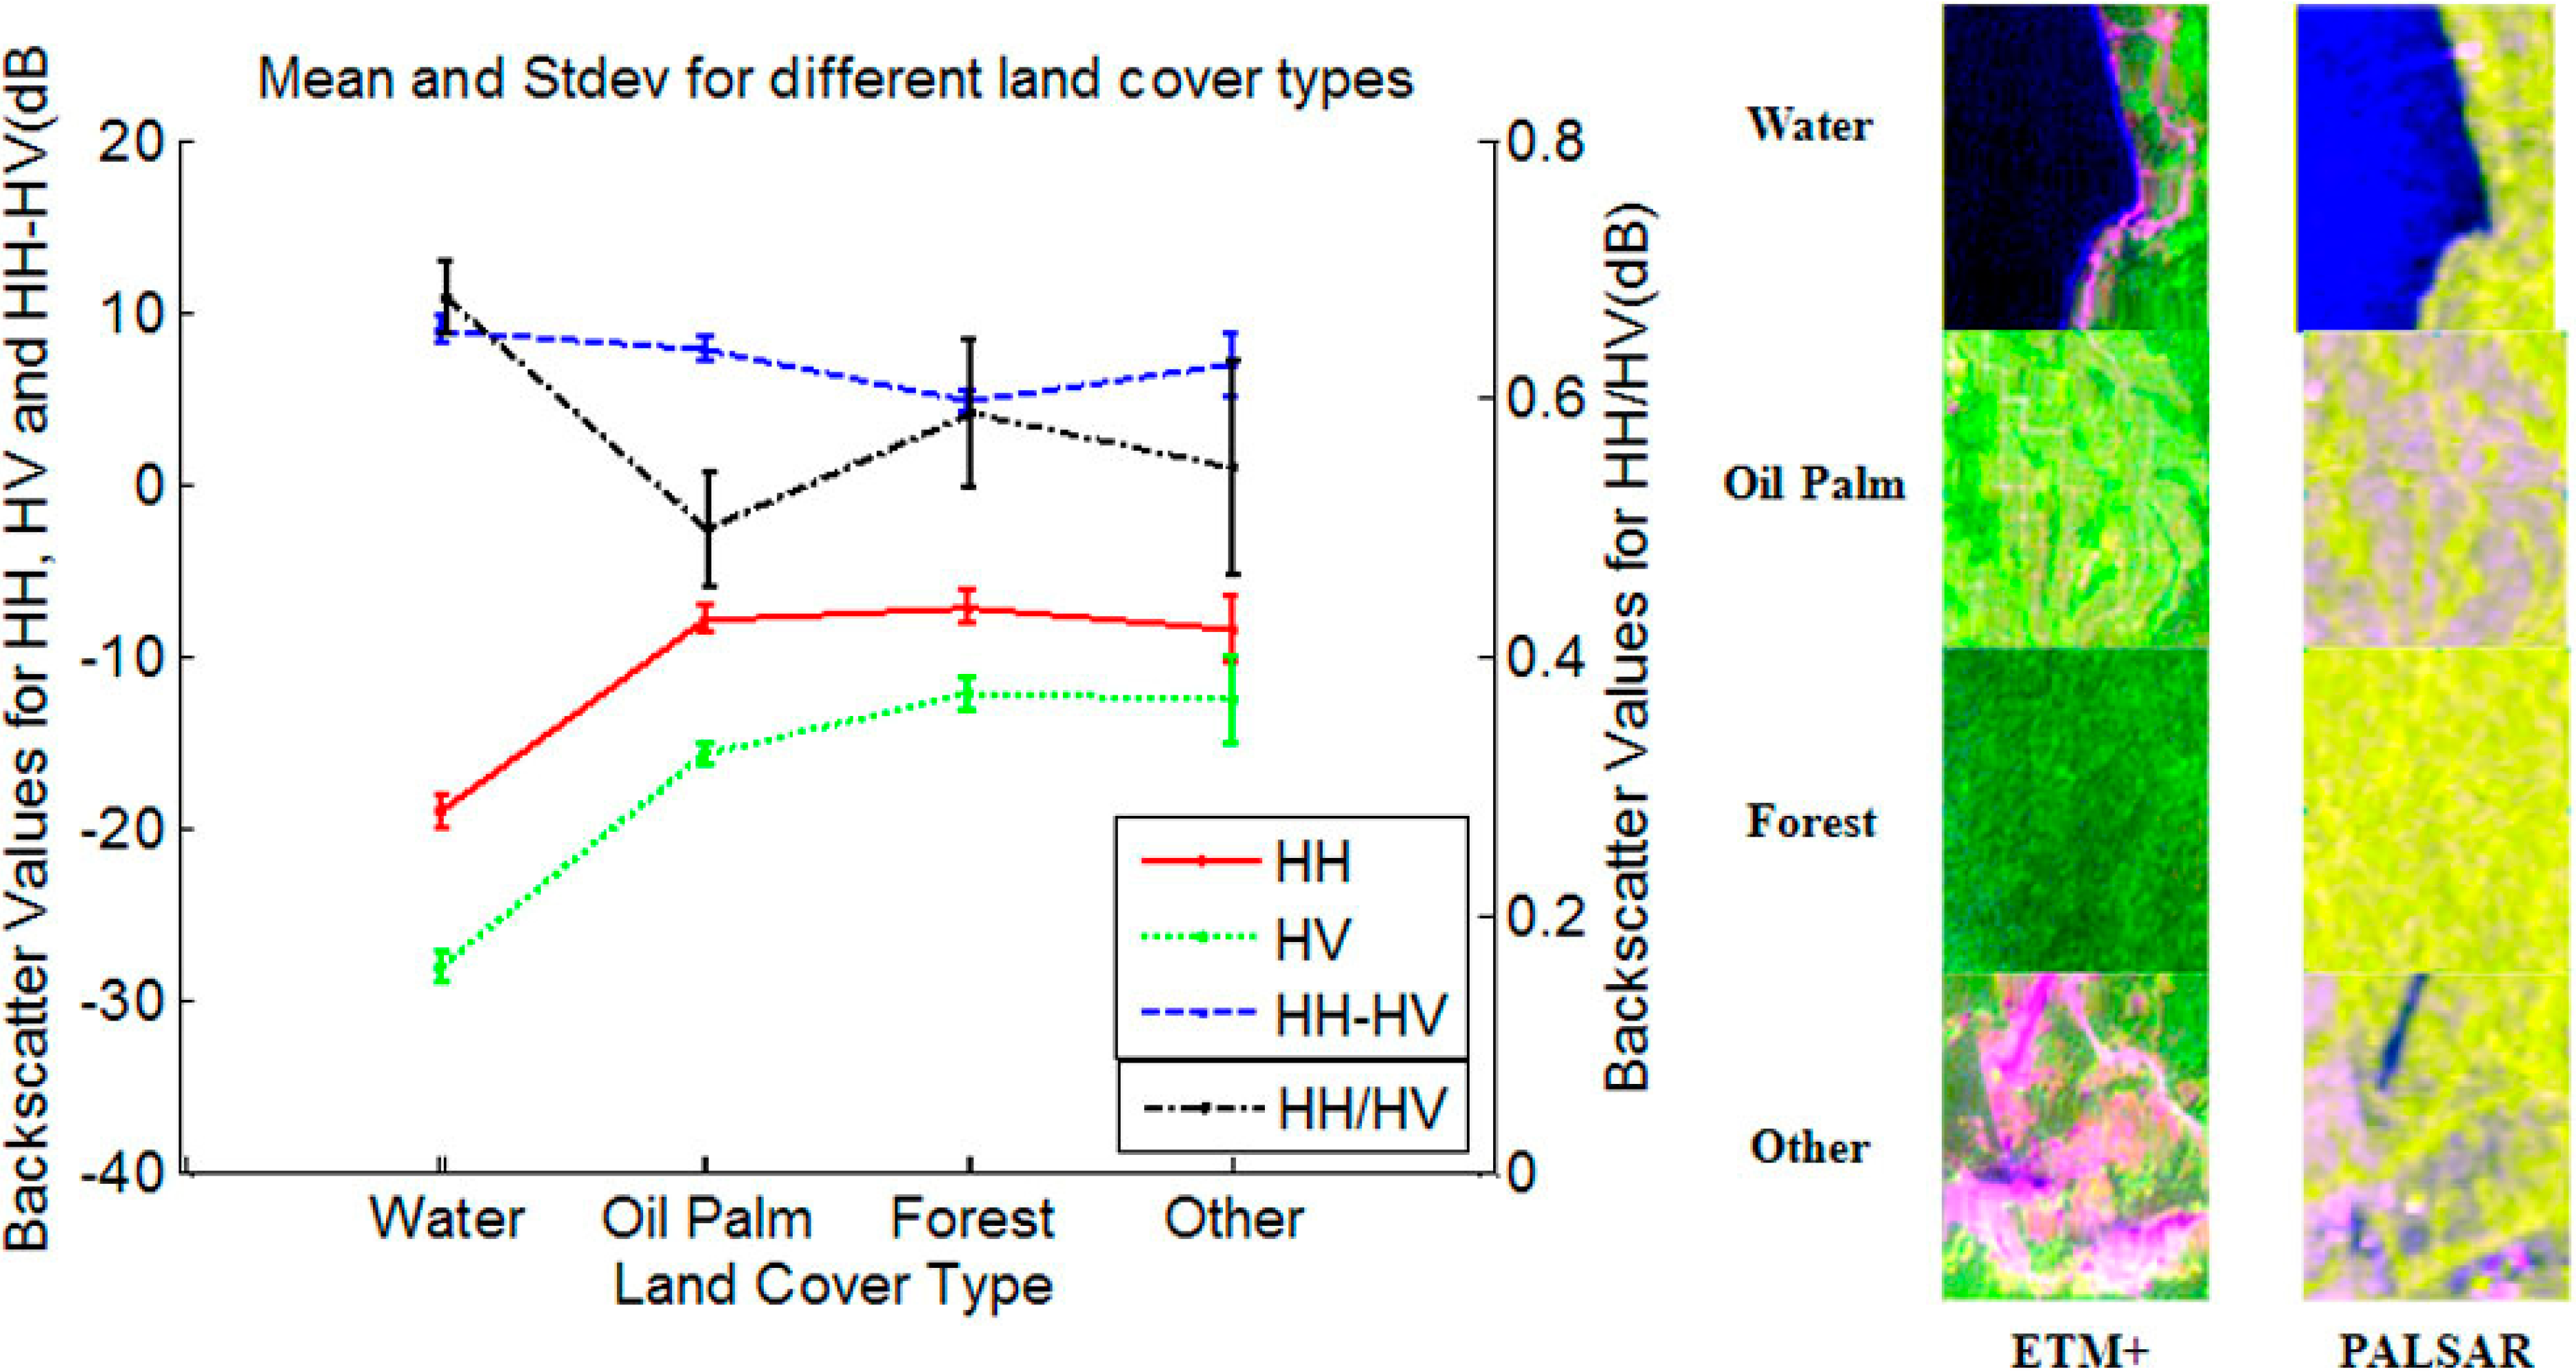
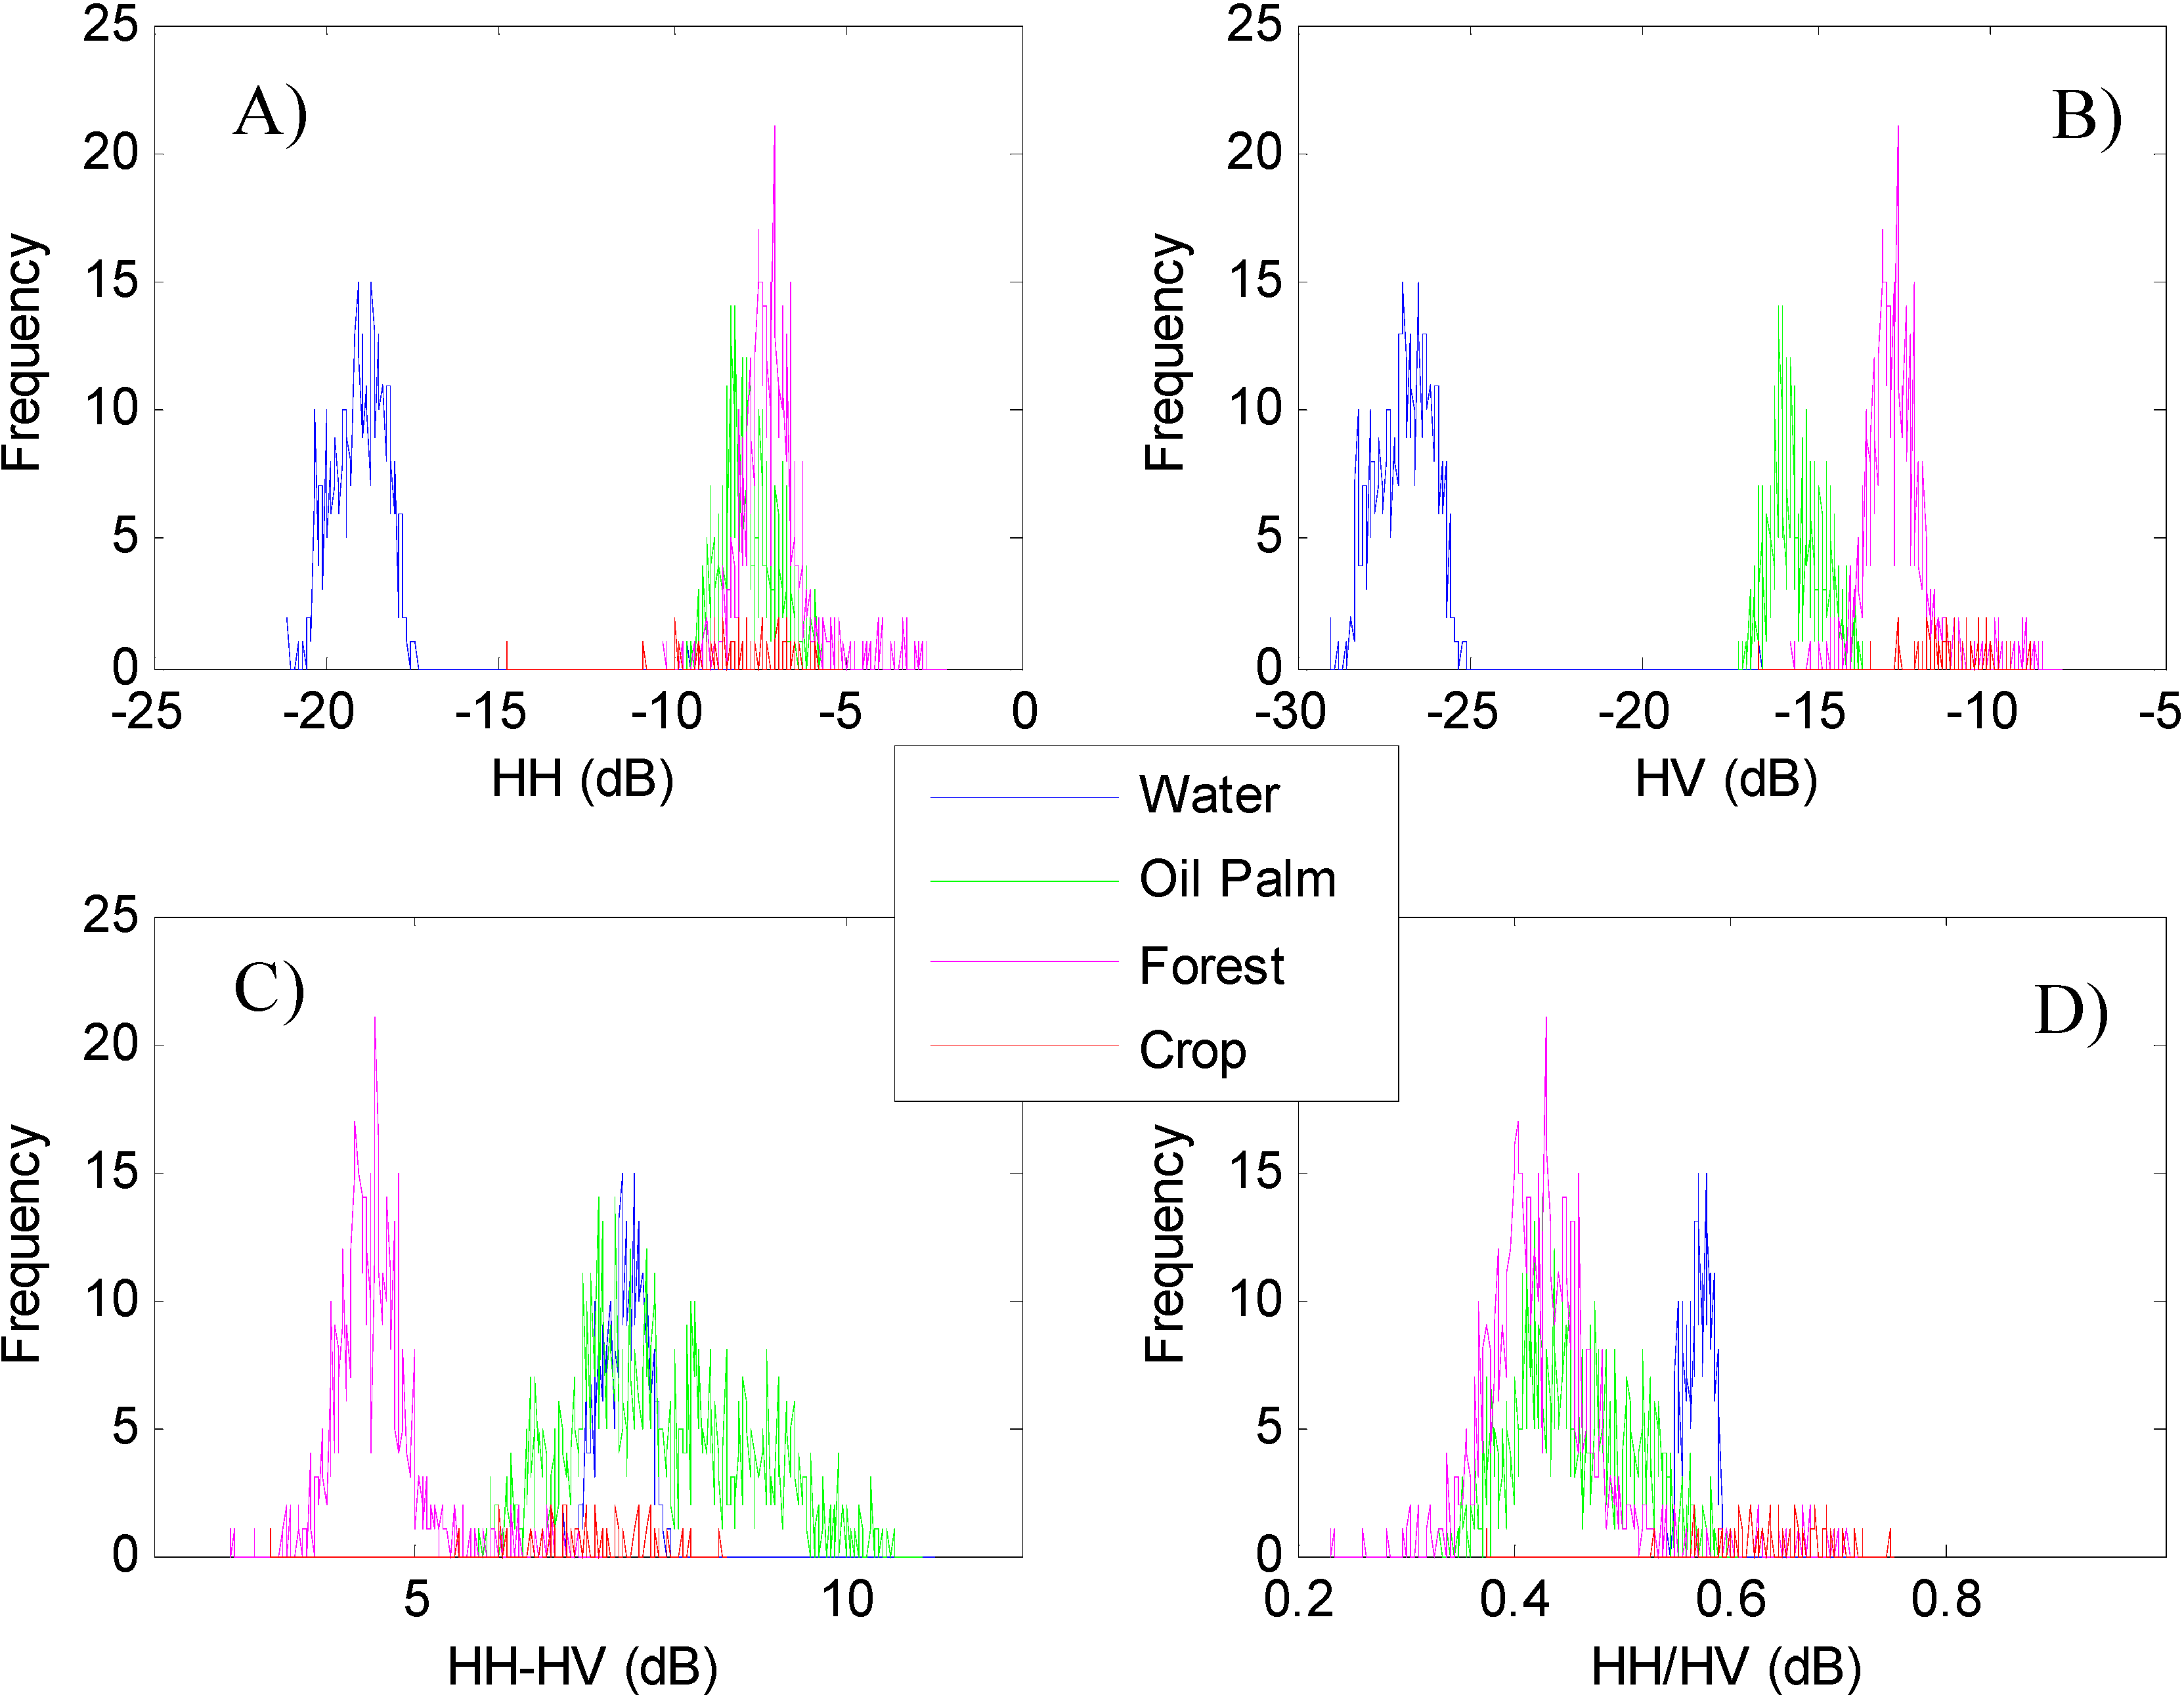
2.4. Signature Analyses of Backscatter Data of Oil Palm and other Land Cover Types

To obtain the desired classification result, it is necessary to understand the backscatter signatures of various land cover types. Many factors such as polarization, frequency, surface roughness, geometric shape (e.g., inclination of land surface) and dielectric properties of the target will affect microwave backscatter values. L-band PALSAR penetrates far more than C or X-band [44], and is more sensitive to the structure and the size of trunks, branches and leaves. Oil palm has no branches but it has a trunk and leaves, so oil palm is readily recognized in PALSAR images. To compare the difference between oil palm plantation and other land cover types, we calculated the mean and standard deviation of ROIs using the HH, HV, ratio and difference images (Figure 3). Water has the lowest values in HH and HV because of absorption and mirror reflection, but the highest values in the difference and the ratio values, compared to the other three land cover types. Thus, water can be easily identified. Oil palm has HH and HV values between water and forest although closer to forest, but higher difference values and lower ratio values than those of forest. Note that the difference in the ratio values among different land cover types is of too small an order of magnitude to recognize. Therefore, even though the HH/HV ratio values of oil palm are the lowest, it is not easy to pick up oil palm based on the HH/HV ratio values. To further understand these characteristics, especially of oil palm, the histograms of the HH image, HV image, the ratio image and the difference image for different land-cover types are shown in Figure 4, which verifies that water has the lowest backscatter values. Though oil palm and natural forest have partially overlapped HH data, oil palm has lower HV backscatter data than natural forest, which is mainly caused by their differences in branch, trunk, and canopy. At the same time, natural forest has very low difference values (HH-HV image) and is separable from oil palm plantations at the value of 6.5 or so, which is consistent with the results of previous work [28]. Therefore, taking both the HV values and HH-HV difference values into account, oil palm plantations can be separated from natural forests and other type.
Figure 3. A comparison between statistical value of different land cover types. The backscatter statistical character of buildup land cover type is given to stand for “other” land cover type.
Remotesensing 07 01206 g003
Figure 4. A comparison between histograms of different land cover types in four images. (A) HH polarization; (B) HV polarization; (C) Difference image(HH-HV); and (D)Ratio image(HH/HV); (E) The Regions of Interest (ROIs) used for training. The backscatter histogram of crop land cover type is given to stand for “other” land cover type.
Remotesensing 07 01206 g004aRemotesensing 07 01206 g004b

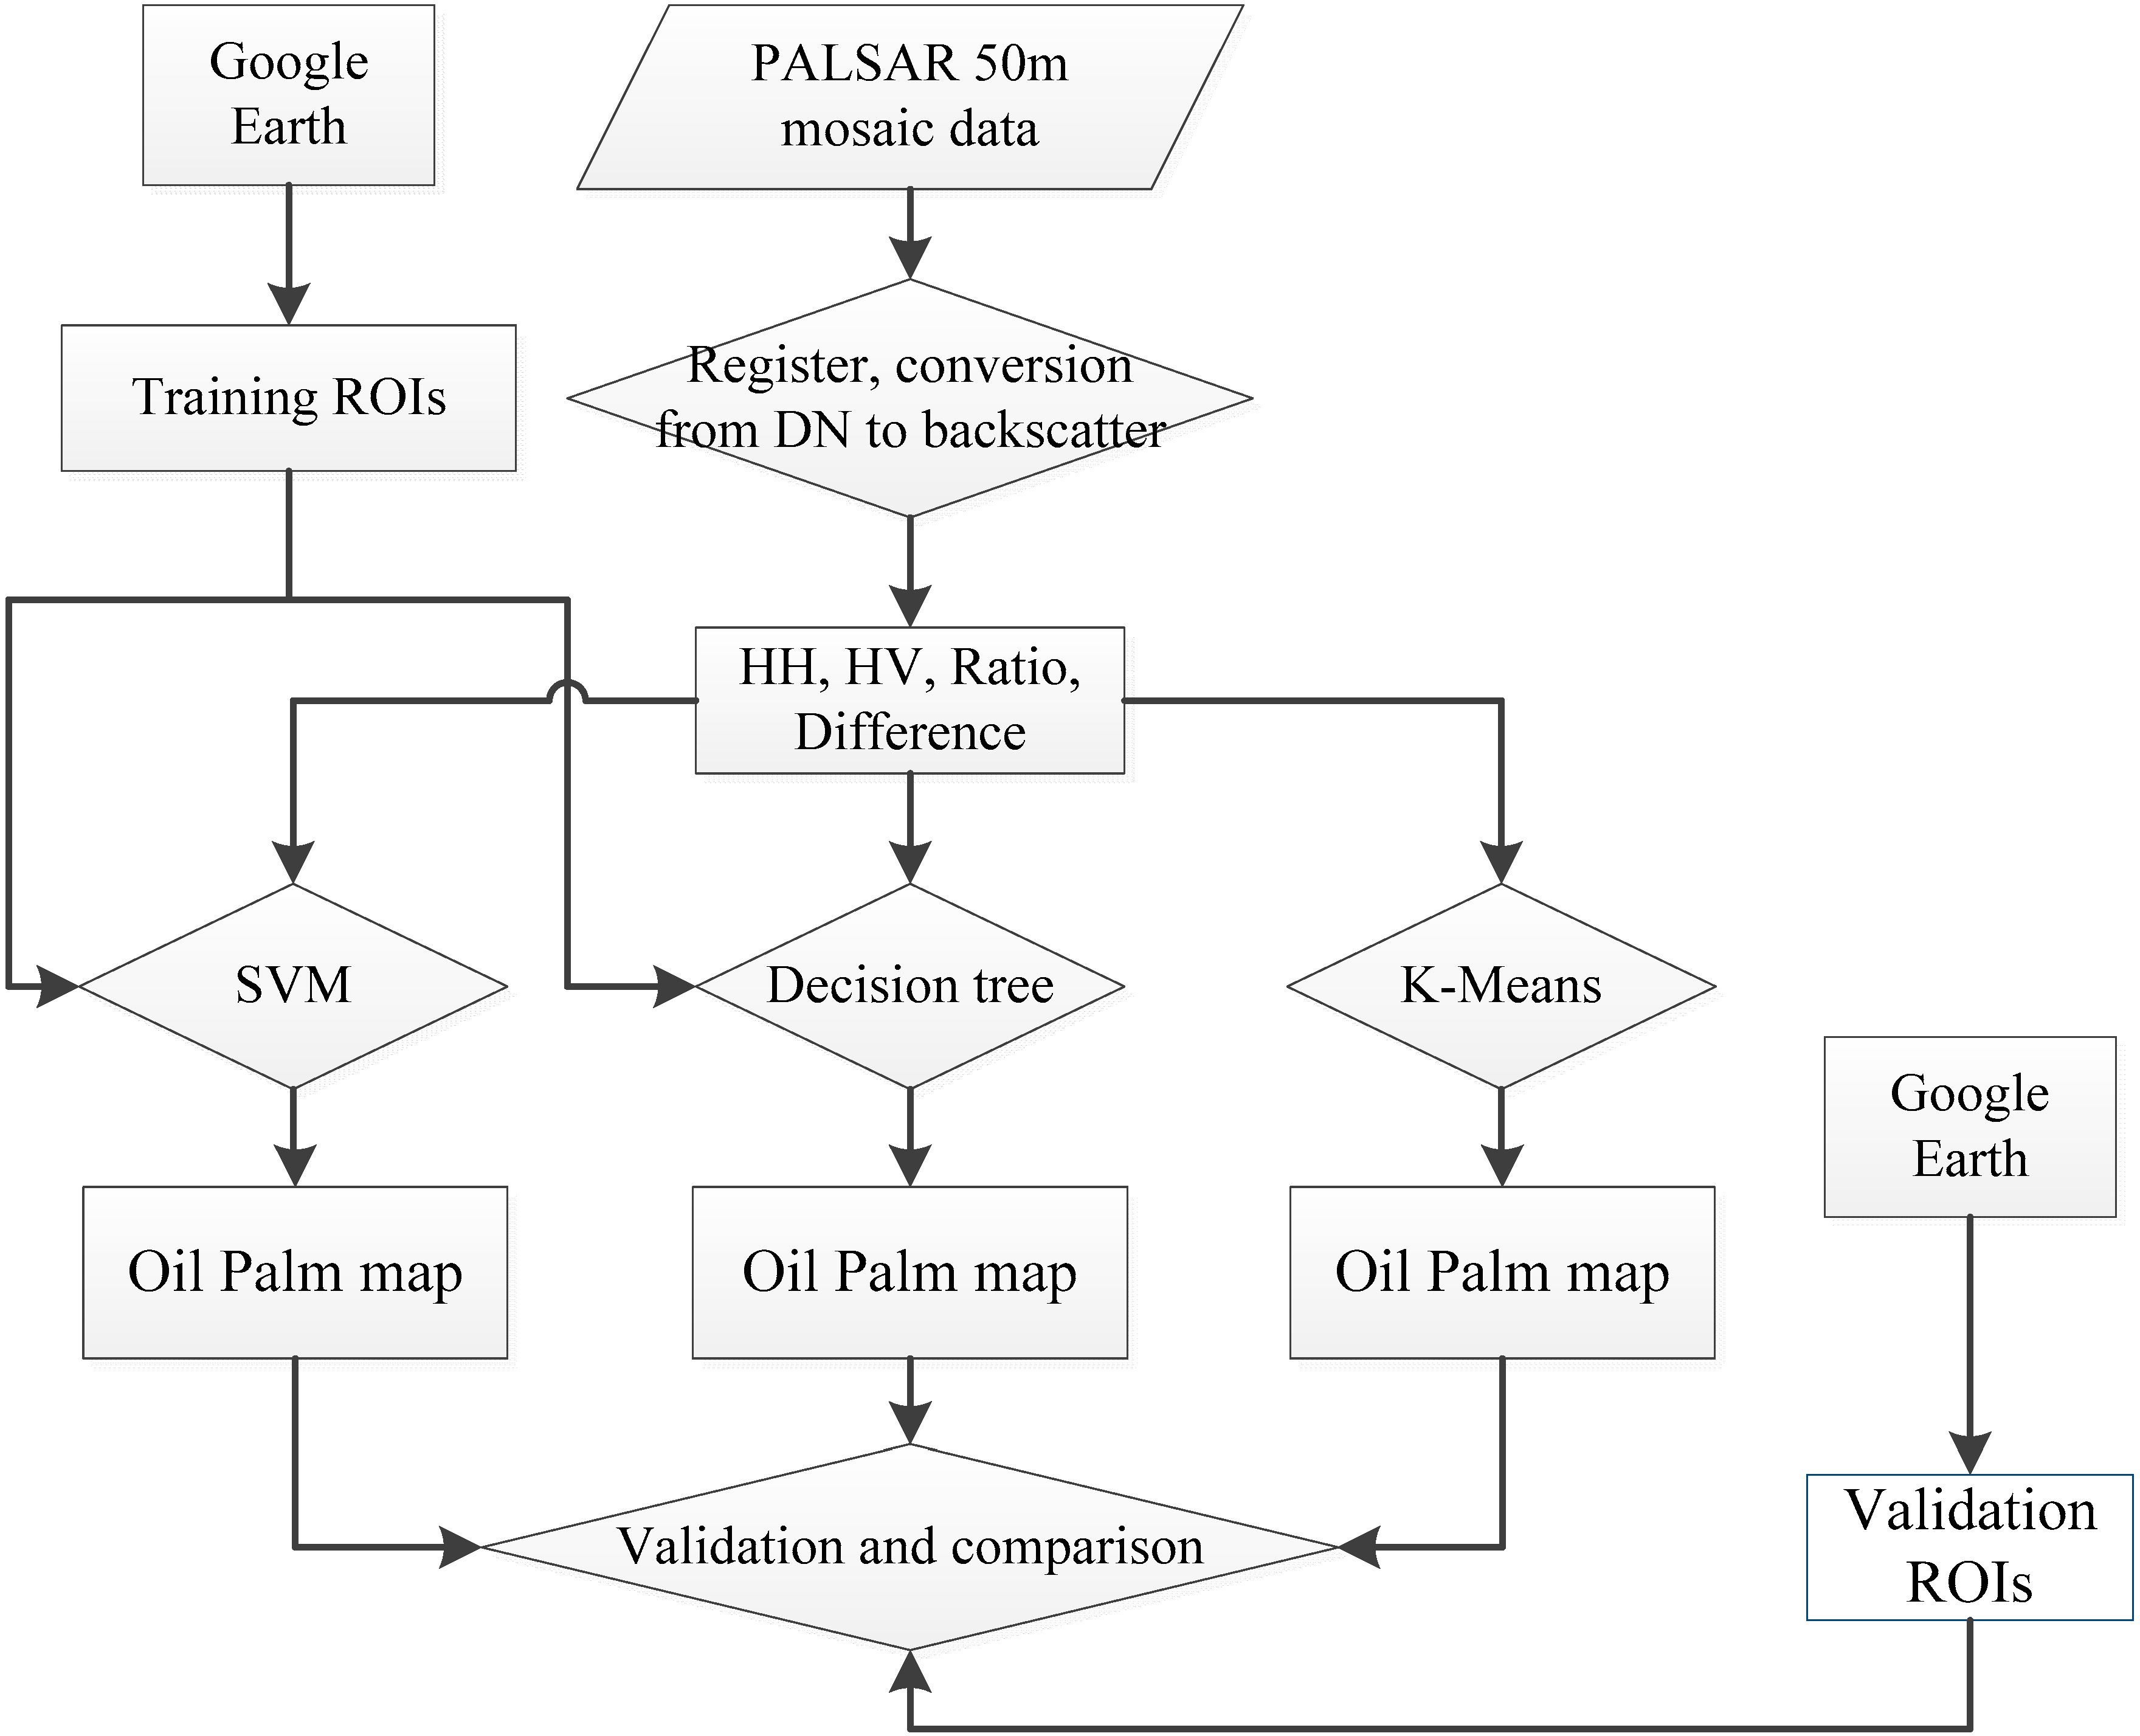
2.5. Mapping Algorithms for Oil Palm Plantations with PALSAR

The workflow for oil palm mapping is shown in Figure 5. Multiple classification approaches were carried out and their accuracies were assessed. We evaluated an unsupervised method (K-Means classification), a decision tree method (QUEST), and a machine learning method (SVM). SVM and K-Means algorithms were implemented with ENVI 5.0 software. The QUEST algorithm was implemented with RuleGenTool embedded into ENVI 5.0. The results for these three classification methods were compared, and performance with different parameters for these methods was also tested.
As an unsupervised classification method, K-Means classification needs no training samples. In our study, four land cover classes (oil palm, forest, water bodies and other land cover types) were used. We ran the K-Means method with an initial value of k = 20 (class 1, 2, …, 20), and the resultant 20 classes were interpreted and combined into the four land cover classes. K-Means classification guarantees that each intensity value is sorted into the nearest class with a minimum distance. ENVI software chose the initial clusters randomly and then adjusted the class members by iterative processing. To optimize the setting parameters, a range of values were set for the two parameters: Change Threshold (0.1~10) and Maximum Iterations (1 through 10, 50, 100 and 200). K-Means classification was repeated until the threshold was met for every class. The best combination with the highest classification accuracy was used for the classification results.
Figure 5. The workflow for mapping oil palm based on PALSAR 50-m orthorectified mosaic imagery.
Remotesensing 07 01206 g005
The decision tree classification is widely used in remote sensing application. QUEST is a nonparametric decision tree procedure that makes decisions by creating splits automatically without additional user’s intervention. According to the above microwave signatures analysis, the rules for QUEST are explicit. The QUEST classification was implemented using the RuleGenTool that can be embedded in ENVI [45]. Four classes, oil palm, forest, water, and other (including vegetation as well as non-vegetated surfaces and built-up), were labeled with a categorical value from 1 to 4. To test the impact of training sample size, different sizes (20, 50, 100, 200, 300, 400, 500 pixels for each type) of samples were used for creating the QUEST models. The same randomly selected training samples were used for both QUEST and SVM classification methods.
To take advantage of a linear classifier which can separate classes with maximum margin, the SVM linearizes complex decision boundaries by mapping the input of low dimensional space to high dimensional space with a kernel function. To get good classification results, we must select kernel functions carefully. Kernel functions that fit the optimal separating hyper plane in the high dimensional space used in ENVI include four types: linear, polynomial, sigmoid, and radial basis function (RBF). Many studies [46,47,48,49,50] have compared the kernel function and parameters setting, and RBF is considered to work well in most cases. We also tried two more kernel functions: linear and polynomial, in additional to RBF. Considering the importance of optimizing the kernel parameters [48], a range of values were used for each kernel function. For the polynomial and RBF kernel, the kernel radius ( γ ), which should be a value greater than 0, ranged from 0.1 to 10 in our study, while the regularization parameter (C) varied from 1 to 100. Other parameters such as the number of pyramid levels to use and the classification probability threshold value were set according to the suggestions in the ENVI User’s Manual [51]. The various combinations of these parameter values were tested for classification accuracy and Kappa coefficient. The kernel function and the parameters with the highest accuracies were used for comparison purposes. In addition, to investigate the effect of sample volume, training datasets with different training sample sizes, ranging from 20 to 500 pixels, for each land cover type were examined, as were done in the QUEST method.

2.6. Accuracy Assessment and Error and Uncertainty Analysis

To validate the oil palm plantation maps generated by the K-Means, QUEST and SVM algorithms, we randomly selected 400 ROIs (7534 pixels, 3.0% of total pixels) as samples in representative sites from the whole study area, as shown in Section 2.3. The accuracy statistics, including overall accuracy and Kappa coefficient, were calculated for these three classification results. A confusion matrix was computed to evaluate the resultant maps of oil palm plantations. In addition, the significance of differences among these classification algorithms was estimated using the McNemar’s significance testing. The McNemar’s test based on a chi-square statistics was done using the following definition [52,53]:
Z = c 12 c 21 c 12 + c 21
where c 12 refers to the pixels that are correctly classified by method 1 but falsely classified by method 2, while c 21 refers to the pixels that are correctly classified by method 2 but falsely classified by method 1. If Z 1.96 for a 95% confidence level, it means that method i provides a statistically significant improvement in classification results at the 5% level [54].

3. Results

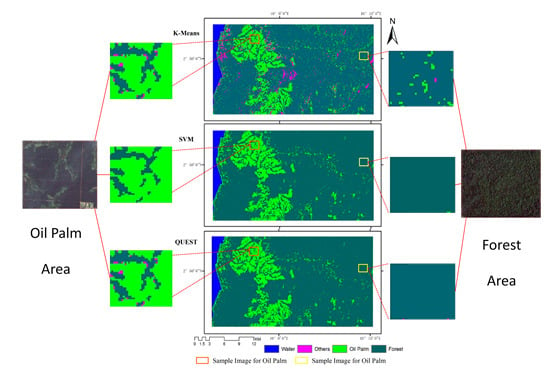
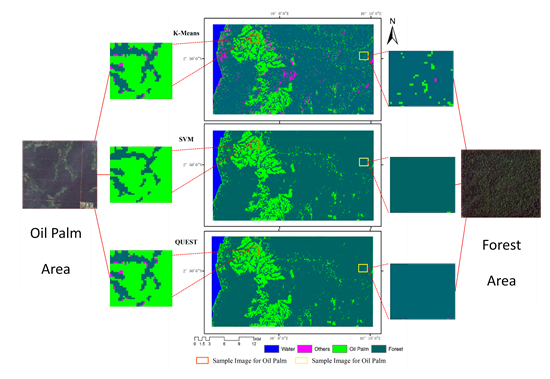
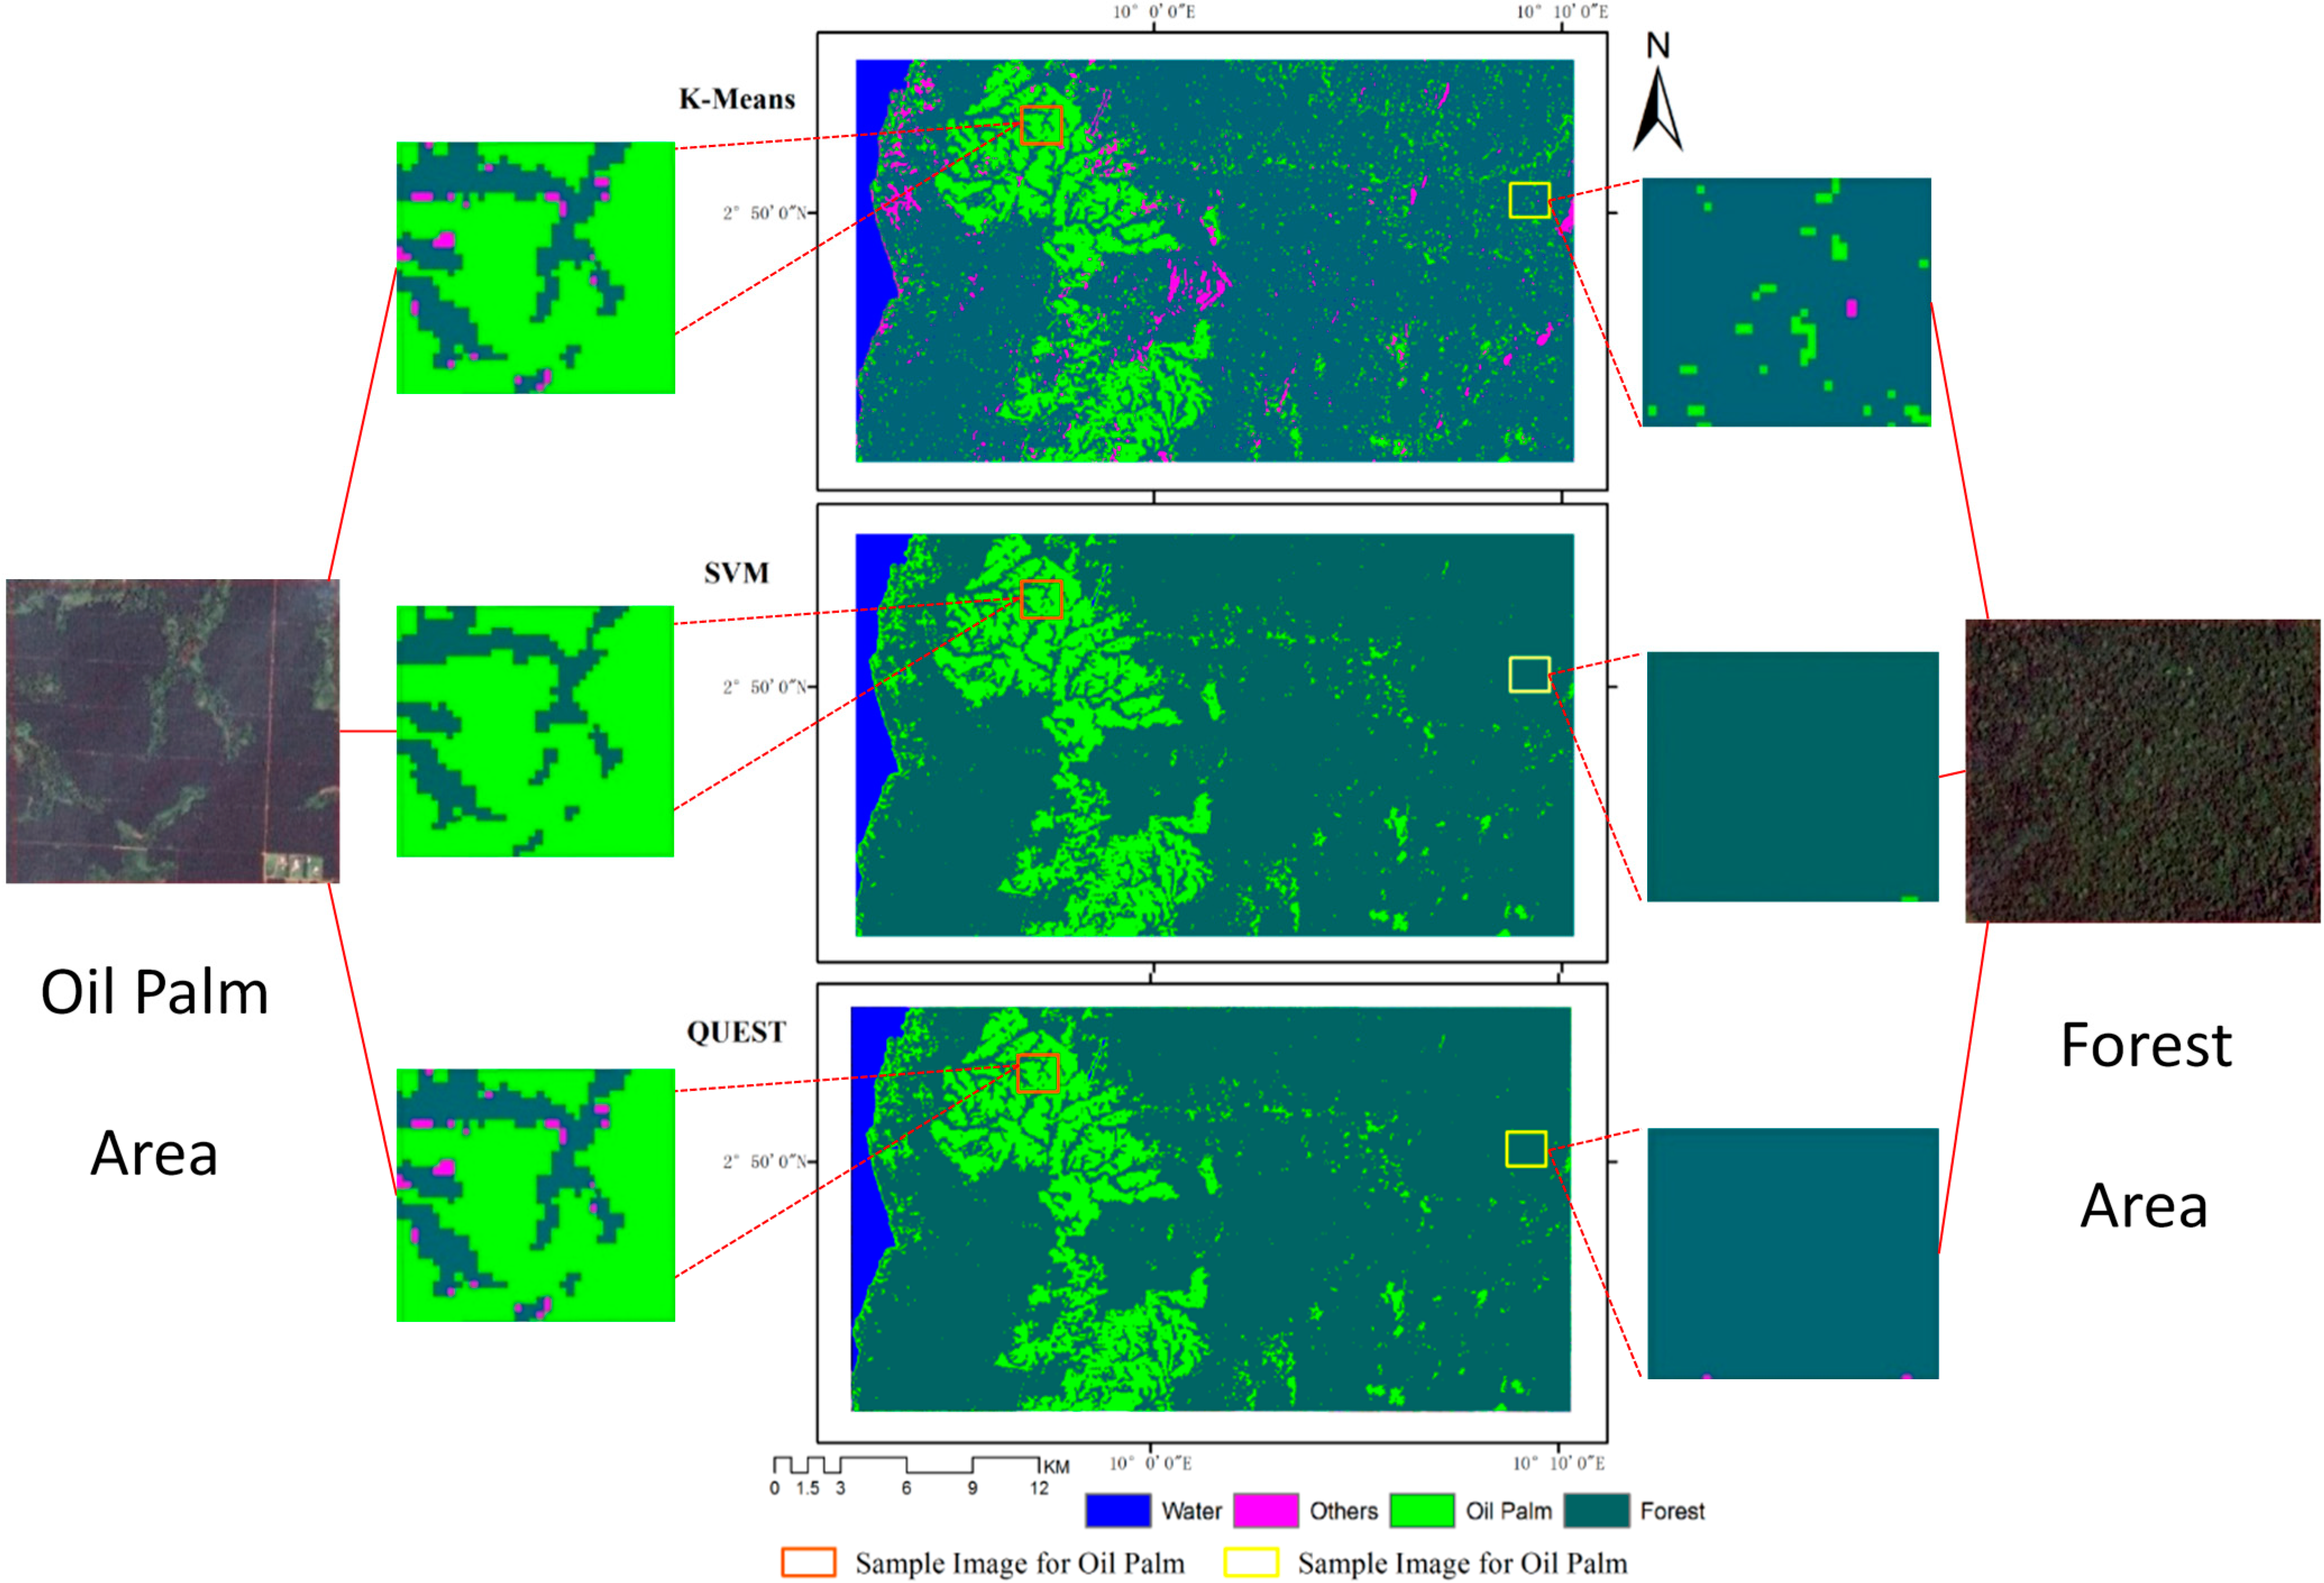
3.1. Oil Palm Plantation Map at 50m Spatial Resolution

Oil palm plantation maps generated by the SVM, QUEST, and K-Means methods were shown in Figure 6.
The accuracy of the classification results based on PALSAR was very high according to ROI validation. The overall accuracies and Kappa coefficients for the three classification methods are shown in Table 1. For simplicity, we only show here the results for situations using a bigger training sample size (2453 pixels for forest, 1597 pixels for oil palm, 464 pixels for water and 357 pixels for other land cover types). It can be seen that for a bigger training sample size (i.e., more than 500 pixels per class), the overall accuracies and Kappa coefficients were above 88% and 0.79, respectively, for all the three classification methods and above 92% and 0.85, for the two supervised classification methods.
Figure 6. Maps of oil palm plantations from SVM, Decision Tree and K-Means classification methods. The figure shows that the oil palm and natural forest have good seperability in the result.
Remotesensing 07 01206 g006
Table 1. Confusion matrix for accuracy assessment of oil palm mapping.
MethodsOverall Accuracy (%)Kappa CoefficientClassGround Truth Samples (Pixels)Total Classified PixelsUser Acc. (%)
Oil PalmForestsWaterOther
SVM92.340.8581Oil Palm1165215061144180.84
Forests1334580062477595.92
Water007851279798.50
Other094042752181.96
Total ground truth pixels129848897855627534
Prod. Acc. (%)89.7593.6810075.98
Decision Tree92.630.8650Oil Palm115774057127789.83
Forests464614062473397.71
Water007801579598. 11
Other95201542872958.71
Total ground truth pixels129848897855627534
Prod. Acc. (%)89.1494.3899.3676. 16
K-Means88.280.7855Oil Palm1063307034140475.71
Forests2354378079469293.31
Water007832280597.27
Other0204242763367.46
Total ground truth pixels129848897855627534
Prod. Acc. (%)81.9089.5599.7575.98

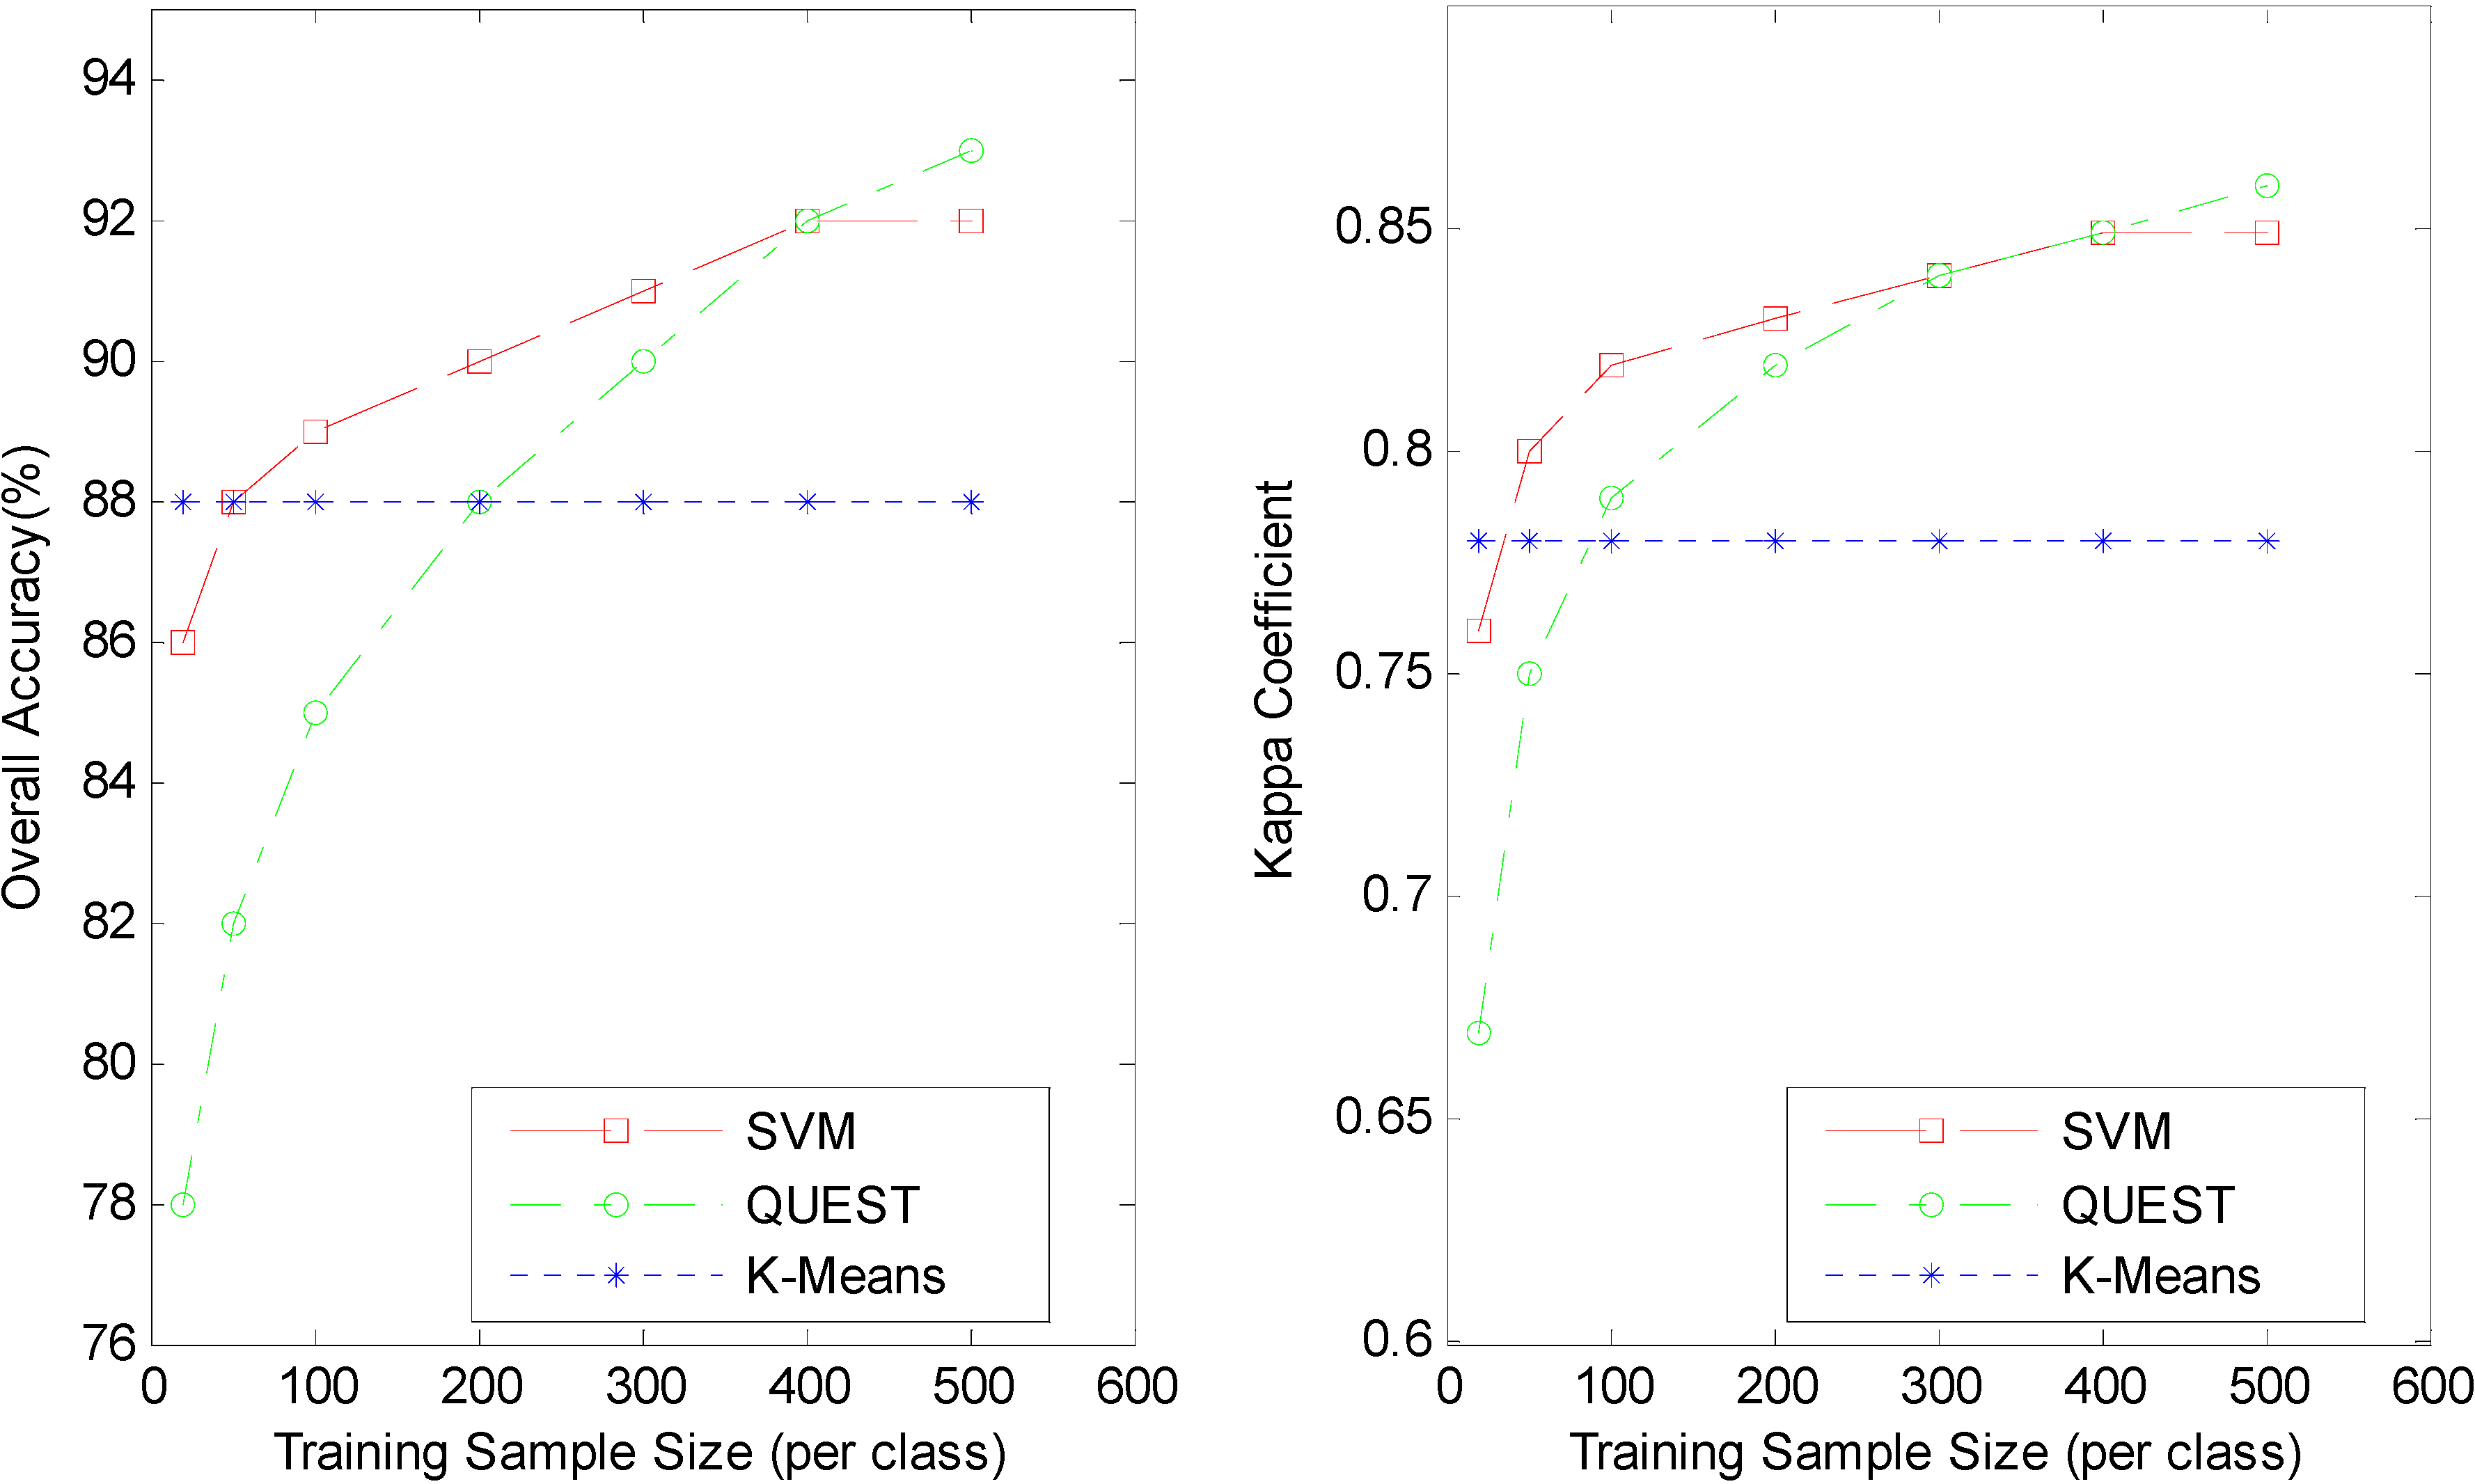
3.2. Accuracy Assessment with Various Sizes of Training Samples and McNemar’s Test

To test the performance variation of the three classification methods with different training sample sizes, we computed the overall accuracies and Kappa coefficients for different training sample sizes, and the results are shown in Figure 7.
Figure 7. The overall accuracies and Kappa coefficients from SVM, Decision Tree and K-Means classification methods.
Remotesensing 07 01206 g007
According to the overall accuracies and Kappa coefficients, the performance of SVM exceeded QUEST and K-Means for almost all given training sample sizes. For big training sizes (i.e., no less than 500 pixels per class), the overall accuracy and Kappa coefficient of SVM were 92% and 0.85, respectively. SVM’s results were almost the same as those of QUEST (93% for overall accuracy and 0.86 for Kappa coefficient) and slightly outperformed those of K-Means (88% for overall accuracy and 0.78 for Kappa coefficient). When the training sample size was smaller, the SVM and K-Means methods had higher overall accuracies and Kappa coefficients, with superior overall accuracies 8% above QUEST. For the QUEST method, when the training samples increased, accuracy performance improved rapidly. When the training size was big enough (more than 500 pixels per class), QUEST and SVM were similarly accurate, and better than the K-Means method. The same trends appeared in Kappa coefficients as in the overall accuracies. It is obvious that training sample size had less of an impact on the SVM classification than on Decision Tree (QUEST). The overall accuracies and Kappa coefficients suggest that SVM exceeded the other two classification methods.
Table 2 shows that the McNemar’s test value Z between SVM and Decision Tree ranged from 19.055 (significant) to −0.7182 (negligible), dependent upon the training sample size. SVM had a significant advantage with small sample sizes that diminished with increased training sample size. For SVM and K-Means, the McNemar’s test yielded Z values varying from −5.424 to 8.471 in favor of SVM at greater training sample sizes. For Decision Tree and K-Means, Z values varied according to the training sample size; when the training sample size increased, the Z value increased too. It should be noted that as an unsupervised method, the K-Means method needed no training sample, so the increasing Z values further proves that the performance of SVM/Decision Tree improved along with training size increases. Therefore, SVM had significant advantage over Decision Tree and K-Means.
Table 2. McNamar’s Test for SVM, Decision Tree and K-Means. If the McNemar’s test value is greater than 1.96, it means that the first method provides a statistically significant improvement in classification results. If the McNemar’s test value is less than −1.96, it means that the former method has a statistically distinctly worse performance than the latter one.
Size of Training Samples20 Pixels (Per Class)50 Pixels (Per Class)100 Pixels (Per Class)200 Pixels (Per Class)300 Pixels (Per Class)400 Pixels (Per Class)500 Pixels (Per Class)
SVM vs. Decision Tree18.98711.9329.3796.4322.7631.846−0.757
SVM vs. K-Means−5.125−2.0671.8566.0237.3247.2418.097
Decision Tree vs. K-Means−19.964−14.265−10.278−9.032−5.8675.2478.290

4. Discussion

4.1. Source of Uncertainty and Errors in the Oil Palm Map

Many factors affect the accuracy of classification, such as classification method, remote sensing data source, and training sample selection. In this study, PALSAR data from 2009 was used, but we selected training samples and validation samples based on Google Earth whose remote images in our study area were obtained in 2009–2010. During this period, some land cover change may have occurred. The difference in image acquisition time may have introduced some uncertainty or even error in our result.
The water area might be underestimated. In the study area, there are two long rivers. The width of the rivers is narrow, usually less than 50 m, which is less than one pixel width in PALSAR images. In addition, the PALSAR images we used were acquired in the dry season, which means some rivers had little water or had even run dry. Thus, we can be fairly confident that the water samples we selected did not include the area of the rivers.
The area of oil palm plantations calculated is likely to be smaller than the actual area. In this study, mature oil palm plantations were the primary target. The training samples of oil palm were mainly from groves of mature oil palms. Some newly planted oil palm plantations, which are usually surrounded by grass or legumes, could be overlooked due to differences in the backscatter characteristics between newly planted oil palm and mature oil palm. For example, in the L-band JERS-1 data, the difference between newly planted areas and mature oil palm plantations is about 4 dB [55]. In future work, studies with extensive samples at different growth stages will be used to analyze backscatter characteristics and identify oil palms at different ages.

4.2. Potential Application of These Classification Methods

In order to make optimal use of each classification method, we need a good understanding of the performance of these methods. SVM outperforms the other two algorithms in classification accuracy in most situations. However, to select a suitable algorithm, we must take into account all the likely pros and cons specific to the situation, not only in accuracy but also in model parameters, speed, and easy-of-use. The SVM method needs to set and adjust model parameters as described above. Bad parameters will most likely yield bad results. When it comes to speed, SVM loses to Decision Tree and K-Means. Especially for a large remote sensing dataset, SVM classification will take a much longer time at the training stage and the actual data classification stage, making SVM unsuitable for regional or global scale classification. Decision Tree and K-Means algorithms need no additional model parameters, and they are less time-consuming. The K-Means method needs time neither for training nor for any prior statistical backscatter analyses, but it does need an expert’s involvement, so its performance depends on the skills and knowledge of the operator. Using the Decision Tree method, the structure of the decision tree varies along with the training data size. If enough training samples are available, the threshold values for classifying oil palm will be less than −14 dB for HV image and greater than 6.5 dB for HH-HV difference image, which agrees with the previous studies [4,28]. If this rule can be universally applied to oil palm mapping, the decision method will also need no training samples and will be the fastest and easiest among the three methods.
For a given application, additional considerations for algorithm selection should also include the input data and the desired output. SVM is not good at dealing with noisy data. Therefore, for microwave remote sensing data, the pre-processing is very important when using SVM to map the land cover types. In addition, the quality of training samples is of great concern for automatic classification. For SVM, a relatively small number of mislabeled training samples will dramatically impair the classification result. Thus, although SVM needs fewer samples, it needs high quality training samples. The Decision Tree method needs training samples not only in good quality but also in good quantity.
Given its speed and classification accuracy, SVM is the optimal method for sub-regional level classification, while Decision Tree is the superior algorithm for land-cover classification at regional and global scales, if there are a large number of training samples available. If no training samples are available, K-Means is the second to none selection among these three methods. Furthermore, the universality of the Decision Tree threshold needs to be examined in the future. If the decision tree derived is suitable for other areas, the Decision Tree method will also need no training samples and will be the most applicable method in any situation.
When come to the data sources, ALOS PALSAR is not operational anymore, so we cannot get new SAR data from it. Fortunately, its successor ALOS-2 also called Daichi-2, was launched on 24 May 2014. The PALSAR-2 radar carried by ALOS-2 also works at 1.2 GHz (L-band) and provides effective extension of the PALSAR radar.

5. Conclusions

Global demand for palm oil has resulted in a wide expansion of oil palm plantations. Oil palm plantation expansion also results in land cover conversion from natural tropical rainforests to cultivated agro-forest with associated deforestation over a large area, especially in tropical regions. To monitor and assess the impacts of these land cover conversions on the environment, biodiversity, and carbon cycle, as well as on local economy, oil palm plantations must be mapped accurately and in a timely manner. In this paper, PALSAR data and three classification algorithms were explored for mapping oil palm plantations in Cameroon, a hotspot region for oil palm plantations. To compare the performance of the three different classification methods, different training sample sizes (20, 50, 100, 200, 300, 400, 500 pixels for each type) and parameters were used to conduct the classification experiments. The results showed that a map of oil palm plantations at 50m spatial resolution can be obtained using PALSAR data with the overall accuracies and Kappa coefficients above 88% and 0.79 respectively, for a bigger training sample size (i.e., more than 500 pixels per class). The smaller the training sample size was, the more pronounced the superiority the SVM. However, SVM was the most time-consuming method, especially when it came to mapping a large area. K-Means, an unsupervised classification method, runs faster and needs no training data. However, it is less accurate with inferior overall accuracies 4% below SVM and 5% below QUEST for a bigger training sample size, and it requires a person to interpret image clusters and label the land cover types which makes it less desirable. QUEST was a compromise on speed and accuracy, but it needed sufficient training data. That said, if the decision tree derived from QUEST can be proven to be universal, it will be the most viable method. To select a suitable algorithm for oil palm mapping, data size, the available training data, study area extent, and time requirement should be taken into account.

Acknowledgments

This study was supported by the NASA Land Cover and Land Use Change program (NNX11AJ35G, NNX14AD78G), the US National Science Foundation EPSCoR program (IIA-1301789), and the National Institutes of Health (1R01AI101028-01A1). Li was supported by the National Natural Science Foundation of China (Grant No. 41201340), and by the Chinese Universities Scientific Fund (Project No. 2012QJ157). Tenku was supported by the Fulbright Graduate Student Fellowship. The PALSAR 50 m mosaic images were provided by the JAXA as the ALOS product. We thank Sarah Xiao for her English editing and comments.

Author Contributions

Li Li, Jinwei Dong and Xiangming Xiao designed the study and conducted the data processing and manuscript writing. Simon Njeudeng Tenku contributed to the PALSAR data processing and manuscript editing. All the authors worked on the interpretation of results and manuscript revisions.

Conflicts of Interest

The authors declare no conflict of interest.

References

  1. Frank, N.E.G.; Albert, M.M.E.; Laverdure, D.E.E.; Paul, K. Assessment of the quality of crude palm oil from smallholders in Cameroon. J. Stored Prod. Postharvest Res. 2011, 2, 52–58. [Google Scholar]
  2. Feintrenie, L. Oil palm in Cameroon: Risks and opportunities. Nat. Faune 2012, 26, 23–27. [Google Scholar]
  3. Hoyle, D.; Levang, P. Oil Palm Development in Cameroon; WWF/IRD/CIFOR Report; WWF: Gland, Switzerland, 2012; p. 16. [Google Scholar]
  4. Carlson, K.M.; Curran, L.M.; Ratnasari, D.; Pittman, A.M.; Soares-Filh, B.S.; Asner, G.P.; Trigg, S.N.; Gaveau, D.A.; Lawrence, D.; Rodrigues, H.O. Committed carbon emissions, deforestation, and community land conversion from oil palm plantation expansion in West Kalimantan, Indonesia. Proc. Natl. Acad. Sci. USA 2012, 109, 7559–7564. [Google Scholar] [CrossRef] [PubMed]
  5. Sheil, D.; Casson, A.; Meijaard, E.; van Nordwijk, M.; Gaskell, J.; Sunderland-Groves, J.; Wertz, K.; Kanninen, M. The Impacts and Opportunities of Oil Palm in Southeast Asia: What do We Know and What do We Need to Know? CIFOR Report; Center for International Forestry Research (CIFOR): Bogor, Indonesia, 2009; p. 67. [Google Scholar]
  6. Jeffrey, S.; Jaboury, G.; Paul, N.; Agni, K.B. Oil palm expansion transforms tropical landscapes and livelihoods. Glob. Food Secur. 2012, 1, 114–119. [Google Scholar] [CrossRef]
  7. Jusoff, K.; Setiawan, I. Quantifying deforestation in a permanent forest reserve using vectorised Landsat TM. J. Trop. For. Sci. 2003, 15, 570–582. [Google Scholar]
  8. Naert, B.; Gal, R.; Lubis, A.U.; Suwandi, D.; Olivin, J. Preliminary assessment of the possibilities of using spatial remote-sensing to study developments on an oil palm plantation in North Sumatra. Oleagineux 1990, 45, 201–214. [Google Scholar]
  9. Santoso, H.; Gunawan, T.; Jatmiko, R.H.; Darmosarkoro, W.; Minasny, B. Mapping and identifying basal stem rot disease in oil palms in North Sumatra with QuickBird imagery. Precis. Agric. 2011, 12, 233–248. [Google Scholar] [CrossRef]
  10. Tan, K.P.; Kanniah, K.D.; Cracknell, A.P. A review of remote sensing based productivity models and their suitability for studying oil palm productivity in tropical regions. Prog. Phys. Geog. 2012, 36, 655–679. [Google Scholar] [CrossRef]
  11. Thenkabail, P.S.; Stucky, N.; Griscom, B.W.; Ashton, M.S.; Diels, J.; Meer, B.V.D.; Enclona, E. Biomass estimations and carbon stock calculations in the oil palm plantations of African derived savannas using IKONOS data. Int. J. Remote Sens. 2004, 25, 5447–5472. [Google Scholar] [CrossRef]
  12. Shafri, H.Z.M.; Hamdan, N.; Saripan, M.I. Semi-automatic detection and counting of oil palm trees from high spatial resolution airborne imagery. Int. J. Remote Sens. 2011, 32, 2095–2115. [Google Scholar] [CrossRef]
  13. Morel, A.C.; Saatchi, S.S.; Malhi, Y.; Berry, N.J.; Banin, L.; Burslem, D.; Nilus, R.; Ong, R.C. Estimating aboveground biomass in forest and oil palm plantation in Sabah, Malaysian Borneo using ALOS PALSAR data. For. Ecol. Manag. 2011, 262, 1786–1798. [Google Scholar] [CrossRef]
  14. Santos, C.; Messina, J.P. Multi-sensor data fusion for modeling African palm in the Ecuadorian Amazon. Photogramm. Eng. Rem. Sens. 2008, 74, 711–723. [Google Scholar] [CrossRef]
  15. Gutierrez-Velez, V.H.; DeFries, R.; Pinedo-Vasquez, M.; Uriarte, M.; Padoch, C.; Baethgen, W.; Fernandes, K.; Lim, Y. High-yield oil palm expansion spares land at the expense of forests in the Peruvian Amazon. Environ. Res. Lett. 2011, 6. [Google Scholar] [CrossRef]
  16. Gutierrez-Velez, V.H.; DeFries, R. Annual multi-resolution detection of land cover conversion to oil palm in the Peruvian Amazon. Remote Sens. Environ. 2013, 129, 154–167. [Google Scholar] [CrossRef]
  17. Walker, W.S.; Stickler, C.M.; Kellndorfer, J.M.; Kirsch, K.M.; Nepstad, D.C. Large-Area classification and mapping of forest and land cover in the Brazilian Amazon: A comparative analysis of ALOS/PALSAR and Landsat data sources. IEEE J. Sel. Top. Appl. Earth Obs. Remote Sens. 2010, 3, 594–604. [Google Scholar] [CrossRef]
  18. De Grandi, G.; Mayaux, P.; Rauste, Y.; Rosenqvist, A.; Simard, M.; Saatchi, S.S. The global rain forest mapping project JERS-1 Radar mosaic of tropical Africa: Development and product characterization aspects. IEEE Trans. Geosci. Remote Sens. 2000, 38, 2218–2233. [Google Scholar]
  19. Koo, V.C.; Chan, Y.K.; Gobi, V.; Chua, M.Y.; Lim, C.H.; Lim, C.S.; Thum, C.C.; Lim, T.S.; Ahmad, Z.; Mahmood, K.A.; et al. A new unmanned aerial vehicle synthetic aperture radar for environmental monitoring. Prog. Electromagn. Res. 2012, 122, 245–268. [Google Scholar] [CrossRef]
  20. Basuki, T.M.; Skidmore, A.K.; Hussin, Y.A.; van Duren, I. Estimating tropical forest biomass more accurately by integrating ALOS PALSAR and Landsat-7 ETM+ data. Int. J. Remote Sens. 2013, 34, 4871–4888. [Google Scholar] [CrossRef]
  21. Bagan, H.; Kinoshita, T.; Yamagata, Y. Combination of AVNIR-2, PALSAR, and polarimetric parameters for land cover classification. IEEE Trans. Geosci. Remote Sens. 2012, 50, 1318–1328. [Google Scholar] [CrossRef]
  22. Clewley, D.; Lucas, R.; Accad, A.; Armston, J.; Bowen, M.; Dwyer, J.; Pollock, S.; Bunting, P.; McAlpine, C.; Eyre, T.; et al. An approach to mapping forest growth stages in Queensland, Australia through integration of ALOS PALSAR and Landsat sensor data. Remote Sens. 2012, 4, 2236–2255. [Google Scholar] [CrossRef] [Green Version]
  23. Dong, J.W.; Xiao, X.M.; Chen, B.Q.; Torbick, N.; Jin, C.; Zhang, G.L.; Biradar, C. Mapping deciduous rubber plantations through integration of PALSAR and multi-temporal Landsat imagery. Remote Sens. Environ. 2013, 134, 392–402. [Google Scholar] [CrossRef]
  24. Dong, J.W.; Xiao, X.M.; Sheldon, S.; Biradar, C.; Duong, N.D.; Hazarika, M. A comparison of forest cover maps in Mainland Southeast Asia from multiple sources: PALSAR, MERIS, MODIS and FRA. Remote Sens. Environ. 2012, 127, 60–73. [Google Scholar] [CrossRef]
  25. Li, G.Y.; Lu, D.S.; Moran, E.; Dutra, L.; Batistella, M. A comparative analysis of ALOS PALSAR L-band and RADARSAT-2 C-band data for land-cover classification in a tropical moist region. ISPRS J. Photogramm. Remote Sens. 2012, 70, 26–38. [Google Scholar] [CrossRef]
  26. Rakwatin, P.; Longepe, N.; Isoguchi, O.; Shimada, M.; Uryu, Y.; Takeuchi, W. Using multiscale texture information from ALOS PALSAR to map tropical forest. Int. J. Remote Sens. 2012, 33, 7727–7746. [Google Scholar] [CrossRef]
  27. Zhao, C.Y.; Lu, Z.; Zhang, Q.; de la Fuente, J. Large-area landslide detection and monitoring with ALOS/PALSAR imagery data over Northern California and Southern Oregon, USA. Remote Sens. Environ. 2012, 124, 348–359. [Google Scholar] [CrossRef]
  28. Lehmann, E.A.; Caccetta, P.A.; Zhou, Z.S.; McNeill, S.J.; Wu, X.L.; Mitchell, A.L. Joint processing of Landsat and ALOS-PALSAR data for forest mapping and monitoring. IEEE Trans. Geosci. Remote Sens. 2012, 50, 55–67. [Google Scholar] [CrossRef]
  29. Kellndorfer, J. Pan-tropical Forest Cover Mapped with Cloud-Free Radar Imaging. Available online: http://www.whrc.org/mapping/pantropical/alos.html (accessed on 12 November 2013).
  30. Miettinen, J.; Liew, S.C. Separability of insular Southeast Asian woody plantation species in the 50 m resolution ALOS PALSAR mosaic product. Remote Sens. Lett. 2011, 2, 299–307. [Google Scholar] [CrossRef]
  31. Srestasathiern, P.; Rakwatin, P. Oil palm tree detection with high resolution multi-spectral satellite imagery. Remote Sens. 2014, 6, 9749–9774. [Google Scholar] [CrossRef]
  32. Japan Aerospace Exploration Agency (JAXA), K&C Mosaic Homepage—PALSAR 50 m Orthorectified Mosaic Product. Available online: http://www.eorc.jaxa.jp/ALOS/en/kc_mosaic/kc_map_50.htm (accessed on 11 May 2014).
  33. Longepe, N.; Rakwatin, P.; Isoguchi, O.; Shimada, M.; Uryu, Y.; Yulianto, K. Assessment of ALOS PALSAR 50 m Orthorectified FBD data for regional land cover classification by support vector machines. IEEE Trans. Geosci. Remote Sens. 2011, 49, 2135–2150. [Google Scholar] [CrossRef]
  34. Shimada, M.; Ohtaki, T. Generating large-scale high-quality SAR mosaic datasets: Application to PALSAR data for global monitoring. IEEE J. Sel. Top. Appl. Earth Obs. Remote Sens. 2010, 3, 637–656. [Google Scholar] [CrossRef]
  35. Shimada, M.; Isoguchi, O.; Tadono, T.; Isono, K. PALSAR radiometric and geometric calibration. IEEE Trans. Geosci. Remote Sens. 2009, 47, 3915–3932. [Google Scholar] [CrossRef]
  36. Touzi, R.; Shimada, M. Polarimetric PALSAR calibration. IEEE Trans. Geosci. Remote Sens. 2009, 47, 3951–3959. [Google Scholar] [CrossRef]
  37. Rosenqvist, A.; Shimada, M.; Ito, N.; Watanabe, M. ALOS PALSAR: A pathfinder mission for global-scale monitoring of the environment. IEEE Trans. Geosci. Remote Sens. 2007, 45, 3307–3316. [Google Scholar] [CrossRef]
  38. Wu, F.; Wang, C.; Zhang, H.; Zhang, B.; Tang, Y.X. Rice crop monitoring in South China with RADARSAT-2 quad-polarization SAR data. IEEE Geosci. Remote Sens. Lett. 2011, 8, 196–200. [Google Scholar] [CrossRef]
  39. Benedek, C.; Sziranyi, T. Change detection in optical aerial images by a multilayer conditional mixed Markov model. IEEE Trans. Geosci. Remote Sens. 2009, 47, 3416–3430. [Google Scholar] [CrossRef]
  40. Kennedy, R.E.; Yang, Z.G.; Cohen, W.B. Detecting trends in forest disturbance and recovery using yearly Landsat time series: 1. LandTrendr—Temporal segmentation algorithms. Remote Sens. Environ. 2010, 114, 2897–2910. [Google Scholar] [CrossRef]
  41. Cohen, W.B.; Yang, Z.G.; Kennedy, R. Detecting trends in forest disturbance and recovery using yearly Landsat time series: 2. TimeSync—Tools for calibration and validation. Remote Sens. Environ. 2010, 114, 2911–2924. [Google Scholar] [CrossRef]
  42. Potere, D. Horizontal positional accuracy of Google Earth’s high-resolution imagery archive. Sensors 2008, 8, 7973–7981. [Google Scholar] [CrossRef]
  43. Richards, J.A.; Jia, X. Remote Sensing Digital Image Analysis: An Introduction, 5rd ed.; Springer-Verlag: Berlin/Heidelberg, Germany, 2012. [Google Scholar]
  44. Baghdadi, N.; Boyer, N.; Todoroff, P.; El Hajj, M.; Begue, A. Potential of SAR sensors TerraSAR-X, ASAR/ENVISAT and PALSAR/ALOS for monitoring sugarcane crops on Reunion Island. Remote Sens. Environ. 2009, 113, 1724–1738. [Google Scholar] [CrossRef]
  45. Jengo, C. RuleGen Spatial Analysis ENVI Module (Version 1.02). Available online: http://wwwittviscom/codebank/searchasp?FID=295 (accessed on 22 October 2011).
  46. Erener, A. Classification method, spectral diversity, band combination and accuracy assessment evaluation for urban feature detection. Int. J. Appl. Earth Obs. Geoinf. 2013, 21, 397–408. [Google Scholar] [CrossRef]
  47. Schwert, B.; Rogan, J.; Giner, N.M.; Ogneva-Himmelberger, Y.; Blanchard, S.D.; Woodcock, C. A comparison of support vector machines and manual change detection for land-cover map updating in Massachusetts, USA. Remote Sens. Lett. 2013, 4, 882–890. [Google Scholar] [CrossRef]
  48. Dixon, B.; Candade, N. Multispectral landuse classification using neural networks and support vector machines: One or the other, or both? Int. J. Remote Sens. 2008, 29, 1185–1206. [Google Scholar] [CrossRef]
  49. Petropoulos, G.P.; Kalaitzidis, C.; Vadrevu, K.P. Support vector machines and object-based classification for obtaining land-use/cover cartography from Hyperion hyperspectral imagery. Comput. Geosci. 2012, 41, 99–107. [Google Scholar] [CrossRef]
  50. Cherkassky, V.; Ma, Y.Q. Practical selection of SVM parameters and noise estimation for SVM regression. Neural Netw. 2004, 17, 113–126. [Google Scholar] [CrossRef] [PubMed]
  51. Guide EUs. ENVI On-Line Software User’s Manual. Available online: http://www.exelisvis.com/docs/home.html (accessed on 19 January 2015).
  52. McNemar, Q. Note on the sampling error of the difference between correlated proportions or percentages. Psychometrika 1947, 12, 153–157. [Google Scholar] [CrossRef] [PubMed]
  53. Braun, A.C.; Weidner, U.; Hinz, S. Classification in high-dimensional feature spaces-assessment using SVM, IVM and RVM with focus on simulated EnMAPdata. IEEE J. Sel. Top. Appl. Earth Obs. Remote Sens. 2012, 5, 436–443. [Google Scholar] [CrossRef]
  54. Koc-San, D. Evaluation of different classification techniques for the detection of glass and plastic greenhouses from WorldView-2 satellite imagery. J. Appl. Remote Sens. 2013, 7, 073553: 1–073553:20. [Google Scholar] [CrossRef]
  55. Rosenqvist, Å. Evaluation of JERS-1, ERS-1 and Almaz SAR backscatter for rubber and oil palm stands in West Malaysia. Int. J. Remote Sens. 1996, 17, 3219–3231. [Google Scholar]

