Article

Integrating Multiple Source Data to Enhance Variation and Weaken the Blooming Effect of DMSP-OLS Light

State Key Laboratory of Earth Surface Processes and Resource Ecology/Center for Human-Environment System Sustainability (CHESS), Beijing Normal University, No. 19, Xinjiekouwai Street, Haidian District, Beijing 100875, China
*
Author to whom correspondence should be addressed.
Remote Sens. 2015, 7(2), 1422-1440; https://doi.org/10.3390/rs70201422
Submission received: 25 October 2014 / Accepted: 22 January 2015 / Published: 29 January 2015
(This article belongs to the Special Issue Remote Sensing with Nighttime Lights)

Abstract

:
Defense Meteorological Satellite Program/Operational Linescan System (DMSP-OLS) nighttime light has proved to be an effective tool to monitor human activities, especially in mapping urban areas. However, the inherent defects of DMSP-OLS light including saturation and blooming effects remain to be tackled. In this study, the Normalized Difference Vegetation Index (NDVI) product of the Moderate-resolution Imaging Spectroradiometer/Normalized Difference Vegetation Index 1-Month (MODND1M), the temperature product of Moderate-resolution Imaging Spectroradiometer/Land Surface Temperature 1-Month (MODLT1M) and DMSP-OLS light were integrated to establish the Vegetation Temperature Light Index (VTLI), aiming at weakening the saturation and blooming effects of DMSP-OLS light. In comparison with DMSP-OLS nighttime light, this new methodology achieved the following improvements: (1) the high value (30%–100%) range of VTLI was concentrated in the urban areas; (2) VTLI could effectively enhance the variation of DMSP-OLS light, especially in the urban center; and (3) VTLI reached convergence faster than Vegetation Adjusted Normalized Urban Index (VANUI). Results showed that the urban areas extracted by VTLI were closer to those from Landsat TM images with the accuracy of kappa coefficients in Beijing (0.410), Shanghai (0.718), Lanzhou (0.483), and Shenyang (0.623), respectively. Thus, it can be concluded that the proposed index is able to serve as a favorable option for urban areas mapping.

Graphical Abstract

1. Introduction

Globally, more and more scientific studies have focused on the coupling of human activities and natural system [1]. As a main cause of land cover/land use change, human disturbance cannot be ignored. Urbanization, in particular, is the most powerful evidence of humans stepping into the nature [2]. Today, more than 50% of people around the world live in urban areas [3]. The demand for urban areas greatly increases with the rapid growth of urban populations. It has become a hot research topic to measure the effect of rapid urbanization on the human-nature system [4,5,6]. Thus, accurate quantification of rapid urbanization is the first critical step in studying the coupling of human-nature system.
At present, statistical methods and remote sensed extraction are the two mainstream ways to quantify urban information [7,8]. Both of them have limitations in that statistical data are difficult to spatialize and time-consuming as it is hard to acquire continuously high-quality remote sensed images. However, with high temporal resolution, Defense Meteorological Satellite Program/Operational Linescan System (DMSP-OLS) nighttime light has the potential to make up for their limitations. The observational data provided by the OLS sensor contains dawn, daytime, dusk, and nighttime periods each day. Since 1992, three types of product have been invented, including radiation calibration products, stable light products, and light intensity products [9,10,11]. With visible spectral resolution of 6 bit, Digital Number (DN) value of stable light product ranges from 0 to 63.
Nowadays, DMSP-OLS nighttime light has been widely used to monitor human activities [12,13,14,15,16,17,18,19]. To accurately measure urban areas by DMSP-OLS data, a threshold of the DMSP-OLS light DN value is usually acquired by two main approaches. One relies on auxiliary data, such as administrative boundaries, land cover data as well as build-up area [20,21,22]; the other utilizes the physical property changes of light polygons by increasing the detection frequency of DMSP-OLS light [23]. The relationship between the DMSP-OLS light DN value and social economic indicators including population, Gross Domestic Product (GDP), build-up area, and electricity consumption, were also reported [24,25,26,27,28,29,30,31,32,33,34,35,36,37]. Although DMSP-OLS light can detect artificial light at night in clear weather conditions, the data value of urban centers is too bright and tends to saturate due to the limitation of radiometric range of DMSP-OLS data [10,20]. Additionally, the light scattering effect makes some places luminous without light [17].Therefore, the saturation and blooming effects cannot be ignored. Cubic regression models were used to correct DMSP-OLS light [38,39], and two popular indices called the Human Settlement Index (HSI) and the Vegetation Adjusted Normalized Urban Index (VANUI) were used to address the saturation and blooming effects of DMSP-OLS nighttime light. They were both based on the rationale that impervious surface area was inversely correlated with vegetation abundance [40,41]. However, there are several demerits for HSI and VANUI. By integrating single Normalized Difference Vegetation Index (NDVI) factor, HSI and VANUI only increase the inter-urban variability within certain cities, in which the vegetation health and abundance is negatively correlated with DMSP-OLS light [42]. In the areas where the land type is vegetation, and NDVI is equal to 1, HSI is not equal to 0. It indicates that urban activities co-occur in heavily vegetated areas, but this is hardly possible in reality [41]. In addition, when NDVI is equal to 0, the values of HSI and VANUI are invariant, which means that the saturation and blooming effects are not reduced when NDVI is equal to 0. Furthermore, non-vegetation land covers, such as bare soils and human settlements, have similar NDVI values. Thus, NDVI images are not suitable for directly separating human settlements, as is the case with Beijing [41]. The second shortcoming relates to water bodies. As water has weak reflection of light, blooming light affects water body extraction. The third problem is that it is hard to interpret the meaning of HSI with complex formulas [40]. Additionally, HSI is sensitive to changes in NDVI when the value of DMSP-OLS light is high [42].
This paper develops a new approach termed the Vegetation Temperature Light Index (VTLI) to extract urban information by merging DMSP-OLS light, NDVI, and land surface temperature. It can be used to reduce the saturation and blooming effects of DMSP-OLS light based on easily available data, such as NDVI product of Moderate-resolution Imaging Spectroradiometer/Normalized Difference Vegetation Index 1-Month (MODND1M) and land surface temperature product of Moderate-resolution Imaging Spectroradiometer/Land Surface Temperature 1-Month (MODLT1M). The proposed index is then applied in four typical metropolises in China including Beijing, Shanghai, Lanzhou, and Shenyang, respectively. Our method demonstrates itself as a more favorable tool in capturing urban area.

2. Materials and Methodology

2.1. Study Area

Four cities, including Beijing, Shanghai, Shenyang, and Lanzhou are selected as sampling sites.
Beijing, as the capital of China, is the center of politics, culture, and technology. Beijing is located between 39°26′ N and 41°03′ N latitude and between 115°25′ E and 117°30′ E longitude. It has a north temperate monsoon climate and four distinct seasons. Rapid urbanization has taken place in Beijing. The permanent population has increased by 43.9% between 2000 and 2010. The urban areas of Beijing cluster together with regular rings. Since the government formulated and revised the rules for urban afforestation, the green space of Beijing City has increased to 190.2 km2 in 2010 (Beijing Statistical Yearbook, 2011).
Shanghai, the largest city in China, is located between 39°40′ N and 31°53′ N latitude and between 120°52′ E and 122°12′ E longitude. It has a north subtropical monsoon climate. Spring and autumn are shorter than winter and summer. In 2010, the permanent population increased by 40% from 2000. The proportion of urban green space increased to 1201.5 km2 in 2010 (Shanghai Statistical Yearbook, 2011).
Shenyang is one of the central cities in the Northeast China. It is located at 41°48′ N latitude and 123°23′ E longitude in the south of northeast China and in the center of the northeast Asia economic circle. Shenyang has a temperate sub-humid continental climate. Due to the effect of the monsoon, it is characterized by concentrated rainfall, large temperature differences, and four distinct seasons. The permanent population increased by 5% between 2000 and 2010. Due to Shenyang municipal planning, urban green space increased to 273.28 km2 in 2010 [43].
Lanzhou is located at 36°03′ N latitude and 103°40′ E longitude. With a temperate continental climate, it has neither a hot summer nor a cold winter. It is one of the arid and semi-arid cities in China with less vegetation around, which is different from the other three cities in this study. The permanent population increased by 3% between 2000 and 2010. The urban green space in Lanzhou increased to 16.79 km2 in 2010. Lanzhou is a second-tier city with a lower level of economy development.
The locations of the four cities are shown in Figure 1. These four metropolises all experience long histories of urbanization and have different natural climates, so they have broad representativeness.
Figure 1. The location of the study areas in China (Background: Defense Meteorological Satellite Program/Operational Linescan System (DMSP-OLS) nighttime light in 2000).
Remotesensing 07 01422 g001

2.2. Data and Preprocessing

This study employed DMSP-OLS stable light product, NDVI product, Land Surface Temperature and Emissivity product, and Landsat Thematic Mapper (TM) images. Table 1 shows a brief description of all the data. The DMSP-OLS stable light product was acquired from the National Oceanic and Atmospheric Administration/National geophysical Data Center (NOAA/NGDC) Earth Observation Group [44]. The stable light product contains the light collected from cities, towns, and other sites with persistent lighting, including gas flares. To reduce errors between the multi-source datasets, the average DN value of the DMSP-OLS light derived from F14 and F15 was calculated. The MODND1M products for monthly NDVI and MODLT1M products for monthly land surface temperature were downloaded from the Geospatial Data Cloud [45], and the maximum of monthly NDVI products was calculated in 2000 [46]. The urban heat island effect is usually more pronounced in the night than in the day. Therefore, to highlight the urban heat island effect, the Moderate-resolution Imaging Spectroradiometer (MODIS)-derived maximum of the monthly night temperature products in 2000 was calculated as the temperature factor. The land cover types classified by Landsat TM images with resolution of 28.5 m were used as the true representation of urban areas, which were obtained by maximum likelihood classifier based on training data extracted from typical urban areas [46]. The Landsat images were classified into two categories (urban vs. non-urban). Because it is hard to distinguish between urban and suburban pixels covered by building and roads, the urban areas produced by the supervised classification were aggregated [46]. Subsequently, 28.5 m of classified urban areas were rescaled to the resolution of 1km to validate urban areas extracted by the indices based on DMSP-OLS light. In this study, all datasets were projected to GCS_WGS_1984. In order to better compare with VANUI, DMSP-OLS light and temperature were normalized by subset with Equation (1):
D i = d i d min d max d min
where Di is the normalized value; di is the original value; dmin and dmax are the minimum and maximum of the subsets, respectively.
Table 1. Description of data in this study.
Data SourceProduct DescriptionAcquisition Date
DMSP-OLS nighttime lightYearly stable light product with 1km spatial resolution2000
MODIS NDVI and Land Surface Temperature productsComputer Network Information Center, Chinese Academy of Science synthesizes China 1km monthly average NDVI and Land Surface Temperature products by MODND1M and MODLT1M, respectively ( http://www.gscloud.cn/)12 months in 2000
The land cover classification images by Landsat TM28.5 m spatial resolutionObtained from Xin Cao [43]

2.3. VTLI Index

The increasing urban impervious layer generally encroaches on vegetation, and there is an obvious temperature gradient between urban and rural surroundings [47]. The positive relationship between land surface temperature (LST) and impervious surface area (ISA) percent is strong [48]. ISA percent could represent urban mixed land-use type. The land surface temperature, unlike NDVI which may saturate [41], would contribute to the detection of spatial variation within urban environment in conjunction with NDVI. Therefore, we integrated NDVI and the land surface temperature to reduce the saturation and blooming effects of DMSP-OLS light. Based on the structure of VANUI, the method of factor multiplication was chosen. This method could not only enhance the same roles among factors, but also retain the different roles; therefore, VTLI is proposed as follows with Equations (2)–(4):
V T L I = ( 1 V max ) × T max × L
V max = M a x ( V J a n u a r y V F e b r u a r y ... V D e c e m b e r )
T max = M a x ( T J a n u a r y T F e b r u a r y ... T D e c e m b e r )
Where V is monthly NDVI, T is the monthly night temperature and L is the DN value of DMSP-OLS light. All the factors range from 0 to 1.
To compare the capabilities of representing urban area of VANUI and VTLI, the following threshold method was used. The threshold started at 5% and kept increasing by 5% in each step until the matching degrees decreased. The DMSP-OLS light, VTLI, and VANUI were reclassified into two categories (urban area vs. non-urban area) on the threshold, which were compared with the Landsat TM classification using the Confusion Matrix tool in ENVI 4.7. All pixels in each subset were compared and the matching degree was measured by the kappa coefficient and overall accuracy (OA). Considering the wide range of non-urban pixels involved in the OA calculation, the optimal threshold was selected according to the maximum of the kappa coefficients [46]. All data were prepared with spatial resolution of 1km in the accuracy assessment. Furthermore, an examination of where disagreement occurred was conducted and the error areas which were not identified as the correct class (urban area or non-urban area) were analyzed. The formulas of OA and the kappa coefficient as follows were used to evaluate the accuracy of urban area extraction from VANUI and VTLI.
O A = x k k N
k a p p a = N k x k k k x k x k N 2 k x k x k
Where N is the total pixel count in the land cover type, xkk is the diagonal of the classification confusion matrix, xk is the total pixel count of k class, and xk is the total pixel count that is classified into the k class.

3. Results

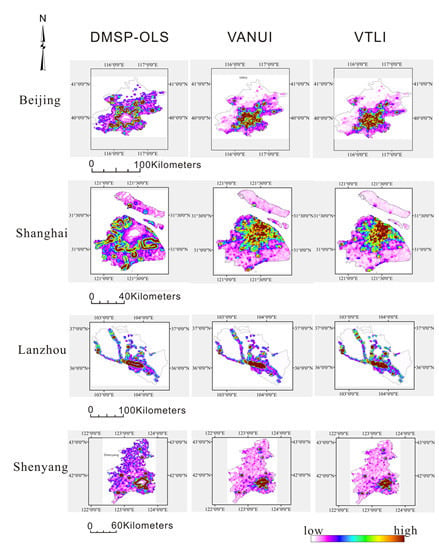
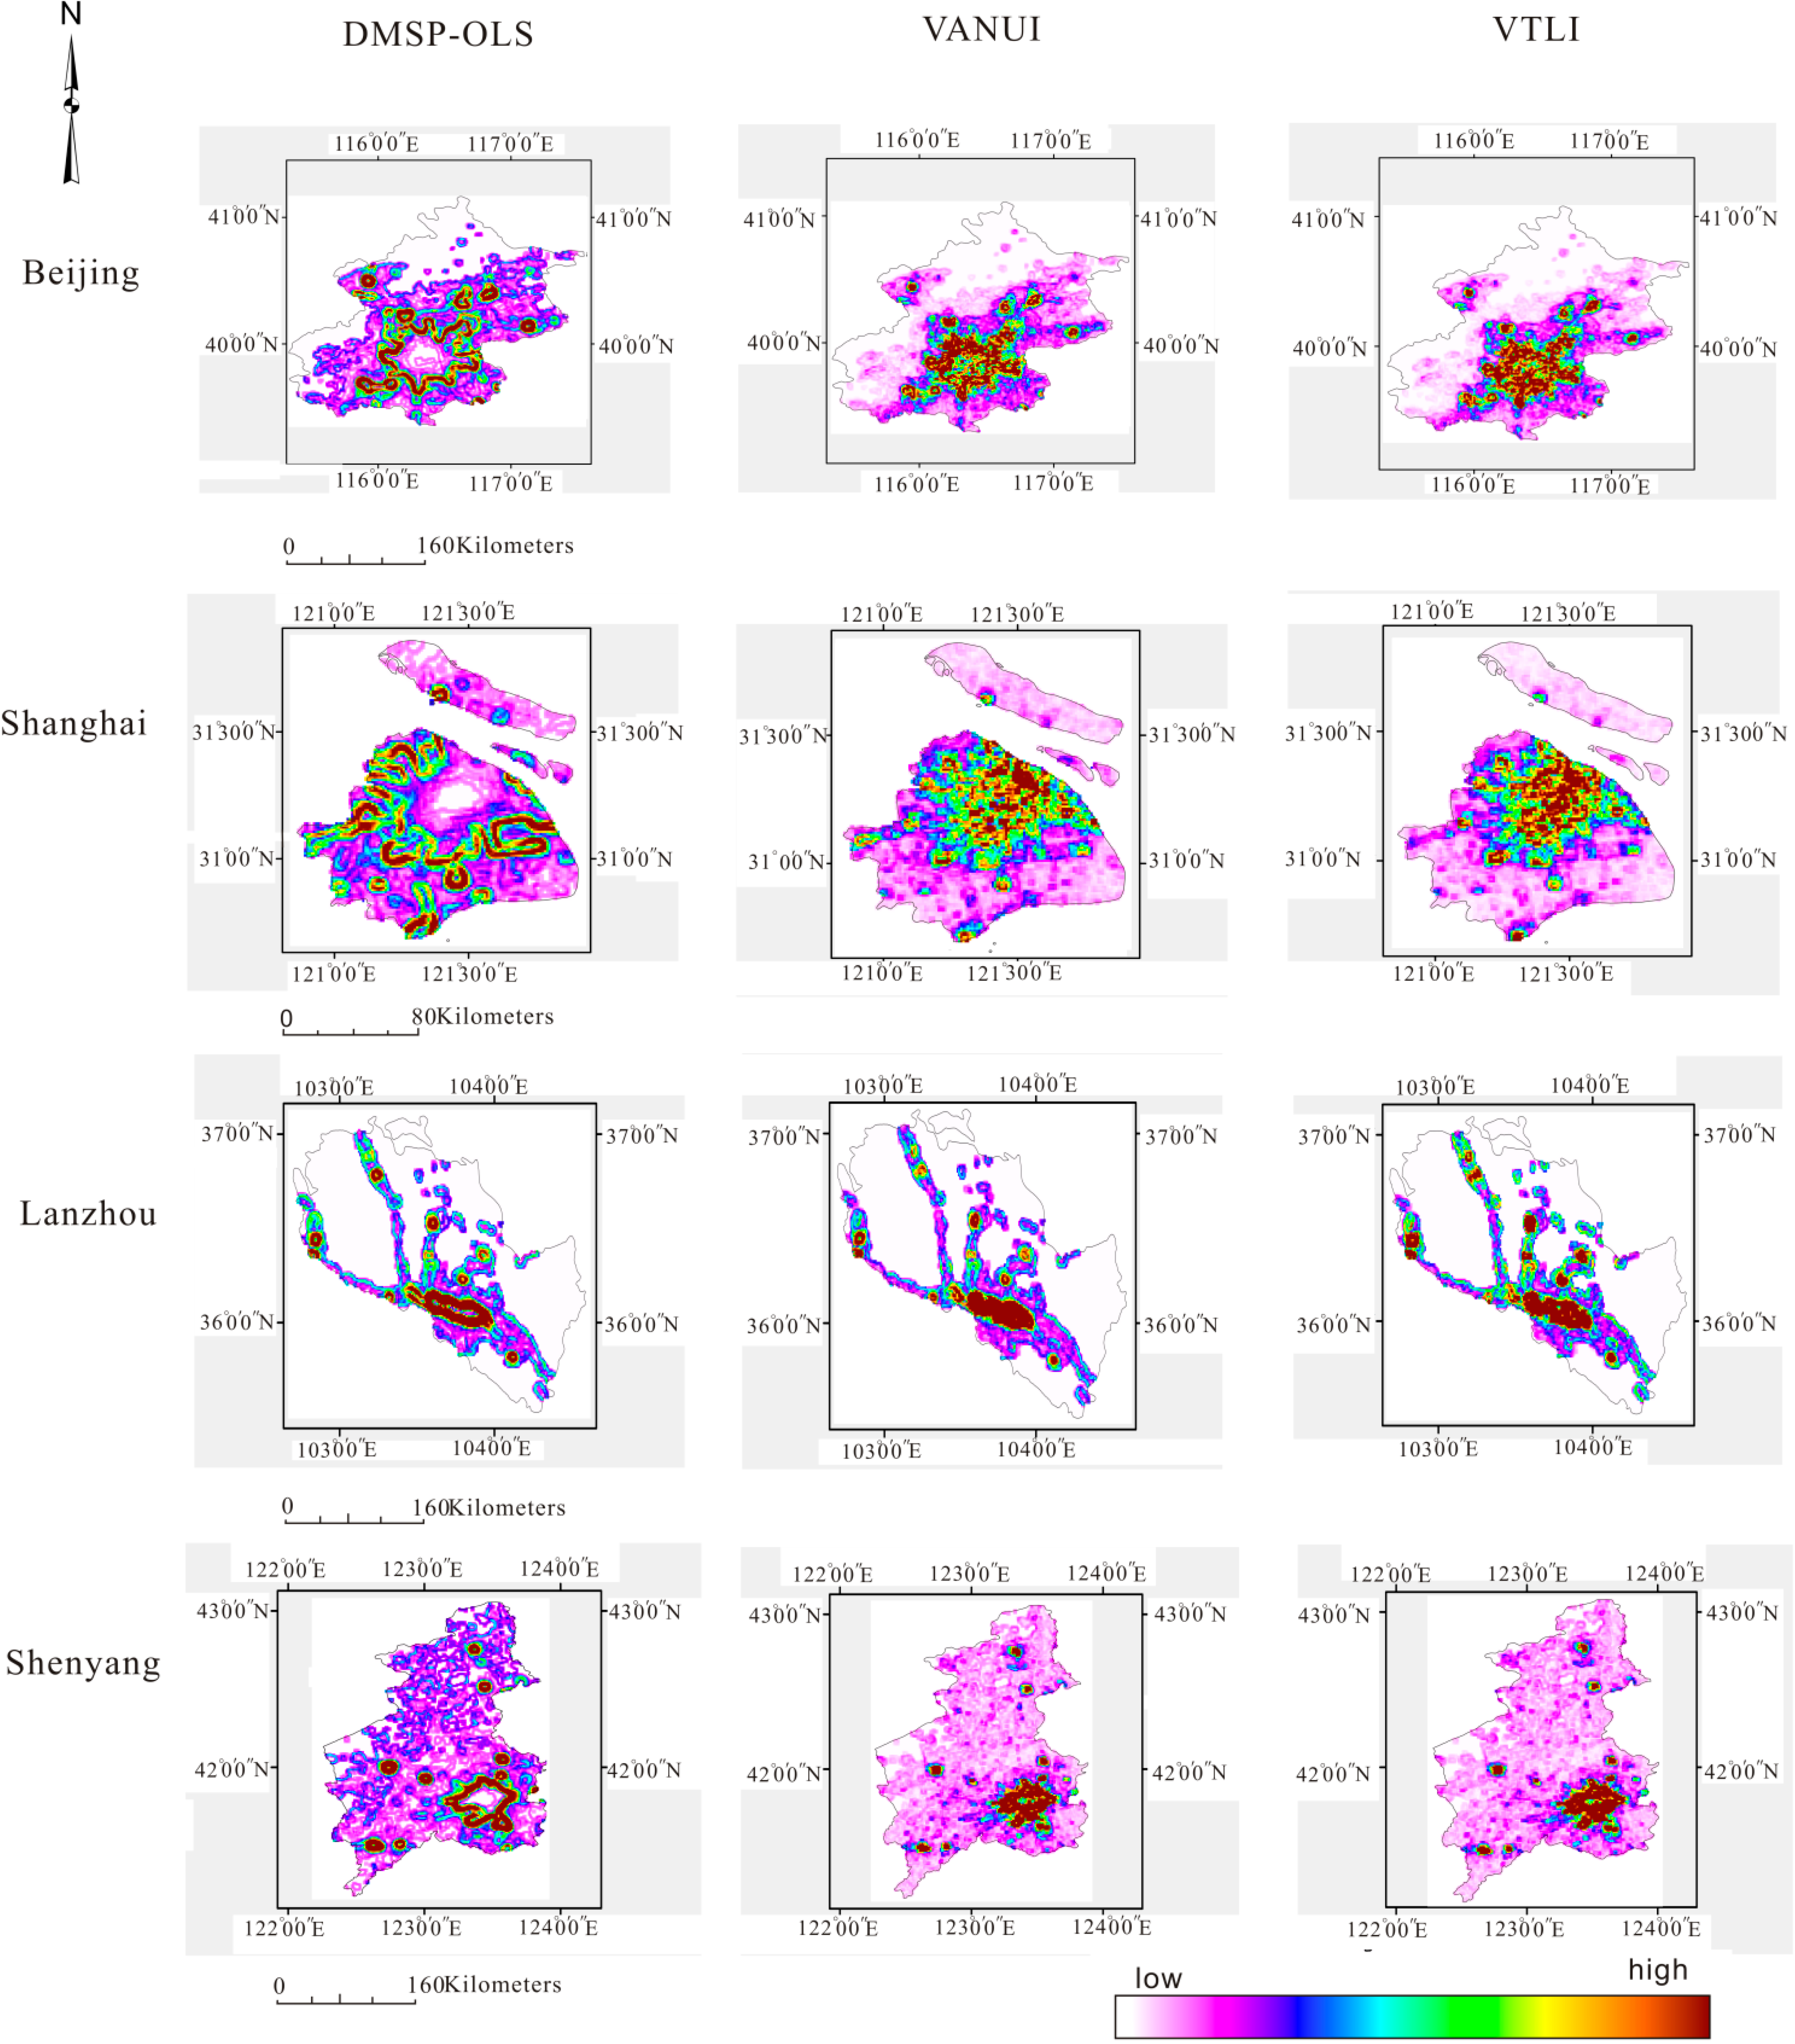
3.1. Spatial Distributions of the Three Indices

Figure 2 shows the spatial distributions of DMSP-OLS light, VAUNI, and VTLI based on three ranges, which consist of high value (30%–100%), middle value (10%–30%), and low value (0–10%), respectively. The high value (30%–100%) range of DMSP-OLS light represents the approximate locations of the cities (Figure 2). The values of VAUNI and VTLI decrease from the urban centers to the suburbs, just as DMSP-OLS light does, and the pixels of value larger than 10% are much more concentrated compared with DMSP-OLS light. The main difference between VANUI and VTLI lies in that spatial distribution of high value (30%–100%) range of VTLI is discontinuously patchy, which is closer to actual urban patterns.

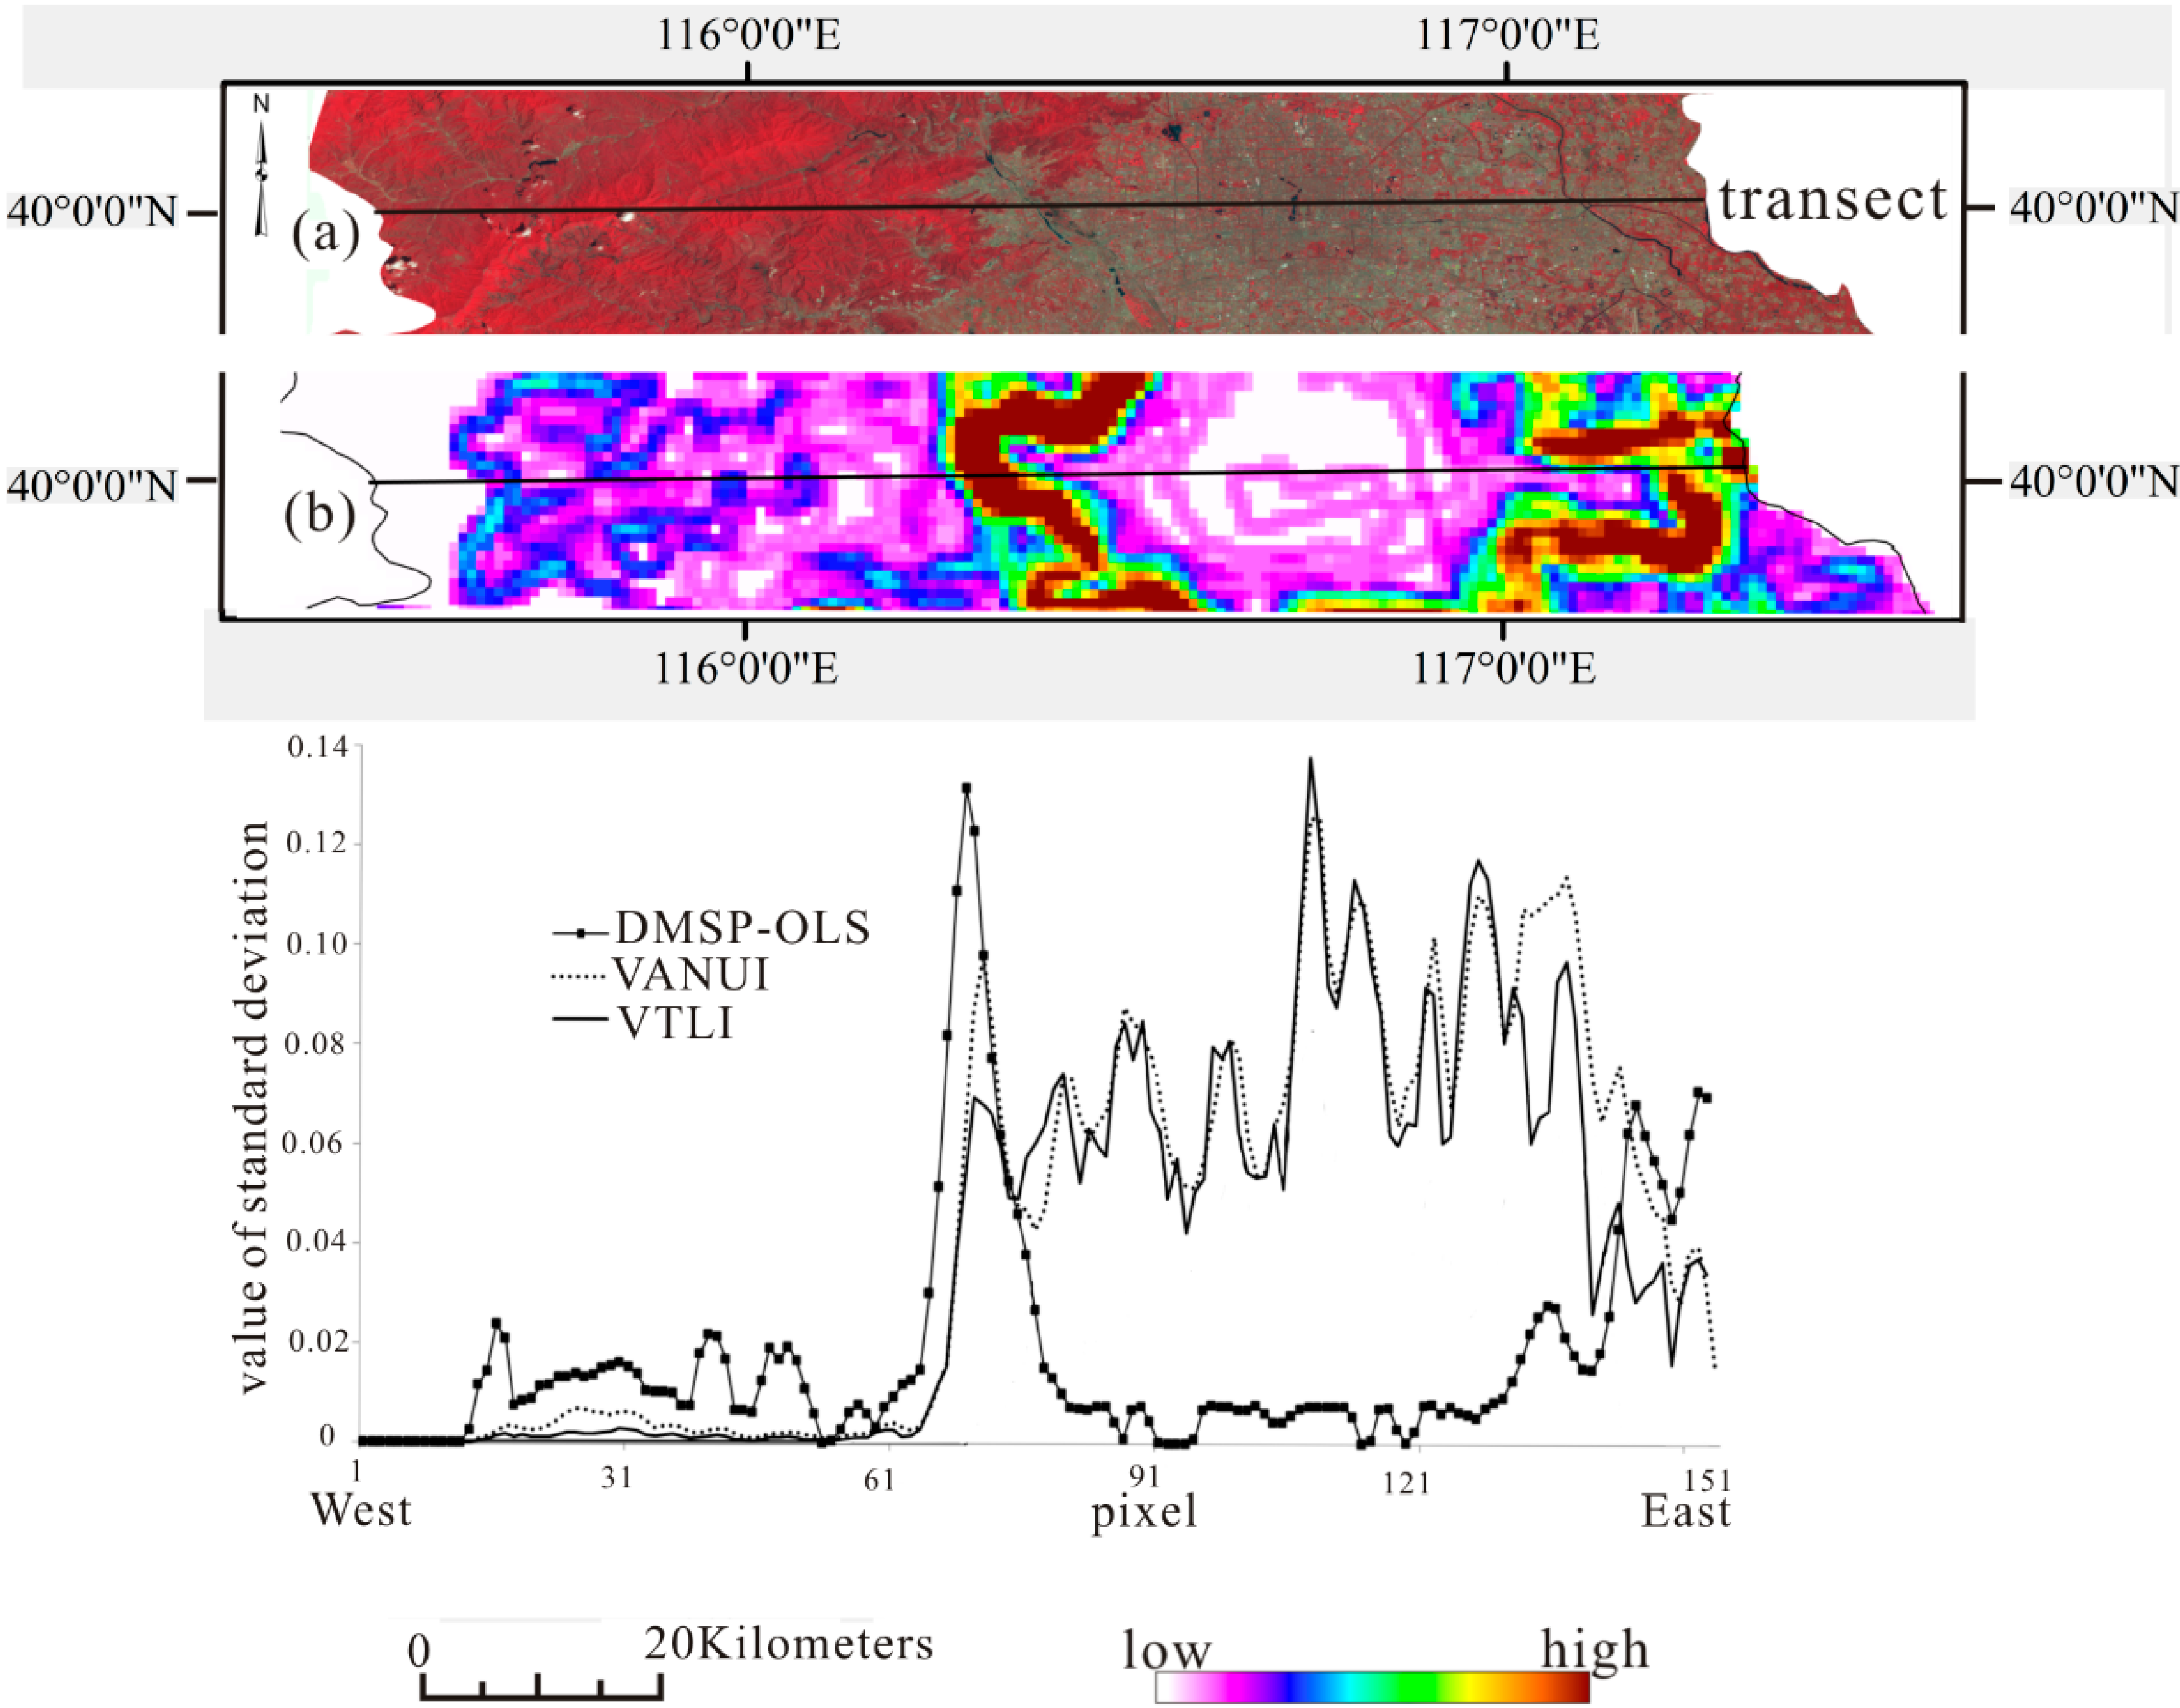
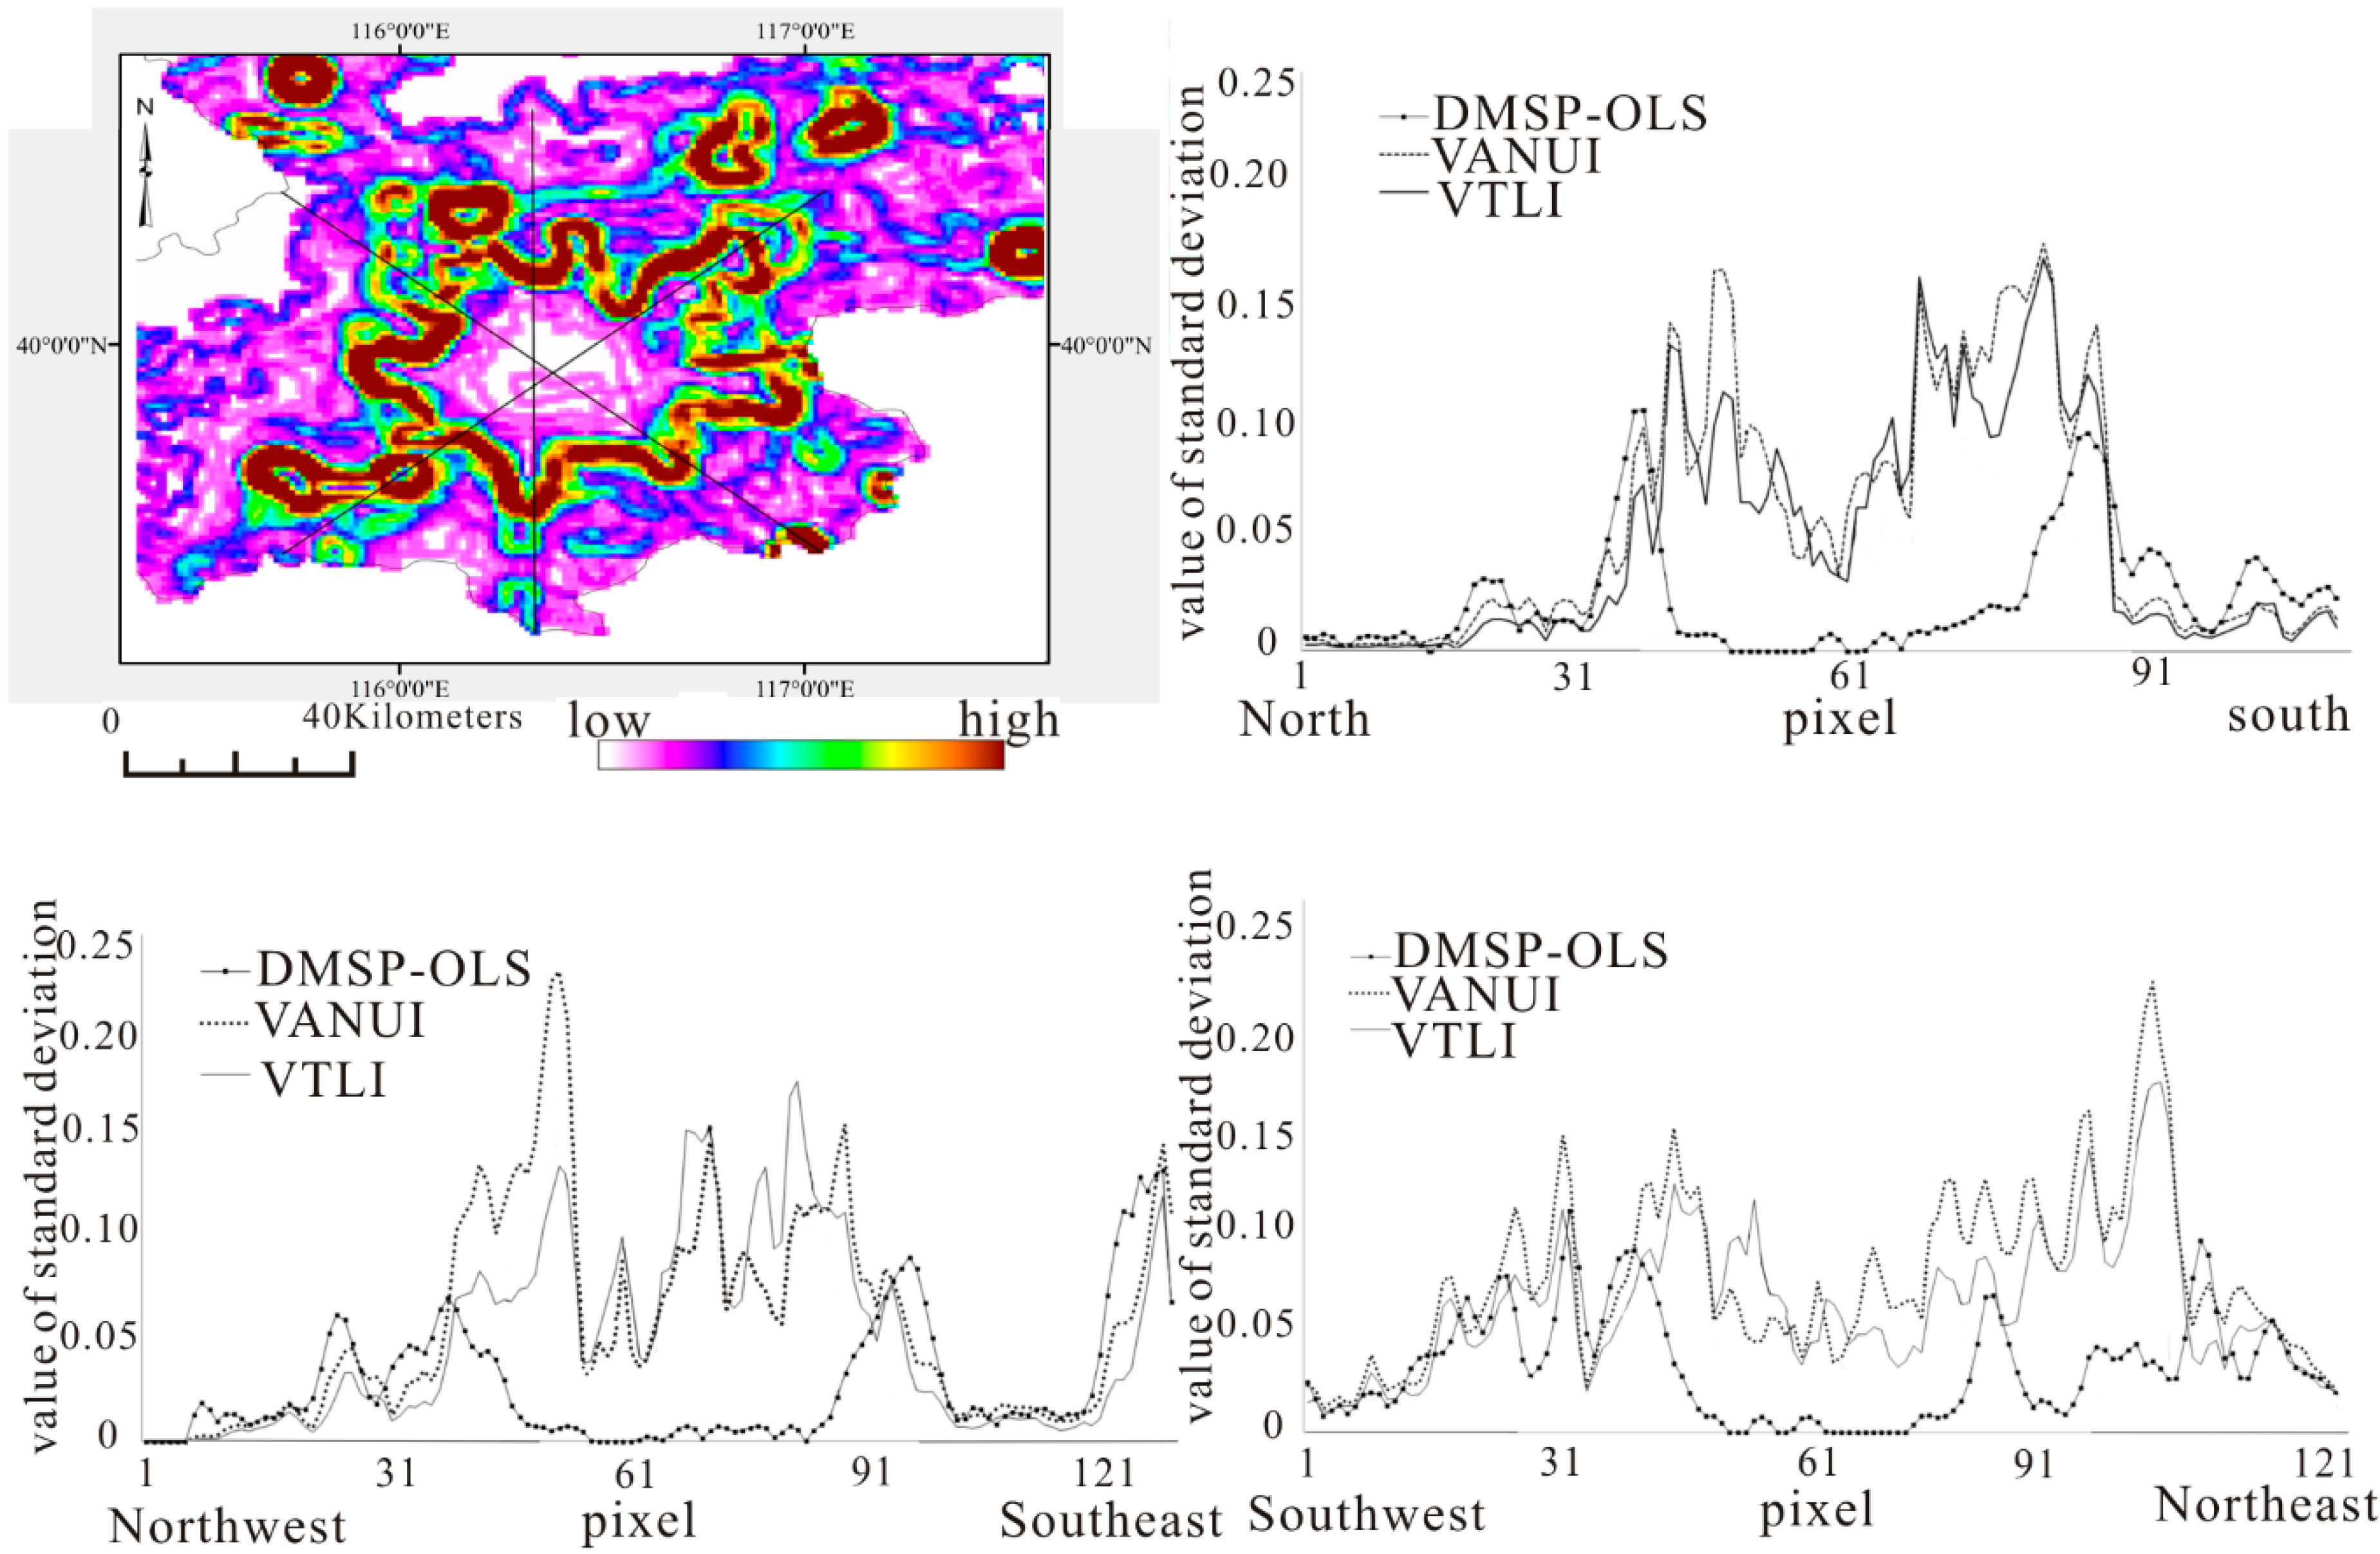
3.2. Standard Deviation of the Three Indices

To quantify the variation of DMSP-OLS light, VAUNI, and VTLI, standard deviation was calculated using a 3 × 3 window on Arcgis 9.3. The spatial distribution of the standard deviation was shown in Figure 3. A higher standard deviation represents a larger variation of the index value. The spatial distribution of DMSP-OLS light standard deviation presents a regular shape, and it almost surrounds the urban areas (Figure 3). VAUNI and VTLI show higher standard deviations in the urban areas overall. As for the case of Beijing, it has distinct rural-urban divisions, with six ring roads radiating outwards. Here we draw four lines in different directions (see the Appendix Figure A1). Figure 4 shows the variation on the transect through the gradient of the rural-urban-urban center from west to east in Beijing. At the junction of urban and non-urban areas, the standard deviation of DMSP-OLS light increases sharply (Figure 4). In urban areas, the standard deviation of DMSP-OLS light is almost zero, while those of VANUI and VTLI are higher. This indicates that VAUNI and VTLI could detect the variation of DMSP-OLS light in the urban areas more effectively. Spatial distributions of the standard deviation of VAUNI and VTLI are similar, but VTLI shows many peaks with higher frequency of fluctuation (Figure 4 and the Appendix Figure A1), and thus is superior to VANUI in this aspect.
Figure 2. The spatial distributions of the DMSP-OLS light, Vegetation Adjusted Normalized Urban Index (VANUI), and Vegetation Temperature Light Index (VTLI) in the four cities.
Remotesensing 07 01422 g002
Figure 3. The standard deviations of the DMSP-OLS light, VANUI, and VTLI in the four cities.
Remotesensing 07 01422 g003
Figure 4. The standard deviation changes for the DMSP-OLS light-based indices. (a) Latitudinal transect with background of Landsat TM image in Beijing. (b) Standard deviation transect of the DMSP-OLS light in corresponding to (a).
Remotesensing 07 01422 g004
Figure 5. The pixel count distributions of DMSP-OLS light, VANUI, and VTLI in the four cities; X axis is the value of the indices in percent; Y axis is the pixel count.
Remotesensing 07 01422 g005

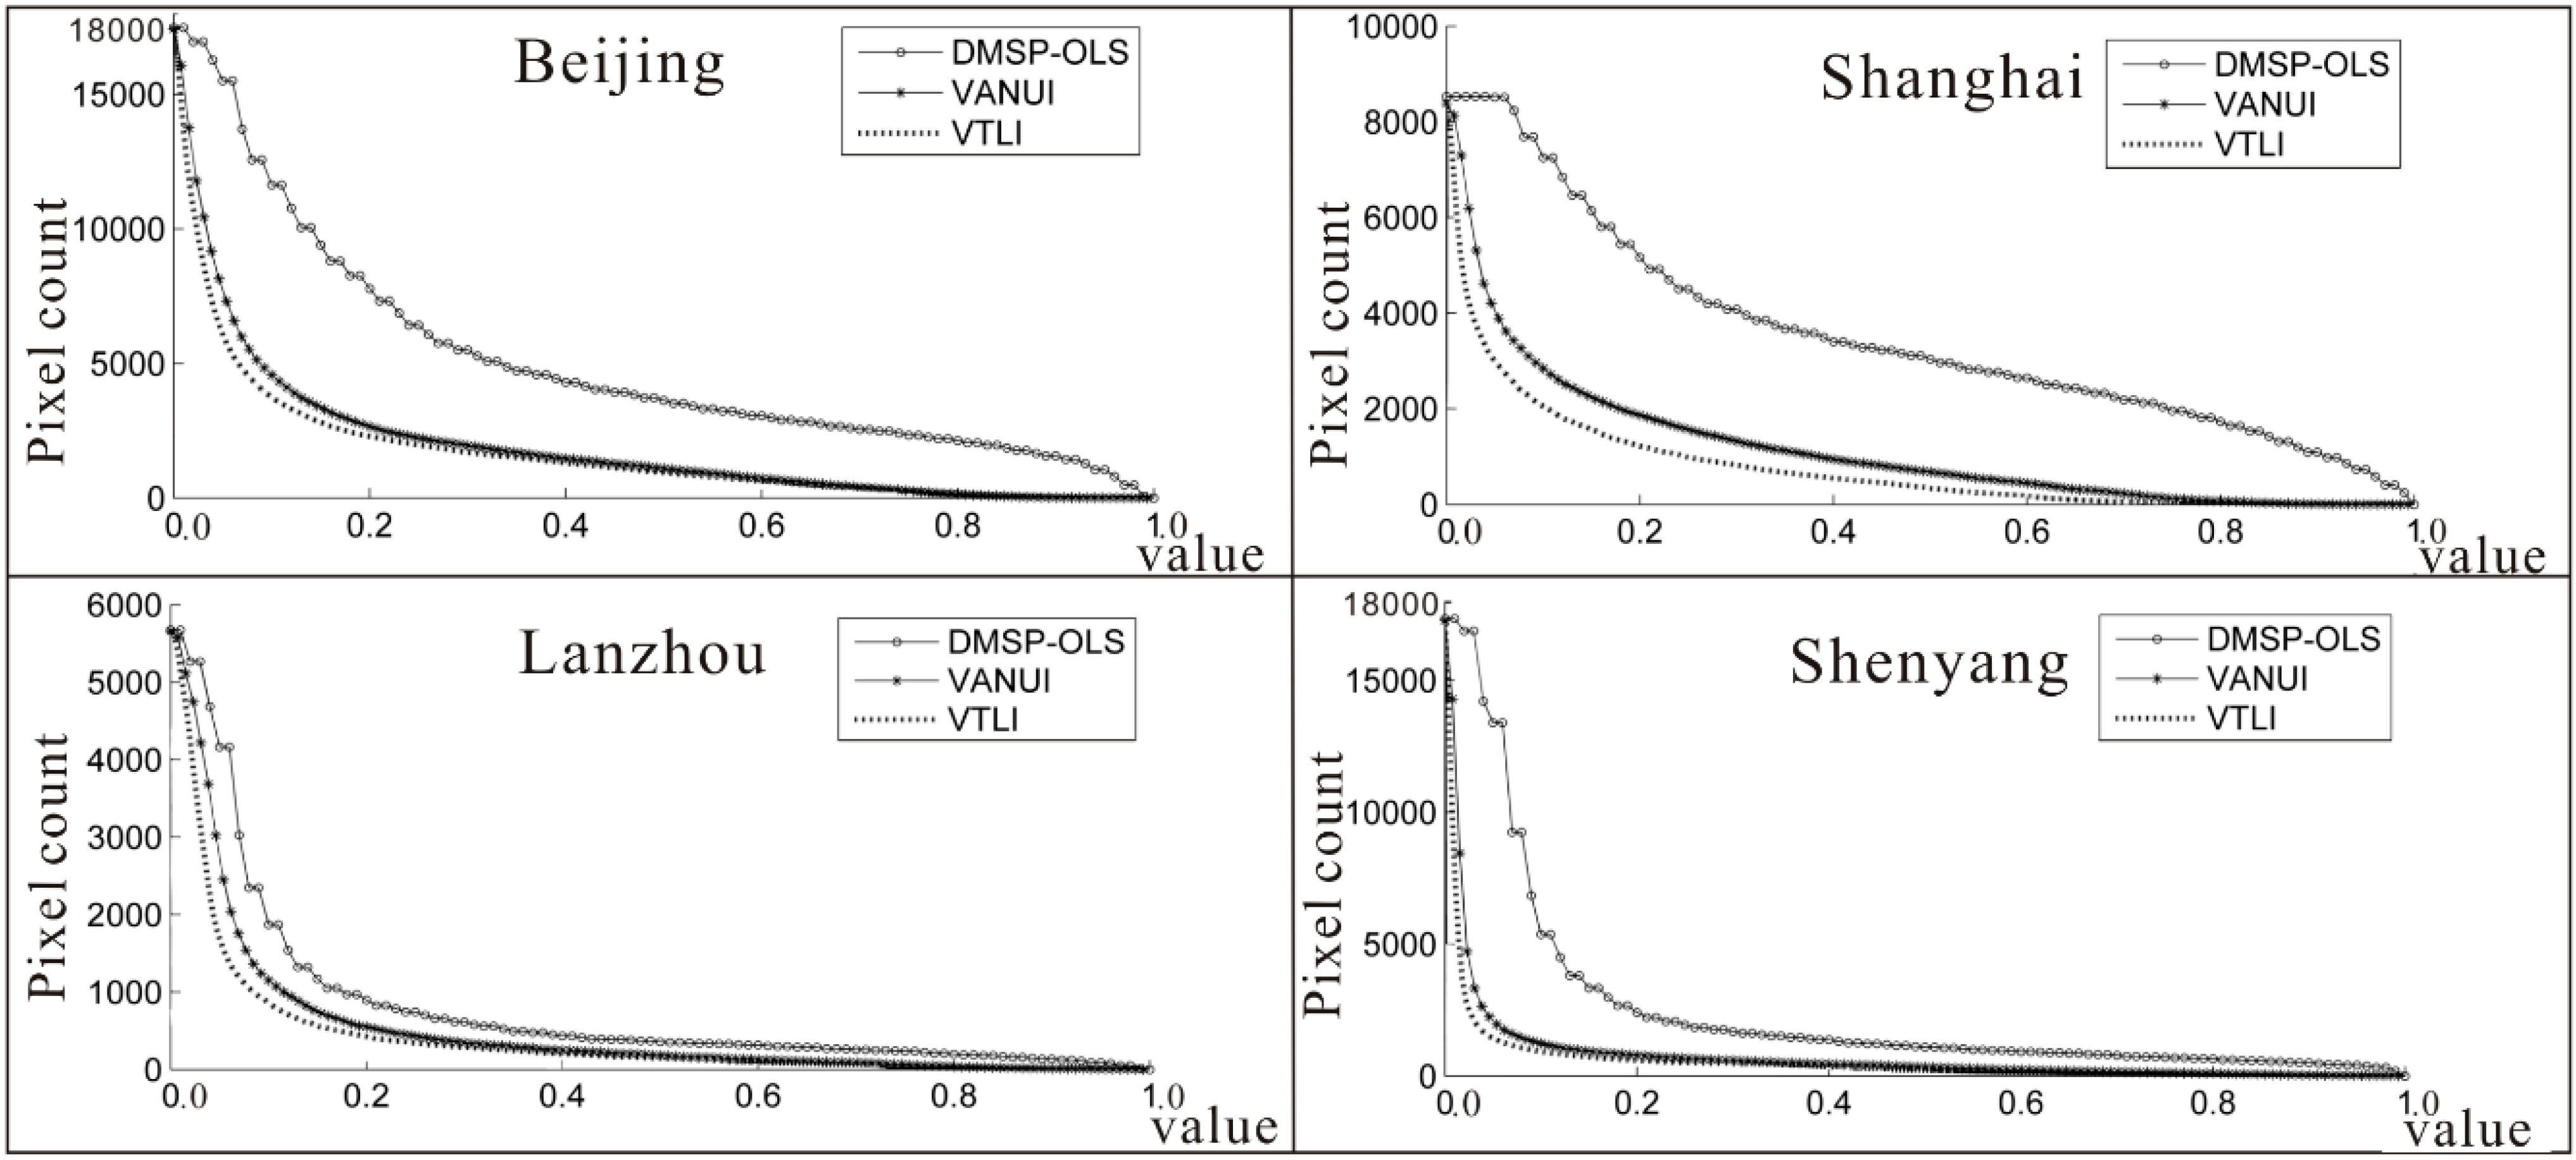
3.3. Convergence features of the Three Indices

Figure 5 is the plot of the pixel count distributions of three indices in the four cities. In comparison with DMSP-OLS light and VANUI, VTLI reaches convergences fastest in the four cities, and the convergence means that the pixel counts of indices no longer decrease by increasing the value. The pixel count of DMSP-OLS light is larger than those of VANUI and VTLI all the time and it decreases slowly in the four cities (Figure 5). The pixel counts of both VAUNI and VTLI drop sharply between 0 and 0.1, which means that many non-urban pixels are filtered out, and the pixel count of VTLI is always smaller than VANUI at the same threshold value zone in the four cities. In addition, VTLI reaches the stationary points faster than VANUI, indicating that VTLI can extract urban area more easily.
Table 2. The matching degrees of VANUI and VTLI at increasing thresholds and the highest kappa coefficients for the four cities (*).
CityIndexThreshold
5%10%15%20%
KappaOAKappaOAKappaOAKappaOA
BeijingVANUI0.27963.4%0.38469.2%0.40770.6%0.40770.7%
VTLI0.37268.6%0.410 *70.8%0.40170.6%0.38069.6%
ShanghaiVANUI0.42460.0%0.58573.0%0.66679.2%0.70582.1%
VTLI0.57572.1%0.70081.6%0.718 *83.4%0.71483.7%
LanzhouVANUI0.09436.9%0.22353.0%0.33264.2%0.42672.1%
VTLI0.23253.8%0.36267.0%0.45074.6%0.483 *78.1%
ShenyangVANUI0.34883.1%0.48190.1%0.54492.5%0.57893.7%
VTLI0.52091.8%0.60194.5%0.623 *95.2%0.61595.5%

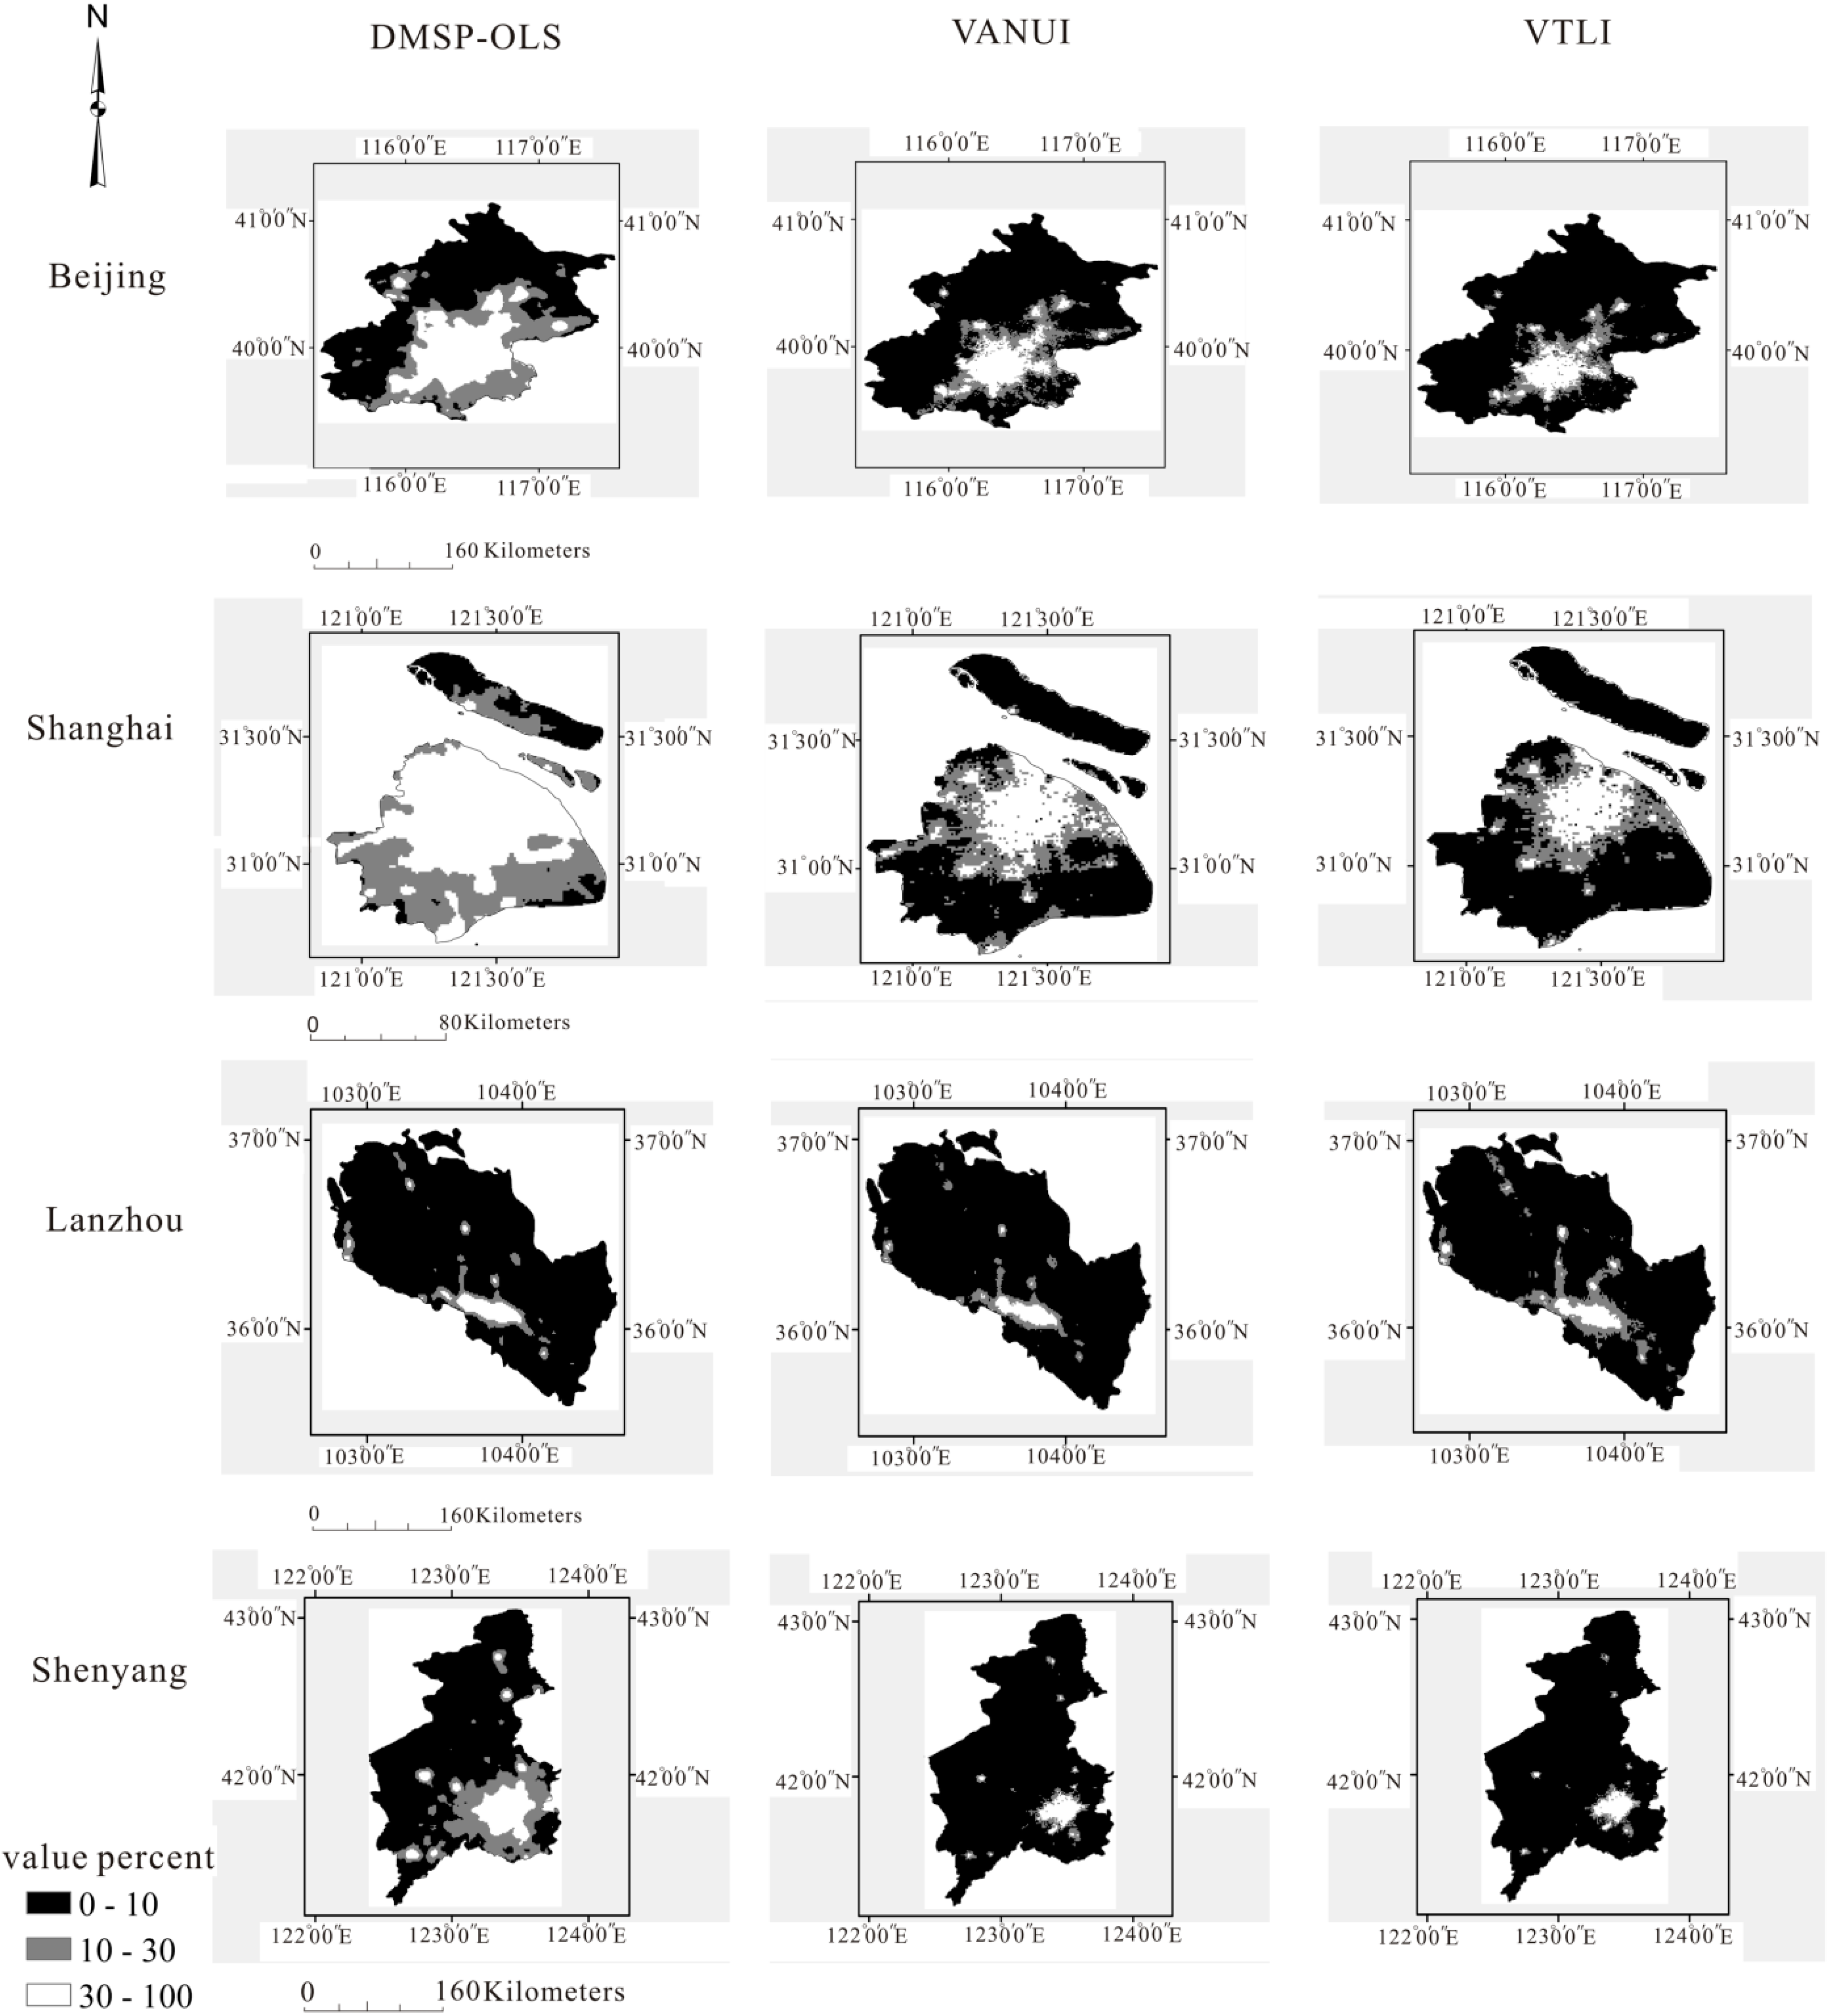
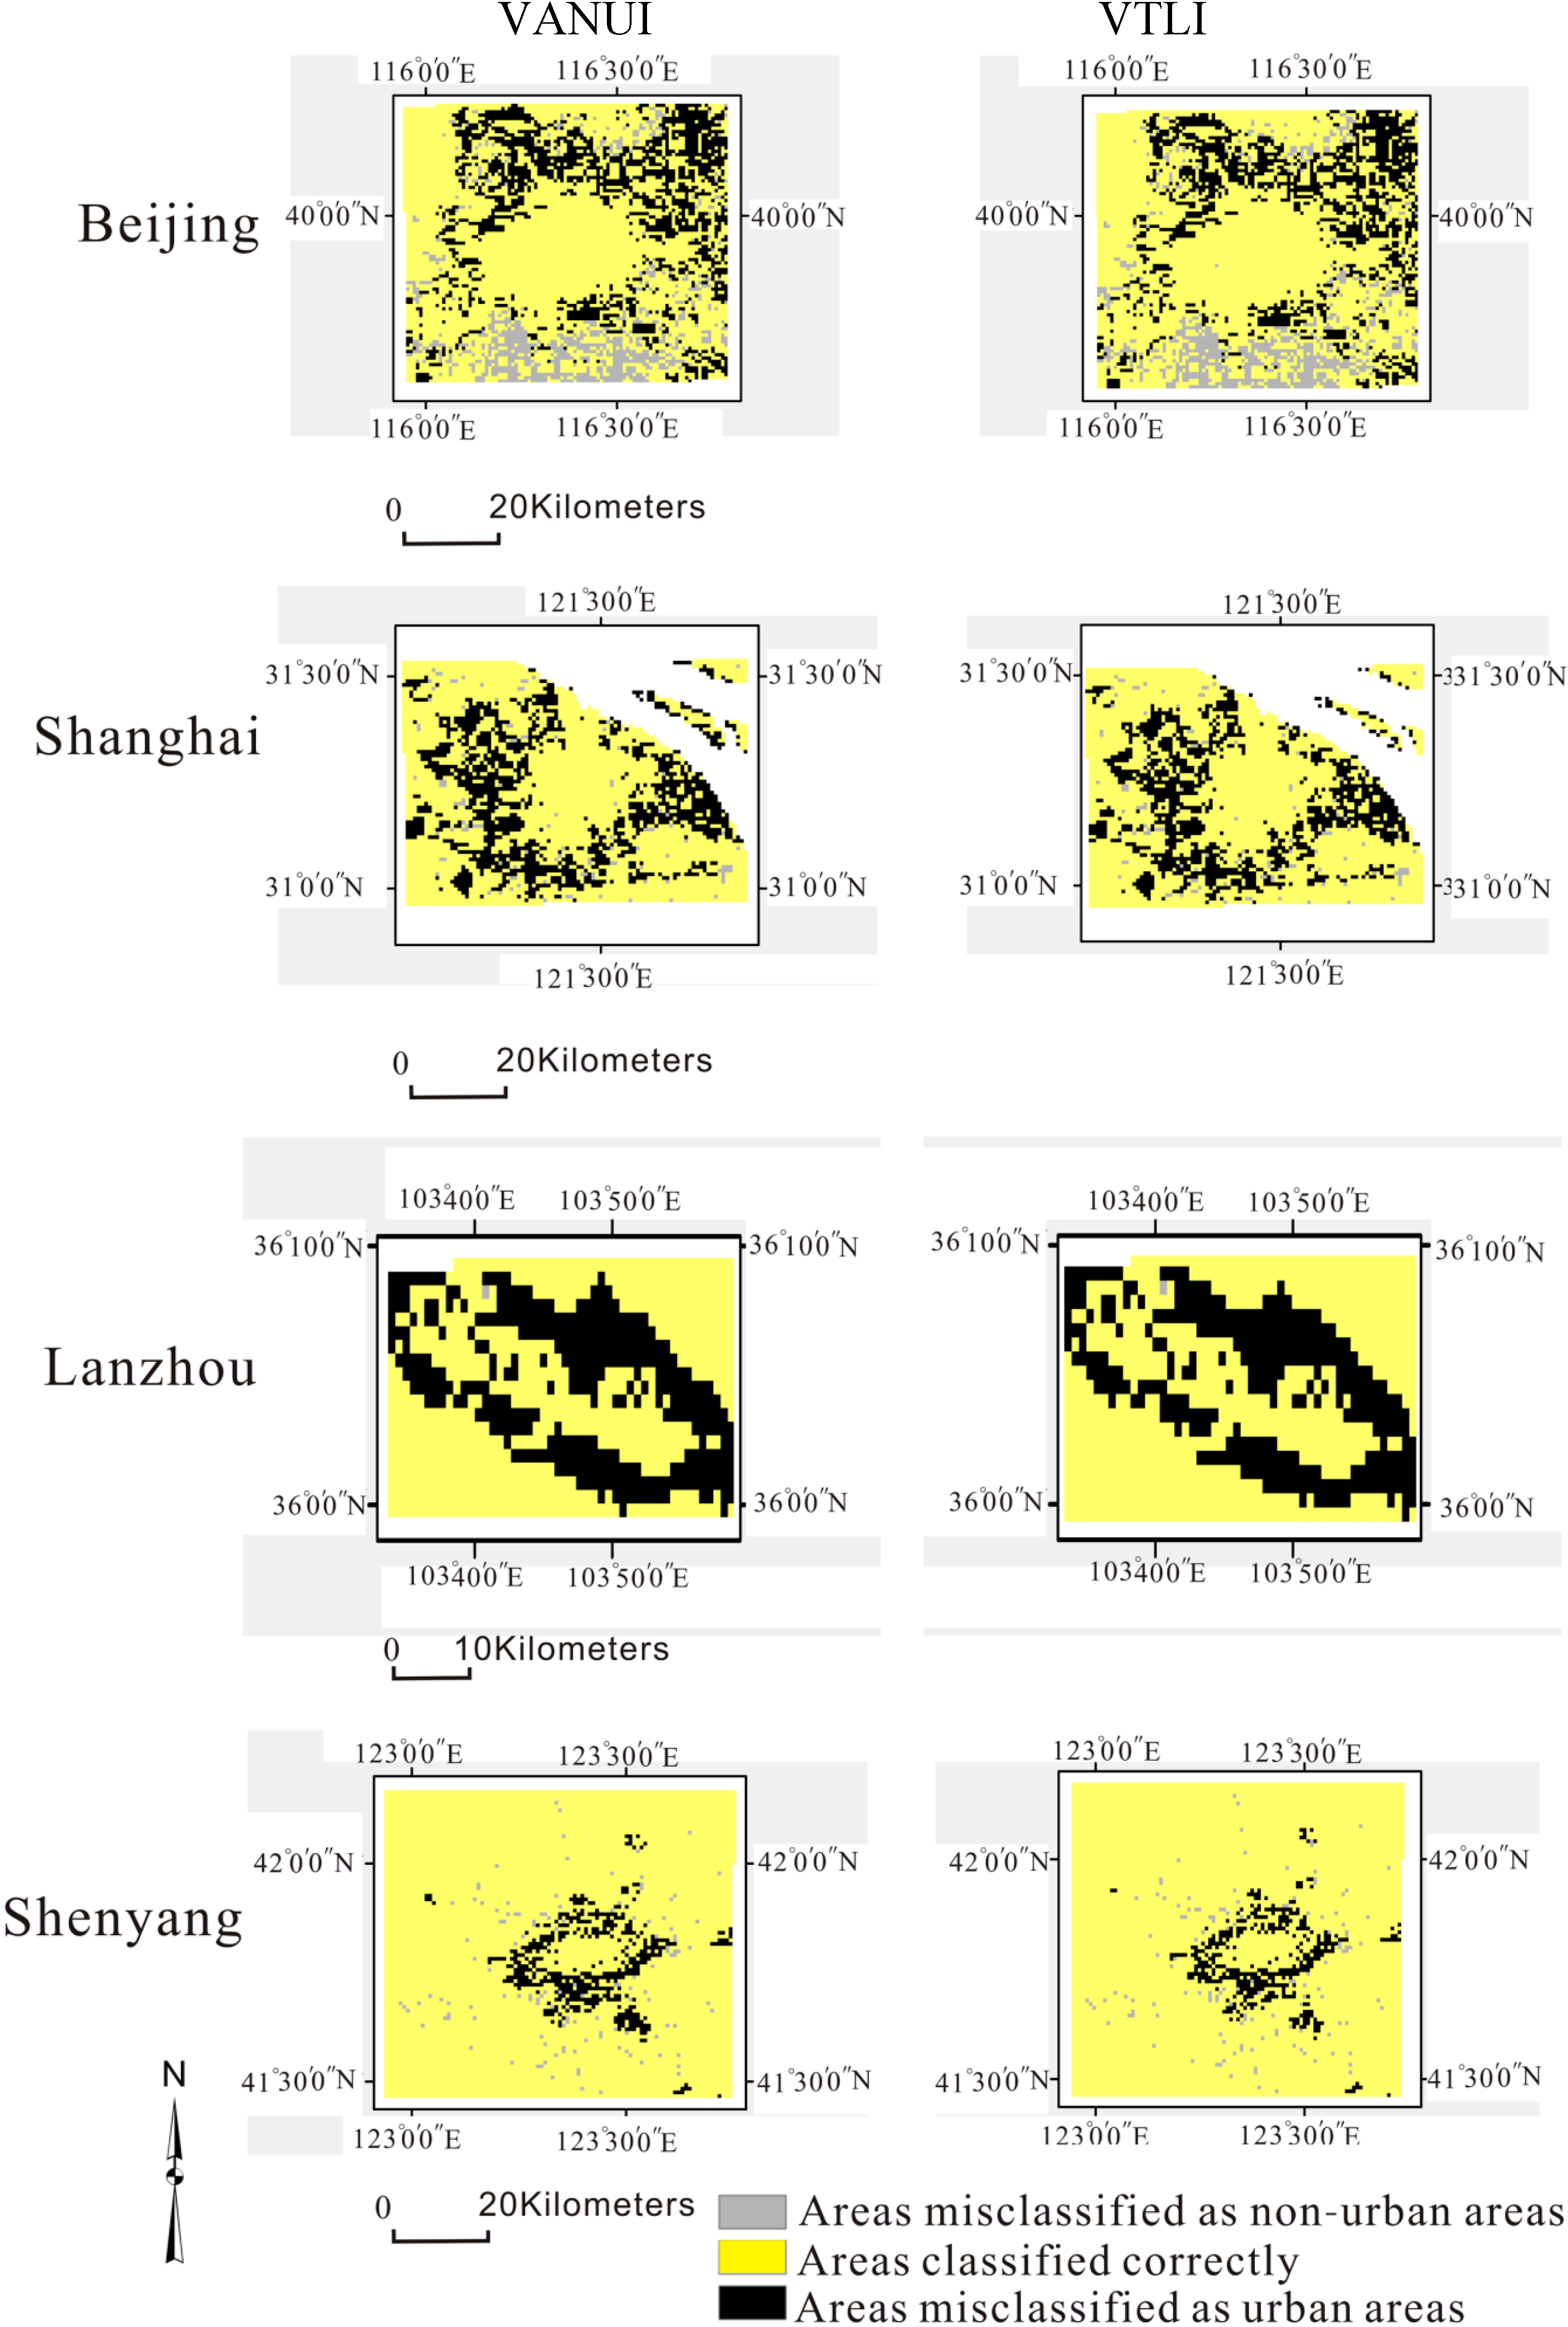
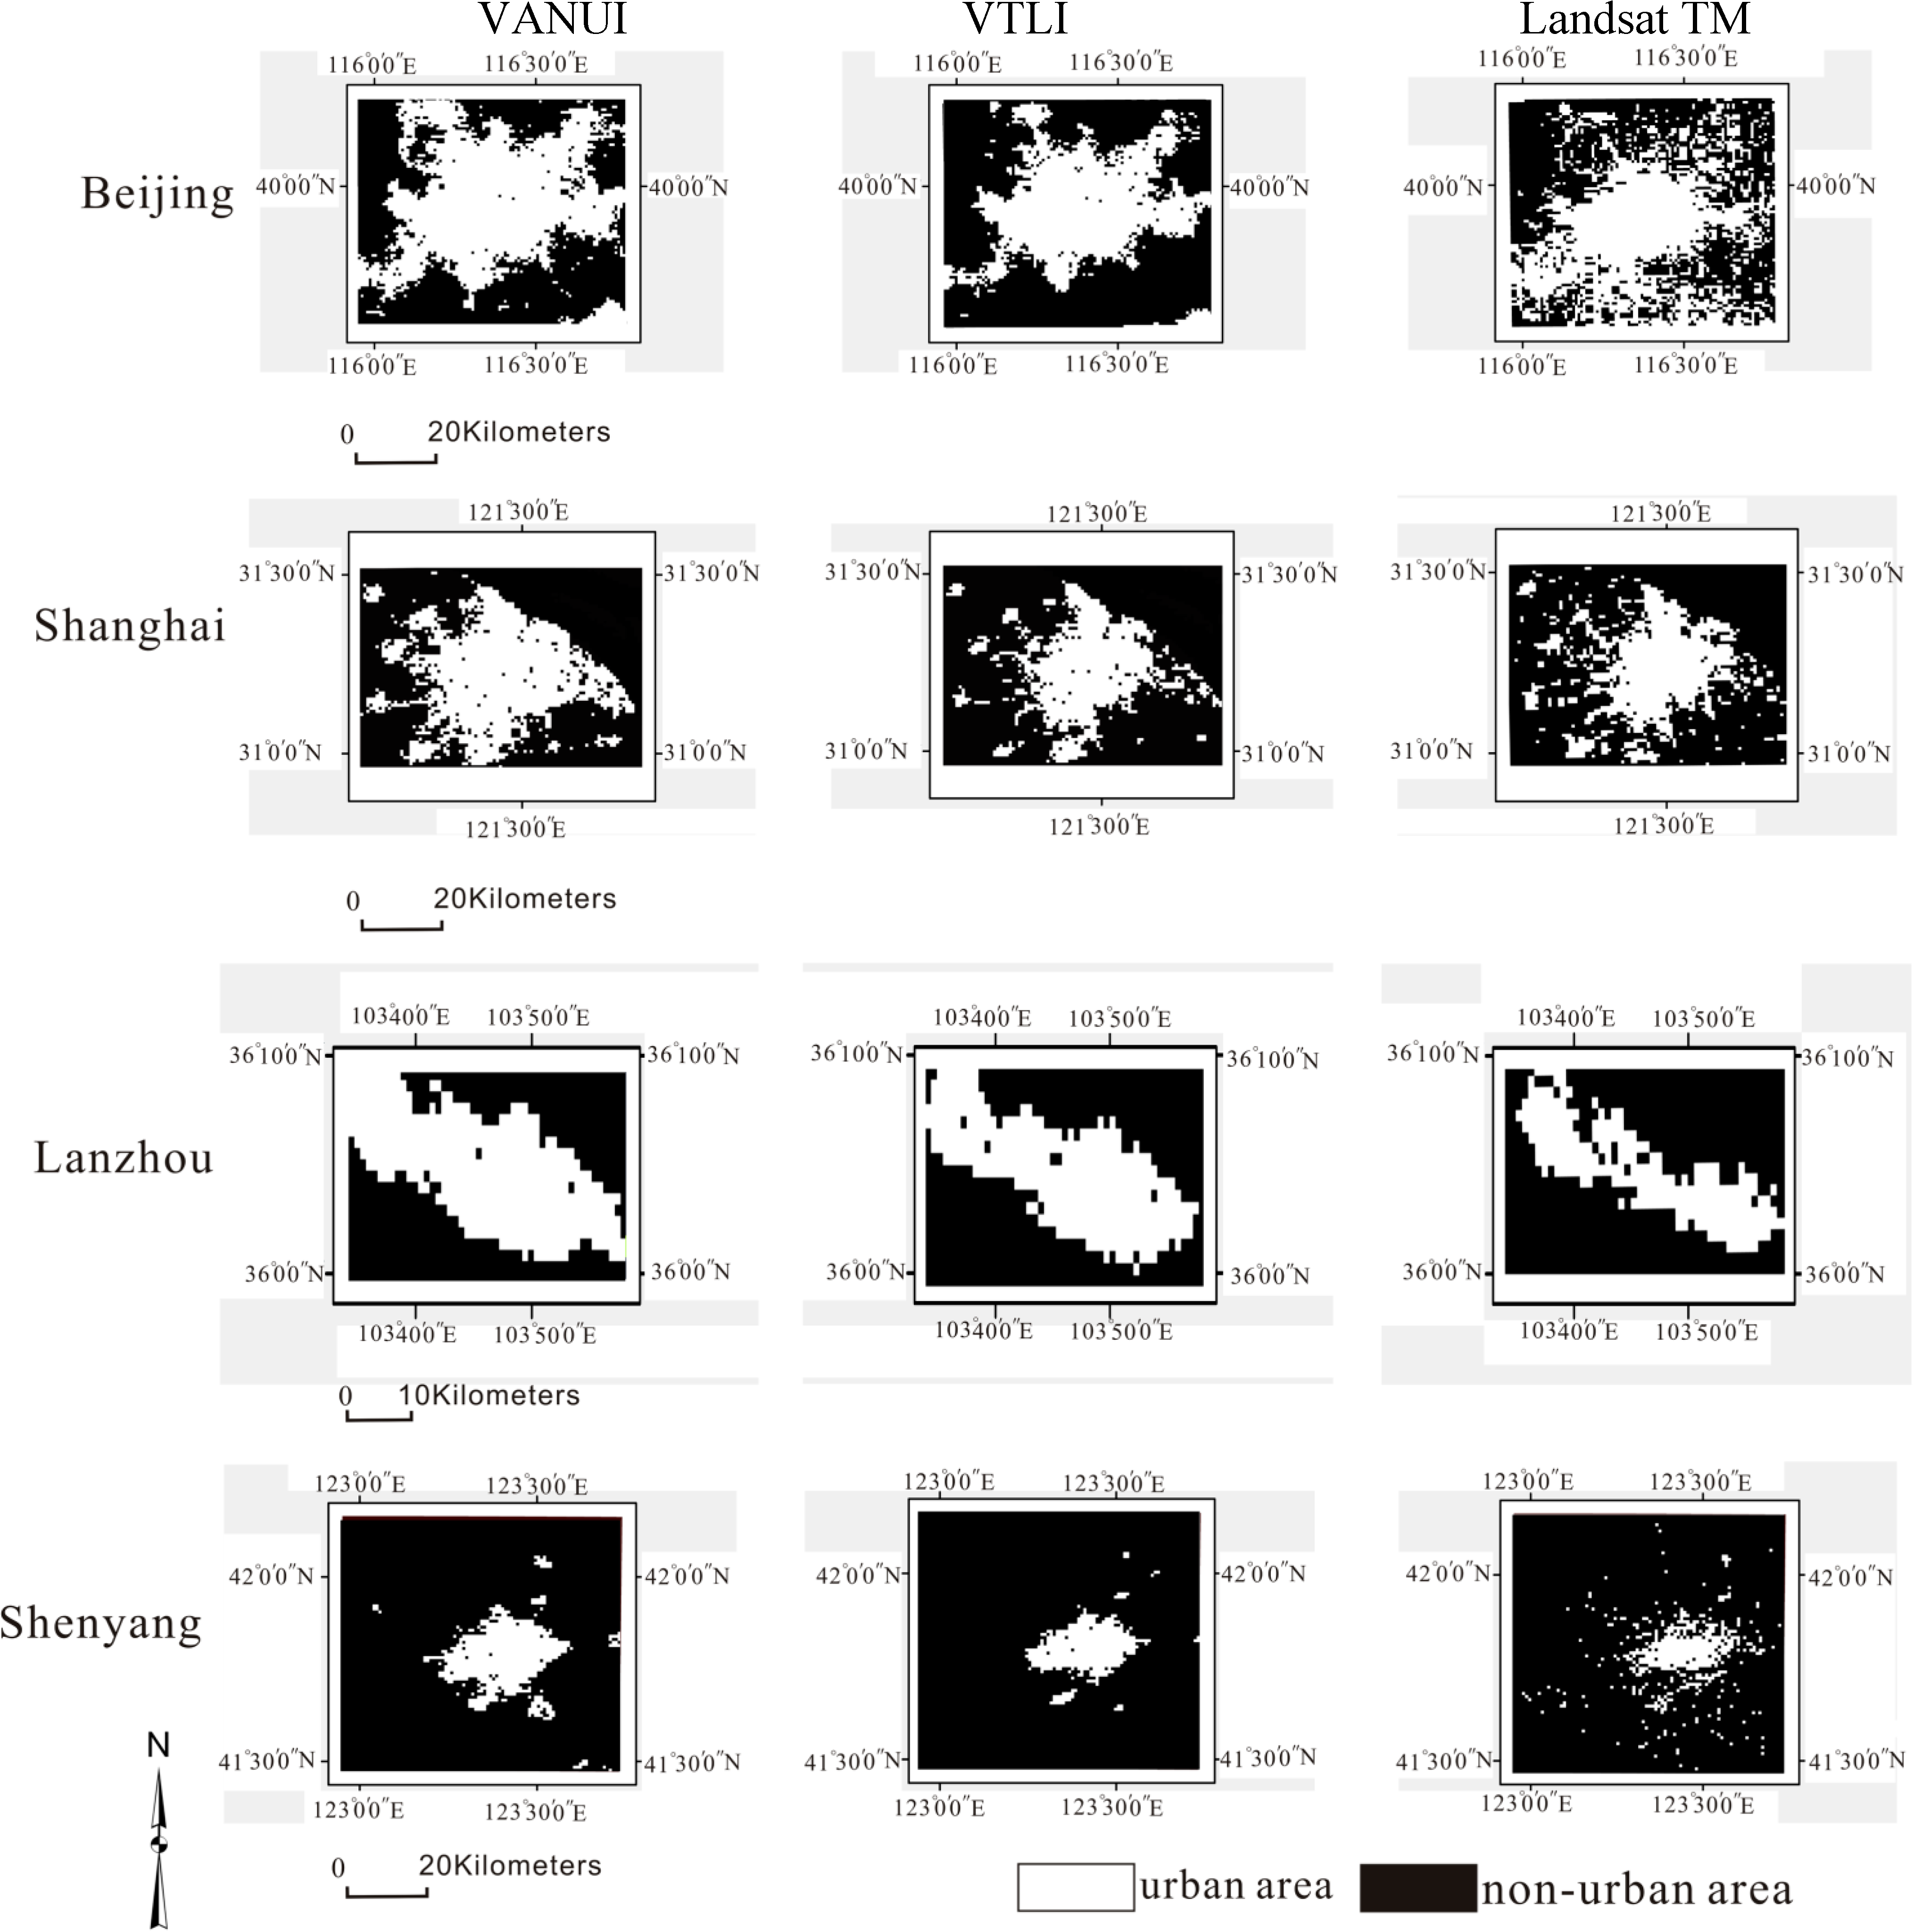
3.4. Applications of the Three Indices in Extracting the Urban Areas

We obtained the urban areas by increasing the threshold of the indices. The results of the matching degrees with the Landsat TM images were shown in Table 2. At the threshold of 20%, the pixel counts of VAUNI and VTLI decrease slowly in all four cities (Figure 5), and they almost reach convergences. We stop increasing the threshold at 20% because the matching degrees begin to drop in Beijing, Shanghai, and Shenyang. In terms of kappa coefficients and overall accuracies (OAs), VTLI has the best consistency with the urban area from Landsat TM images in the four cities (Beijing: kappa = 0.410, OA = 70.8%; Shanghai: kappa = 0.718, OA = 83.4%; Lanzhou: kappa = 0.483, OA = 78.1%; Shenyang: kappa = 0.623, OA = 95.2%). The highest matching degrees of VTLI are acquired at lower thresholds than VANUI, indicating many non-urban pixels are effectively filtered out (Figure 5). Besides, the lower threshold means that it is easier to obtain the optimum threshold for VTLI. Therefore, VTLI is more sensitive and robust to extract urban areas than VANUI. The urban areas are extracted at the respective optimum thresholds in accord with the highest matching degrees (*) in the four cities (Figure 6). VAUNI and VTLI also omit some small urban patches around the urban centers in Beijing, Shanghai, and Shenyang. Compared with the urban areas from Landsat TM image, the ones (Figure 6) extracted by VANUI greatly magnify the true urban areas of the four cities, while VTLI presents the almost true urban area. In addition, an examination of areas where disagreement occurred was shown in Figure 7 and the difference between the two indices was listed in Table 3. The urban areas which are not classified as the urban areas of VTLI are greater than those of VANUI except Lanzhou where they are the same. In Figure 7, the areas misclassified as non-urban areas are discretely distributed far away from the urban centers in Shanghai and Shenyang, while they tend to be agglomerated in the south of Beijing. On the other hand, the areas misclassified as urban areas of VTLI are much smaller than those of VANUI in the four cities (Table 3). Most of the areas misclassified as urban areas are distributed around the urban areas (Figure 7), which may be caused by the arbitrary nature of assigning a threshold. The difference of classification error between VTLI and VANUI is mainly in the category of areas which are misclassified as urban areas, and VANUI overestimates the urban areas greatly.
Figure 6. The urban areas from Landsat TM images and those extracted from VANUI and VTLI at the respective optimum thresholds for Beijing (10%), Shanghai (15%), Lanzhou (20%), and Shenyang (15%), respectively.
Remotesensing 07 01422 g006
Figure 7. The spatial comparison of urban areas in Landsat TM with those extracted by VANUI and VTLI in four cities at the optimum thresholds of 10% for Beijing, 15% for Shanghai, 20% for Lanzhou, and 15% for Shenyang, respectively.
Remotesensing 07 01422 g007
Table 3. The difference of classification between VTLI and VANUI in the four cities (areas of VTLI minus those of VANUI in the corresponding category).
CityArea (km2)
Areas Misclassified as Non-Urban AreasAreas Classified CorrectlyAreas Misclassified as Urban Areas
Beijing5371−124
Shanghai557−106
Lanzhou025−25
Shenyang756−63

4. Discussion

Although DMSP-OLS nighttime light has been used to study urbanization for years [20,49,50,51], up until now, there have been no robust methods to reduce the saturation and blooming effects of DMSP-OLS light. Even if HSI and VANUI (Equations (1) and (2), respectively) increased the variation of DMSP-OLS light, the improvements were limited. In Equation (7) [40], the NDVImax is the maximal NDVI during April and October and OLSnor is the normalized DN value of DMSP-OLS light. In Equation (8) [41], the NTL is the DN value of DMSP-OLS light, and the NDVI is the annual average value.
H S I = ( 1 N D V I max ) + O L S n o r ( 1 O L S n o r ) + N D V I max + O L S n o r × N D V I max
V A N U I = ( 1 N D V I ) × N T L
In this study, VTLI has effectively weakened the saturation and blooming effects of DMSP-OLS light in rapid urbanized cities. The standard deviation graph (Figure 4) shows that VTLI has potential for increasing inter-urban variability, especially in the urban centers. Moreover, it is better at extracting urban areas. The inter-urban variability characterized by VANUI only depends on the NDVI range in the city, as is shown in Equation (8). However, vegetation coverage is very low in some urban-rural junctions, so the role of NDVI in reducing light saturation is small in these places. In VTLI, the temperature factor strengthens the difference between urban and non-urban areas in nighttime data due to a temperature gradient between urban and rural areas. Vegetation cover, vegetation composition, and vegetation configuration together affect the temperature of urban heat islands. For such cities as semiarid Lanzhou, the effect of VANUI is not obvious because vegetation mainly lives on artificial irrigation in most of the arid and semi-arid areas, which results in more vegetation in urban areas instead. Nevertheless, the night temperature in the desert of non-urban areas is much lower than that of urban areas, so VTLI is also suitable for cities in arid and semi-arid areas. Compared with urban areas in Landsat TM images, many of the small urban patches far from the urban centers cannot be obtained through VTLI and some areas around the urban areas are also misclassified. When examining areas where disagreement occurred, the difference between VTLI and VANUI was small and the advantage of VTLI was not remarkable. There are two reasons behind that result. First, with the resolution of 1 km, DMSP-OLS light is too rough to detect small urban patches, and this is to say, DMSP-OLS light is much more appropriate to reflect urban information on a large scale. Second, the method of assigning a threshold maybe the other source of problem. The misclassified areas vary among four cities, e.g., the areas misclassified as non-urban areas are more concentrated in Beijing than other three cities. This may be explained by the imbalance of economic level among cities and VTLI may still suffer somewhat from the blooming effect.
The applications of DMSP-OLS light, VANUI, and VTLI are summarized as follows. Firstly, with the mutation points of the standard deviation representing the transition of urban and non-urban areas (Figure 4), urban areas may be extracted by setting threshold according to the mutation points of standard deviation. Secondly, VANUI and VTLI can effectively reduce saturation and increase variation in nighttime luminosity, but for cities that have experienced significant growth over a relatively short time span with similar NDVI, VTLI is superior to the former in detecting the inter-urban variability. For many researchers who studied urban dynamics using DMSP-OLS nighttime light [52,53,54], it would be more accurate to take advantage of the VTLI index because it effectively reduces the saturation and blooming effects. Thirdly, the spatial distribution of the standard deviation from VTLI reflects the urban form to some extent (Figure 3). Urban form is one of the most important indicators to identify urban ecological effects [24,55,56] or evaluate urban sprawl. As Figure 2 shows, the value of VTLI in the urban center is higher. Thus, the driving force factors behind urbanization may be analyzed corresponding to urban spatial pattern. It is also useful for policy makers to allocate social resources and formulate policies.
In spite of its superiorities, VTLI still has its drawbacks. The Urban Heat Island (UHI) depends on the time, season, latitude, climate zones and other factors. The maximum of night temperature throughout the year was calculated in this study. After being compared with the median and minimum night temperature, the effect of the maximum can be best captured. However, the mechanism influencing the temperature is very complex, and it is related to anthropogenic heat emissions, building shapes, building materials, and underlying surface properties. How these factors affect the results requires further investigation. In addition, DMSP-OLS nighttime light is related to many factors, including socio-economic, geographical, and natural environmental factors. VTLI has not yet assimilated these socio-economic and geographical factors.

5. Conclusions

DMSP-OLS nighttime light was demonstrated to be an indicator of human activities, so it has been used to map urbanization dynamics and spatialize social economic data. The saturation and blooming effects of DMSP-OLS light are two large obstacles to achieve the aim. In this study, the new index VTLI, which integrates DMSP-OLS light, NDVI, and temperature datasets, was proposed. It could enhance the variation and difference between non-urban areas and urban areas of DMSP-OLS light.
Without losing the spatial information of DMSP-OLS light data, the high value (30%–100%) range of VTLI was more concentrated in the urban centers. The discontinuously patchy distribution of VTLI is closer to actual urban patterns. The standard deviation was used to represent the variation of indices. In the urban center and the junction between urban area and non-urban area, the higher standard deviation of VTLI showed its ability of enhancing the variation of DMSP-OLS light data. Compared with VANUI, VTIL reached the convergence fastest. In the value range of 0–20% in four cities, the pixel counts dropped sharply and decreased slowly afterwards, indicating the threshold belonged to this range. The highest accuracies of extracting urban areas were obtained by VTLI and the optimum thresholds were 10% for Beijing, 15% for Shanghai, 20% for Lanzhou, and 15% for Shenyang, respectively. Though some small patches far from urban centers were not identified correctly, the higher temporal resolution and coarser spatial resolution made VTLI an ideal alternative tool for extracting large scale urban information. Furthermore, as the four cities have different climate and social economic characters, VTLI may be applicable to other regions with rapid urbanization.
Currently, the saturation and blooming effects of DMSP-OLS light are still not well solved, and we believe that, with the simplicity and feasibility of VTLI, it can be widely used in the studies and practices of urban planning, urban ecology, and urban sustainability on a large scale.

Acknowledgments

This study was supported by Fund for Creative Research Groups of National Natural Science Foundation of China (No. 41321001), the Program of Introducing Talents of Discipline to Universities (Grant No. B08008), and the Project of State Key Laboratory of Earth Surface Processes and Resources Ecology. The authors would like to thank the reviewers for their helpful and valuable comments to improve the manuscript.

Author Contributions

Ruifang Hao and Deyong Yu conceived and designed the paper. Ruifang Hao mainly analyzed the data and wrote the paper. Deyong Yu designed and revised the paper. Additionally, the other co-authors helped process partial data for this paper.

Conflicts of Interest

The authors declare no conflict of interest.

References

  1. Yu, D.; Shao, H.; Shi, P.; Zhu, W.; Pan, Y. How does the conversion of land cover to urban use affect net primary productivity? A case study in Shenzhen city, China. Agr. Forest Meteorol. 2009, 149, 2054–2060. [Google Scholar] [CrossRef]
  2. Seto, K.C.; Fragkias, M. Quantifying spatiotemporal patterns of urban land-use change in four cities of China with time series landscape metrics. Landscape Ecol. 2005, 20, 871–888. [Google Scholar] [CrossRef]
  3. Wu, J.; Jenerette, G.D.; Buyantuyev, A.; Redman, C.L. Quantifying spatiotemporal patterns of urbanization: The case of the two fastest growing metropolitan regions in the United States. Ecol. Complex. 2011, 8, 1–8. [Google Scholar] [CrossRef]
  4. Shen, W.; Wu, J.; Grimm, N.B.; Hope, D. Effects of urbanization-induced environmental changes on ecosystem functioning in the phoenix metropolitan region, USA. Ecosystems 2008, 11, 138–155. [Google Scholar] [CrossRef]
  5. Yu, D.; Xun, B.; Shi, P.; Shao, H.; Liu, Y. Ecological restoration planning based on connectivity in an urban area. Ecol. Eng. 2012, 46, 24–33. [Google Scholar] [CrossRef]
  6. Yu, D.; Jiang, Y.; Kang, M.; Tian, Y.; Duan, J. Integrated urban land-use planning based on improving ecosystem service: Panyu case, in a typical developed area of China. J. Urban Plan. Develop. 2010, 137, 448–458. [Google Scholar] [CrossRef]
  7. Xu, C.; Liu, M.; Zhang, C.; An, S.; Yu, W.; Chen, J.M. The spatiotemporal dynamics of rapid urban growth in the Nanjing metropolitan region of China. Landscape Ecol. 2007, 22, 925–937. [Google Scholar] [CrossRef]
  8. Matsuoka, M.; Hayasaka, T.; Fukushima, Y.; Honda, Y. Land cover in east Asia classified using terra MODIS and DMSP OLS products. Int. J. Remote Sens. 2007, 28, 221–248. [Google Scholar] [CrossRef]
  9. Ziskin, D.; Baugh, K.; Hsu, F.C.; Ghosh, T.; Elvidge, C. Methods Used for the 2006 Radiance Lights. Available online: http://journals.sfu.ca/apan/index.php/apan/article/view/88/pdf_43 (accessed on 25 October 2014).
  10. Elvidge, C.D.; Imhoff, M.L.; Baugh, K.E.; Hobson, V.R.; Nelson, I.; Safran, J.; Dietz, J.B.; Tuttle, B.T. Night-time lights of the world: 1994–1995. ISPRS J. Photogramm. Remote Sens. 2001, 56, 81–99. [Google Scholar] [CrossRef]
  11. Liu, Z.; He, C.; Zhang, Q.; Huang, Q.; Yang, Y. Extracting the dynamics of urban expansion in China using DMSP-OLS nighttime light data from 1992 to 2008. Landscape Urban Plan. 2012, 106, 62–72. [Google Scholar] [CrossRef]
  12. Imhoff, M.L.; Tucker, C.J.; Lawrence, W.T.; Stutzer, D.C. The use of multisource satellite and geospatial data to study the effect of urbanization on primary productivity in the United States. IEEE Trans. Geosci. Remote Sens. 2000, 38, 2549–2556. [Google Scholar] [CrossRef]
  13. Sutton, P.C. A scale-adjusted measure of “urban sprawl” using nighttime satellite imagery. Remote Sens. Environ. 2003, 86, 353–369. [Google Scholar] [CrossRef]
  14. Zeng, C.; Zhou, Y.; Wang, S.; Yan, F.; Zhao, Q. Population spatialization in China based on night-time imagery and land use data. Int. J. Remote Sens. 2011, 32, 9599–9620. [Google Scholar] [CrossRef]
  15. Fan, J.; Ma, T.; Zhou, C.; Zhou, Y. A new approach to the application of DMSP/OLS nighttime light data to urbanization assessment. In Proceedings of 2012 IEEE International Geoscience and Remote Sensing Symposium (IGARSS), Munich, Germany, 22–27 July 2012; pp. 6983–6986.
  16. Lo, C. Urban indicators of China from radiance-calibrated digital DMSP-OLS nighttime images. Ann. Assoc. Am. Geogr. 2002, 92, 225–240. [Google Scholar] [CrossRef]
  17. Small, C.; Elvidge, C.D. Night on earth: Mapping decadal changes of anthropogenic night light in Asia. Int. J. Appl. Earth Obs. Geoinf. 2013, 22, 40–52. [Google Scholar] [CrossRef]
  18. Chand, T.K.; Badarinath, K.; Elvidge, C.; Tuttle, B. Spatial characterization of electrical power consumption patterns over India using temporal DMSP-OLS night-time satellite data. Int. J. Remote Sens. 2009, 30, 647–661. [Google Scholar] [CrossRef]
  19. Yao, Y. Correlation of human activities with population and GDP in Chinese cities—Based on the data of DMSP-OLS. Int. J. Econ. Manag. Eng. 2012, 2, 125–128. [Google Scholar]
  20. Imhoff, M.L.; Lawrence, W.T.; Stutzer, D.C.; Elvidge, C.D. A technique for using composite DMSP/OLS “city lights” satellite data to map urban area. Remote Sens. Environ. 1997, 61, 361–370. [Google Scholar] [CrossRef]
  21. Milesi, C.; Elvidge, C.D.; Nemani, R.R.; Running, S.W. Assessing the impact of urban land development on net primary productivity in the southeastern United States. Remote Sens. Environ. 2003, 86, 401–410. [Google Scholar] [CrossRef]
  22. Letu, H.; Hara, M.; Yagi, H.; Naoki, K.; Tana, G.; Nishio, F.; Shuhei, O. Estimating energy consumption from night-time DMPS/OLS imagery after correcting for saturation effects. Int. J. Remote Sens. 2010, 31, 4443–4458. [Google Scholar] [CrossRef]
  23. Small, C.; Pozzi, F.; Elvidge, C.D. Spatial analysis of global urban extent from DMSP-OLS night lights. Remote Sens. Environ. 2005, 96, 277–291. [Google Scholar] [CrossRef]
  24. Elvidge, C.D.; Safran, J.; Tuttle, B.; Sutton, P.; Cinzano, P.; Pettit, D.; Arvesen, J.; Small, C. Potential for global mapping of development via a nightsat mission. GeoJournal 2007, 69, 45–53. [Google Scholar] [CrossRef]
  25. He, C.; Ma, Q.; Li, T.; Yang, Y.; Liu, Z. Spatiotemporal dynamics of electric power consumption in Chinese mainland from 1995 to 2008 modeled using DMSP/OLS stable nighttime lights data. J. Geogr. Sci. 2012, 22, 125–136. [Google Scholar] [CrossRef]
  26. Wang, W.; Cheng, H.; Zhang, L. Poverty assessment using DMSP/OLS night-time light satellite imagery at a provincial scale in China. Adv. Space Res. 2012, 49, 1253–1264. [Google Scholar] [CrossRef]
  27. Anderson, S.J.; Tuttle, B.T.; Powell, R.L.; Sutton, P.C. Characterizing relationships between population density and nighttime imagery for Denver, Colorado: Issues of scale and representation. Int. J. Remote Sens. 2010, 31, 5733–5746. [Google Scholar] [CrossRef]
  28. Roychowdhury, K.; Jones, S.; Arrowsmith, C. Assessing the utility of DMSP/OLS night-time images for characterizing Indian urbanization. In Proceedings of Urban Remote Sensing Event, Shanghai, China, 20–22 May 2009; pp. 1–7.
  29. He, C.; Shi, P.; Li, J.; Chen, J.; Pan, Y.; Li, J.; Zhuo, L.; Ichinose, T. Restoring urbanization process in China in the 1990s by using non-radiance-calibrated DMSP/OLS nighttime light imagery and statistical data. Chin. Sci. Bull. 2006, 51, 1614–1620. [Google Scholar] [CrossRef]
  30. Roy Chowdhury, P.K.; Maithani, S.; Dadhwal, V.K. Estimation of urban population in Indo-Gangetic Plains using night-time OLS data. Int. J. Remote Sens. 2012, 33, 2498–2515. [Google Scholar]
  31. Guldmann, J.M. Analytical strategies for estimating suppressed and missing data in large regional and local employment, population, and transportation databases. WIREs Data Min. Knowl. 2013, 3, 280–289. [Google Scholar] [CrossRef]
  32. Li, X.; Ge, L.; Chen, X. Detecting Zimbabwe’s decadal economic decline using nighttime light imagery. Remote Sens. 2013, 5, 4551–4570. [Google Scholar] [CrossRef]
  33. Doll, C.H.; Muller, J.-P.; Elvidge, C.D. Night-time imagery as a tool for global mapping of socioeconomic parameters and greenhouse gas emissions. AMBIO 2000, 29, 157–162. [Google Scholar]
  34. Doll, C.N.; Pachauri, S. Estimating rural populations without access to electricity in developing countries through night-time light satellite imagery. Energ. Policy 2010, 38, 5661–5670. [Google Scholar] [CrossRef]
  35. Jin, X.; Chen, C. Mapping the trend of regional inequality in China from nighttime light data. In Proceedings of 3rd International Conference on Humanities, Geography and Economics (ICHGE’2013), Bali, Indonesia, 4–5 January 2013.
  36. Zhuo, L.; Ichinose, T.; Zheng, J.; Chen, J.; Shi, P.; Li, X. Modeling the population density of China at the pixel level based on DMSP/OLS non-radiance-calibrated night-time light images. Int. J. Remote Sens. 2009, 30, 1003–1018. [Google Scholar] [CrossRef]
  37. Townsend, A.C.; Bruce, D.A. The use of night-time lights satellite imagery as a measure of Australia’s regional electricity consumption and population distribution. Int. J. Remote Sens. 2010, 31, 4459–4480. [Google Scholar] [CrossRef]
  38. Letu, H.; Hara, M.; Tana, G.; Nishio, F. A saturated light correction method for DMSP/OLS nighttime satellite imagery. IEEE Trans. Geosci. Remote Sens. 2012, 50, 389–396. [Google Scholar] [CrossRef]
  39. Letu, H.; Hara, M.; Yagi, H.; Tana, G.; Nishio, F. Estimating the energy consumption with nighttime city light from the DMSP/OLS imagery. In Proceedings of Urban Remote Sensing Event, Shanghai, China, 20–22 May 2009.
  40. Zhang, Q.; Schaaf, C.; Seto, K.C. The vegetation adjusted NTL urban index: A new approach to reduce saturation and increase variation in nighttime luminosity. Remote Sens. Environ. 2013, 129, 32–41. [Google Scholar] [CrossRef]
  41. Lu, D.; Tian, H.; Zhou, G.; Ge, H. Regional mapping of human settlements in southeastern China with multisensor remotely sensed data. Remote Sens. Environ. 2008, 112, 3668–3679. [Google Scholar] [CrossRef]
  42. Ma, L.; Wu, J.; Li, W.; Peng, J.; Liu, H. Evaluating saturation correction methods for DMSP/OLS nighttime light data: A case study from China’s cities. Remote Sens. 2014, 6, 9853–9872. [Google Scholar] [CrossRef] [Green Version]
  43. Shanghai Statistical Yearbook. Available online: http://sysinet.gov.cn/ (accessed on 19 October 2014).
  44. National Oceanic and Atmospheric Administration/National Geophysical Data Center (NOAA/NGDC) Earth Observation Group. Available online: http://ngdc.noaa.gov/eog/ (accessed on 19 October 2014).
  45. Geospatial Data Cloud. Available online: http://modis.gsfc.nasa.gov /data/ (accessed on 19 October 2014).
  46. Cao, X.; Chen, J.; Imura, H.; Higashi, O. A SVM-based method to extract urban areas from DMSP-OLS and SPOT VGT data. Remote Sens. Environ. 2009, 113, 2205–2209. [Google Scholar] [CrossRef]
  47. Du, Y.; Xie, Z.; Zeng, Y.; Shi, Y.; Wu, J. Impact of urban expansion on regional temperature change in the Yangtze river delta. J. Geogr. Sci. 2007, 17, 387–398. [Google Scholar] [CrossRef]
  48. Li, J.; Song, C.; Cao, L.; Zhu, F.; Meng, X.; Wu, J. Impacts of landscape structure on surface urban heat islands: A case study of Shanghai, China. Remote Sens. Environ. 2011, 115, 3249–3263. [Google Scholar] [CrossRef]
  49. Amaral, S.; Câmara, G.; Monteiro, A.V.; Elvidge, C.D.; Quintanilha, J.A. Nighttime Lights-DMSP Satellite Data as an Indicator of Human Activity in the Brazilian Amazonia: Relations with Population and Electrical Power Consumption. Available online: http://citeseerx.ist.psu.edu/viewdoc/download?doi=10.1.1.2.9753&rep=rep1&type=pdf (accessed 25 October 2014).
  50. He, C.; Li, J.; Chen, J.; Shi, P.; Chen, J.; Pan, Y.; Li, J.; Zhuo, L.; Toshiaki, I. The urbanization process of Bohai rim in the 1990s by using DMSP/OLS data. J. Geogr. Sci. 2006, 16, 174–182. [Google Scholar] [CrossRef]
  51. Sun, R.; Zhang, X.; Wang, W. Urban expansion analysis of the Huang-Huai-Hai plain region by DMSP/OLS nighttime light data. In Proceedings of Urban Remote Sensing Event, Shanghai, China, 20–22 May 2009.
  52. Parés-Ramos, I.K.; Álvarez-Berríos, N.L.; Aide, T.M. Mapping urbanization dynamics in major cities of Colombia, Ecuador, Perú, and Bolivia using night-time satellite imagery. Land 2013, 2, 37–59. [Google Scholar] [CrossRef]
  53. Zhang, Q.; Seto, K.C. Mapping urbanization dynamics at regional and global scales using multi-temporal DMSP/OLS nighttime light data. Remote Sens. Environ. 2011, 115, 2320–2329. [Google Scholar] [CrossRef]
  54. Ma, T.; Zhou, C.; Pei, T.; Haynie, S.; Fan, J. Quantitative estimation of urbanization dynamics using time series of DMSP/OLS nighttime light data: A comparative case study from China’s cities. Remote Sens. Environ. 2012, 124, 99–107. [Google Scholar] [CrossRef]
  55. Tatem, A.J.; Hay, S.I. Measuring urbanization pattern and extent for malaria research: A review of remote sensing approaches. J. Urban Health 2004, 81, 363–376. [Google Scholar] [CrossRef] [PubMed]
  56. Zhang, Q.; Seto, K.C. Can night-time light data identify typologies of urbanization? A global assessment of successes and failures. Remote Sens. 2013, 5, 3476–3494. [Google Scholar] [CrossRef]

Appendix

Figure A1. The standard deviation changes of DMSP-OLS light, VANUI, and VTLI in different directions in Beijing.
Remotesensing 07 01422 g008

