
Remote Sensing of Shrubland Drying in the South-East Mediterranean, 1995–2010: Water-Use-Efficiency-Based Mapping of Biomass Change

Abstract
:
1. Introduction
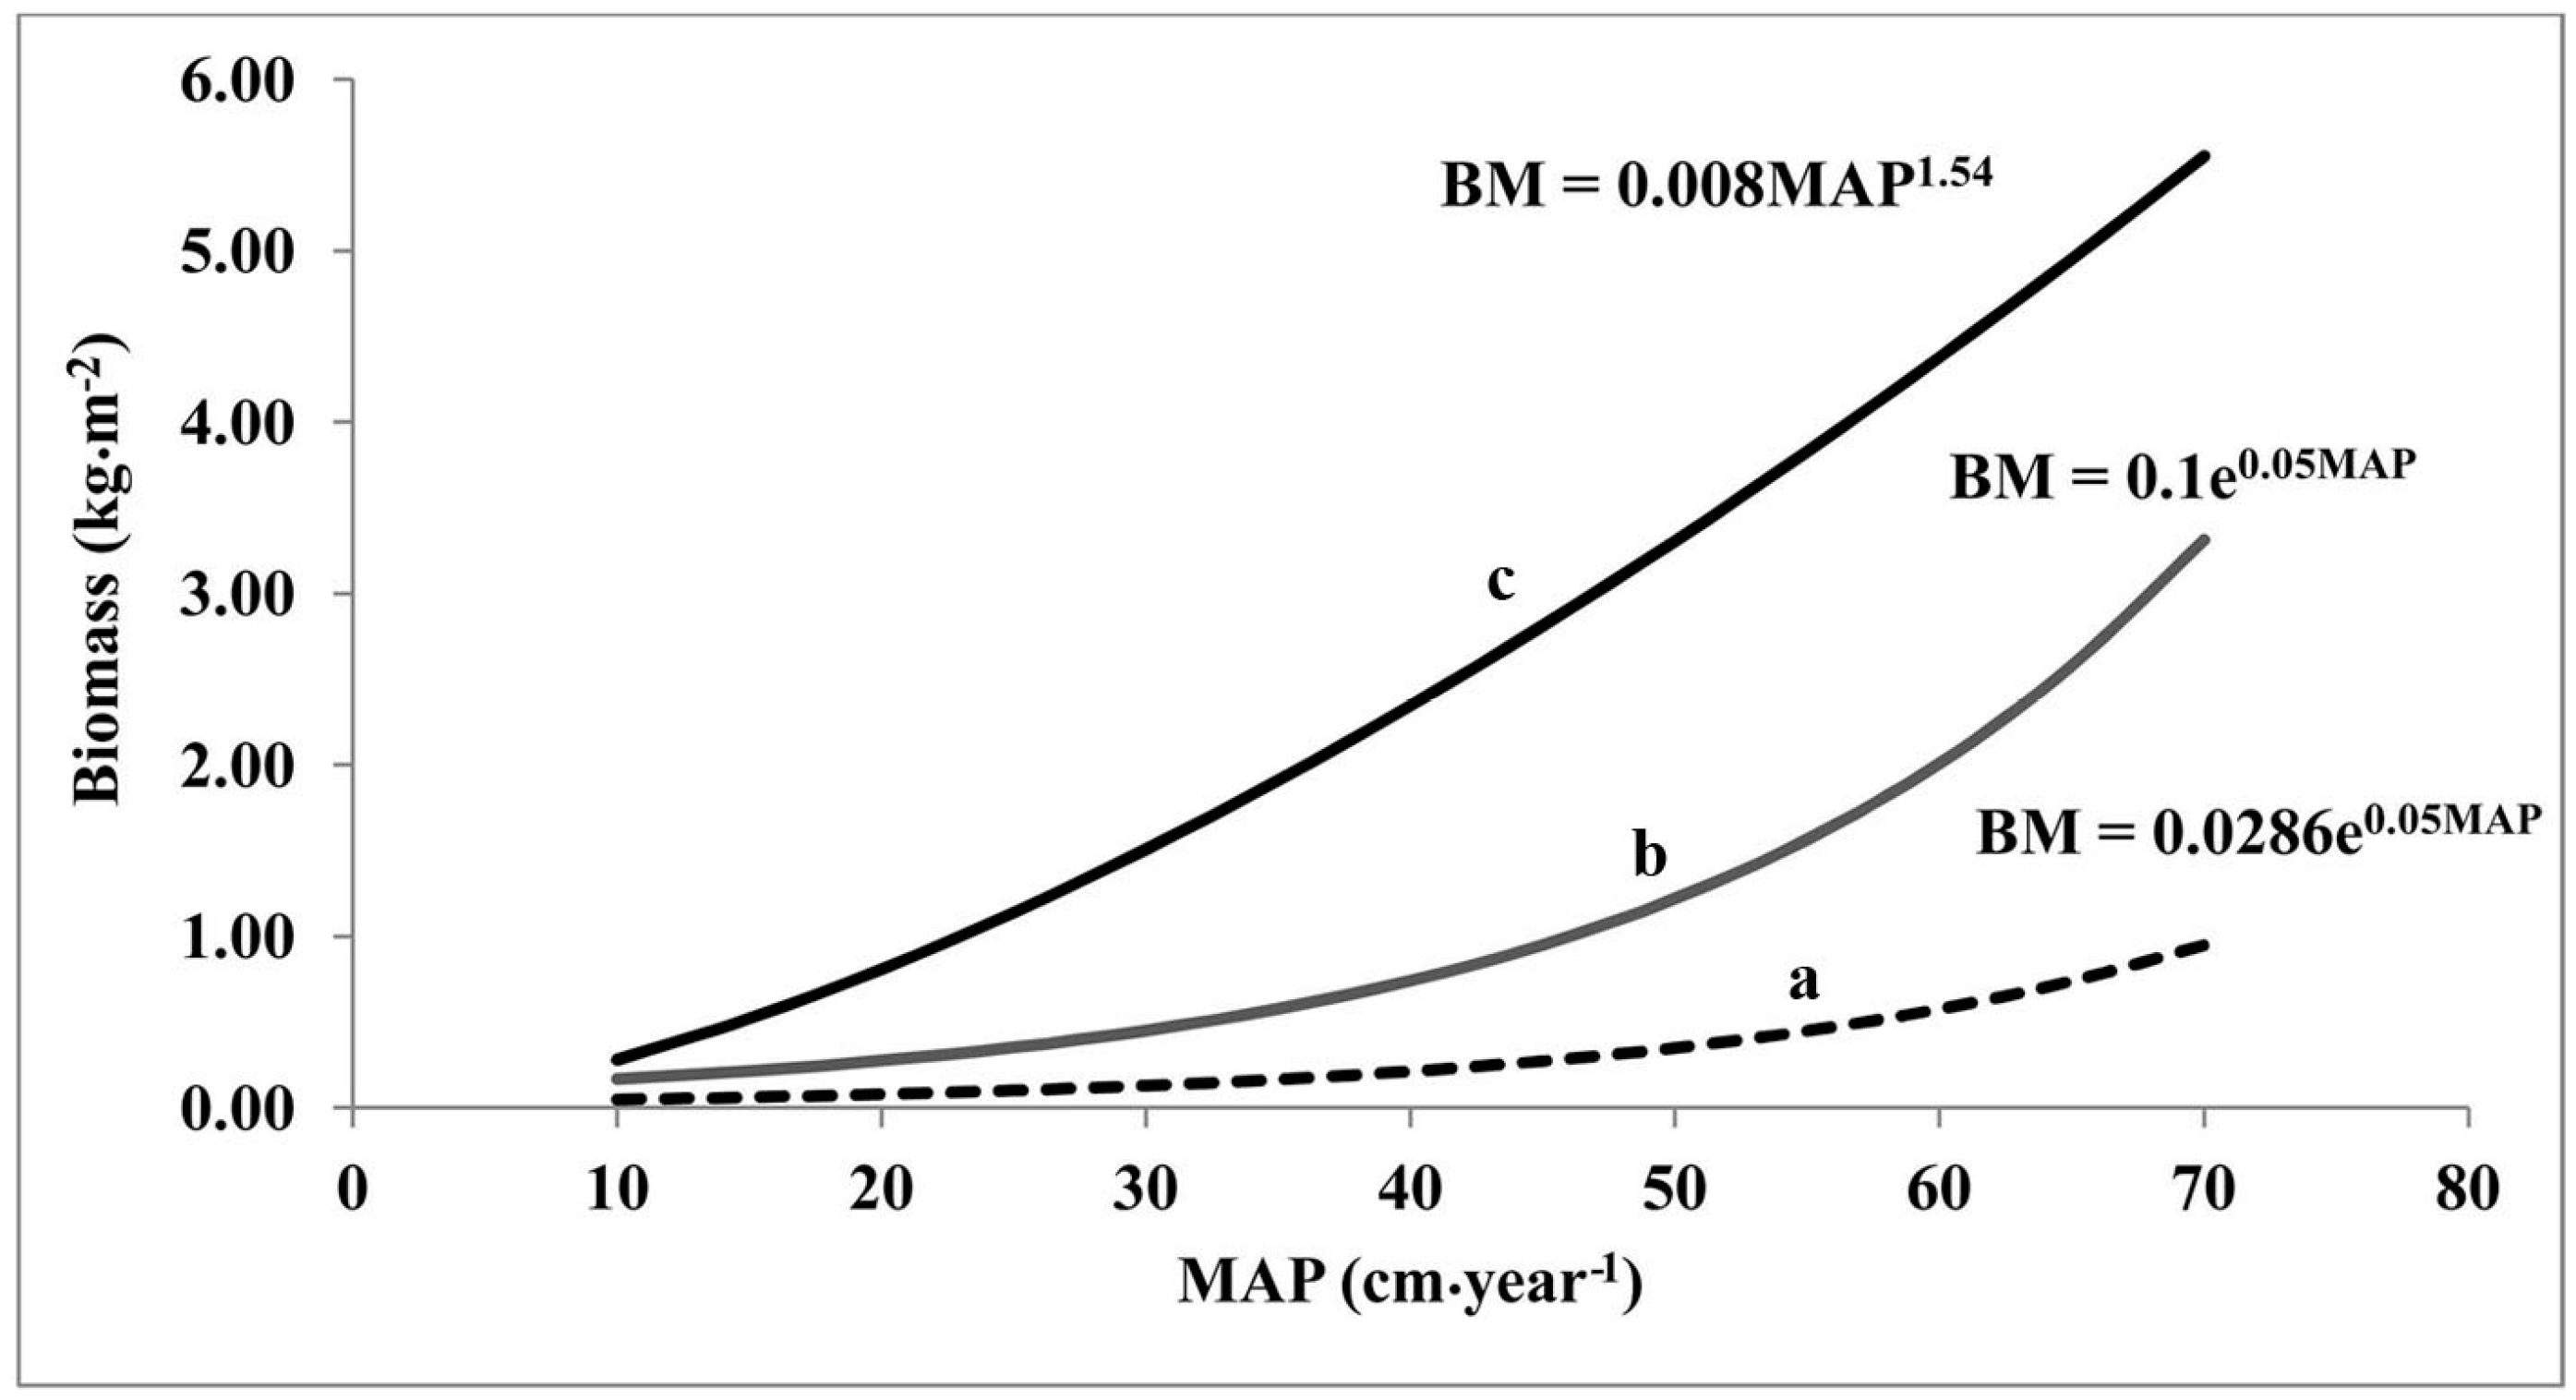
2. Generalizing Biomass versus Mean Annual Precipitation (MAP)
- Extrapolation of data for full shrub coverage from Evenari [15] yielded 0.27 kg/m2 for Artemisia in the Negev Desert, with 8 to 12 cm/yr rainfall.
- Sternberg and Shoshany [16] reported 1 kg/m2 for Sarcoproterium spinosum in the Negev Desert margins, with 25 cm/yr rainfall.
- Sternberg and Shoshany [16] reported 2.27 kg/m2 for Quercus calliprinus in the Judean Highlands, with 45 cm/yr rainfall.
- Saglam et al. [19] reported 5.5 kg/m2 (live biomass) for tall shrubs dominated by the Quercus-Phillyraea alliance and by Q. coccifera in western Turkey (Kesan site), with 65 cm/yr rainfall.

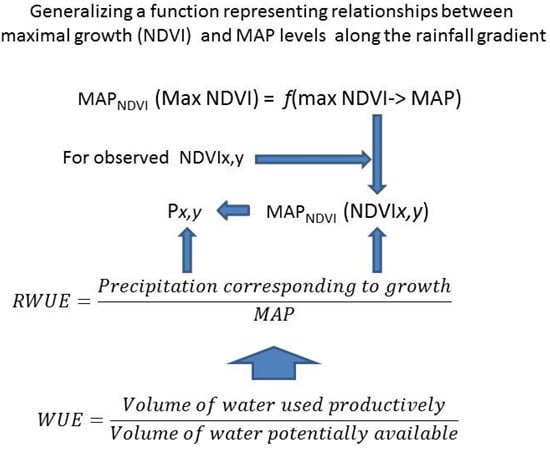
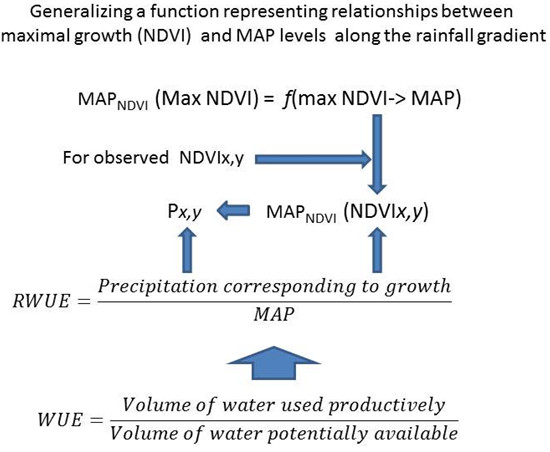
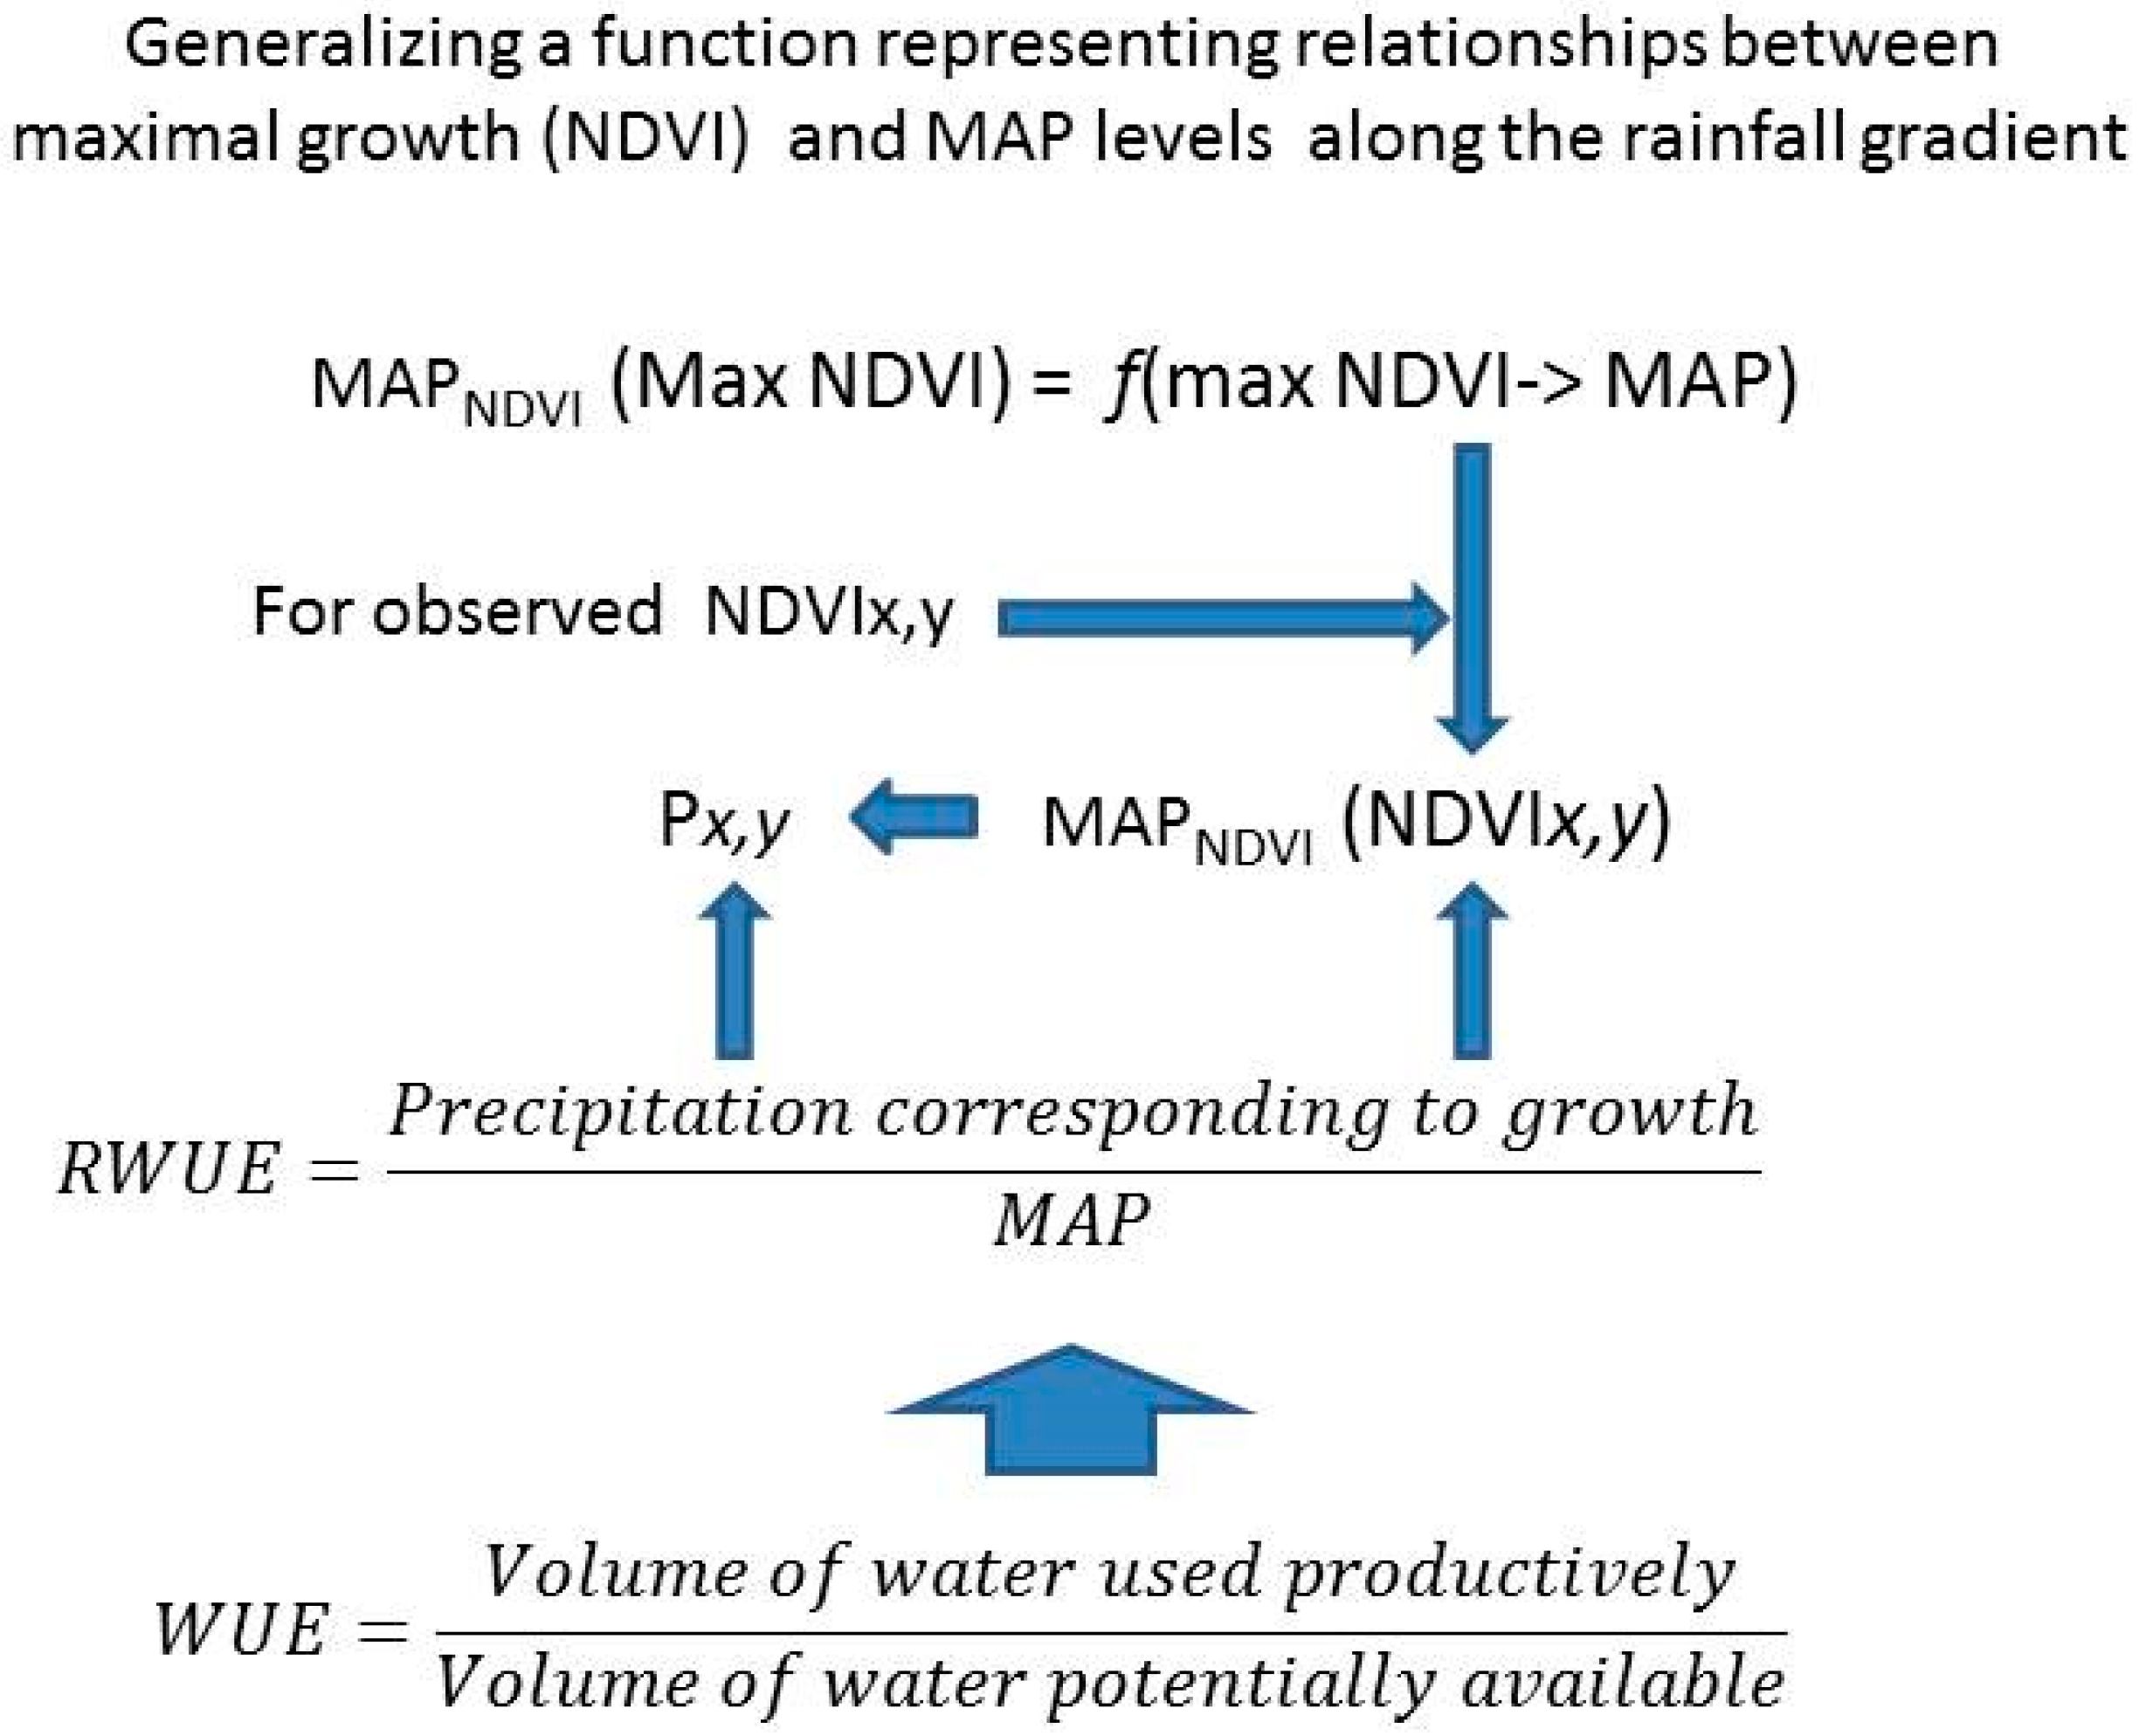
3. Water-Use Efficiency and NDVI

4. Water-Use-Based Estimates of Shrubland Biomass

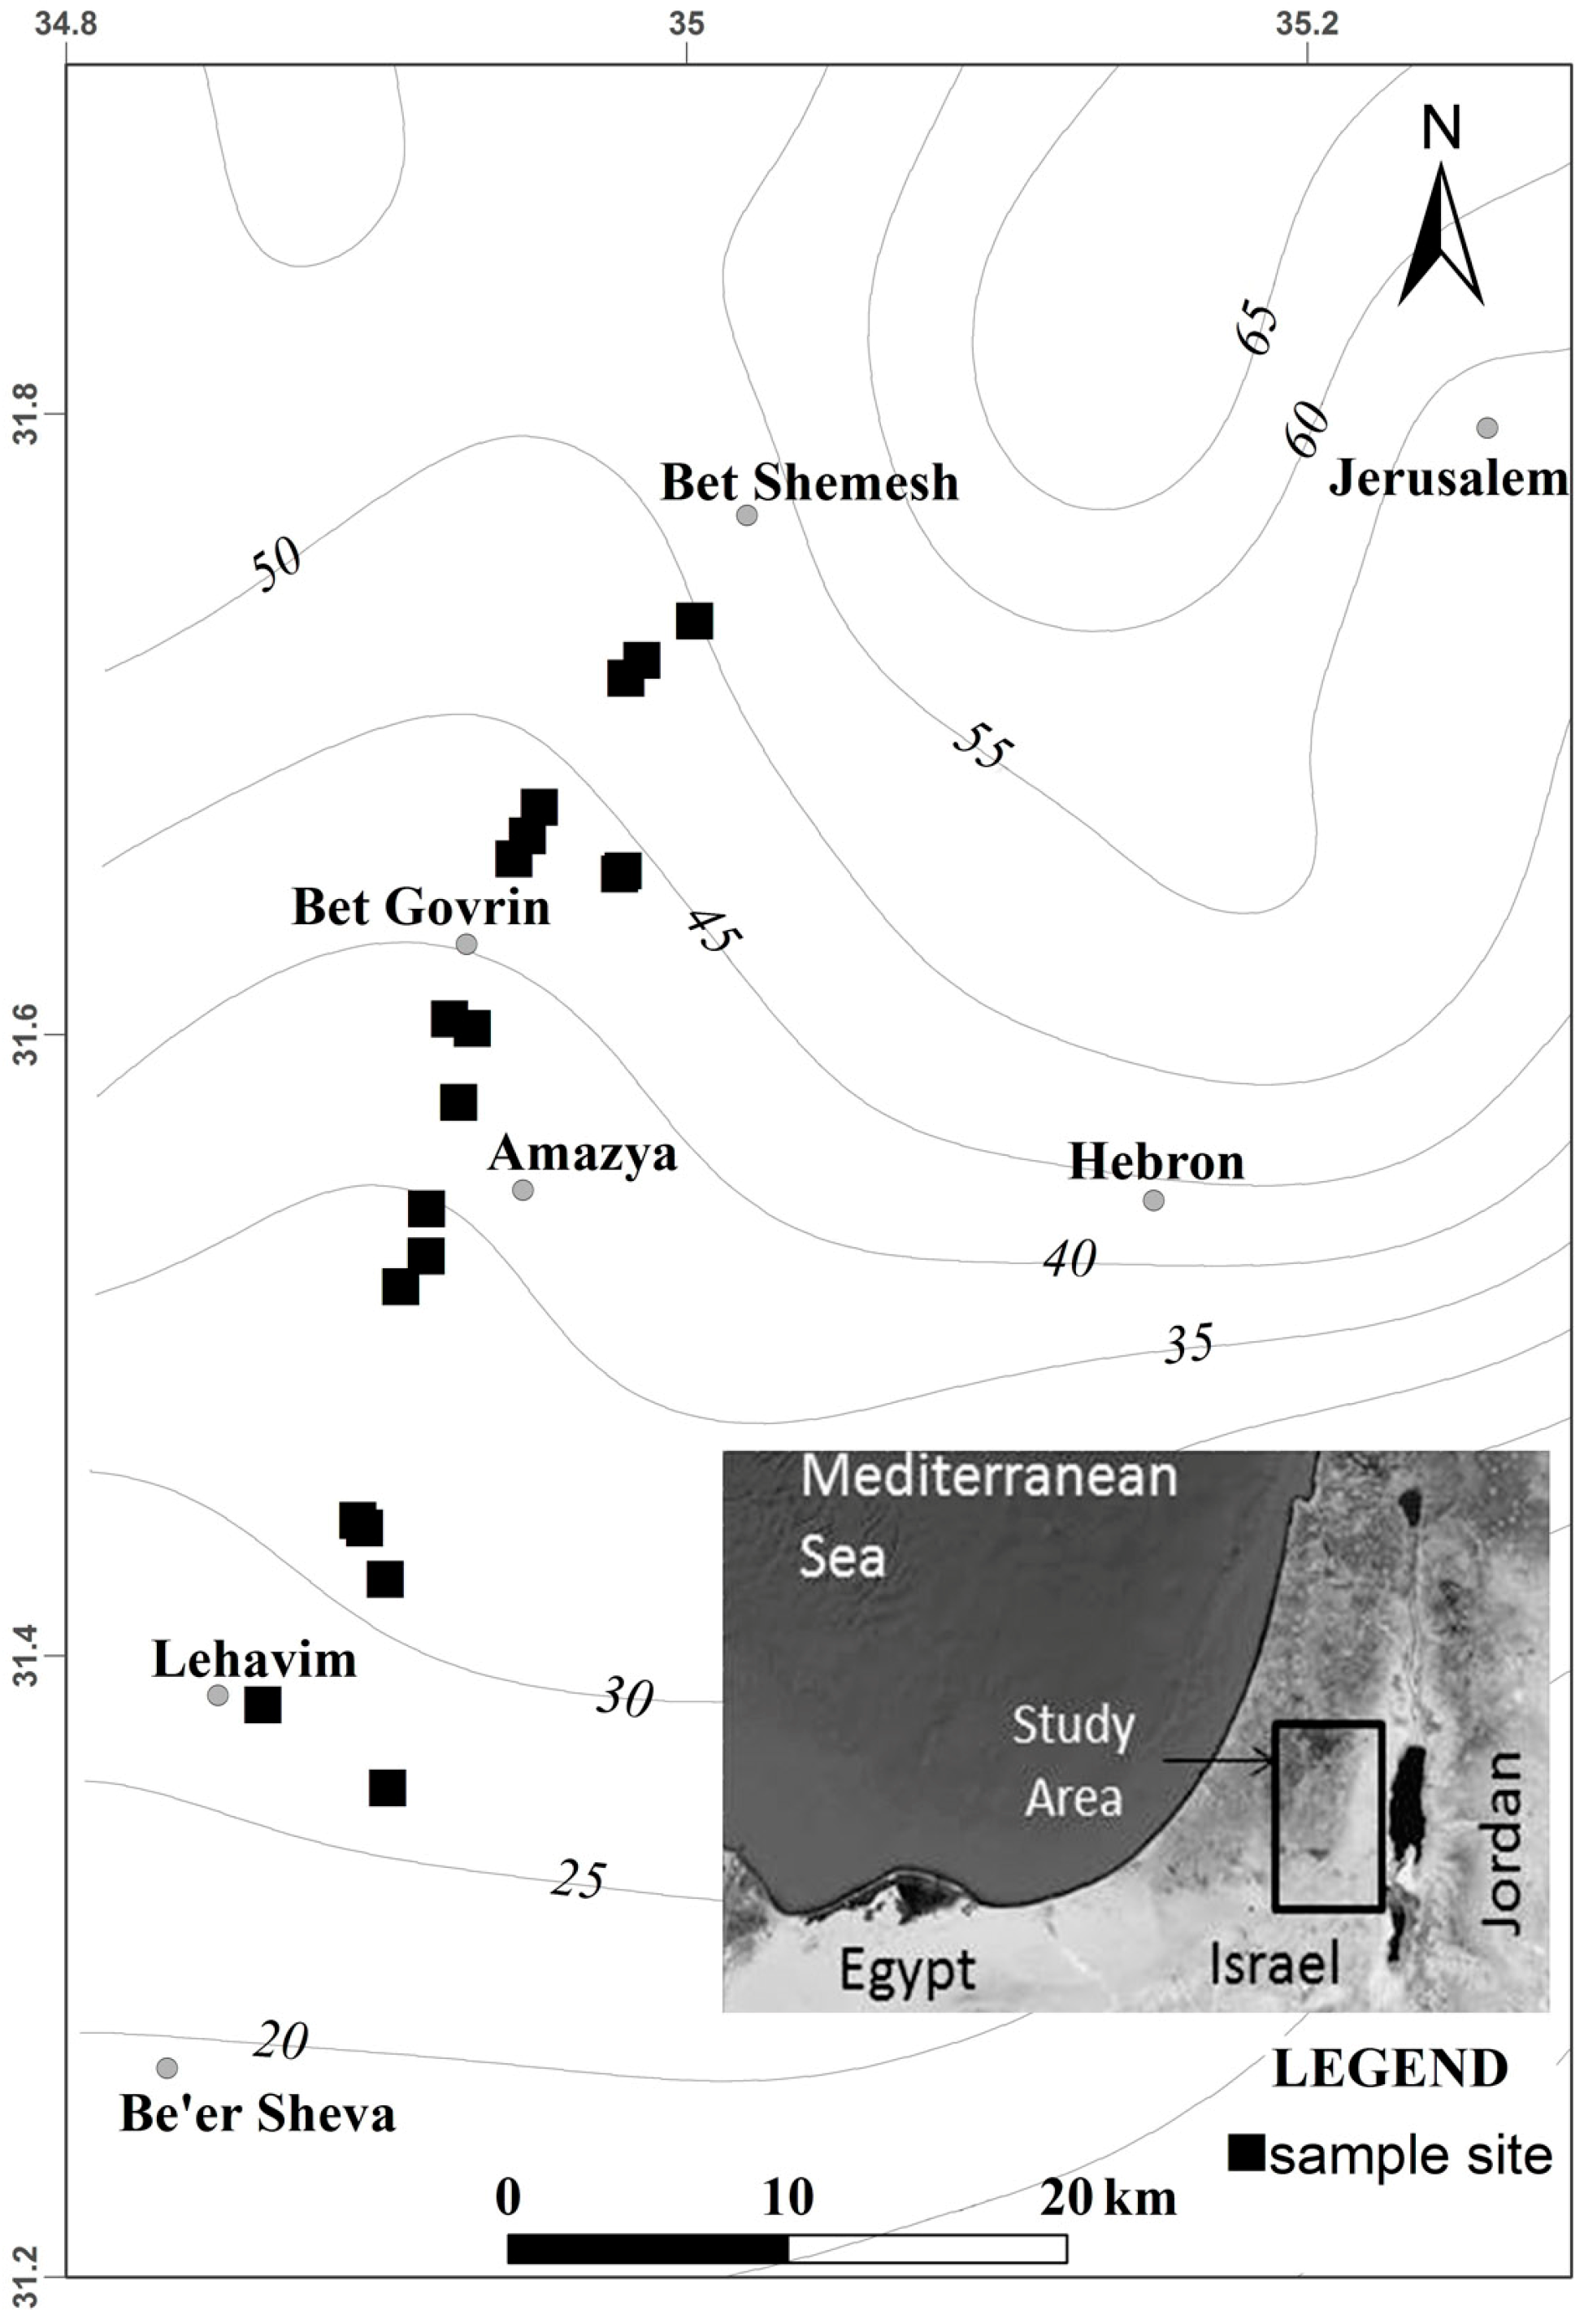
5. Study Area


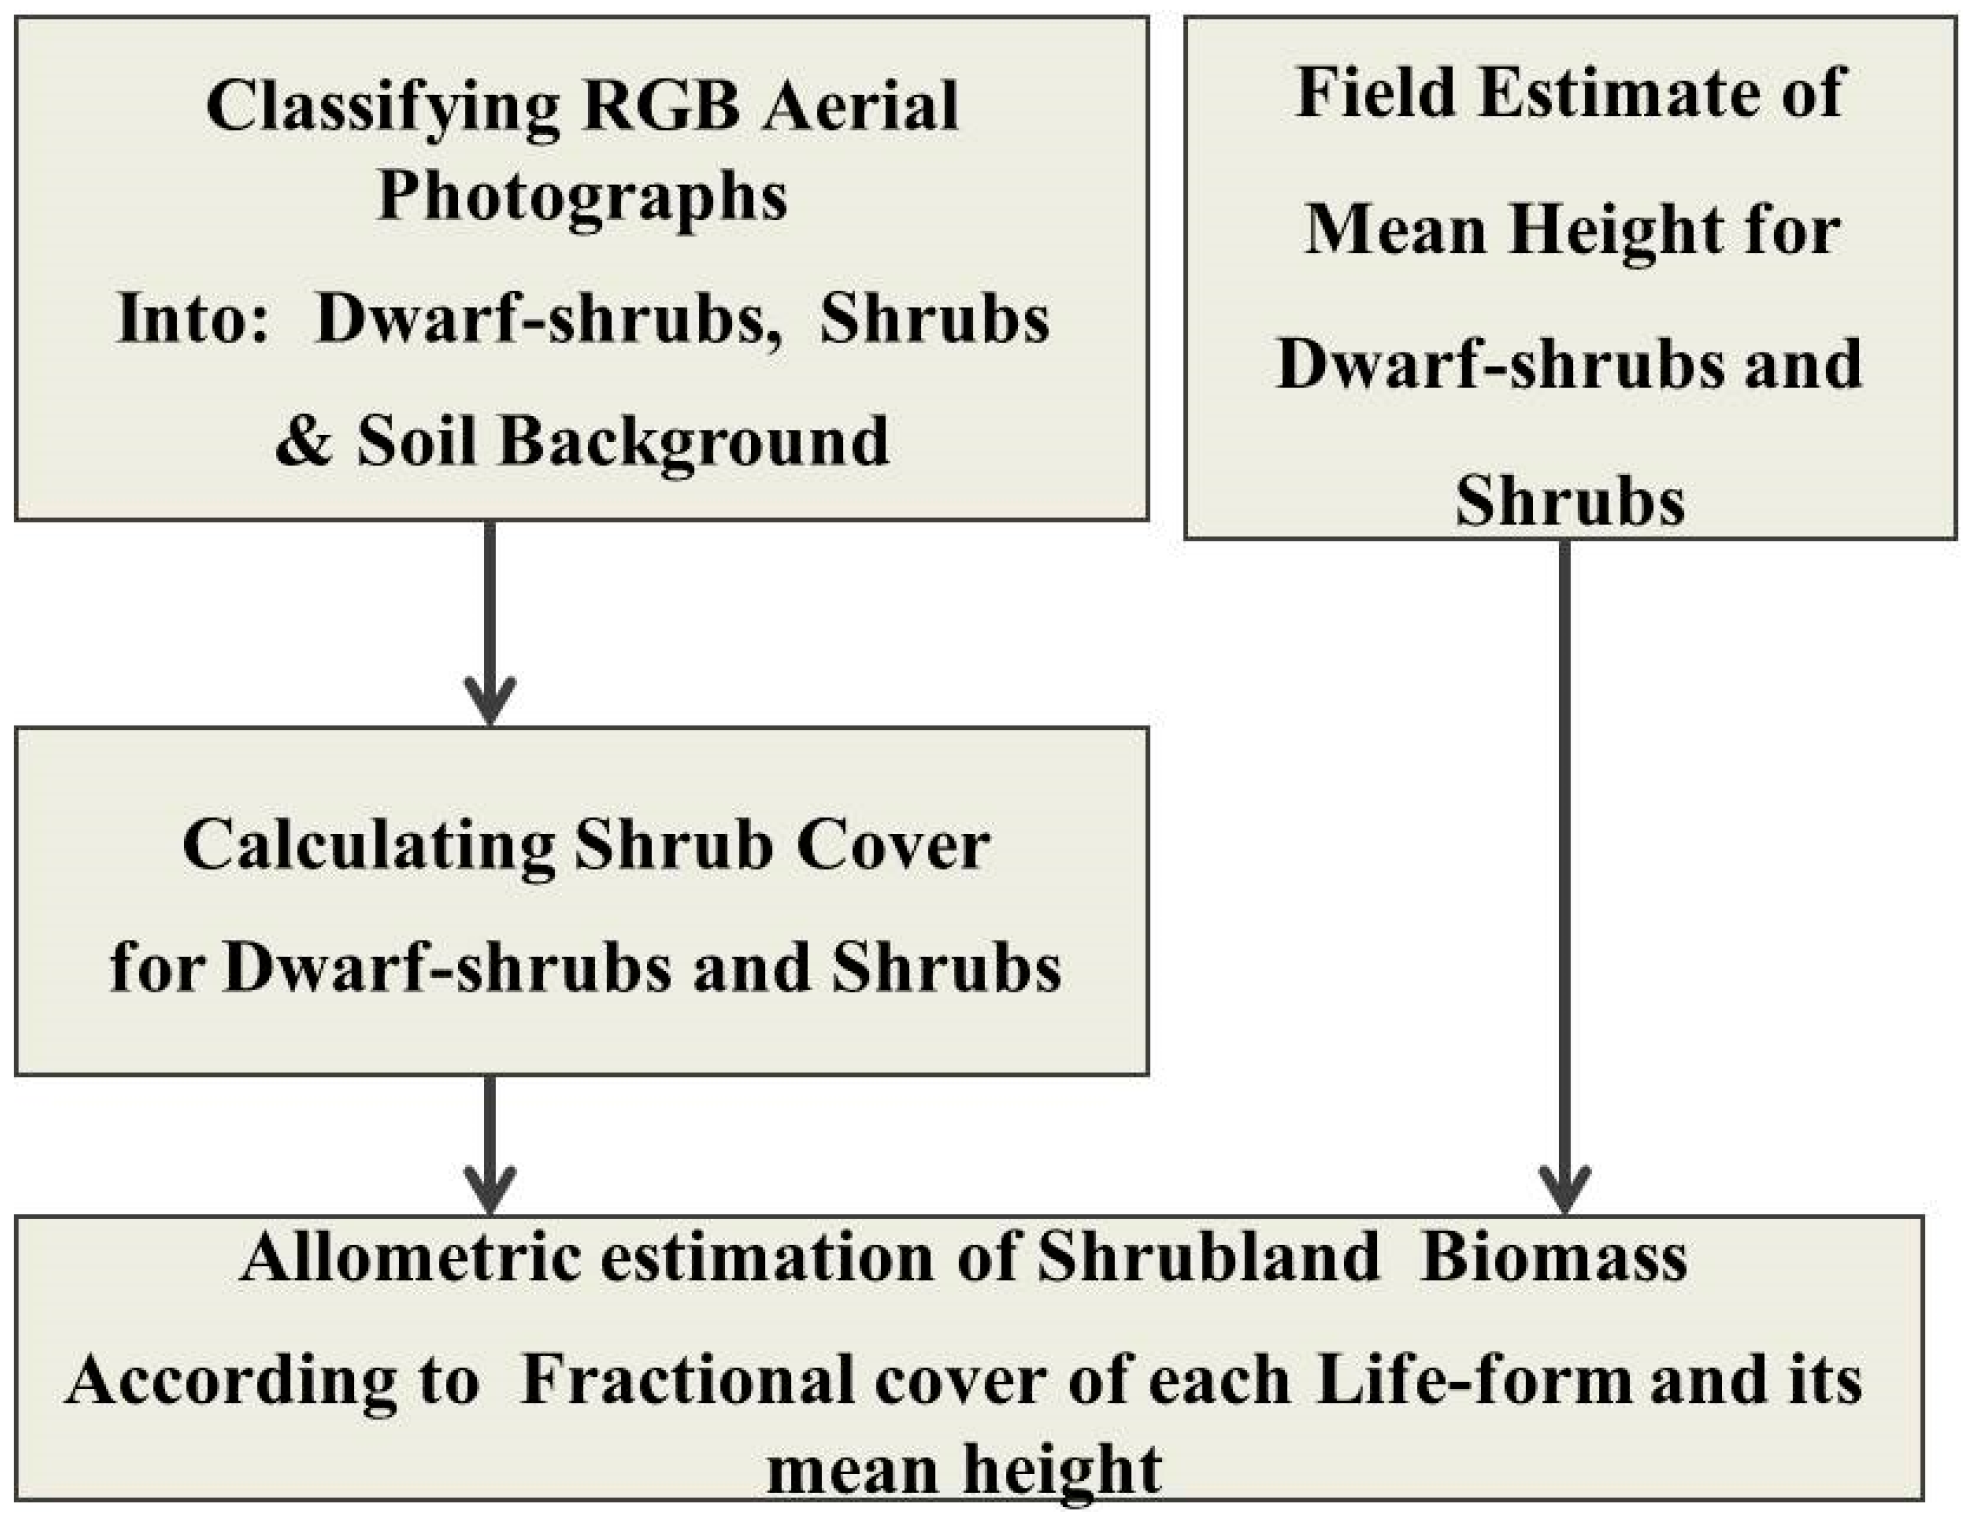
6. Methodology
6.1. Information Gathering
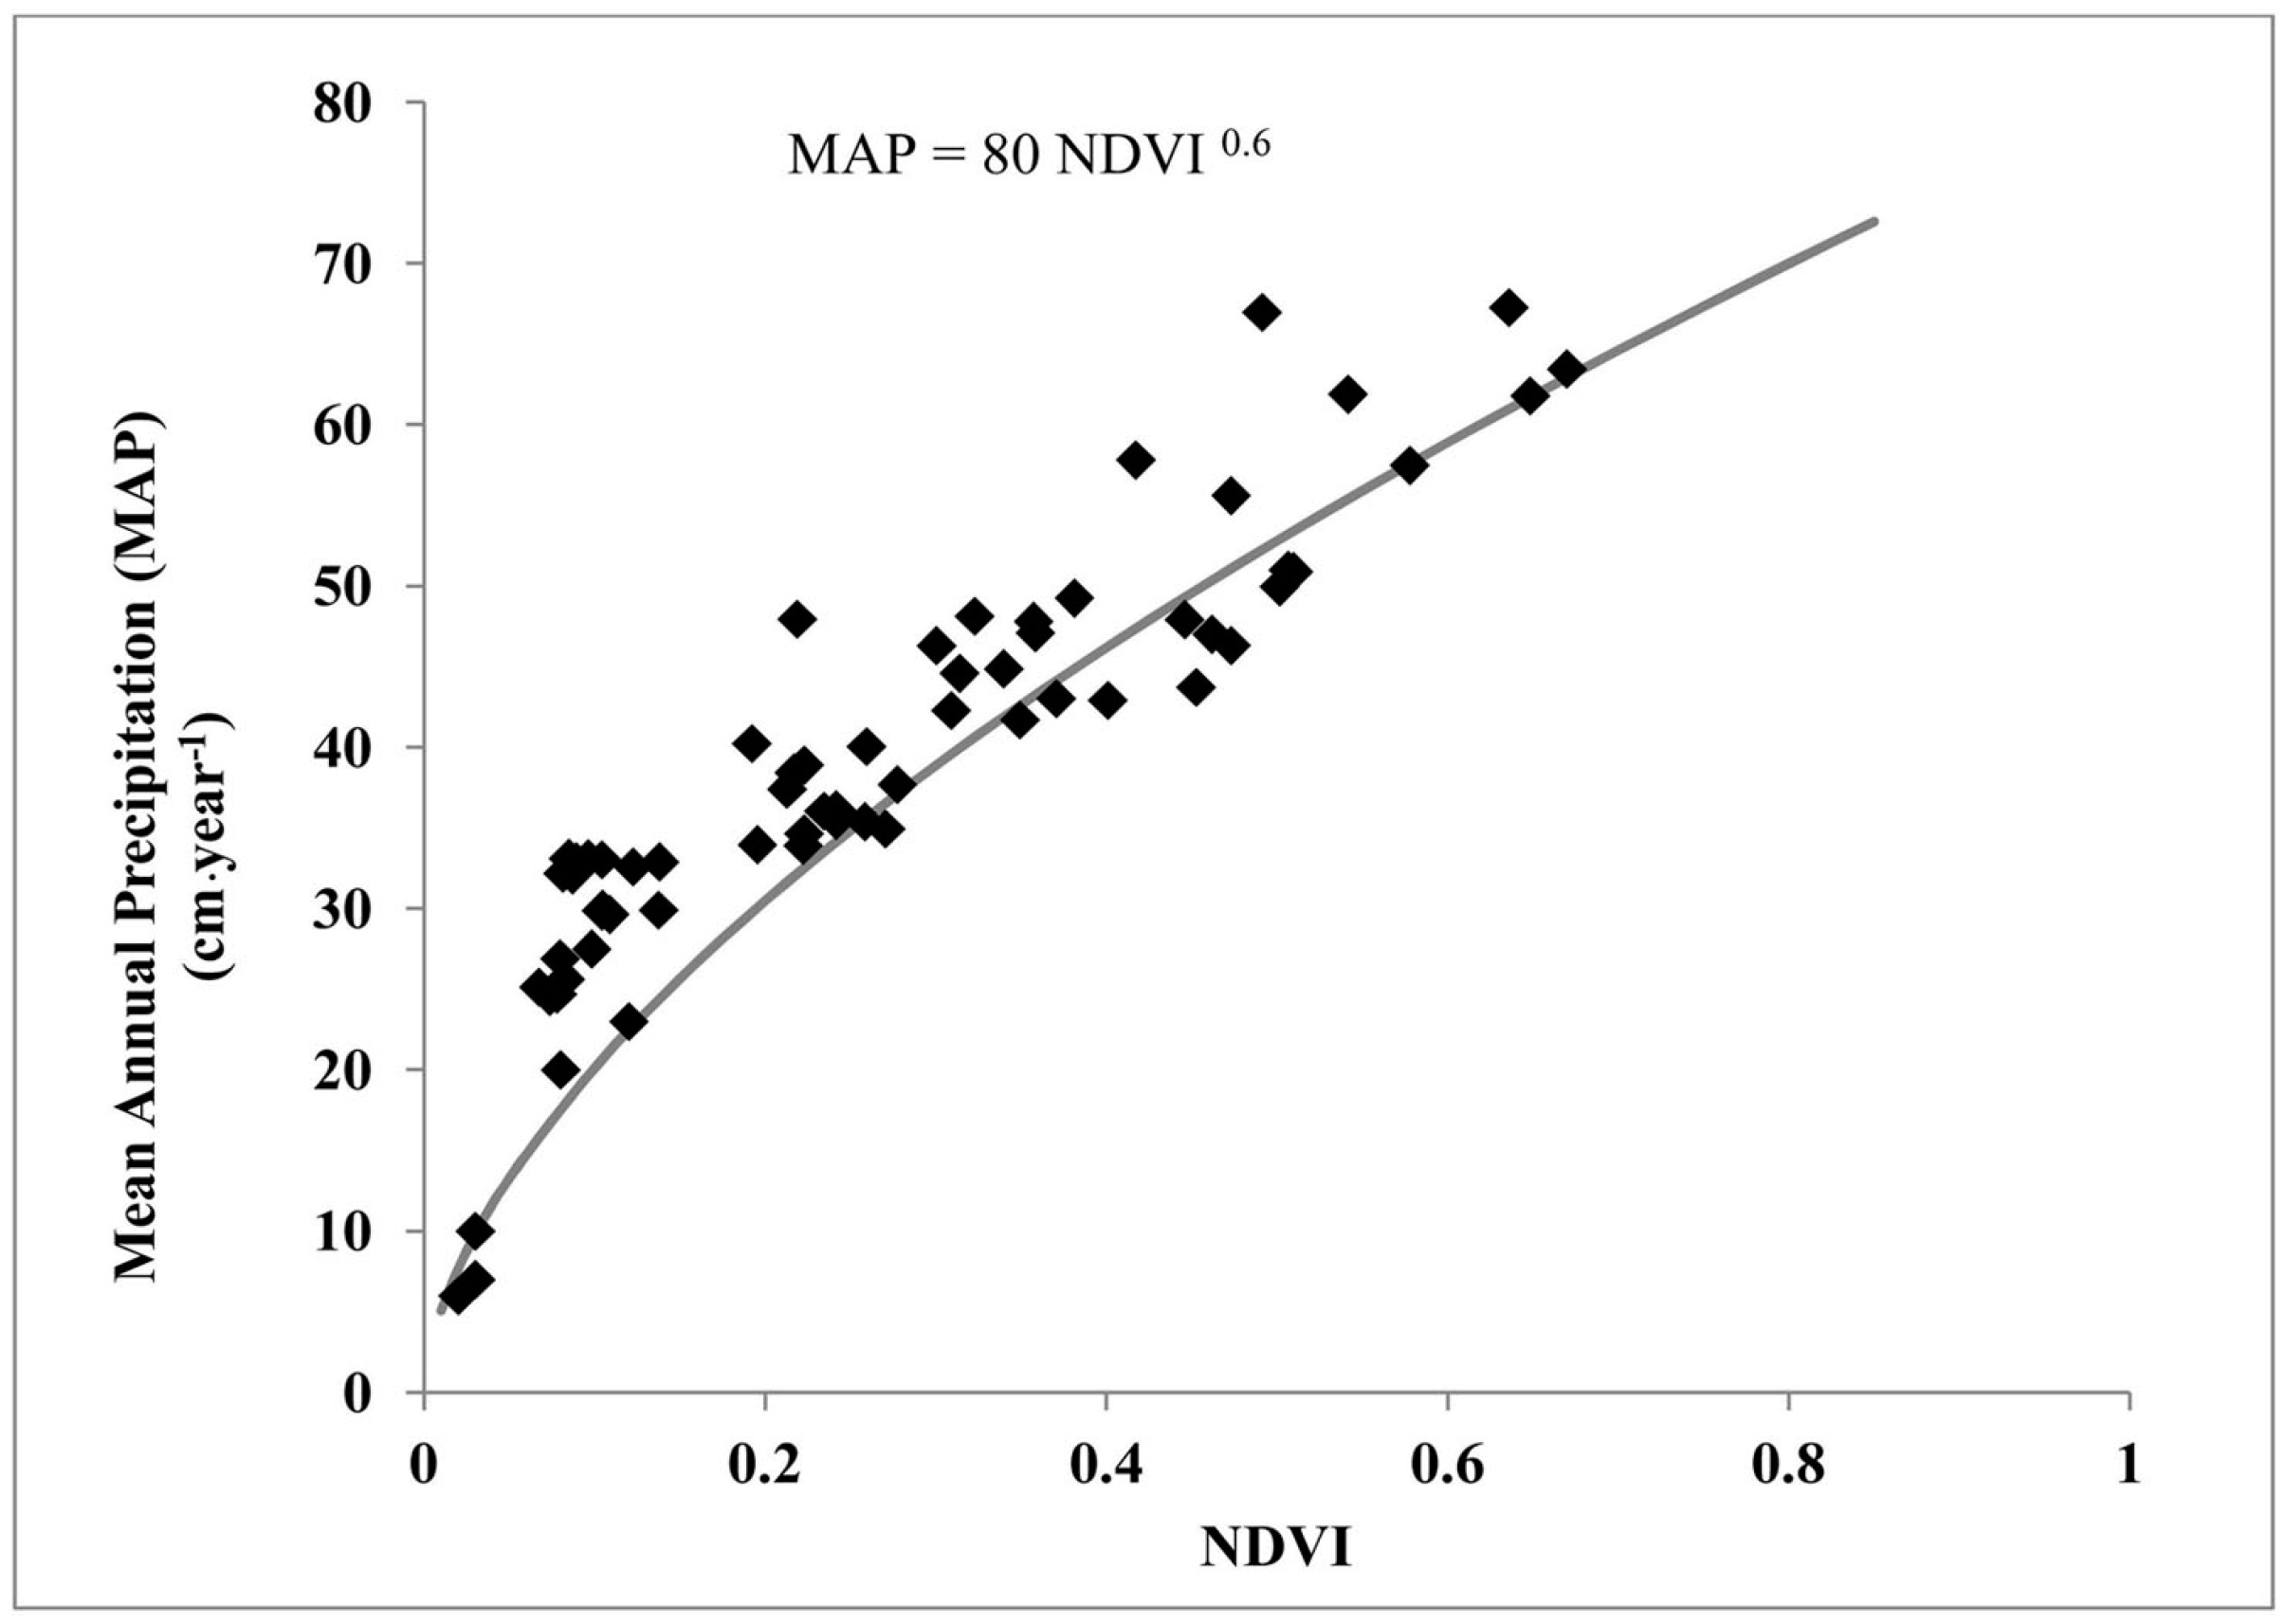
6.2. Formulating the MAPNDVI Function

6.3. Assessment of the RWUE Shrublands Biomass Model


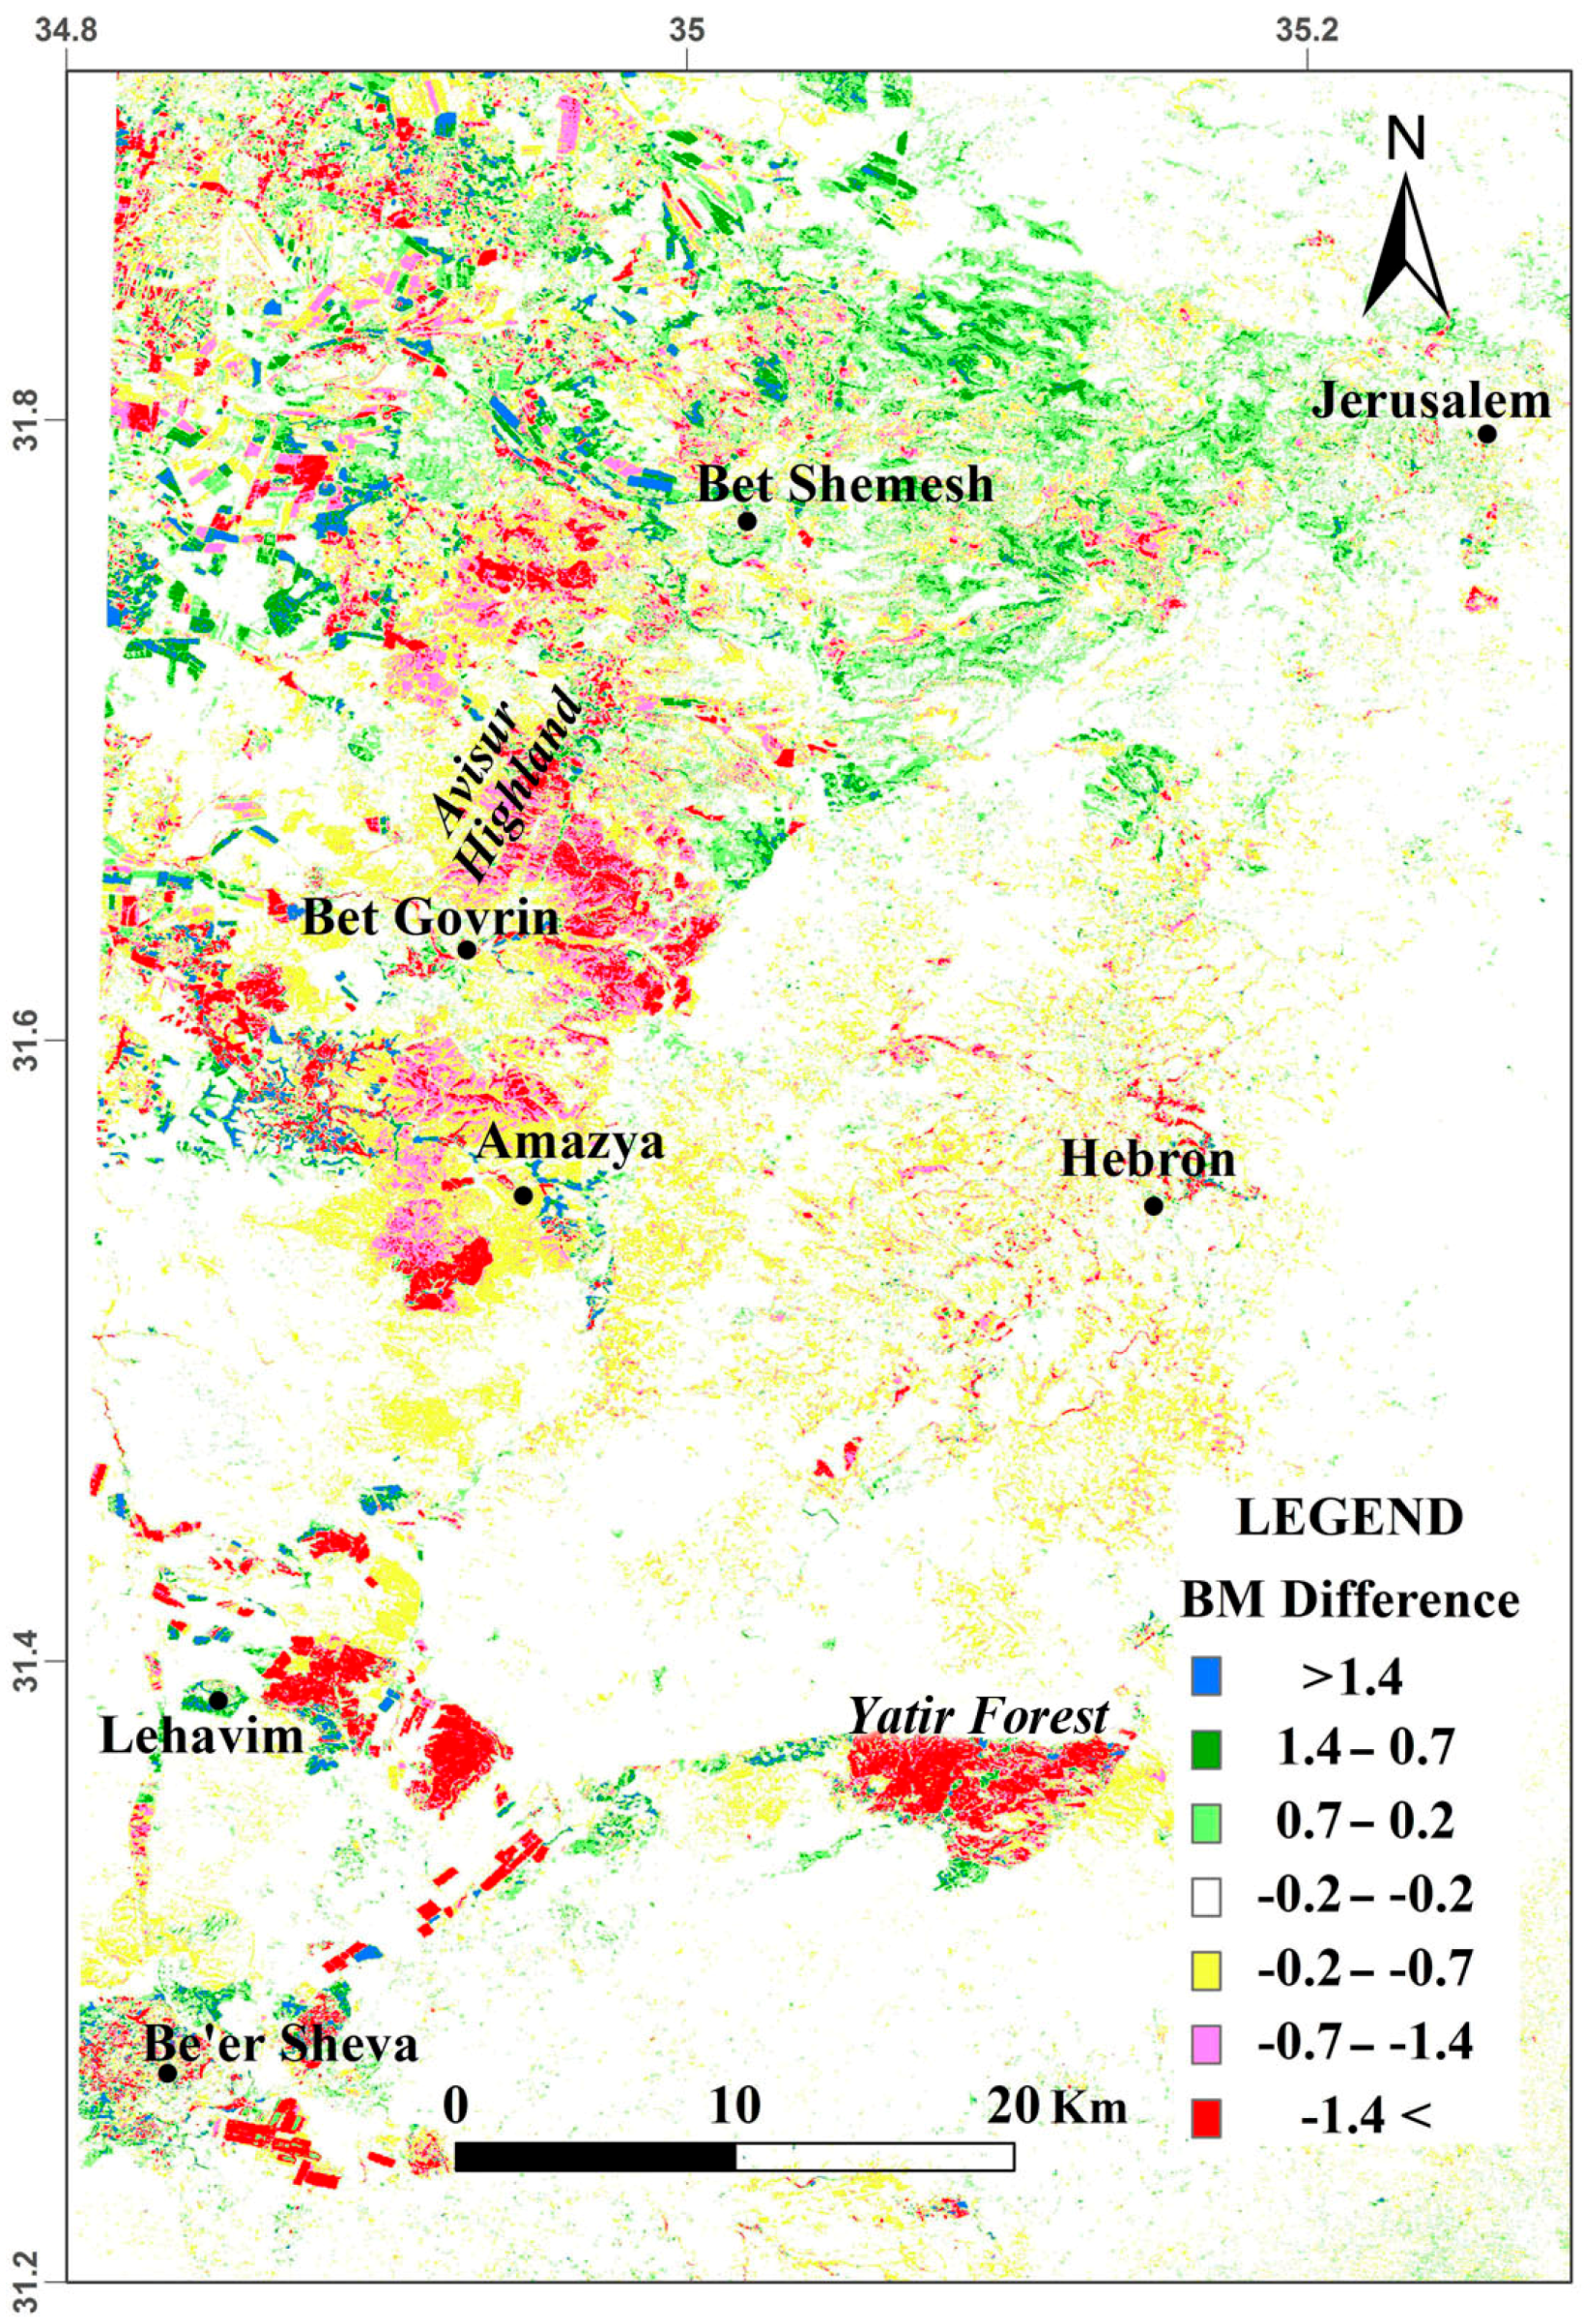
6.4. Calculation of Biomass Differences between 1994 and 2011


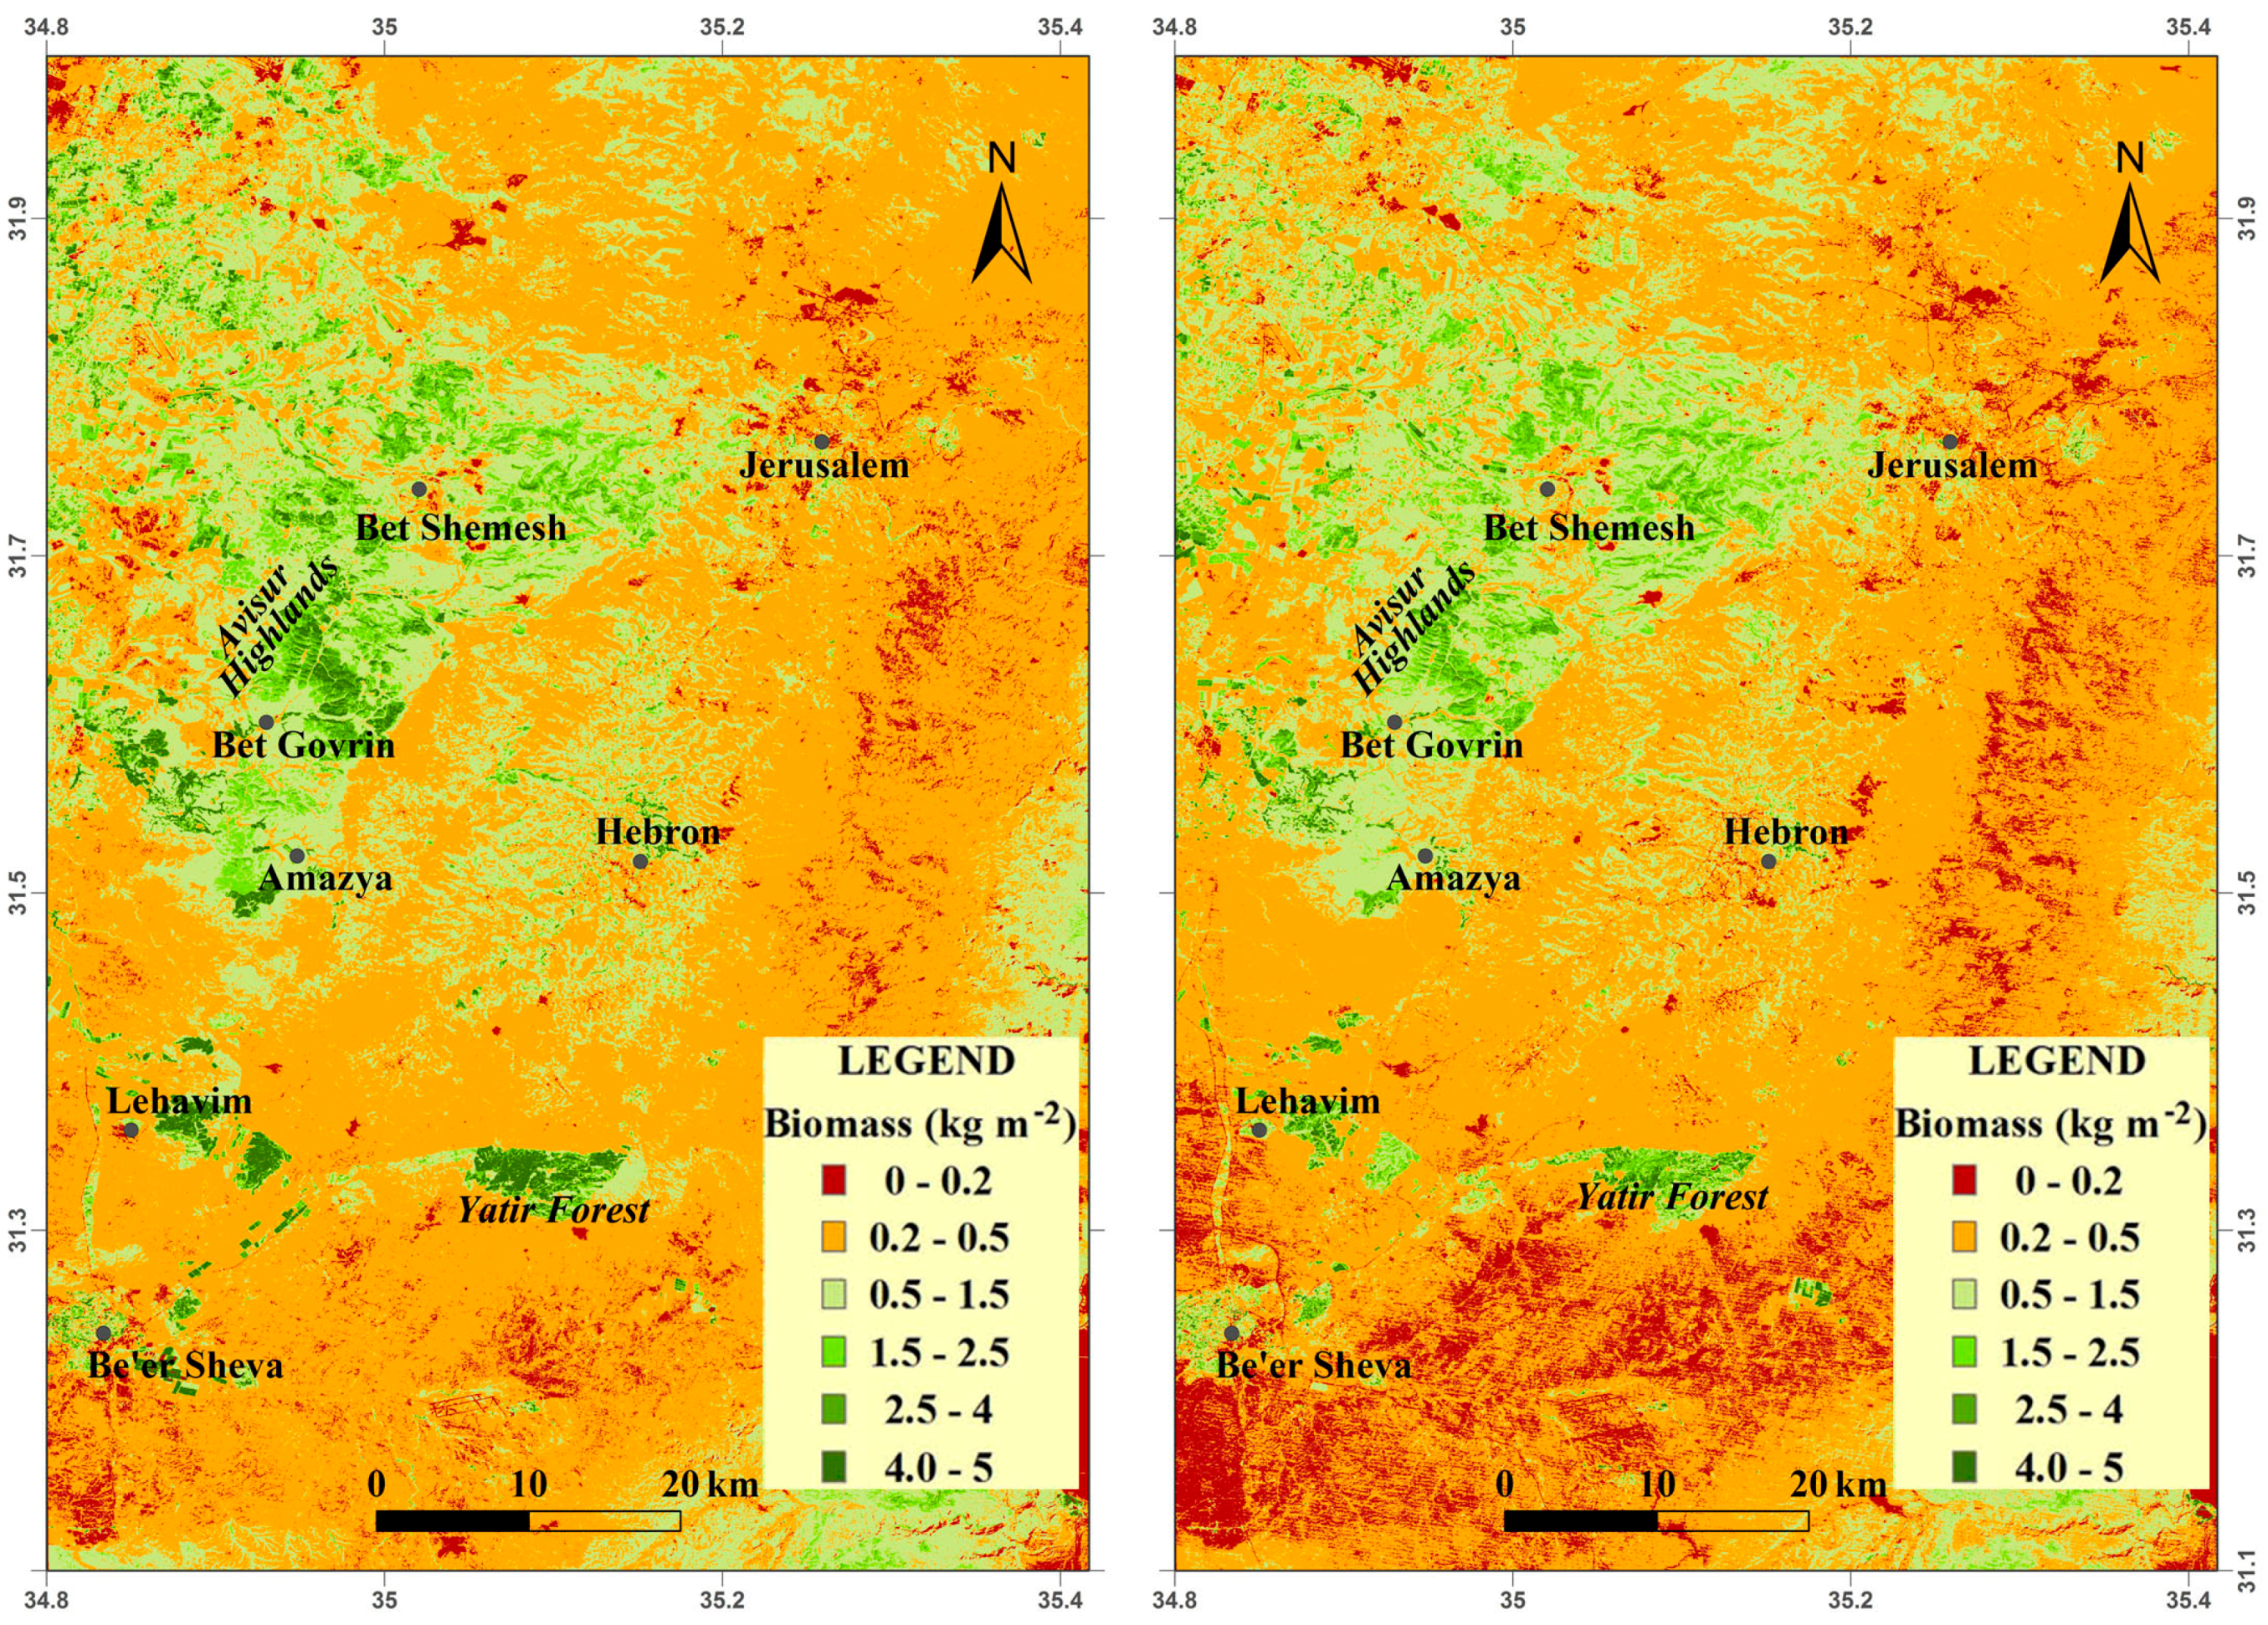
7. Changes in Biomass, 1995–2010


8. Discussion
9. Summary and Conclusions
Acknowledgment
Author Contributions
Conflicts of Interest
References
- Giorgi, F.; Lionello, P. Climate change projections for the Mediterranean region. Glob. Planet. Change 2008, 63, 90–104. [Google Scholar] [CrossRef]
- Lelieveld, J.; Hadjinicolaou, P.; Kostopoulou, E.; Chenoweth, J.; El Maayar, M.; Giannakopoulos, C.; Hannides, C.; Lange, M.A.; Tanarhte, M.; Tyrlis, E.; Xoplaki, E. Climate change and impacts in the Eastern Mediterranean and the Middle East. Clim. Change 2012, 114, 667–687. [Google Scholar] [CrossRef]
- Mariotti, A.; Zeng, N.; Yoon, J.-H.; Artale, V.; Navarra, A.; Alpert, P.; Li, L.Z.X. Mediterranean water cycle changes: transition to drier 21st century conditions in observations and CMIP3 simulations. Environ. Res. Lett. 2008, 3, 044001. [Google Scholar] [CrossRef]
- Hydrological Service of Israel Summation of the 2011/2012 Rainfall Year and Its Hydrological Principle Characteristics; Israel Water Authority: Jerusalem, Israel, 2012.
- Paz-Kagan, T.; Panov, N.; Shachak, M.; Zaady, E.; Karnieli, A. Structural changes of desertified and managed shrubland landscapes in response to drought: Spectral, spatial and temporal analyses. Remote Sens. 2014, 6, 8134–8164. [Google Scholar] [CrossRef]
- Verón, S.R.; Paruelo, J.M. Desertification alters the response of vegetation to changes in precipitation. J. Appl. Ecol. 2010, 47, 1233–1241. [Google Scholar] [CrossRef]
- Safriel, U. Status of desertification in the Mediterranean region. In Water Security, Land Degradation and Desertification in the Mediterranean Region; Rubio, J.L., Rubio, J.L., Daussa, R., Blum, W., Pedrazzini, F., Eds.; Springer: Berlin, Germany, 2009; pp. 33–43. [Google Scholar]
- Prieto, P.; Peñuelas, J.; Llusià, J.; Asensio, D.; Estiarte, M. Effects of experimental warming and drought on biomass accumulation in a Mediterranean shrubland. Plant Ecol. 2009, 205, 179–191. [Google Scholar] [CrossRef]
- Sonnenschein, R.; Kuemmerle, T.; Udelhoven, T.; Stellmes, M.; Hostert, P. Differences in Landsat-based trend analyses in drylands due to the choice of vegetation estimate. Remote Sens. Environ. 2011, 115, 1408–1420. [Google Scholar] [CrossRef]
- Eisfelder, C.; Kuenzer, C.; Dech, S. A review on derivation of biomass information in semi-arid regions based on remote sensing data. Proc. SPIE 2010. [Google Scholar] [CrossRef]
- Lu, D. The potential and challenge of remote sensing-based biomass estimation. Int. J. Remote Sens. 2006, 27, 1297–1328. [Google Scholar] [CrossRef]
- Shoshany, M.; Karnibad, L. Mapping shrubland biomass along Mediterranean climatic gradients: The synergy of rainfall-based and NDVI-based models. Int. J. Remote Sens. 2011, 32, 9497–9508. [Google Scholar] [CrossRef]
- Emmerich, W.E. Ecosystem Water use efficiency in a semiarid shrubland and grassland community. Rangel. Ecol. Manag. 2007, 60, 464–470. [Google Scholar] [CrossRef]
- Shoshany, M. The rational model of shrubland biomass, pattern and precipitation relationships along semi-arid climatic gradients. J. Arid Environ. 2012, 78, 179–182. [Google Scholar] [CrossRef]
- Evenari, M.; Bamberg, S.; Schulze, E.D.; Kappen, L.; Lange, L.O.; Buschbom, U. The biomass production of some higher plants in near-Eastern and American deserts. In Photosynthesis and Productivity in Different Environments; Cooper, J.P., Ed.; Cambridge University Press: Cambridge, UK, 1975; pp. 121–128. [Google Scholar]
- Sternberg, M.; Shoshany, M. Influence of slope aspect on Mediterranean woody formations: Comparison of a semiarid and an arid site in Israel. Ecol. Res. 2001, 16, 335–345. [Google Scholar] [CrossRef]
- Cerrillo, R.M.N.; Oyonarte, P.B. Estimation of above-ground biomass in shrubland ecosystems of southern Spain. Investig. Agrar. Sist. Recur. For. 2006, 15, 197–207. [Google Scholar] [CrossRef]
- Alrababah, M.A.; Alhamad, M.N.; Bataineh, M.M. Arboreal diversity and aboveground biomass in a semi-arid Mediterranean forest ecosystem: Case of Kufur-Khal natural reserve. Jordan J. Agric. Sci. 2007, 3, 363–375. [Google Scholar]
- Saǧlam, B.; Küçük, Ö.; Bilgili, E.; Durmaz, B.D.; Baysal, I. Estimating fuel biomass of some shrub species (maquis) in Turkey. Turkish J. Agric. For. 2008, 32, 349–356. [Google Scholar]
- Stanhill, G. Water use efficiency. Adv. Agron. 1986, 39, 53–85. [Google Scholar]
- Kustas, W.P.; Norman, J.M. Use of remote sensing for évapo-transpiration monitoring over land surfaces. Hydrol. Sci. J. 1996, 41, 495–516. [Google Scholar] [CrossRef]
- Lu, X.; Zhuang, Q. Evaluating evapotranspiration and water-use efficiency of terrestrial ecosystems in the conterminous United States using MODIS and AmeriFlux data. Remote Sens. Environ. 2010, 114, 1924–1939. [Google Scholar] [CrossRef]
- Hein, L.; De Ridder, N. Deserti cation in the Sahel: A reinterpretation. Glob. Chang. Biol. 2006, 12, 751–758. [Google Scholar] [CrossRef]
- Prince, S.D.; Wessels, K.J.; Tucker, C.J.; Nicholson, S.E. Desertification in the Sahel: A reinterpretation of a reinterpretation. Glob. Chang. Biol. 2007, 13, 1308–1313. [Google Scholar] [CrossRef]
- Shoshany, M.; Svoray, T. Multidate adaptive unmixing and its application to analysis of ecosystem transitions along a climatic gradient. Remote Sens. Environ. 2002, 82, 5–20. [Google Scholar] [CrossRef]
- Herrmann, S.M.; Anyamba, A.; Tucker, C.J. Recent trends in vegetation dynamics in the African Sahel and their relationship to climate. Glob. Environ. Chang. 2005, 15, 394–404. [Google Scholar] [CrossRef]
- Diouf, A.; Lambin, E.F. Monitoring land-cover changes in semi-arid regions: remote sensing data and field observations in the Ferlo, Senegal. J. Arid Environ. 2001, 48, 129–148. [Google Scholar] [CrossRef]
- Nicholson, S.E.; Davenport, M.L.; Malo, A.R. A comparison of the vegetation response to rainfall in the Sahel and East Africa, using normalized difference vegetation index from NOAA AVHRR. Clim. Change 1990, 17, 209–241. [Google Scholar] [CrossRef]
- Peinado, M.; Alcaraz, F.; Aguirre, J.L.; Delgadillo, J.; Aguado, I. Shrubland formations and assosiation in mediterranean-desert transitional zones of northwestern Baja California. Vegetatio 1995, 117, 165–179. [Google Scholar] [CrossRef]
- Danin, A.; Orshan, G.; Zohary, M. The vegetation of nothern negev and judean desert. Isr. J. Bot. 1975, 24, 118–172. [Google Scholar]
- Danin, A. Flora and vegetation of Israel and adjacent areas. Bocconea 1992, 3, 18–42. [Google Scholar]
- Naveh, Z.; Carmel, Y. the Evolution of the cultural Mediterranean landscape in Israel as affected by fire, grazing, and humanactivities. In Evolutionary Theory and Processes: Modern Horizons, Papers in Honour of Eviatar Nevo; Wasser, S.P., Ed.; Kluwer Academic Publishers: Dordrecht, The Nethelands, 2003; pp. 337–409. [Google Scholar]
- Sharakas, O.; Hammad, A.A.; Nubani, A.; Abdullah, A. Land Degradation Risk Assessment in the Palestinian Central Mountains Utilizing Remote Sensing and GIS Technique (Research Report); Geography Department, Birzeit University: Birzeit, Palestine, 2006; p. 97. [Google Scholar]
- Grunzweig, J.M. Briefing Notes on the CIRCE Rural Case Studies: The Judean Foothills; CIRCLE Climate Change and Impact Research: The Mediterranean Environment, 2008. Available online: http://www.cru.uea.ac.uk/projects/circe/JudeanFoothills.html (accessed on 23 December 2014).
- Stern, E.; Reiter, R.; Frumkin, R. Biosphere Reserve in the Judean Foothills—Method, Outline and Structure; Final Report; Tel-Aviv, Israel, 2004. (In Hebrew) [Google Scholar]
- Shoshany, M. Landscape fragmentation and soil cover changes on south- and north-facing slopes during ecosystems recovery: An analysis from multi-date air photographs. Geomorphology 2002, 45, 3–20. [Google Scholar] [CrossRef]
- Tessler, N.; Malkinson, D.; Vitenberg, L.; Grinbaum, N. Forest and woodland fires in the Carmel and Jerusalem Mountains-Documentation and analysis of temporal patterns. Horizons 2010, 76, 157–165. (In Hebrew) [Google Scholar]
- Song, C.; Woodcock, C.E.; Seto, K.C.; Lenney, M.P.; Macomber, S.A. Classification and change detection using Landsat TM data: When and how to correct atmospheric effects? Remote Sens. Environ. 2001, 75, 230–244. [Google Scholar] [CrossRef]
- De Jong, S.M.; Pebesma, E.J.; Lacaze, B. Above ground biomass assessment of Mediterranean forests using airborne imaging spectrometry: The DAIS Peyne experiment. Int. J. Remote Sens. 2003, 24, 1505–1520. [Google Scholar] [CrossRef]
- Shoshany, M. Desert threshold identification by maximizing potential instability in soil and shrubs’ patterns: A remote sensing study. Land. Degrad. Dev. 2012, 23, 331–338. [Google Scholar] [CrossRef]
- Kogan, F.N. Global drought watch from space. Bull. Am. Meteorol. Soc. 1997, 78, 621–636. [Google Scholar] [CrossRef]
- Allen, C.D.; Macalady, A.K.; Chenchouni, H.; Bachelet, D.; McDowell, N.; Vennetier, M.; Kitzberger, T.; Rigling, A.; Breshears, D.D.; Hogg, E.H.(T.); Gonzalez, P.; Fensham, R.; Zhang, Z.; Castro, J.; Demidova, N.; Lim, J.H.; Allard, G.; Running, S.W.; Semerci, A.; Cobb, N. A global overview of drought and heat-induced tree mortality reveals emerging climate change risks for forests. For. Ecol. Manage. 2010, 259, 660–684. [Google Scholar] [CrossRef]
- Matusick, G. Drought and heat triggers sudden and severe dieback in a dominant Mediterranean type woodland species. Open J. For. 2012, 02, 183–186. [Google Scholar]
- Gao, Y.; Fu, J.S.; Drake, J.B.; Liu, Y.; Lamarque, J.-F. Projected changes of extreme weather events in the eastern United States based on a high resolution climate modeling system. Environ. Res. Lett. 2012, 7, 1–12. [Google Scholar] [CrossRef]
- Ruffault, J.; Martin-StPaul, N.K.; Rambal, S.; Mouillot, F. Differential regional responses in drought length, intensity and timing to recent climate changes in a Mediterranean forested ecosystem. Clim. Change 2013, 117, 103–117. [Google Scholar] [CrossRef]
- Hoerling, M.; Eischeid, J.; Perlwitz, J.; Quan, X.; Zhang, T.; Pegion, P. On the increased frequency of mediterranean drought. J. Clim. 2012, 25, 2146–2161. [Google Scholar] [CrossRef]
- Erian, W.; Katlan, B.; Ouldbedy, B.; Awad, H.; Zaqhtity, E.; Ibrahim, S. Agricultural Drought in Africa Mediterranean and Middle East; Background Paper Prepared for the Global Assessment Report on Disaster Risk Reduction; United Nations Office for Disaster Risk Reduction: Geneva, Switzerland, 2013; p. 402. [Google Scholar]
- Volcani, A.; Karnieli, A.; Svoray, T. The use of remote sensing and GIS for spatio-temporal analysis of the physiological state of a semi-arid forest with respect to drought years. For. Ecol. Manage. 2005, 215, 239–250. [Google Scholar] [CrossRef]
- Dorman, M.; Svoray, T.; Pre, A. Drying trees in the Jerusalem pine forests of Israel—From a high altitude point of view. Ecol . Environ. 2012, 3, 230–237. (In Hebrew) [Google Scholar]
- Ziv, B.; Saaroni, H.; Pargament, R.; Harpaz, T.; Alpert, P. Trends in rainfall regime over Israel, 1975–2010, and their relationship to large-scale variability. Reg. Environ. Chang. 2013, 14, 1751–1764. [Google Scholar] [CrossRef]
- Kafle, H.K.; Bruins, H.J. Climatic trends in Israel 1970–2002: Warmer and increasing aridity inland. Clim. Change 2009, 96, 63–77. [Google Scholar] [CrossRef]
- Sachs, M.; Itshack, M. Savanization: An ecological viable management approach to desertified regions. In Arid Lands Management: Toward Ecological Sustainability; Hoekstra, T.W., Shachak, M., Eds.; University of Illinois Press: Champaign, IL, USA, 1999; pp. 248–253. [Google Scholar]
- Rotem, G.; Bouskila, A.; Rothschild, A. Ecological Effects of Afforestation in the Northern Negev; Report of the Society for the Protection of Nature in Israel. Environmental Protection Division, Society for the Protection of Nature in Israel: Tel-Aviv, Israel, 2014. Available online: http://www.teva.org.il/_Uploads/dbsAttachedFiles/forestration_northern_NegevSPNI_Eng_finalMay2014.pdf (accessed on 14 February 2015).
© 2015 by the authors; licensee MDPI, Basel, Switzerland. This article is an open access article distributed under the terms and conditions of the Creative Commons Attribution license (http://creativecommons.org/licenses/by/4.0/).
Share and Cite
Shoshany, M.; Karnibad, L. Remote Sensing of Shrubland Drying in the South-East Mediterranean, 1995–2010: Water-Use-Efficiency-Based Mapping of Biomass Change. Remote Sens. 2015, 7, 2283-2301. https://doi.org/10.3390/rs70302283
Shoshany M, Karnibad L. Remote Sensing of Shrubland Drying in the South-East Mediterranean, 1995–2010: Water-Use-Efficiency-Based Mapping of Biomass Change. Remote Sensing. 2015; 7(3):2283-2301. https://doi.org/10.3390/rs70302283
Chicago/Turabian StyleShoshany, Maxim, and Lev Karnibad. 2015. "Remote Sensing of Shrubland Drying in the South-East Mediterranean, 1995–2010: Water-Use-Efficiency-Based Mapping of Biomass Change" Remote Sensing 7, no. 3: 2283-2301. https://doi.org/10.3390/rs70302283