
Climate Contributions to Vegetation Variations in Central Asian Drylands: Pre- and Post-USSR Collapse


Abstract
:
1. Introduction
2. Data and Methods
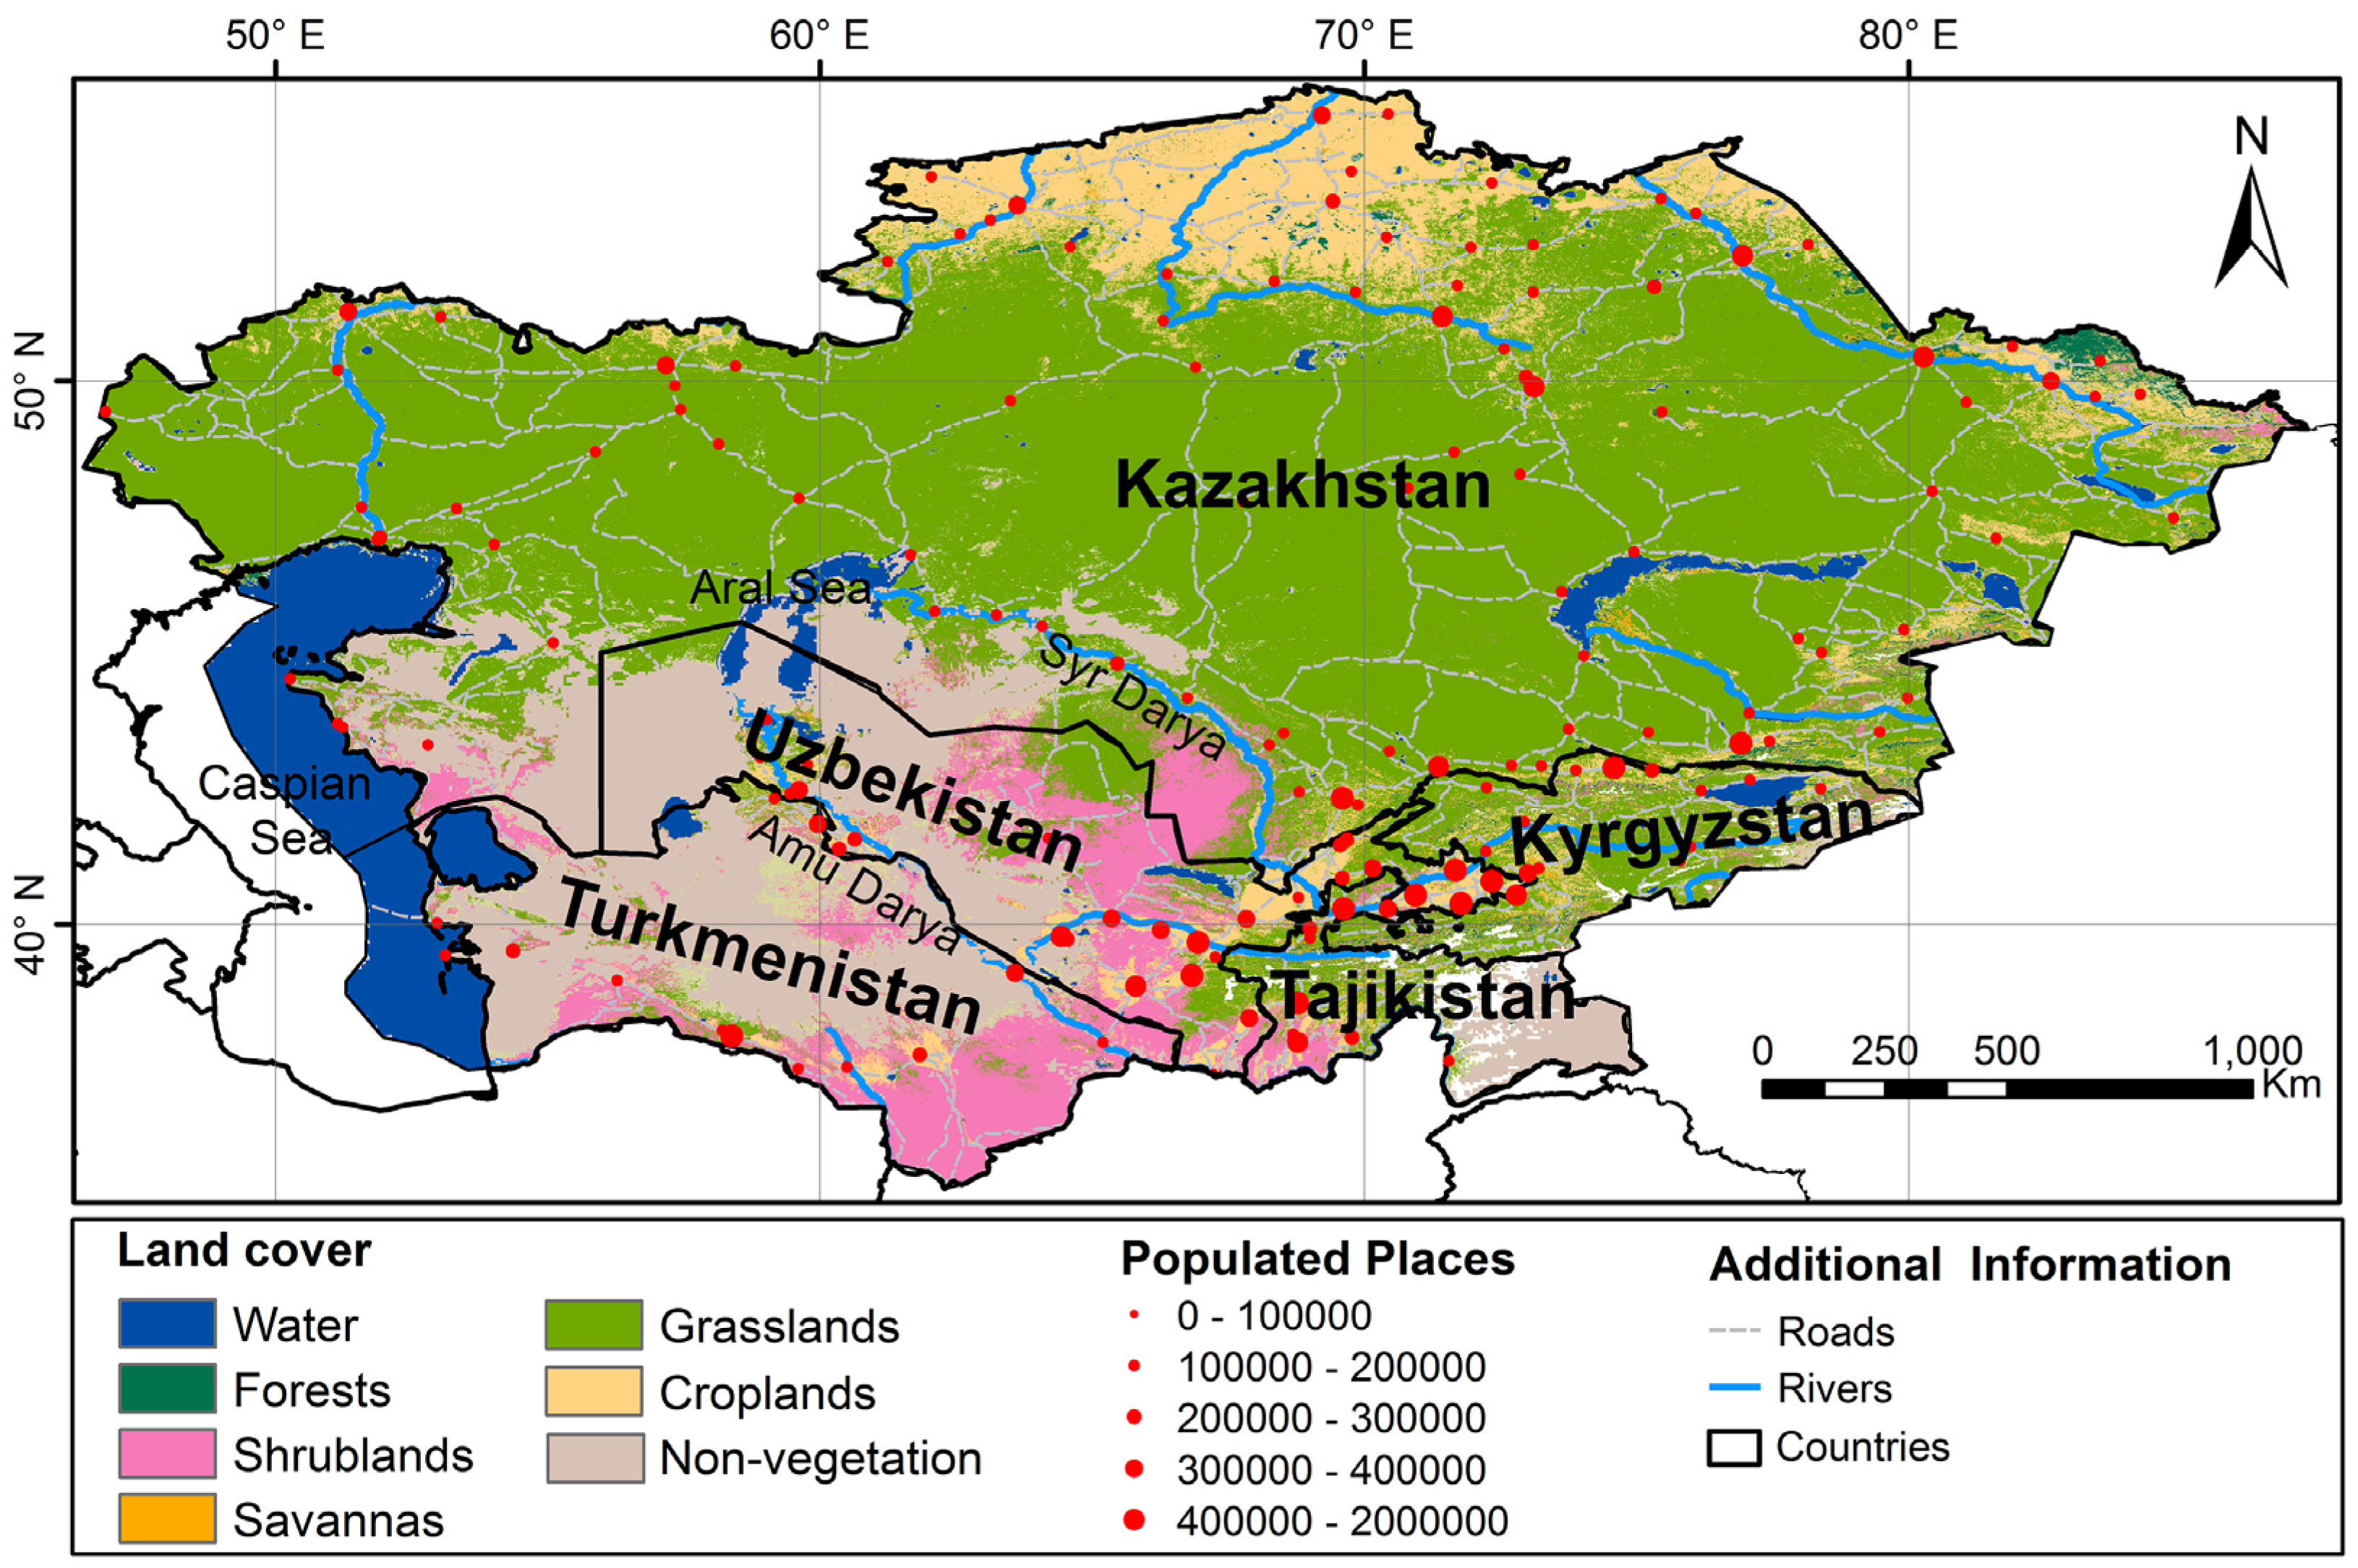
2.1. Study Area

2.2. Data
2.2.1. GIMMS3g NDVI Data
2.2.2. Climate Data
2.3. Methods
2.3.1. Trend Analysis of NDVI and Climatic Factors
2.3.2. Multiple- and Partial-Correlation Analysis for the Climatic Impact on Vegetation
2.3.3. Time-Lag Correlation Analysis between NDVI and Precipitation
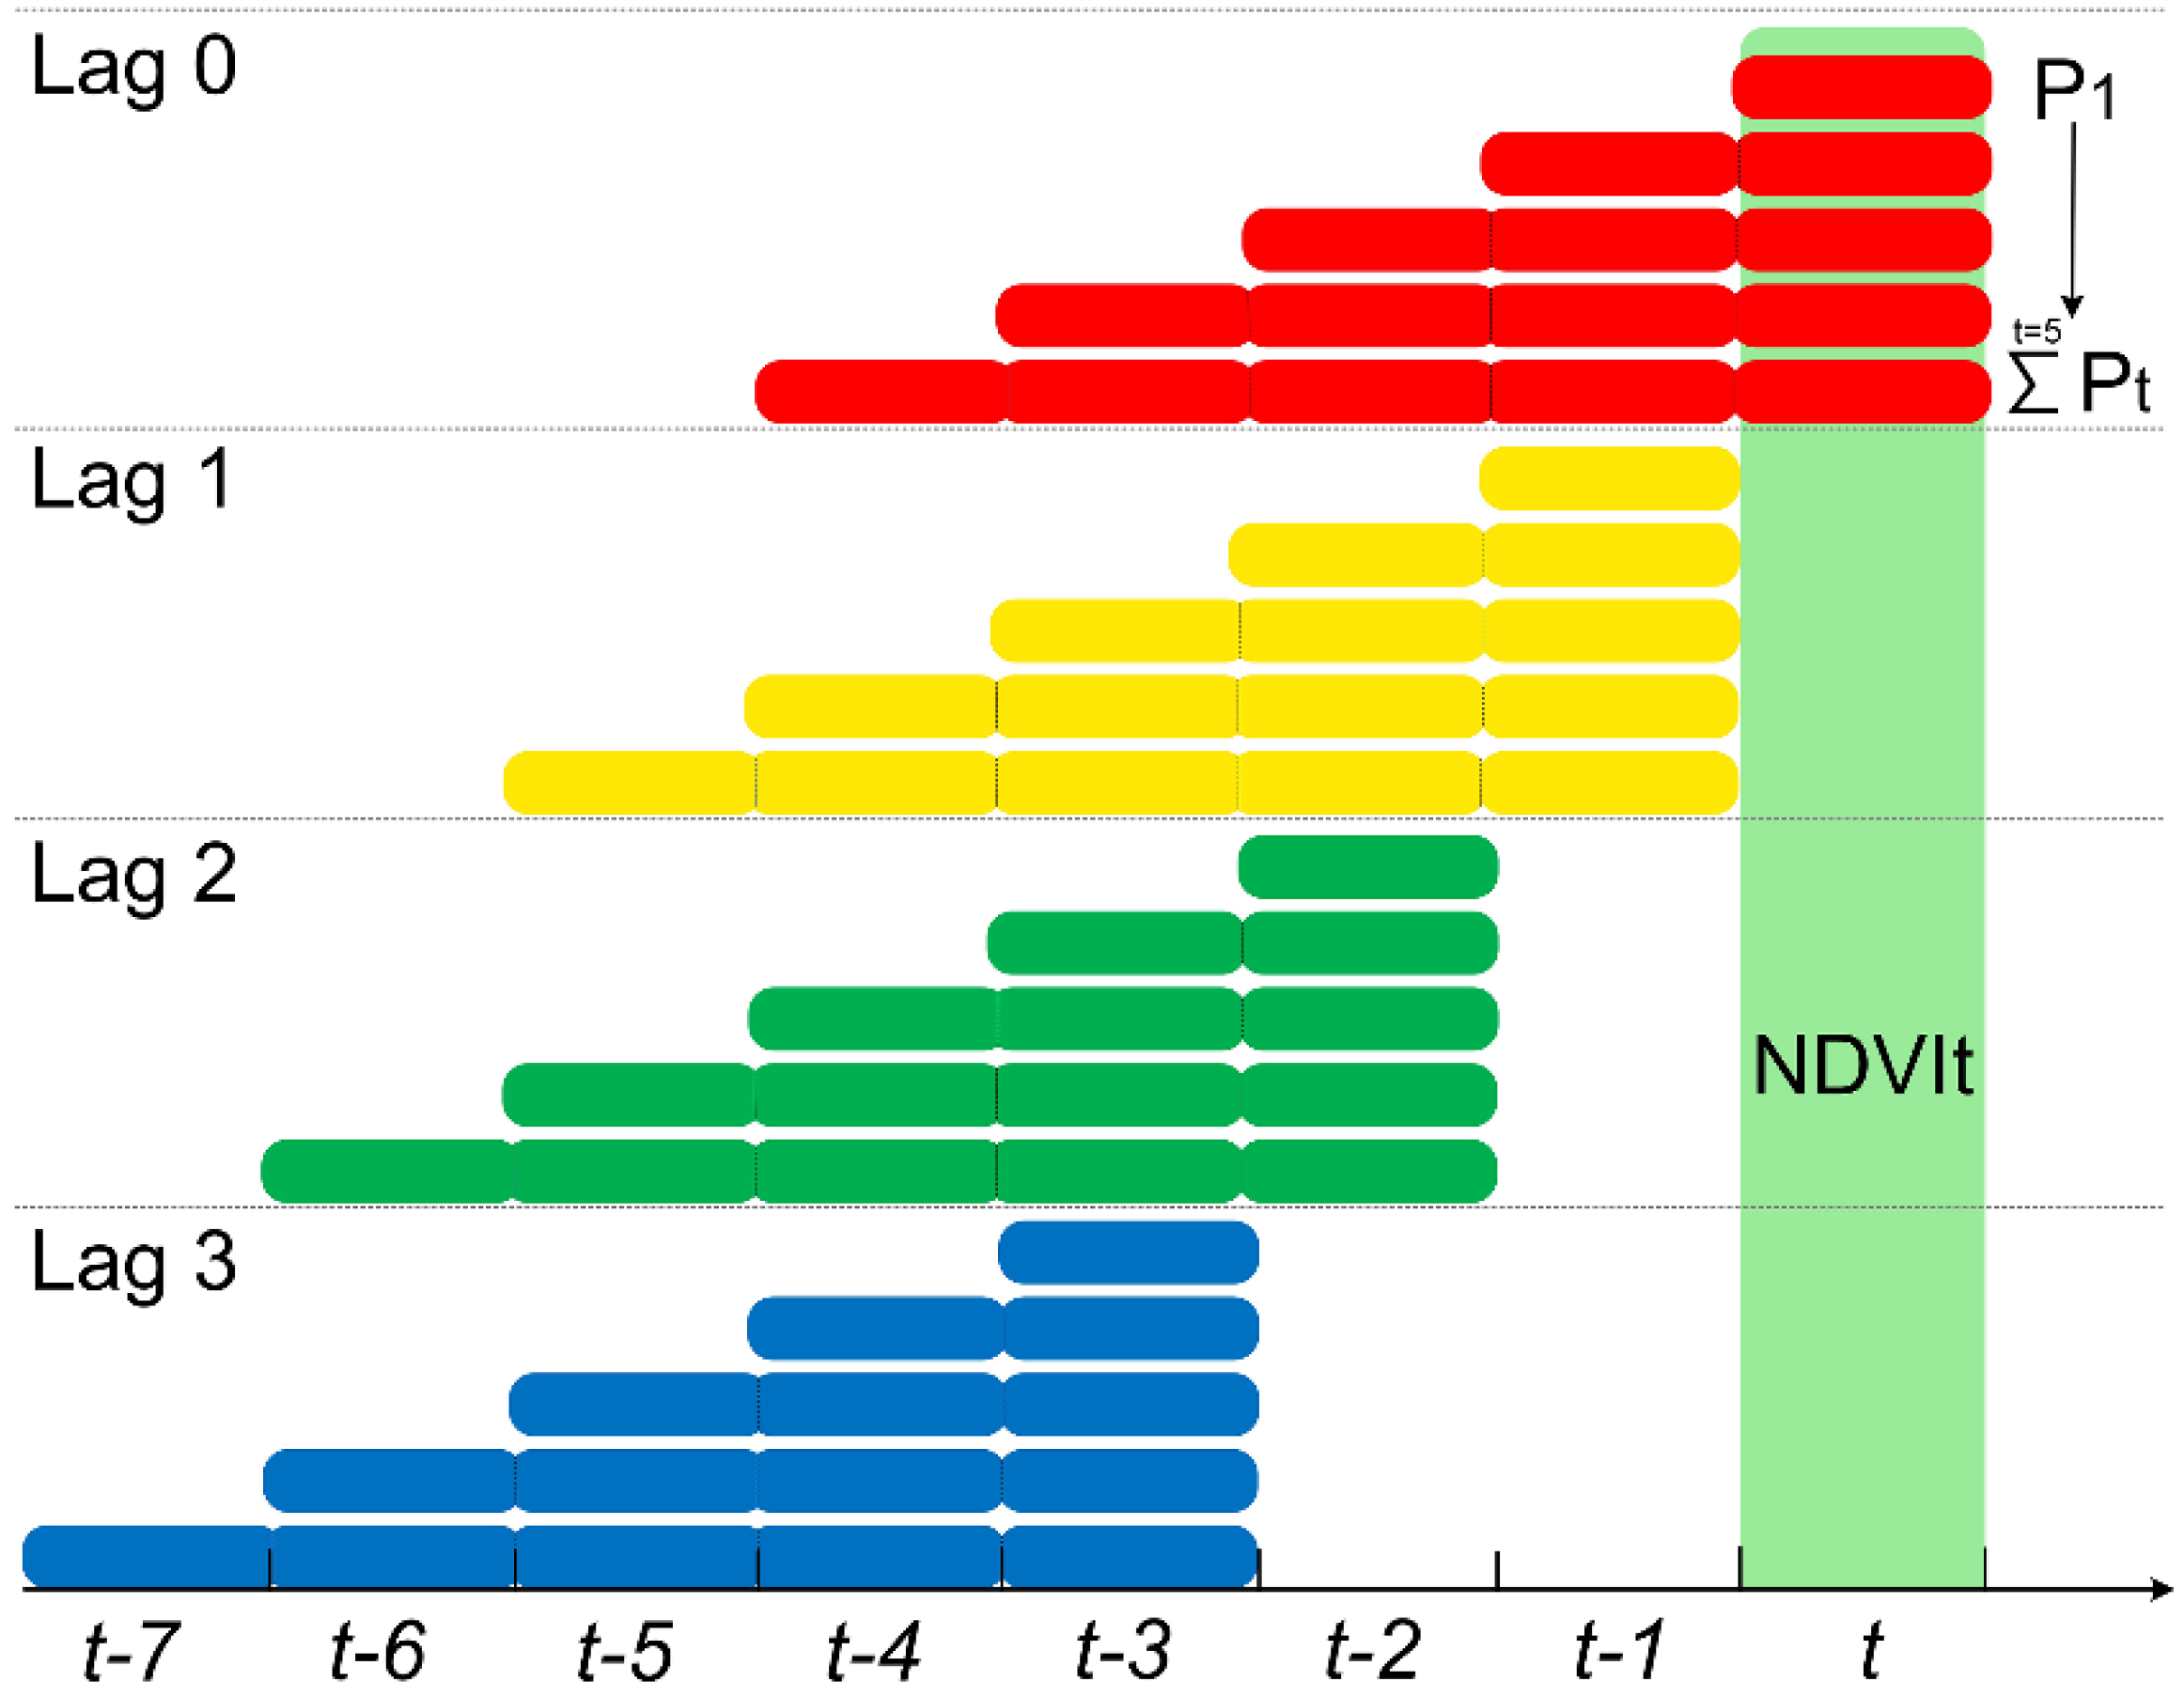
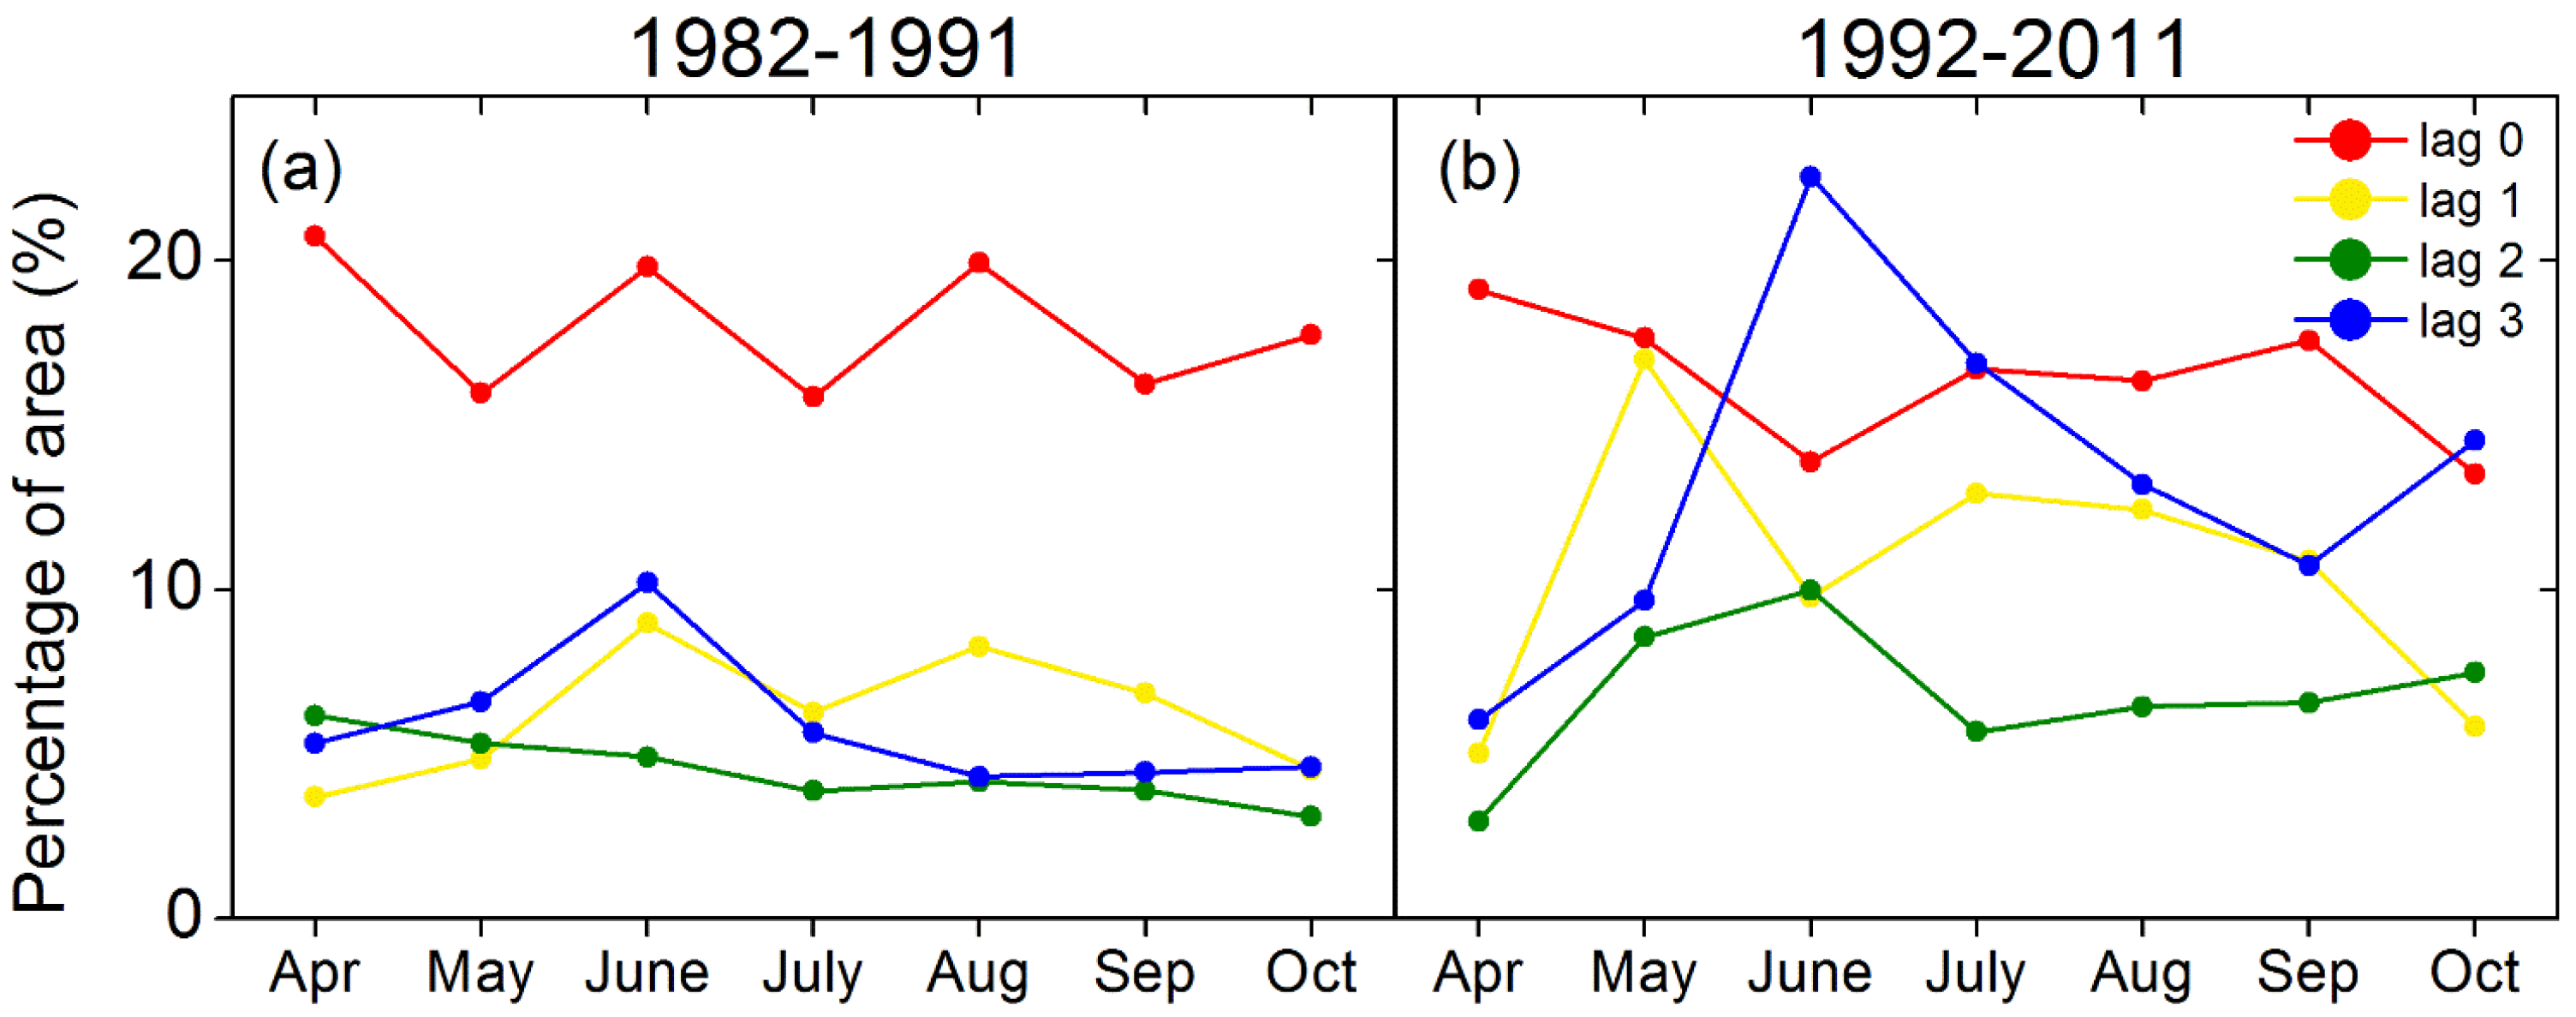
- The relationship between NDVI and precipitation was analyzed through partial correlation according to Equation (2). The time-lagged correlations were performed for four different month lags (lag 0, lag 1, lag 2, and lag 3) for each pixel. For each lag effect, we considered the cumulative effect of 1–5 months [17], resulting in 20 lag-correlations for all conditions (Figure 2).
- To assess the most accurate lag-response of the vegetation to precipitation changes, we adopted the maximum correlation coefficient of the 20 correlation analyses for each pixel.
- Through the maximum correlation coefficient, we determined the lag time from the 20 lag-correlation results. The lag effects were illustrated by the maximum correlation coefficient and corresponding lag time.
3. Results
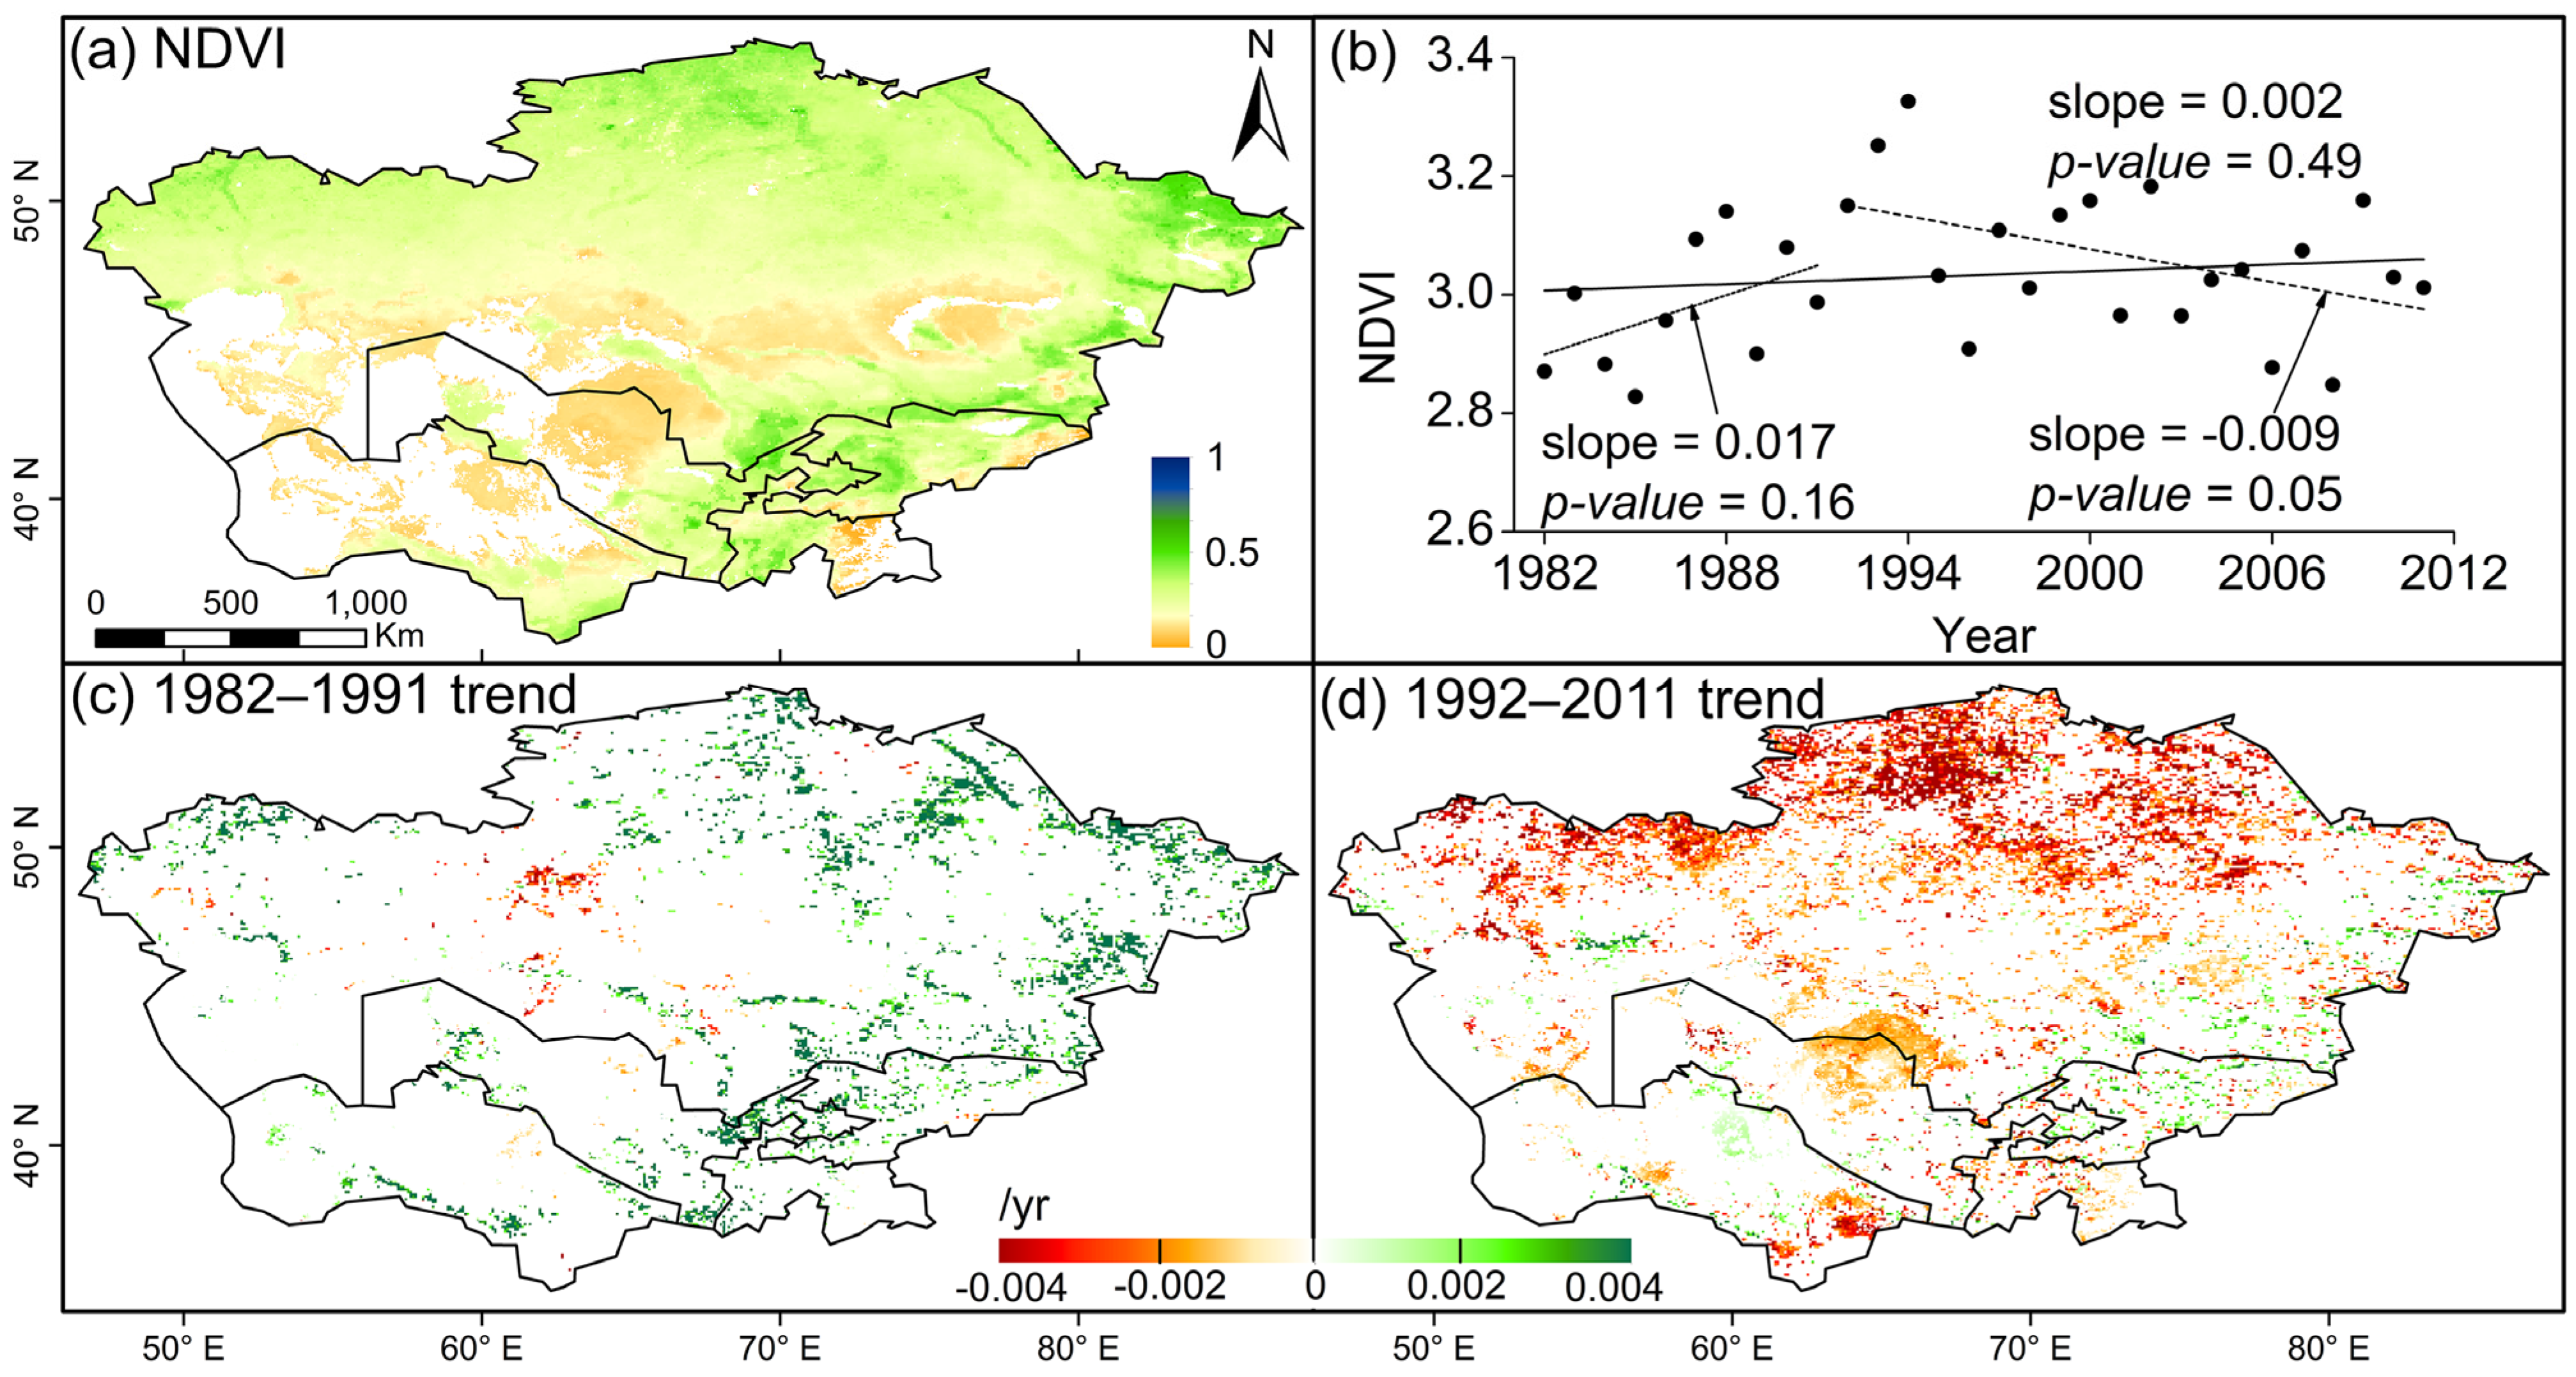
3.1. Annual Trends in the Climatic Factors and NDVI


3.2. Seasonal Trends in the Climatic Factors and NDVI


| Trend | Spring | Summer | Autumn | ||||
|---|---|---|---|---|---|---|---|
| 1982–1991 | 1992–2011 | 1982–1991 | 1992–2011 | 1982–1991 | 1992–2011 | ||
| Precip | + | 0.0% | 0.5% | 0.1% | 0.3% | 0.0% | 0.5% |
| − | 0.1% | 0.6% | 0.0% | 0.6% | 0.5% | 1.5% | |
| Temp | + | 1.1% | 43.9% | 1.8% | 41.9% | 16.2% | 78.9% |
| − | 3.6% | 0.0% | 0.0% | 0.8% | 0.0% | 0.0% | |
| NDVI | + | 4.5% | 17.5% | 7.9% | 4.5% | 13.5% | 3.6% |
| − | 0.5% | 7.2% | 0.3% | 13.5% | 0.4% | 27.1% | |
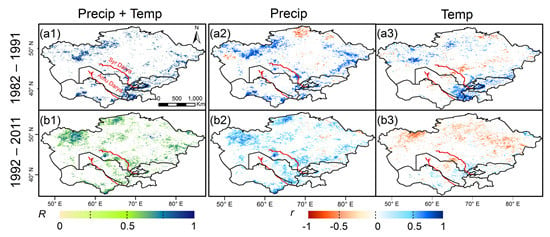
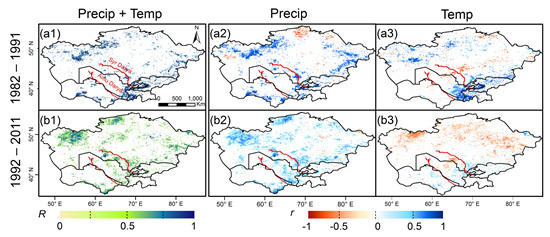
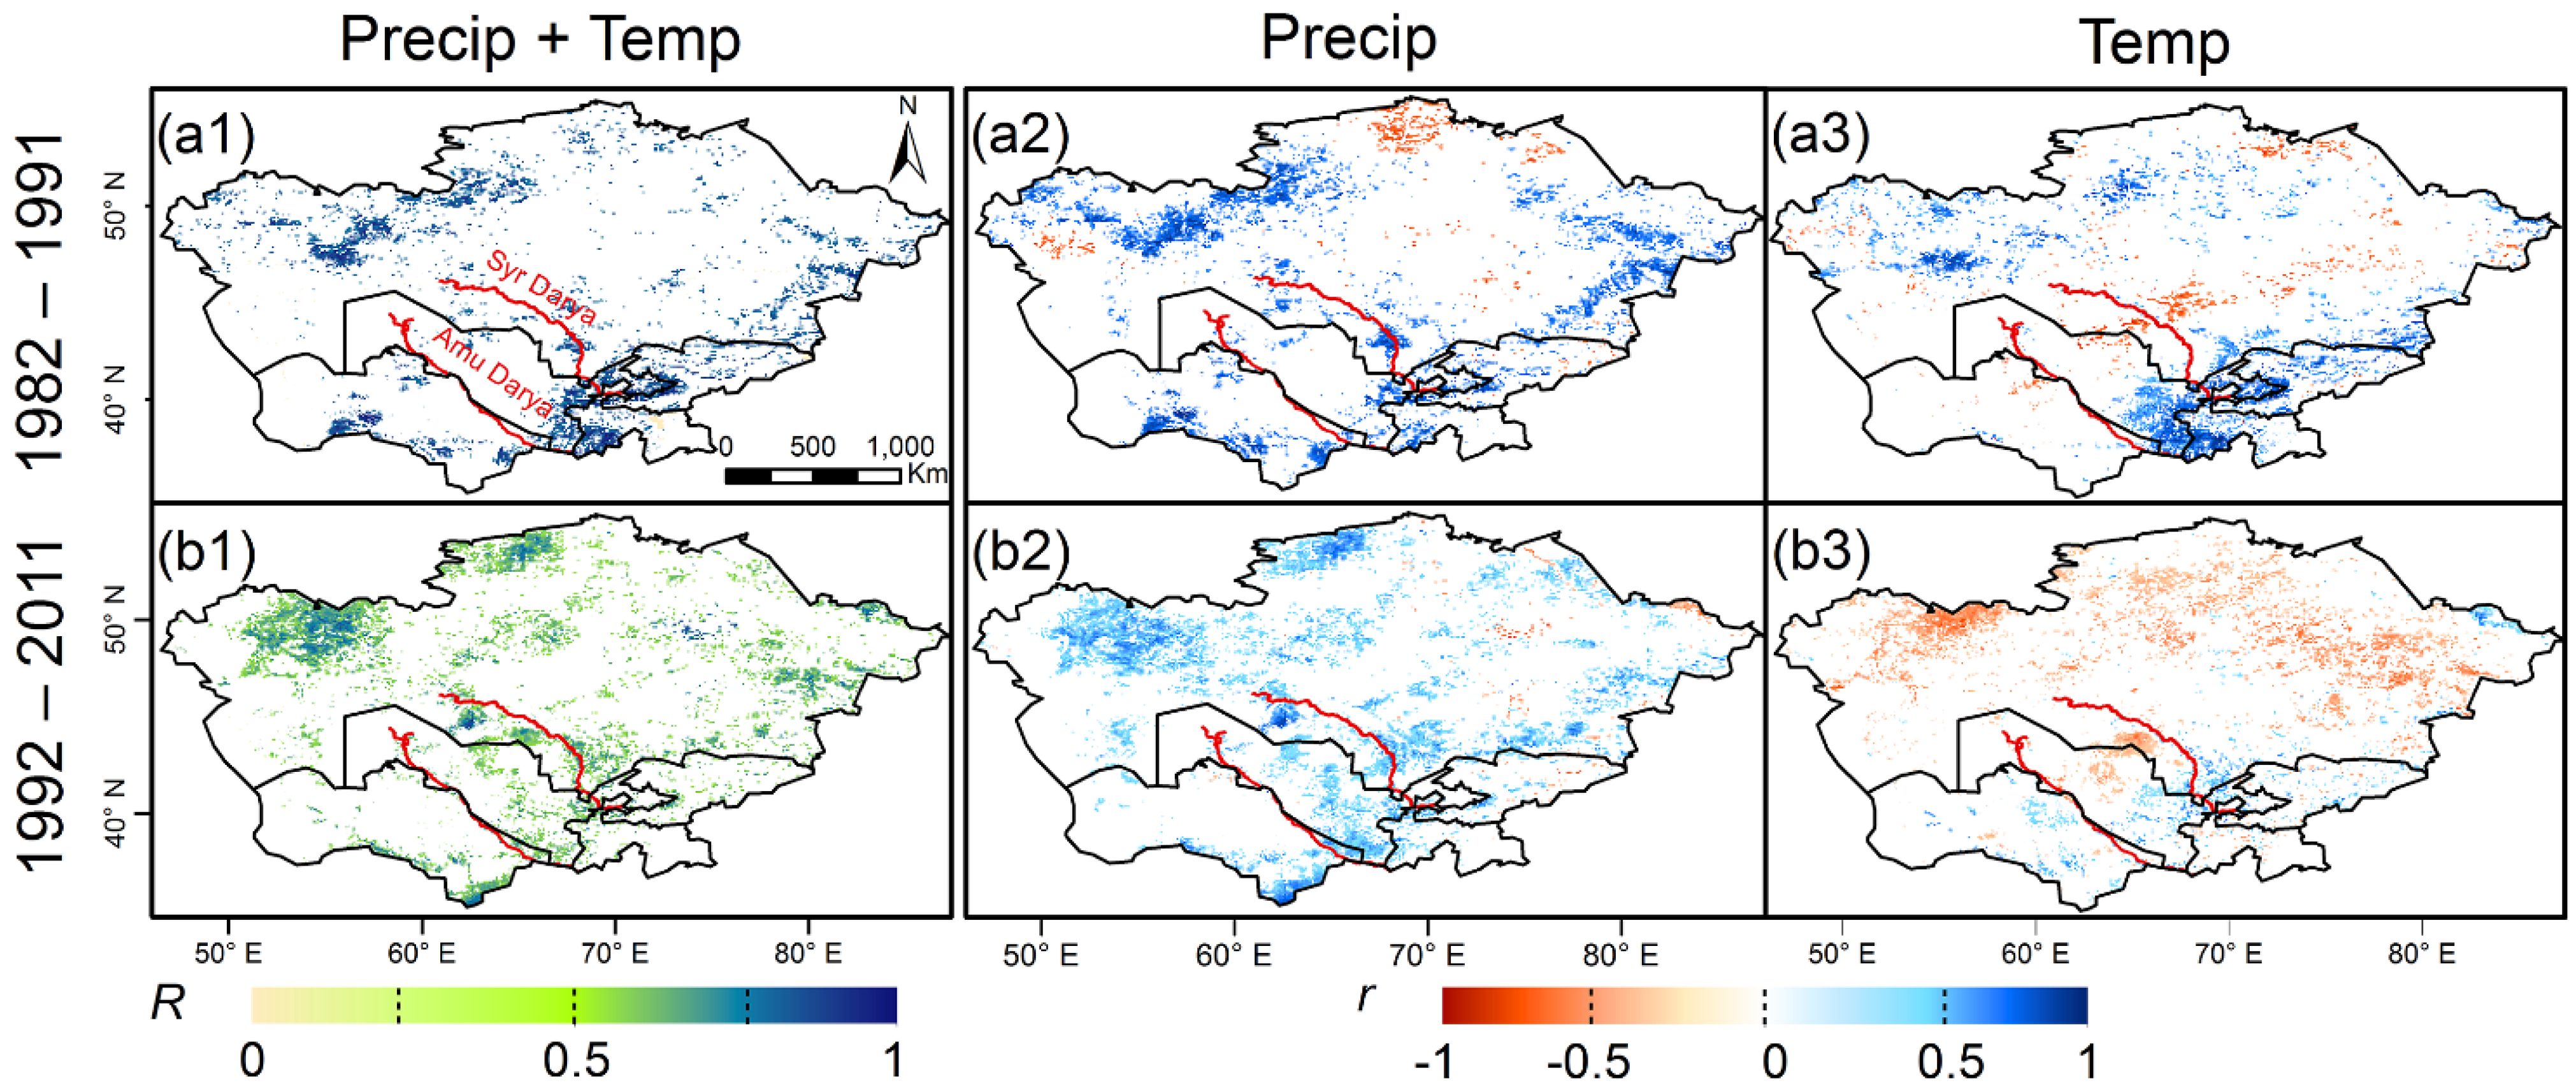
3.3. Climate Impact on the Vegetation Greenness.

3.4. Lagged-Response of NDVI to Precipitation


4. Discussion
4.1. Vegetation Variations and Their Relationships with Climatic Factors
4.2. Potential Impacts of the USSR Collapse on Climate-Vegetation Relationships
5. Conclusions
- The overall trends of NDVI evidently differed before and after 1992. The vegetation greenness showed an increasing trend for most areas before 1991, but experienced a dramatic decrease in 1992–2011.
- Climate largely contributed to the greening/browning trends in Central Asia during these two periods, but its influence on greenness varied significantly. The increasing temperature prompted vegetation greening before 1991 for most areas. However, in 1992–2011, this warming trend resulted in desiccation, suppressing the greening trend by increasing evapotranspiration and fire occurrences. The precipitation-controlled area expanded in 1992–2011, compared to 1982–1991. Moreover, the time-lag response of plants to precipitation extended to 1–3 months in 1992–2011.
- Considering the distinctive greening/browning trends and their climatic responses during the pre- and post-USSR collapse, the effect of socio-economic changes on the climate-vegetation relationships cannot be ignored, such as the human migration in Kazakhstan and land-use policy changes in the Amu Darya and Syr Darya basins during the post-USSR period. Similar to vegetation greenness, these policy changes also had significant impacts on animals, with Bragina et al. [79] showing a rapid decline in large mammal populations in Russia, after the USSR collapse.
- Our findings contributed to a comprehensive understanding of the role of climate change and its impact on drylands in Central Asia pre- and post-USSR collapse. Furthermore, our results provide an important illustration of the integrated effect of both climate variation and human disturbance on dryland vegetation growth. These findings will bring additional insight to the future response and adaptation of vegetation to climate change and human disturbance in the world’s drylands.
Acknowledgements
Author Contributions
Conflicts of Interest
References
- United Nations Environment Program (UNEP). World Atlas of Desertification; Revised Edition; Edward Arnold: London, UK, 1997. [Google Scholar]
- Food and Agriculture Organization of the United Nations (FAO). FAOSTAT Food and Agriculture Organization On-Line Databases. Available online: http://faostat3.fao.org/faostat-gateway/go/to/download/O/OA/E (accessed on 27 September 2013).
- Loboda, T.V.; Giglio, L.; Boschetti, L.; Justice, C.O. Regional fire monitoring and characterization using global NASA MODIS fire products in dry lands of Central Asia. Front. Earth Sci. 2012, 6, 196–205. [Google Scholar] [CrossRef]
- Lioubimtseva, E.; Cole, R.; Adams, J.M.; Kapustin, G. Impacts of climate and land-cover changes in arid lands of Central Asia. J. Arid. Environ. 2005, 62, 285–308. [Google Scholar] [CrossRef]
- Piao, S.L.; Wang, X.H.; Ciais, P.; Zhu, B.; Wang, T.; Liu, J. Changes in satellite-derived vegetation growth trend in temperate and boreal Eurasia from 1982 to 2006. Glob. Change Biol. 2011, 17, 3228–3239. [Google Scholar] [CrossRef]
- Fensholt, R.; Proud, S.R. Evaluation of earth observation based long term vegetation trends—Intercomparing NDVI time series trend analysis consistency of Sahel from AVHRR GIMMS, Terra MODIS and SPOT VGT data. Remote Sens. Environ. 2012, 119, 131–147. [Google Scholar] [CrossRef]
- Mohammat, A.; Wang, X.; Xu, X.; Peng, L.; Yang, Y.; Zhang, X.; Myneni, R.B.; Piao, S. Drought and spring cooling induced recent decrease in vegetation growth in Inner Asia. Agr. Forest. Meteorol. 2013, 178–179, 21–30. [Google Scholar] [CrossRef]
- Verstraete, M.M. Defining desertification—A review. Clim. Change. 1986, 9, 5–18. [Google Scholar] [CrossRef]
- Asian Development Bank (ADB). Land Degradation in Central Asia. ADB TA 6356-REG: Central Asian Countries Initiative for Land Management Multicountry Partnership Framework Support Project. Available online: http://aoa.ew.eea.europa.eu/virtual-library-viewer/answer_8349096812 (accessed on 14 October 2014).
- Intergovernmental Panel on Climate Change (IPCC). Climate Change; The IPCC Third Assessment Report, I (The Scientific Basis), II (Impacts, Adaptation, and Vulnerability) and III (Mitigation); Cambridge University Press: Cambridge, UK/New York, NY, USA, 2001. [Google Scholar]
- Lioubimtseva, E.; Henebry, G.M. Climate and environmental change in arid Central Asia: Impacts, vulnerability, and adaptations. J. Arid. Environ. 2009, 73, 963–977. [Google Scholar] [CrossRef]
- Hu, Z.Y.; Zhang, C.; Hu, Q.; Tian, H.Q. Temperature changes in Central Asia from 1979 to 2011 based on multiple datasets. J. Clim. 2014, 27, 1143–1167. [Google Scholar] [CrossRef]
- Mannig, B.; Muller, M.; Starke, E.; Merkenschlager, C.; Mao, W.Y.; Zhi, X.F.; Podzun, R.; Jacob, D.; Paeth, H. Dynamical downscaling of climate change in Central Asia. Glob. Planet. Change 2013, 110, 26–39. [Google Scholar] [CrossRef]
- Intergovernmental Panel on Climate Change (IPCC). Climate Change 2007: Impacts, Adaptation and Vulnerability; IPCC: Cambridge, UK, 2007. [Google Scholar]
- Eisfelder, C.; Klein, I.; Niklaus, M.; Kuenzer, C. Net primary productivity in Kazakhstan, its spatio-temporal patterns and relation to meteorological variables. J. Arid. Environ. 2014, 103, 17–30. [Google Scholar] [CrossRef]
- Propastin, P.A.; Kappas, M.; Muratova, N.R. Inter-annual changes in vegetation activities and their relationship to temperature and precipitation in Central Asia from 1982 to 2003. J. Environ. Inform. 2008, 12, 75–87. [Google Scholar] [CrossRef]
- Gessner, U.; Naeimi, V.; Klein, I.; Kuenzer, C.; Klein, D.; Dech, S. The relationship between precipitation anomalies and satellite-derived vegetation activity in Central Asia. Glob. Planet. Change 2012, 110, 74–87. [Google Scholar] [CrossRef]
- Nezlin, N.P.; Kostianoy, A.G.; Li, B.-L. Inter-annual variability and interaction of remote-sensed vegetation index and atmospheric precipitation in the Aral Sea region. J. Arid. Environ. 2005, 62, 677–700. [Google Scholar] [CrossRef]
- Behnke, R. The Socio-Economic Causes and Consequences of Desertification in Central Asia; Springer: Dordrecht, The Netherlands, 2008. [Google Scholar]
- Dubovyk, O.; Menz, G.; Conrad, C.; Kan, E.; Machwitz, M.; Khamzina, A. Spatio-temporal analyses of cropland degradation in the irrigated lowlands of Uzbekistan using remote-sensing and logistic regression modeling. Environ. Monit. Assess. 2013, 185, 4775–4790. [Google Scholar] [CrossRef] [PubMed]
- Dubovyk, O.; Menz, G.; Conrad, C.; Lamers, J.P.A.; Lee, A.; Khamzina, A. Spatial targeting of land rehabilitation: A relational analysis of cropland productivity decline in arid Uzbekistan. Erdkunde 2013, 67, 167–181. [Google Scholar] [CrossRef]
- Kuemmerle, T.; Hostert, P.; Radeloff, V.C.; van der Linden, S.; Perzanowski, K.; Kruhlov, I. Cross-border comparison of post-socialist farmland abandonment in the Carpathians. Ecosystems 2008, 11, 614–628. [Google Scholar] [CrossRef]
- Kuemmerle, T.; Olofsson, P.; Chaskovskyy, O.; Baumann, M.; Ostapowicz, K.; Woodcock, C.E.; Houghton, R.A.; Hostert, P.; Keeton, W.S.; Radeloff, V.C. Post-Soviet farmland abandonment, forest recovery, and carbon sequestration in western Ukraine. Glob. Change Biol. 2011, 17, 1335–1349. [Google Scholar] [CrossRef]
- Bogaert, J.; Zhou, L.; Tucker, C.J.; Myneni, R.B.; Ceulemans, R. Evidence for a persistent and extensive greening trend in Eurasia inferred from satellite vegetation index data. J. Geophys. Res. 2002, 107. [Google Scholar] [CrossRef]
- Kariyeva, J.; van Leeuwen, W.J.D. Phenological dynamics of irrigated and natural drylands in Central Asia before and after the USSR collapse. Agr. Ecosyst. Environ. 2012, 162, 77–89. [Google Scholar] [CrossRef]
- De Pauw, E. ICARDA Regional GIS Datasets for Central Asia: Explanatory Notes; GIS Unit Technical Bulletin; International Center for Agricultural Research in the Dry Areas (ICARDA): Aleppo, Syria, 2008. [Google Scholar]
- Nature Earth. Available online: http://www.naturalearthdata.com/ (accessed on 8 June 2011).
- Savvaitova, K.; Petr, T. Lake Issyk-Kul, Kirgizia. Int. J. Salt Lake Res. 1992, 1, 21–46. [Google Scholar] [CrossRef]
- Bai, J.; Chen, X.; Li, J.; Yang, L.; Fang, H. Changes in the area of inland lakes in arid regions of central Asia during the past 30 years. Environ. Monit. Assess. 2011, 178, 247–256. [Google Scholar] [CrossRef] [PubMed]
- Saiko, T.A.; Zonn, I.S. Irrigation expansion and dynamics of desertification in the Circum-Aral region of Central Asia. Appl. Geogr. 2000, 20, 349–367. [Google Scholar] [CrossRef]
- Fensholt, R.; Rasmussen, K.; Kaspersen, P.; Huber, S.; Horion, S.; Swinnen, E. Assessing land degradation/recovery in the African Sahel from long-term Earth Observation based primary productivity and precipitation relationships. Remote Sens. 2013, 5, 664–686. [Google Scholar]
- Pinzon, J.; Brown, M.E.; Tucker, C.J. Satellite time series correction of orbital drift artifacts using empirical mode decomposition. In Hilbert-Huang Transform: Introduction and Applications; Huang, N., Ed.; World Scientific: Singapore, 2005; pp. 167–186. [Google Scholar]
- Zhu, Z.C.; Bi, J.; Pan, Y.Z.; Ganguly, S.; Anav, A.; Xu, L.; Samanta, A.; Piao, S.L.; Nemani, R.R.; Myneni, R.B. Global data sets of vegetation leaf area index (LAI)3g and fraction of photosynthetically active radiation (FPAR)3g derived from Global Inventory Modeling and Mapping Studies (GIMMS) Normalized Difference Vegetation Index (NDVI3g) for the Period 1981 to 2011. Remote Sens. 2013, 5, 927–948. [Google Scholar]
- Zeng, F.W.; Collatz, G.J.; Pinzon, J.E.; Ivanoff, A. Evaluating and quantifying the climate-driven interannual variability in Global Inventory Modeling and Mapping Studies (GIMMS) Normalized Difference Vegetation Index (NDVI3g) at Global Scales. Remote Sens. 2013, 5, 3918–3950. [Google Scholar]
- Klein, I.; Gessner, U.; Kuenzer, C. Regional land cover mapping and change detection in Central Asia using MODIS time-series. Appl. Geogr. 2012, 35, 219–234. [Google Scholar]
- Global Modeling and Assimilation Office. Available online: http://gmao.gsfc.nasa.gov/ (accessed on 16 November 2013).
- Rienecker, M.M.; Suarez, M.J.; Gelaro, R.; Todling, R.; Bacmeister, J.; Liu, E.; Bosilovich, M.G.; Schubert, S.D.; Takacs, L.; Kim, G.-K.; et al. MERRA: NASA’s modern-era retrospective analysis for research and applications. J. Climate 2011, 24, 3624–3648. [Google Scholar] [CrossRef]
- Birkes, D.; Dodge, Y. Alternative Methods of Regression; John Wiley & Sons: New York, NY, USA, 2011; Volume 190. [Google Scholar]
- Liu, S.; Gong, P. Change of surface cover greenness in China between 2000 and 2010. Chin. Sci. Bull. 2012, 57, 2835–2845. [Google Scholar] [CrossRef]
- Powell, J.L. Least absolute deviations estimation for the censored regression-model. J. Econom. 1984, 25, 303–325. [Google Scholar] [CrossRef]
- Zhang, L.; Guo, H.; Wang, C.; Ji, L.; Li, J.; Wang, K.; Dai, L. The long-term trends (1982–2006) in vegetation greenness of the alpine ecosystem in the Qinghai-Tibetan Plateau. Environ. Earth Sci. 2014, 72, 1827–1841. [Google Scholar] [CrossRef]
- Wang, J.; Rich, P.M.; Price, K.P. Temporal responses of NDVI to precipitation and temperature in the central Great Plains, USA. Int. J. Remote. Sens. 2003, 24, 2345–2364. [Google Scholar] [CrossRef]
- Ji, L.; Peters, A.J. Lag and seasonality considerations in evaluating AVHRR NDVI response to precipitation. Photogramm. Eng. Remote Sens. 2005, 71, 1053–1061. [Google Scholar] [CrossRef]
- De Beurs, K.M.; Wright, C.K.; Henebry, G.M. Dual scale trend analysis for evaluating climatic and anthropogenic effects on the vegetated land surface in Russia and Kazakhstan. Environ. Res. Lett. 2009, 4, 045012. [Google Scholar] [CrossRef]
- Nemani, R.R.; Keeling, C.D.; Hashimoto, H.; Jolly, W.M.; Piper, S.C.; Tucker, C.J.; Myneni, R.B.; Running, S.W. Climate-driven increases in global terrestrial net primary production from 1982 to 1999. Science 2003, 300, 1560–1563. [Google Scholar] [CrossRef] [PubMed]
- Tebaldi, C.; Hayhoe, K.; Arblaster, J.M.; Meehl, G.A. Going to the extremes. Clim. Change 2006, 79, 185–211. [Google Scholar] [CrossRef]
- Lucht, W.; Prentice, I.C.; Myneni, R.B.; Sitch, S.; Friedlingstein, P.; Cramer, W.; Bousquet, P.; Buermann, W.; Smith, B. Climatic control of the high-latitude vegetation greening trend and Pinatubo effect. Science 2002, 296, 1687–1689. [Google Scholar] [CrossRef] [PubMed]
- Park, S.S.; Kim, J.; Lee, J.; Lee, S.; Kim, J.S.; Chang, L.S.; Ou, S. Combined dust detection algorithm by using MODIS infrared channels over East Asia. Remote Sens. Environ. 2014, 141, 24–39. [Google Scholar] [CrossRef]
- Tucker, C.J.; Fung, I.Y.; Keeling, C.D.; Gammon, R.H. Relationship between atmospheric CO2 variations and a satellite-derived vegetation index. Nature 1986, 319, 195–199. [Google Scholar] [CrossRef]
- Xiao, J.; Moody, A. Geographical distribution of global greening trends and their climatic correlates: 1982–1998. Int. J. Remote. Sens. 2005, 26, 2371–2390. [Google Scholar] [CrossRef]
- Zhou, L.; Tucker, C.J.; Kaufmann, R.K.; Slayback, D.; Shabanov, N.V.; Myneni, R.B. Variations in northern vegetation activity inferred from satellite data of vegetation index during 1981 to 1999. J. Geophys. Res. 2001, 106, 20069–20083. [Google Scholar] [CrossRef]
- Karnieli, A.; Agam, N.; Pinker, R.T.; Anderson, M.; Imhoff, M.L.; Gutman, G.G.; Panov, N.; Goldberg, A. Use of NDVI and land surface temperature for drought assessment: Merits and limitations. J. Clim. 2010, 23, 618–633. [Google Scholar] [CrossRef]
- Van der Molen, M.K.; Dolman, A.J.; Ciais, P.; Eglin, T.; Gobron, N.; Law, B.E.; Meir, P.; Peters, W.; Phillips, O.L.; Reichstein, M.; et al. Drought and ecosystem carbon cycling. Agr. Forest. Meteorol. 2011, 151, 765–773. [Google Scholar] [CrossRef]
- Xu, Z.Z.; Zhou, G.S. Combined effects of water stress and high temperature on photosynthesis, nitrogen metabolism and lipid peroxidation of a perennial grass Leymus chinensis. Planta 2006, 224, 1080–1090. [Google Scholar] [CrossRef] [PubMed]
- United Nations Development Programme (UNDP). The III–VI National Communication of the Republic of Kazakhstan to the UN Framework Convention on Climate Change (UNFCCC); UNDP: Astana, Kazakhstan, 2013; p. 13. [Google Scholar]
- Nicholson, S.E.; Davenport, M.L.; Malo, A.R. A comparison of the vegetation response to rainfall in the Sahel and East-Africa, using normalized difference vegetation index from NOAA AVHRR. Clim. Change 1990, 17, 209–241. [Google Scholar] [CrossRef]
- Donohue, R.J.; McVicar, T.R.; Roderick, M.L. Climate-related trends in Australian vegetation cover as inferred from satellite observations, 1981–2006. Glob. Change Biol. 2009, 15, 1025–1039. [Google Scholar] [CrossRef]
- Inouye, D.W. The ecological and evolutionary significance of frost in the context of climate change. Ecol. Lett. 2000, 3, 457–463. [Google Scholar] [CrossRef]
- Li, X.; Koike, T. Frozen soil parameterization in SiB2 and its validation with GAME-Tibet observations. Cold Reg. Sci. Technol. 2003, 36, 165–182. [Google Scholar] [CrossRef]
- Davenport, M.L.; Nicholson, S.E. On the relation between rainfall and the normalized difference vegetation index for diverse vegetation types in East-Africa. Int. J. Remote. Sens. 1993, 14, 2369–2389. [Google Scholar] [CrossRef]
- Cui, L.L.; Shi, J. Temporal and spatial response of vegetation NDVI to temperature and precipitation in eastern China. J. Geogr. Sci. 2010, 20, 163–176. [Google Scholar] [CrossRef]
- Ji, L.; Peters, A.J. A spatial regression procedure for evaluating the relationship between AVHRR-NDVI and climate in the northern Great Plains. Int. J. Remote. Sens. 2004, 25, 297–311. [Google Scholar] [CrossRef]
- Davies, W.J.; Zhang, J. Root signals and the regulation of growth and development of plants in drying soil. Annu. Rev. Plant Phys. 1991, 42, 55–76. [Google Scholar] [CrossRef]
- Ogle, K.; Reynolds, J.F. Plant responses to precipitation in desert ecosystems: Integrating functional types, pulses, thresholds, and delays. Oecologia 2004, 141, 282–294. [Google Scholar] [CrossRef] [PubMed]
- Díaz, S.; Cabido, M. Plant functional types and ecosystem function in relation to global change. J. Veg. Sci. 1997, 8, 463–474. [Google Scholar] [CrossRef]
- Hobbs, R.J. Can we use plant functional types to describe and predict responses to environmental change? In Plant Functional Types: Their Relevance to Ecosystem Properties and Global Change; Smith, T.M., Shugart, H.H., Woodward, F.I., Eds.; Cambridge University Press: Cambridge, UK, 1997; pp. 66–90. [Google Scholar]
- Kramer, P. Changing concepts regarding plant water relations. Plant Cell Environ. 1988, 11, 565–568. [Google Scholar] [CrossRef]
- Hostert, P.; Kuemmerle, T.; Prishchepov, A.; Sieber, A.; Lambin, E.F.; Radeloff, V.C. Rapid land use change after socio-economic disturbances: The collapse of the Soviet Union versus Chernobyl. Environ. Res. Lett. 2011, 6, 045201. [Google Scholar] [CrossRef]
- World Resources Institute. World Resources 1996–97; Oxford University Press: New York, NY, USA, 1996. [Google Scholar]
- Lerman, Z.; Csaki, C.; Feder, G. Evolving farm structures and land use patterns in former socialist countries. Q. J. Int. Agr. 2004, 43, 309–336. [Google Scholar]
- Swinnen, F.M. Political Economy of Agrarian Reform in Central and Eastern Europe; Ashgate Publishing Ltd.: Aldershot, UK, 1997. [Google Scholar]
- Kaifu, P.; Zhang, Y.; Wang, Y.-J.; Wang, F.; Liu, Y. On Kazakhstan population and social development after its independence. J. Xinjiang Univ. 2010, 1, 024. (In Chinese) [Google Scholar]
- Ioffe, G.; Nefedova, T.; Zaslavsky, I. From spatial continuity to fragmentation: The case of Russian farming. Ann. Assoc. Am. Geogr. 2004, 94, 913–943. [Google Scholar]
- Chen, X.; Bai, J.; Li, X.Y.; Luo, G.P.; Li, J.L.; Li, B.L. Changes in land use/land cover and ecosystem services in Central Asia during 1990–2009. Curr. Opin. Environ. Sustain. 2013, 5, 116–127. [Google Scholar] [CrossRef]
- Micklin, P.P. Desiccation of the Aral Sea: A water management disaster in the Soviet Union. Science 1988, 241, 1170–1176. [Google Scholar] [CrossRef] [PubMed]
- Ji, C. Central Asian Countries Initiative for Land Management Multicountry Partnership Framework Support Project; ADB: Tashkent, Uzbekistan, 2008. [Google Scholar]
- Babu, S.C.; Tashmatov, A. Food Policy Reforms in Central Asia: Setting the Research Priorities; International Food Policy Research Institute: Washington, DC, USA, 2000. [Google Scholar]
- United Nations Environment Programme-World Conservation Monitoring Centre (UNEP-WCMC). State of the World’s Protected Areas 2007: An Annual Review of Global Conservation Progress; UNEP-WCMC: Cambridge, UK, 2008. [Google Scholar]
- Bragina, E.V.; Ives, A.R.; Pidgeon, A.M.; Kuemmerle, T.; Baskin, L.M.; Gubar, Y.P.; Piquer, R.M.; Keuler, N.S.; Petrosyan, V.G.; Radeloff, V.C. Rapid declines of large mammal populations after the collapse of the Soviet Union. Conserv. Biol. 2015. [Google Scholar] [CrossRef]
© 2015 by the authors; licensee MDPI, Basel, Switzerland. This article is an open access article distributed under the terms and conditions of the Creative Commons Attribution license (http://creativecommons.org/licenses/by/4.0/).
Share and Cite
Zhou, Y.; Zhang, L.; Fensholt, R.; Wang, K.; Vitkovskaya, I.; Tian, F. Climate Contributions to Vegetation Variations in Central Asian Drylands: Pre- and Post-USSR Collapse. Remote Sens. 2015, 7, 2449-2470. https://doi.org/10.3390/rs70302449
Zhou Y, Zhang L, Fensholt R, Wang K, Vitkovskaya I, Tian F. Climate Contributions to Vegetation Variations in Central Asian Drylands: Pre- and Post-USSR Collapse. Remote Sensing. 2015; 7(3):2449-2470. https://doi.org/10.3390/rs70302449
Chicago/Turabian StyleZhou, Yu, Li Zhang, Rasmus Fensholt, Kun Wang, Irina Vitkovskaya, and Feng Tian. 2015. "Climate Contributions to Vegetation Variations in Central Asian Drylands: Pre- and Post-USSR Collapse" Remote Sensing 7, no. 3: 2449-2470. https://doi.org/10.3390/rs70302449