
A Study of Coal Fire Propagation with Remotely Sensed Thermal Infrared Data

 , ,
, ,
Abstract
:
1. Introduction

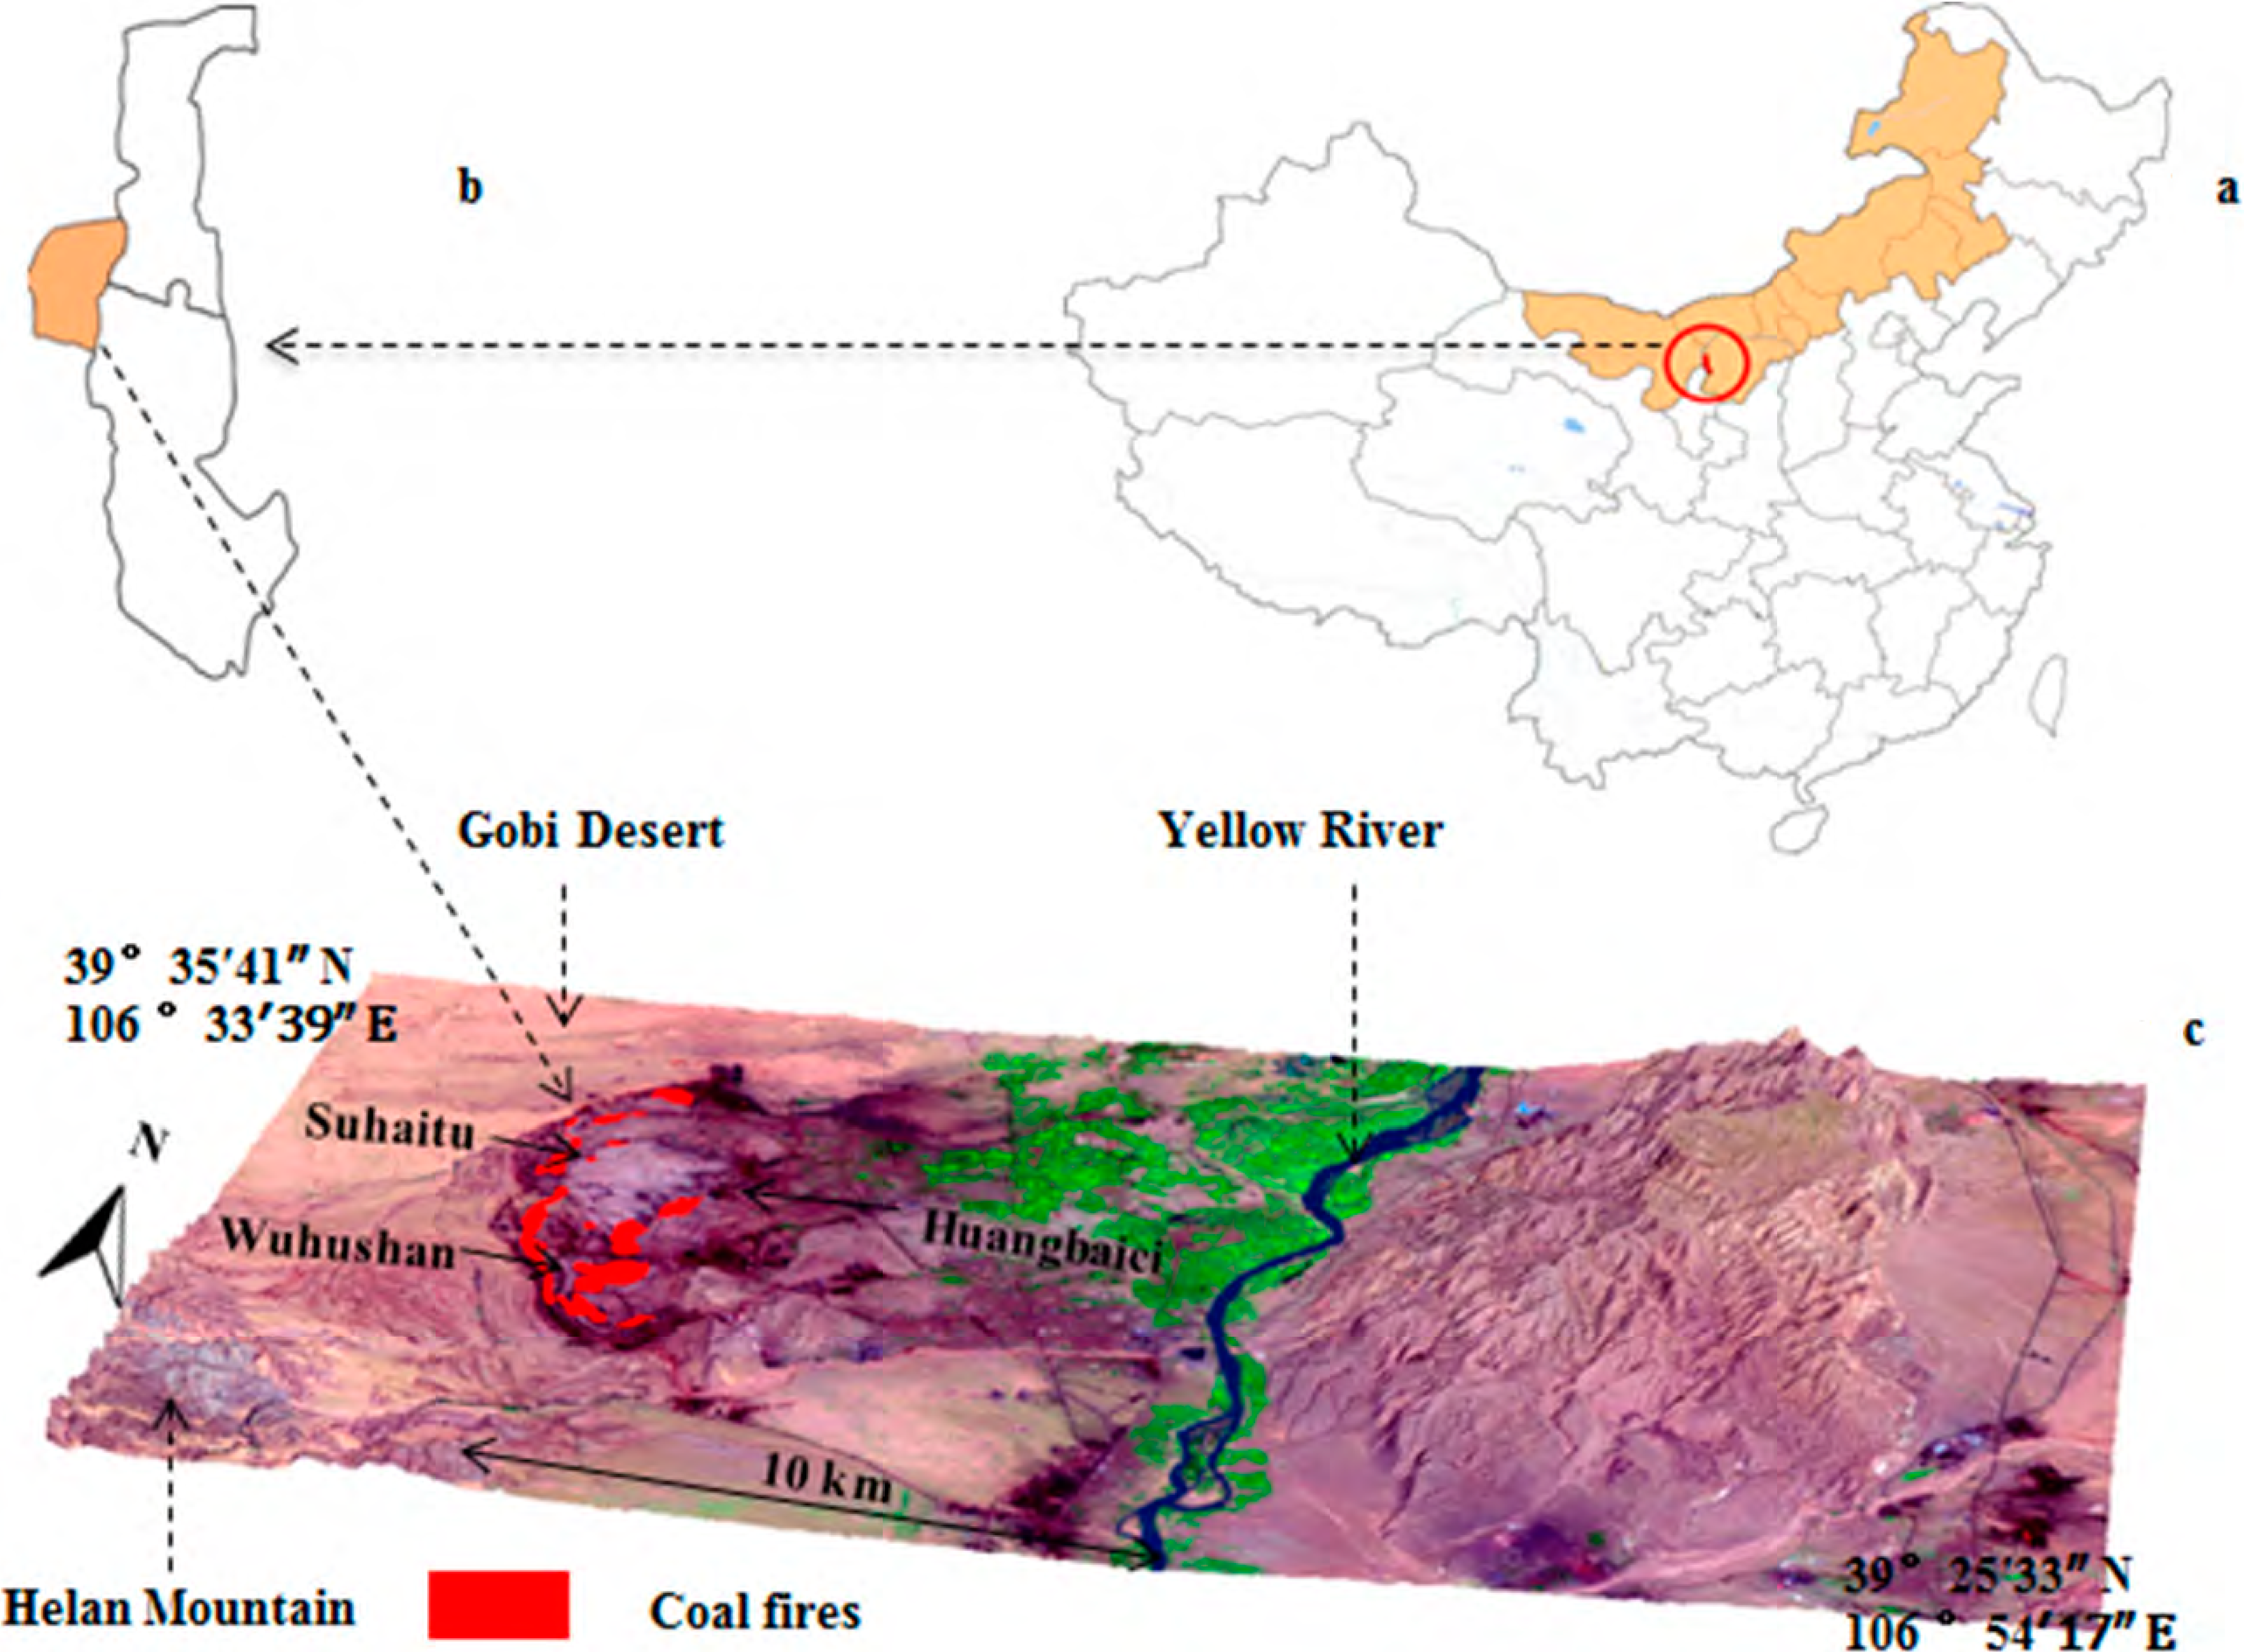
2. Study Area

3. Dataset and Pre-Processing

| Data Type | Acquisition Time | Spatial Resolution |
|---|---|---|
| ETM+ | 12 August 1999 | 60 m |
| ETM+ | 30 August 2000 | 60 m |
| ETM+ | 4 October 2001 | 60 m |
| ETM+ | 20 August 2002 | 60 m |
| ETM+ | 3 May 2003 | 60 m |
| TM | 17 August 2004 | 120 m |
| TM | 7 August 2006 | 120 m |
| ASTER | 8 August 2001 | 90 m |
| CFM | 2002–2003 | Scale: 1:5000 |
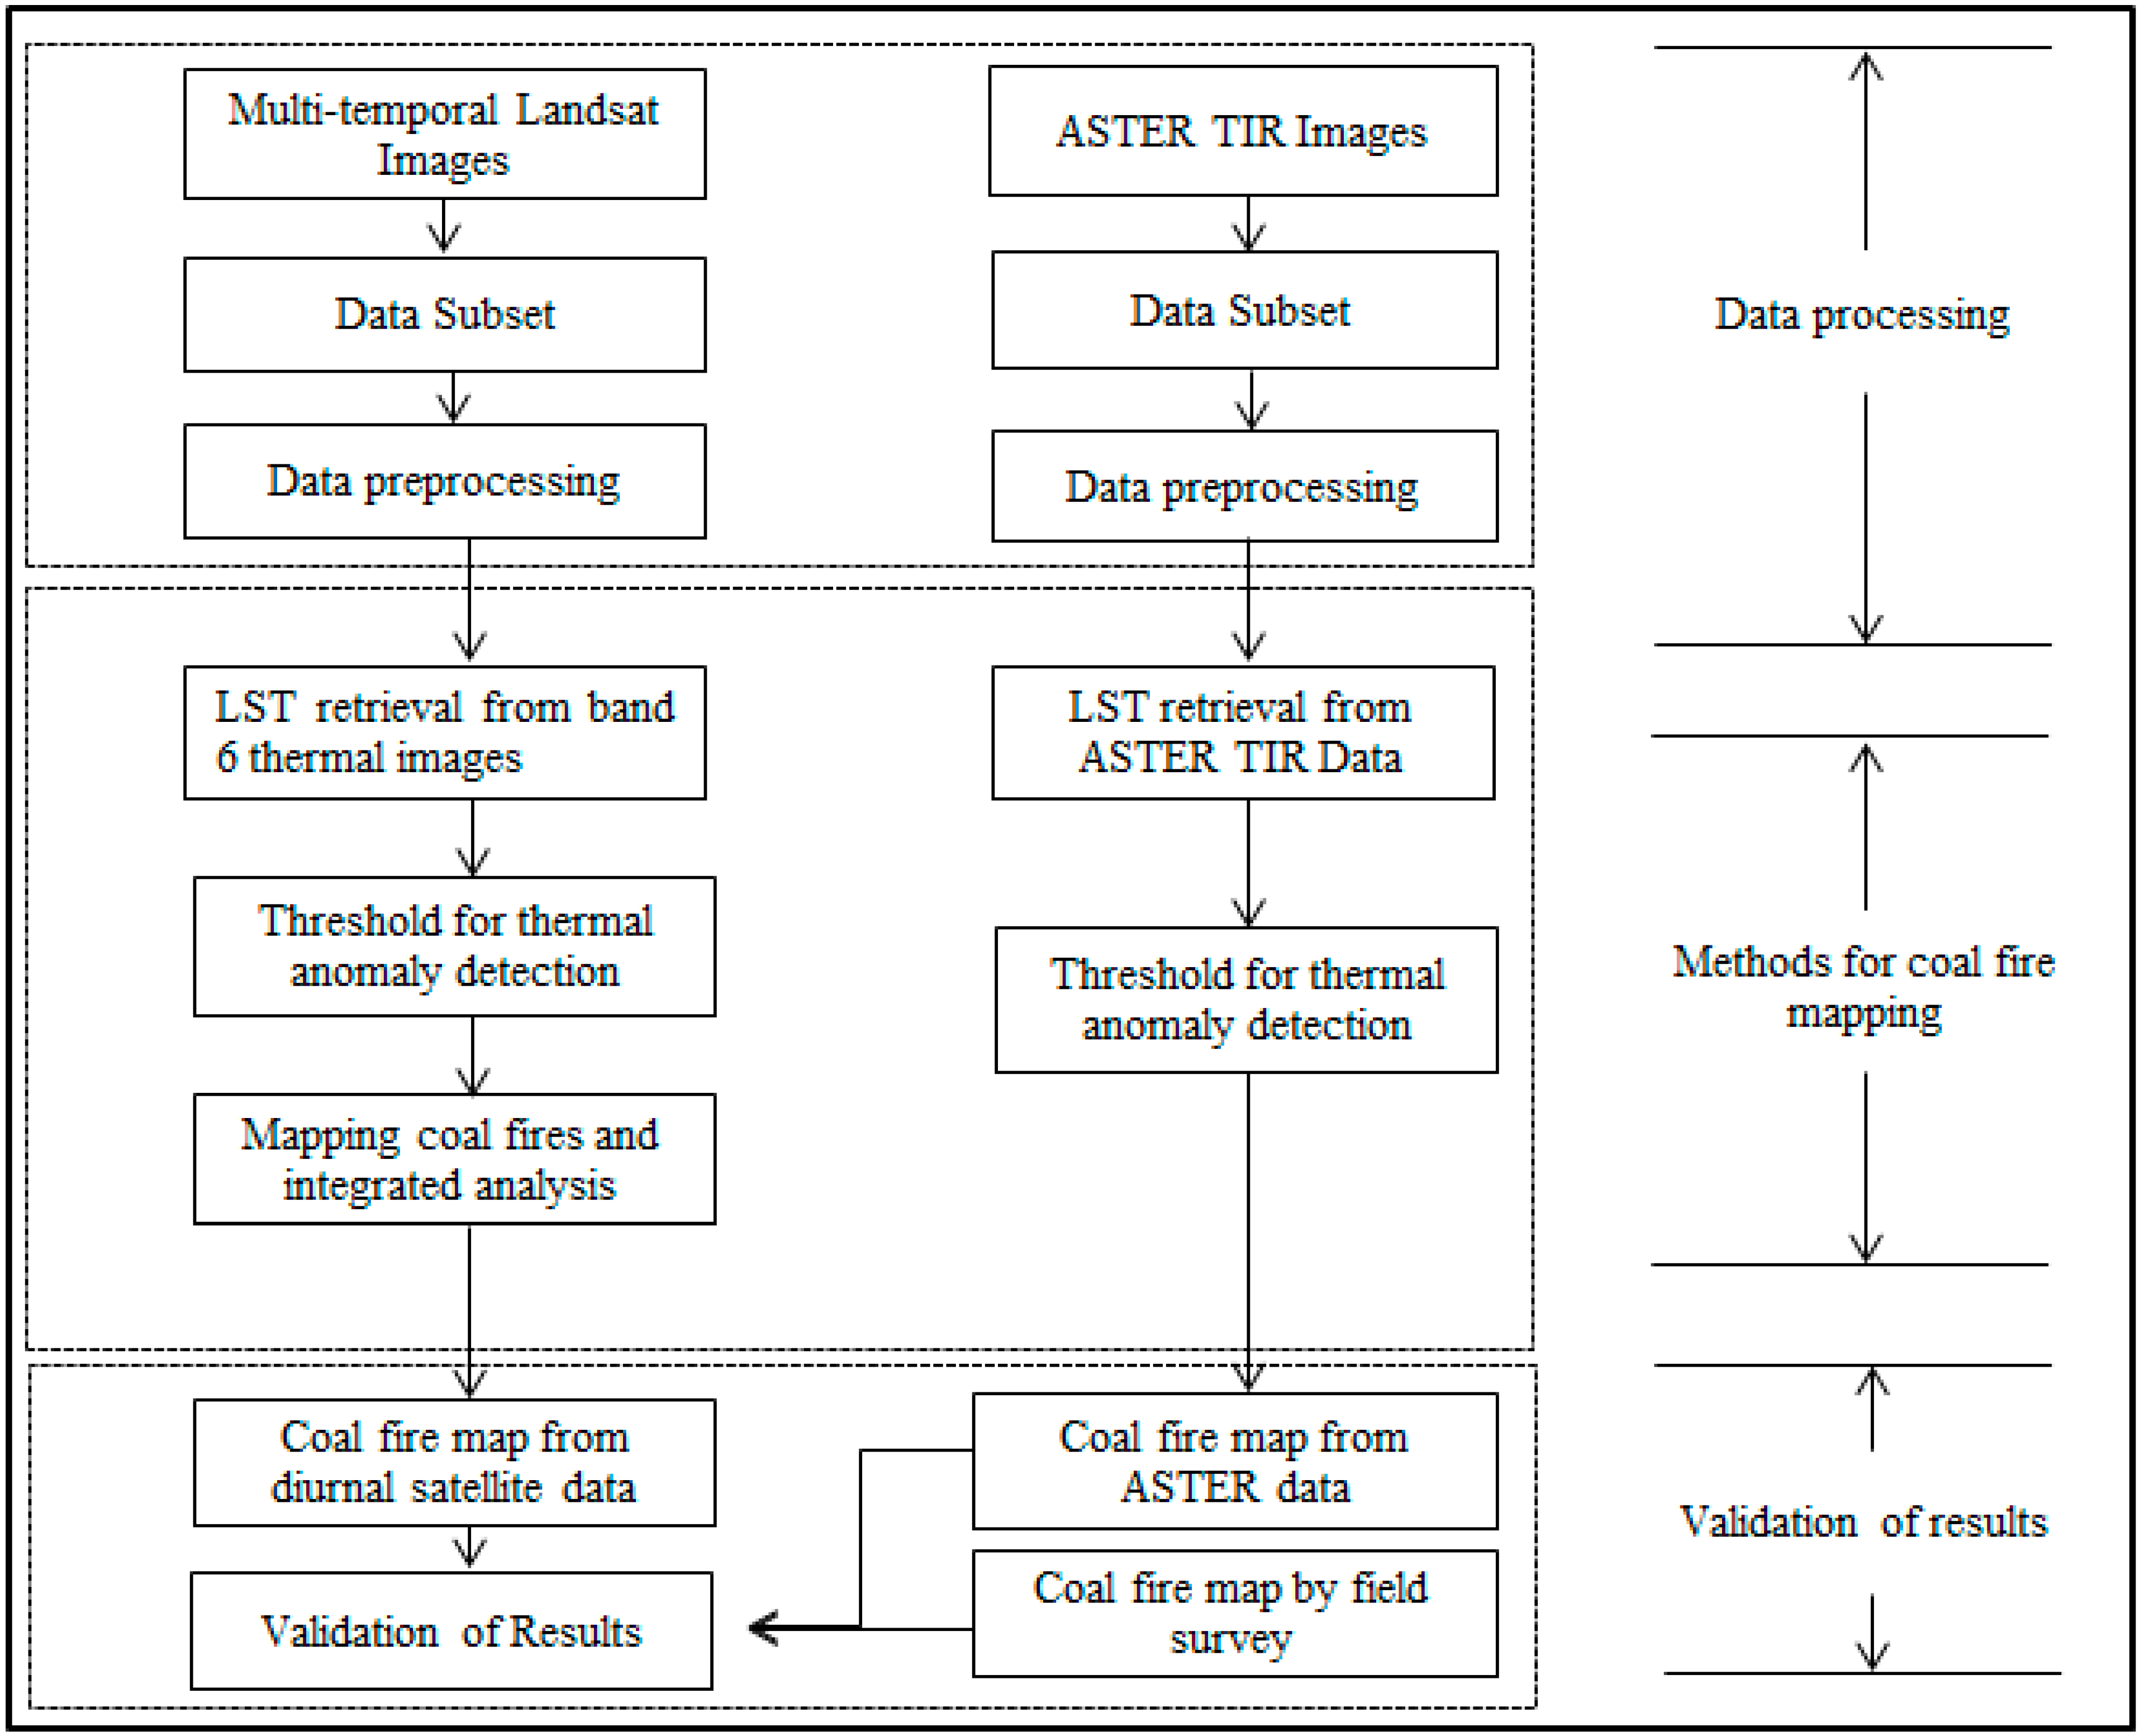
4. Methodology
4.1. LST Retrieval from ETM+/TM Band 6 TIR Data

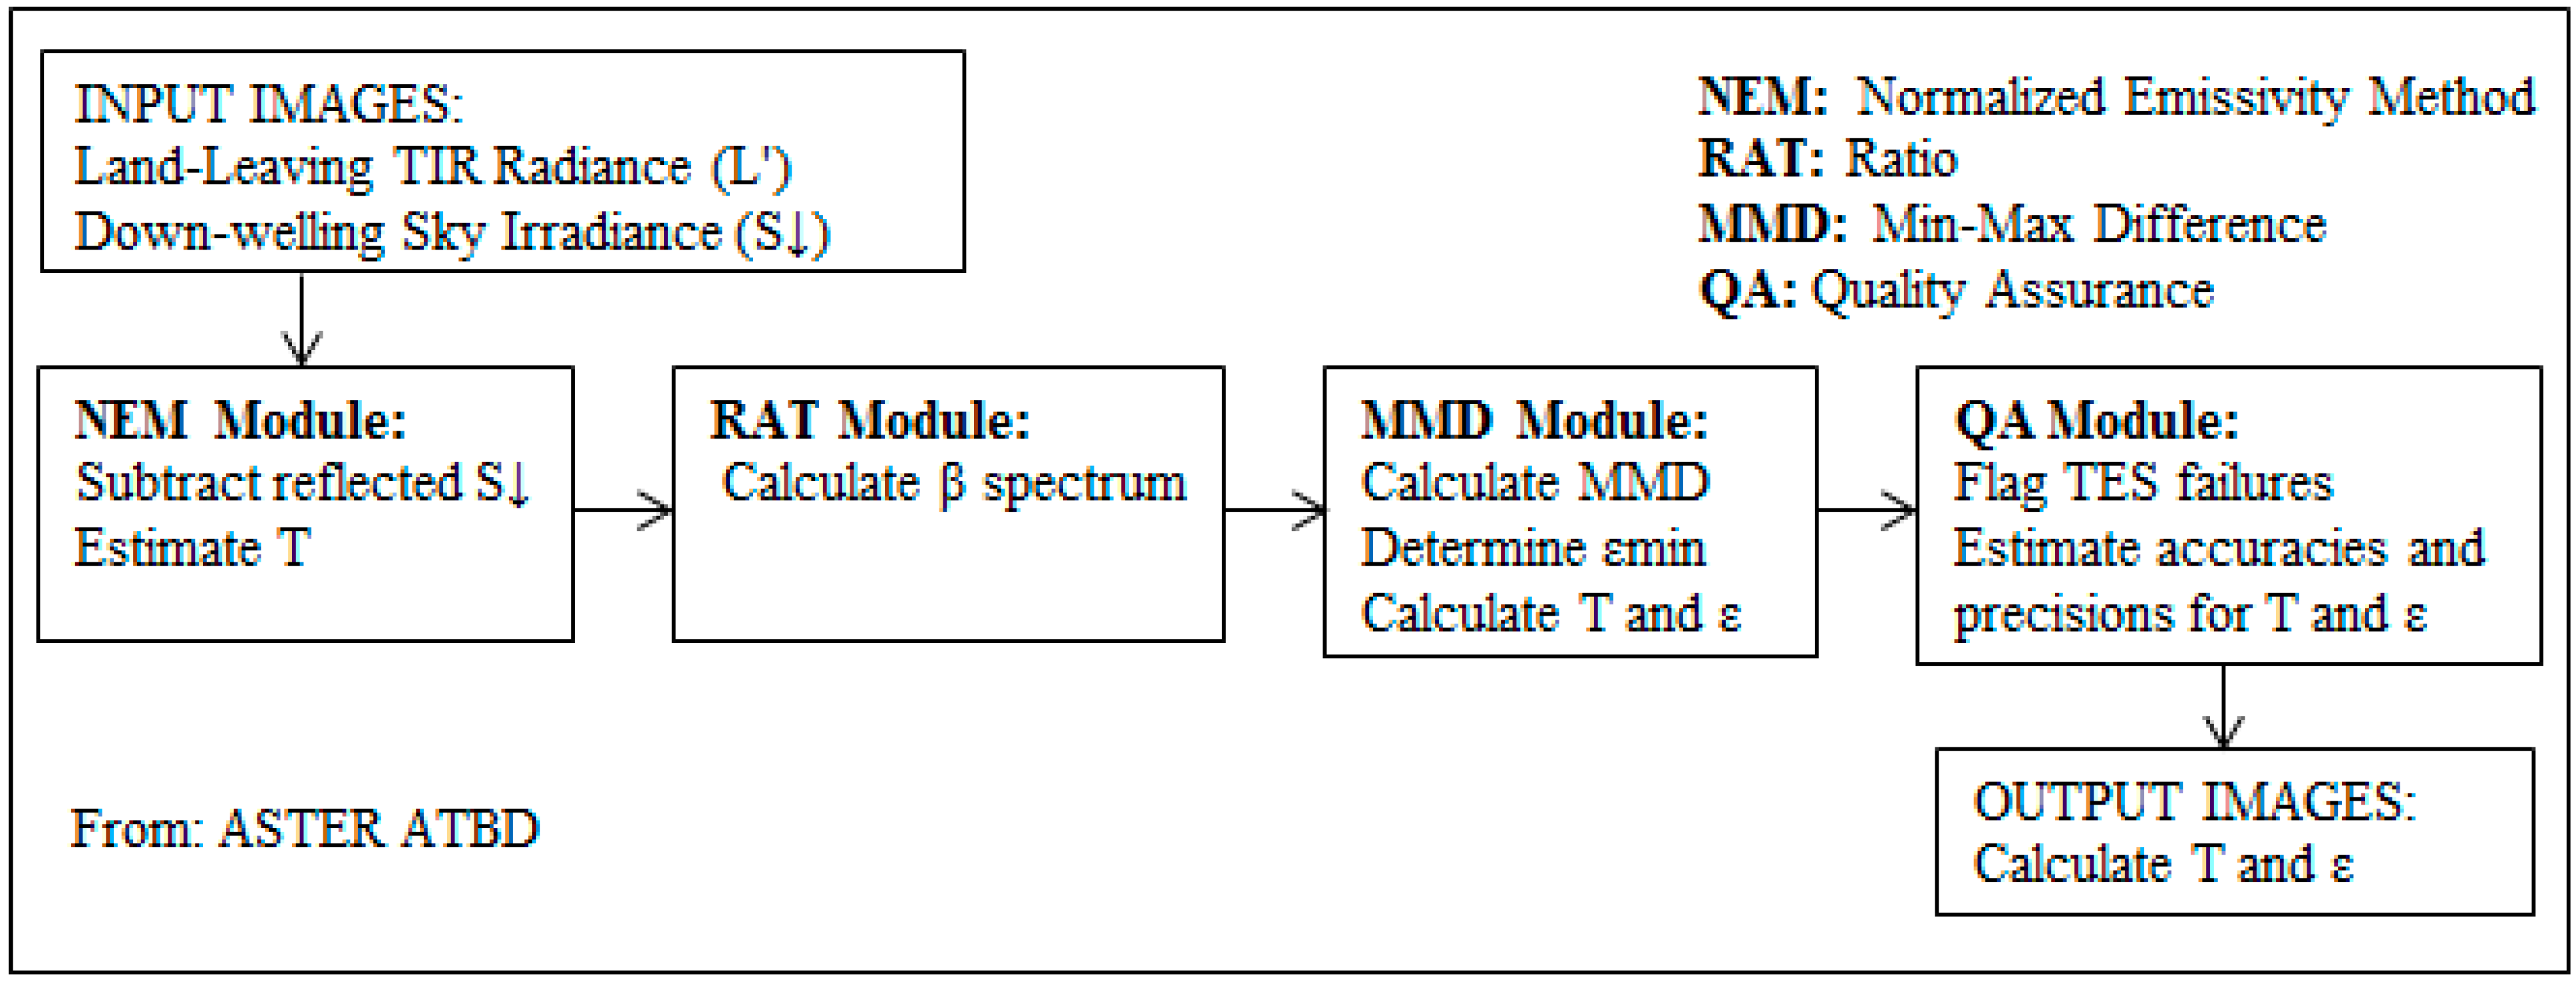
4.2. LST Retrieval from ASTER TIR Data Using the TES Algorithm

4.3. Threshold for Coal Fire Delineation Using Landsat TM Band 6 and ASTER TIR Data


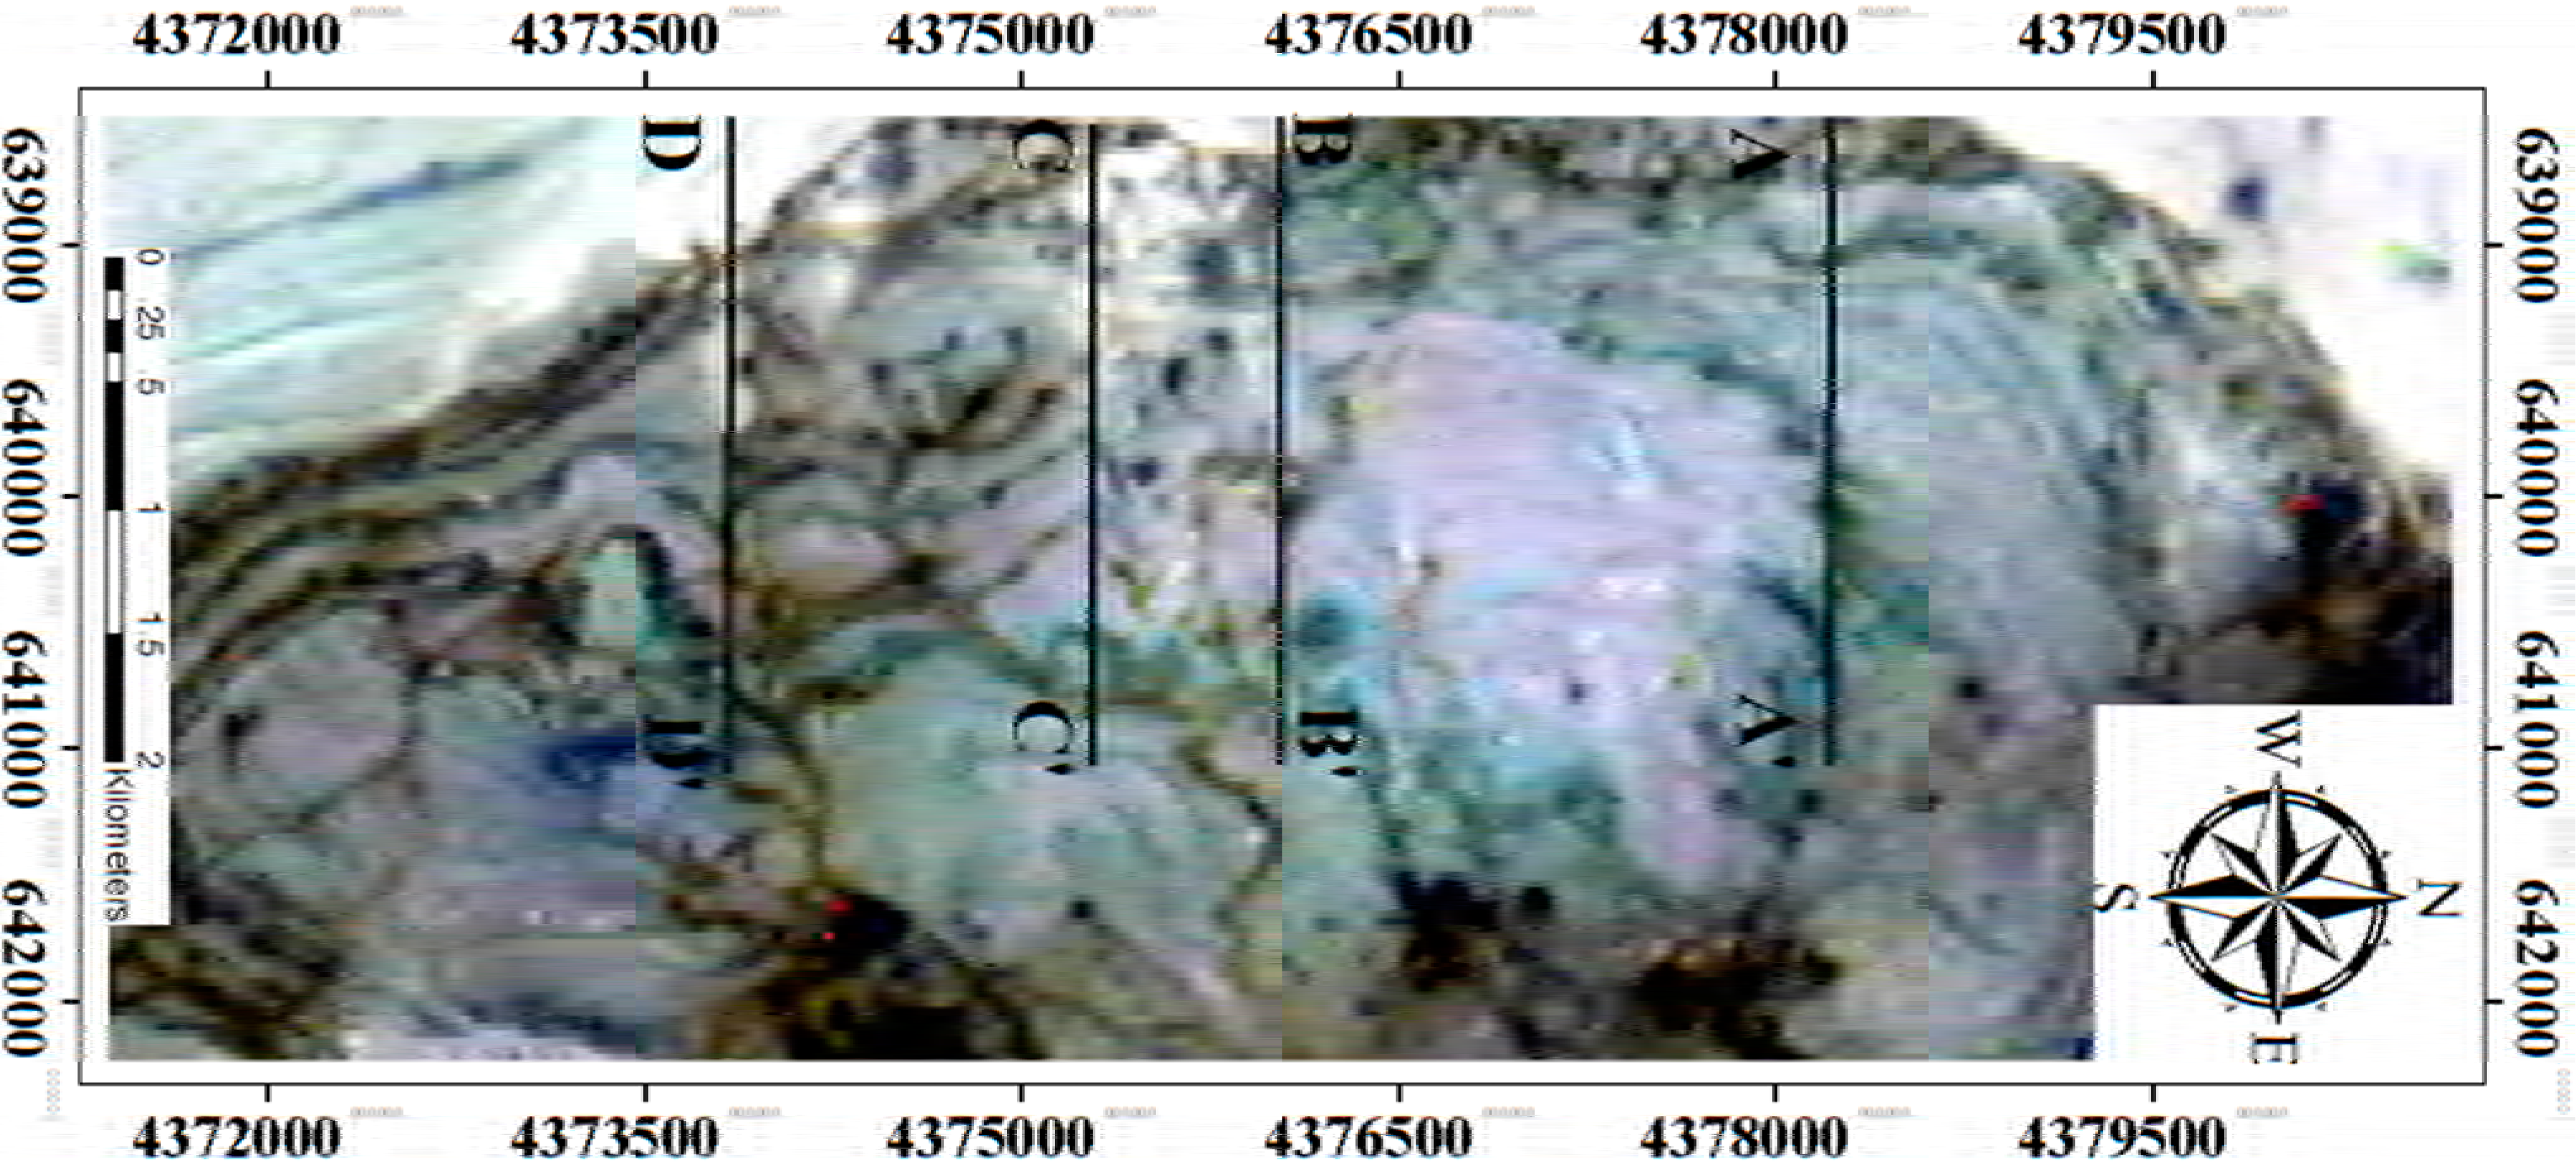
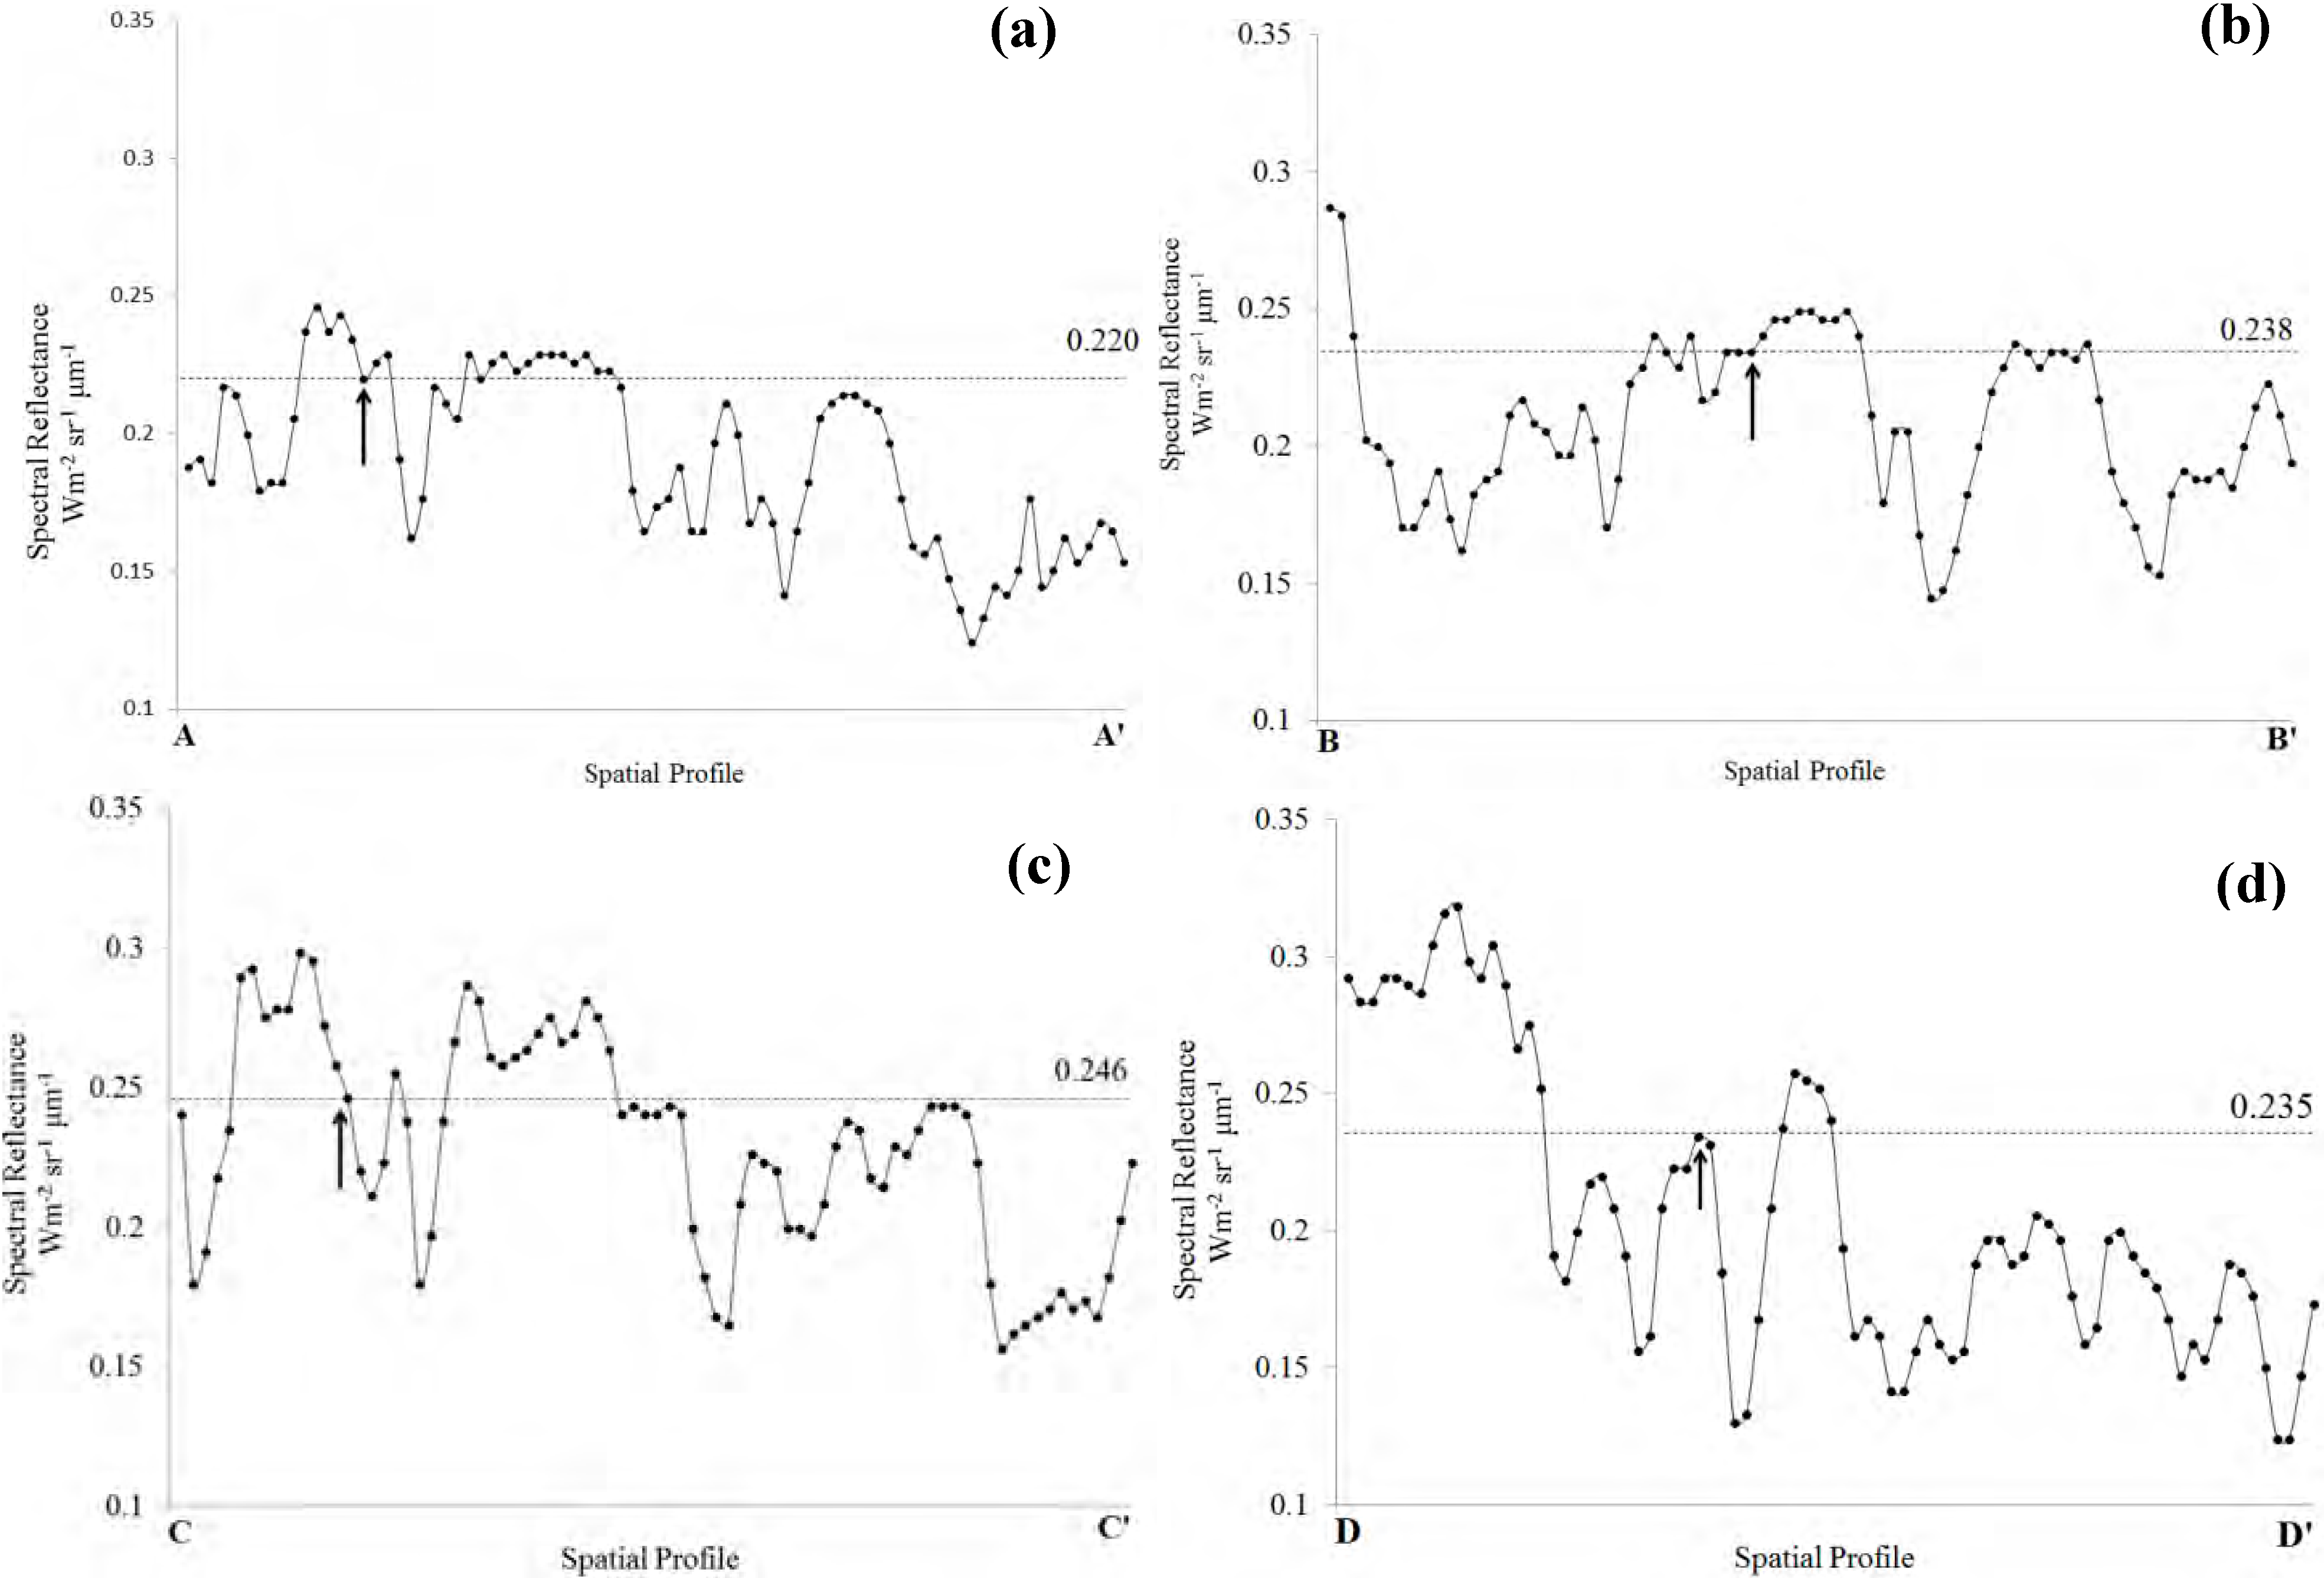
4.4. Detection of the Spreading Direction of Coal Fire
5. Results and Discussions
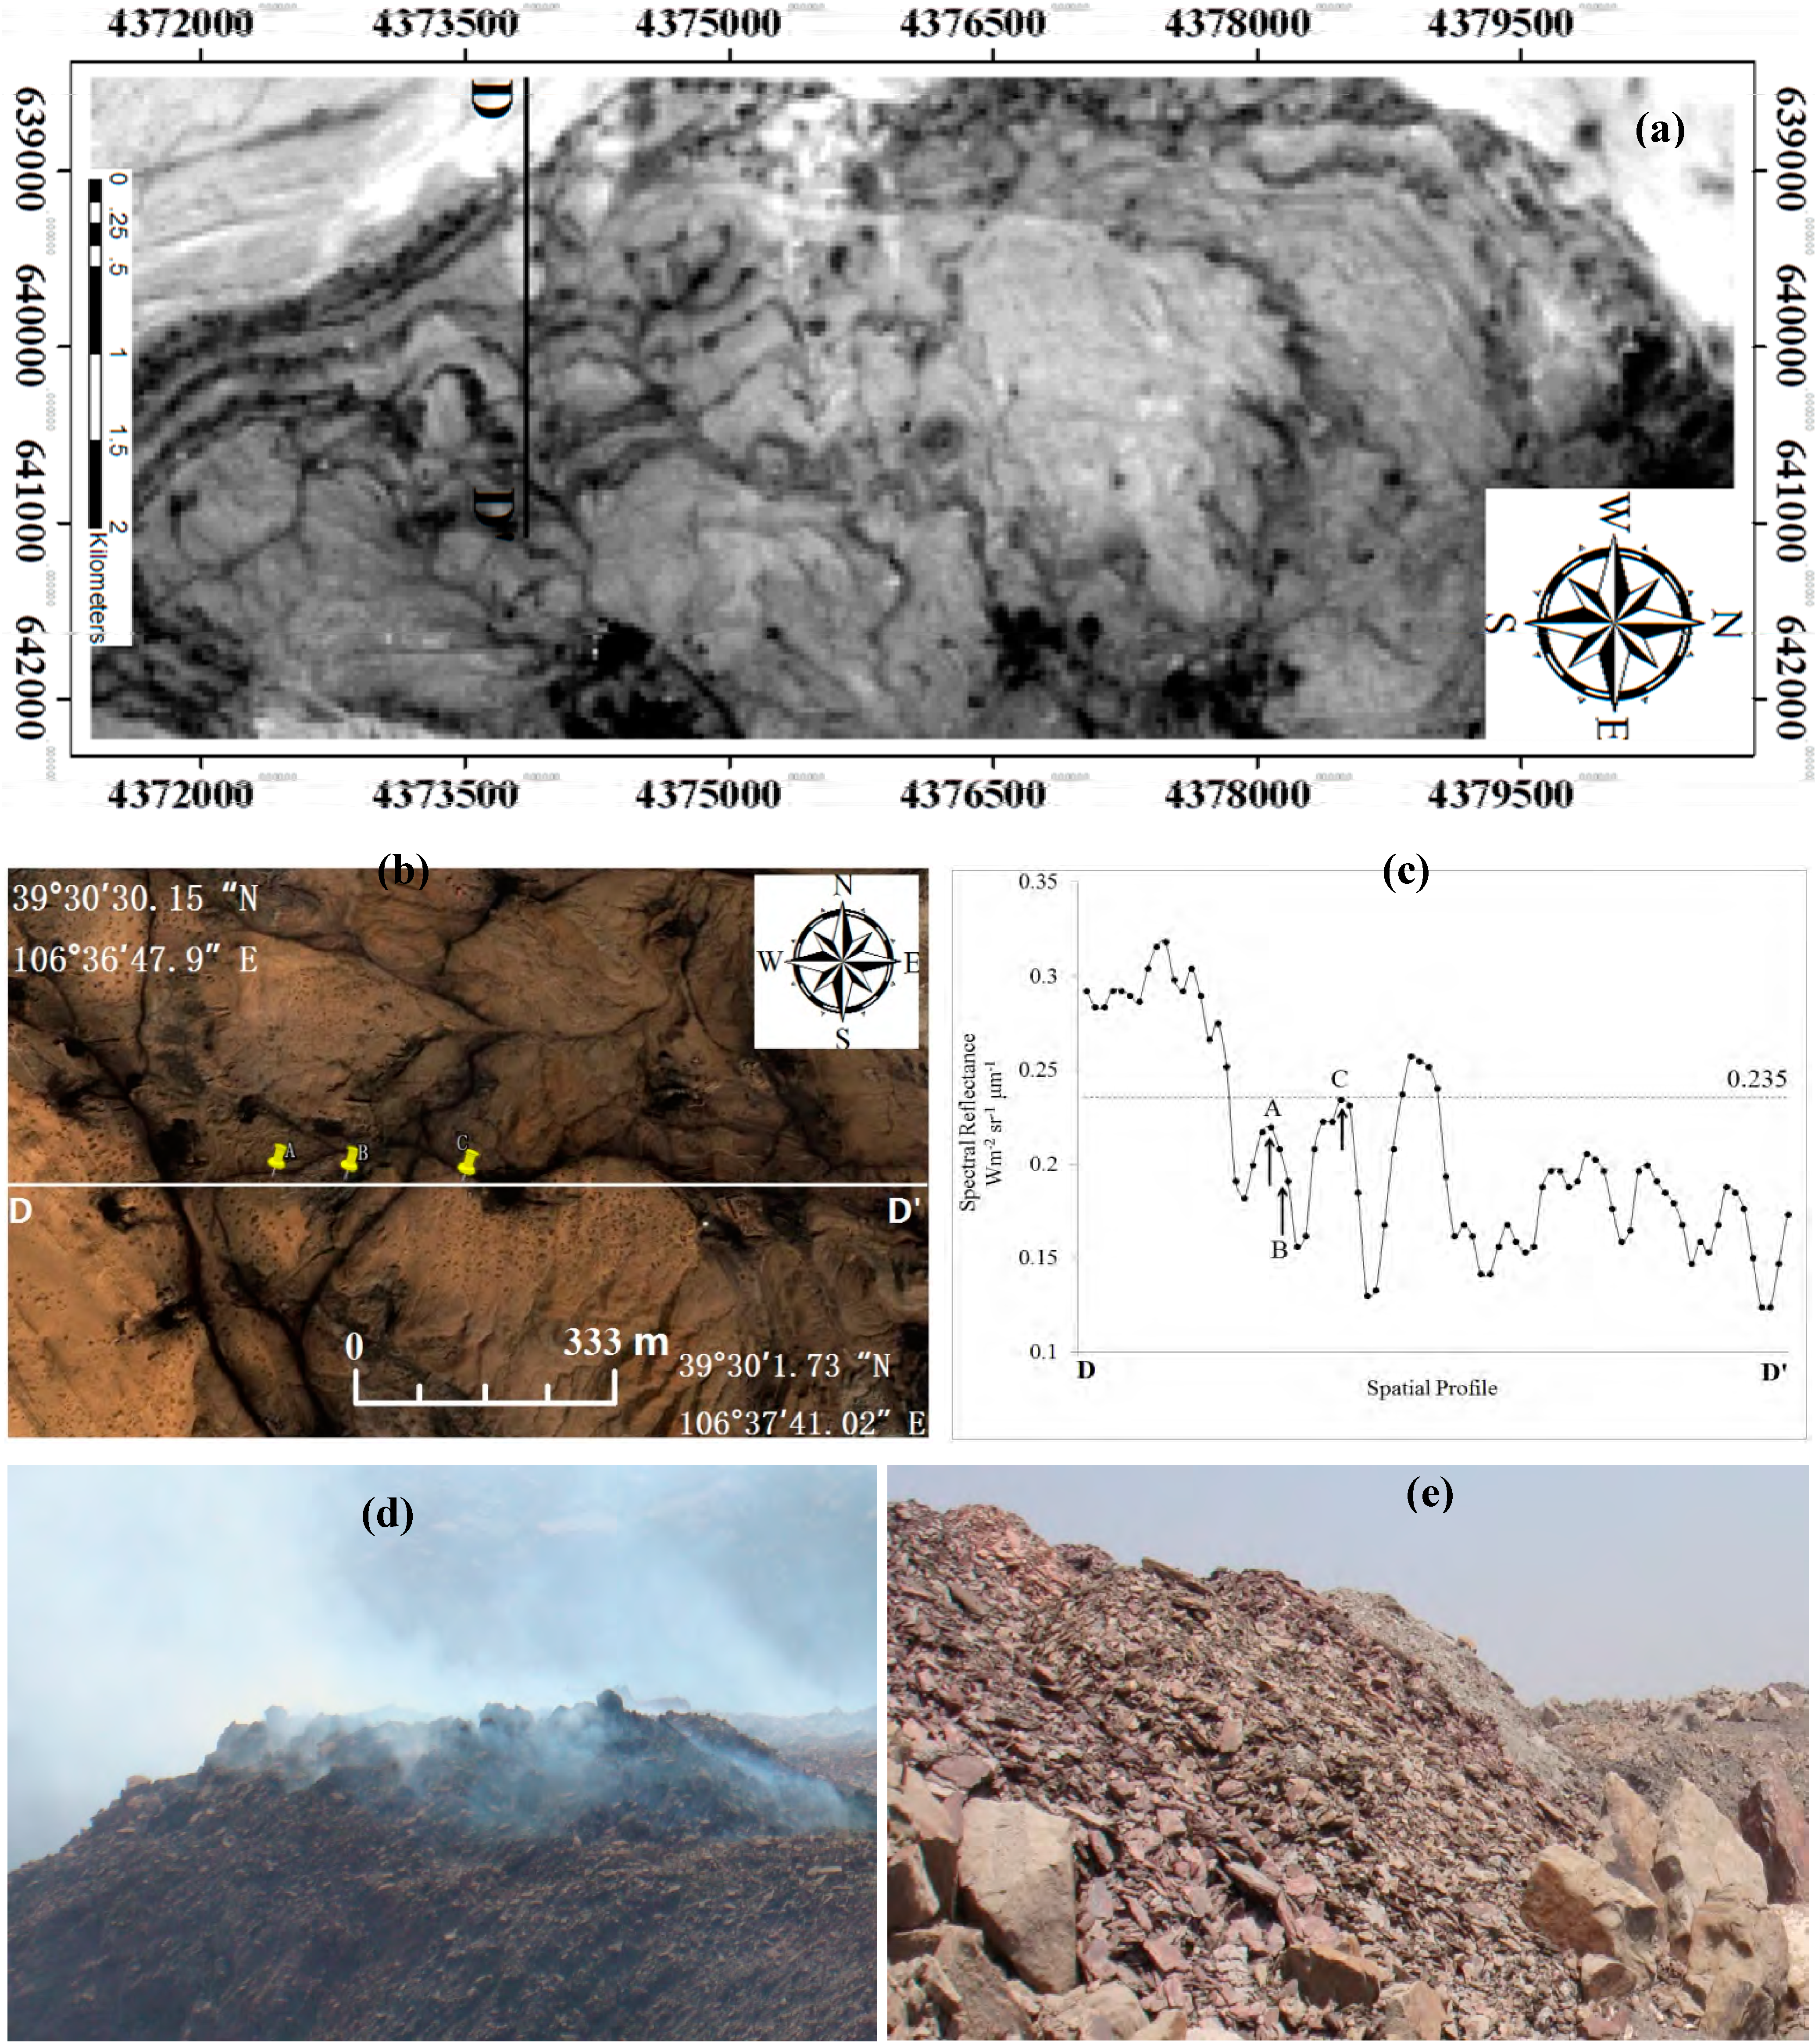
5.1. Validation of the Results of Coal Fires
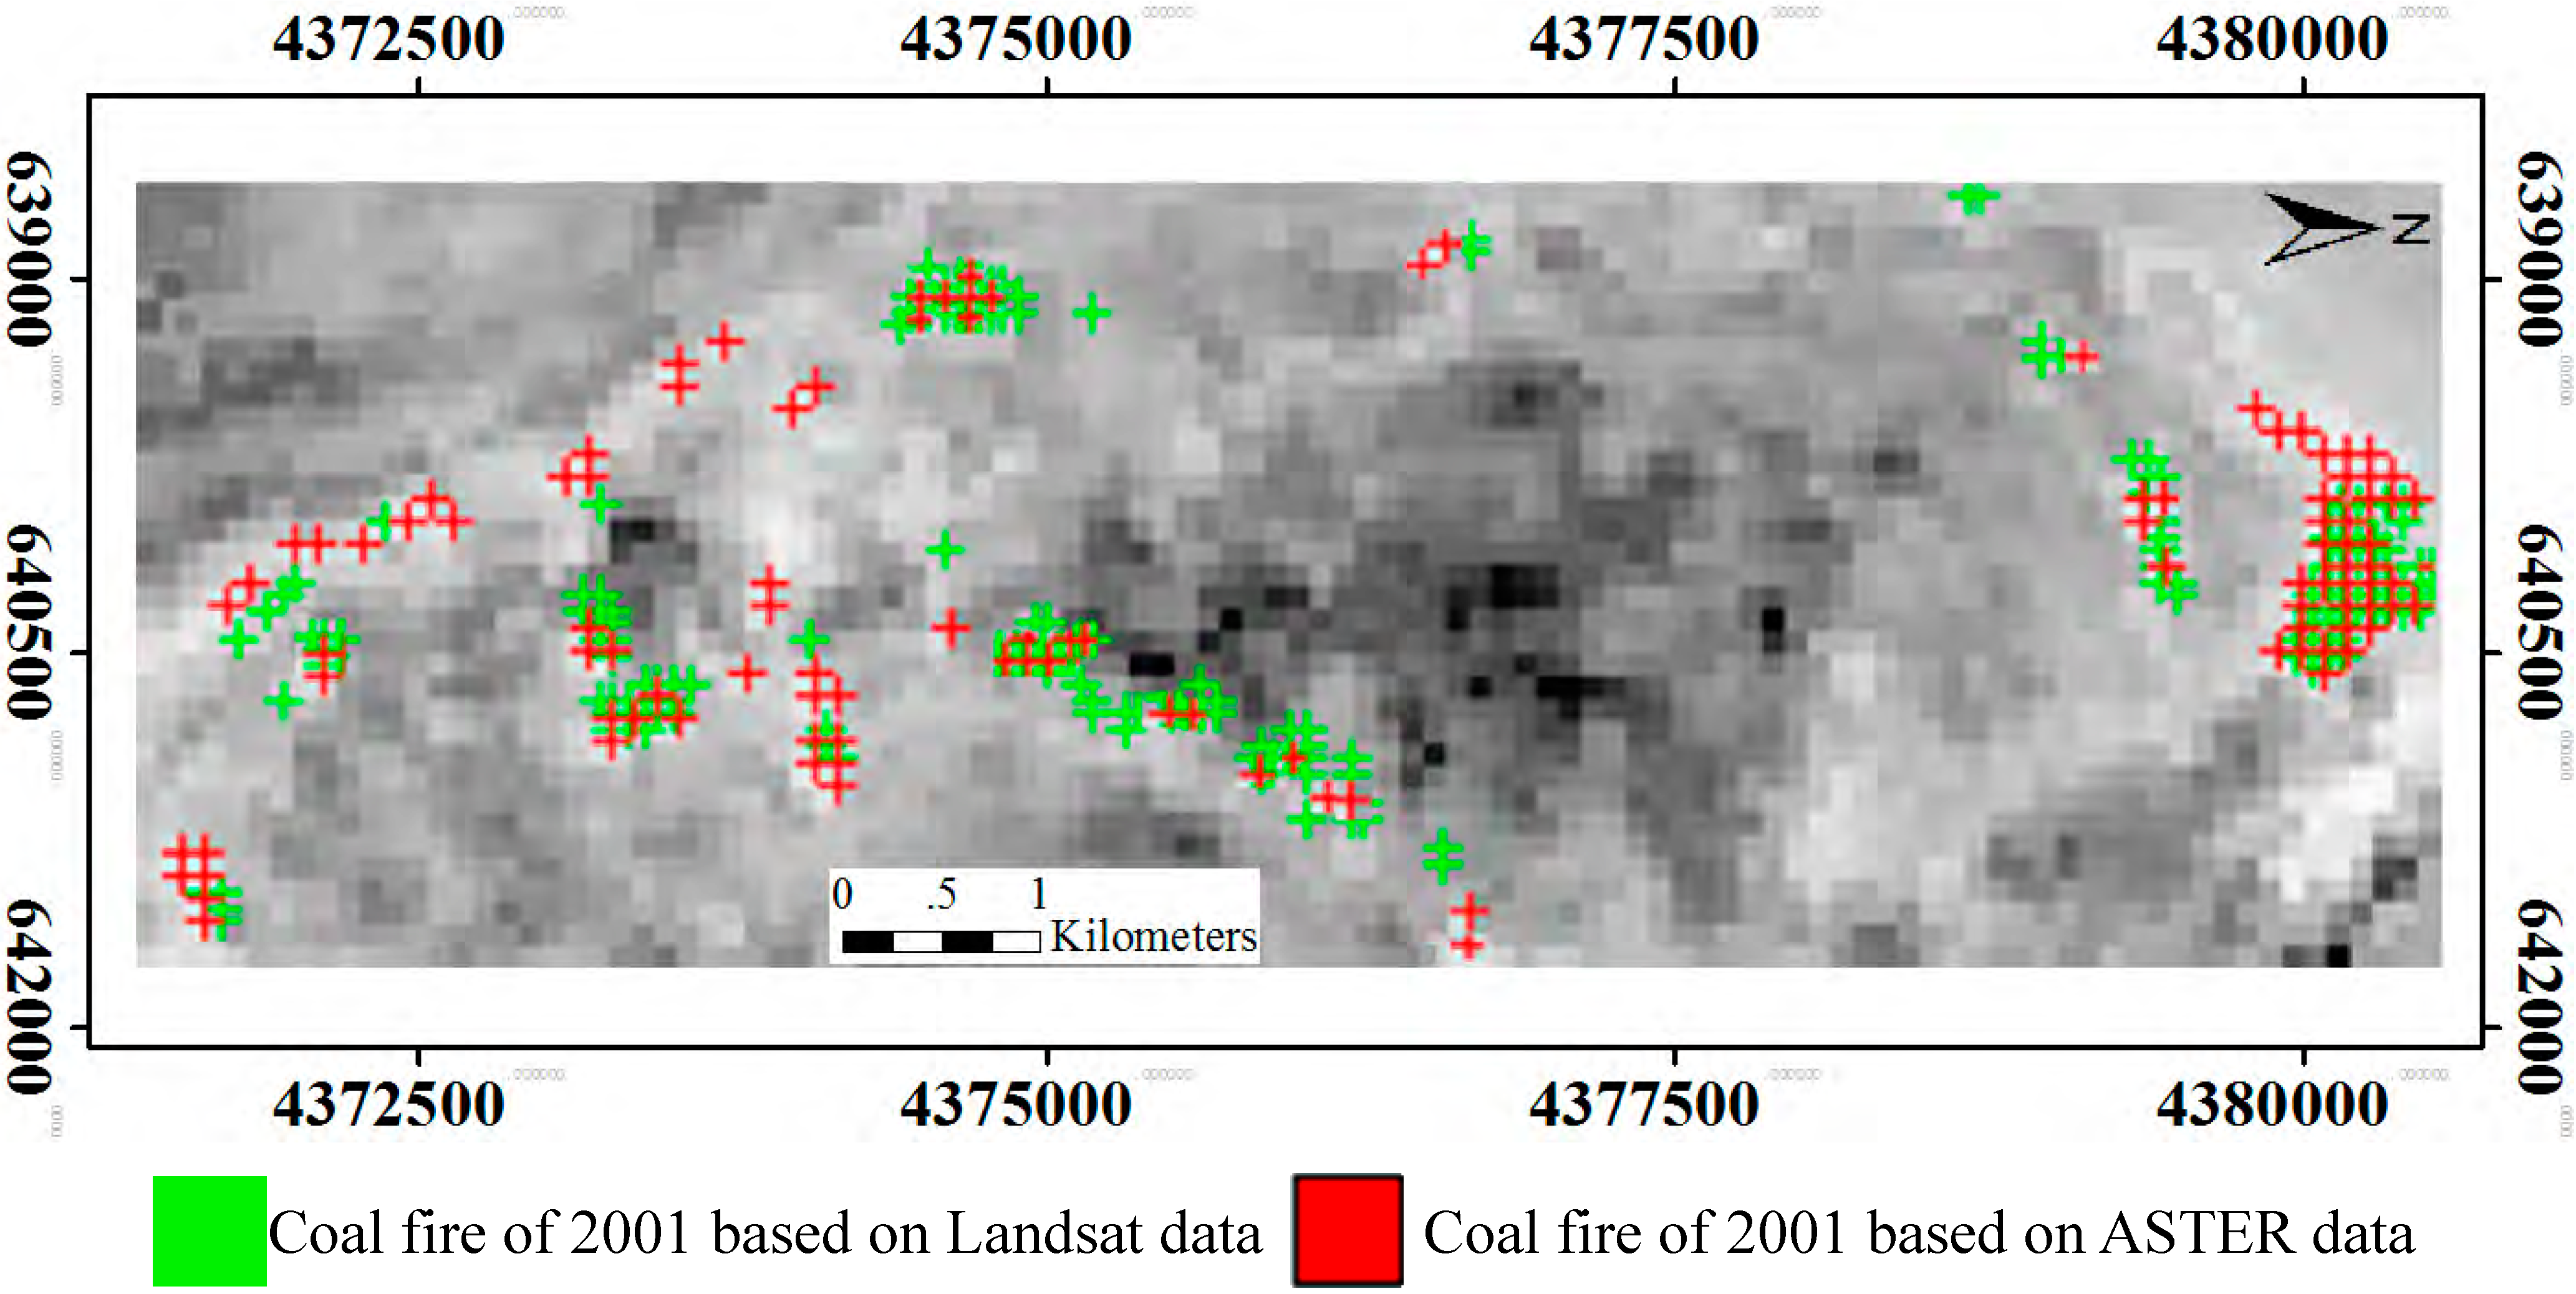
5.1.1. Testing of the Continuity of Results That Were Obtained from 2001 ASTER Data and ETM+ Band 6 Data

| Data Type | Acquisition Time | Spatial Resolution | Coal Fires Extracted from Satellite Data | Intersection Part of Coal Fires (%) |
|---|---|---|---|---|
| ETM+ | 29 May 2001 | 90 m | 96 Pixels | 90.5 |
| ASTER | 8 August 2001 | 90 m | 106 Pixels |
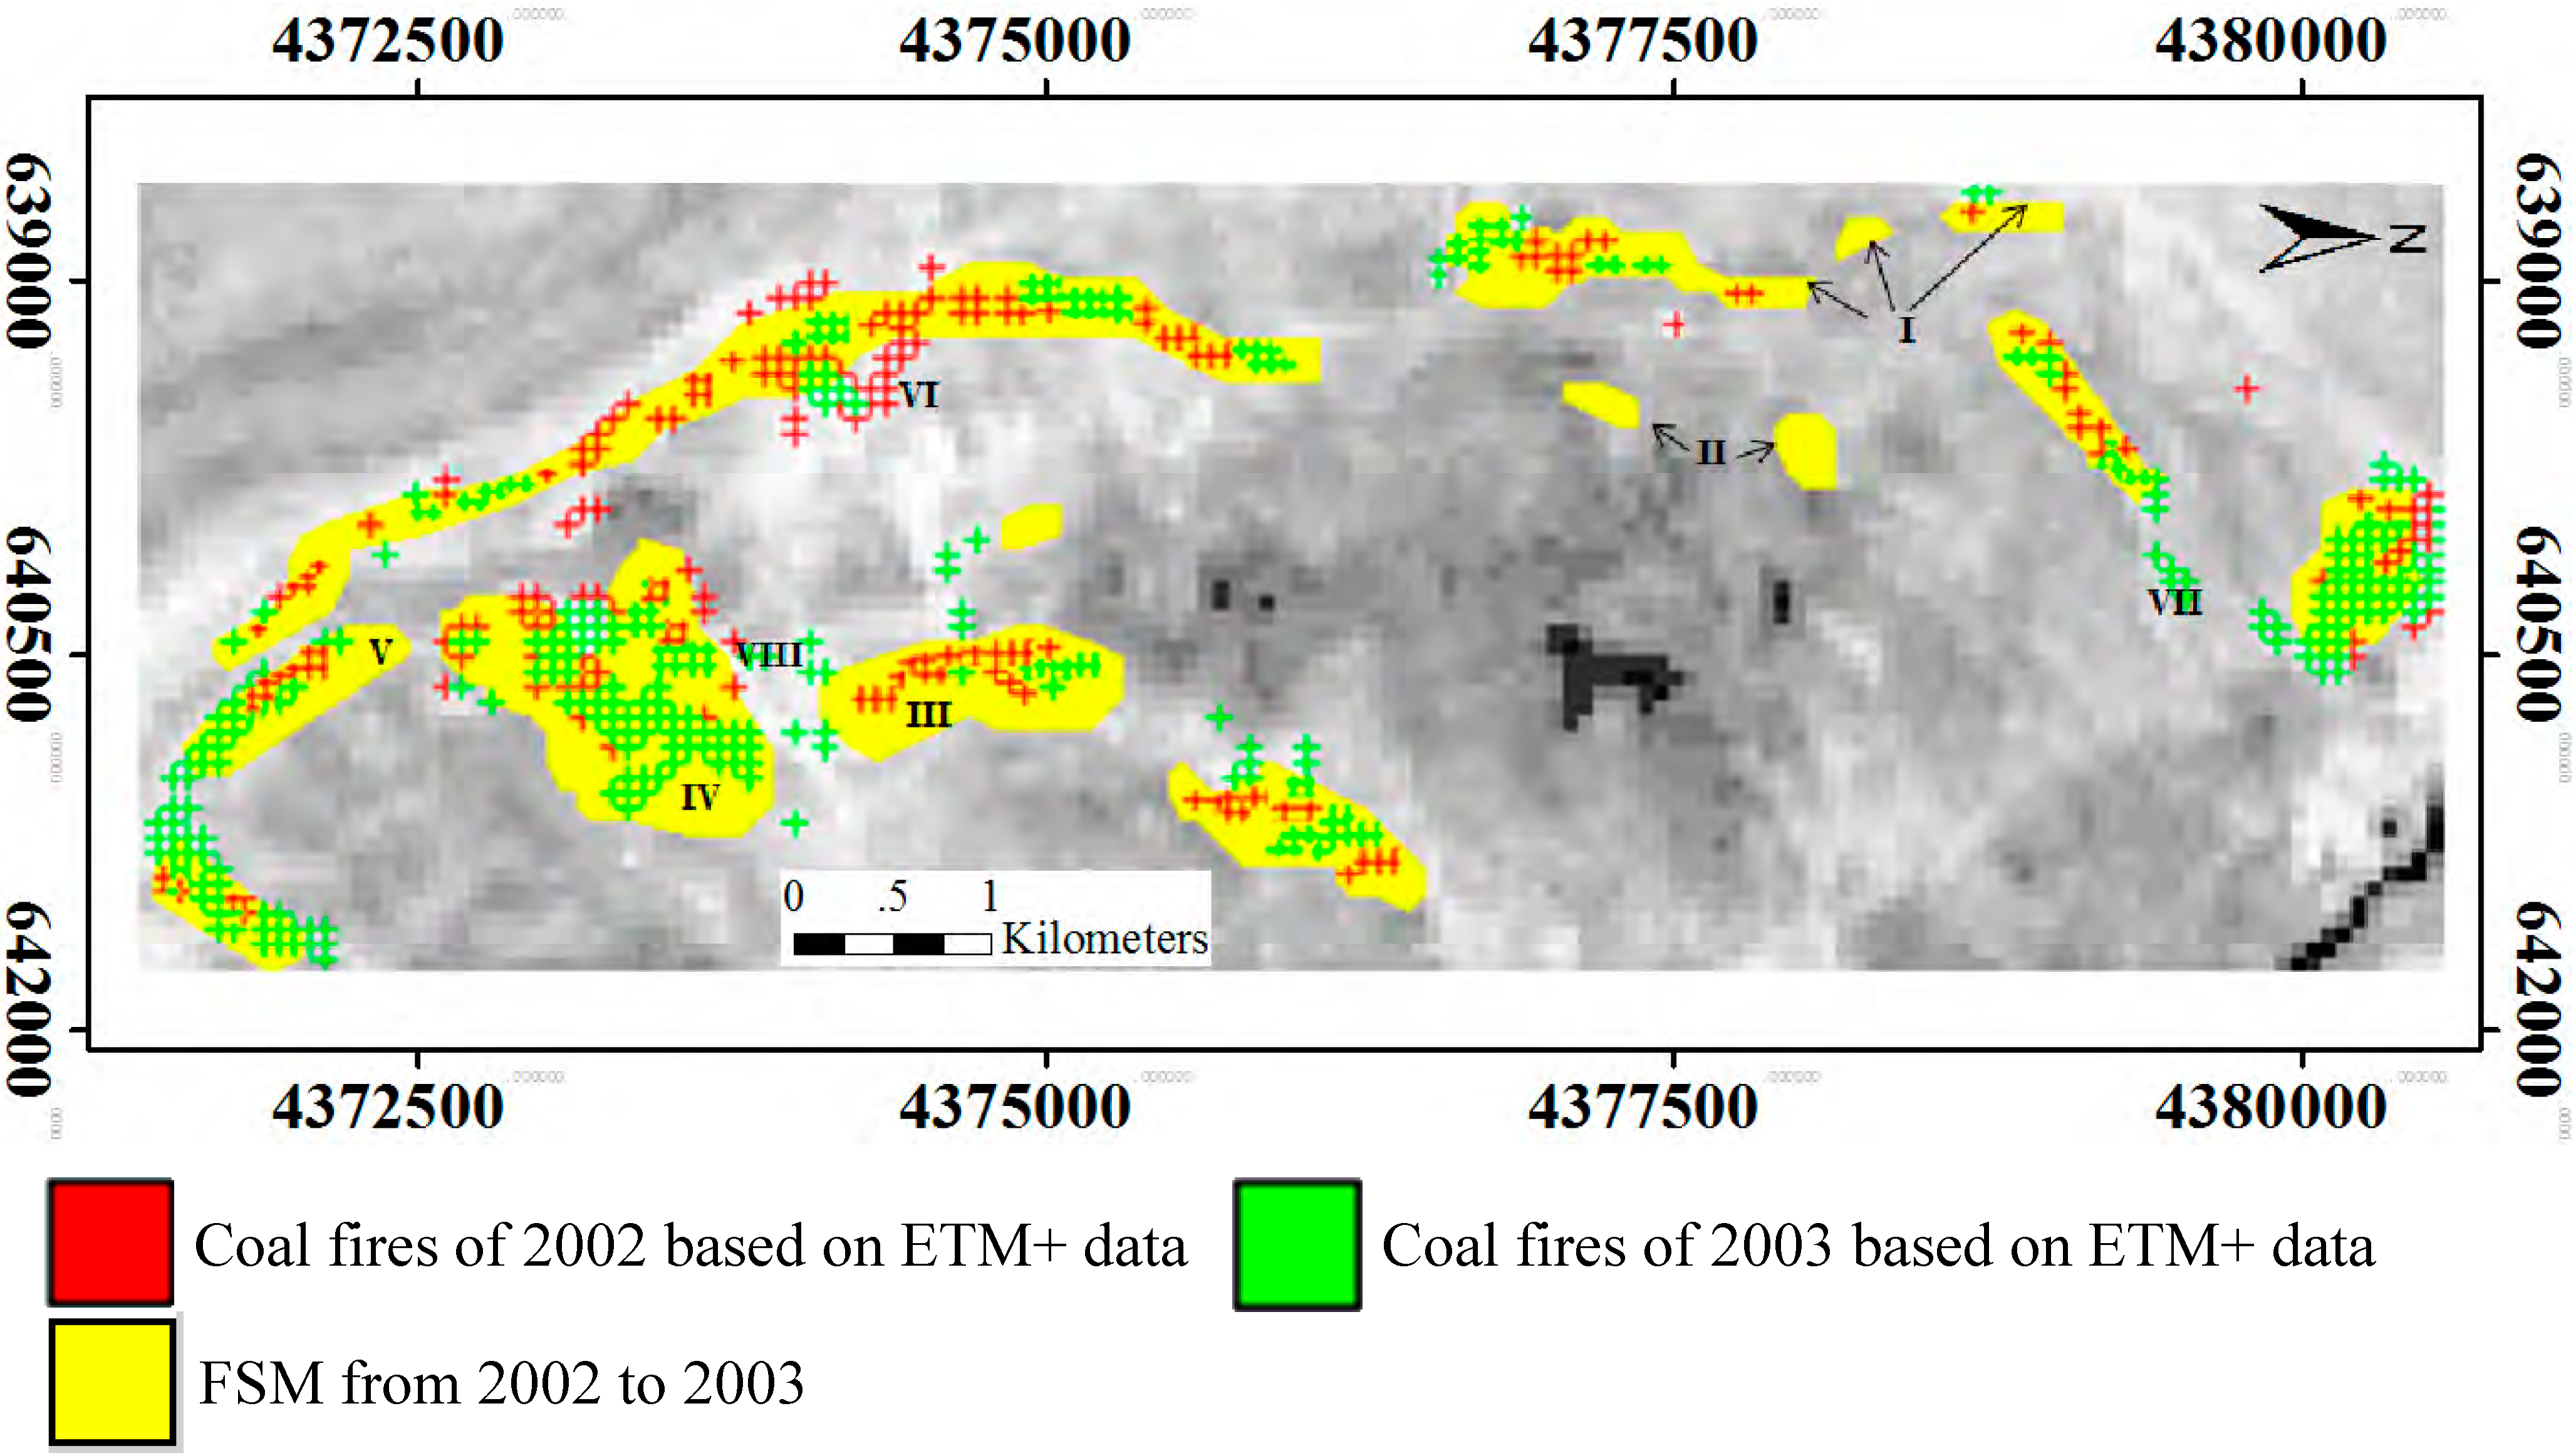
5.1.2. Validation of the Results Obtained from 2002 and 2003 ETM+ Band 6 Data Using the Field Survey Map

| Data Type | Acquisition Time | Spatial Resolution | Omission Error (%) | Commission Error (%) |
|---|---|---|---|---|
| ETM+ | 20 August 2002 | 60 m | 21.5 | 3.6 |
| FSM | 2002–2003 | 60 m | ||
| ETM+ | 3 May 2003 | 60 m | 26.7 | 1.7 |
| FSM | 2002–2003 | 60 m |
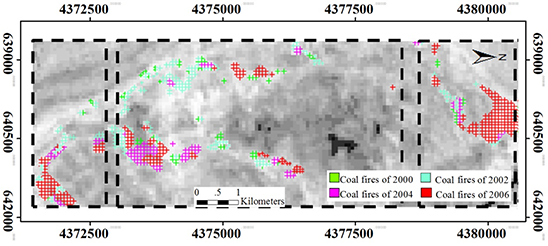
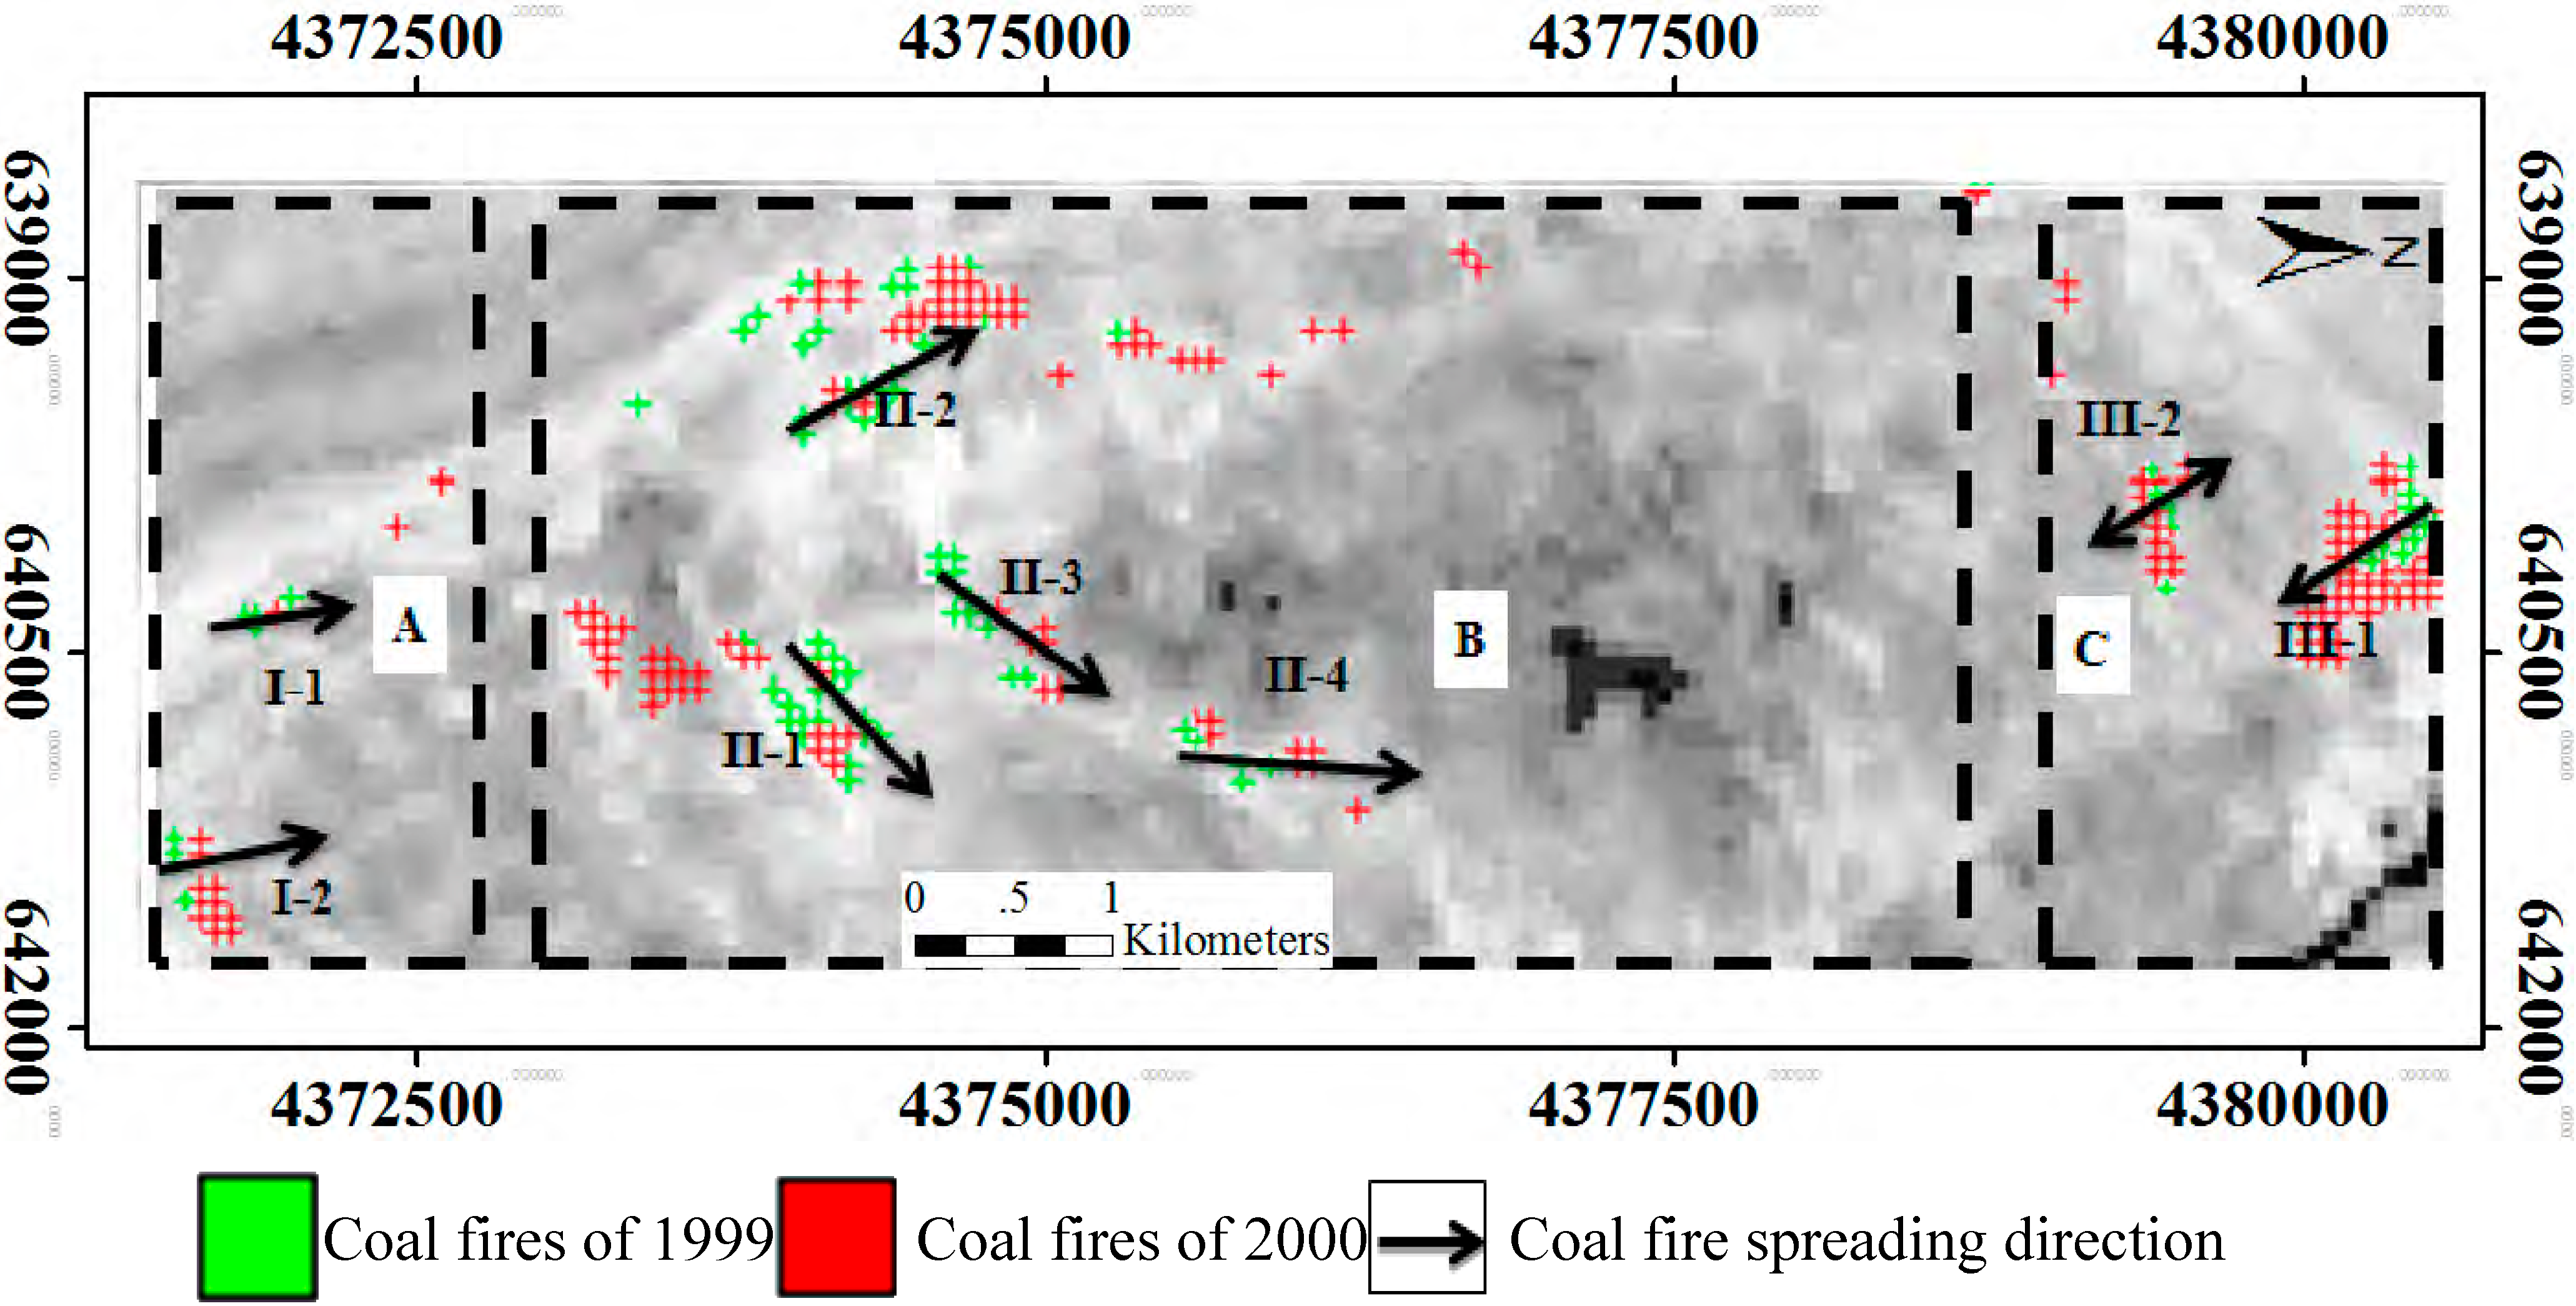
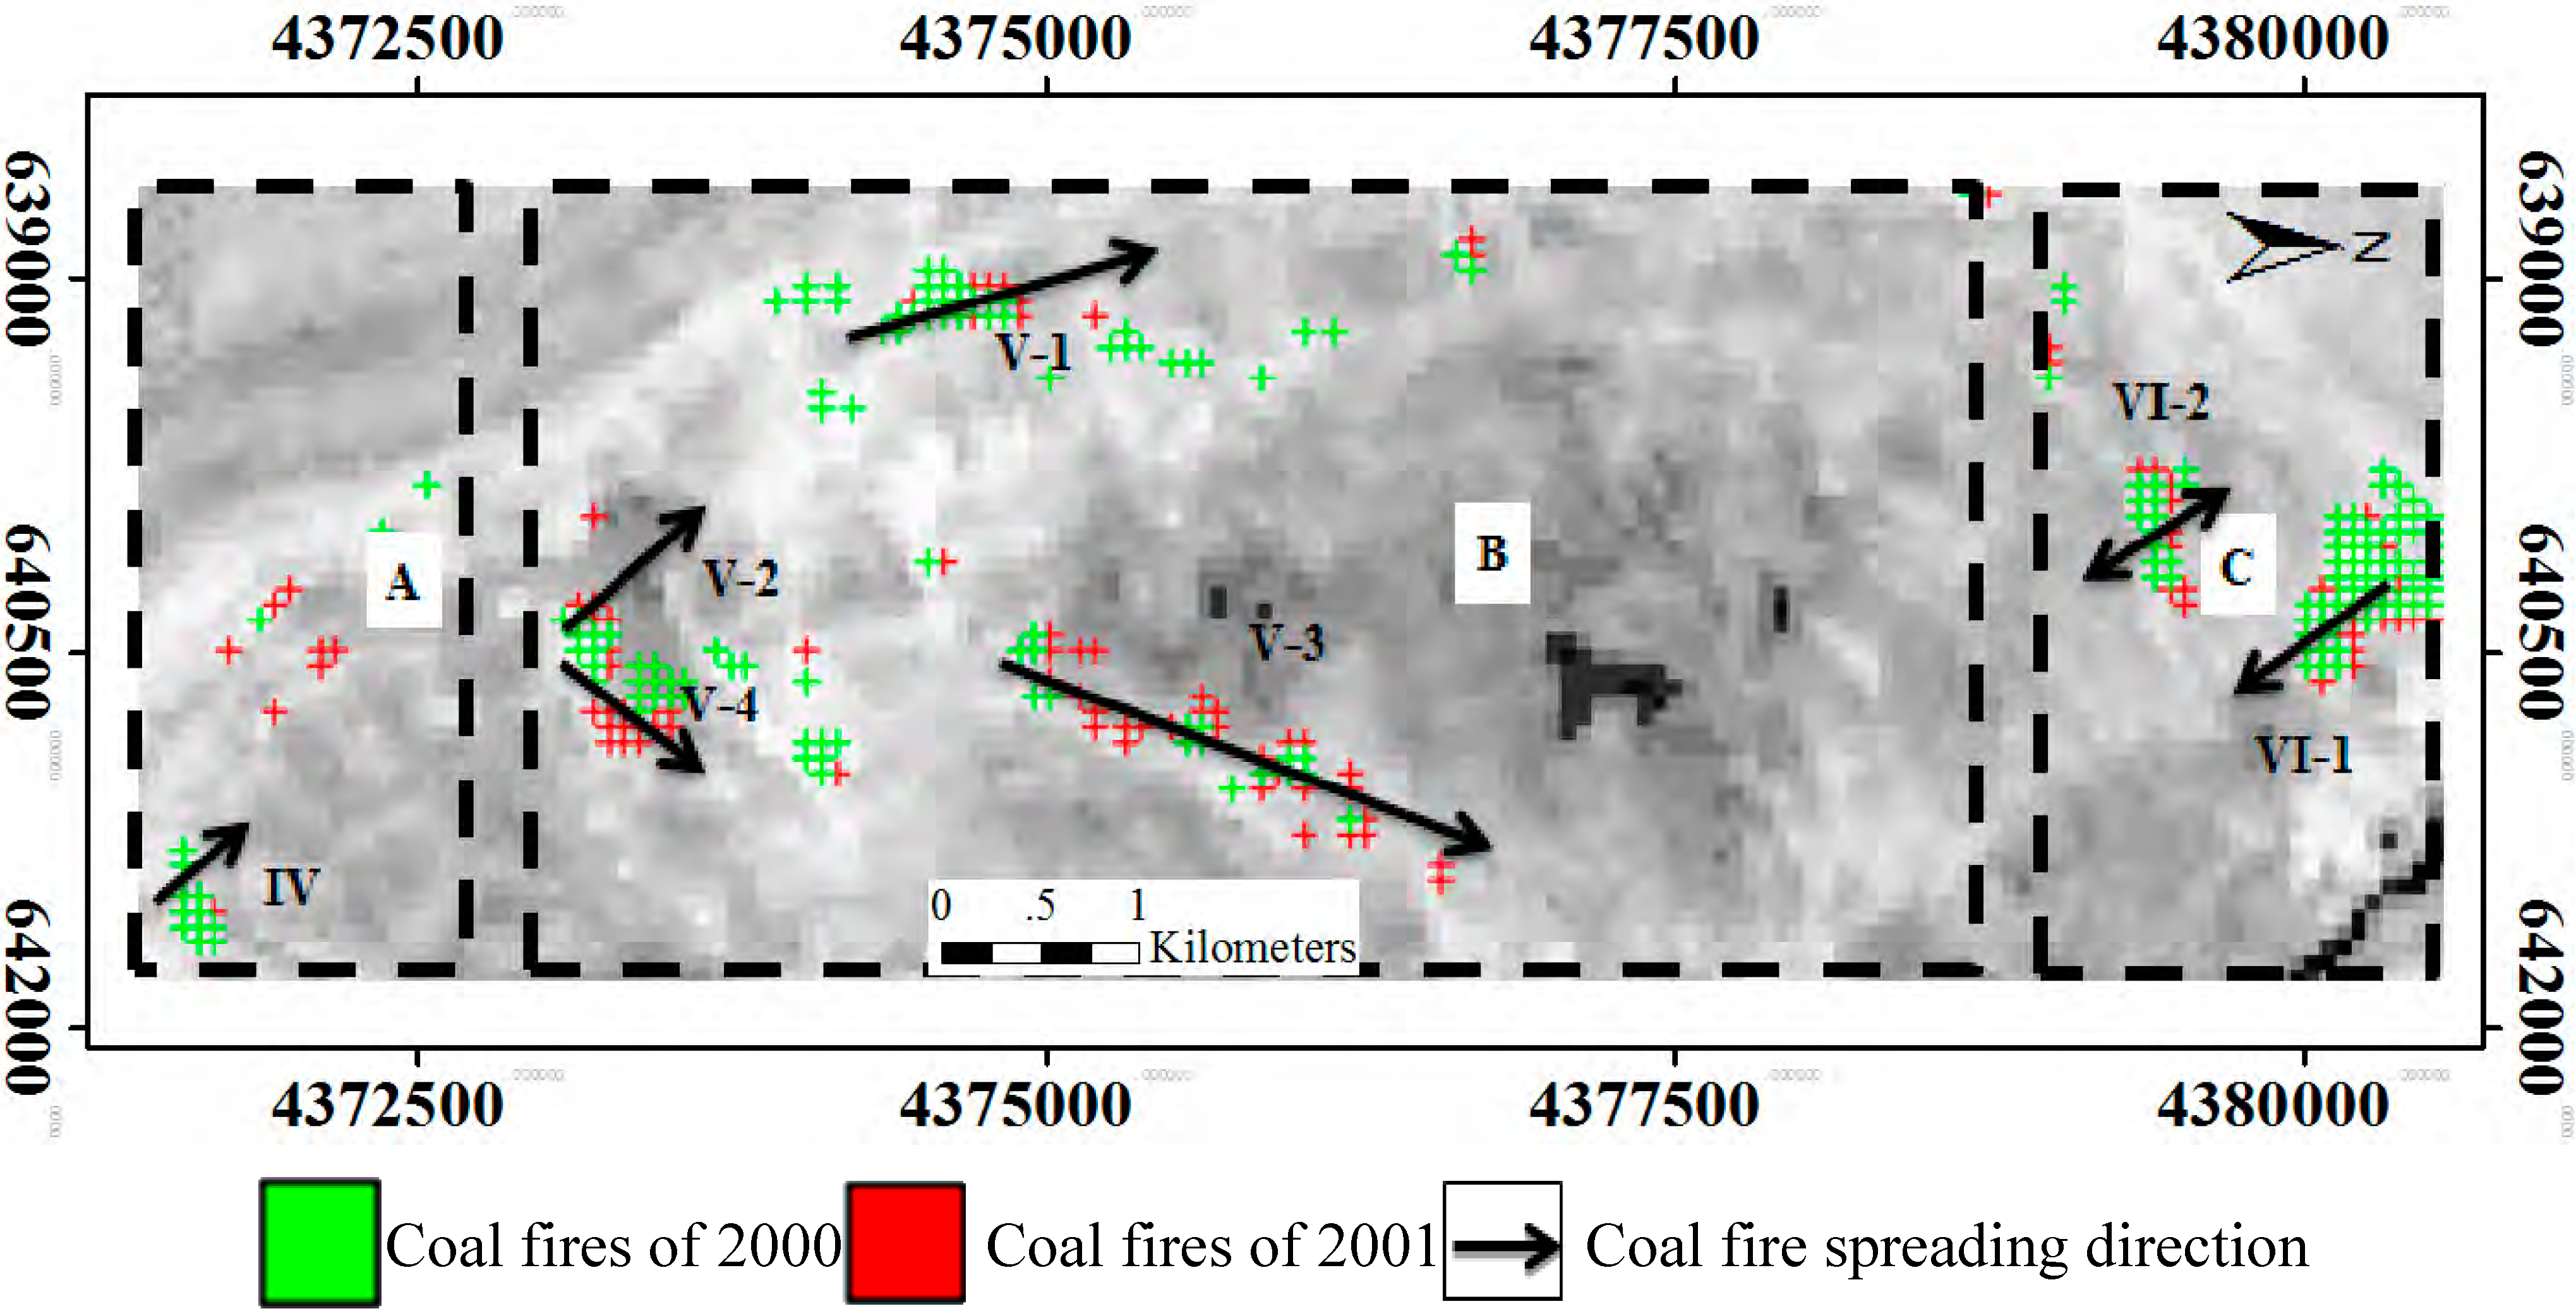
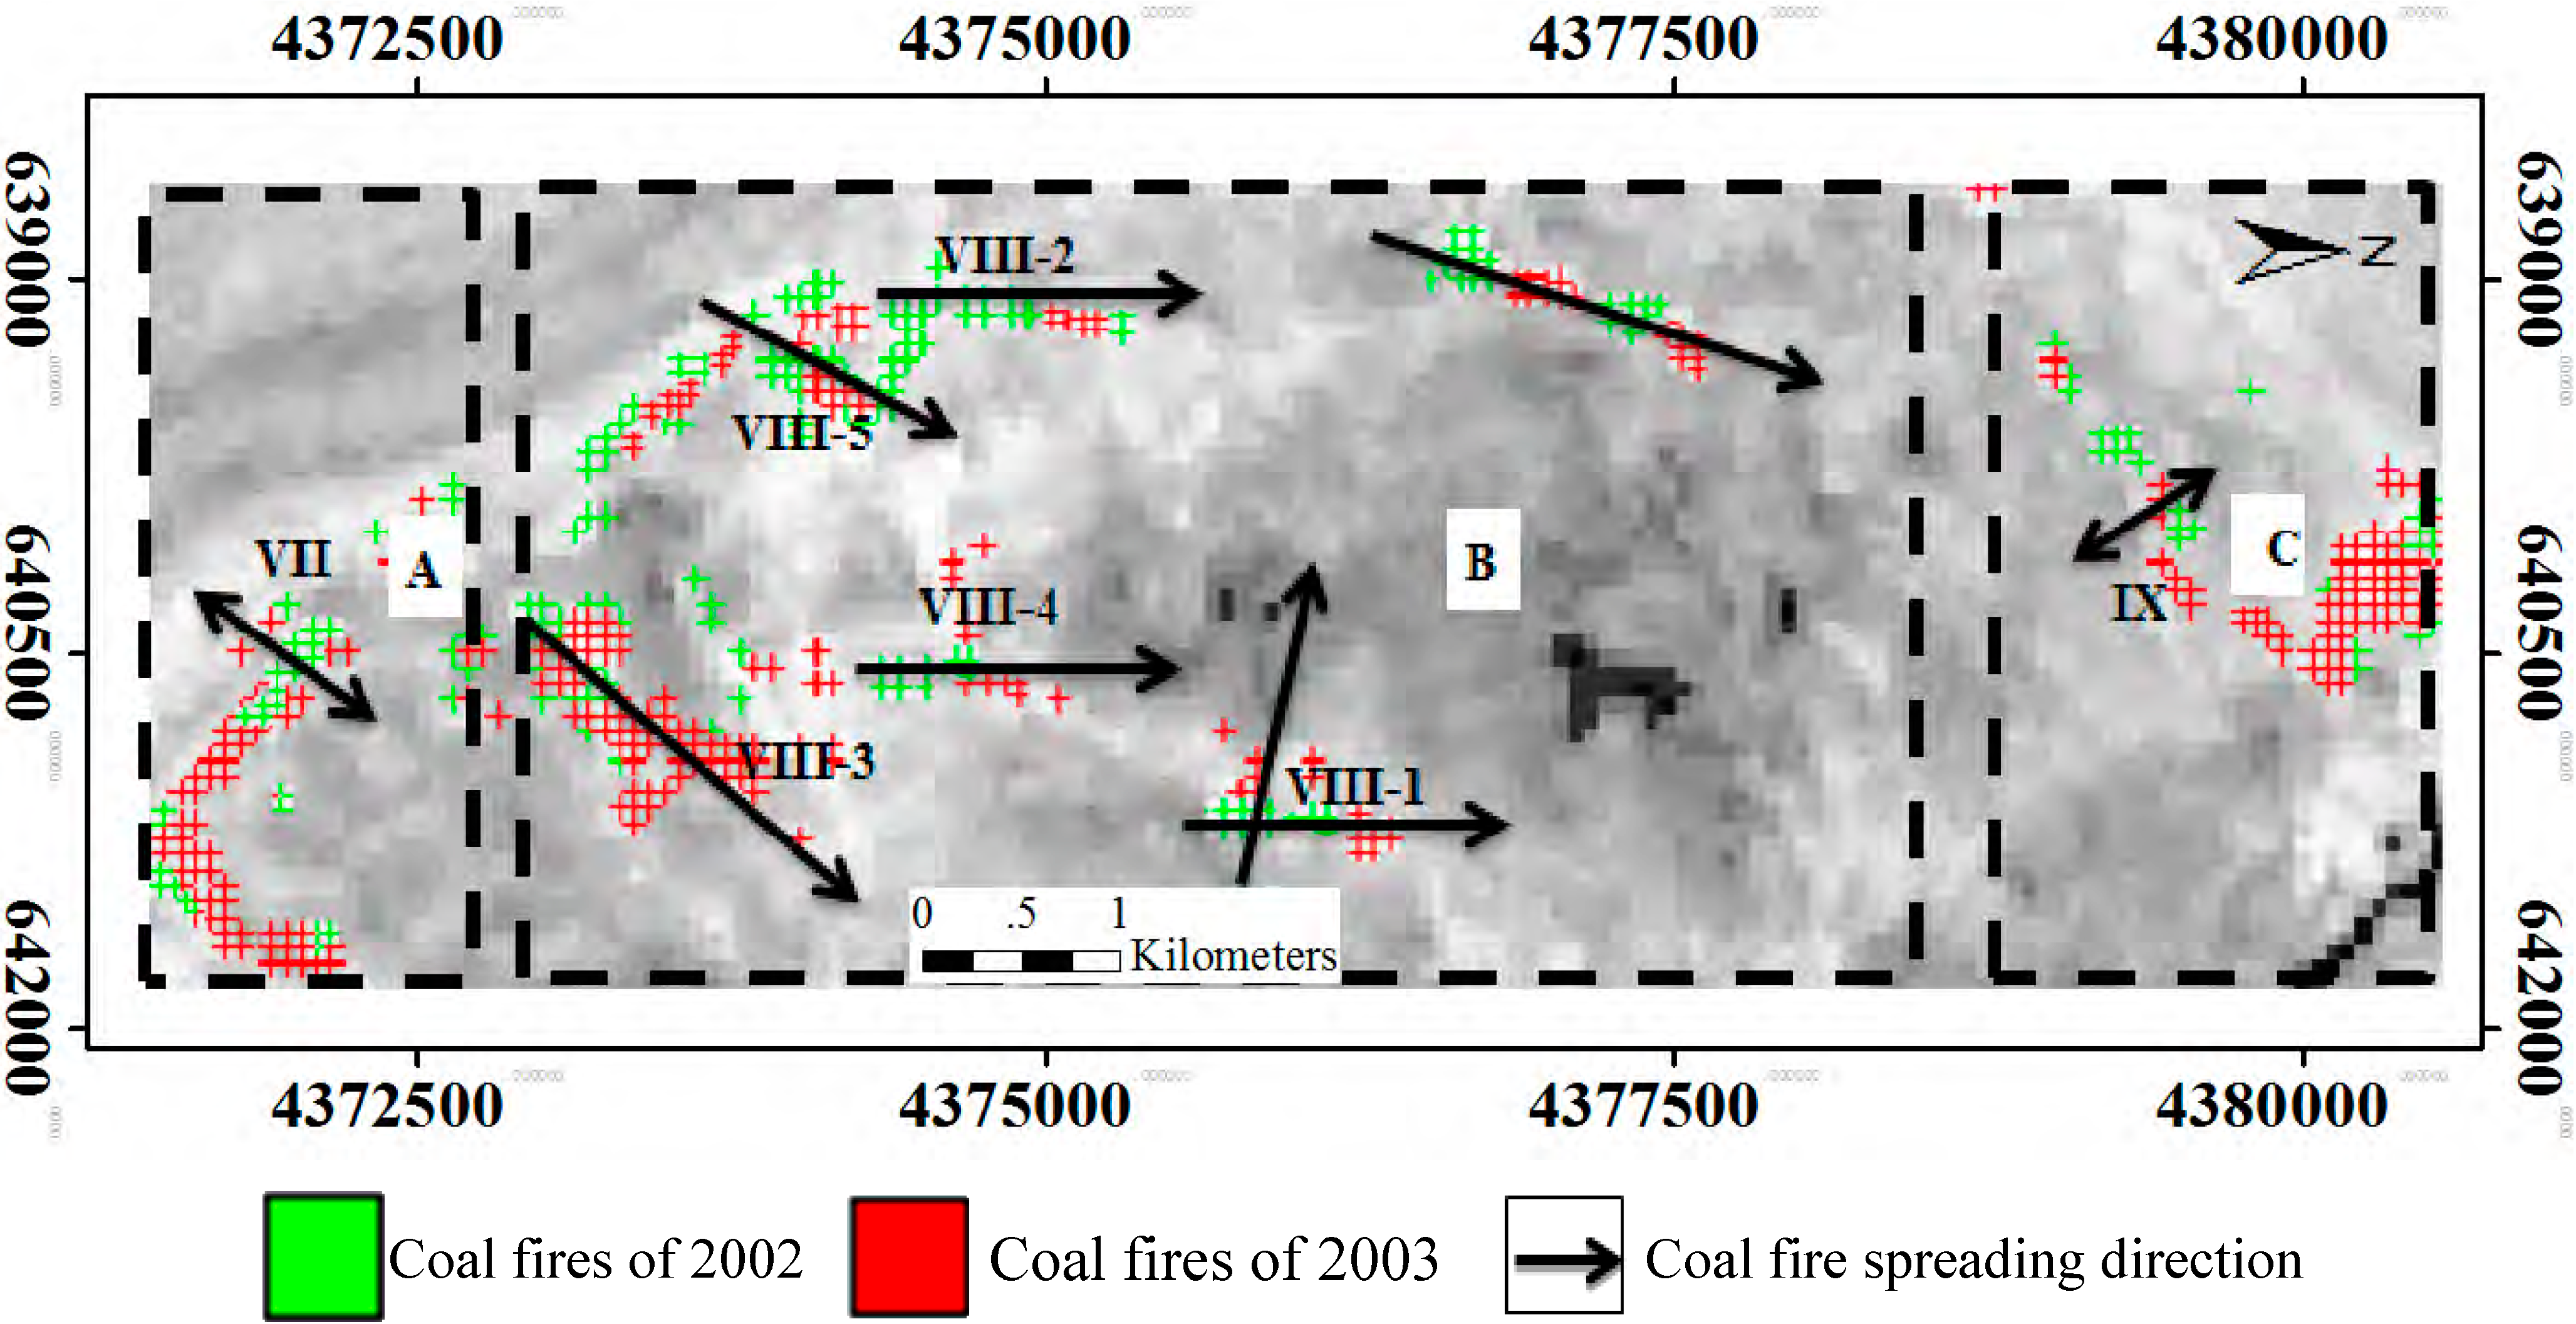
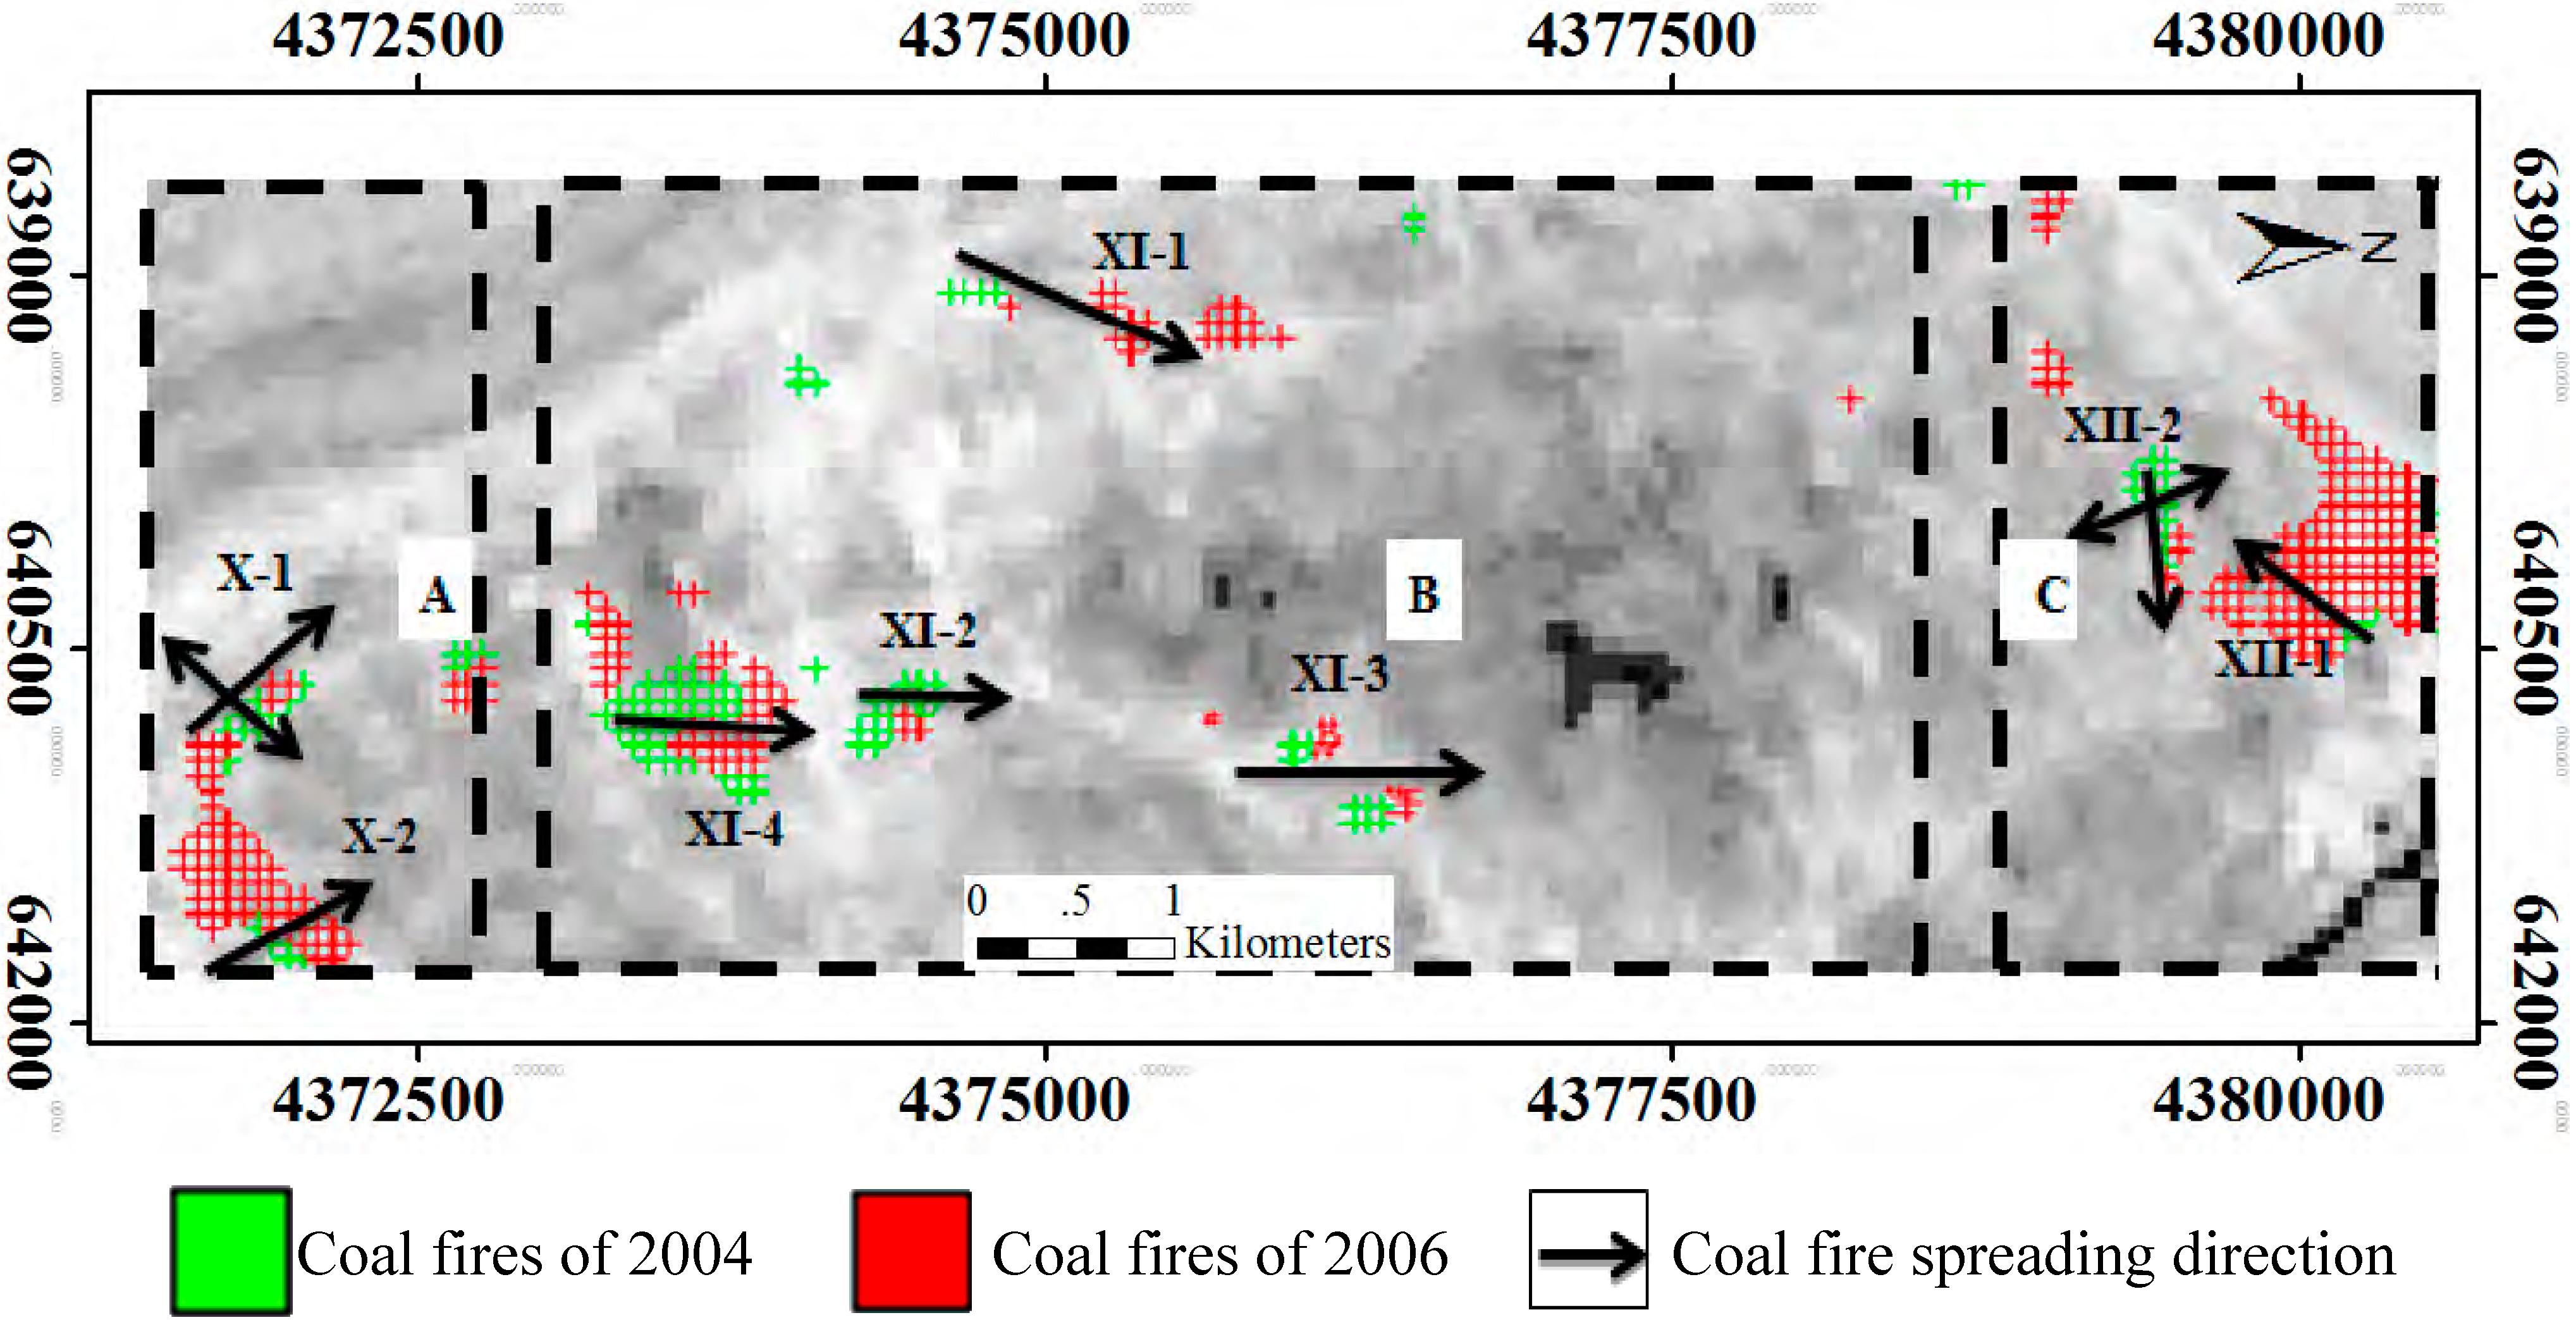
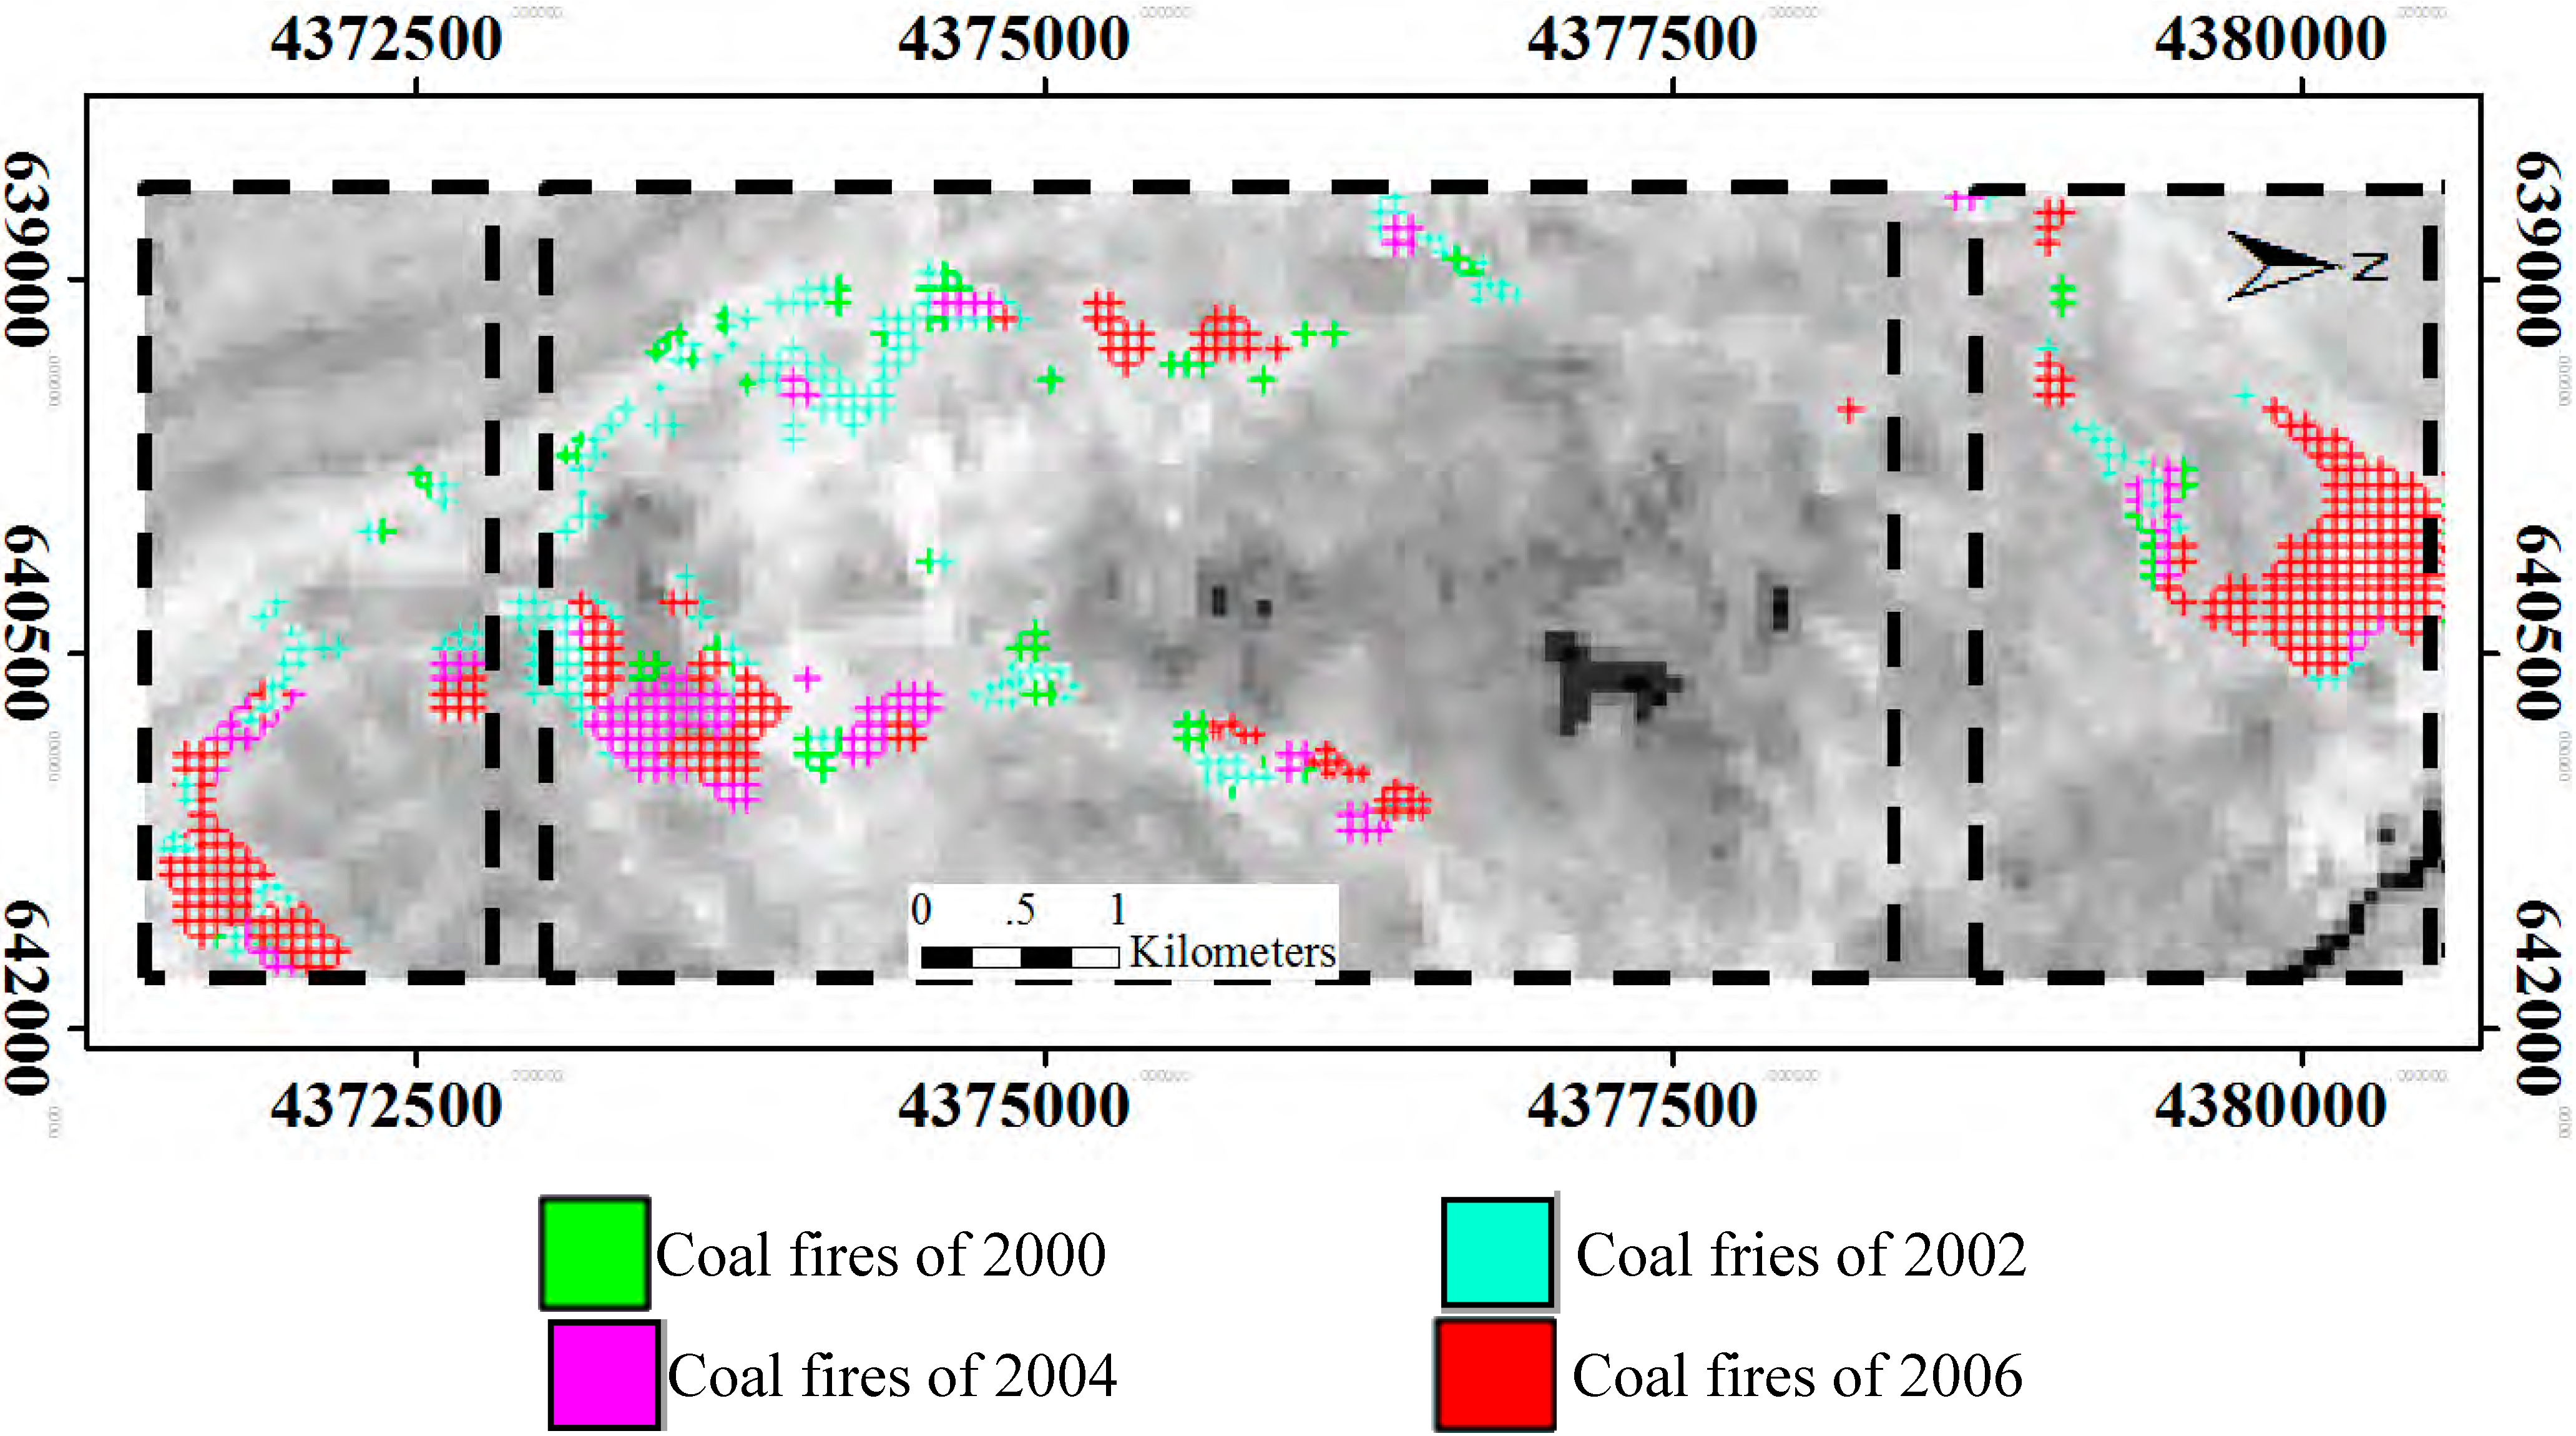
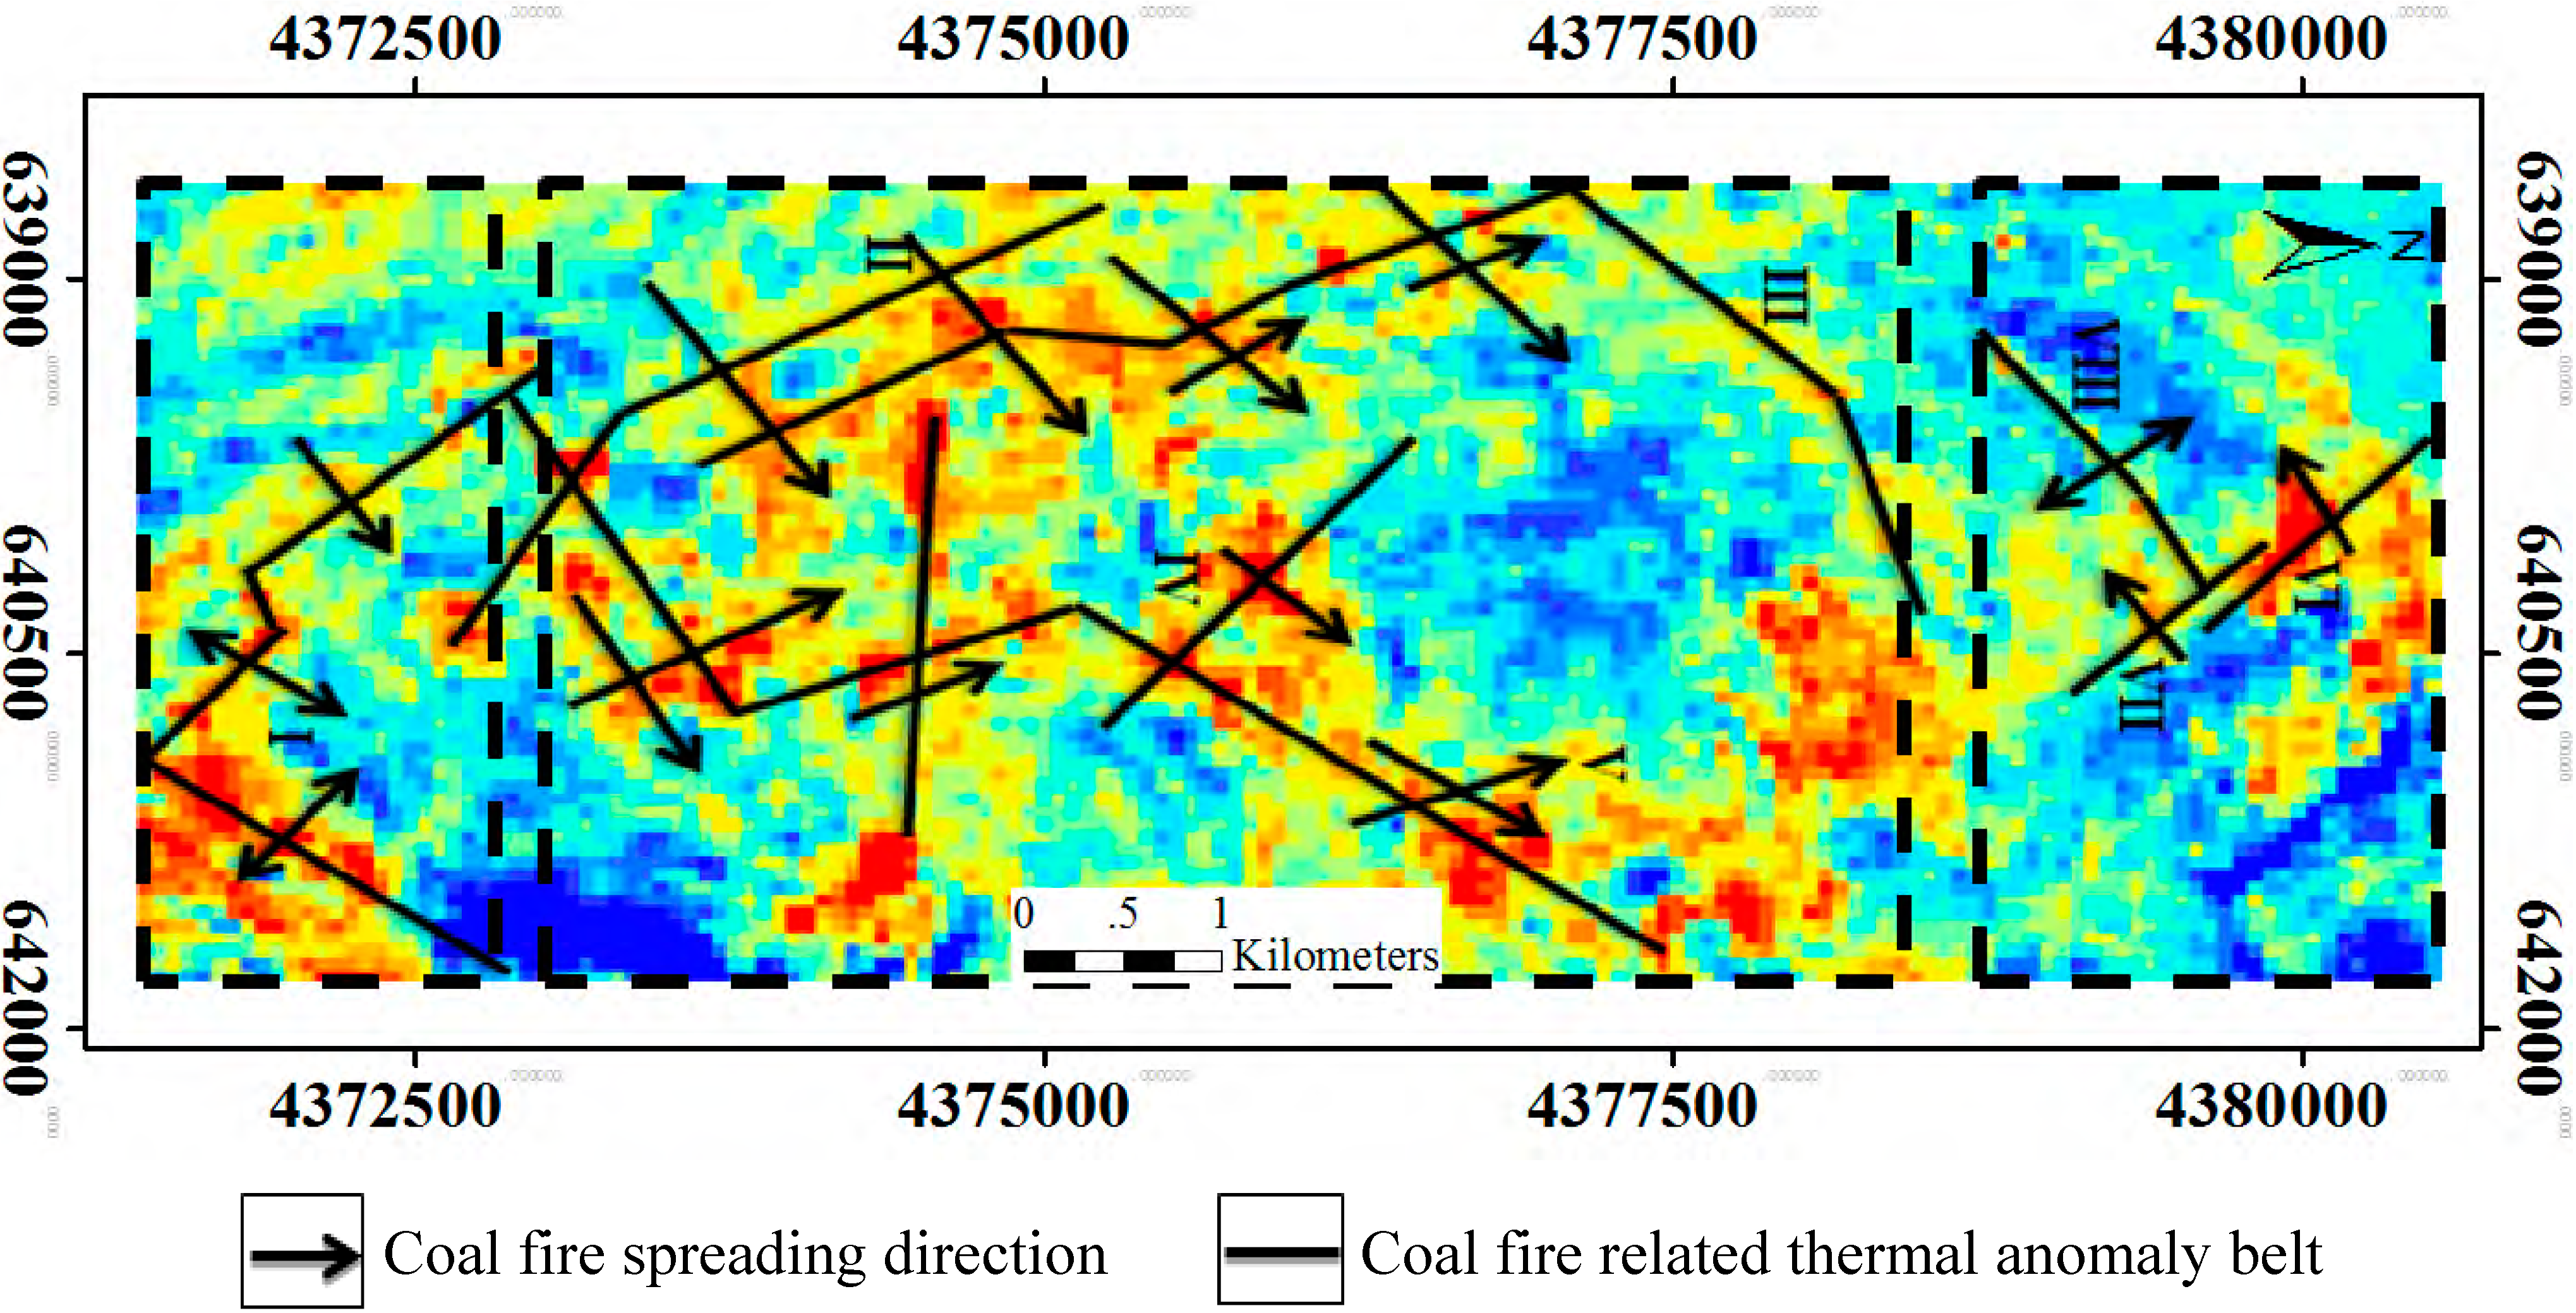
5.2. Analysis of the Coal Fire Spreading Direction from 1999 to 2006
| Data Type | Spatial Resolution (m) | Acquisition Time | Threshold (K) | Area of Coal Fire (m2) |
|---|---|---|---|---|
| ETM+ | 120 | 12 August 1999 | 316.0 | 309,600 |
| ETM+ | 120 | 30 August 2000 | 313.0 | 651,600 |
| ETM+ | 120 | 29 May 2001 | 316.0 | 684,000 |
| ETM+ | 120 | 20 August 2002 | 308.0 | 770,400 |
| ETM+ | 120 | 3 May 2003 | 315.0 | 838,800 |
| TM | 120 | 17 August. 2004 | 308.0 | 918,800 |
| TM | 120 | 7 August 2006 | 310.0 | 1,015,400 |


6. Conclusions
Acknowledgements
Author Contributions
Conflicts of Interest
References
- Gangopadhyay, P. Coalfire Detection and Monitoring in Wuda, North China: A Multi-Spectral and Multi-Sensor TIR Approach. Master’s Thesis, International Institute for Geo-Information Science and Earth Observation (ITC), Enschede, The Netherlands, 2003. [Google Scholar]
- Banerjee, S.C. Spontaneous Combustion of Coal and Mine Fires; A. A. Balkema: Rotterdam, The Netherlands, 1985. [Google Scholar]
- Schmal, D.; Duyzer, J.H.; van Heuven, J.W. A model for the spontaneous heating of coal. Fuel 1985, 64, 963–972. [Google Scholar] [CrossRef]
- Fisher, W.J.; Knuth, W.M. Detection and delineation of subsurface coal fires by aerial infrared scanning. Geol. Soc. Am. Spec. Pap. 1968, 115, 67–68. [Google Scholar]
- Greene, G.W.; Moxham, R.M. Aerial Infrared surveys and borehole temperature measurements of coal mine fires in Pennsylvania. In Proceeding of the 6th Symposium on Remote Sensing of Envrionment, Ann Arbor, MI, USA, 13–16 October 1969; pp. 517–525.
- Ellyett, C.D.; Fleming, A.W. Thermal infrared imagery of the burning mountain coal fire. Remote Sens. Environ. 1974, 3, 79–86. [Google Scholar] [CrossRef]
- Sinha, P.R. Mine fires in Indian coalfields. Energy 1986, 11, 1147–1154. [Google Scholar] [CrossRef]
- Mukherjee, T.K.; Bandyopadhyay, T.; Pande, S. Detection and delineation of depth of subsurface coalmine fires based on an airborne multispectral scanner survey in a part of the Jharia coalfield, India. Photogramm. Eng. Remote Sens. 1991, 57, 1203–1207. [Google Scholar]
- Cassells, C.; van Genderen, J.; Zhang, X. Detection and measuring underground coal fires by remote sensing. In Proceddings of 8th Australia Remote Sensing Conference, Canberra, ACT, Austrilia, 25–29 March 1996; pp. 90–101.
- Stracher, G.B. Coal fires: A burning global recipe for catastrophe. Geotimes 2002, 47, 36–37. [Google Scholar]
- Finkelman, R.B. Potential health impacts of burning coal beds and waste banks. Int. J. Coal Geol. 2004, 59, 19–24. [Google Scholar] [CrossRef]
- Whitehouse, A.E.; Mulyana, A.A.S. Coal fires in Indonesia. Int. J. Coal Geo. 2004, 59, 91–97. [Google Scholar] [CrossRef]
- Agarwal, R.; Singh, D.; Chauhan, D.; Singh, K. Detection of coal mine fires in the Jharia coal field using NOAA/AVHRR data. J. Geo. Eng. 2006, 3, 212–218. [Google Scholar] [CrossRef]
- Kuenzer, C.; Zhang, J.; Tetzlaff, A.; van Dijk, P.; Voigt, S.; Mehl, H.; Wagner, W. Uncontrolled coal fires and their environmental impacts: Investigating two arid mining regions in north-central China. Appl. Geogr. 2007, 27, 42–62. [Google Scholar] [CrossRef]
- Zhou, L.; Zhang, D.; Wang, J.; Huang, Z.; Pan, D. Mapping land subsidence related to underground coal fires in the Wuda coalfield (northern China) using a small stack of ALOS PALSAR differential interferograms. Remote Sens. 2013, 5, 1152–1176. [Google Scholar] [CrossRef]
- Huo, H.; Jiang, X.; Song, X.; Li, Z.-L.; Ni, Z.; Gao, C. Detection of coal fire dynamics and propagation direction from multi-temporal nighttime Landsat SWIR and TIR data: A case study on the Rujigou coalfield, Northwest (NW) China. Remote Sens. 2014, 6, 1234–1259. [Google Scholar] [CrossRef]
- Huo, H.; Jiang, X.; Song, X.; Ni, Z.; Gao, C.; Zhang, Y.; Liu, L. A study on spreading direction of coal-fire based with TIR remote sensing in Wuda Coalfield from 2000 to 2006, Northern China. IOP Conf. Ser.: Earth Environ. Sci. 2014, 17. [Google Scholar] [CrossRef]
- Kuenzer, C.; Strunz, G.; Voigt, S.; Wagner, W. Multitemporal landcover investigations in an arid mining environment: Coal fire areas in northern China. In Proceeding of the Conference of the EARSel Special Interest Group on Land Use and Land Cover, Dubrovnik, Croatia, 25–27 May 2004; pp. 125–134.
- Kuenzer, C.; Voigt, S.; Morth, D. Investigating land cover changes in two Chinese coal mining environment using partial unmixing. In Proceedings of the GGRS Conference 2004, Applications in Geosciences, Gottinger, Germany, 7–8 October 2004; pp. 31–37.
- Chen, Y.; Jing, L.; Bo, Y.; Shi, P.; Zhang, S. Detection of coal fire location and change based on multi-temporal thermal remotely sensed data and field measurements. Int. J. Remote Sens. 2007, 28, 3173–3179. [Google Scholar] [CrossRef]
- Kuenzer, C.; Hecker, C.; Zhang, J.; Wessling, S.; Wagner, W. The potential of multidiurnal MODIS thermal band data for coal fire detection. Int. J. Remote Sens. 2007, 29, 923–944. [Google Scholar] [CrossRef]
- Kuenzer, C.; Wessling, S.; Zhang, J.; Litschke, T.; Schmidt, M.; Schulz, J.; Gielisch, H.; Wagner, W. Concepts for green house gas emission estimation of underground coal seam fires. Geophys. Res. Abstr. 2007, 9, 11716. [Google Scholar]
- Kuenzer, C.; Zhang, J.; Li, J.; Voigt, S.; Mehl, H.; Wagner, W. Detecting unknown coal fires: Synergy of automated coal fire risk area delineation and improved thermal anomaly extraction. Int. J. Remote Sens. 2007, 28, 4561–4585. [Google Scholar] [CrossRef]
- Song, Z.; Kuenzer, C. Coal fires in China over the last decade: A comprehensive review. Int. J. Coal Geol. 2014, 133, 72–99. [Google Scholar] [CrossRef]
- Peng, F.; Li, J.J. Aplication of the ground radon exploration on the coal spontaneous resource. West-China Explor. Eng. 2007, 12, 98–100. (In Chinese) [Google Scholar]
- Zhang, J.; Kuenzer, C.; Tetzlaff, A.; Oertel, D.; Zhukov, B.; Wagner, W. Thermal characteristics of coal fires 2: Results of measurements on simulated coal fires. J. Appl. Geophys. 2007, 63, 135–147. [Google Scholar] [CrossRef]
- Li, A. Application of radon measure technique for fire exploration extinguishing in ventilating shaft of Dongshan coal mine. Coal Technol. 2008, 27, 65–67. (In Chinese) [Google Scholar]
- Gangopadhyay, P.K. Coalfires Related CO2 Emissions and Remote Sensing. Ph.D. Thesis, International Institute for Geo-Information Science and Earth Observation (ITC), Enschede, The Netherlands, 2008. [Google Scholar]
- Meng, X.; Chu, R.; Wu, G.; Xu, H.; Zhu, J.; Wang, Z. Thermogravimetric study of the effect of a PVA oxygen-insulating barrier on the spontaneous combustion of coal. Min. Sci. Technol. (China) 2010, 20, 882–885. [Google Scholar] [CrossRef]
- Abbott, W.E. Mount Wingen and the Wingen Coal Measures; Angus & Robertson: Sydeny, NSW, Austrilia, 1918. [Google Scholar]
- Davis, S.M.; Landgrebe, D.A.; Phillips, T.L.; Swain, P.H.; Hoffer, R.M.; Lindenlaub, J.C.; Silva, L.F. Remote Sensing: The Quantitative Approach; McGraw-Hill Int. Book Co.: New York, NY, USA, 1978. [Google Scholar]
- Chuvieco, E.; Congalton, R.G. Application of remote sensing and geographic information systems to forest fire hazard mapping. Remote Sens. Environ. 1989, 29, 147–159. [Google Scholar] [CrossRef]
- Ram, B.; Kolarkar, A. Remote sensing application in monitoring land-use changes in arid Rajasthan. Int. J. Remote Sens. 1993, 14, 3191–3200. [Google Scholar] [CrossRef]
- Rosema, A.; van Genderen, J.; Schalke, H. Environmental Monitoring of Coal Fires in North China; Project Identification Mission Report; Delft Beleids Commmissie Remote Sensing (BCRS): Delft, The Netherlands, 1993; Volume 93, p. 29. [Google Scholar]
- Sobrino, J.; Raissouni, N. Toward remote sensing methods for land cover dynamic monitoring: Application to Morocco. Int. J. Remote Sens. 2000, 21, 353–366. [Google Scholar] [CrossRef]
- Melesse, A.M.; Weng, Q.; Thenkabail, P.S.; Senay, G.B. Remote sensing sensors and applications in environmental resources mapping and modelling. Sensors 2007, 7, 3209–3241. [Google Scholar] [CrossRef]
- Duan, S.-B.; Li, Z.-L.; Tang, B.-H.; Wu, H.; Tang, R.; Bi, Y.; Zhou, G. Estimation of diurnal cycle of land surface temperature at high temporal and spatial resolution from clear-sky MODIS data. Remote Sens. 2014, 6, 3247–3262. [Google Scholar] [CrossRef]
- Huo, H.; Ni, Z.; Jiang, X.; Zhou, P.; Liu, L. Mineral mapping and ore prospecting with HyMap data over eastern Tien Shan, Xinjiang Uyghur Autonomous Region. Remote Sens. 2014, 6, 11829–11851. [Google Scholar] [CrossRef]
- Lu, J.; Tang, R.; Tang, H.; Li, Z.-L.; Zhou, G.; Shao, K.; Bi, Y.; Labed, J. Daily evaporative fraction parameterization scheme driven by day-night differences in surface parameters: Improvement and validation. Remote Sens. 2014, 6, 4369–4390. [Google Scholar] [CrossRef]
- Zhang, D.; Tang, R.; Zhao, W.; Tang, B.; Wu, H.; Shao, K.; Li, Z.-L. Surface soil water content estimation from thermal remote sensing based on the temporal variation of land surface temperature. Remote Sens. 2014, 6, 3170–3187. [Google Scholar] [CrossRef] [Green Version]
- Zhao, W.; Li, A.; Bian, J.; Jin, H.; Zhang, Z. A Synergetic algorithm for mid-morning land surface soil and vegetation temperatures estimation using MSG-SEVIRI products and TERRA-MODIS products. Remote Sens. 2014, 6, 2213–2238. [Google Scholar] [CrossRef]
- Slavecki, R.J. Detection and location of subsurface coal fires. In Proceedings of the Third Symposium on Remote Sensing of Environment, Ann Arbor, MI, USA, 14–16 October 1964; pp. 537–547.
- Künzer, C.; Zhang, J.; Voigt, S.; Center, G.R.S.D. Set up of a spectral database for unmixing approaches in mining environments in north-central China: Demarcating coal fire risk areas. In Proceedings of the 3rd EARSeL Workshop on Imaging Spectroscopy, Starnberg, Germany, 13–16 May 2003; pp. 344–348.
- Zhang, X.; Zhang, J.; Kuenzer, C.; Voigt, S.; Wagner, W. Capability evaluation of 3–5 µm and 8–12.5 µm airborne thermal data for underground coal fire detection. Int. J. Remote Sens. 2004, 25, 2245–2258. [Google Scholar] [CrossRef]
- Gangopadhyay, K.P.; Lahiri-Dutt, Kuntala. Detecting Coalfires with Remote Sensing: A Comparative Study of Selected Countries; Resource Management in Asia-Pacific Working Paper No. 58; Resource Management in Aisa-Pacific Program, Research School of Pacific and Aisan Studies, The Australian National University: Canberra, ACT, Australia, 2005. [Google Scholar]
- Gangopadhyay, P.K.; Maathuis, B.; van Dijk, P. ASTER-derived emissivity and coal-fire related surface temperature anomaly: A case study in Wuda, North China. Int. J. Remote Sens. 2005, 26, 5555–5571. [Google Scholar] [CrossRef]
- Künzer, C. Demarcating Coal Fire Risk Areas Based on Spectral Test Sequences and Partial Unmixing Using Multi Sensor Remote Sensing Data. Ph.D. Thesis, Technical University Vienna, Vienna, Austria, 2005; p. 199. [Google Scholar]
- Hecker, C.; Kuenzer, C.; Zhang, J. Remote-sensing-based coal-fire detection with low-resolution MODIS data. Rev. in Eng. Geol. 2007, 18, 229–239. [Google Scholar]
- Zhang, J.; Kuenzer, C. Thermal surface characteristics of coal fires 1 results of in-situ measurements. J. Appl. Geophys. 2007, 63, 117–134. [Google Scholar] [CrossRef]
- Wessling, S.; Kuenzer, C.; Kessels, W.; Wuttke, M.W. Numerical modeling for analyzing thermal surface anomalies induced by underground coal fires. Int. J. Coal Geol. 2008, 74, 175–184. [Google Scholar] [CrossRef]
- Li, Z.-L.; Wu, H.; Wang, N.; Qiu, S.; Sobrino, J.A.; Wan, Z.; Tang, B.-H.; Yan, G. Land surface emissivity retrieval from satellite data. Int. J. Remote Sens. 2012, 34, 3084–3127. [Google Scholar] [CrossRef]
- Li, Z.-L.; Tang, B.-H.; Wu, H.; Ren, H.; Yan, G.; Wan, Z.; Trigo, I.F.; Sobrino, J.A. Satellite-derived land surface temperature: CURRENT status and perspectives. Remote Sens. Environ. 2013, 131, 14–37. [Google Scholar] [CrossRef]
- Sobrino, J.A.; Oltra-Carrió, R.; Sòria, G.; Jiménez-Muñoz, J.C.; Franch, B.; Hidalgo, V.; Mattar, C.; Julien, Y.; Cuenca, J.; Romaguera, M. Evaluation of the surface urban heat island effect in the city of Madrid by thermal remote sensing. Int. J. Remote Sens. 2013, 34, 3177–3192. [Google Scholar] [CrossRef]
- Yang, B.; Chen, Y.; Li, J.; Gong, A.; Kuenzer, C.; Zhang, J. Simple normalization of multi-temporal thermal IR data and applied research, on the monitoring of typical coal fires in northern China. In Proceedings of the Geoscience and Remot Sensing Symposium (IGARSS), Seoul, South Korea, 25–29 July 2005; pp. 5725–5728.
- Prakash, A. Remote Sensing-GIS Based Geoenvironmental Studies in Jharia Coalfield, India, with Special Reference to Coalmine Fires. Ph.D. Thesis, University of Roorkee, Roorkee, India, 1996. [Google Scholar]
- Prakash, A.; Gupta, R.P.; Saraf, A.K. A Landsat TM based comparative study of surface and subsurface fires in the Jharia coalfield, India. Int. J. Remote Sens. 1997, 18, 2463–2469. [Google Scholar] [CrossRef]
- Prakash, A.; Gupta, R.P. Land-use mapping and change detection in a coal mining area—Case study in the Jharia coalfield, India. Int. J. Remote Sens. 1998, 19, 391–410. [Google Scholar] [CrossRef]
- Prakash, A.; Gupta, R.P. Surface fires in Jharia coalfield, India—Their distribution and estimation of area and temperature from TM data. Int. J. Remote Sens. 1999, 20, 1935–1946. [Google Scholar] [CrossRef]
- Dozier, J. A method for satellite identification of surface temperature fields of subpixel resolution. Remote Sens. Environ. 1981, 11, 221–229. [Google Scholar] [CrossRef]
- Prakash, A.; Schaefer, K.; Witte, W.K.; Collins, K.; Gens, R.; Goyette, M.P. A remote sensing and GIS based investigation of a boreal forest coal fire. Int. J. Coal Geol. 2011, 86, 79–86. [Google Scholar] [CrossRef]
- Sobrino, J.A.; Raissouni, N. Toward remote sensing methods for land cover dynamic monitoring: Application to Morocco. Int. J. Remote Sens. 2000, 21, 353–366. [Google Scholar] [CrossRef]
- Gillespie, A.; Rokugawa, S.; Matsunaga, T.; Cothern, J.S.; Hook, S.; Kahle, A.B. A temperature and emissivity separation algorithm for Advanced Spaceborne Thermal Emission and Reflection Radiometer (ASTER) images. IEEE Trans. Geosci. Remote Sens. 1998, 36, 1113–1126. [Google Scholar] [CrossRef]
- Gillespie, A.R.; Rokugawa, S.; Hook, S.J.; Matsunaga, T.; Kahle, A.B. Temperature/Emissivity Separation Algorithm Theoretical Basis Document, Version 2.4; ATBD Contract NAS5-31372; National Aeronautics and Space Administration: Washington, DC, USA, 1999. [Google Scholar]
- Markham, B.; Baker, J. EOSAT Landsat Technical Notes No. 1; EOSAT: Lanham, MD, USA, 1986; p. 8. [Google Scholar]
- Prakash, A.; Saraf, A.K.; Gupta, R.P.; Dutta, M.; Sundaram, R.M. Surface thermal anomalies associated with underground fires in Jharia coal mines, India. Int. J. Remote Sens. 1995, 16, 2105–2109. [Google Scholar] [CrossRef]
- Wang, C. Detection of Coal Fires in Xinjiang (China) Using Remote Sensing Techniques. Master’s Thesis, Faculty of Geo-Information Science and Earth Information (ITC), Enschede, The Nethelands, 2002; p. 93. [Google Scholar]
- Prakash, A.; Gens, R.; Vekerdy, Z. Monitoring coal fires using multi-temporal night-time thermal images in a coalfield in North-West China. Int. J. Remote Sens. 1999, 20, 2883–2888. [Google Scholar] [CrossRef]
- Stracher, G.B.; Prakash, A.; Sokol, E.V. Coal and Peat Fires: A Global Perspective Volume 1: Coal—Geology and Combustion; Elsevier Science: Amsterdam, The Netherlands, 2010. [Google Scholar]
- Raju, A.; Gupta, R.P.; Prakash, A. Delineation of coalfield surface fires by thresholding Landsat TM-7 day-time image data. Geocarto Int. 2012, 28, 343–363. [Google Scholar] [CrossRef]
- Kong, B.; Zhou, Z.; Ma, J.; Zhang, G.; Long, X. Study on integrated detecting on the 18th coal fire zone of Wuda Coalfield. Shenhua Sci. Technol. 2009, 7, 8–13. (in Chinese). [Google Scholar]
© 2015 by the authors; licensee MDPI, Basel, Switzerland. This article is an open access article distributed under the terms and conditions of the Creative Commons Attribution license (http://creativecommons.org/licenses/by/4.0/).
Share and Cite
Huo, H.; Ni, Z.; Gao, C.; Zhao, E.; Zhang, Y.; Lian, Y.; Zhang, H.; Zhang, S.; Jiang, X.; Song, X.; et al. A Study of Coal Fire Propagation with Remotely Sensed Thermal Infrared Data. Remote Sens. 2015, 7, 3088-3113. https://doi.org/10.3390/rs70303088
Huo H, Ni Z, Gao C, Zhao E, Zhang Y, Lian Y, Zhang H, Zhang S, Jiang X, Song X, et al. A Study of Coal Fire Propagation with Remotely Sensed Thermal Infrared Data. Remote Sensing. 2015; 7(3):3088-3113. https://doi.org/10.3390/rs70303088
Chicago/Turabian StyleHuo, Hongyuan, Zhuoya Ni, Caixia Gao, Enyu Zhao, Yuze Zhang, Yi Lian, Huili Zhang, Shiyue Zhang, Xiaoguang Jiang, Xianfeng Song, and et al. 2015. "A Study of Coal Fire Propagation with Remotely Sensed Thermal Infrared Data" Remote Sensing 7, no. 3: 3088-3113. https://doi.org/10.3390/rs70303088