
Remotely Sensed Active Layer Thickness (ReSALT) at Barrow, Alaska Using Interferometric Synthetic Aperture Radar

 ,
,
Abstract
:
1. Introduction

2. Methods
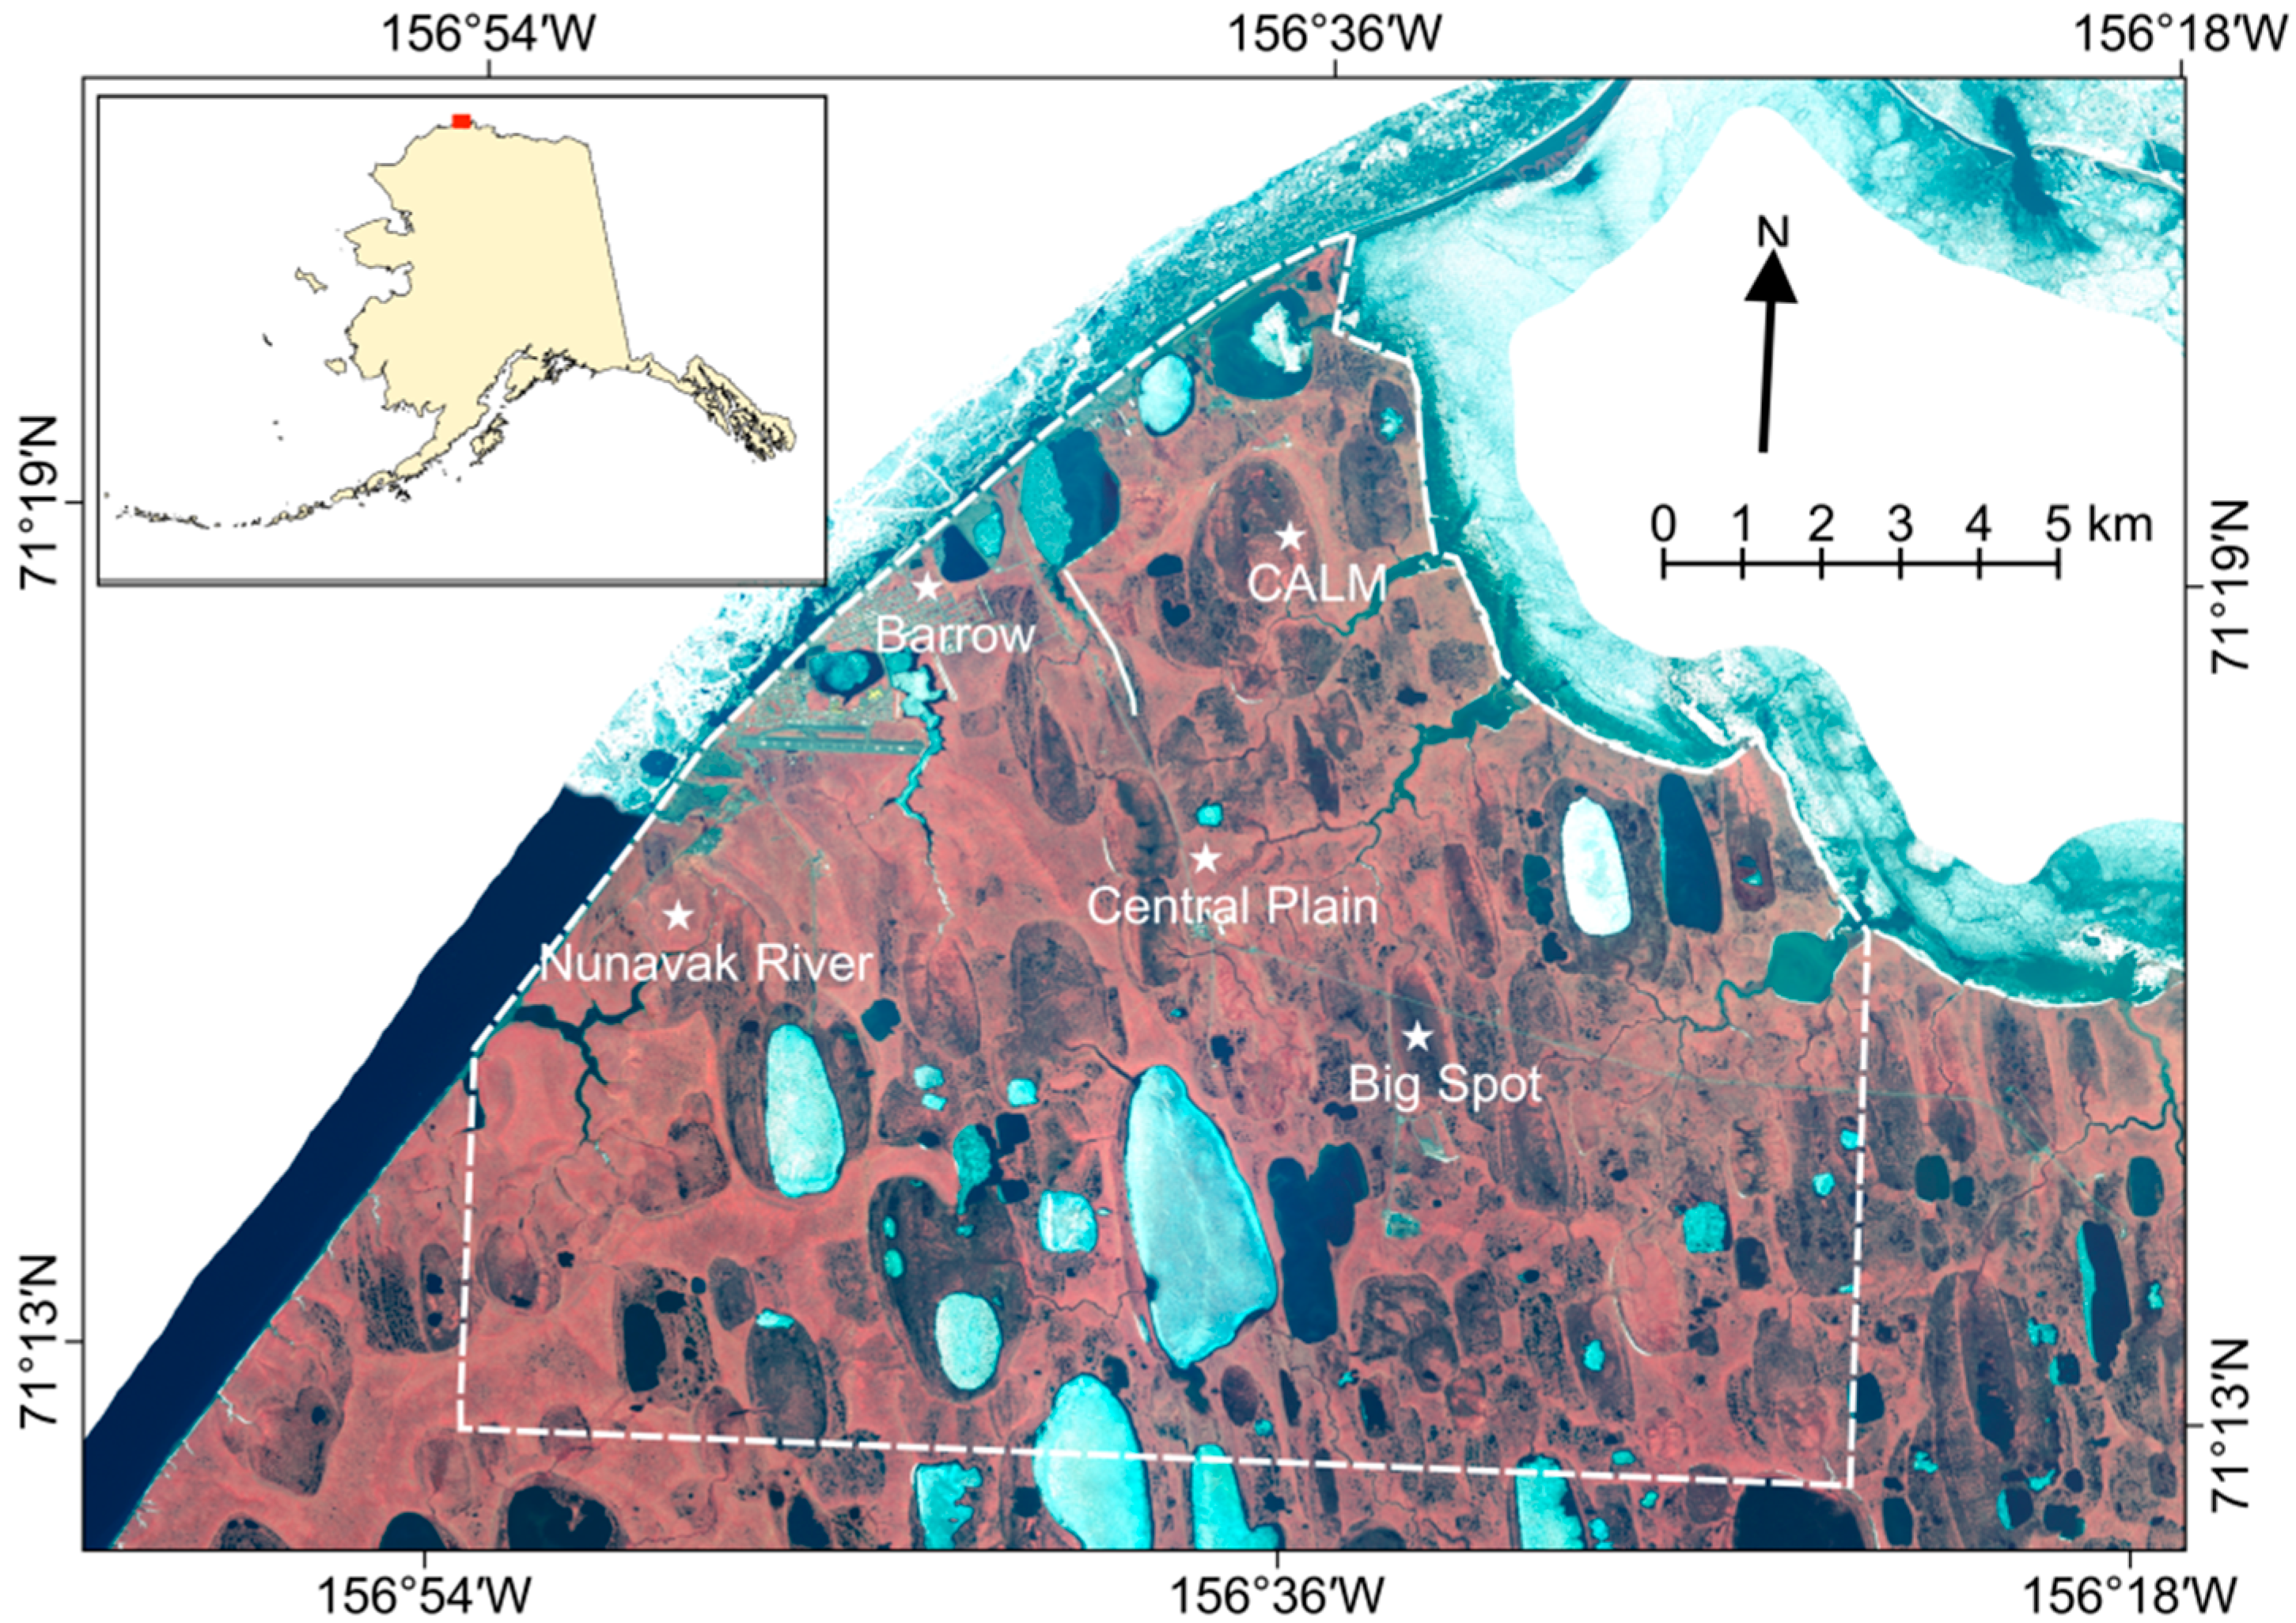
2.1. Validation Sites

| Site | Latitude (deg) | Longitude (deg) | Date in 2013 | Selection Criteria |
|---|---|---|---|---|
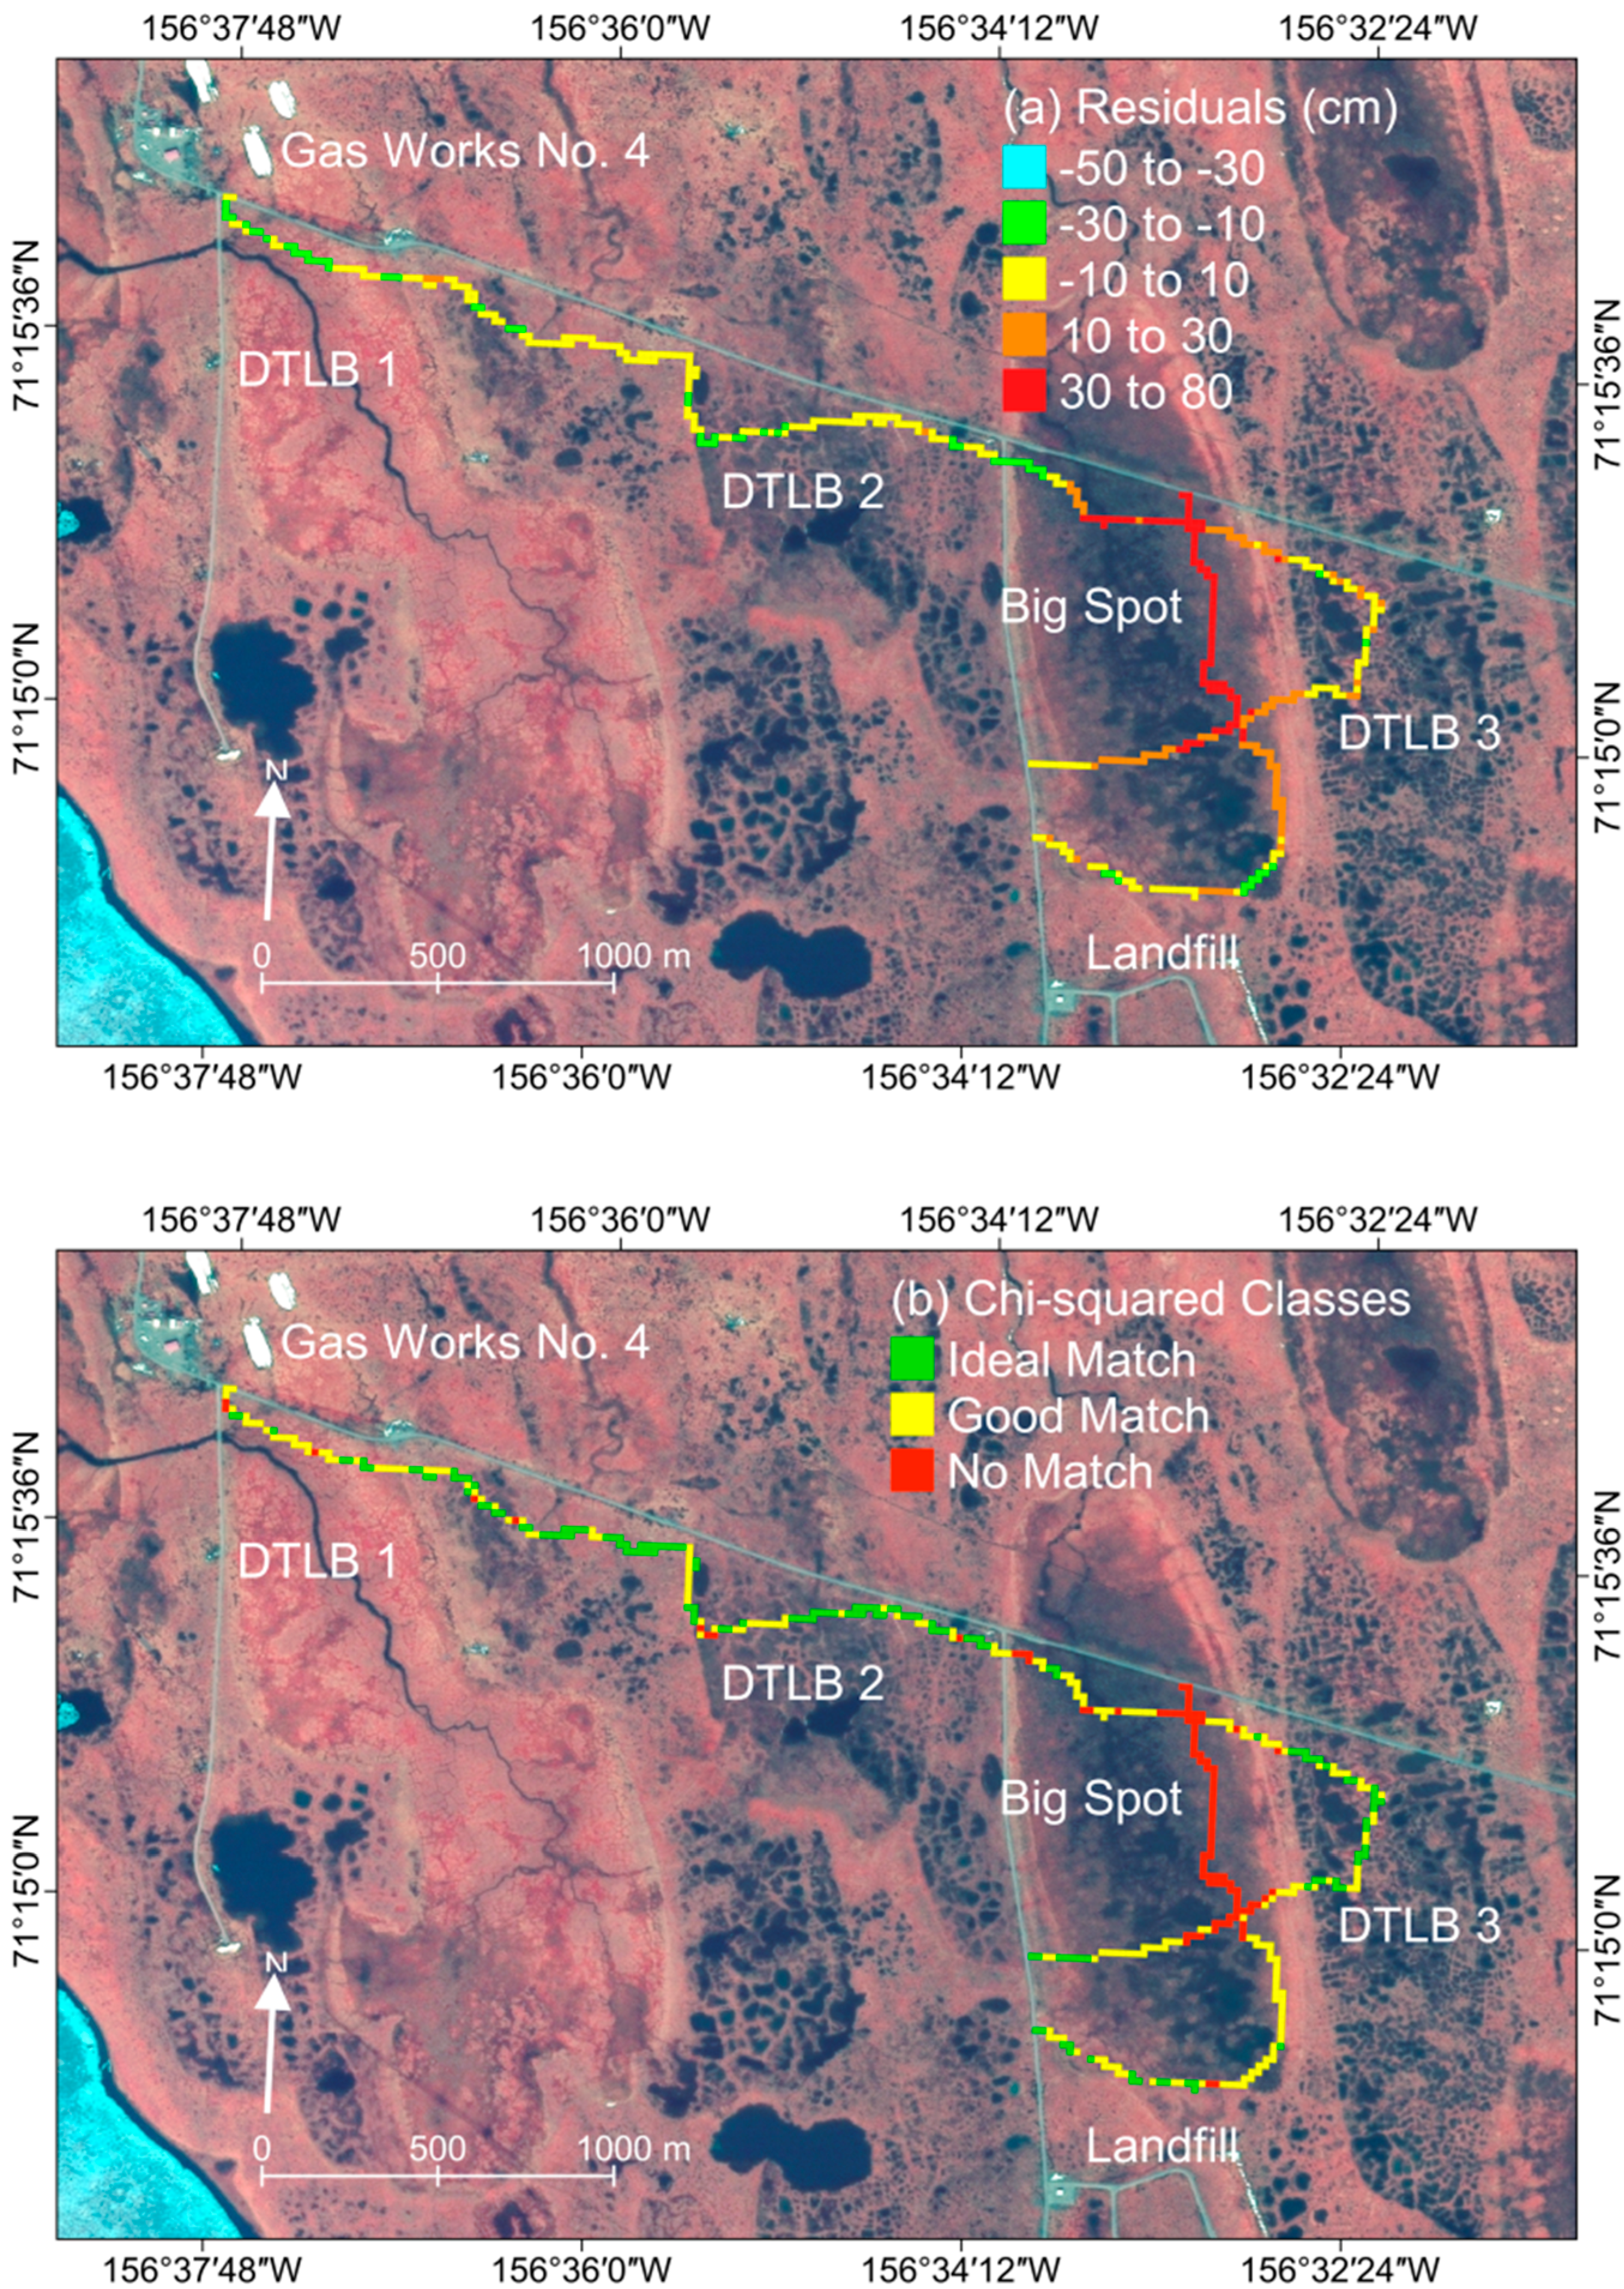
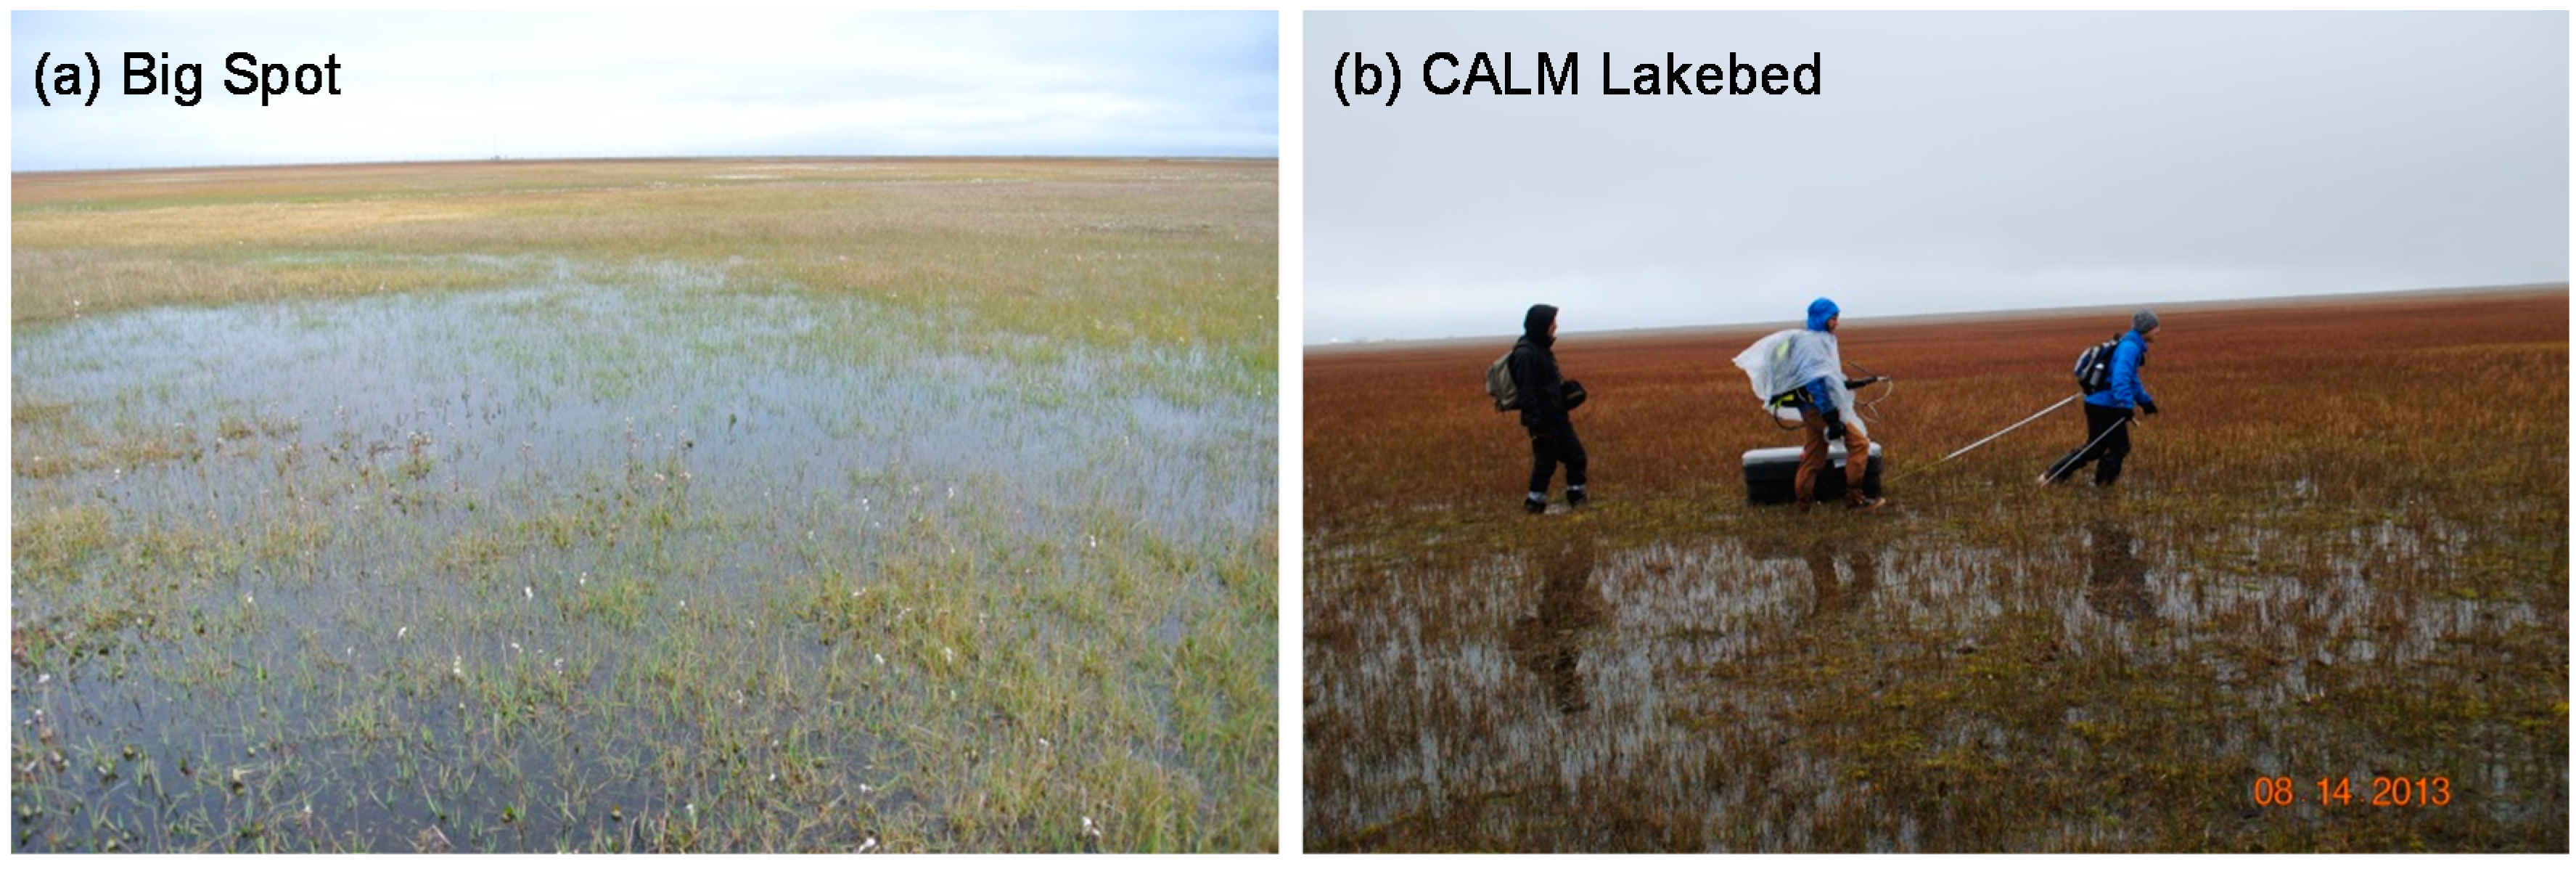
| Big Spot | 71.252975 | −156.557655 | 11–12 August | Largest ReSALT values; typical DTLB conditions |
| CALM | 71.31202 | −156.609585 | 14–15 August | Large DTLBs; historical ALT observations |
| Central Plain | 71.273177 | −156.634896 | 12–13 August | Typical undisturbed tundra |
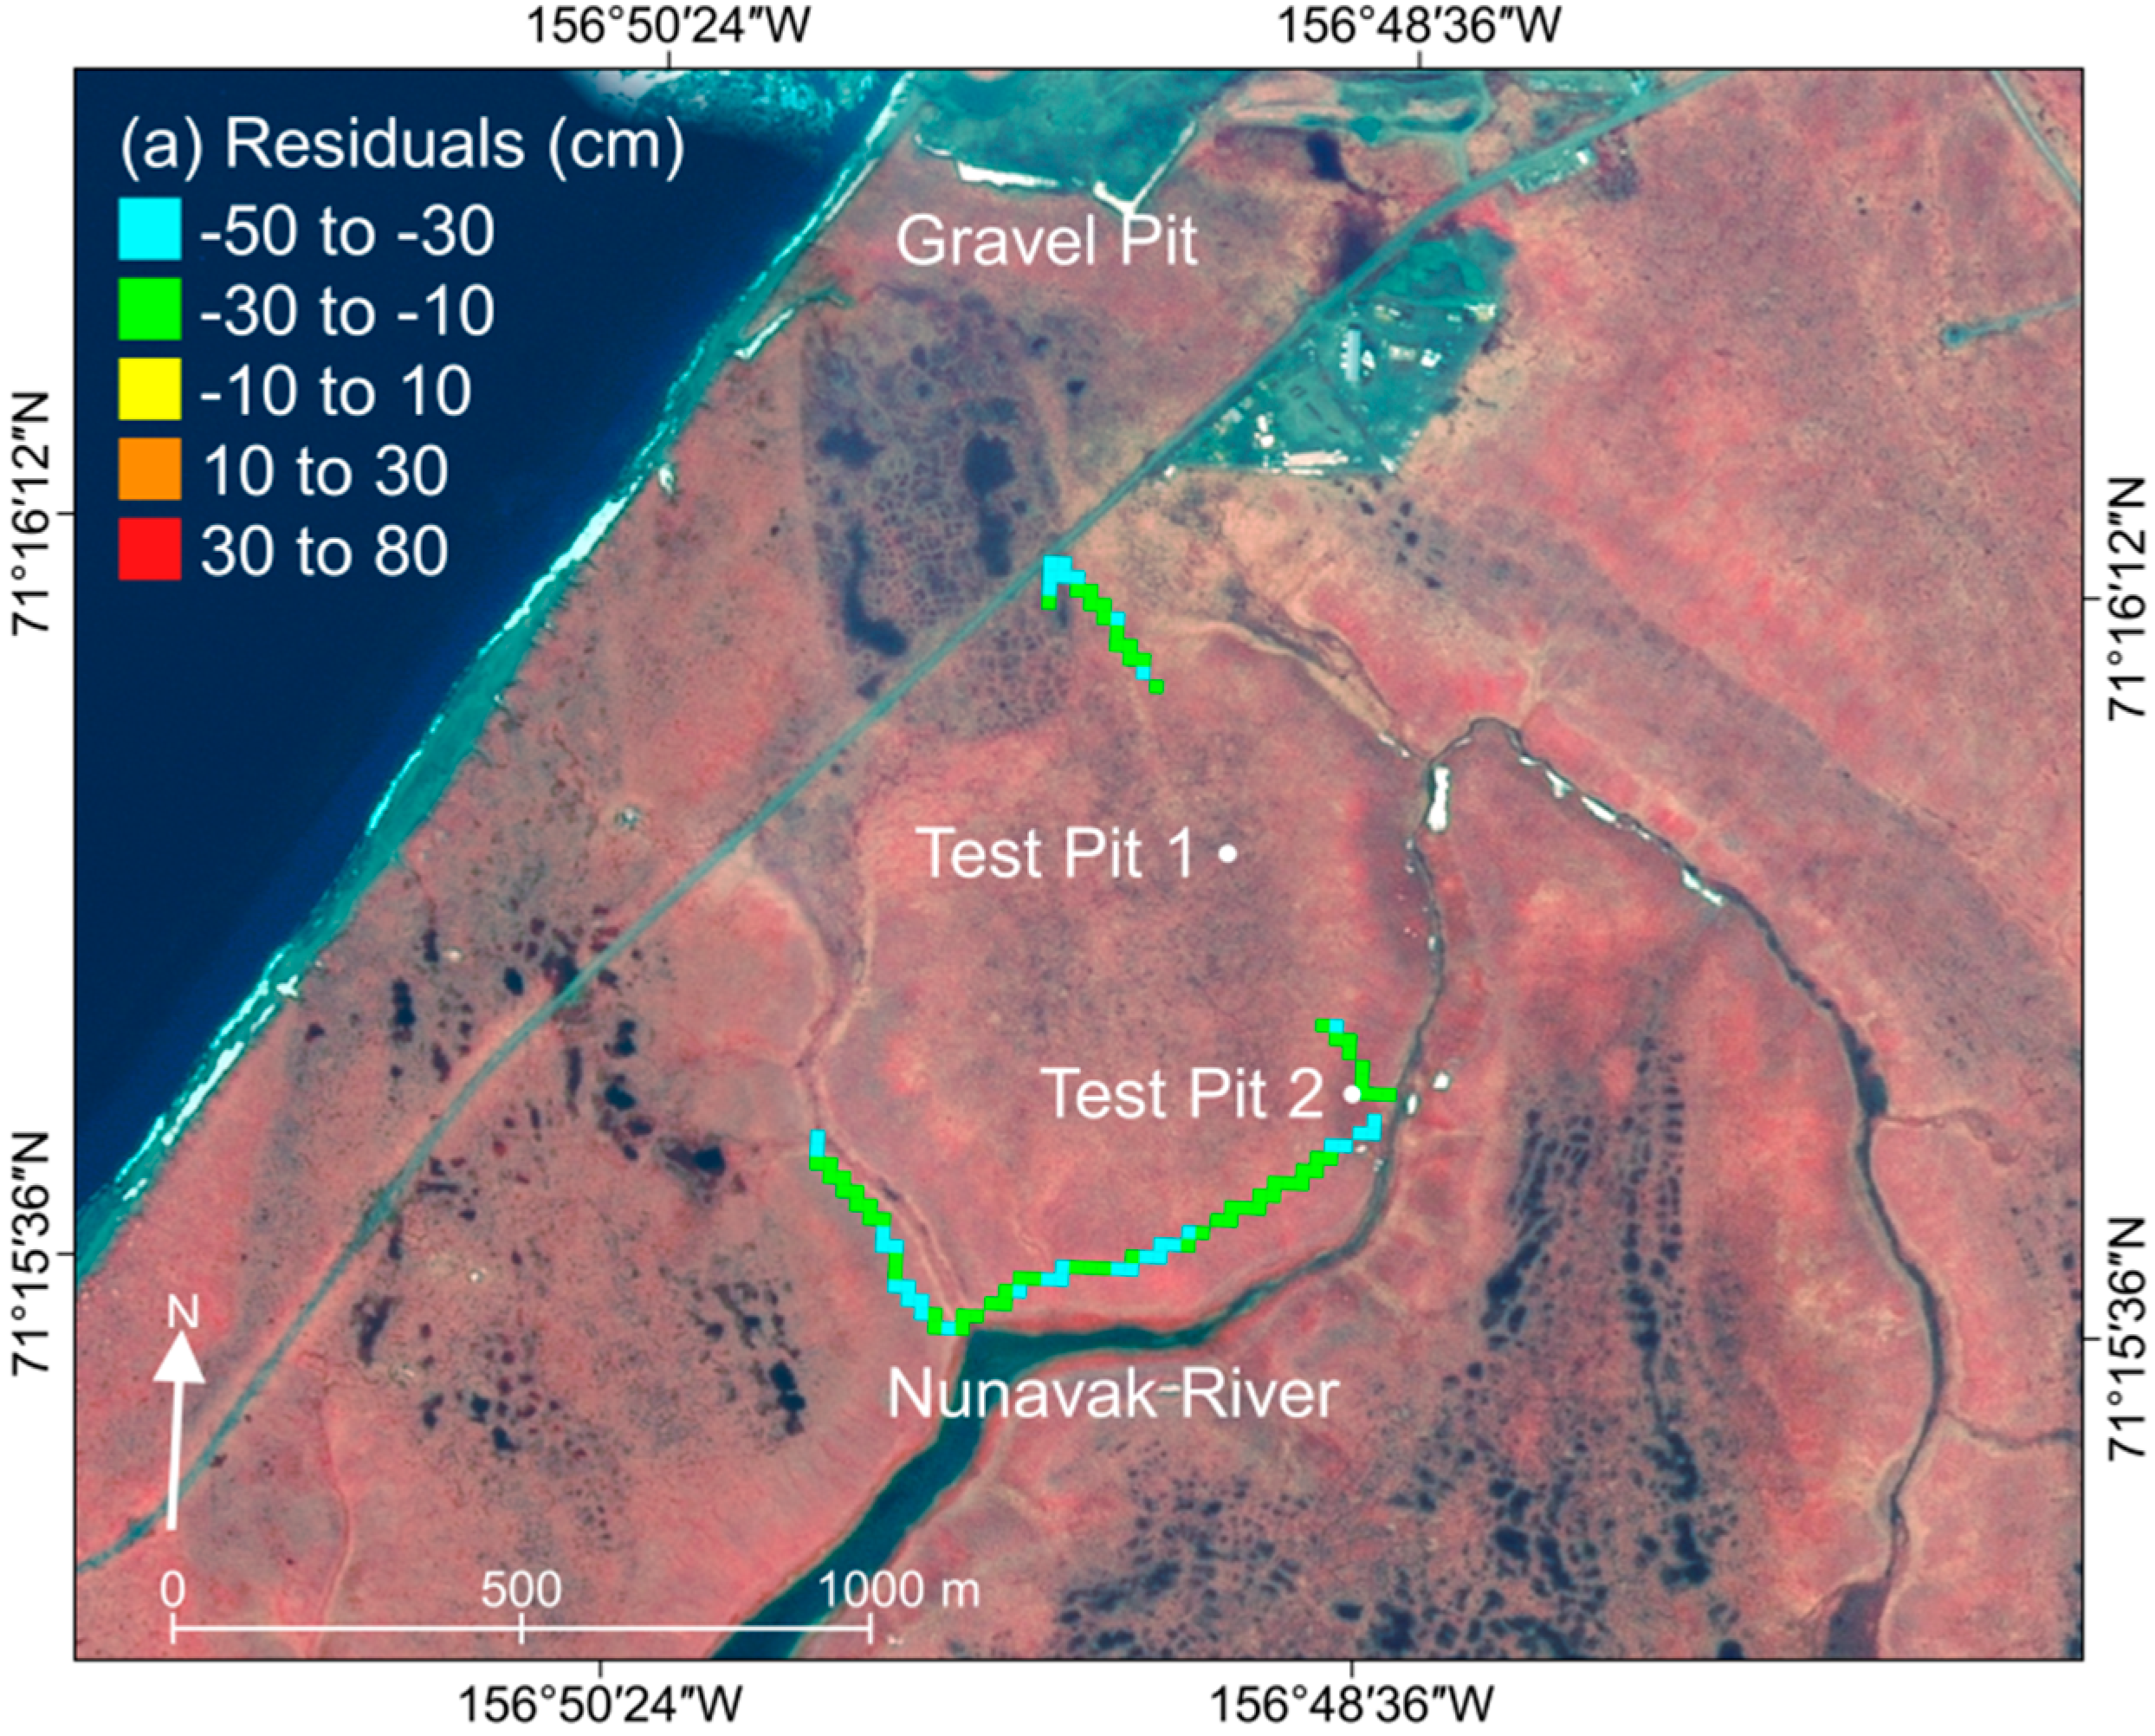
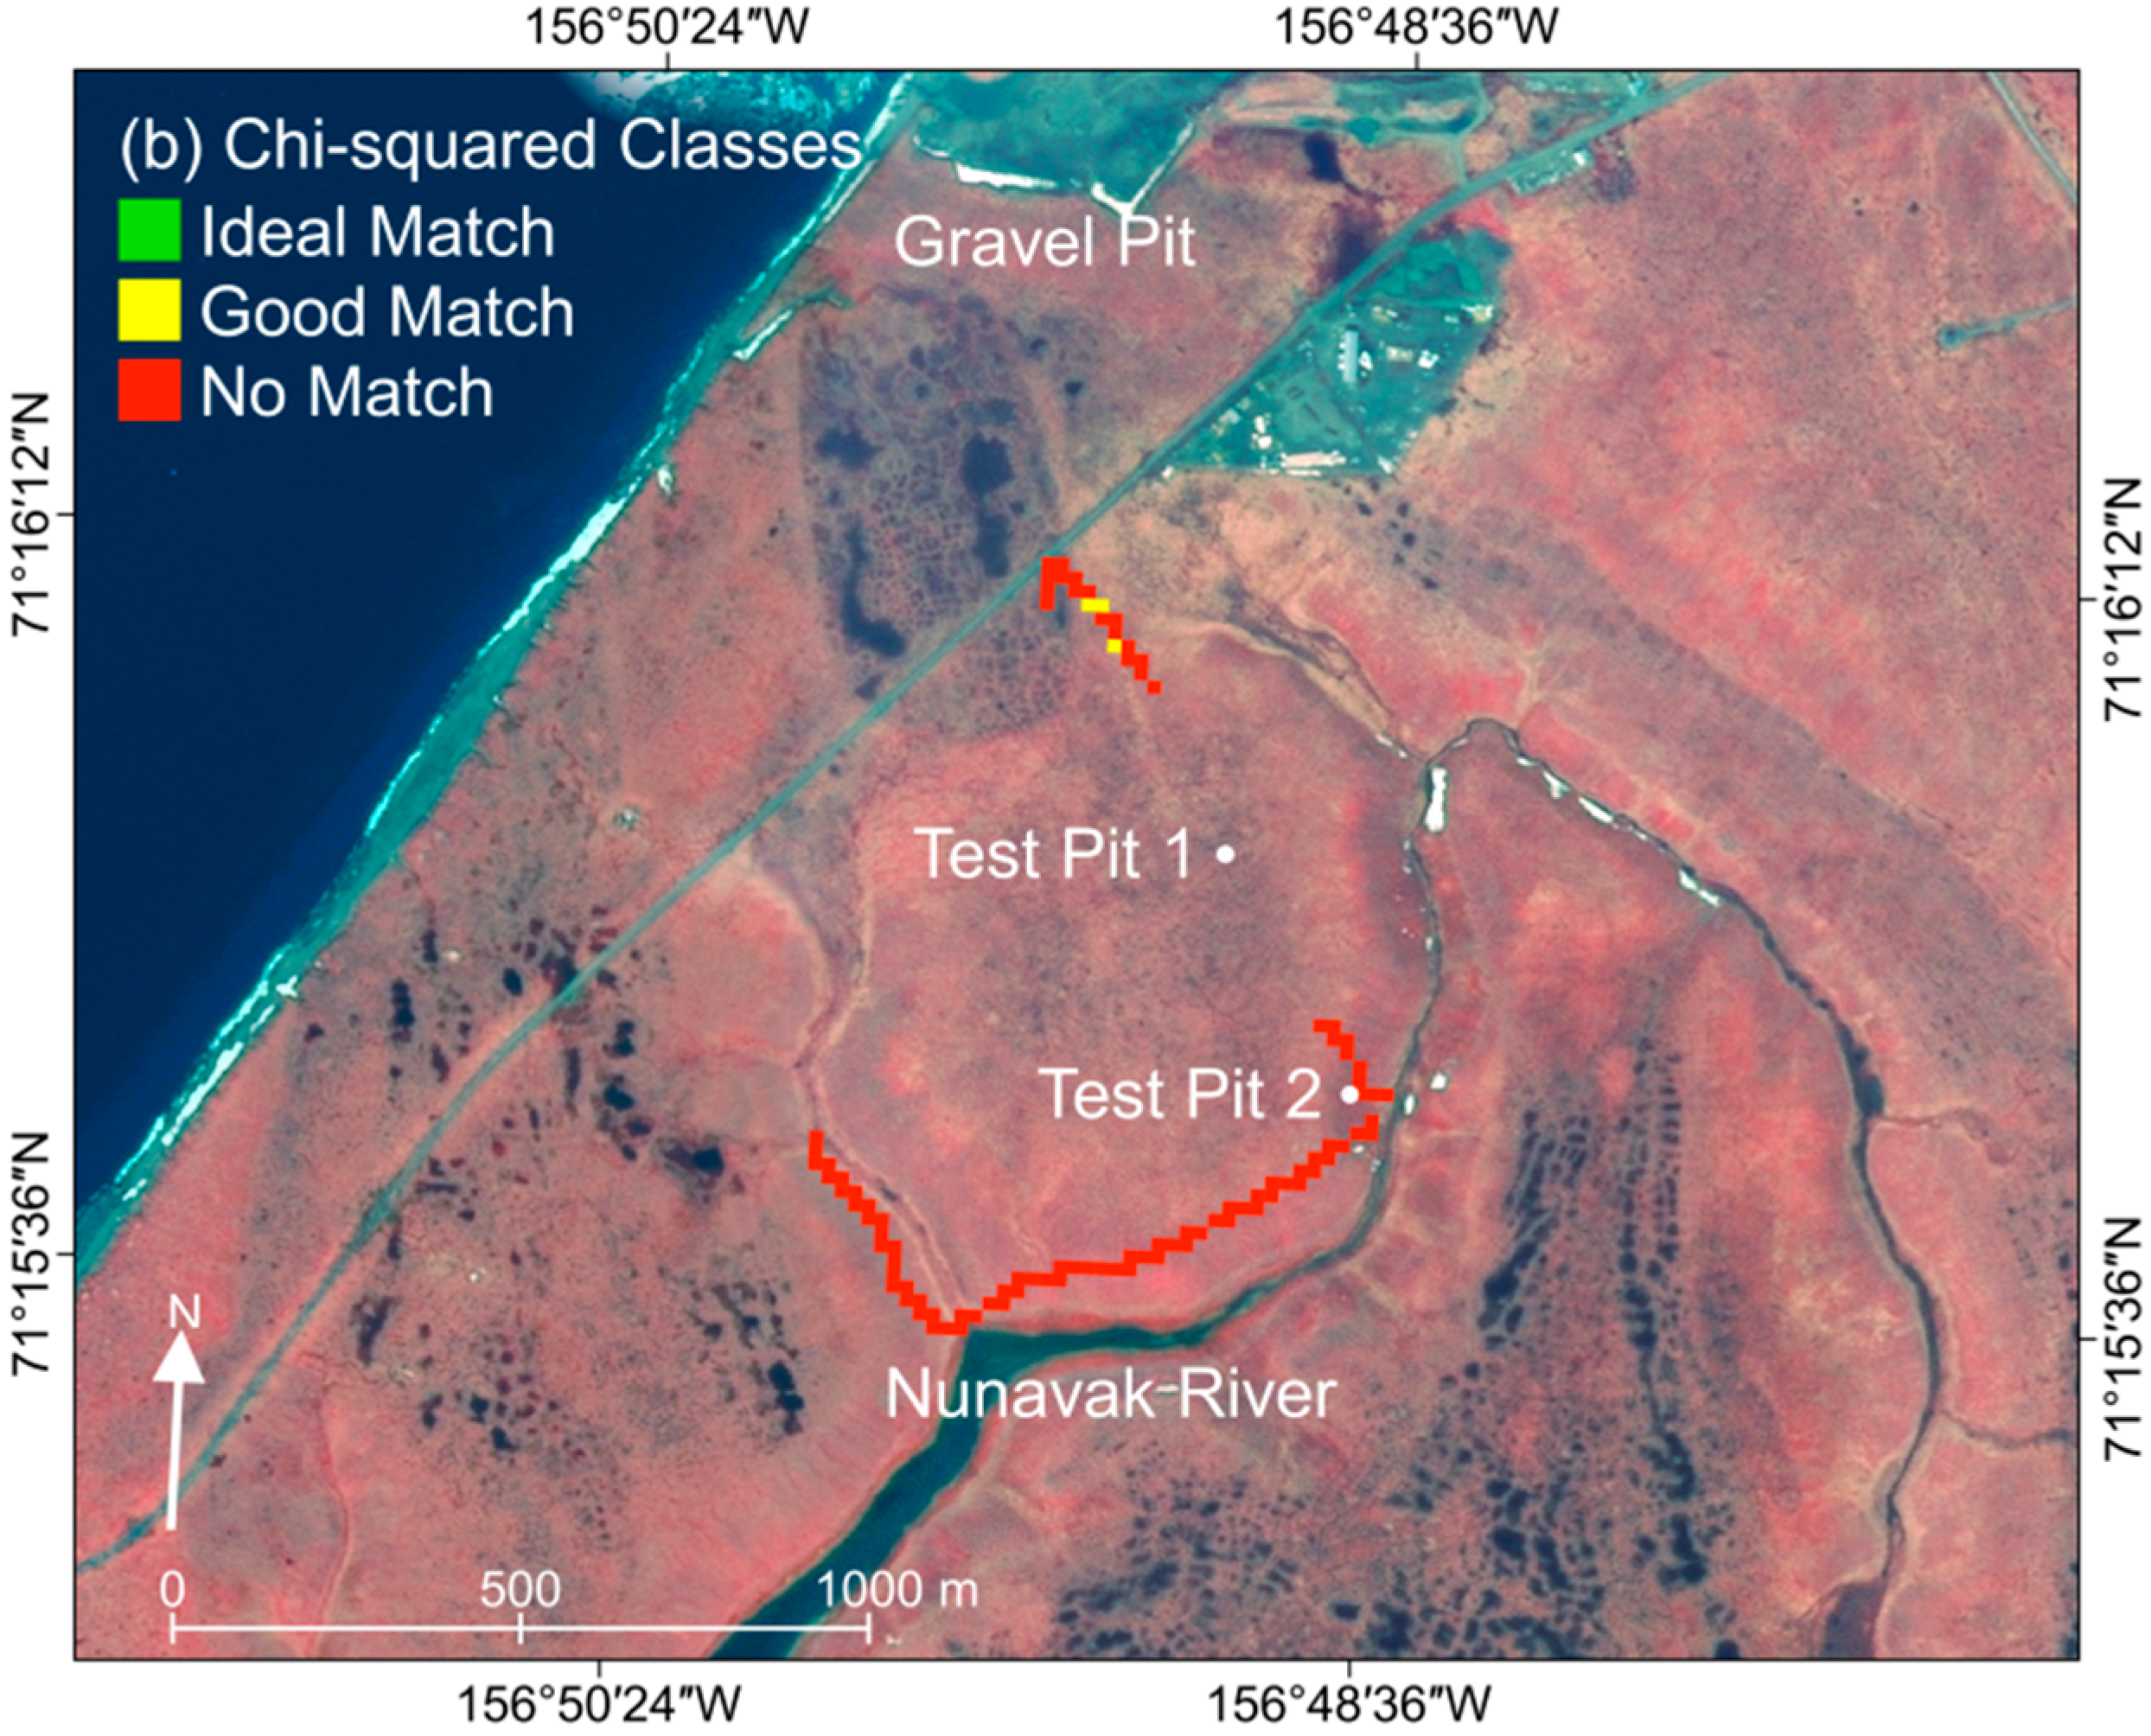
| Nunavak River | 71.263803 | −156.820302 | 10 August | Lowest ReSALT values; saturated and unsaturated soils |
2.2. CALM Data
2.3. Ground Penetrating Radar (GPR)
2.4. InSAR Techniques
2.5. ALT Comparison

| Site | Velocity (m/ns) | Velocity Uncertainty (m/ns) | VWC (−) | VWC Uncertainty (−) | Average ALT (cm) | RMSE (cm) | ALT Uncertainty (cm) |
|---|---|---|---|---|---|---|---|
| Big Spot | 0.036 | 0.005 | 0.75 | 0.10 | 37 ± 8 | 5 | 6.83 |
| Big Spot peat | 0.036 | 0.004 | 0.96 | 0.12 | |||
| Big Spot upland | 0.044 | 0.012 | 0.60 | 0.16 | |||
| CALM | 0.042 | 0.009 | 0.62 | 0.12 | 40 ± 8 | 7 | 8.40 |
| CALM peat | 0.035 | 0.009 | 0.97 | 0.24 | |||
| CALM upland | 0.047 | 0.014 | 0.56 | 0.16 | |||
| Central Plain | 0.041 | 0.007 | 0.64 | 0.10 | 35 ± 6 | 6 | 7.59 |
| Nunavak River | 0.038 | 0.010 | 0.70 | 0.18 | 32 ± 6 | 6 | 7.59 |
3. Results
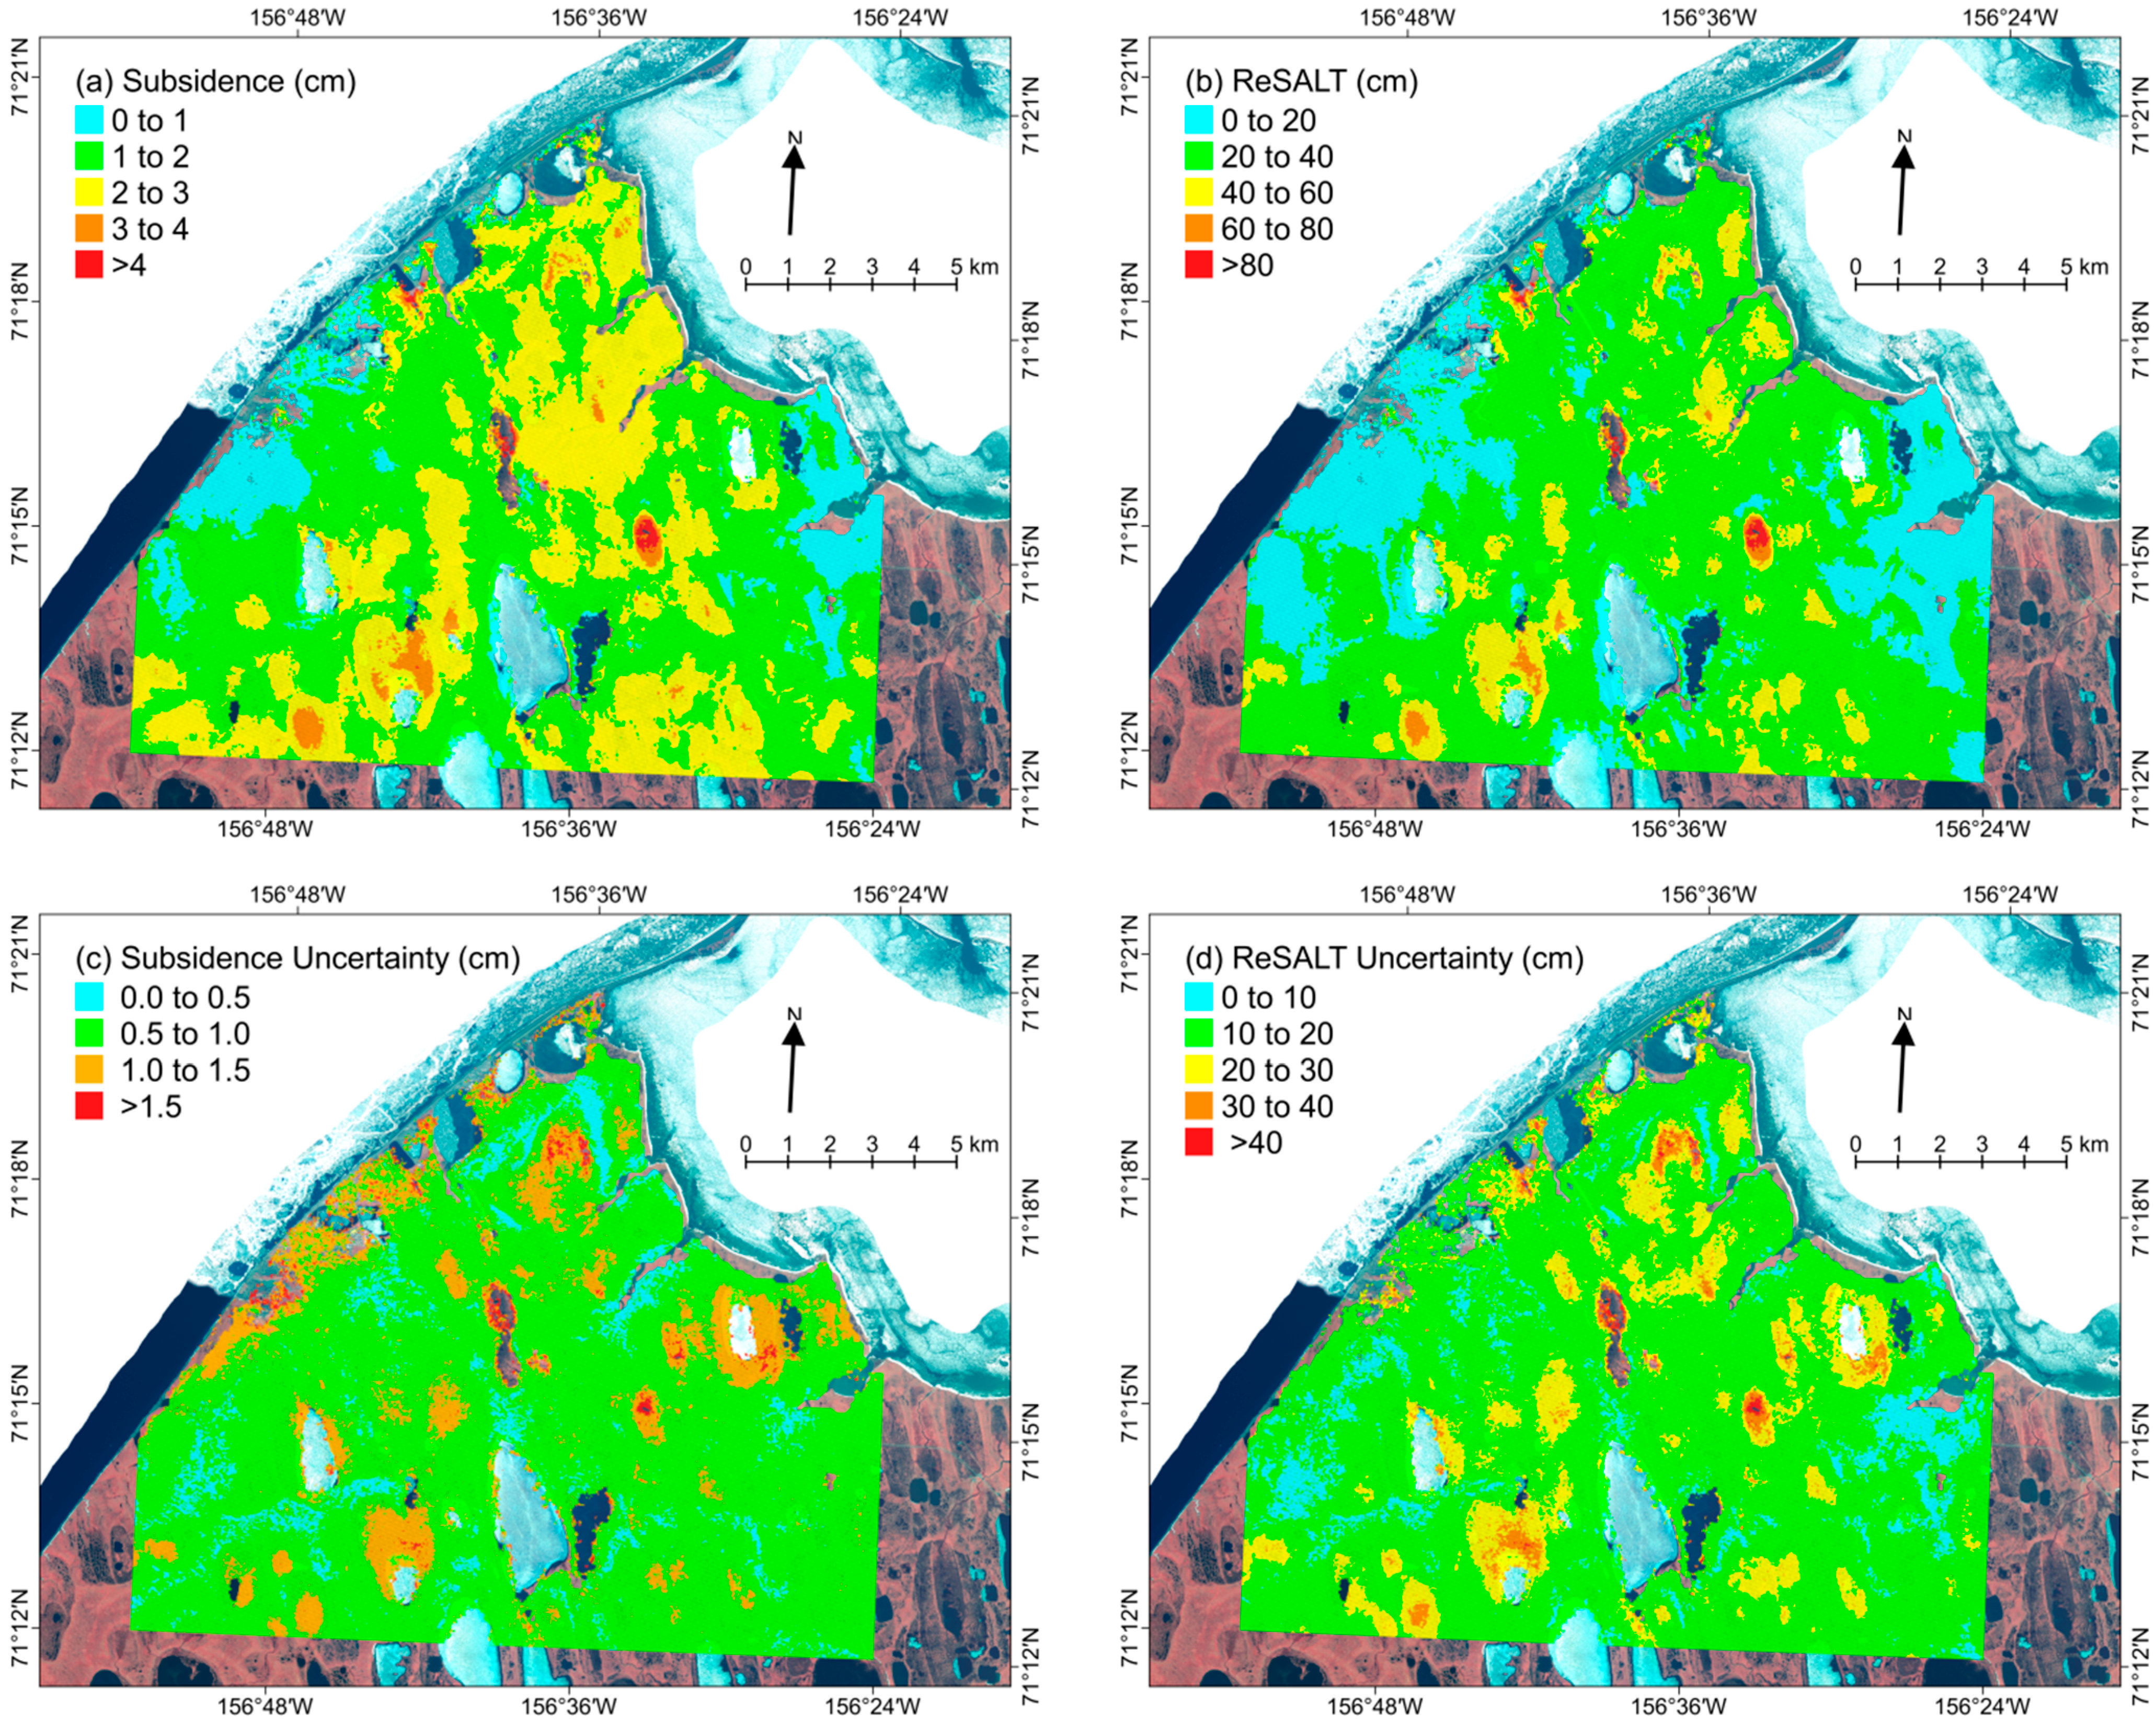
3.1. ReSALT

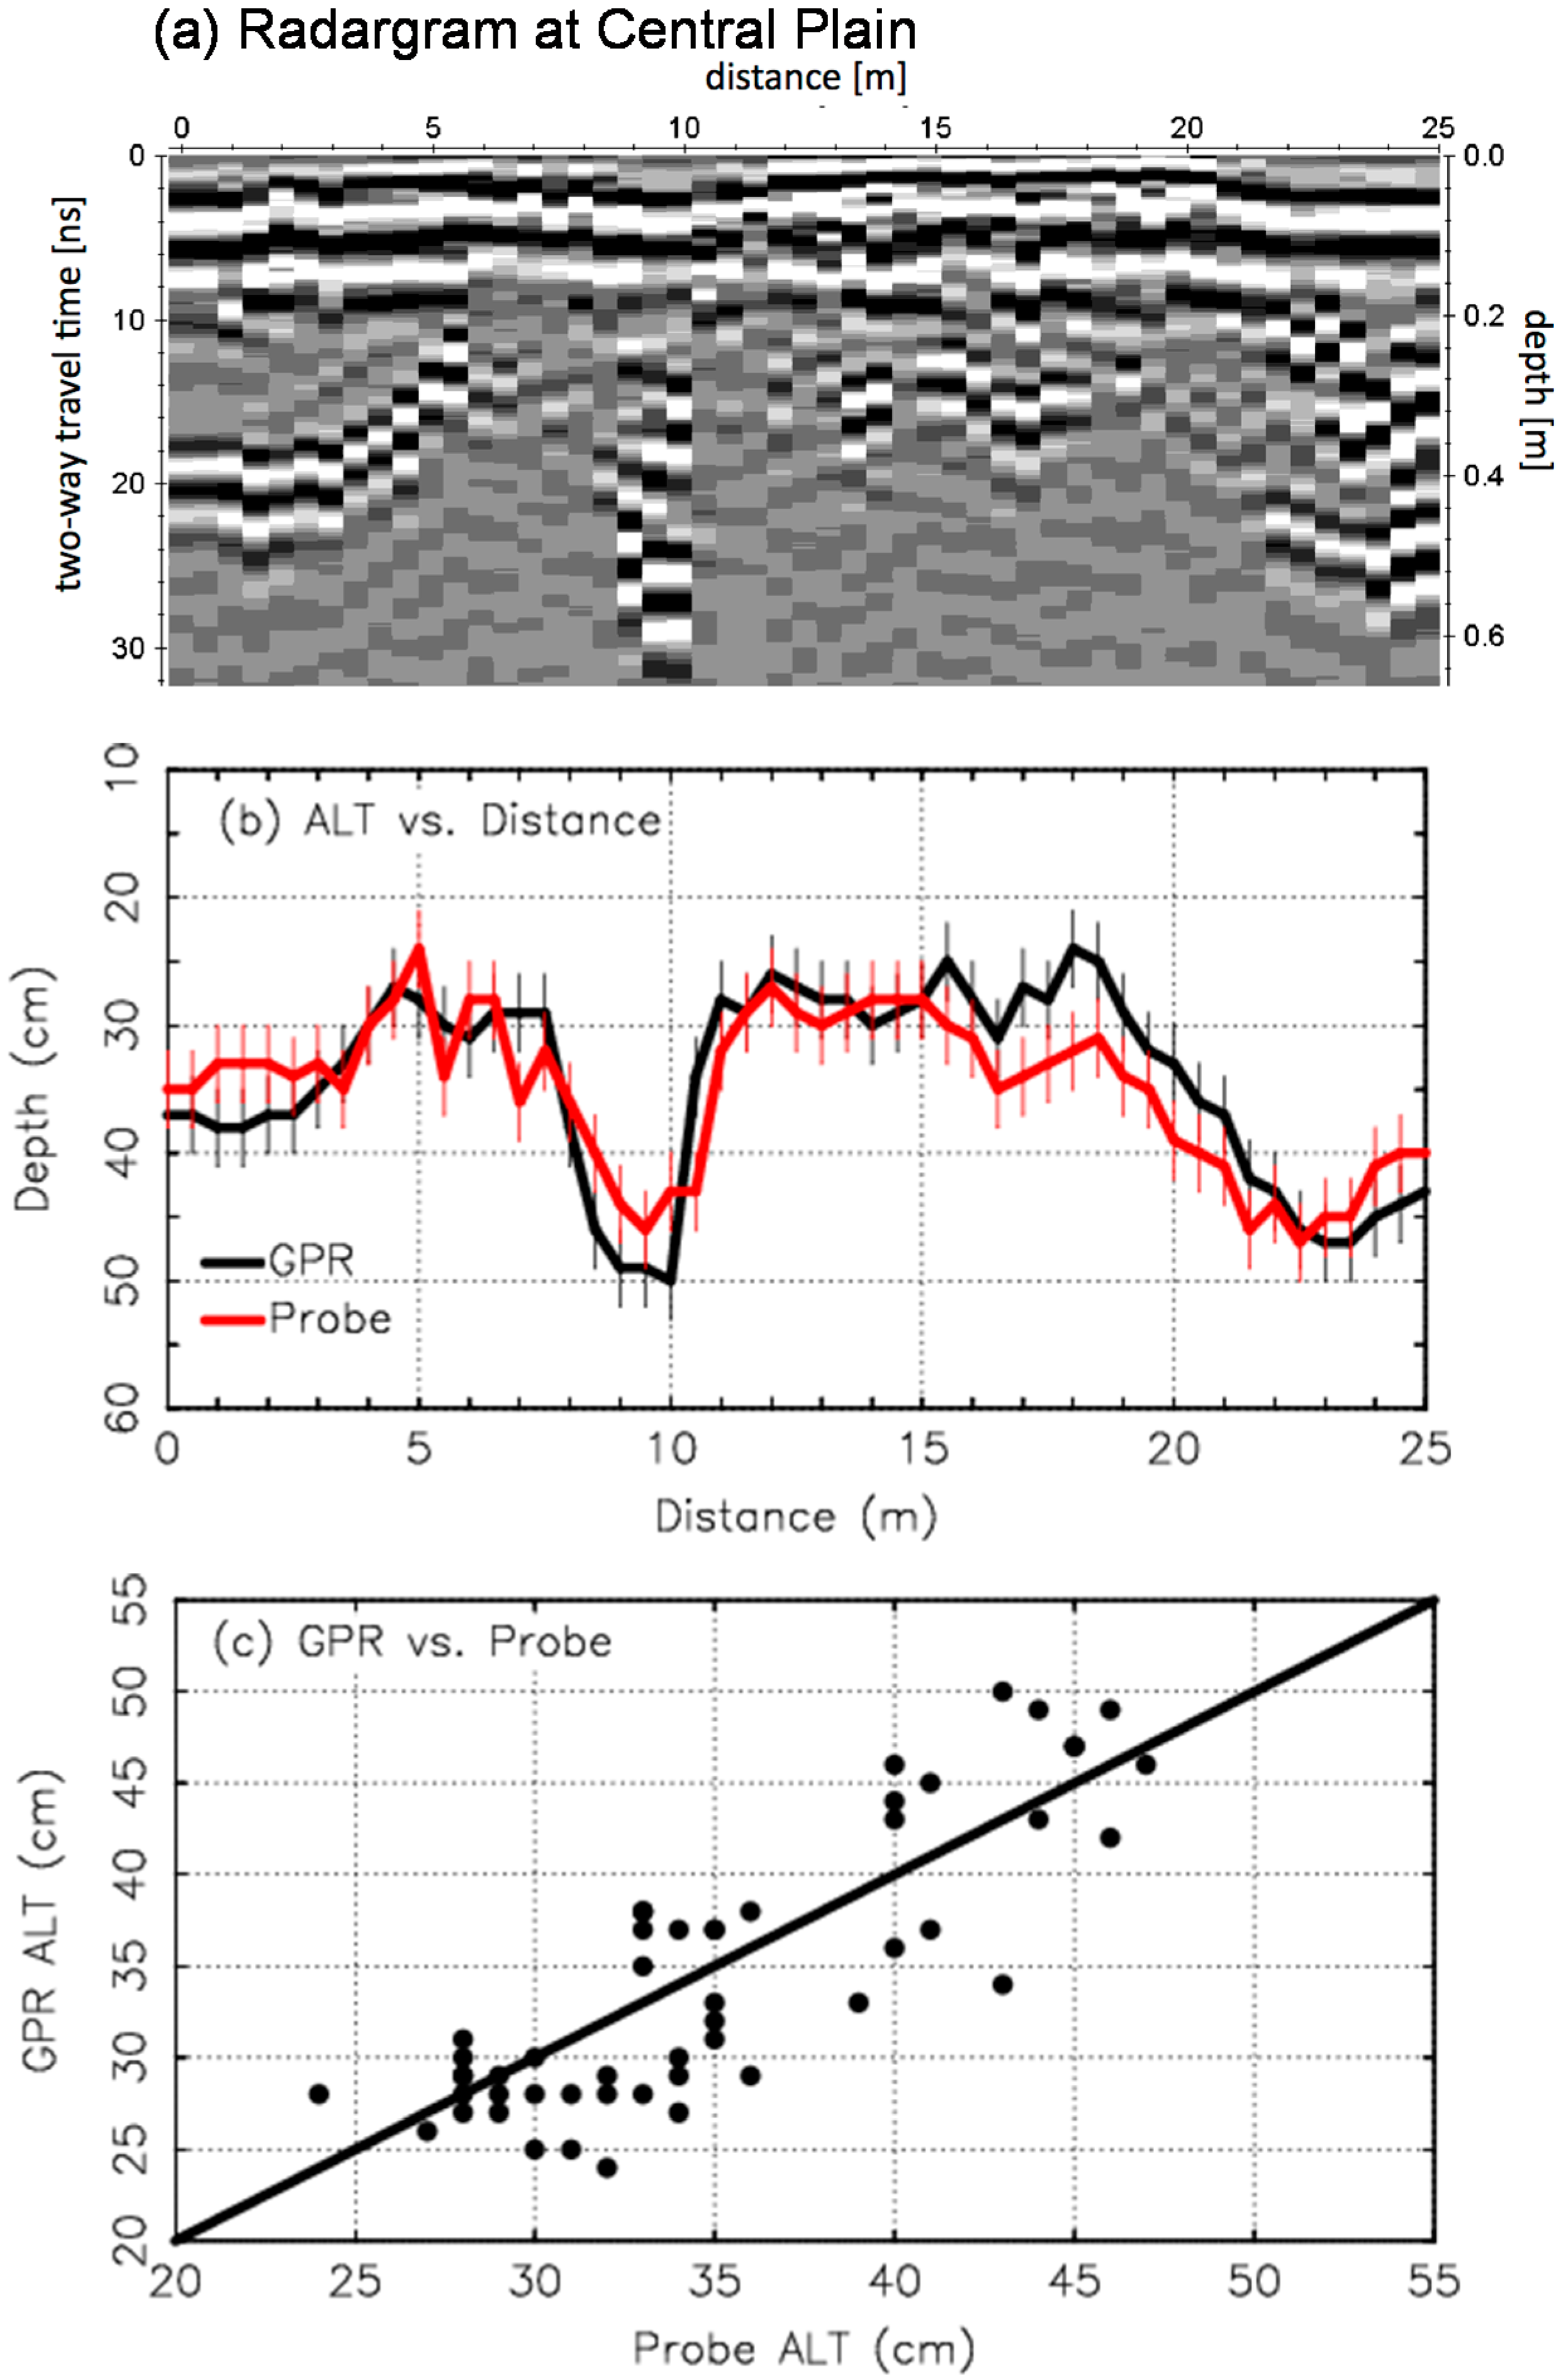
3.2. GPR Results

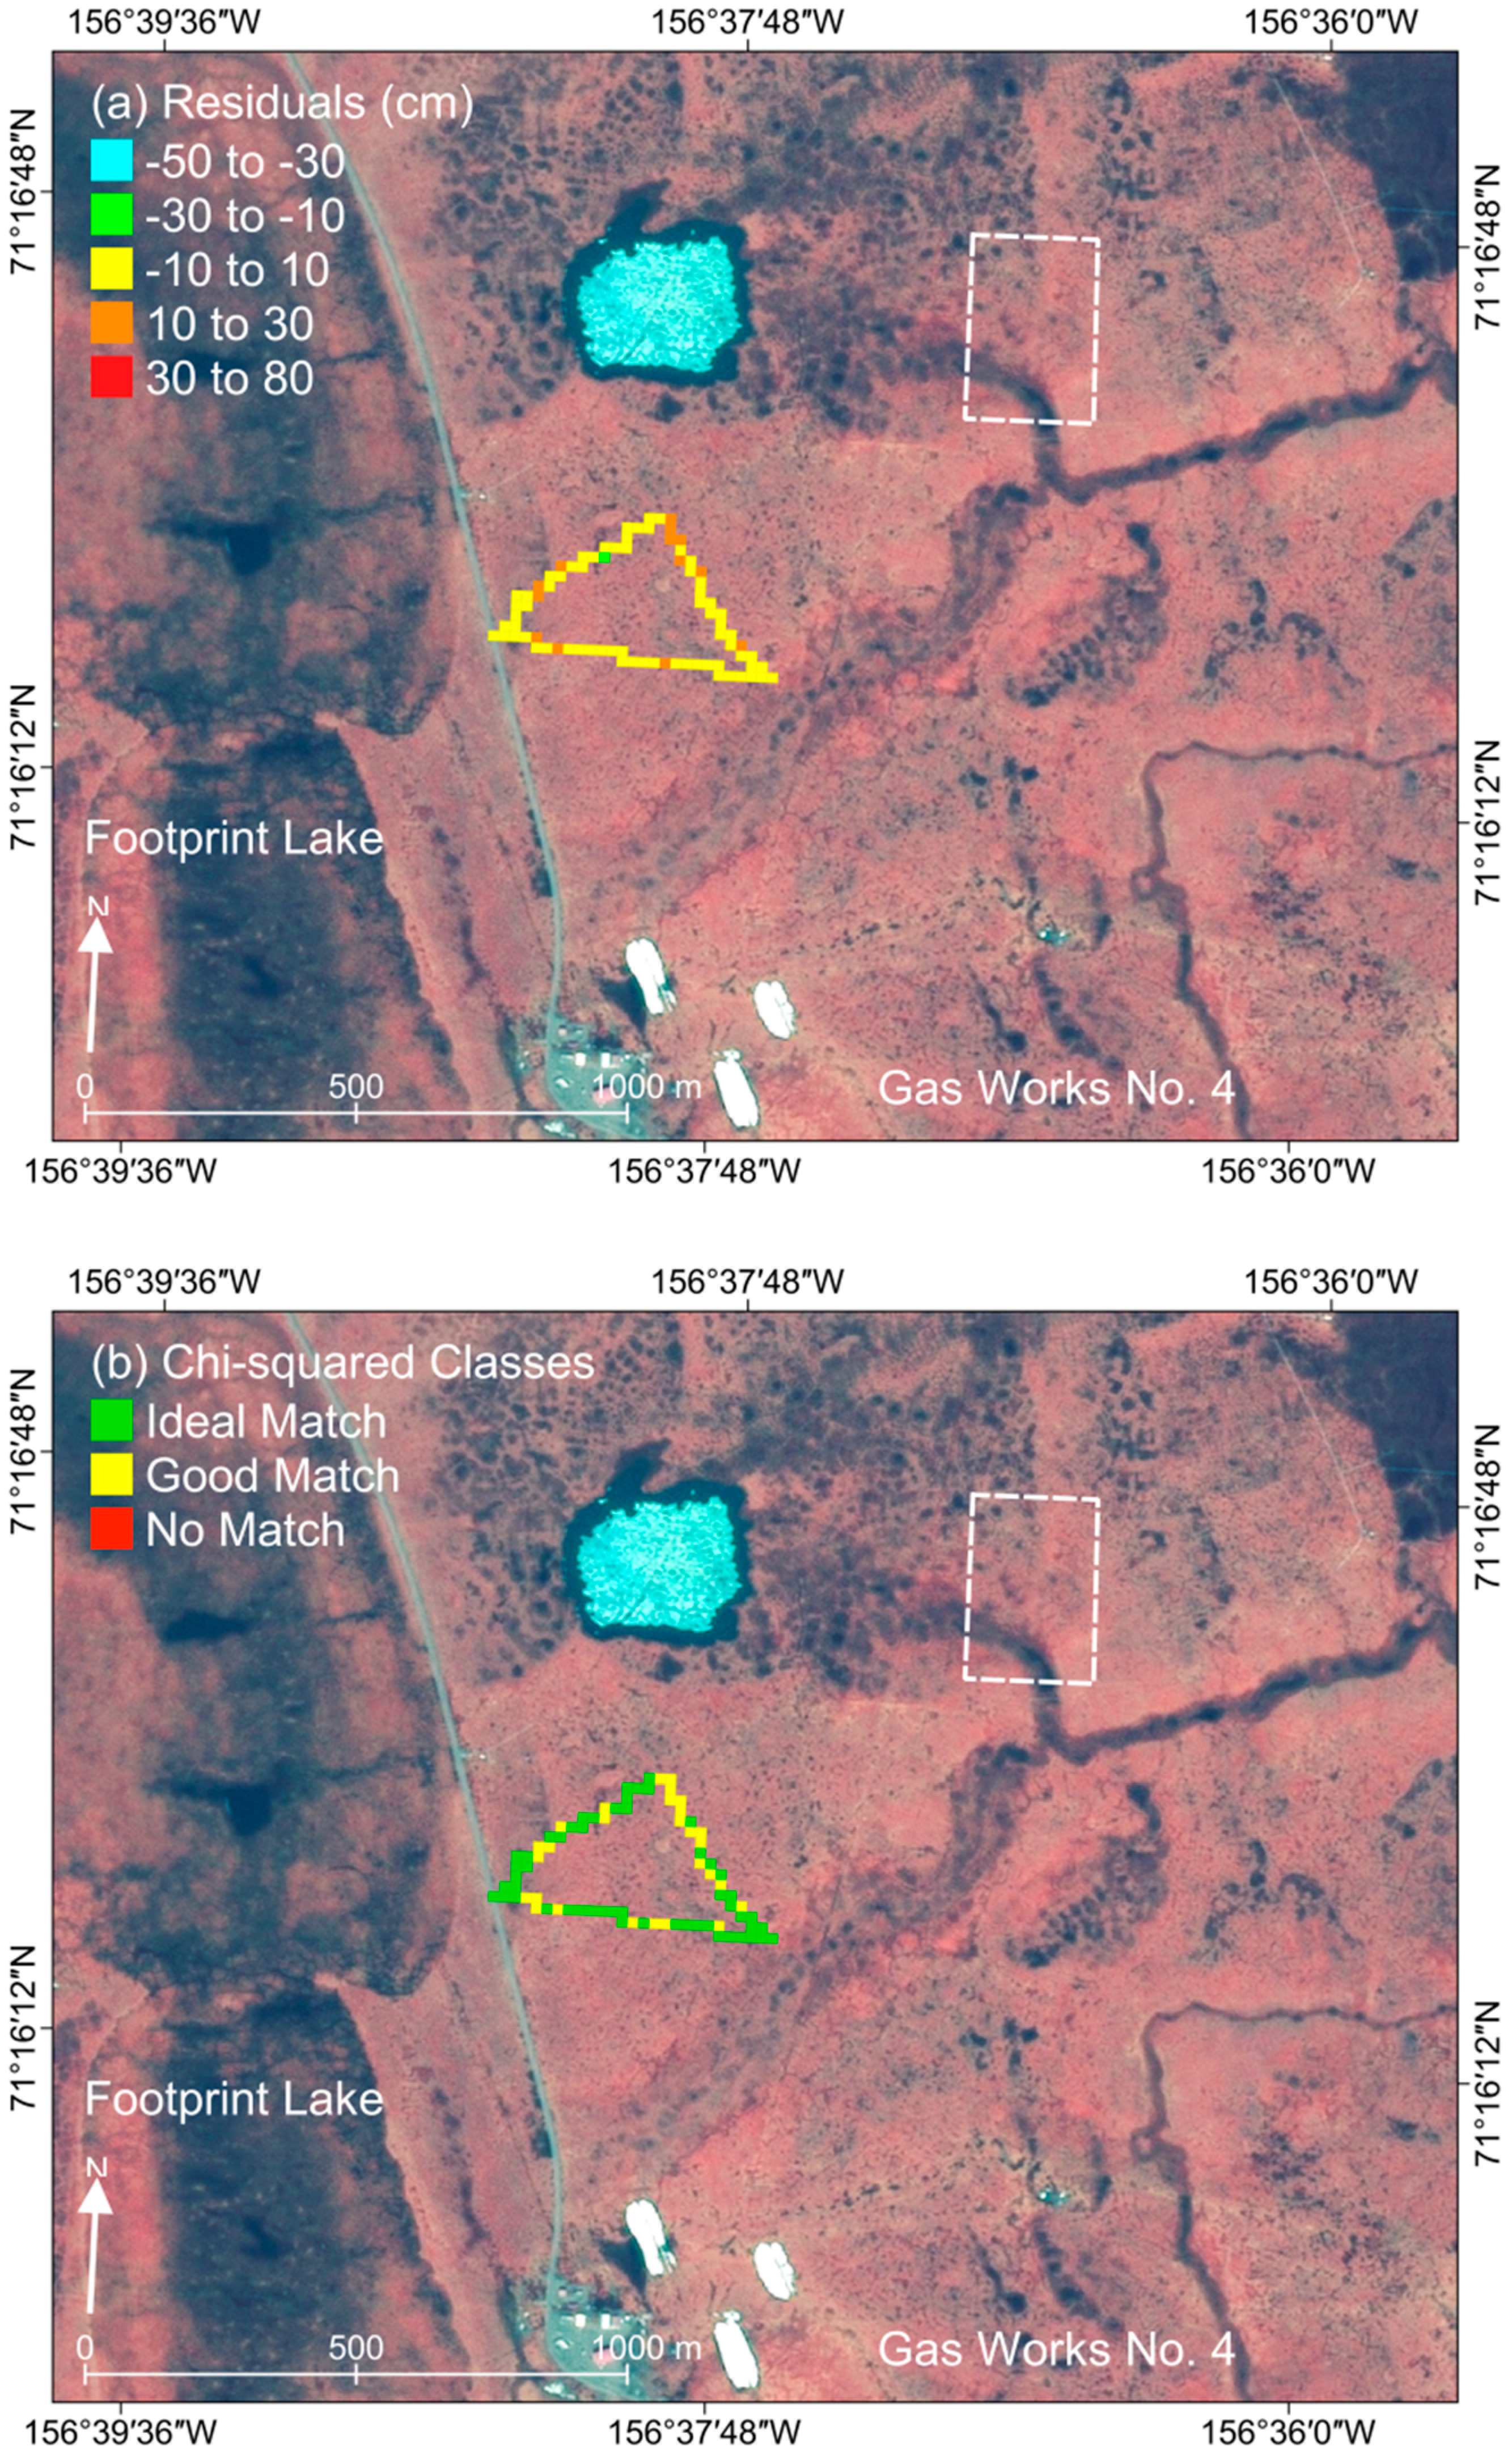
3.3. ReSALT Validation
| Statistic | All | Big Spot | CALM GPR | CALM Probe | Central Plain | Nunavak River |
|---|---|---|---|---|---|---|
| ReSALT ALT (cm) | 36 ± 19 | 48 ± 23 | 33 ± 10 | 37 ± 8 | 39 ± 2 | 4 ± 2 |
| Observed ALT (cm) 1 | 38 ± 8 | 37 ± 8 | 40 ± 8 | 36 ± 8 | 35 ± 6 | 32 ± 6 |
| Bias (cm) | −1.7 | 10.3 | −6.5 | 0.8 | 4.0 | −28.5 |
| Number Grid Cells | 1373 | 441 | 637 | 115 | 81 | 99 |
| χ2 (−) | 6.2 | 11.5 | 1.9 | 2.5 | 0.9 | 14.7 |
| Ideal Match (%) | 45 | 32 | 56 | 62 | 65 | 0 |
| Good Match (%) | 29 | 47 | 21 | 26 | 35 | 3 |
| No Match (%) | 26 | 21 | 23 | 12 | 0 | 97 |


4. Discussion

4.1. Soil Water Content
4.2. InSAR Data Artifacts
4.3. Gravel Effects
4.4. Overestimation of ALT in DTLBs
5. Conclusions
Acknowledgments
Author Contributions
Conflicts of Interest
Appendix A
| # | Scene 1 Date * | Scene 2 Date * | Scene 1 Granule | Scene 2 Granule |
|---|---|---|---|---|
| 1 | 20060618 | 20060803 | ALPSRP021272170 | ALPSRP027982170 |
| 2 | 20060618 | 20080623 | ALPSRP021272170 | ALPSRP128632170 |
| 3 | 20060618 | 20090626 | ALPSRP021272170 | ALPSRP182312170 |
| 4 | 20060618 | 20090811 | ALPSRP021272170 | ALPSRP189022170 |
| 5 | 20060803 | 20090626 | ALPSRP027982170 | ALPSRP182312170 |
| 6 | 20070621 | 20070806 | ALPSRP074952170 | ALPSRP081662170 |
| 7 | 20070621 | 20080623 | ALPSRP074952170 | ALPSRP128632170 |
| 8 | 20070621 | 20090626 | ALPSRP074952170 | ALPSRP182312170 |
| 9 | 20070621 | 20090811 | ALPSRP074952170 | ALPSRP128632170 |
| 10 | 20070621 | 20100629 | ALPSRP074952170 | ALPSRP235992170 |
| 11 | 20070806 | 20080623 | ALPSRP081662170 | ALPSRP128632170 |
| 12 | 20070806 | 20090626 | ALPSRP081662170 | ALPSRP182312170 |
| 13 | 20070806 | 20090811 | ALPSRP081662170 | ALPSRP128632170 |
| 14 | 20070806 | 20100629 | ALPSRP081662170 | ALPSRP189022170 |
| 15 | 20070806 | 20100814 | ALPSRP081662170 | ALPSRP242702170 |
| 16 | 20080623 | 20090626 | ALPSRP128632170 | ALPSRP182312170 |
| 17 | 20080623 | 20090811 | ALPSRP128632170 | ALPSRP189022170 |
| 18 | 20090626 | 20090811 | ALPSRP182312170 | ALPSRP189022170 |
| 19 | 20090811 | 20100629 | ALPSRP189022170 | ALPSRP235992170 |
| 20 | 20100629 | 20100814 | ALPSRP235992170 | ALPSRP242702170 |
References
- Christiansen, H.H.; Etzelmüller, B.; Isaksen, K.; Juliussen, H.; Farbrot, H.; Humlum, O.; Johansson, M.; Ingeman-Nielsen, T.; Kristensen, L.; Hjort, J.; et al. The thermal state of permafrost in the nordic area during the international polar year 2007–2009. Perm. Periglac. Proc. 2010, 21, 156–181. [Google Scholar] [CrossRef]
- Romanovsky, V.E.; Drozdov, D.S.; Oberman, N.G.; Malkova, G.V.; Kholodov, A.L.; Marchenko, S.S.; Moskalenko, N.G.; Sergeev, D.O.; Ukraintseva, N.G.; Abramov, A.A.; et al. Thermal state of permafrost in Russia. Perm. Periglac. Proc. 2010, 21, 136–155. [Google Scholar] [CrossRef]
- Smith, S.L.; Romanovsky, V.E.; Lewkowicz, A.G.; Burn, C.R.; Allard, M.; Clow, G.D.; Yoshikawa, K.; Throop, J. Thermal state of permafrost in North America–A contribution to the international polar year. Perm. Periglac. Proc. 2010, 21, 117–135. [Google Scholar] [CrossRef]
- Osterkamp, T.E. Thermal state of permafrost in Alaska during the fourth quarter of the twentieth century (plenary paper). In Proceedings of the Ninth International Conference on Permafrost, Fairbanks, AK, USA, 29 June–3 July 2008; Vol. 2, pp. 1333–1338.
- Romanovsky, V.E.; Smith, S.L.; Christiansen, H.H. Permafrost thermal state in the polar Northern Hemisphere during the international polar year 2007–2009: A synthesis. Perm. Periglac. Proc. 2010, 21, 106–116. [Google Scholar] [CrossRef]
- Van Everdinger, R. Multi-Language Glossary of Permafrost and Related Ground-Ice Terms (Revised 2005); National Snow and Ice Data Center/World Data Center for Glaciology: Boulder, CO, USA, 1998. [Google Scholar]
- Shiklomanov, N.I.; Streletskiy, D.A.; Nelson, F.E.; Hollister, R.D.; Romanovsky, V.E.; Tweedie, C.E.; Bockheim, J.G.; Brown, J. Decadal variations of active-layer thickness in moisture-controlled landscapes, Barrow, Alaska. J. Geophys. Res. 2010, 115, G00I04. [Google Scholar]
- Voigt, T.; Füssel, H.M.; Gärtner-Roer, I.; Huggel, C.; Marty, C.; Zemp, M. Impacts of Climate Change on Snow, Ice, and Permafrost in Europe: Observed Trends, Future Projections, and Socio-Economic Relevance; Technical Paper 2010/13; European Topic Centre on Air and Climate Change: Bilthoven, The Netherlands, 2010. [Google Scholar]
- Romanovsky, V.E.; Smith, S.L.; Christiansen, H.H.; Shiklomanov, N.I.; Drozdov, D.S.; Oberman, N.G.; Kholodov, A.L.; Marchenko, S.S. Permafrost. Arctic Report Card 2011; 2011. Available online: http://www.arctic.noaa.gov/reportcard (accessed on 1 February 2014). [Google Scholar]
- Burgess, M.M.; Smith, S.L.; Brown, J.; Romanovsky, V.; Hinkel, K. The Global Terrestrial Network for Permafrost (GTNet-P): Permafrost Monitoring Contributing to Global Climate Observations. Available online: http://ftp2.cits.rncan.gc.ca/pub/geott/ess_pubs/211/211621/cr_2000_e14.pdf (accessed on 23 March 2015).
- Brown, J.; Hinkel, K.M.; Nelson, F.E. The circumpolar active layer monitoring (CALM) program: Research designs and initial results. Polar Geog. 2000, 24, 165–258. [Google Scholar] [CrossRef]
- Streletskiy, D.A.; Shiklomanov, N.I.; Nelson, F.E.; Klene, A.E. 13 years of observations at Alaskan CALM sites: Long-term active layer and ground surface temperature trends. In Proceedings of the Ninth International Conference on Permafrost, Fairbanks, AK, USA, 29 June–3 July 2008; Vol. 2, pp. 1727–1732.
- Gangodagamage, C.; Rowland, J.C.; Hubbard, S.S.; Brumby, S.P.; Liljedahl, A.K.; Wainwright, H.; Wilson, C.J.; Altmann, G.L.; Dafflon, B.; Peterson, J.; et al. Extrapolating active layer thickness measurements across Arctic polygonal terrain using LiDAR and NDVI data sets. Water Resour. Res. 2014. [Google Scholar] [CrossRef]
- Nelson, F.E.; Shiklomanov, N.I.; Mueller, G.R.; Hinkel, K.M.; Walker, D.A.; Bockheim, J.G. Estimating active-layer thickness over a large region: Kuparuk River basin, Alaska, USA. Arct. Alp. Res. 1997, 29, 367–378. [Google Scholar] [CrossRef]
- Pastick, N.J.; Jorgenson, M.T.; Wylie, B.K.; Minsley, B.J.; Ji, L.; Walvoord, M.A.; Smith, B.D.; Abraham, J.D.; Rose, J.R. Extending airborne electromagnetic surveys for regional active layer and permafrost mapping with remote sensing and ancillary data, Yukon Flats Ecoregion, Central Alaska. Perm. Periglac. Proc. 2013, 24, 184–199. [Google Scholar] [CrossRef]
- Wang, Z.; Li, S. Detection of winter frost heaving of the active layer of Arctic permafrost using SAR differential interferograms. In Proceedings of the IGARSS’99: Remote Sensing of the System Earth: A Challenge for the 21st Century, Hamburg, Germany, 28 June–2 July 1999; pp. 1946–1948.
- Singhroy, V.; Couture, R.; Alasset, P.J.; Poncos, V. InSAR monitoring of landslides on permafrost terrain in Canada. In Proceedings of the IEEE 2007 International Geoscience and Remote Sensing Symposium, Barcelona, Spain, 23–28 July 2007; pp. 2451–2454.
- Rykhus, R.P.; Lu, Z. InSAR detects possible thaw settlement in the Alaskan Arctic coastal plain. Can. J. Remote Sens. 2008, 34, 100–112. [Google Scholar] [CrossRef]
- Liu, L.; Zhang, T.; Wahr, J. InSAR measurements of surface deformation over permafrost on the North Slope of Alaska. J. Geophys. Res. 2010, 115, F03023. [Google Scholar]
- Short, N.; Brisco, B.; Couture, N.; Pollard, W.; Murnaghna, K.; Budkewitsch, P. A comparison of TerraSAR-X, RADARSAT-2 and ALOS-PALSAR interferometry for monitoring permafrost environments, case study from Herschel Island, Canada. Remote Sens. Environ. 2011, 115, 3491–3506. [Google Scholar] [CrossRef]
- Liu, L.; Schaefer, K.; Zhang, T.; Wahr, J. Estimating 1992–2000 average active layer thickness on the Alaskan North Slope from remotely sensed surface subsidence. J. Geophys. Res. 2012. [Google Scholar] [CrossRef]
- Hinkel, K.M.; Nelson, F.E. Spatial and temporal patterns of active layer thickness at Circumpolar Active Layer Monitoring (CALM) sites in northern Alaska, 1995–2000. J. Geophys. Res. 2003. [Google Scholar] [CrossRef]
- Doolittle, J.A.; Hardisky, M.A.; Gross, M.F. A ground-penetrating radar study of active layer thickness in areas of moist sedge and wet sedge tundra, near Bethel, Alaska, USA. Arct. Alp. Res. 1990, 22, 175–182. [Google Scholar] [CrossRef]
- Schwamborn, G.D.; Wagner, D.; Hubberten, H.W. The use of GPR to detect active layers in young periglacial terrain of Livingston Island, Maritime Antarctica. Near Surf. Geophys. 2008, 6, 331–336. [Google Scholar] [CrossRef]
- Wollschlager, U.; Gerhards, H.; Yu, Q.; Roth, K. Multi-channel ground-penetrating radar to explore spatial variations in thaw depth and moisture content in the active layer of a permafrost site. Cryosphere 2010, 4, 269–283. [Google Scholar] [CrossRef]
- Hubbard, S.S.; Gangodagamage, C.; Dafflon, B.; Wainwright, H.; Peterson, J.; Gusmeroli, A.; Ulrich, C.; Wu, Y.; Wilson, C.; Rowland, J.; et al. Quantifying and relating land-surface and subsurface variability in permafrost environments using LiDAR and surface geophysical datasets. Hydrogeo. J. 2012. [Google Scholar] [CrossRef]
- Gusmeroli, A.; Liu, L.; Schaefer, K.; Zhang, T.; Schafer, T.; Grosse, G. Active layer stratigraphy and organic layer thickness at a thermokarst site in Arctic Alaska identified using ground penetrating radar. Arct. Antarc. Alp. Res. 2015, in press. [Google Scholar]
- Engstrom, R.; Hope, A.; Kwon, H.; Stow, D.; Zamolodchikov, D. Spatial distribution of near surface soil moisture and its relationship to microtopography in the Alaskan Arctic coastal plain. Nordic Hydrol. 2005, 36, 219–234. [Google Scholar]
- Parsekian, A.D.; Slater, L.; Giménez, D. Application of ground-penetrating radar to measure near-saturation soil water content in peat soils. Water Resour. Res. 2012, 48, W02533. [Google Scholar] [CrossRef]
- Topp, G.C.; Davis, J.L.; Annan, A.P. Electromagnetic determination of soil-water content: Measurements in coaxial transmission lines. Water Resour. Res. 1980, 16, 574–582. [Google Scholar] [CrossRef]
- Lin, L.; Jafarov, E.E.; Schaefer, K.M.; Jones, B.M.; Zebker, H.A.; Williams, C.A.; Rogan, J.; Zhang, T. InSAR detects increase in surface subsidence caused by an Arctic tundra fire. Geophys. Res. Lett. 2014. [Google Scholar] [CrossRef]
- Zebker, H.A.; Hensley, S.; Shanker, P.; Wortham, C. Geodetically accurate InSAR data processor. IEEE Trans. Geosci. Remote Sens. 2010, 48, 4309–4321. [Google Scholar] [CrossRef]
- Zebker, H.A.; Villasenor, J. Decorrelation in interferometric radar echoes. IEEE Trans. Geosci. Remote Sens. 1992, 30, 950–959. [Google Scholar] [CrossRef]
- Meyer, F.J.; Nicoll, J.B.; Doulgeris, A.P. Correction and characterization of radio frequency interference signatures in L-band synthetic aperture radar data. IEEE Trans. Geosci. Remote Sens. 2013, 51, 4961–4972. [Google Scholar] [CrossRef]
- Liu, L.; Schaefer, K.; Chen, A.; Gusmeroli, A.; Jafarov, E.; Panda, S.; Parsekian, A.; Schaefer, T.; Zebker, H.A.; Zhang, T. Pre-ABoVE: Remotely Sensed Active Layer Thickness (ReSALT) Barrow, Alaska, 2006–2011. Available online: http://dx.doi.org/10.3334/ORNLDAAC/1266 (accessed on 11 February 2015).
- Zhang, T.; Osterkamp, T.E.; Stamnes, K. Effects of climate on the active layer and permafrost on the north slope of Alaska, USA. Perm. Periglac. Proc. 1997, 8, 45–67. [Google Scholar] [CrossRef]
- Dagesse, D.F. Freezing-induced bulk soil volume changes. Can. J. Soil Sci. 2010, 90, 389–401. [Google Scholar] [CrossRef]
- Carlin, P.A.; Reader, N.A. Structure, composition, and bulk properties of upland stream gravels. Earth Surf. Proc. Landforms 1982, 7, 349–365. [Google Scholar] [CrossRef]
- Frings, R.M.; Schüttrumpf, H.; Vollmer, S. Verification of porosity predictors for fluvial sand-gravel deposits. Water Resour. Res. 2011, 47, W07525. [Google Scholar] [CrossRef]
- Haynes, H.; Ockelford, A.M.; Vignaga, E.; Holmes, W.M. A new approach to define surface/sub-surface transition in gravel beds. Acta Geophys. 2012, 60, 1589–1606. [Google Scholar]
- Liu, L.; Schaefer, K.; Gusmeroli, A.; Grosse, G.; Jones, B.M.; Zhang, T.; Parsekian, A.D.; Zebker, H.A. Seasonal thaw settlement at drained thermokarst lake basins, Arctic Alaska. Cryosphere 2014. [Google Scholar] [CrossRef] [Green Version]
© 2015 by the authors; licensee MDPI, Basel, Switzerland. This article is an open access article distributed under the terms and conditions of the Creative Commons Attribution license (http://creativecommons.org/licenses/by/4.0/).
Share and Cite
Schaefer, K.; Liu, L.; Parsekian, A.; Jafarov, E.; Chen, A.; Zhang, T.; Gusmeroli, A.; Panda, S.; Zebker, H.A.; Schaefer, T. Remotely Sensed Active Layer Thickness (ReSALT) at Barrow, Alaska Using Interferometric Synthetic Aperture Radar. Remote Sens. 2015, 7, 3735-3759. https://doi.org/10.3390/rs70403735
Schaefer K, Liu L, Parsekian A, Jafarov E, Chen A, Zhang T, Gusmeroli A, Panda S, Zebker HA, Schaefer T. Remotely Sensed Active Layer Thickness (ReSALT) at Barrow, Alaska Using Interferometric Synthetic Aperture Radar. Remote Sensing. 2015; 7(4):3735-3759. https://doi.org/10.3390/rs70403735
Chicago/Turabian StyleSchaefer, Kevin, Lin Liu, Andrew Parsekian, Elchin Jafarov, Albert Chen, Tingjun Zhang, Alessio Gusmeroli, Santosh Panda, Howard A. Zebker, and Tim Schaefer. 2015. "Remotely Sensed Active Layer Thickness (ReSALT) at Barrow, Alaska Using Interferometric Synthetic Aperture Radar" Remote Sensing 7, no. 4: 3735-3759. https://doi.org/10.3390/rs70403735