Article

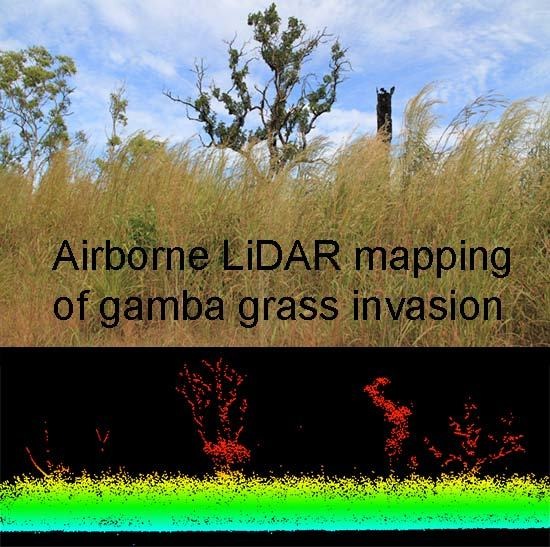
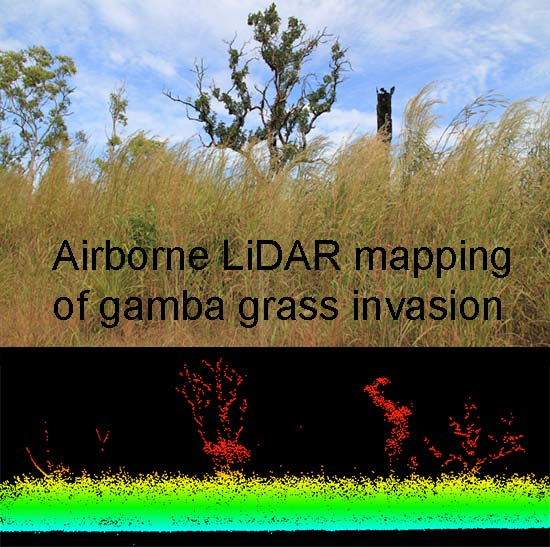
Monitoring the Distribution and Dynamics of an Invasive Grass in Tropical Savanna Using Airborne LiDAR

by
Shaun R. Levick
1,*,
Samantha A. Setterfield
2,
Natalie A. Rossiter-Rachor
2,
Lindsay B. Hutley
2,
Damien McMaster
2 and
Jorg M. Hacker
3
1
Max Planck Institute for Biogeochemistry, Hans-Knoell-Str. 10, Jena 07745, Germany
2
Research Institute for Environment and Livelihoods, Charles Darwin University, Darwin, NT 0909, Australia
3
Airborne Research Australia, Flinders University, Salisbury South, SA 5106, Australia
*
Author to whom correspondence should be addressed.
Remote Sens. 2015, 7(5), 5117-5132; https://doi.org/10.3390/rs70505117
Submission received: 5 February 2015 / Revised: 10 April 2015 / Accepted: 20 April 2015 / Published: 24 April 2015
(This article belongs to the Special Issue Remote Sensing and GIS for Habitat Quality Monitoring)

Abstract

:
The spread of an alien invasive grass (gamba grass—Andropogon gayanus) in the tropical savannas of Northern Australia is a major threat to habitat quality and biodiversity in the region, primarily through its influence on fire intensity. Effective control and eradication of this invader requires better insight into its spatial distribution and rate of spread to inform management actions. We used full-waveform airborne LiDAR to map areas of known A. gayanus invasion in the Batchelor region of the Northern Territory, Australia. Our stratified sampling campaign included wooded savanna areas with differing degrees of A. gayanus invasion and adjacent areas of native grass and woody tree mixtures. We used height and spatial contiguity based metrics to classify returns from A. gayanus and developed spatial representations of A. gayanus occurrence (1 m resolution) and canopy cover (10 m resolution). The cover classification proved robust against two independent field-based investigations at 500 m2 (R2 = 0.87, RMSE = 12.53) and 100 m2 (R2 = 0.79, RMSE = 14.13) scale. Our mapping results provide a solid benchmark for evaluating the rate and pattern of A. gayanus spread from future LiDAR campaigns. In addition, this high-resolution mapping can be used to inform satellite image analysis for the evaluation of A. gayanus invasion over broader regional scales. Our research highlights the huge potential that airborne LiDAR holds for facilitating the monitoring and management of savanna habitat condition.

Graphical Abstract

1. Introduction

Savannas cover 20% of the global terrestrial land surface and account for 30% of terrestrial net primary production (NPP) [1]. Fire is an integral component of savanna ecology and dynamics, particularly in tropical savannas which typically burn every 1–3 years [2]. Fire can markedly alter the structure and biomass of savanna vegetation, so understanding fire dynamics is critical for managing carbon storage and conserving biodiversity in these habitats. Global changes in land-use and climate threaten many of the ecosystem services that savannas provide, and the spread of alien invasive plants that alter fire regimes presents major additional ecological challenges [3].
Over the past two decades, there has been increased research focus on invasive alien grasses—particularly mapping their distribution, determining patterns of spread, quantifying their ecological impacts and developing more effective management strategies. The focus on this group of invaders is the consequence of the substantial threat that they pose to the structure and function of many of the world’s ecosystems [4]. Ecological impacts include the displacement of native species and consequent reduction in native flora and fauna, significant changes to nutrient and water cycling, and substantial changes to fire behaviour and altered fire regimes [5,6].
Introduced crop and pasture plants form the basis of most of Australia’s agricultural production, and in north Australia’s savannas a number of exotic grass species have spread from the pastoral estate to invade native savanna vegetation [7,8,9]. The species considered the greatest threat to the region’s savanna woodlands and forests is Andropogon gayanus Kunth. (gamba grass) [10,11]. A. gayanus is a perennial C4 grass that forms large tussocks in excess of 4 meters high and displaces the much shorter native vegetation [10]. A. gayanus alters nitrogen cycling [5,12] and reduces plant species richness and abundance [10]. Invasion results in fuel loads at least three times higher than native grasses, resulting in significantly more intense fires [8,11,13]. The rate of spread from initial source paddocks of A. gayanus has been rapid [14] with invasion now covering ~15,000 km2. Modelling exercises predict that most of Australia’s mesic savanna is suitable for invasion, including ~380,000 km2 of Australia’s Northern Territory, as well as large savanna areas in Queensland and Western Australia [15]. There is an urgent need for effective management of A. gayanus in northern Australia.
Accurately mapping the distribution of invasive plants underpins effective management. Distribution mapping is critical for determining the extent and pattern of invasion, and the prioritisation of invaded areas for management actions [16]. In addition, distribution maps are used in predictive modelling of the potential distribution and patterns of spread [17], and for assessing regional impacts [18]. To better understand and better manage the spread and consequences of A. gayanus invasion, we need spatially explicit knowledge of where A. gayanus occurs and how fast it is spreading. However the savanna region of northern Australia is the largest and most intact savanna system in the world, covering 2 million km2, so mapping the extent of habitat invaded by A. gayanus is challenging.
Satellite remote sensing has played an important role in ecological research since the 1970s and is the most viable option for monitoring large land areas through repeated time intervals [19]. The use of satellite remote sensing for alien invasive plant studies only started gaining traction in the mid-1990s as spatial and temporal resolutions increased. The application of remote sensing to the study of alien plant invasions is most efficient when the invader presents a novel structure, phenology or biochemistry relative to neighbouring native vegetation [20,21]. Airborne LiDAR has emerged as a powerful tool for the fine-scale structural characterisation of ecosystems [22], including studying the effects of management actions on savanna vegetation dynamics and biodiversity conservation [23,24]. Most ecological studies involving LiDAR focus on woody vegetation, with return pulse densities of 1–4 per m2 due to necessary compromises between sensor performance, flight altitude and flight speed. Laser returns from the grass layer are generally indistinguishable from the shrub layer at this resolution, or are treated as noise when refining the terrain models.
In this study we explore the potential for very high-resolution airborne LiDAR to map the presence and distribution of A. gayanus in the tropical savannas of northern Australia. Our goal was to produce a reliable representation of current A. gayanus coverage that can serve as both a benchmark for future rates of spread calculations, and as robust end-members for training satellite based investigations over broader regions.

2. Materials and Methods

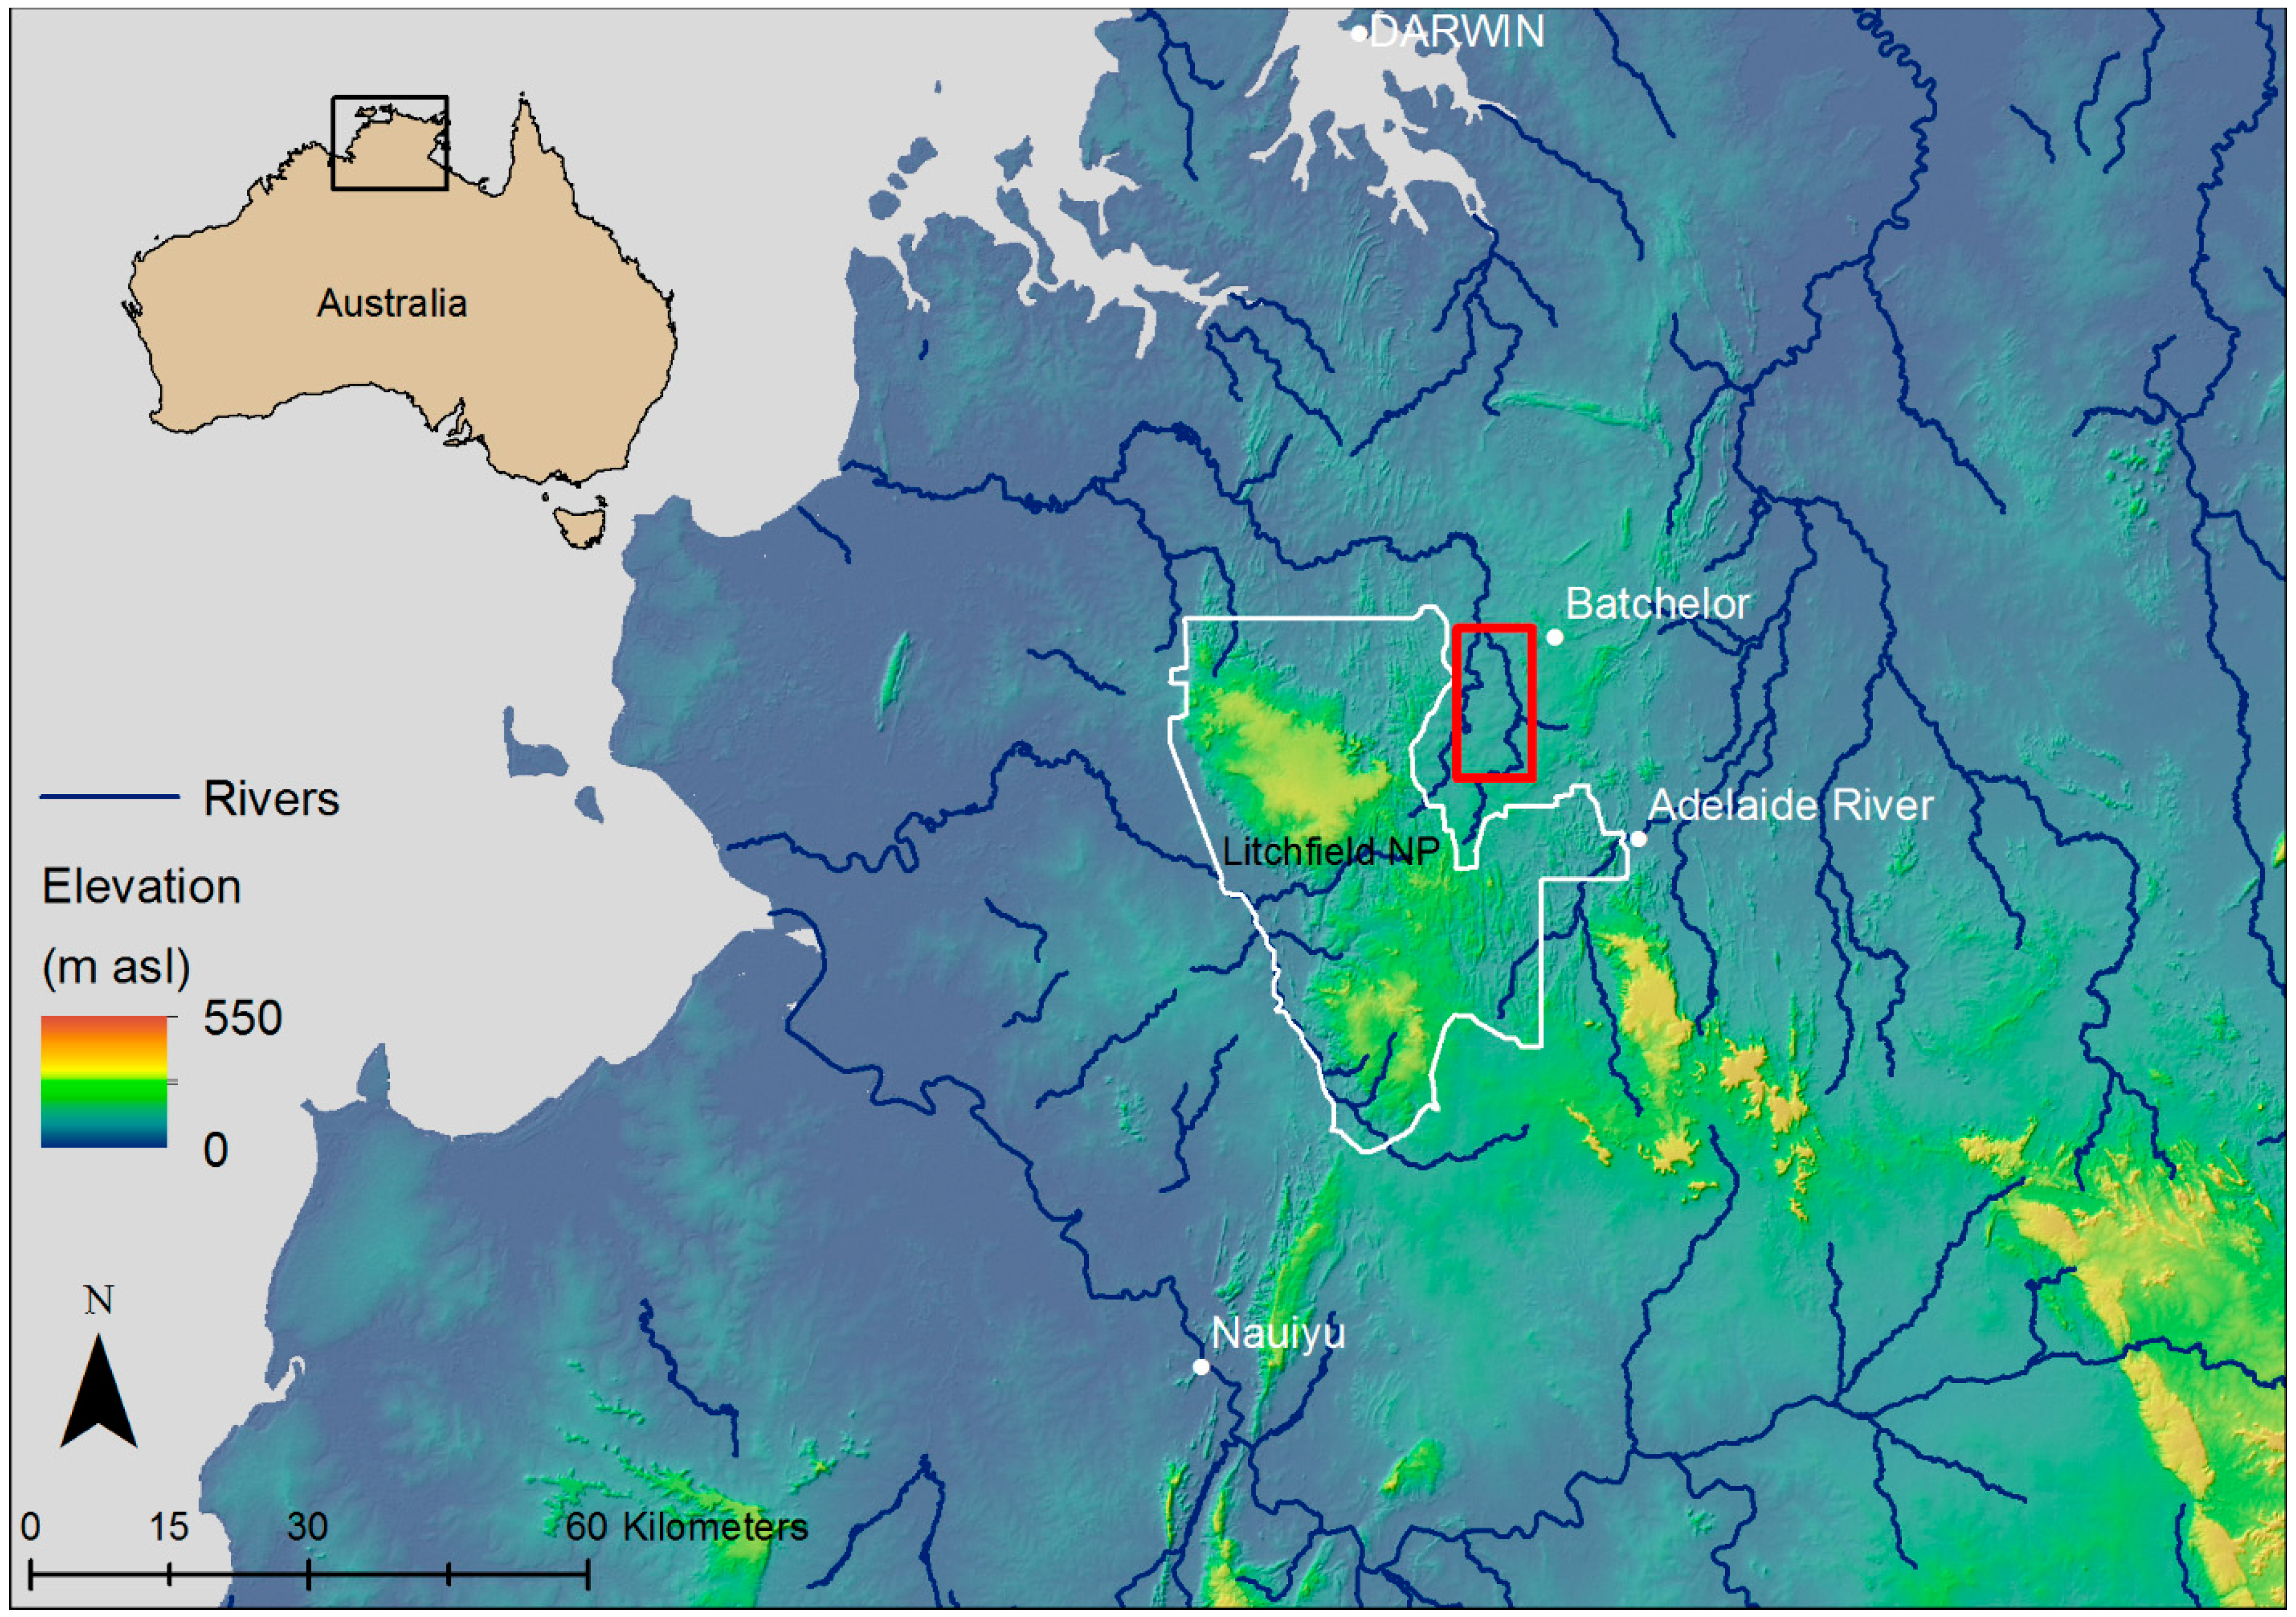
2.1. Study Species and Site Location

Andropogon gayanus is a perennial C4 grass that is structurally distinct from native grasses of northern Australia. A. gayanus forms taller tussocks (typically 2–5 m cf. 0.5–3 m for native grasses) with a larger basal area (up to 70 cm diameter c.f. up to 20 cm for native grasses) [12]. In the late wet season (March/April), A. gayanus undergoes significant growth and soon overtops the native herbaceous layer (Figure 1). In the early dry season (April/May/June), when the dominant annual grasses have begun to senesce, A. gayanus remains green and is clearly visible in the landscape.
A. gayanus was introduced into Australia in the 1930s, and subsequently cultivated into an improved pasture with the cultivar ‘Kent’ released in 1978 [11]. It was planted in paddocks within the study area in the mid-1980s, and spread from these paddocks to adjacent areas was noticed in the 1990s [25]. Significant areas of invasion now occur across northern Australia [15].
The study area for our investigation occurs within the Coomalie Shire region, located approximately 70–100 km south of Darwin, Northern Territory (NT), Australia (Figure 2). The study area has a distinct wet-dry tropical climate. Air temperature is high throughout the year (mean maximum 33 °C), while rainfall is highly seasonal (1662 mm, Batchelor Airport, Bureau of Meteorology, http://www.bom.gov.au) and concentrated in the wet season (November-April). The major vegetation type is savanna woodland dominated by Eucalyptus miniata (Cunn. Ex Schauer) and E. tetrodonta (F. Muell), with a grass understory dominated by native perennial species such as Heteropogon contortus (L.) Roem. & Schult and Alloteropsis semialata (R. Br.) Hitchc. or annual grasses, such as Sorghum intrans (F.Muell. ex Benth.). The study area is largely under private ownership for pastoral lease or semi-rural development, with other significant areas owned by local Aboriginal communities (the Finniss River Aboriginal Land Trust) or under Government ownership.
Figure 1. Typical vegetation structure in three stages of invasion—(a) a native vegetation site; (b) a site at the early stage of invasion with A. gayanus in understory and an intact Eucalyptus dominated overstory; and (c) a site heavily invaded with A. gayanus with a decline in overstory trees due to high intensity fires.
Remotesensing 07 05117 g001
Figure 2. Study site location (red box) in the Batchelor region of the Northern Territory, Australia.
Remotesensing 07 05117 g002

2.2. Airborne LiDAR Acquisition and Processing

We mapped 3000 ha of the study landscape with airborne LiDAR in June 2013. The survey was conducted by Airborne Research Australia (ARA) with a full-waveform LiDAR sensor (RIEGL LMS-Q560) operated from a light fixed-wing aircraft (Diamond Aircraft ECO-Dimona). We aimed to achieve a very high-resolution representation of the ecosystem, so overlapping flightlines were used to achieve double coverage of the sites (average flying height 300 m AGL, swath width ~300 m, line spacing 125 m). The RIEGL LMS-Q560 was operated at 240 kHz and 135 lines per second. Our very slow flying speed of less than 40 m/s ensured high point densities along track, with an average pulse density of 13.71 m2 and an average pulse spacing of 0.28 m.
Raw LiDAR data were processed with RiANALYZE (RIEGL®) for decomposing the full waveforms into discrete returns, and with the ARA RASP open source software (RASP Version 0.98: manual, code and executables available from ARA on request) to orientate the point cloud to Cartesian coordinates and output the geolocated point cloud in the American Society for Photogrammetry and Remote Sensing (ASPRS) standard LAS format. All further point-cloud processing tasks were conducted with the LAStools suite of processing scripts (http://www.lastools.org, Isenburg 2014). The last returns were classified into ground and non-ground points for bare-earth extraction. A digital terrain model (DTM) was constructed from ground returns using a triangulated irregular network approach (TIN) at 0.5 m resolution. The DTM was used to normalize the z coordinate of vegetation returns to height above ground level.

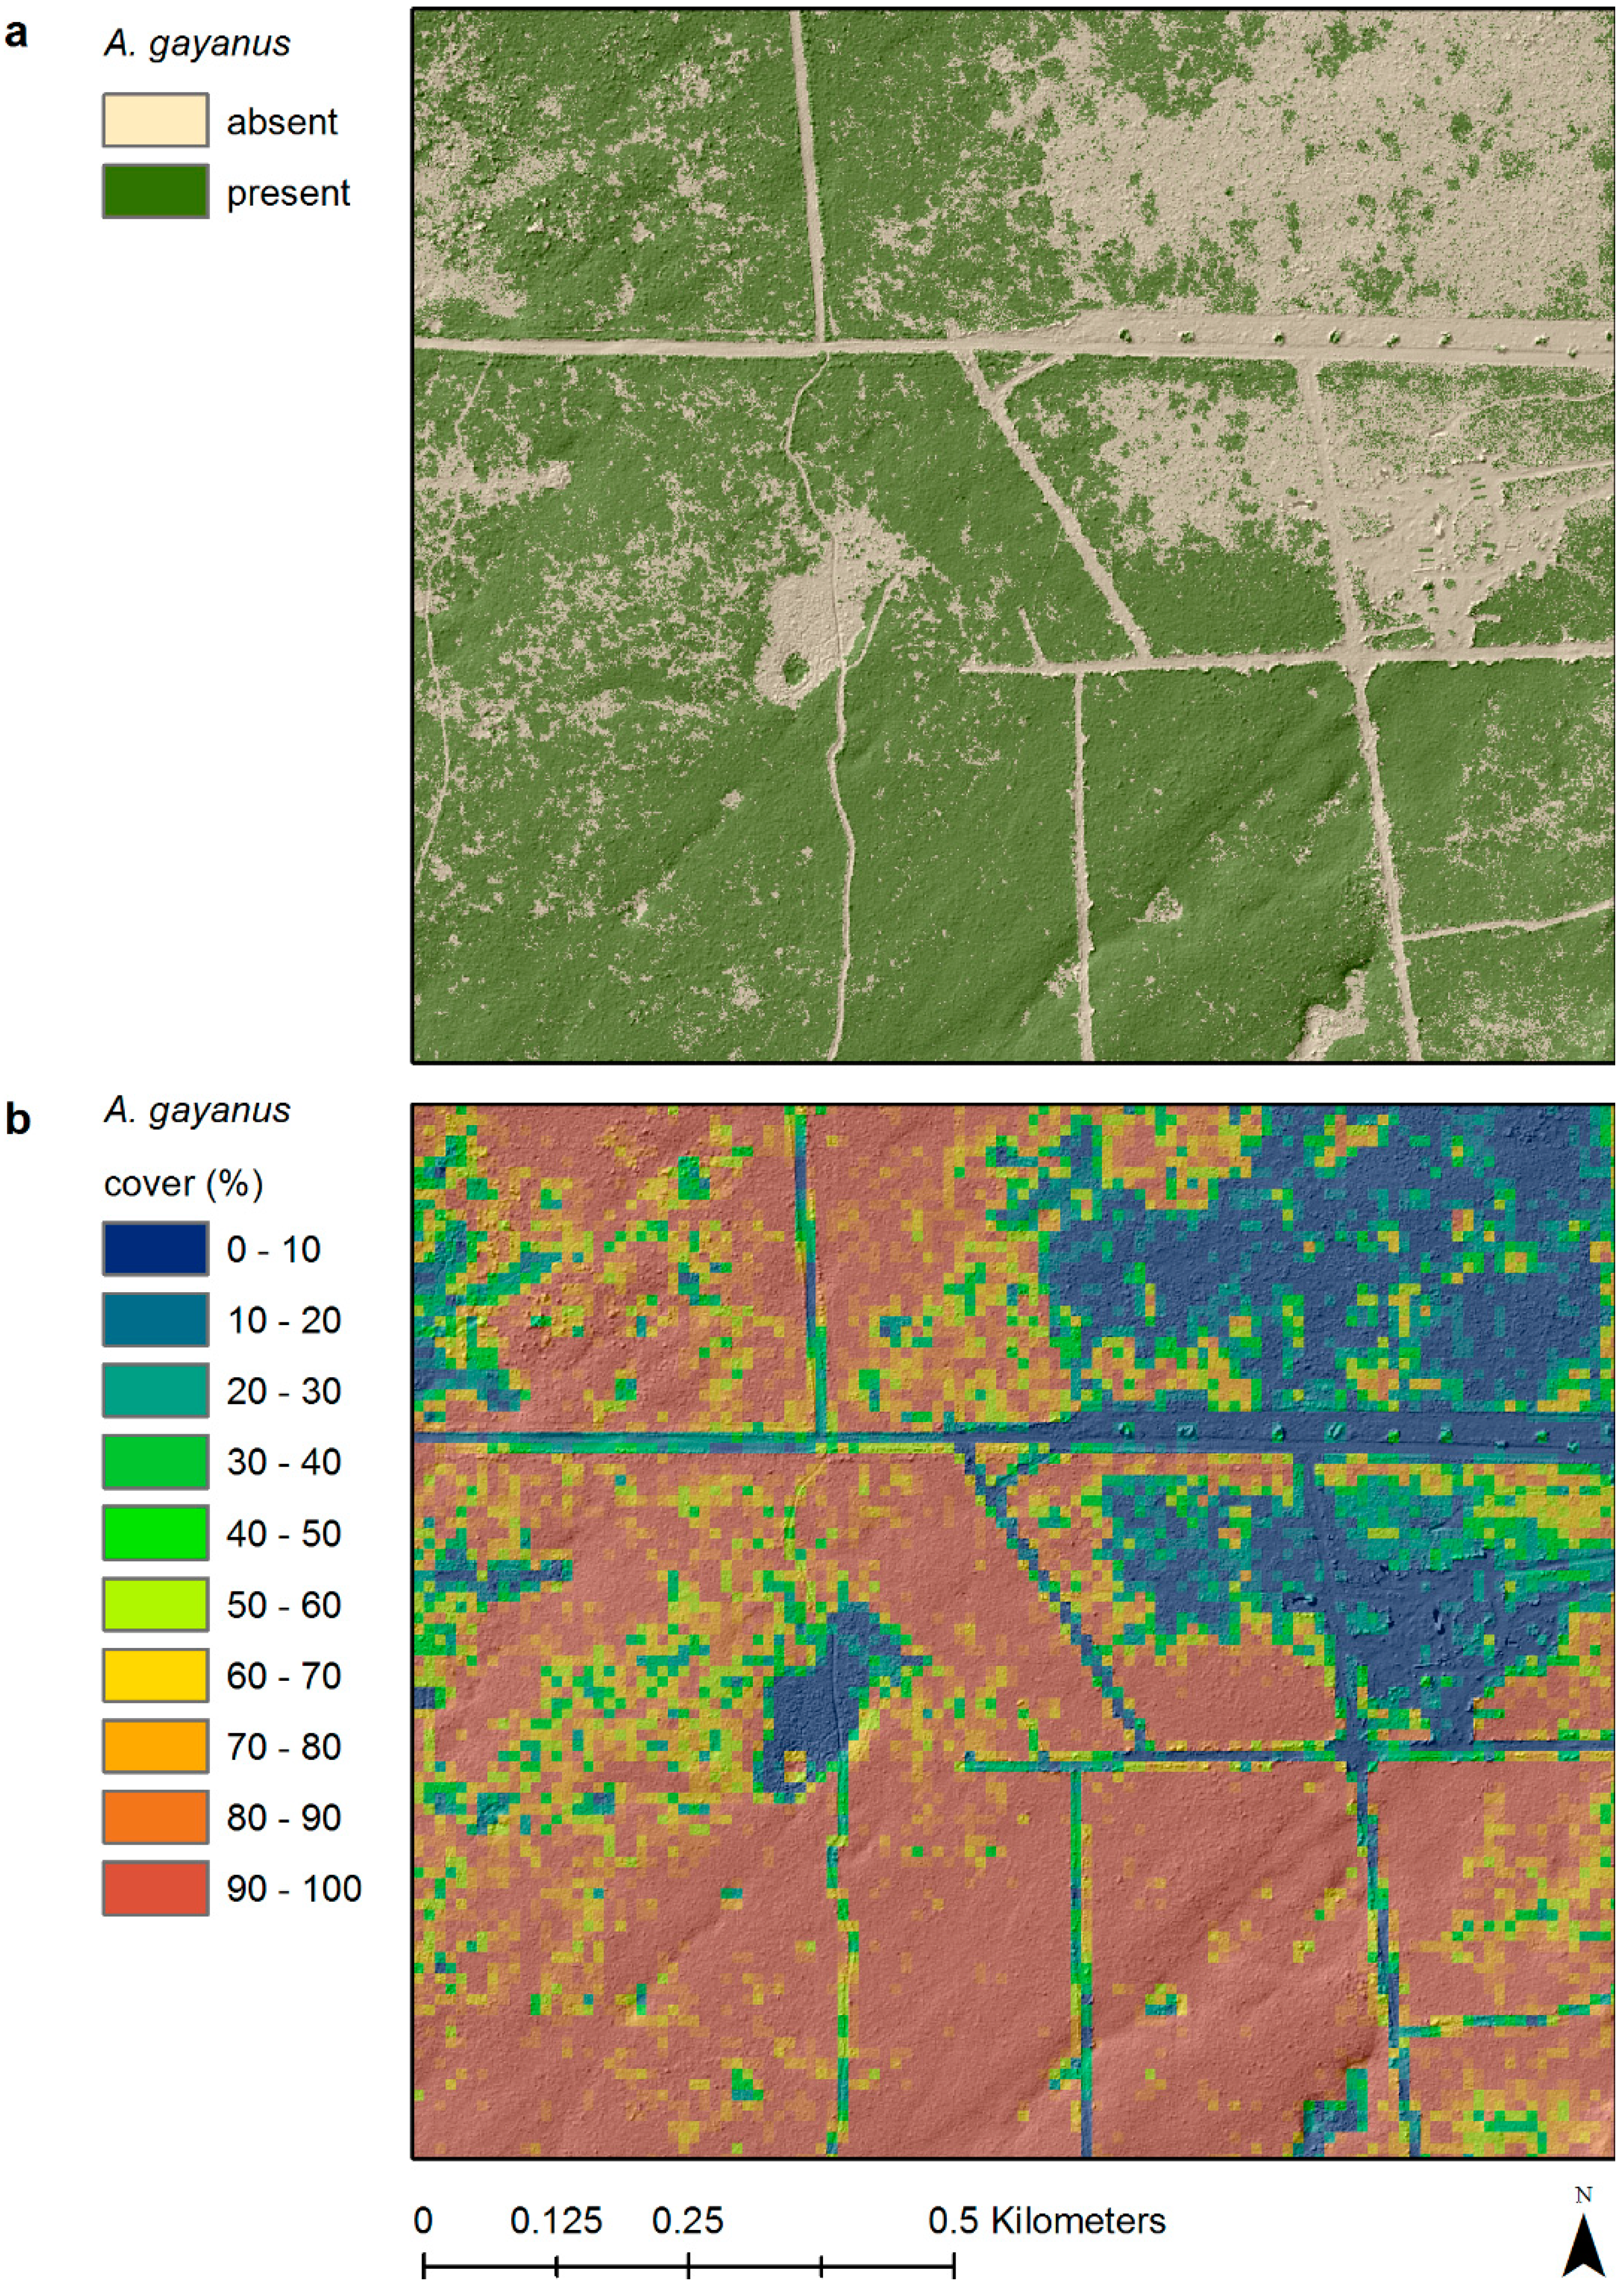
2.3. A. gayanus Classification and Cover Mapping

We developed a rule-set for A. gayanus classification based on prior field-based knowledge of its growth form. A. gayanus does not exceed 5 m in height in the field, so we filtered all points less than or equal to 5 m above ground level as a first step in our classification scheme. We excluded points in the first 0.25 m to limit the influence of terrain and woody debris on the classification, so only points in the 0.25–5 m range were considered as potential returns from A. gayanus. Commonly occurring native grasses (such as Sorghum spp. and Heteropogon contortus) and woody shrubs are also present in this height zone, however their distribution is not as uniform as the continuous dense canopy of A. gayanus that we observe in the field. As such, we adopted a voxel-based approach (volumetric pixel, see [26] for more details) to quantify the density of LiDAR returns for each cubic meter of space across the study site. This step provided a quantification of the distribution of vegetation both horizontally and vertically in the ecosystem. We then searched for voxels that were vertically contiguous from 0.25 m upwards and flagged them as potential A. gayanus returns. We generated a spatial representation of potential A. gayanus occurrence across the study site based on voxel continuity with a 1 m horizontal resolution. This presence/absence map was aggregated to 10 m horizontal resolution to provide a cover-based distribution estimate on a 0%–100% scale.

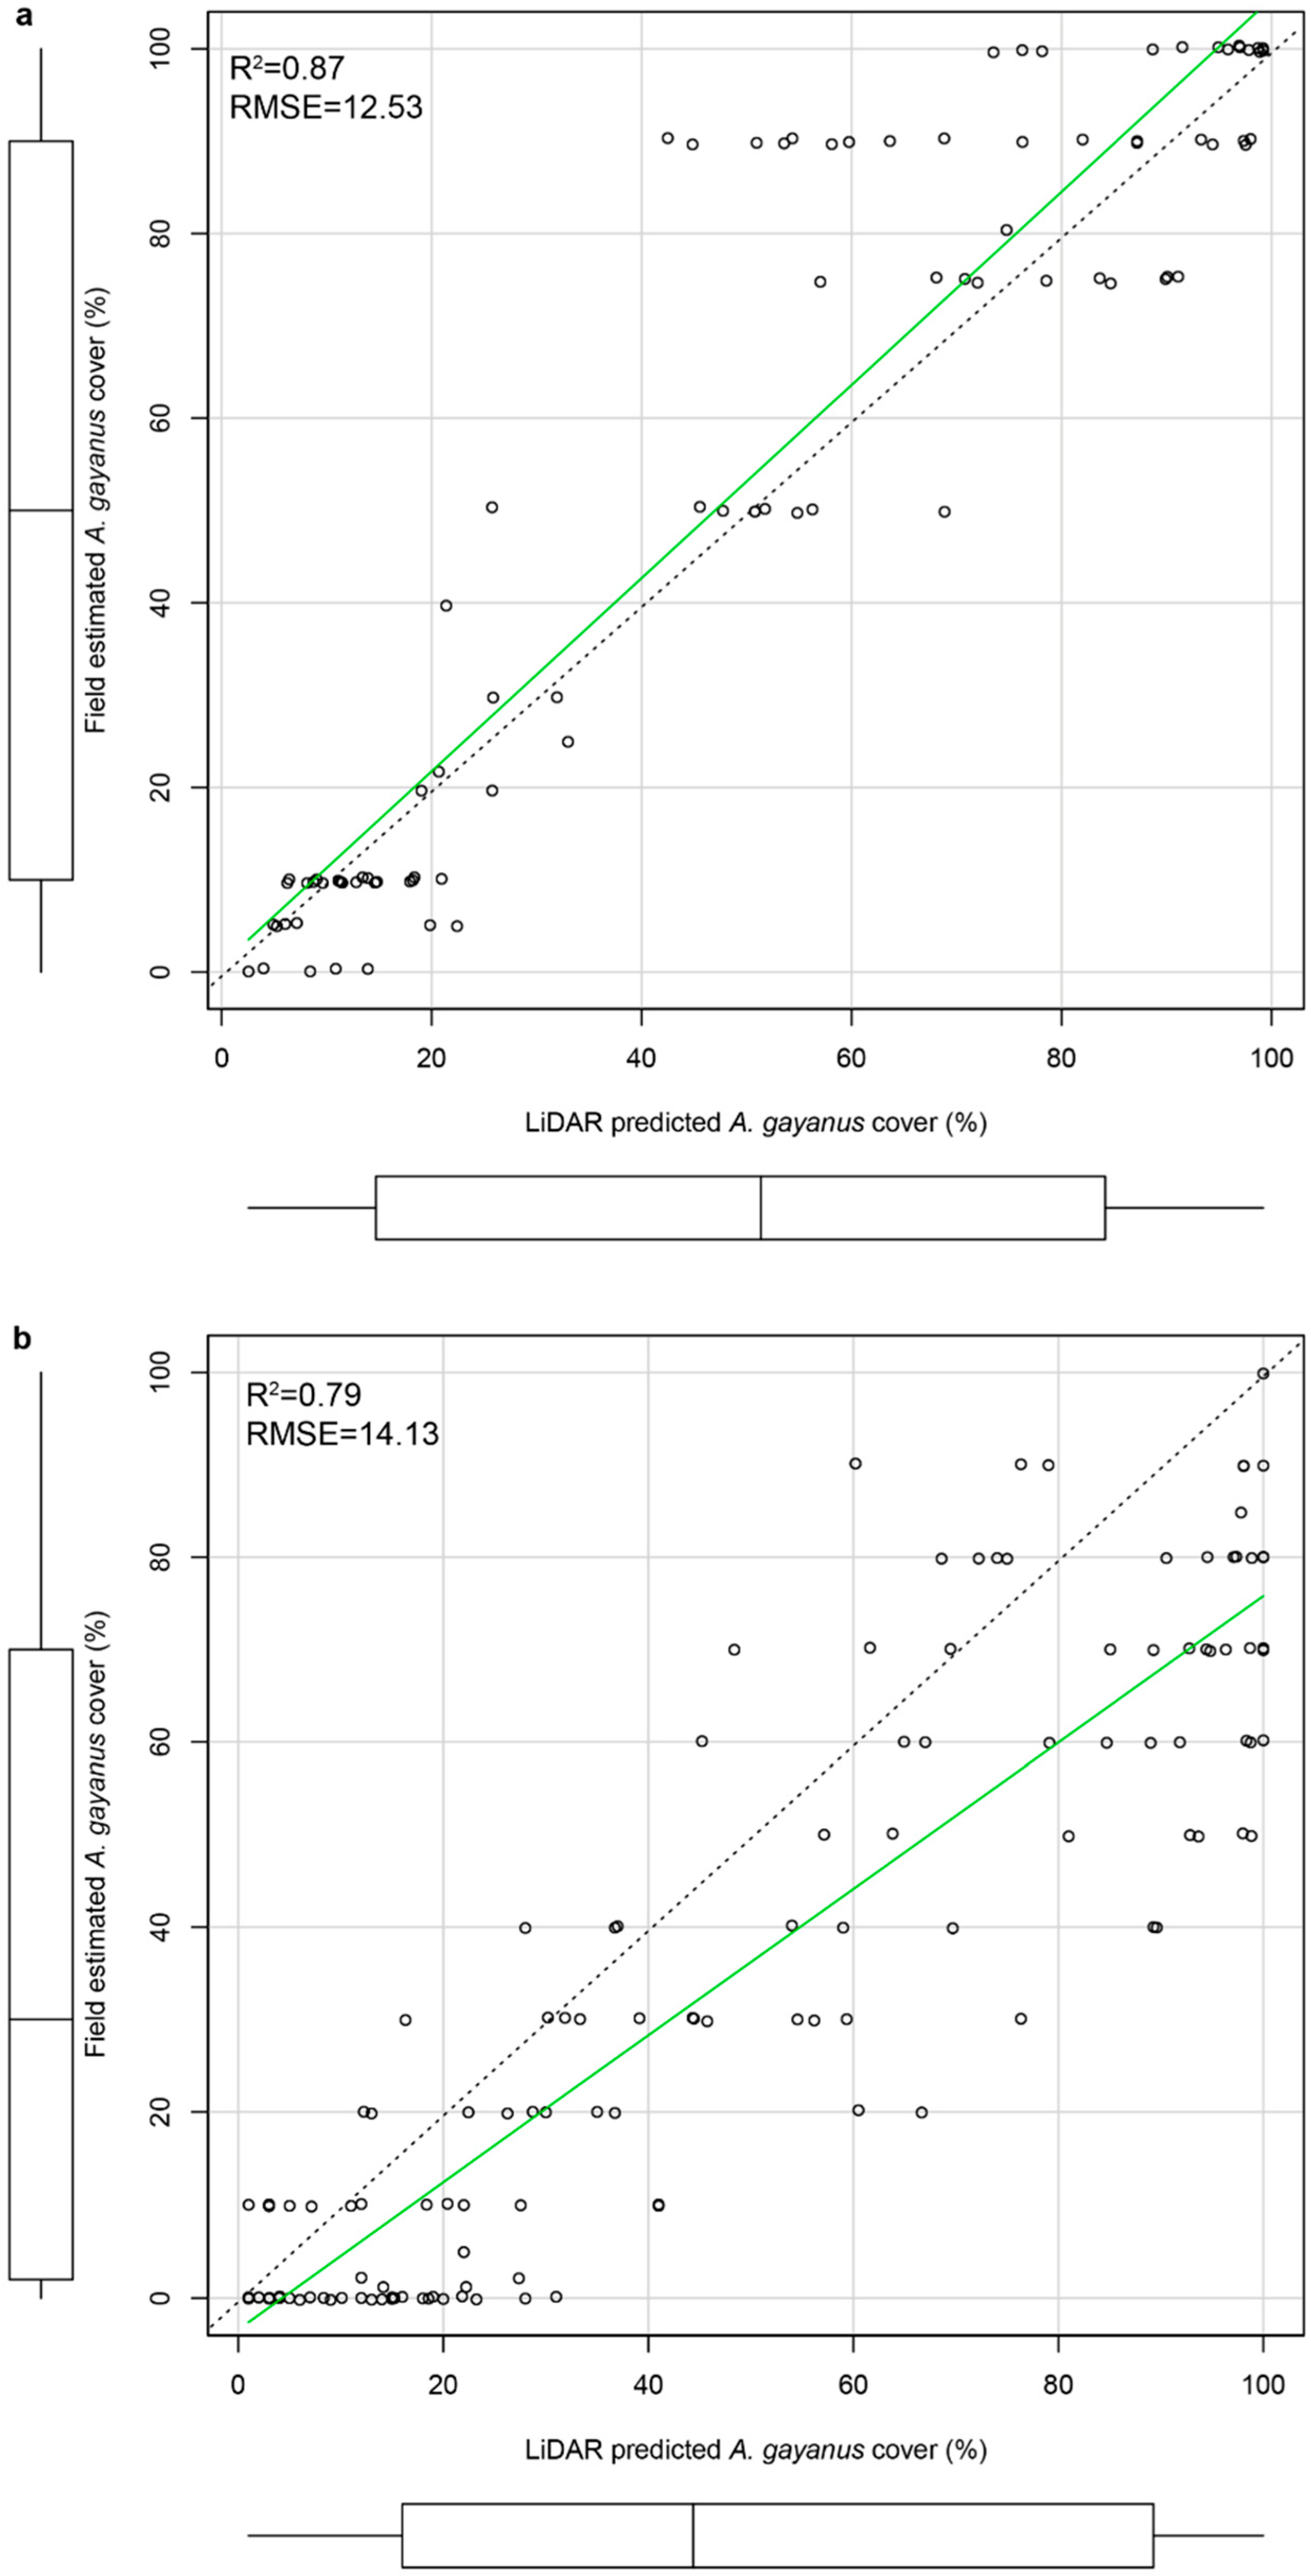
2.4. Field-Validation of LiDAR Predictions
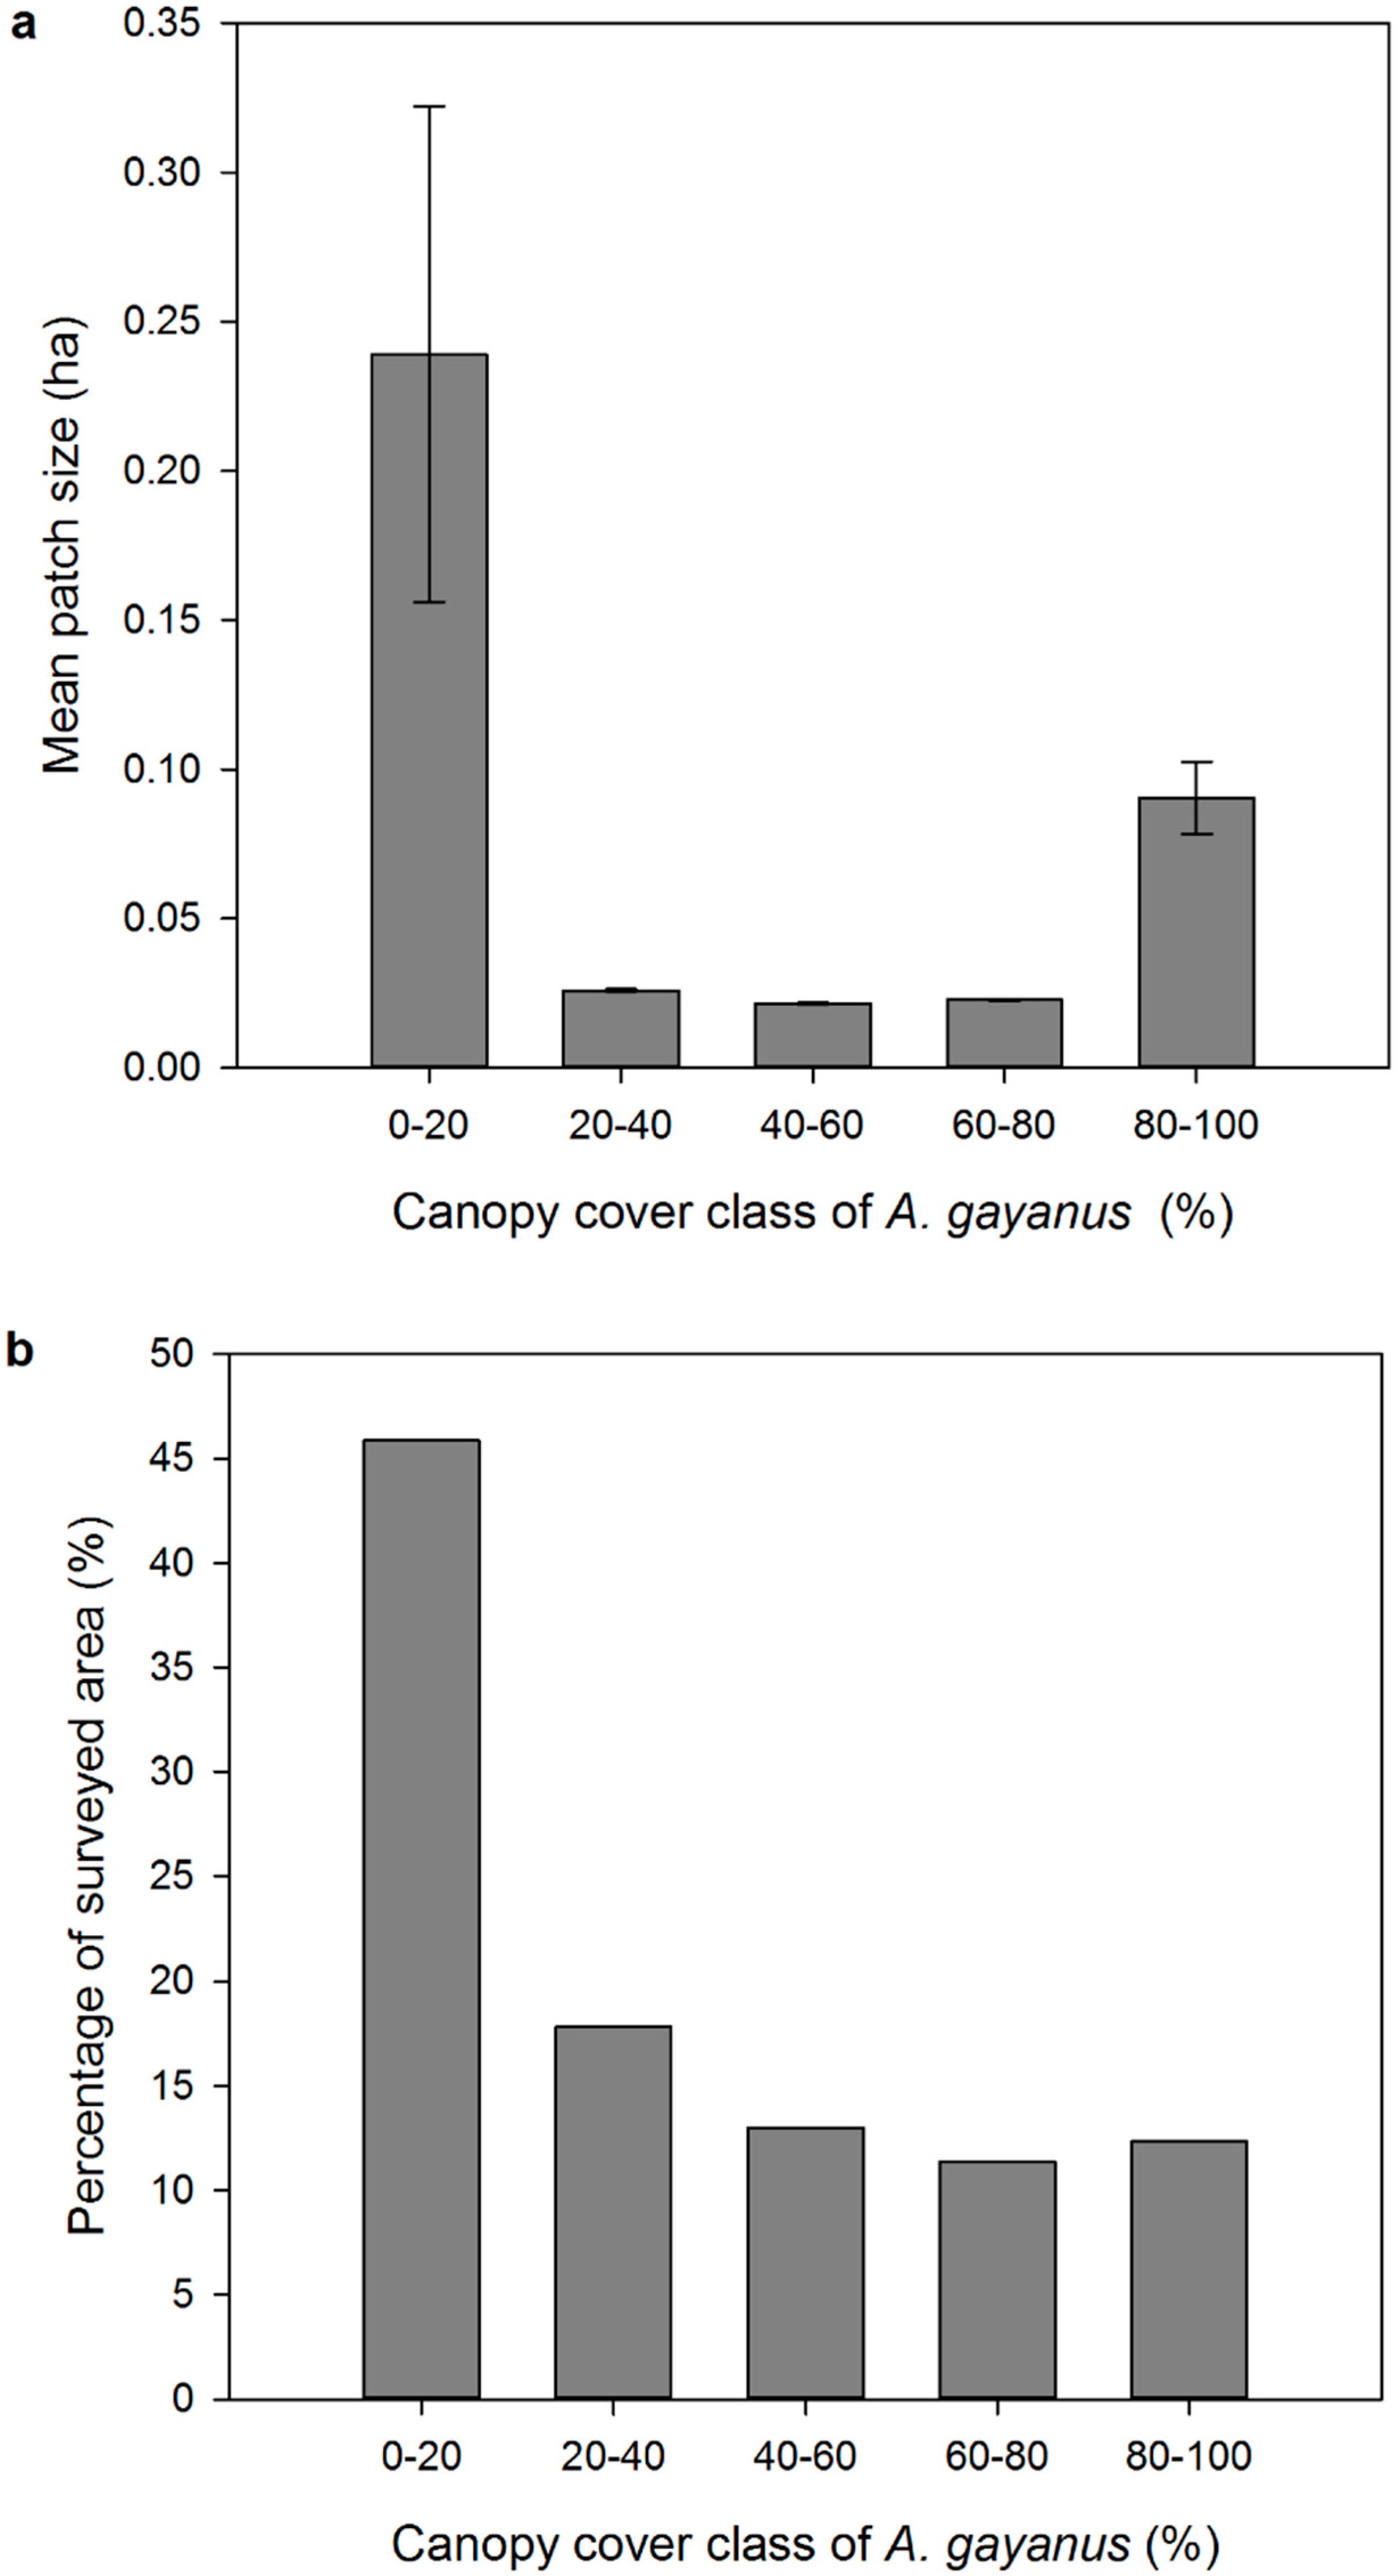
The A. gayanus classification routine was derived from expert knowledge of the vegetation growth form, and not through sample selection and training. In order to test the robustness of the classification, we conducted two separate validation tests against field data. Firstly, we compared the classification results with field survey data collected from 90 plots in April 2014. These plots measured 10 × 50 m (500 m2) each with woody stand structure and percentage of A. gayanus cover visually estimated. Secondly, we conducted additional fieldwork in November 2014 to explicitly test the accuracy of LiDAR derived A. gayanus spatial predictions. We generated 150 validation points in a stratified random manner, assigning 15 points per 10% increment of predicted A. gayanus cover. Our ‘blind’ field team (field team had no prior knowledge of the LiDAR derived predictions) attempted to locate each of the prescribed points by differential GPS in the field, however due to land-ownership constraints and recent fires, only 85 of these points could be visited. An additional 65 points were sampled by the field team to compensate for the unreachable points, ensuring that the full range of A. gayanus canopy cover was sampled (total sample size = 150). At each point the presence and percentage cover of A. gayanus was estimated within a 10 × 10 m (100 m2) quadrat centred on the GPS point. We used ordinary least square regression to assess the relationship between field and LiDAR derived A. gayanus cover estimates (LiDAR estimates were aggregated to match the 500 m2 and 100 m2 resolutions of the field transects).
We aggregated the A. gayanus cover predictions into cover classes of 20% increments to explore metrics of patch size, shape and spatial configuration. We used a voxel based approach to quantify the mean vegetation canopy height profiles within each cover class to gain insight into the impact of different A. gayanus densities on woody vegetation canopy structure.

3. Results

The airborne LiDAR survey provided excellent three-dimensional representations of the open tropical savanna woodland habitat. Individual trees were well defined in the 3D point cloud, with numerous returns from trunks and branches (Figure 3). Multiple returns were obtained from within the A. gayanus layer—rendering it clearly visible in the LiDAR point cloud. The structural differences between native grasses and shrubs (Figure 3a) were visually distinguishable from A. gayanus (Figure 3b), primarily through the presence of small gaps in the vegetation layer just above ground level.
Figure 3. Cross-section through the collected LiDAR point cloud, normalised to height above ground level, in (a) a native vegetation site, and (b) a A. gayanus invaded site. The width of the point cloud cross-section is 10 m.
Remotesensing 07 05117 g003
The uniform nature of A. gayanus was a key component of the rule-based classification scheme for identifying its occurrence based on height and vertical contiguity (Figure 4a). Spatial representations of A. gayanus canopy cover highlighted the clumped nature of its distribution, with complete coverage on some farms (Figure 4b).
Ground-based validation of the A. gayanus cover mapping revealed strong correlation between cover estimates obtained in the field and from the air (R2 = 0.87) with moderate error (RMSE = 12.53) at 500 m2 resolution (Figure 5a). These results were very encouraging, however since the field-data were primarily collected for the characterisation of woody vegetation under high and low A. gayanus densities, a large proportion of the reference points were located within the very low and very high cover categories. As such, this validation gives us confidence in our ability to distinguish native savanna from heavily invaded savanna at the 500 m2 scale, but provides less insight into our ability to map more subtle variations in A. gayanus cover. However, the results from our targeted fieldwork at 100 m2 scale also showed good agreement (R2 = 0.79, RMSE = 14.13) with LiDAR derived estimates of A. gayanus cover (Figure 5b). The finer 100 m2 comparisons did contain more scatter however, and the linear model deviated from the 1:1 line with LiDAR predictions overestimating A. gayanus cover relative to field-based estimations.
Figure 4. Airborne LiDAR based classification of (a) A. gayanus occurrence at 1 m scale, and (b) A. gayanus percentage canopy cover at 10 m scale.
Remotesensing 07 05117 g004
Figure 5. Validation of LiDAR estimated A. gayanus coverage against field-based estimates at (a) 500 m2 scale and (b) 100 m2 scale. Solid green line represents the ordinary least squares regression, and the 1:1 line is indicated by the dotted black line.
Remotesensing 07 05117 g005
Mean patch size was largest for patches of low (0%–20%) and high (80%–100%) A. gayanus canopy cover, with minimal variation in the intermediate cover categories (Figure 6a). Areas of low A. gayanus cover (0%–20%) accounted for almost 45% of the study area, and heavily invaded patches (80%–100%) were present in 13% of the study site (Figure 6b).
Figure 6. Patch metrics for five classes of A. gayanus canopy cover mapped with airborne LiDAR. (a) Mean size of spatially contiguous patches of five canopy cover categories. (b) Percentage of total area surveyed for each of the five canopy cover categories.
Remotesensing 07 05117 g006
Areas of low (0%–20%) and high (80%–100%) A. gayanus cover supported dramatically different woody vegetation structures (Figure 7). The woody layer displayed a bi-modal pattern in areas of low A. gayanus cover, with prominent separation between a recruiting layer (<4 m) and an overstory layer with a high proportion of trees in the 8–12 m height classes (Figure 7a). Areas with high invasion contained almost no overstory canopy, with the vast majority of LiDAR returns coming from the grass itself in the <4 m height ranges (Figure 7b).
Figure 7. Canopy height profiles of vegetation growing within zones identified as containing (a) low A. gayanus canopy cover (0%–20%), and (b) high A. gayanus canopy cover (80%–100%).
Remotesensing 07 05117 g007

4. Discussion

4.1. Airborne LiDAR Based Estimations of A. gayanus Cover

Airborne LiDAR has been used extensively for the 3D characterisation of woody vegetation in southern Africa [23,27,28] and eastern Australia [29]. To date, we have not seen it applied to the characterisation of the herbaceous layer in savannas but our findings in this study indicate good potential for retrieving structural information from this zone—provided a sufficiently high pulse density with a small foot-print size is achieved. The presence of A. gayanus was clearly discernable in the LiDAR point cloud collected during our study (Figure 3) and remotely derived cover estimates were well aligned with those obtained in the field (Figure 4). There were, however, some discrepancies between the LiDAR-field validations conducted at 500 m2 (R2 = 0.87, RMSE = 12.53) and 100 m2 (R2 = 0.79, RMSE = 14.13). In general, we would expect better correlation from the larger quadrats as the edge effect is minimized and noise is averaged out. However the differences between our 500 m2 results (Figure 5a) and 100 m2 (Figure 5b) do not appear to be artefacts of edge effects, nor GPS positioning (given the high confidence in differential GPS locations with decimeter accuracy). Rather, the deviation of the 100 m2 fit from the 1:1 line was more systematic, with LiDAR predications overestimating those from the field. Unfortunately, comparisons between these two validations are confounded by the time of year that the fieldwork campaigns were conducted, and the time interval between airborne campaign and field data collection.
The LiDAR campaign was conducted in June 2013, but due to logistical constraints the first field validation (500 m2) was conducted in April 2014 (10 months post LiDAR survey) and the second field validation (100 m2) was conducted in November 2014 (16 months post LiDAR survey). A. gayanus phenological conditions in June (early dry season) are much closer to those in April (end of wet season) than those in November (end of dry season). Therefore, when A. gayanus cover was estimated in the field in November 2014 it had already senesced and therefore had markedly less projected areal cover that when it was assessed in the field in April 2014 or from the air in June 2013. Furthermore, it was noted that a number of sites in November 2014 had been recently burnt. As such, we do not consider the LiDAR predictions to be overestimates, and it is likely that LiDAR provides a more accurate estimate for a particular snapshot in time than what can be obtained in the field—especially when considering the difficulty of measuring A. gayanus cover on the ground in the first instance.

4.2. Implications for A. gayanus Invasion Ecology and Management

High-resolution and accurate mapping of A. gayanus occurrence and canopy cover with airborne LiDAR holds a number of important implications for advancing the ecological understanding and management of its invasion. To date, managers have not had an accurate regional map of the distribution of A. gayanus because most of the invasion has occurred in areas that are remote and very difficult to access, and the limited visibility and impenetrability in invaded areas (Figure 1) has meant that systematic ground-based surveys have been limited. The LiDAR mapping provides an accurate map of the area and continuity of increased fuel load resulting from invasion. The high-resolution and accurate mapping results from this study will also underpin both a weed management strategy and a fire fuel management strategy for the region.
In addition to learning more about is spatial distribution and structure (Figure 6), spatially explicit knowledge of A. gayanus cover can linked back to LiDAR-based analysis of the woody vegetation structure to quantify the effects of different levels of invasion on structural diversity (Figure 7). The dramatic reduction and loss of diversity in woody canopy structure under high A. gayanus cover is alarming from both carbon management and biodiversity conservation standpoints. There is an urgent need for effective management of A. gayanus in northern Australia and results from this study indicate that LiDAR can play an important role both in quantifying the effects of invasion and in informing its management.
In most cases, observing alien plants remotely requires working at the limits of at least one type of sensor resolution, be it spatial, temporal or spectral resolution, given the similarity in spectral and/or structural profiles of these native and invasive species [30]. However in this case, the structure of A. gayanus differs markedly from that of native vegetation and this signal is readily obtainable from very high-resolution airborne LiDAR. The drawback of this approach however, is the cost associated with collecting these types of data over large areas, although this needs to be assessed relative to costs associated with extensive ground based field surveys in often remote and/or inaccessible areas. However, flying low and slow with multiple flight lines is not feasible over broad scales and satellite based options are required for regional scale monitoring. Most satellite sensors with broad spatial coverage and high temporal resolution lack the spatial resolution required to distinguish individual plants or canopy strata. A multi-scaled approach is therefore needed to integrate information from different airborne and spaceborne sensors. Airborne LiDAR can provide detailed spatial information of A. gayanus cover at fine scales, which can then be used: (i) as end-member information for training satellite-based analyses at broader-scales (e.g., from Landsat, WorldView and the forthcoming Sentinel-2 mission); (ii) for informing sub-pixel unmixing to derive fractional cover estimates; (iii) for improved calibration of historical satellite based imagery; and (iv) for developing monitoring tools that provide future mapping and tracking of invasion fronts. Furthermore, by using LiDAR to obtain a robust snapshot of current A. gayanus distribution, it will be possible to both measure and test predictions of how fast the grass is expanding its range, by utilizing a series of repeat airborne campaigns in the future. Time-series investigations in ecology utilizing airborne LiDAR are rare due to the costs of airborne campaigns, but the few investigations that do exist in savannas have revealed important spatial insights into how ecosystems change over time [24,28,31]. Of particular interest in this region will be the long-term monitoring of invasion fronts that are well depicted from the LiDAR analysis (Figure 8).
Figure 8. Spatial variability of A. gayanus cover mapped using airborne LiDAR showing the advancing invasion front in the region adjacent to Litchfield National Park, NT.
Remotesensing 07 05117 g008

5. Conclusions

Our study highlights the potential of high-resolution airborne LiDAR to provide robust estimates of A. gayanus canopy cover (R2 = 0.87, RMSE = 12.53, at 500 m2 scale and R2 = 0.79, RMSE = 14.13, at 100 m2 scale). These airborne mapping results provide a solid benchmark for evaluating the rate and pattern of A. gayanus spread from future LiDAR campaigns. In addition, this high-resolution mapping can be used to inform satellite image analyses for the evaluation of A. gayanus invasion over broader regional scales. LiDAR sensor technology continues to advance, and in coming years it will be possible to obtain similar structural results shown here from higher altitudes and faster air speeds, with fewer overpasses, or via the use of unmanned airborne vehicles. Current and continued developments in LiDAR remote sensing science hold great potential for invasive plant research, monitoring and management.

Acknowledgments

The German Federal Ministry of Education and Research (BMBF) and Australian Research Council (ARC) provided funding for travel related expenses as part of a Germany-Australia mobility grant (FIREBIODIV–01DR14010). Funding for data collection and field validation was provided by the Australian Department of Environment’s National Environmental Research Program, Northern Australia Hub (NERP-NAH). We are grateful to Mitchel Rudge for assistance in the field.

Author Contributions

Samantha A. Setterfield, Natalie A. Rossiter-Rachor and Lindsay B. Hutley conceived the study. Jorg M. Hacker conducted the airborne surveying and pre-processing. Damien MacMaster carried out the field-validation. Shaun R Levick performed the analyses. SRL, SAS, NARR, LBH, and JMH wrote the paper.

Conflicts of Interest

The authors declare no conflict of interest.

References

  1. Grace, J.; José, J.S.; Meir, P.; Miranda, H.S.; Montes, R.A. Productivity and carbon fluxes of tropical savannas. J. Biogeogr. 2006, 33, 387–400. [Google Scholar] [CrossRef]
  2. Beringer, J.; Hutley, L.B.; Tapper, N.J.; Cernusak, L.A. Savanna fires and their impact on net ecosystem productivity in North Australia. Glob. Chang. Biol. 2007, 13, 990–1004. [Google Scholar] [CrossRef]
  3. Walther, G.R.; Roques, A.; Hulme, P.E.; Sykes, M.T.; Pyšek, P.; Kühn, I.; Zobel, M.; Bacher, S.; Botta-Dukát, Z.; Bugmann, H.; et al. Alien species in a warmer world: Risks and opportunities. Trends Ecol. Evol. 2009, 24, 686–693. [Google Scholar] [CrossRef] [PubMed]
  4. D’Antonio, C.M.; Vitousek, P.M. Biological invasions by exotic grasses, the grass/fire cycle, and global change. Annu. Rev. Ecol. Syst. 1992, 23, 63–87. [Google Scholar]
  5. Rossiter-Rachor, N.A.; Setterfield, S.A.; Douglas, M.M.; Hutley, L.B.; Cook, G.D. Andropogon gayanus (gamba grass) invasion increases fire-mediated nitrogen losses in the tropical savannas of northern Australia. Ecosystems 2008, 11, 77–88. [Google Scholar] [CrossRef]
  6. Cook, G.D.; Grice, A.C. Historical perspectives on invasive grasses and their impact on wildlife in Australia. Wildl. Soc. Bull. 2013, 37, 469–477. [Google Scholar]
  7. Douglas, M.M.; O’Connor, R.A. Weed invasion changes fuel characteristics: Para Grass (Urochloa mutica (Forssk.) T.Q. Nguyen) on a tropical floodplain. Ecol. Manag. Restor. 2004, 5, 143–145. [Google Scholar] [CrossRef]
  8. Setterfield, S.A.; Rossiter-Rachor, N.A.; Douglas, M.M.; Wainger, L.; Petty, A.M.; Barrow, P.; Shepherd, I.J.; Ferdinands, K.B. Adding fuel to the fire: The impacts of non-native grass invasion on fire management at a regional scale. PLoS ONE 2013, 8, e59144. [Google Scholar] [CrossRef] [PubMed]
  9. Flores, T.A.; Setterfield, S.A.; Douglas, M.M. Seedling recruitment of the exotic grass Andropogon gayanus (Poaceae) in northern Australia. Aust. J. Bot. 2005, 53, 243–249. [Google Scholar] [CrossRef]
  10. Brooks, K.J.; Setterfield, S.A.; Douglas, M.M. Exotic grass invasions: Applying a conceptual framework to the dynamics of degradation and restoration in Australia’s tropical savannas. Restor. Ecol. 2010, 18, 188–197. [Google Scholar] [CrossRef]
  11. Setterfield, S.A.; Rossiter-Rachor, N.A.; Hutley, L.B.; Douglas, M.M.; Williams, R.J. Turning up the heat: The impacts of Andropogon gayanus (gamba grass) invasion on fire behaviour in northern Australian savannas. Divers. Distrib. 2010, 16, 854–861. [Google Scholar] [CrossRef]
  12. Rossiter-Rachor, N.A.; Setterfield, S.A.; Douglas, M.M.; Hutley, L.B.; Cook, G.D.; Schmidt, S. Invasive Andropogon gayanus (gamba grass) is an ecosystem transformer of nitrogen relations in Australian savanna. Ecol. Appl. 2009, 19, 1546–1560. [Google Scholar] [CrossRef] [PubMed]
  13. Rossiter, N.A.; Setterfield, S.A.; Douglas, M.M.; Hutley, L.B. Testing the grass-fire cycle: Alien grass invasion in the tropical savannas of northern Australia. Divers. Distrib. 2003, 9, 169–176. [Google Scholar] [CrossRef]
  14. Adams, V.M.; Setterfield, S.A. Estimating the financial risks of Andropogon gayanus to greenhouse gas abatement projects in northern Australia. Environ. Res. Lett. 2013, 8, 025018. [Google Scholar] [CrossRef]
  15. Hutley, L.B.; Setterfield, S.A. Savanna. In Encyclopedia of Ecology; Jorgensen, S.E., Fath, B.D., Eds.; Academic Press: Oxford, UK, 2008; pp. 3143–3154. [Google Scholar]
  16. Shaw, D.R. Translation of remote sensing data into weed management decisions. Weed Sci. 2005, 53, 264–273. [Google Scholar] [CrossRef]
  17. Guisan, A.; Tingley, R.; Baumgartner, J.B.; Naujokaitis-Lewis, I.; Sutcliffe, P.R.; Tulloch, A.I.T.; Regan, T.J.; Brotons, L.; McDonald-Madden, E.; Mantyka-Pringle, C.; et al. Predicting species distributions for conservation decisions. Ecol. Lett. 2013, 16, 1424–1435. [Google Scholar] [CrossRef] [PubMed] [Green Version]
  18. Balch, J.K.; Bradley, B.A.; D’Antonio, C.M.; Gómez-Dans, J. Introduced annual grass increases regional fire activity across the arid western USA (1980–2009). Glob. Chang. Biol. 2013, 19, 173–183. [Google Scholar] [CrossRef]
  19. Pettorelli, N.; Safi, K.; Turner, W. Satellite remote sensing, biodiversity research and conservation of the future. Philos. Trans. R. Society B: Biol. Sci. 2014, 369, 20130190. [Google Scholar] [CrossRef]
  20. Huang, C.-Y.; Asner, G.P. Applications of remote sensing to alien invasive plant studies. Sensors 2009, 9, 4869–4889. [Google Scholar] [CrossRef] [PubMed]
  21. Singh, K.K.; Davis, A.J.; Meentemeyer, R.K. Detecting understory plant invasion in urban forests using LiDAR. Int. J. Appl. Earth Obs. Geoinf. 2015, 38, 267–279. [Google Scholar] [CrossRef]
  22. Lefsky, M.; Cohen, W.; Parker, G.; Harding, D. Lidar remote sensing for ecosystem studies. BioScience 2002, 52, 19–30. [Google Scholar] [CrossRef]
  23. Levick, S.R.; Rogers, K.H. Structural biodiversity monitoring in savanna ecosystems: Integrating LiDAR and high resolution imagery through object-based image analysis. In Object-Based Image Analysis: Spatial Concepts for Knowledge-Driven Remote Sensing Applications; Blaschke, T., Lang, S., Hay, G., Eds.; Springer-Verlag: Berlin, Germany, 2008; pp. 477–492. [Google Scholar]
  24. Levick, S.R.; Baldeck, C.A.; Asner, G.P. Demographic legacies of fire history in an African savanna. Funct. Ecol, 2014, 29, 131–139. [Google Scholar] [CrossRef]
  25. Adams, V.M.; Setterfield, S.A. Optimal dynamic control of invasions: Applying a systematic conservation approach. Ecol. Appl. (in press).
  26. Popescu, S.C.; Zhao, K. A voxel-based lidar method for estimating crown base height for deciduous and pine trees. Remote Sens. Environ. 2008, 112, 767–781. [Google Scholar] [CrossRef]
  27. Asner, G.P.; Levick, S.R.; Kennedy-Bowdoin, T.; Knapp, D. E.; Emerson, R.; Jacobson, J.; Colgan, M.S.; Martin, R.E. Large-scale impacts of herbivores on the structural diversity of African savannas. Proc. Natl. Acad. Sci. USA 2009, 106, 4947–4952. [Google Scholar] [CrossRef] [PubMed]
  28. Levick, S.R.; Asner, G.P. The rate and spatial pattern of treefall in a savanna landscape. Biol. Conserv. 2013, 157, 121–127. [Google Scholar] [CrossRef]
  29. Lee, A.C.; Lucas, R.M. A LiDAR-derived canopy density model for tree stem and crown mapping in Australian forests. Remote Sens. Environ. 2007, 111, 493–518. [Google Scholar] [CrossRef]
  30. Asner, G. Hyperspectral remote sensing of canopy chemistry, physiology and diversity in tropical rainforests. In Hyperspectral Remote Sensing of Tropical and Sub-Tropical Forests; Kalacska, M., Sanchez-Azofeifa, G.A., Eds.; Taylor and Francis Group: Oxford, UK, 2008; pp. 261–288. [Google Scholar]
  31. Asner, G.P.; Levick, S.R. Landscape-scale effects of herbivores on treefall in African savannas. Ecol. Lett. 2012, 15, 1211–1217. [Google Scholar] [CrossRef] [PubMed]

