
Definitions and Mapping of East African Wetlands: A Review

1
Remote Sensing Research Group (RSRG), University of Bonn, Meckenheimer Allee 166, 53115 Bonn, Germany
2
Remote Sensing Centre, Department of Science, Information Technology and Innovation, Ecoscience Precinct, Level 2B West, 41 Boggo Road Dutton Park, GPO BOX 5078, Brisbane, QLD 4102, Australia
3
Center for Remote Sensing of Land Surfaces (ZFL), University of Bonn, Walter-Flex-Str. 3, 53113 Bonn, Germany
*
Author to whom correspondence should be addressed.
Remote Sens. 2015, 7(5), 5256-5282; https://doi.org/10.3390/rs70505256
Submission received: 12 January 2015
/
Revised: 13 April 2015
/
Accepted: 20 April 2015
/
Published: 27 April 2015
(This article belongs to the Special Issue Towards Remote Long-Term Monitoring of Wetland Landscapes)
Abstract
:Wetlands provide invaluable ecosystem services and contribute significantly to food security around the world. To maintain these functions, wetlands need to be protected from rapid transformation and overuse. Spatially-explicit information is required for sustainable wetland management. Development of wetland maps based on remote sensing requires a clear-cut definition of wetlands. This review was undertaken to improve the understanding of these habitats from a remote sensing perspective and to determine available wetland map layers for the East African countries of Kenya, Rwanda, Tanzania and Uganda. This study includes three components: (1) a review of the availability and types of wetland definitions from the scientific literature record (including 245 separate references); (2) a systematic analysis of land use/land cover classifications and the conceptual approaches and spatial coverages of wetland classes for each system; and (3) a depiction of wetland layers and a discussion of their suitability for use in regional inventories. Our literature review shows that a standard definition of wetlands is not in use, and a specific definition of wetlands is not given in more than 40% of the reviewed remote sensing publications. Spatial information on East African wetlands is currently insufficient for use in regional wetland management.
1. The Wise Use of East African Wetlands and the Need for Spatial Data
In 2005, the World Resources Institute produced the Millennium Ecosystem Assessment Report on Wetlands and Water [1]. This document states clearly that wetlands are an important ecosystem resource in multiple dimensions. Complex wetland ecosystems provide “…services vital for human well-being and poverty alleviation…”, including essential freshwater and energy resources [2], regulation of hydrologic regimes and climatic processes and soil erosion control. The report estimates that the annual combined global value of wetlands, tidal marshes and swamp ecosystem services is US$ 44,355 ha−1 year−1. When compared to the values estimated for forest ecosystems (US$ 3,278 [3]), the critical importance of wetlands to local communities and economic systems becomes obvious. In a 2001 study examining wetlands in Kenya, Thenya [4] characterized them as “…among (Kenya’s) most important resources for social-cultural and economic development.”
An important dimension of food security is food production [5], to which wetlands can and do contribute [6]. Inland wetlands in particular are vital for food supply; important to both agricultural production and fisheries [1]. This is especially relevant to East Africa, a region that has an extensive and acute history of food security crises. The situation in the region is considered to be serious and ongoing, with severe micronutrient deficiency present among children [7], although the International Food Policy Research Institute’s (IFPRI) Global Hunger Index currently shows slight improvements. At the end of 2014, food aid agencies were preparing for another drought in East Africa. Drought impacts regional food production negatively [8] and intensifies pressure for uncontrolled use of wetlands. The available water and associated fertile soils typically found in wetland environments provide excellent resources for local farmers. As a result, wetlands are endangered [9], with land conversions, water withdrawals and overuse critical factors in wetlands conversion or destruction. It is estimated that globally, more than 50% of wetlands were lost during the twentieth century [1]. Climate change and the associated coping strategies of affected people are expected to exacerbate this trend in Africa [10].
The 1971 Ramsar Convention on the Wise Use of Wetlands (implemented by the Ramsar Convention Secretariat and commonly referred to as the Ramsar Convention), defines wise use of wetlands as “…the maintenance of their ecological character, achieved through the implementation of ecosystem approaches, within the context of sustainable development” [11]. If human claims to wetlands are to be effectively balanced against wetland ecosystem protection, spatially-explicit information is vital.
Whereas local people might be well aware of the availability, extent and change in wetlands, institutional stakeholders need systematic and precise spatial information [12]. Reliable and comprehensive spatial data that are consistent across political boundaries can support agencies in wetland management and protection. The Ramsar Convention encourages research in the quantification of wetlands to obtain baseline information for future monitoring activities [13]. Wetland researchers having accurate information about wetland location and extent can enhance their focus on relevant study sites, extrapolate findings from case studies and “…undertake effective research” [14].
Our motivation for this review is the need for an up-to-date, regionally-consistent wetland map for East Africa and to provide basic information that can help with developing it through remote sensing technology. We have identified four fundamental requirements of such a map.
- ▪
- Cross-border alignment to avoid discontinuities within the East African region,
- ▪
- Comprehensiveness (within the constraints of the spatial resolution in reference to the pixel size of the sensor used),
- ▪
- A thoroughly documented methodology, and
- ▪
- Quality assessment based on ground truth or very high-resolution data.
We argue that these map requirements can best be met by the application of remotely-sensed data and their analysis. A proposed data analysis scheme is provided in Section 4.
The trans-boundary regional focus of a wetland map is important, because mechanisms to share information, including a common understanding of wetlands, support stakeholders in monitoring and protecting these endangered ecosystems [15]. Water moves across borders, and political decision processes on water-influenced ecosystems, like wetlands, can only be improved by regional cooperation [16]. The GlobE Wetlands project is a collaborative research effort between East African and German partners that was initiated in 2013 [17]. As part of the GlobE-Securing the Global Food Supply initiative, this project is funded by the German Federal Ministry of Education and Research. Twenty partnering institutions from Kenya, Rwanda, Tanzania, Uganda and Germany work in an interdisciplinary partnership. The team aims to reconcile future food production with environmental protection by learning more about wetlands and promoting the wise use of these environments among decision makers and stakeholders in the East African region (Kenya, Rwanda, Tanzania and Uganda). The project aims to overcome the information gaps that exist between scientists and wetland managers [15] through the compilation of an international public wetland database and by fostering and sustaining close collaboration with decision makers in the institutional environmental sector on the ground. The nations of Kenya, Rwanda, Tanzania and Uganda are participants in the program and are therefore referred to in the material that follows as the East African region. Addressing this region for wetland research is of high interest due to the strong environmental gradient from sub-humid to semi-arid climatic regions that exists here. Within this transect, we find highly diverse geomorphological settings and seasonal patterns of vegetation growth. Therefore, wetlands develop in different formations, and reporting on different wetland types is essential to the research project.
Two fundamental questions are addressed in this literature review:
- ▪
- “How are wetlands defined?” and
- ▪
- “Do wetland maps of the East African region exist and can they be improved by means of remote sensing?” This second question is addressed within the contexts of global, continental (African) and national maps.
A comprehensive methodological review of wetland remote sensing is already provided by Ozesmi and Bauer [18]. Our study therefore does not emphasize analytic methods, but rather examines the availability of spatial data relevant to wetland environments and is focused on the East African region.
2. Literature Review
2.1. Our Methodological Approach
An analysis of 245 scientific references was performed in the search for a generally applicable definition for the term wetlands. The principal sources for these references were peer reviewed journals focused on remote sensing, including some of the highly contributing journals, like Remote Sensing, International Journal of Remote Sensing, Remote Sensing of Environment and Photogrammetric Engineering and Remote Sensing. Furthermore, journals, like Wetlands Ecology and Management, Vegetation and Wetlands, were incorporated to consider definitions coming from a non-remote sensing perspective. The selected journal articles were identified via Google Scholar© on diverse keyword searches. As wetlands are referred to with manifold terminologies (see the next section), keyword searches were not limited to wetlands only. We searched for terms like floodplain, swamp and mires and subsequently used reference lists of the identified literature for additional sampling of the literature. Non-peer reviewed wetland-related publications issued within the East African region, as well as scientific monographs or important wetland publications by international institutions were also examined. These were reviewed at the online library facilities of the University of Bonn. Additional important national and international programs on wetlands were incorporated, even if only online resources were available. They could be found via customary search engines after the identification in the relevant specialized literature. Our literature search was not limited to publication years and covered a range between 1971 and the end of 2014. Literature focusing solely on water surface detection was excluded from the analysis, as it could often only be indirectly linked to wetland research (e.g. [19,20,21,22]). An analysis of the availability of wetland definitions in scientific publications and a classification matrix for applied definitions within their study context are discussed in Section 2.2. The detailed grouping and a list of all used references for this analysis can be found in the supplement accompanying this review article.
Our approach to researching the availability of wetland maps included two elements. Land use/land cover classification systems were initially evaluated for their utility in wetland mapping, for which we provide an overview of existing wetland maps and data layers covering the East African region. Wetland inventories of the East African region were identified with the advice of the partnering researchers within the countries. We catalogue and describe available wetland maps covering the East African region at global, continental and national spatial scales.
2.2. Review of Wetlands Definitions
The term wetlands groups several types of moist environments that manifest in a wide range of landscape units [23]. According to the majority of the references examined, wetlands can be described as having conditions of soil or bedrock formation and hydrology in common that, together, cause and reflect the abundance of water over a time span sufficient to support internally diverse natural (riparian) vegetation that differs from the surrounding uplands.
This definition reflects the three core components of wetland formation: hydrology, soils and vegetation [24]. Aside from these fundamental elements, wetland environments display immense variation over the globe and many “…have more in common with non-wetland habitats than with each other” [25]. In addition, wetland surface covers may be internally spatially fragmented and temporally variable [26]. Wetlands are azonal ecosystems present throughout the world, and their formation is not primarily conditioned by climate [27]. At a global level, however, wetland surface area and expression are dependent on climatic zones [24,27,28,29,30,31], and wetland nomenclature and descriptors differ according to region and language [32].
A comprehensive understanding of wetlands must be established along with a common, uniformly applicable definition of wetlands if these environments are to be protected and conserved throughout the world. Great regional variation is seen throughout the world in perception, understanding and description of different wetland environments, and linguistic barriers are a hindrance in wetland research. Table 1 provides an excerpt and an exemplary grouping of different wetland terms as given by Mitsch and Gosselink [24].

| Term Group | Term | Term Description |
|---|---|---|
| Term that groups wetlands globally | wetland | Internationally used term for wet areas. |
| Terms frequently used synonymously with wetlands | swamp | Used similarly to wetlands, but in the U.S. is dominated by trees or shrubs and in Europe refers to forested fens or wetlands dominated by reeds. |
| marsh | Continually inundated wetland. In Europe, with a mineral soil substrate without accumulated peat-soil. | |
| Terms related to wetlands at seashore lines | delta | A wetland-river-upland system where rivers merge with the sea (not the case in inland deltas). |
| lagoon | Term used frequently in Europe for delta-like systems. | |
| Terms related to wetlands at seashore lines with saline-tolerant vegetation dominant | mangrove | (Sub) tropical ecosystems developing in coastal areas, related to saltwater; also used as a term for plants developing in saline wet systems. |
| mangal | Similar to mangroves. | |
| Terms referring to wetlands accumulating peat | mire | European term for peat-accumulating wetlands. |
| mose | Danish and Swedish version of mires. | |
| moor | European term for peatlands. Highmoor = raised bog; lowmoor = peatland in a depression. | |
| peatland | Term for wetlands accumulating peat. | |
| fen | Peat-accumulating wetlands, marsh-like vegetation. | |
| bog | Peat-accumulating wetlands with sphagnum-dominated vegetation. | |
| Terms related to wetlands without pronounced stream in-/out-flow | dambo | Seasonally waterlogged, stream-like grass-covered linear depression. |
| vleis | Southern African term for dambo. |
The diversity in wetland terminology is described as useful in understanding subtle differences among the diverse wetlands ecosystems found in different locales by Mitsch and Gosselink [24], although the authors also emphasize that the diversity of terms and the lack in standardization can be confusing for the international scientific community [24]. The need to harmonize knowledge about and understanding of wetlands is critical for large-scale, cross-border inventories. In his discussion of wetland definitions, Lewis states that “…some critical words can be interpreted by the application of common sense” [33]. This is questionable in the case of cross-boundary consistent maps, as notions of common sense may differ among interpreters from different cultures speaking different languages. Ideally, a definition should be precise and avoid vague terms, like normally or many times, which lead to broad interpretation. Where a definition may form the basis for legally-binding decisions (e.g., the protected area of a wetland, which carries use restrictions), imprecise formulations should be avoided. Concise definitions are also vital in the application of remote sensing for large-scale land use/land cover inventories. Automated decision-rule classifiers require unambiguous definitions and descriptors to allow accurate identification and unequivocal partitioning of landscape units.
The process of delineating wetlands from uplands is also inherently linked to a wetland’s definition. Semeniuk and Semeniuk [28] show that wetlands need to be demarcated relative to the environments in which they are manifest. Here, the question of scale is of interest. A regional or worldwide map that includes climatic gradients and diverse wetland types and formations must incorporate a definition that is valid in all relevant environmental settings. In contrast, a local wetland may be separated from the neighbouring upland by a less complicated interpretation of land surface data (particularly relative to wetland/upland surface moisture condition).
Soil water moves along hydrostatic pressure gradients [34]; this is reflected in wetlands’ dynamic surface gradients and complicates the question of wetland boundaries. Wetlands typically develop in shallow ground [35,36], and slight changes in soil water availability can cause substantial changes in wetland extent. Many parts of wetlands undergo seasonal saturation and desiccation, as they are located in transition zones between permanently dry uplands and the permanent aquatic surfaces of lakes, ponds or rivers. Some authors define wetlands exclusively by the feature of the dynamic change in water availability (e.g., [37,38,39]). Semeniuk and Semeniuk [28] proposed that the “…boundary of a wetland should encompass all that terrain that conforms to the definition of a ‘wet land’”, including seasonally-inundated and seasonally-waterlogged zones. However, it should be understood that concise wetland boundaries, “…immovable (and) sharply defined on paper and on the ground…” are a “…legal fiction” [25]. For this reason, legally-binding, jurisdictional wetland boundary delineations will continue to require case-specific, high-resolution in situ ancillary data that cannot be provided by mapping efforts conducted solely using remote sensing techniques [40].
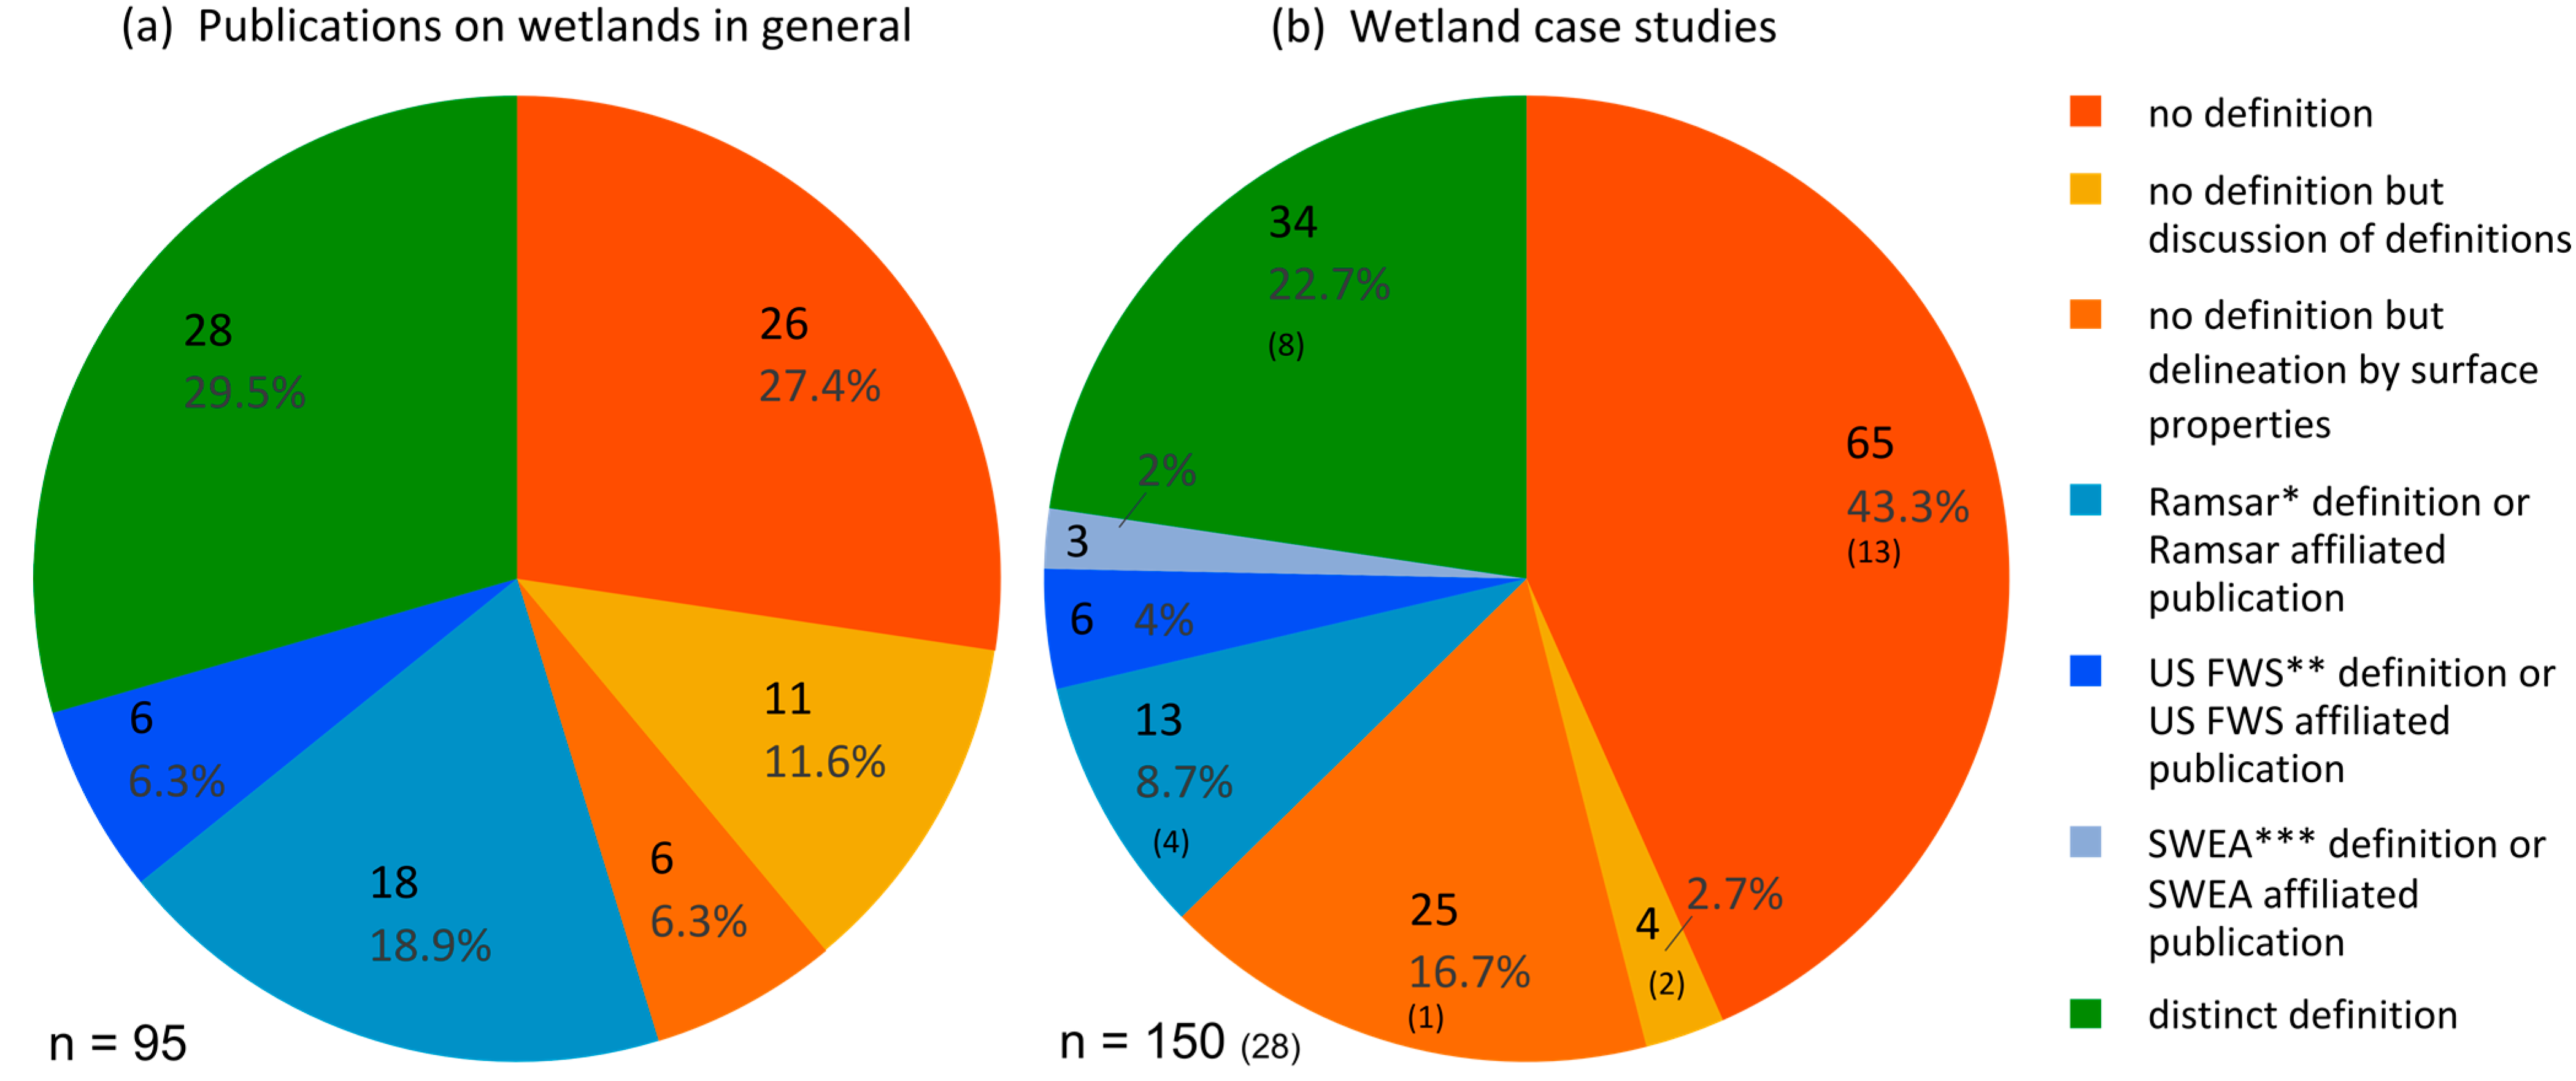
The definition and delineation of wetlands are controversial issues, and this is reflected in the scientific literature on the topic. Figure 1 summarizes our examination of the wetland literature regarding the ‘applied’ definitions of wetlands.
Figure 1a groups literature as publications on wetlands in general and consists mainly of monographs on wetlands and global-scale wetland studies. Figure 1b includes literature that documents studies of wetland analysis methodologies or those that are focused on applications smaller than the global scale, designating these works as wetland case studies. This quantitative analysis confirms that a high proportion of literature related to wetlands, especially remote sensing-based case studies, includes no, or only an indirect, definition of the land cover class of interest. This supports Finlayson and Spiers [13], who critically observed that “…only 30% of (wetland inventory) sources defined the wetlands they covered, and for over one-third (34%), no definition could even be inferred from the material presented.”
Figure 1.
Quantitative analysis of wetland definitions reflected in publications on wetlands in general (a) and in case studies on wetlands (b). Figures shown in brackets in the right portion of the graphic refer to studies that are not specific to the field of remote sensing, but are important either for the GlobE Wetlands project or for general wetlands mapping. * Wetland definition of the Ramsar Convention on the wise use of wetlands [41]. ** Wetland definition of the United States Fish and Wildlife Service [23]. *** Wetland definition of the ‘Small Wetlands in East Africa’ Project [42].

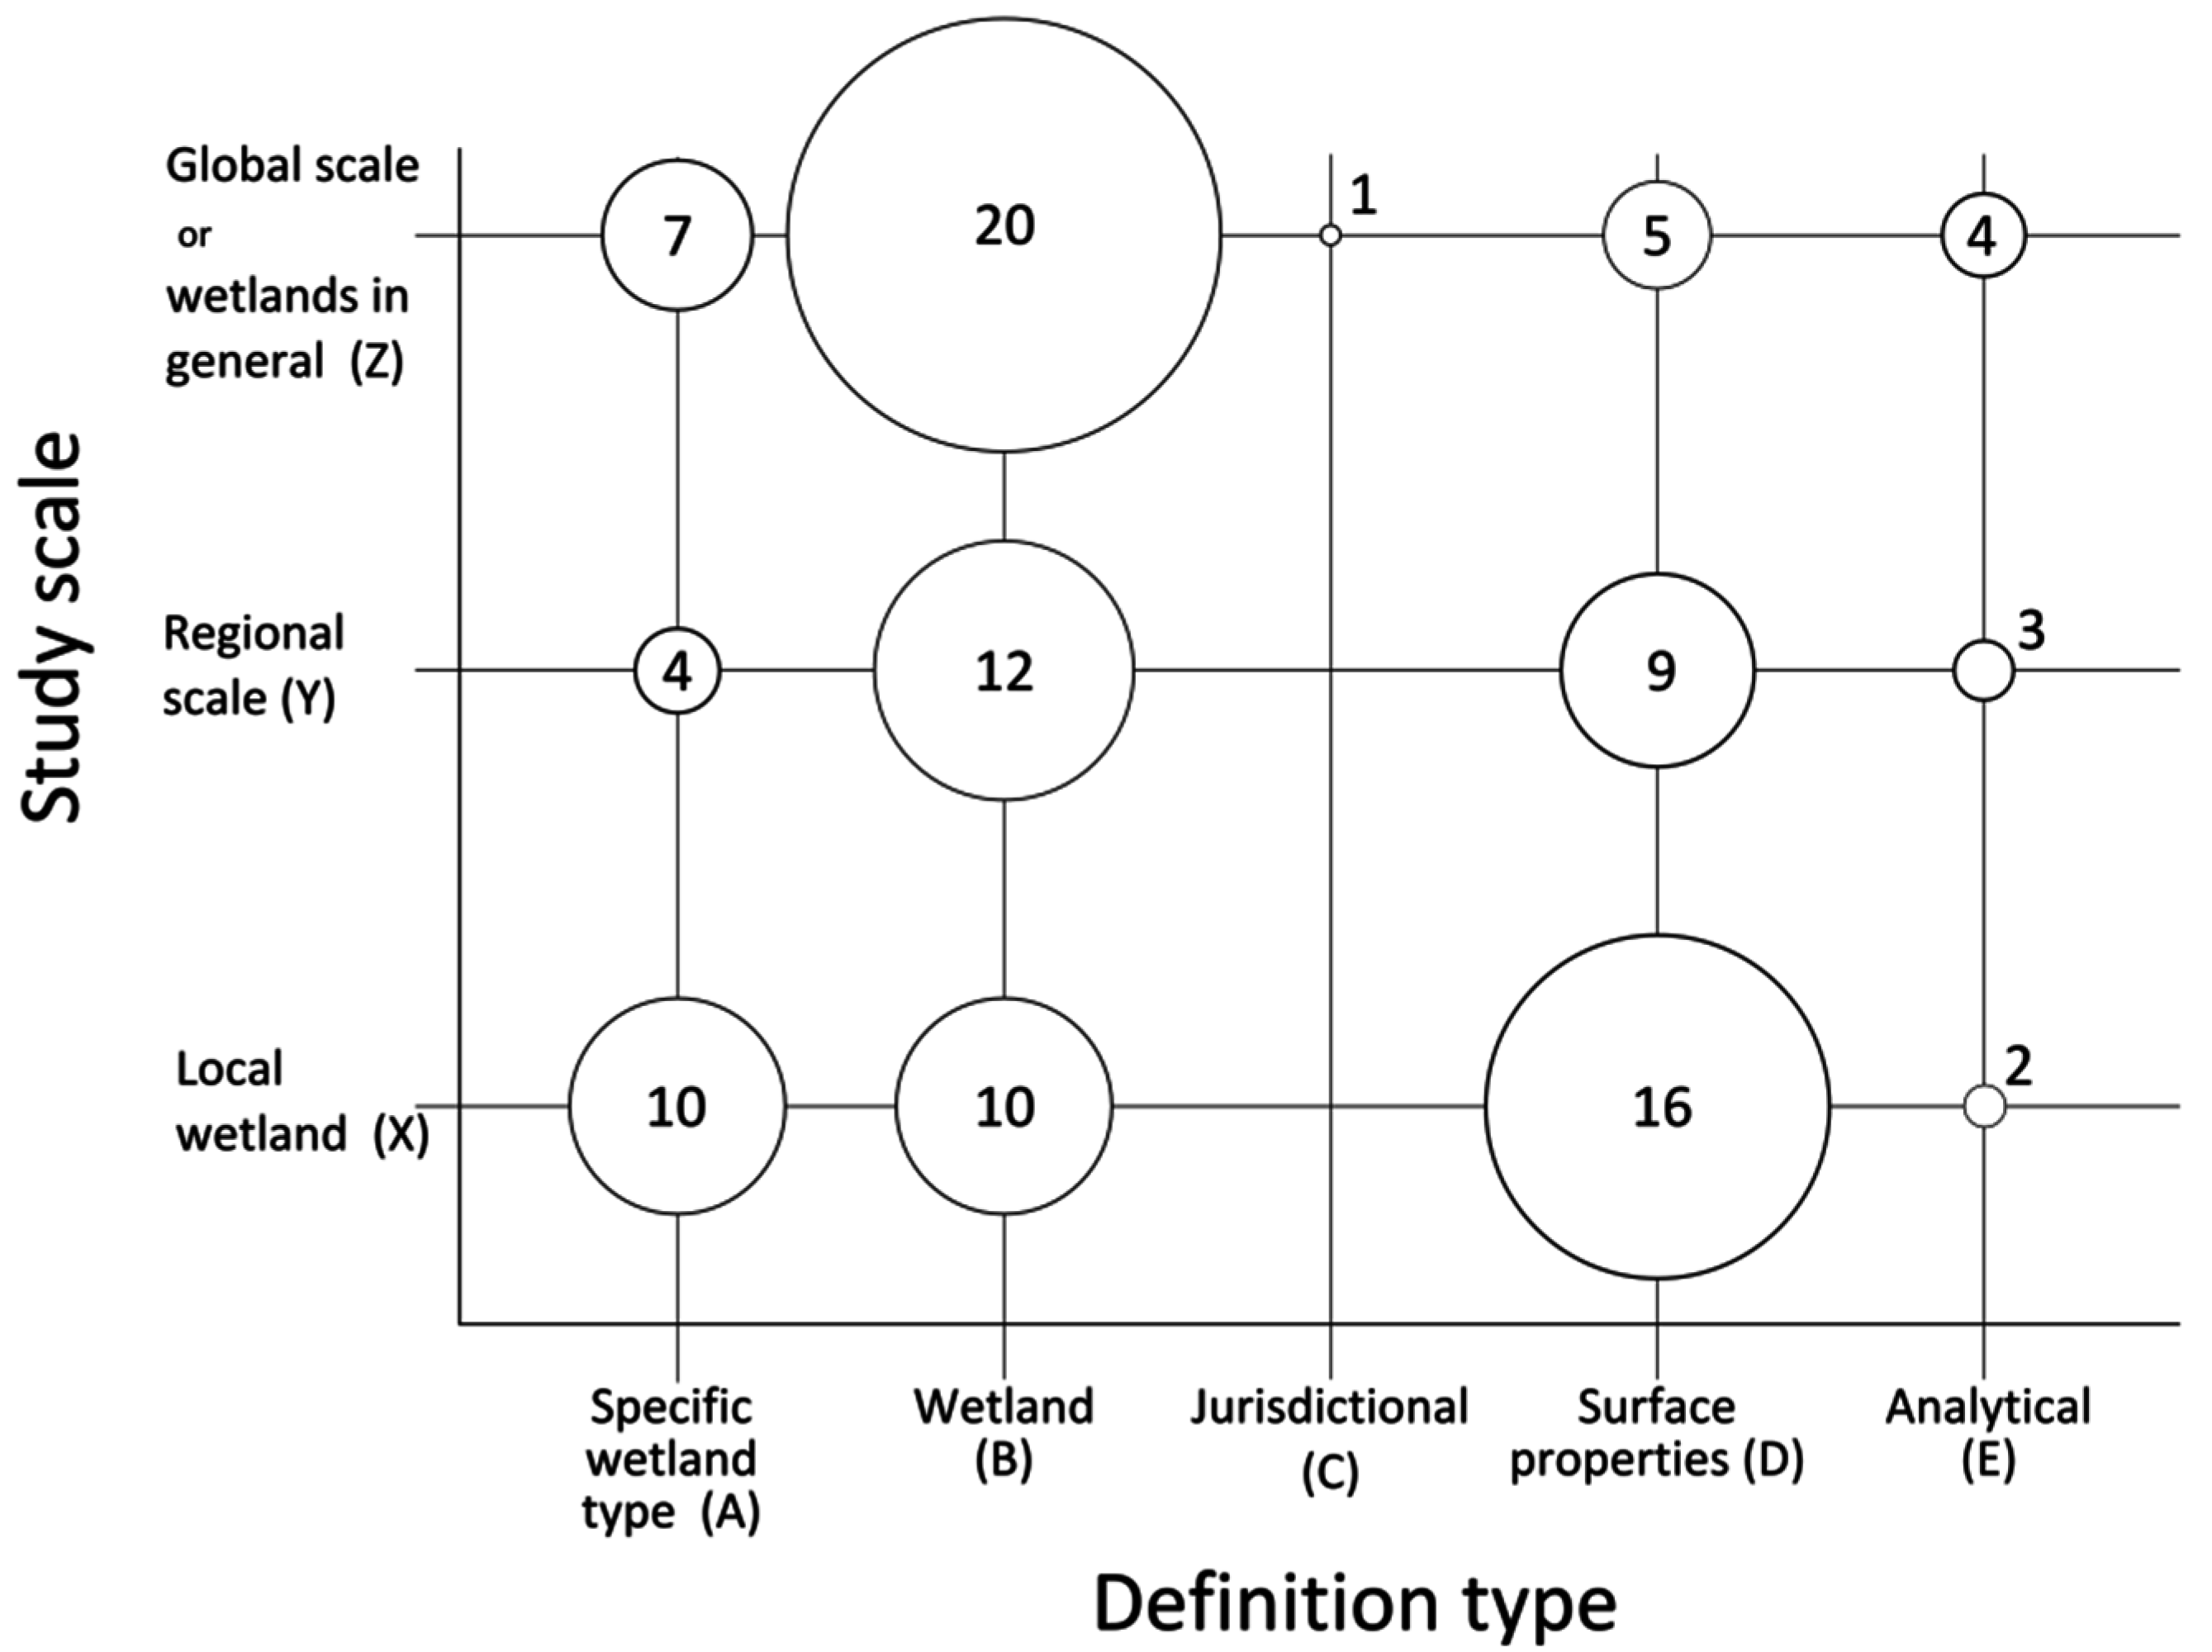
We used 245 references for the analysis discussed above. To better understand how these existing definitions of wetlands relate to specific applications, a classified matrix of definitions was compiled (Figure 2). From the 245 references, 103 different definitions of wetlands were identified and classified. These definitions are plotted by theme and study spatial scale. Case examples are shown in Table 2. Definitions A, B and C are considered as concise definitions for specific surfaces under study. These three groups include over 60% (64/103) of all identified definitions. A definitions are not comprehensive, as only a wetland subtype (e.g., mires, floodplains, etc.) is defined. B and C are considered as definitions appropriate for wetlands mapping.
One of the most important wetland definitions was formulated at the Ramsar Convention:
“(W)etlands are areas of marsh, fen, peatland or water, whether natural or artificial, permanent or temporary, with water that is static or flowing, fresh, brackish or salt, including areas of marine water the depth of which at low tide does not exceed six metres.”.[41]
This definition is applied internationally and at all spatial scales (X, Y and Z in Figure 2).
D and E comprise cases where surface properties, typically vegetation or land cover groups of wetlands or analytical identification of wetlands are applied. These cannot be regarded as valid definitions of wetlands, but rather serve as surrogates. The inductive approach of these studies presents a delineation of wetlands based on analytical results, but does not provide a holistic understanding of what wetlands are. As shown in Figure 2, such cases appear frequently in remote sensing case studies.
Figure 2.
Wetland definitions as identified in the literature analysis. The sizes of circles inside the matrix reflect the number of definitions grouped in each class. Table 2 provides classification descriptions.
Figure 2.
Wetland definitions as identified in the literature analysis. The sizes of circles inside the matrix reflect the number of definitions grouped in each class. Table 2 provides classification descriptions.

Table 2.
Summary of wetland definitions as plotted in Figure 2. Letters A–E indicate the thematic group relevant to each definition; X, Y and Z values indicate the scale of each study (X = local scale; Y = regional scale; Z = global scale or wetlands in general).
| Matrix Attribution | Exemplary Description of Wetland Definition |
|---|---|
| AX | One specific subtype of a wetland; e.g., Taieri River catchment upland bogs [43]. |
| AY | A specific wetland subtype is considered in a region; e.g., Amazon floodplains [44]. |
| AZ | A specific wetland subtype is considered, e.g., dambos [45]. |
| BX | A specific wetland on a local case study, e.g., wetlands in Poyang Lake National Nature Reserve [46]. |
| BY | Wetlands of a region, e.g., Canadian wetland classification [47]. |
| BZ | Wetlands in general are discussed, e.g., [41]. |
| CZ | A legally-binding wetland definition, ideally applicable in wetland protection measures, e.g., potential jurisdictional wetlands [40]. |
| DX | A specific wetland characteristic is identified via its surface properties, e.g., inundated area [48]. |
| DY | Wetlands in a region are defined via their surface properties, e.g., surface water in the Soudan-Sahel region [49]. |
| DZ | Wetlands are defined via surface properties, e.g., plant stress signs [50]. |
| EX | One wetland is studied, and the results of the analysis enable delineation of wetland and upland classes, e.g., shallow marine water and irrigated land in the Pearl River estuary [51]. |
| EY | Land cover classes of wetlands in a region are classified and later separated from uplands, e.g., seasonally-inundated forests and savannahs in the Amazon Basin [52]. |
| EZ | Wetland land cover classes are separated from upland land cover classes, e.g., [31]. |
The quantitative review of wetland definitions indicates that numerous studies omit an explicit definition of the land cover under study. If definitions are available, the issue of standardization remains. In 2010, Mwita [53] critically addressed the Ramsar Convention wetlands definition as “…too broad”, further stating that scientists “…have tended to define wetlands according to their needs” and, hence, to the specific objectives of the conducted wetland studies. The lack of consistency therefore results from the reality of wetlands as a heterogeneous land cover, and their “…complex interrelationships of hydrology, soils, and vegetation” [54] require flexibility instead of a restrictive concept of a man-made land cover class grouping.
2.3. From Land Use/Land Cover Classification to Class-Specific Inventory: The Rationale of Wetland Mapping
The compilation of coarse/medium spatial resolution regional and global land use/land cover classifications (LUCs) utilizing optical satellite data began when the NOAA-AVHRR sensor system became operational in the 1980s. Table 3 lists important LUCs that have been generated since that time, principally using optical satellite data and classification schemes.
Table 3.
Land use/land cover classification (LUC) systems compiled with remote sensing data relevant to wetland classes. GLC2000, Global Land Cover 2000.
| Publication (LUC Name) | Input Data | Coverage | Spatial Resolution/Scale | Wetland Class(es) Available? | Remark | |
|---|---|---|---|---|---|---|
| UNESCO Ecology and Conservation, 1973 [55] (UNESCO Land Cover) | n/a | Global | -- | Yes | Classification system for maps scaled 1:1,000,000 or smaller | |
| Matthews, 1983 [56] (Matthews Land Cover) | various | Global | 1° | No | ||
| Tucker et al., 1985 [57] | NOAA AVHRR | Africa | 4 km | No | ||
| Townshend et al., 1987 [58] | NOAA AVHRR | South America | 4 km | No | ||
| Loveland et al., 1991 [59] | NOAA AVHRR | United States | 1 km | Yes | ||
| Stone et al., 1994 [60] | NOAA AVHRR | South America | 1 km | Yes | ||
| DeFries et al, 1994 [61] | NOAA AVHRR | Global | 1° | No | ||
| De Fries et al., 1995 [62] | NOAA AVHRR | Global | 8 km | No | ||
| DeFries et al. 1998 [63] | NOAA AVHRR | Global | 8 km | No | ||
| Loveland et al., 1999 [64] Global Land-Cover Characterization (GLCC) | NOAA AVHRR | Global | 1 km | -- | Synoptic map product for the following 7 sub-products (classifications) | |
| Sub-products (GLCC) | Anderson et al., 1976 [65] (USGS Land Use/Land Cover) | Global | 1 km | Yes | These classification schemes are applied to the GLCC maps [64] | |
| Sellers et al., 1986 [66] (Simple Biosphere) | Yes | |||||
| Olson, 1994 [67] (Global Ecosystems) | Yes | |||||
| Running et al., 1994 [68] (Vegetation Lifeforms) | No | |||||
| Sellers et al., 1996 [69] (Simple Biosphere 2) | Yes | |||||
| Dickinson et al., 1986 [70] (Biosphere Atmosphere Transfer Scheme) | Yes | |||||
| Loveland et al., 2000 [71] (International Geosphere-Biosphere Programme, Data and Information Systems -IGBP DISCover) | Yes | |||||
| Bossard et al., 2000 [72] (Corine) | Landsat, SPOT | Europe | 1:100,000 | Yes | ||
| Hansen et al., 2000 [73] (University of Maryland—UMd land cover) | NOAA AVHRR | Global | 1 km | No | ||
| Food and Agriculture Organization of the United Nations (FAO), 2001 [74] (Global Agro-Ecological Zones) | Existing global layers | Global | 30 arc seconds | No | ||
| Olson et al., 2001 [75] (Terrestrial Ecoregions of the World) | Existing global layers | Global | -- | Yes | ||
| Friedl et al., 2002 [76] (MODIS Land Cover) | MODIS | Global | 1 km | Yes | ||
| Mayaux et al., 2003 [77] (GLC2000 Africa) | SPOT Vegetation | Africa (global also available) | 1 km | Yes | ||
| Bontemps et al., 2011 [78] (GlobCover 2009) | Envisat MERIS | Global | 300 m | Yes | ||
| FAO, 2012 [79] (Global Agro-Ecological Zones 2010) | Existing global layers | Global | 30 arc seconds | No | ||
| FAO, 2014 [80] (AfriCover) | Landsat TM | East Africa | 1:100,000/1:200,000 | Yes | ||
| Latham et al., 2014 [81] (Global Land Cover—GLC-SHARE) | Existing LUC layers and other information | Global | 30 arc seconds | No | ||
A wetland land cover class is frequently omitted in these classification systems [82]. One or more wetlands or similar class(es) is present in only 58% (15 of 26) of these schemes. This lack of precision regarding wetlands in LUCs results from a number of factors. Difficulties in the definition of wetlands on a global scale and lack of standardization hamper the merging of wetland types into a single classification scheme. The complexity of wetland systems [83] means that they may evolve in many different types of habitats, complicating their delineation from uplands. Cowardin et al. [23] maintained that “…(f)or example, wetlands and farmlands are not necessarily exclusive. Many areas that we define as wetlands are farmed during dry periods.” This is an example of how wetlands may be obscured by other land cover classes. Wetlands are quite likely to be concealed by other classes [82] and not identifiable in remotely-sensed data. The “optical complexity” of inland water surfaces described by Palmer et al. [84] hampers remote sensing analyses of wetland environments, which can be considered as a subgroup of inland waters. For these reasons, the absence of wetland categories in LUC systems is likely, especially if the specific land surface condition of seasonal or permanent wetness was not a focus of the mapping effort.
Darras et al. [85] attempt to include a wetland dataset in a global land cover classification scheme. To provide this complementary wetland inventory with the International Geosphere-Biosphere Programme (IGBP) Land Cover Dataset [64], existing available wetland layers were merged [30,71]. The outcome of this effort was a global grid map that indicated per-pixel percentages of cover by wetlands. The authors of the study emphasized that this product was considered an approximation and that contemporary global LUC systems likely underestimate the global extent of wetlands [85]. This product is a component of an LUC system, as well as a transition to a global wetland map and, therefore, is also included in Table 4.
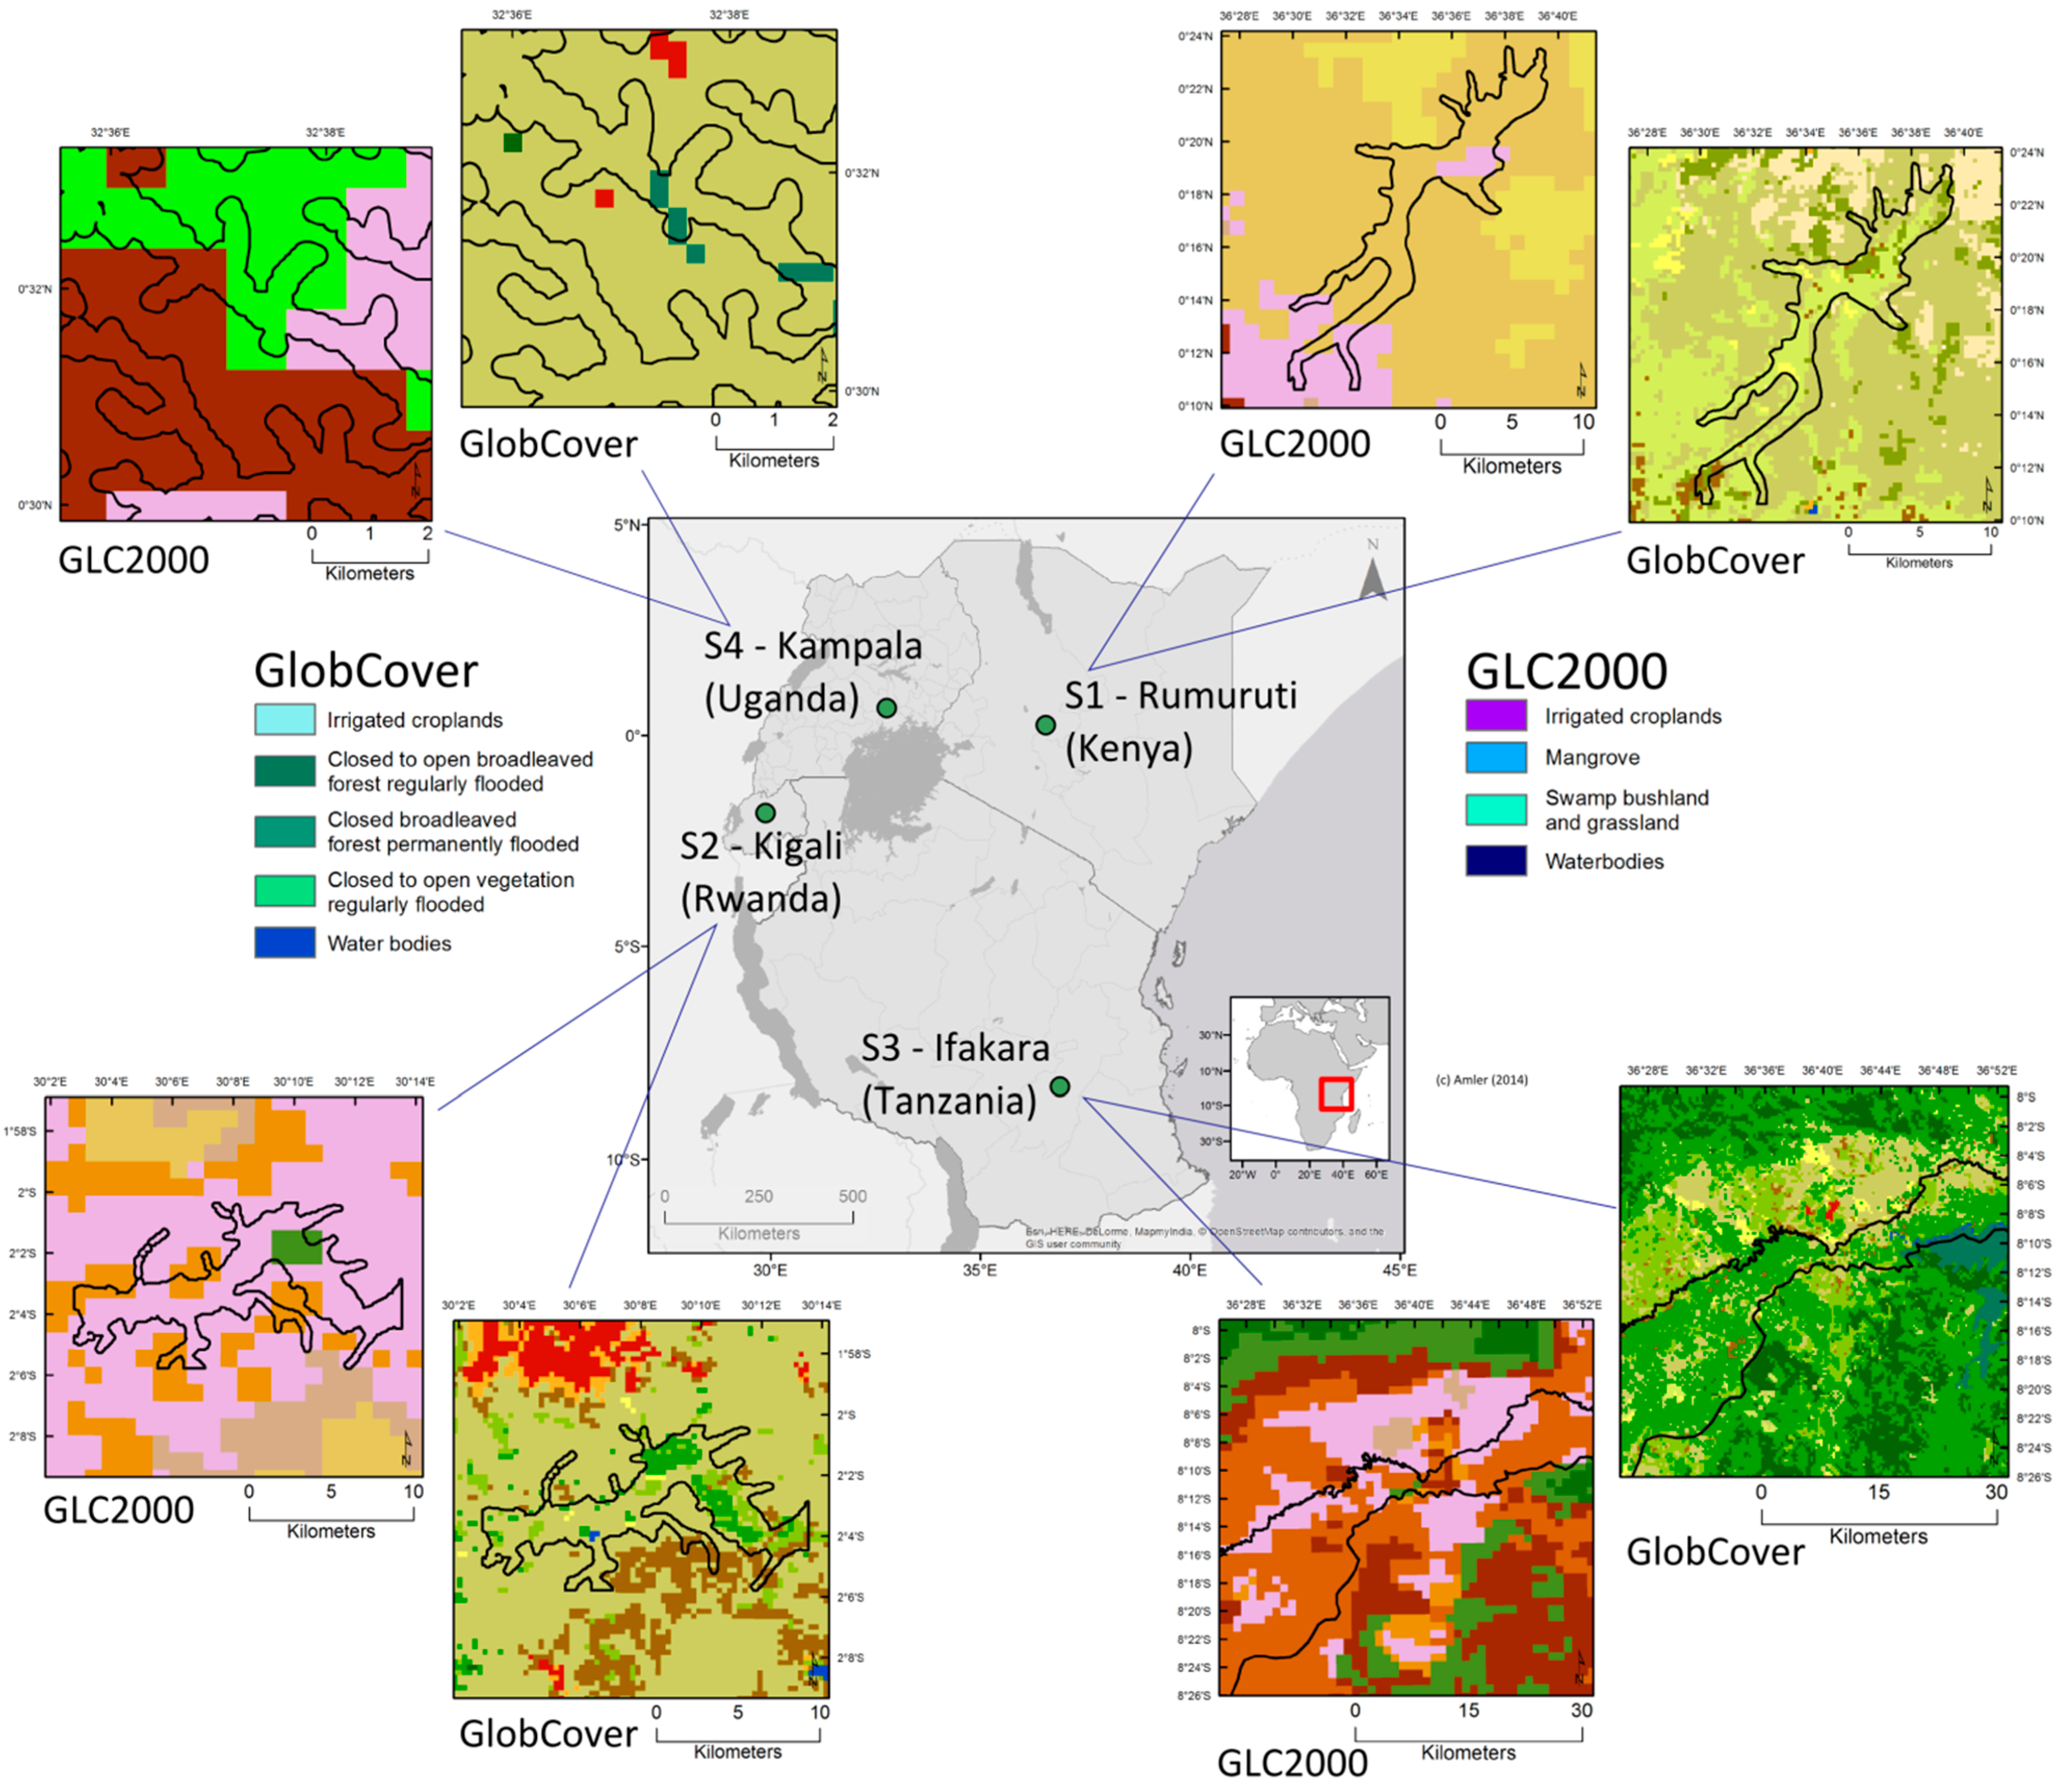
Supported by the Food and Agricultural Organisation (FAO), Di Gregorio and Jansen published Version 1.0 of the Land Cover Classification System (LCCS) in the year 2000 [86]. This LUC classification was used for the Global Land Cover 2000 project (GLC2000) [87], as well as for the GlobCover Project [78]. Although the system applies a dichotomous phase that explicitly separates terrestrial and aquatic or regularly-flooded classes, this differentiation is not directly reflected in the final data product. A limited assessment comparing the segments of the GLC2000 [77] and GlobCover [78] data layers that cover the four GlobE Wetlands test sites in East Africa is shown in Figure 3.
A lack of precision regarding wetlands in the LUC classification systems is reflected in these maps. The wetlands in the regions of interest are simply not mapped in the GlobCover and GLC 2000 products. This example demonstrates that, even if a wetland class is included in the classification scheme, the area and extent of wetland classes estimated in global LUC data products still may be underestimated. GlobCover’s spatial resolution is 300 m, and the classification was based on phenological metrics derived from Medium Resolution Imaging Spectrometer (MERIS) Bidirectional Reflection Distribution Function data [78]. The pixel size of the GLC2000 product is 1 km, and land cover classes were derived by multi-sensor classification. GLC2000 vegetation formations were derived from the SPOT Vegetation dataset, and flooded forests were identified using radar data [77]. The coarse resolution of the global LUC products was a limitation in wetland detection; fragmented wetland surfaces are often too small for the spatial resolution and mapping scale. This issue also becomes obvious in Figure 3, especially in the GLC2000 dataset with its large pixel size of 1 km.
Coarse- or medium-resolution LUCs provide insufficient information regarding the location and extent of wetlands and, thus, are not appropriate for use by scientists, decision makers or stakeholders responsible for wetland research, analyses, management or conservation. Wetlands therefore must be mapped separately. Such wetland maps that are relevant to the East Africa region are discussed in the following section.

2.4. Wetland Maps of the East African Region
2.4.1. The Contribution of Global Maps
Downing [89] contends that small, aquatic ecosystems are systematically ignored in global surveys, principally due to issues of scale rather than any lack of knowledge or awareness. The “small and fragmented nature of wetlands” [90] along with their diverse surface features are sources of underestimation in global wetland maps. As summarized in Table 4, substantial deviations in global wetland area estimates are repeatedly documented [24].
One of the most significant global wetlands data layers was produced in 2004 by Lehner and Döll [29]. It is part of a Global Lakes and Waterbodies Database that is publicly distributed by the World Wildlife Fund (WWF). This dataset is based on seven digital maps of the world, principally the 1993 ESRI Digital Chart of the World and the 1993 World Conservation Monitoring Center (WCMC) Wetlands Map. These data are represented in a 30-arc-second spatial resolution grid and combine spatial resources on different scales. Considering the difficulties in worldwide classification and validation of water bodies and wetlands by remotely-sensed data, the authors of this map do not rely solely on these data, but rather they collect information from “…existing lake and wetland registers, maps and databases” [29]. Most of the datasets used in this project are now more than twenty years old. Due to extensive losses in wetlands globally [27,91] and the disparity among wetland area estimates, an update would be of significant value to wetland researchers and global climate modellers [92]. The controversy and difficulties of scale in global wetland area estimation are obvious when reviewing comments regarding the Lehner and Döll dataset. Zomer et al. [2] observe that, while the task of developing a global wetland inventory is difficult and this dataset is based on the best available data, it is insufficient for regional or local wetland management. However, the dataset is also called the “…most detailed…inventory…in the past 20 years and maybe the most accurate” [24].
| Publication (Map Title) | Knowledge Base | Content | Spatial Resolution | Wetland Classes | Estimated Global Wetland Area | ||
|---|---|---|---|---|---|---|---|
| Gore, 1983 [93] * | From various sources and approximate only | % of mire area in a map zone | n/a | None | No estimate given | ||
| Matthews and Fung, 1987 [30] * and Matthews et al., 1991 [94] * | Digital global vegetation data, digital global soil properties, digital global fractional inundation + land use database, FAOstat, rice cropping calendars | Wetlands fraction per grid cell + annual rice harvest area per grid cell | 1° × 1° | 5 wetland classes + rice harvest areas | Approximately 526 M ha wetlands + approximately 148 M ha rice fields | ||
| Aselmann and Crutzen, 1989 [31] * | Diverse literature and remote sensing data | Freshwater wetlands and rice paddies | 2.5° latitude × 5° longitude | 6 wetland classes + rice paddies | Approximately 570 M ha + 130 M ha | ||
| Dugan, 1993 [27] * | Based on a series of regional wetland directories compiled by the International Union for Conservation of Nature (IUCN) | Wetland areas | n/a | Diverse, depending on regional classification | Approximately 560 M ha | ||
| Mitsch, 1994 [32] * | Diverse, including [27,93] | Estimated global extent of wetlands | n/a | None | Approximately 700 M ha up to 800 M ha | ||
| Finlayson and Spiers, 1999 [13] (Global Review of Wetland Resources and Priorities for Wetland Inventory - GroWi) | Compiled from national inventories | Wetland area estimates of national inventories | n/a | Depending on region/country | Approximately 1.2 B ha | ||
| Darras et al., 1999 [85] * (IGBP DISCover) | Existing global wetlands classes in land cover classifications | Gross estimation % wetland coverage of each grid cell | 1° | None | Approximately 954 M ha | ||
| Kaplan, 2002 [35] * | Digital elevation model | Potential natural wetlands | n/a | None | Approximately 1.1 B ha | ||
| Lehner and Döll, 2004 [29] * | Remotely-sensed data and other existing information | Wetlands of the world | n/a | 10 (including ‘river’ class) | Approximately 821 M ha up to 1 B ha | ||
| Ramsar Convention Secretariat, 2014 [95] | List of wetlands of international importance | Wetland location and extent | n/a | 42 wetland classes [96] | Approximately 209 M ha (registered as designated Ramsar sites) | ||
* Spatially-explicit dataset, global wetland map available, not necessarily in digital mode.
Table 4 shows existing global wetland datasets and the variety in area estimation of global wetland maps and catalogues. Wetland area estimates differ by more than 100%, ranging between 5.6 × 10⁸ ha [27] and 1.2 × 10⁹ ha [13].
At this date, no global dataset of wetlands exists that is compiled solely through the use of satellite remote sensing data. However, researchers supported by NASA currently are compiling a global inundated areas dataset using spaceborne microwave data [97]. The remotely-sensed global inundation products resulting from this work have the potential to provide estimates of global wetland areas. Selected inundation data layers, including coverage of the state of Alaska, are now complete and available. A complementary time series of coarse resolution (~25 km) global inundation is also available online via NASA’s Jet Propulsion Laboratory homepage [97]. From this effort, interactive inundation time series data are available globally, again via web access at the Alaska Satellite Facility [98]. Comparing this map to the GlobE Wetlands project test sites leads to the conclusion that the Alaska Satellite Facility dataset does not reliably depict wetlands.
In another wetland mapping effort, Fluet-Chouinard et al. [99] have utilized a downscaling approach to integrate global land use/land cover estimates with the Lehner and Döll Global Lakes and Wetlands Database. The high-resolution global inundation map generated in this study is currently available to users [99]. We consider inundation to be an important proxy for wetland formation, and the datasets described here can be expected to significantly support future wetland mapping efforts.
2.4.2. The Contribution of Continental Maps
Wetland inventories of the African continent can provide information at a national level and may also contribute to global maps. Hughes and Hughes [100] compiled an important and extensive inventory of African wetlands by reviewing maps, surveys and literature, with additional critical information provided by authorities and experts from individual countries. This directory provides detailed descriptions of wetlands and their host countries and environments, but the authors state clearly that areal estimates are only approximations [100]. This publication was produced in 1992 and now must be considered as historical material. Within the FAO context of agro-ecological zones (see again Table 2), African wetlands are characterized by the distribution of the specific soil types included in the FAO/UNESCO Soil Map of the World [101]. However, although the distribution of potential wetland soils might serve as an indicator for the presence of floodplain wetlands, it must be considered as a coarse proxy of wetland areas on the continent. The International Union for Conservation of Nature (IUCN) has also produced a wetland dataset consisting of a map of the African continent [102]. Major African floodplains are mapped in this dataset, and their total area is estimated at approximately 3.1 × 10⁷ ha. The dataset consists only of major floodplains; for example, the Kilombero floodplain in Tanzania (which is a Ramsar site of 796,735 ha in extent) [95] does not appear in the IUCN dataset. The total area estimation of this dataset must therefore be considered as incomplete, likely due to the large size of the study area.
2.4.3. The Contribution of National Maps
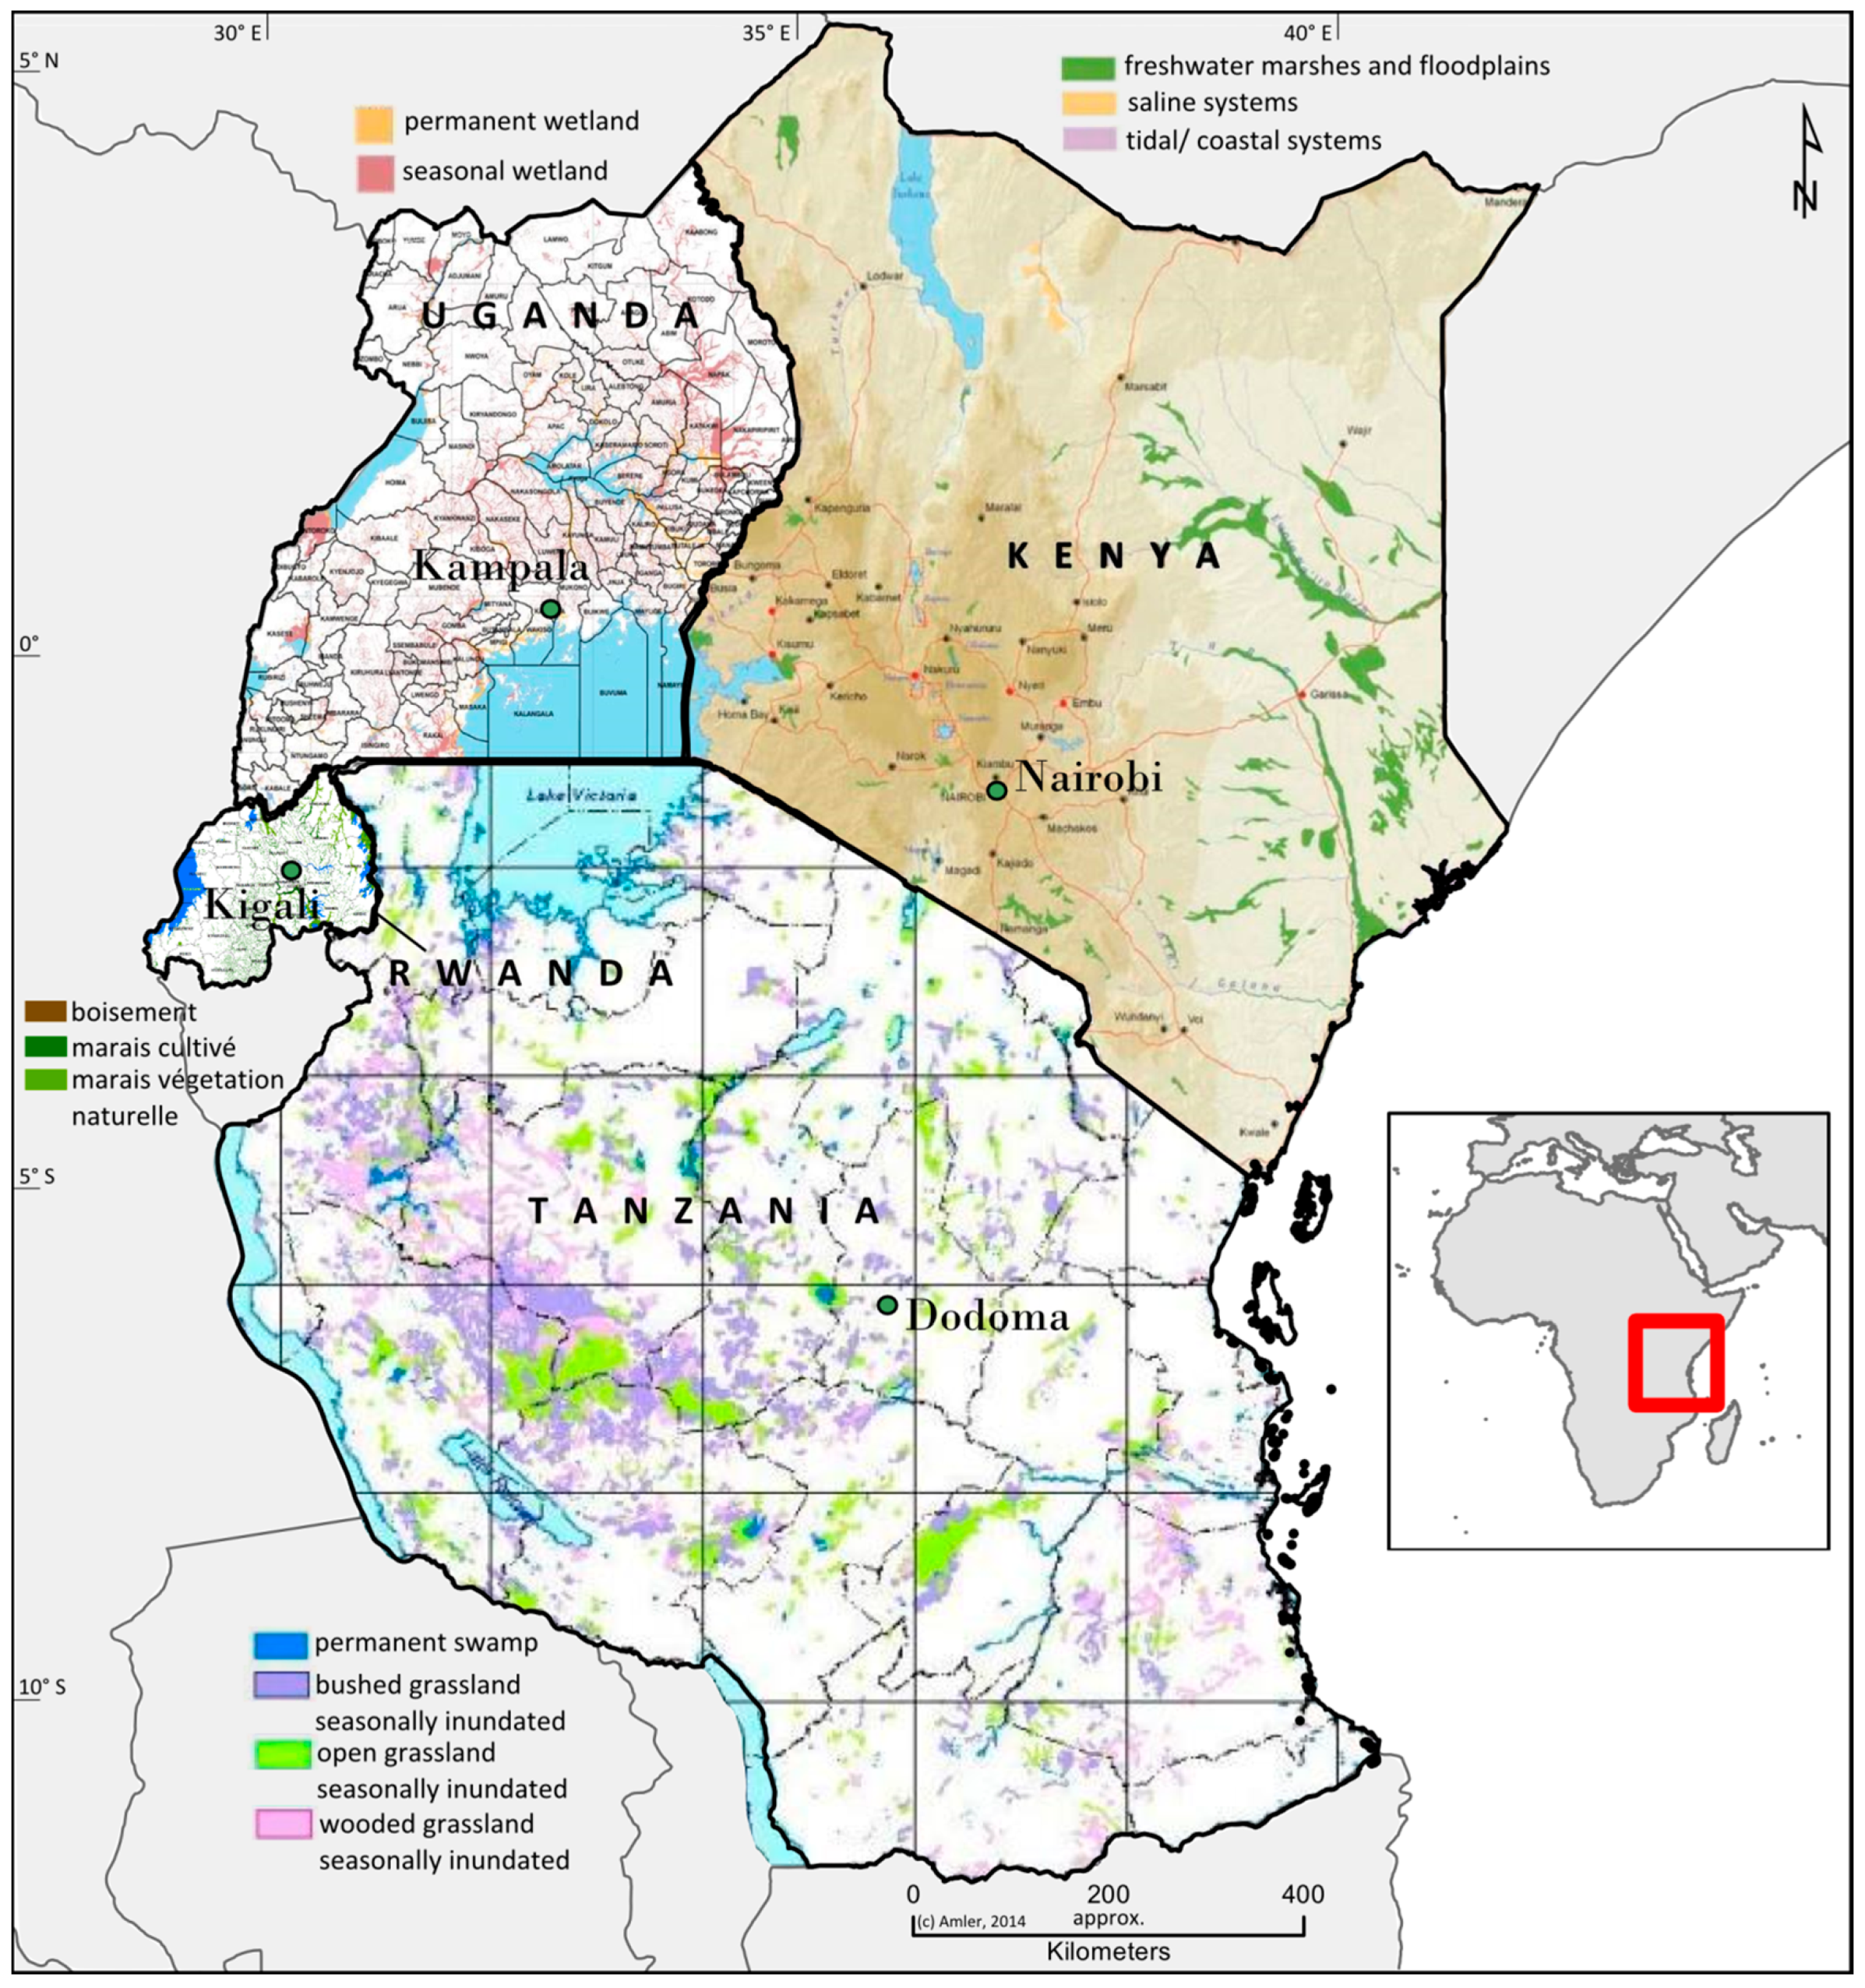
Kenya, Rwanda, Tanzania and Uganda undertake national initiatives to gain better understanding of their wetland resources. Publications on national wetland maps are listed in Table 5.
Table 5 shows that spatially-explicit information about wetland distribution and areal extent estimations are available for all of the nations of interest. The methodologies employed to complete these maps are not well documented for all cases. Figure 4 shows that the quality of publicly available maps differs widely in the four countries.
Table 5.
Compilation of national wetland maps for the project countries. Shaded rows of data indicate the datasets illustrated in Figure 4. Wetlands areas (shown in brackets) have been calculated by the authors; all other estimates were sourced from the original references.
| Country (Extent, Global Administrative Areas—GADM, 2015 [88]) | Publication, Year | Area of Wetlands Coverage 1 | |
|---|---|---|---|
| Kenya (58.6 M ha total land surface area) | United Nations Environment Programme (UNEP) and Kenya Ministry of Environment and Natural Resources, 2012 [103] 2,3 | Approximately 2.7 M ha | |
| FAO, 1998 [101] 2 | Approximately 1.1 M ha–1.8 M ha, 2%–3% of Kenya’s land surface area | ||
| Rwanda (2.5 M ha total land surface area) | Rwanda Ministère des Resssources Naturelles and the Rwanda Environmental Management Agency, 2015 [104] 2 | 278,536 ha, 10.6% of Rwanda’s land surface area, 860 wetlands | |
| Rwanda Environment Management Authority, 2009 [105] 2,4 | 278,536 ha, 10.6% of Rwanda’s land surface area, 860 wetlands | ||
| Rwanda Environment Management Authority, 2011 [106] 2,4 | 278,536 ha, 10.6% of Rwanda’s land surface area, 860 wetlands | ||
| Tanzania (94.4 M ha total land surface area) | Tanzania Ministry of Natural Resources et al., 2003 [107] 2 | Approximately 9.4 M ha, 10% of Tanzania’s land surface area 5 | |
| FAO, 1998 [101] 2 | n/a | ||
| Kamukala and Crafter, 1993 [108] 2 | Approximately 2.7 M ha, 10% of Tanzania’s land surface area 5 | ||
| Uganda (24.2 M ha total land surface area ) | Iyango et al., 2009 [12] 2 | 3.1 M ha, 15% of Uganda’s land surface area | |
| Huising, n/a [109] | Approximately 3.1 M ha, 13% of Uganda’s land surface area | ||
| Uganda Ministry of Water, Lands and Environment, 2015 [110] | Almost approximately 3 M ha, about 13% of Uganda’s land surface area | ||
1 Spatial resolution unknown in all datasets; 2 spatially-explicit datasets, wetland map available (not necessarily in digital mode); 3 map excerpt from [27] (see Table 4); 4 map and data from [104]; 5 the case of Tanzania, and the strong deviation in area estimations in relation to Tanzania’s land surface demonstrates the limited reliability of available wetland maps and area estimates.

2.4.4. Synthesis: The Need for a Regional Wetland Map
Very few literature references could be found describing wetland studies explicitly focused on East Africa. Some are from the project titled Agricultural Use and Vulnerability of Small Wetlands in East Africa (SWEA), which was concluded in 2013. During the first phase of this project, 51 wetlands smaller in size than 500 ha were identified within Kenya and Tanzania [111]. Mwita et al. [112,113] mapped a number of these in detail by applying TerraSAR-X and RapidEye high spatial resolution remotely-sensed data.
To date, no regional, cross-border initiative that harmonizes national wetland map layers has been implemented. As shown in Table 5 and Figure 4, national inventories differ greatly in several aspects. The integration of these maps is currently unlikely, as such an endeavour would require the commitment of substantial resources along with a significant effort in the field of geographical information systems. Important advantages arise from performing regional mapping that utilizes remote sensing technology to derive standardized information about wetland location and extent.
3. Conclusions
Our review aims to show wetland definitions in use by the scientific community and usable wetland maps for the East African region, including up-to-date land use/land cover classifications.
Our discussion on the definition of wetlands showed that, although there is no lack of available definitions, the usability of these for wetland studies based on remote sensing is limited. This became obvious with our findings that 43% (106/245) of publications on wetlands provided no definition, especially in publications for case studies, where 46% failed to provide any definition. For future wetland maps, we argue that a clear definition is necessary, especially when applying remotely-sensed data. Whether the very important, but very broad, Ramsar Convention’s definition on wetlands is applicable needs to be discussed. We developed a classification scheme of available wetland definitions to support a community discussion on the topic and to assist future researchers in finding appropriate wetland definitions.
Our review of land use/land cover classification systems and maps revealed that these products are not recommendable for locating wetlands or conducting estimates of wetland extents. Due to difficulties in mapping wetlands over large areas, they have been poorly addressed in many classification systems, and LUCs very likely underestimate global wetland extent. Hence, wetland researchers need to apply specific wetland maps, instead. Whereas inundation datasets might serve as coarse proxies for wetlands, specific wetland maps that satisfy the requirements for reliability (such as described in Section 1) are rare. We compiled descriptions of wetland maps at global, continental and national levels that showed that data availability is unrewarding for wetland researchers and managers who aim to extrapolate findings from case studies or to protect these endangered, valuable ecosystems from uncontrolled use or conversion. This is especially true for the East African region, which is the focus area of an interdisciplinary research project and lacks consistent, region-wide coverage of spatial information on wetlands. Global wetland maps are, in many cases, outdated, and the information provided in these datasets is too coarse to gain knowledge on the spatial extent of wetlands in the region. African wetland inventories are either in the form of catalogues, which do not provide spatially-explicit data, or are large-area, coarse-scaled maps that underestimate the wetland extent across the continent. Available spatial information at a national level is not usable, as the quality, information on processing methods and availability in digital format are disparate among the four countries.
Targeted remote sensing data and processing methods could significantly improve this situation, and possibilities are discussed in the research outlook.
4. Research Outlook
The ability to extend findings from local-level studies requires consistent knowledge about regional wetland distribution. For example, to improve international implementation of the Ramsar Convention, remote sensing experts cite the need for a “…better collaboration between…countries in a region…to harmonise…classification systems, build shared spectral libraries (and) strengthen mechanisms to share information for inventory and monitoring” [15].
To overcome the existing shortages in East African wetland mapping that were analysed and described in detail in this review, our proposition is to use a multisensor, multitemporal data analysis approach.
The East African region extends over approximately 180 million ha [88]. This large size, along with the limited accessibility of most wetland areas, their remoteness and dynamic seasonal extent, make comprehensive ground-based mapping impossible. Utilizing remote sensing techniques can overcome these limitations. Repeated sequential data acquisitions with a given sensor system enable automated analyses of surface dynamics at regular temporal intervals. Through the application of remotely-sensed data, wetland surfaces can be operationally mapped and monitored on an objective, systematic and synoptic basis [54] at comparatively low cost. Though hindered by a number of factors [114], regular and ongoing monitoring of wetland sites in large and remote areas is most efficiently implemented by non-intrusive remote sensing data collection and analysis. Multisensor remote sensing data and analyses constitute the most promising approach for creating regional wetlands maps that are cross-boundary, continuous, comprehensive, quality controlled and accuracy validated. Multiple sensors acquire data independently [24], which eliminates cross-dependencies among systems. Extensive satellite data time series are now available without restriction from the archives of NOAA-AVHRR, MODIS Terra and Aqua, SPOT Vegetation and Landsat systems. The low to medium spatial resolution of these systems might cause systematic mapping errors due to the fragmented nature of many wetlands and their small size. These limitations can be overcome by the additional application of high-resolution sensors, as was successfully applied to an Australian wetland by Schmidt et al. [115], or, in the future, the European Space Agency’s (ESA) Sentinel system. Nevertheless, due to the strong seasonal variation in wetland extent, a multitemporal approach is promising for wetland detection over a large areal extent.
ESA’s Sentinel satellite program, which is currently initiating its operational phase, has significant potential utility for wetland research. The Sentinel-1 satellite includes a radar system with the capability of collecting cloud-free water- and moisture-specific data. Sentinel-2 incorporates a fine spatial resolution 10-meter multispectral sensor and will orbit with a short, five-day revisit time. The combination of these radar and optical systems holds great promise for wetland mapping [116]. These sensors will also provide data for the GlobWetland III Africa project, which aims to enhance wetland management in line with the Ramsar Convention [117]. GlobWetland III Africa could also benefit from regional maps, as current project objectives focus solely on individual wetlands and do not include the objective of providing an overview of the distribution and extent of existing wetlands.
A region-wide wetland map will be created within the GlobE Wetlands project using multitemporal remote sensing data and techniques. This approach will take advantage of the discrete set of wetland temporal surface reflectance signatures that can be measured against the surrounding uplands. Haas et al. [118] have used coarse-resolution optical satellite data in time series to successfully map ephemeral ponds and wetlands in arid and semi-arid Sub-Saharan West Africa. To derive the wetland map layer for the GlobE Wetlands project region, a suite of active and passive satellite data will be integrated with medium-resolution satellite time series data. This approach of combining sensors over a time range is promising in overcoming the problem of frequent cloud coverage in (sub) tropical regions, like East Africa. A decision tree classifier will be implemented to derive phenological indicators for primary wetland identification. In situ ancillary data will also be collected from four field test sites by researchers from a number of disciplines. This collection of field data will be representative of typical regional wetlands and will significantly contribute to the project by improving the accuracy validation of the final data product. In addition to the comparison to existing wetland datasets, we are able to collect ground truth data extensively and therefore expect to be able to reach a high level of mapping accuracy. Due to the fact that this study will cover the East African region, which is rich in environmental gradients that host a wide range of wetland types, we also expect that this effort will benefit future global wetland mapping efforts. The processing could serve as a prototype for larger studies, especially as it will rely on freely accessible datasets and, therefore, will represent a low-cost mapping approach. In keeping with fundamental project objectives, the results from this mapping effort will be publicly available to researchers and all those participating in the field of sustainable wetland management.
Acknowledgments
This research was conducted under the GlobE Wetlands project, which is funded by the German Federal Ministry of Education and Research (FKZ: 031A250 A-H), with additional funding provided by the German Federal Ministry for Economic Cooperation and Development.
We want to thank Tobias Henning (University of Bonn) and Henryk Hodam (Hochschule Koblenz); Miguel Alvarez, Daniel Kyalo Willy, Susanne Ziegler, Sonja Beuel, Katrin Wagner, Constanze Leemhuis and Kai Behn (the project Typology Team); Denis Rugege and Rose Mukankomeje from the Rwanda Environment Management Agency; and Collins Oloya, Sarah Tumuhairwe and Moses Musinguzi for providing wetland maps from Rwanda and Uganda. We highly appreciate the assistance that was and is given by the project’s country coordinators, Denis Rugege, Salome Misana, Helida Oyieke and Mathias Behangana. Of course, we thank all project members who facilitated this piece of work. We also acknowledge the contribution of Joseph Scepan of Medford, Oregon, USA, in producing this document, of the editors, and of the anonymous reviewers who significantly contributed to an improvement of the document by providing valuable feedback to the authors.
Author Contributions
Esther Amler compiled the literature and analysis. Michael Schmidt and Gunter Menz provided critical input to the outline of the article and supported the process of writing the article by giving critical feedback on all sections.
Conflicts of Interest
The authors declare no conflicts of interest.
References
- Millenium Ecosystem Assessment. In Ecosystems and Human Well-Being: Wetlands and Water-Synthesis; World Resources Institute: Washington, DC, USA, 2005.
- Zomer, R.J.; Trabucco, A.; Ustin, S.L. Building spectral libraries for wetlands land cover classification and hyperspectral remote sensing. J. Environ. Manag. 2009, 90, 2170–2177. [Google Scholar] [CrossRef]
- Costanza, R.; D’Arge, R.; de Groot, R.; Farber, S.; Grasso, M.; Hannon, B.; Limburg, K.; Naeem, S.; O’Neil, R.V.; Paruelo, J.; et al. The value of the world’s ecosystem services and natural capital. Nature 1997, 387, 253–260. [Google Scholar] [CrossRef]
- Thenya, T. Challenges of conservation of dryland shallow waters, Ewaso Narok swamp, Laikipia District, Kenya. Hydrobiologia 2001, 458, 107–119. [Google Scholar] [CrossRef]
- Food and Agriculture Organization (FAO). An Introduction to the Basic Concepts of Food Security; FAO: Rome, Italy, 2008. [Google Scholar]
- Turyahabwe, N.; Kakuru, W.; Tweheyo, M.; Tumusiime, D.M. Contribution of wetland resources to household food security in Uganda. Agric. Food Secur. 2013, 2. [Google Scholar] [CrossRef]
- Von Grebmer, K.; Saltzman, A.; Birol, E.; Wiesmann, D.; Prasai, N.; Yin, S.; Yohannes, Y.; Menon, P.; Thompson, J.; Sonntag, A. Global Hunger Index 2014-The Challenge of Hidden Hunger; International Food Policy Research Institute/Welthungerhilfe/Concern Worldwide: Washington, DC, USA; Bonn, Germany; Dublin, Ireland, 2014. [Google Scholar]
- GIEWS Update—Greater Horn of Africa: Late and Erratic Rains Raise Serious Concern for Crop and Livestock Production. Available online: http://www.fao.org/giews/english/shortnews/hof03062014.htm (accessed on 27 October 2014).
- Un-Water/Africa. African Water Development Report 2006; UNECA: Addis Ababa, Ethiopia, 2006. [Google Scholar]
- Niang, I.; Ruppel, O.C.; Abdrabo, M.; Essel, A.; Lennard, C.; Padgham, J.; Urquhart, P. IPCC WGII AR5 (Final Draft), Chapter 22–Africa. In Climate Change 2014: Impacts, Adaptation, and Vulnerability-IPCC Working Group II Contribution to AR 5; Barros, F., Mach, D., Bilir, M., Ebi, C., Genova, E., Kissel, G., MacCracken, L., White, M., Eds.; Cambridge University Press: New York, NY, USA, 2014. [Google Scholar]
- Ramsar Convention Secretariat. The wise use of wetlands. Available online: http://www.ramsar.org/about/the-wise-use-of-wetlands (accessed on 7 January 2015).
- Iyango, L.; Mafabi, P.; Musinguzi, M.; Namakambo, N.; Emwanu, T.; Muhwezi, B.J.; Okwi, P.; Owuor, J.; Henninger, N.; Landsberg, F. Mapping a Better Future-How Spatial Analysis can Benefit Wetlands and Reduce Poverty in Uganda; Kampala, Wetlands Management Department (Uganda); Ministry of Water and Environment (Uganda); Uganda Bureau of Statistics; International Livestock Research Institute; World Resources Institute: Kampala, Uganda; Washington, DC, USA, 2009. [Google Scholar]
- Australian Government, Department of the Environment. Global Review of Wetland Resources and Priorities for Wetland Inventory; Supervising Scientist Report 144; Finlayson, C.M., Spiers, N.C., Eds.; Supervising Scientist: Canberra, Australia, 1999.
- Australian Government, Department of the Environment. Techniques for Enhanced Wetland Inventory and Monitoring; Supervising Scientist Report 147; Finlayson, C.M., Spiers, N.C., Eds.; Supervising Scientist: Canberra, Australia, 1999.
- MacKay, H.; Finlayson, C.M.; Fernández-Prieto, D.; Davidson, N.; Pritchard, D.; Rebelo, L.-M. The role of Earth Observation technologies in supporting implementation of the Ramsar Convention on Wetlands. J. Environ. Manag. 2009, 90, 2234–2242. [Google Scholar] [CrossRef]
- Alsdorf, D.E.; Rodríguez, E.; Lettenmaier, D.P. Measuring surface water from space. Rev. Geophys. 2007, 45, 1–24. [Google Scholar] [CrossRef]
- Kiene, E. GlobE Wetlands in East Africa. Available online: http://www.wetlands-africa.de/ (accessed on 9 April 2015).
- Ozesmi, S.L.; Bauer, M.E. Satellite Remote Sensing of Wetlands. Wetl. Ecol. Manag. 2002, 10, 381–402. [Google Scholar] [CrossRef]
- Combal, B.; Haas, E.; Bartholomé, E. Detection of Surface Water with SPOT/VEGETATION-Monitoring and Assessing CILSS Countries Surface Water Availability; European Comission JRC-IES: Ispra, Italy, 2009. [Google Scholar]
- Bates, P.D.; Horritt, M.S.; Smith, C.N.; Mason, D. Integrating remote sensing observations of flood hydrology and hydraulic modelling. Hydrol. Process. 1997, 11, 1777–1795. [Google Scholar]
- Mercier, F.; Cazenave, A.; Maheu, C. Interannual lake level fluctuations (1993–1999) in Africa from Topex/Poseidon: Connections with ocean–atmosphere interactions over the Indian Ocean. Glob. Planet. Change 2002, 32, 141–163. [Google Scholar] [CrossRef]
- Varni, M.R.; Entraigas, I.; Migueltorena, V.; Comas, R. Evaluation of flooded areas with satellite imagery using an objective hydrologic criterion. Water Environ. J. 2013, 27, 396–401. [Google Scholar]
- Cowardin, L.M.; Carter, V.; Golet, F.C.; LaRoe, E.T. Classification of Wetlands and Deepwater Habitats of the United States; US Department of the Interior Fish and Wildlife Service: Washington, DC, USA, 1979. [Google Scholar]
- Mitsch, W.J.; Gosselink, J.G. Wetlands, 4th ed.; Wiley: New York, NY, USA, 2007. [Google Scholar]
- Pressey, R.L.; Adam, P. A review of wetland inventory and classification in Australia. Vegetatio 1995, 118, 81–101. [Google Scholar] [CrossRef]
- Maltby, E.; Barker, T. The Wetlands Handbook; Maltby, E., Barker, T., Eds.; Blackwell Publishing Ltd.: West Sussex, UK, 2009. [Google Scholar]
- Dugan, P. Wetlands in Danger: A World Conservation Atlas; Dugan, P., Ed.; Oxford University Press: New York, NY, USA, 1993. [Google Scholar]
- Semeniuk, C.A.; Semeniuk, V. A geomorphic approach to global classification for inland wetlands. Vegetatio 1995, 118, 103–124. [Google Scholar] [CrossRef]
- Lehner, B.; Döll, P. Development and Validation of a global database of lakes, reservoirs and wetlands. J. Hydrol. 2004, 296, 1–22. [Google Scholar] [CrossRef]
- Matthews, E.; Fung, I. Methane emission from natural wetlands: Global distribution, area, and environmental characteristics of sources. Glob. Biogeochem. Cycles 1987, 1, 61–86. [Google Scholar] [CrossRef]
- Aselmann, I.; Crutzen, P.J. Global distribution of natural freshwater wetlands and rice paddies, their net primary productivity, seasonality and possible methane emissions. J. Atmos. Chem. 1989, 8, 307–358. [Google Scholar] [CrossRef]
- Mitsch, W.J. Global Wetlands Old World and New; Mitsch, W.J., Ed.; Elsevier Science B.V.: Amsterdam, The Netherlands, 1994. [Google Scholar]
- Lewis, W.M. Wetlands Explained; Oxford University Press: New York, NY, USA, 2001. [Google Scholar]
- Blume, H.-P.; Brümmer, G.W.; Kandeler, E.; Kögel-Knabner, I.; Kretzschmar, R.; Stahr, K.; Wilke, B.-M. Scheffer/Schachtschabel: Lehrbuch der Bodenkunde, 16th ed.; Spektrum Akademischer Verlag (Springer): Heidelberg, Germany, 2010. [Google Scholar]
- Kaplan, J.O. Wetlands at the Last Glacial Maximum: Distribution and methane emissions. Geophys. Res. Lett. 2002, 29, 31–34. [Google Scholar]
- Bwangoy, J.-R.B.; Hansen, M.C.; Roy, D.P.; de Grandi, G.; Justice, C.O. Wetland mapping in the Congo basin using optical and remotely sensed data and derived topographical indices. Remote Sens. Environ. 2010, 114, 73–86. [Google Scholar] [CrossRef]
- Macfarlane, D.M.; Kotze, D.C.; Ellery, W.N.; Walters, D.; Koopman, V.; Goodman, P.; Goge, C. WET-Health: A technique for Rapidly Assessing Wetland Health; Wetland Management Series 340/08; Water Resources Comission: Gezina, South Africa, 2008. [Google Scholar]
- Brock, M.A. Aquatic vegetation of inland wetlands. In Australian Vegetation, 2nd ed.; Groves, R.H., Ed.; Cambridge University Press: Cambridge, UK, 1994; pp. 437–466. [Google Scholar]
- Roshier, D.A.; Rumbachs, R.M. Broad-scale mapping of temporary wetlands in arid Australia. J. Arid Environ. 2004, 56, 249–263. [Google Scholar] [CrossRef]
- Lyon, J.G.; McCarthy, J. Wetland and Environmental Applications of GIS; Lyon, J.G., McCarthy, J., Eds.; CRC Press LLC: Boca Raton, FL, USA, 1995. [Google Scholar]
- Convention on Wetlands of International Importance Especially as Waterfowl Habitat 1971. Available online: http://portal.unesco.org/en/ev.php-URL_ID=15398&URL_DO=DO_TOPIC&URL_SECTION=201.html (accessed on 18 November 2014).
- Sakané, N.; Alvarez, M.; Becker, M.; Böhme, B.; Handa, C.; Kamiri, H.W.; Langensiepen, M.; Menz, G.; Misana, S.; Mogha, N.G.; et al. Classification, Characterization and Use of small Wetlands in East Africa. Wetlands 2011, 31, 1103–1116. [Google Scholar] [CrossRef]
- Arbuckle, C.J.; Huryn, A.D.; Israel, S.A. Applications of Remote Sensing and GIS to Wetland Inventory: Upland bogs. In Proceedings of the Spatial Information Research Centre’s 10th Colloquium; University of Otago: Dunedin, New Zealand, 1998; pp. 15–24. [Google Scholar]
- Novo, E.M.; Shimabukuro, Y.E. Identification and mapping of the Amazon habitats using a mixing model. Int. J. Remote Sens. 1997, 18, 663–670. [Google Scholar] [CrossRef]
- Von der Heyden, C.J. The hydrology and hydrogeology of dambos: A review. Prog. Phys. Geogr. 2004, 28, 544–564. [Google Scholar] [CrossRef]
- Zhao, X.; Stein, A.; Chen, X.-L. Monitoring the dynamics of wetland inundation by random sets on multi-temporal images. Remote Sens. Environ. 2011, 115, 2390–2401. [Google Scholar] [CrossRef]
- Zoltai, S.C.; Pollett, F.C. Wetlands in Canada: Their classification, distribution and use. In Mires: Swamp, Bog, Fen and Moor; Gore, A.J.P., Ed.; Elsevier: Amsterdam, Netherlands, 1983. [Google Scholar]
- Frazier, P.; Page, K.; Louis, J.; Briggs, S.; Robertson, A.I. Relating wetland inundation to river flow using Landsat TM data. Int. J. Remote Sens. 2003, 24, 3755–3770. [Google Scholar] [CrossRef]
- Kaptué, A.T.; Hanan, N.P.; Prihodko, L. Characterization of the spatial and temporal variability of surface water in the Soudan-Sahel region of Africa. J. Geophys. Res.: Biogeosci. 2013, 118, 1472–1483. [Google Scholar] [CrossRef]
- Anderson, J.E. Spectral Reflectance Properties of Wetlands Plants; US Army Topographic Engineering Center: Alexandria, VA, USA, 1994. [Google Scholar]
- Zhao, H.; Cui, B.; Zhang, H.; Fan, X.; Zhang, Z.; Lei, X. A landscape approach for wetland change detection (1979–2009) in the Pearl River Estuary. Procedia Environ. Sci. 2010, 2, 1265–1278. [Google Scholar] [CrossRef]
- Melack, J.M.; Hess, L.L. Remote Sensing of the Distribution and Extent of Wetlands in the Amazon Basin. In Amazonian Floodplain Forests; Junk, W.J., Piedade, M.T.F., Wittmann, F., Schöngart, J., Parolin, P., Eds.; Springer: Dordrecht, The Netherlands, 2010; pp. 43–59. [Google Scholar]
- Mwita, E. Remote Sensing Based Assessment of Small Wetlands in East Africa. PhD Thesis, University of Bonn, Bonn, Germany, 2010. [Google Scholar]
- Carter, V. Applications of remote sensing to wetlands. In Remote Sensing for Resource Management; Johannsen, C.J., Sanders, J.L., Eds.; Soil Conservation Society of America: Ankeny, IA, USA, 1982; pp. 284–300. [Google Scholar]
- Unesco Ecology and Conservation. In International Classification and Mapping of Vegetation; Unesco: Paris, France, 1973.
- Matthews, E. Global Vegetation and Land Use: New High-Resolution Data Bases for Climate Studies. J. Clim. Appl. Meteorol. 1983, 22, 474–487. [Google Scholar]
- Tucker, C.J.; Townshend, J.R.G.; Goff, T.E. African Land-Cover Classification using Satellite Data. Science 1985, 227, 369–375. [Google Scholar] [CrossRef]
- Townshend, J.R.G.; Justice, C.O.; Kalb, V. Characterization and classification of South American land cover types using satellite data. Int. J. Remote Sens. 1987, 8, 1189–1207. [Google Scholar] [CrossRef]
- Loveland, T.R.; Merchant, J.W.; Ohlen, D.O.; Brown, J.F. Development of a Land-Cover Characteristics Database for the Conterminous U.S. Photogramm. Eng. Remote Sens. 1991, 57, 1453–1463. [Google Scholar]
- Stone, T.A.; Schlesinger, P.; Houghton, R.A.; Woodwell, G.M. A Map of the Vegetation of South America Based on Satellite Imagery. Photogramm. Eng. Remote Sens. 1994, 60, 541–551. [Google Scholar]
- DeFries, R.S.; Townshend, J.R.G. NDVI-derived land cover classifications at a global scale. Int. J. Remote Sens. 1994, 15, 3567–3586. [Google Scholar] [CrossRef]
- DeFries, R.; Hansen, M.; Townshend, J. Global Discrimination of Land Cover Types from Metrics Derived from AVHRR Pathfinder Data. Remote Sens. Environ. 1995, 54, 209–222. [Google Scholar] [CrossRef]
- DeFries, R.S.; Hansen, M.; Townshend, J.R.G.; Sohlberg, R. Global land cover classification at 8 km spatial resolution: The use of training data derived from Landsat imagery and decision tree classifiers. Int. J. Remote Sens. 1998, 19, 3141–3168. [Google Scholar] [CrossRef]
- Loveland, T.R.; Zhu, Z.; Ohlen, D.O.; Brown, J.F.; Reed, B.C.; Yang, L. An Analysis of the IGBP Global Land-Cover Characterization Process. Photogramm. Eng. Remote Sens. 1999, 65, 1021–1032. [Google Scholar]
- Anderson, J.R.; Hardy, E.E.; Roach, J.T.; Witmer, R.E. A Land Use and Land Cover Classification System for Use with Remote Sensor Data; Geological Survey Professional Paper; United States Department of the Interior: Washington, DC, USA, 1976.
- Sellers, P.J.; Mintz, Y.; Sud, Y.C.; Dalcher, A. A Simple Biosphere Model (SiB) for Use within General Circulation Models. J. Atmos. Sci. 1986, 43, 505–531. [Google Scholar]
- Olson, D.M. Global Ecosystem Framework-Definitions: USGS EROS Data Center Internal Report; USGS: Sioux Falls, SD, USA, 1994. [Google Scholar]
- Running, S.W.; Loveland, T.R.; Pierce, L.L. A Vegetation Classification Logic Based on Remote Sensing for Use in Global Biogeochemical Models. Ambio 1994, 23, 77–81. [Google Scholar]
- Sellers, P.J.; Los, S.O.; Tucker, C.J.; Justice, C.O.; Dazlich, D.A.; Collatz, G.J.; Randall, D.A. A Revised Land Surface Parametrization (SiB2) for Atmospheric GCMs. Part II: The Generation of Global Fields of Terrestrial Biophysical Parameters from Satellite Data. J. Clim. 1996, 9, 706–737. [Google Scholar]
- Dickinson, R.E.; Henderson-Sellers, A.; Kennedy, P.J.; Wilson, M.F. Biosphere-Atmosphere Transfer Scheme (BATS) for the NACR Community Climate Model; NCAR Tech. Note: Boulder, CO, USA, 1986. [Google Scholar]
- Loveland, T.R.; Reed, B.C.; Brown, J.F.; Ohlen, D.O.; Zhu, Z.; Yang, L.; Merchant, J.W. Development of a global land cover characteristics database and IGBP DISCover from 1 km AVHRR data. Int. J. Remote Sens. 2000, 21, 1303–1330. [Google Scholar] [CrossRef]
- Bossard, M.; Feranec, J.; Otahel, J. CORINE Land Cover Technical Guide–Addendum 2000; European Environment Agency: Copenhagen, Denmark, 2000. [Google Scholar]
- Hansen, M.C.; DeFries, R.S.; Townshend, J.R.G.; Sohlberg, R. Global land cover classification at 1 km spatial resolution using a classification tree approach. Int. J. Remote Sens. 2000, 21, 1331–1364. [Google Scholar] [CrossRef]
- FAO. FRA 2000 Global Ecological Zoning for the Global Forest Resources Assessment 2000—Final Report; FAO: Rome, Italy, 2001. [Google Scholar]
- Olson, D.M.; Dinerstein, E.; Wikramanayake, E.D.; Burgess, N.D.; Powell, G.V.N.; Underwood, E.C.; D’amico, J.A.; Itoua, I.; Strand, H.E.; Morrison, J.C.; et al. Terrestrial Ecoregions of the World: A New Map of Life on Earth. BioScience 2001, 51, 933–938. [Google Scholar] [CrossRef]
- Friedl, M.A.; McIver, D.K.; Hodges, J.C.F.; Zhang, X.Y.; Muchoney, D.; Strahler, A.H.; Woodcock, C.E.; Gopal, S.; Schneider, A.; Cooper, A.; et al. Global land cover mapping from MODIS: Algorithms and early results. Remote Sens. Environ. 2002, 83, 287–302. [Google Scholar] [CrossRef]
- Mayaux, P.; Bartholomé, E.; Massart, M.; van Cutsem, C.; Cabral, A.; Nonguierma, A.; Diallo, O.; Pretorius, C.; Thompson, M.; Cherlet, M.; et al. A Land Cover Map of Africa; European Communities: Luxembourg, 2003. [Google Scholar]
- Bontemps, S.; Defourny, P.; van Bogaert, E.; Arino, O.; Kalogirou, V.; Perez, J.R. GLOBCOVER 2009: Products Description and Validation Report; UCLouvain & European Space Agency: Louvain, Belgium, 2011. [Google Scholar]
- FAO. FRA 2015 Global Ecological Zones for FAO Forest Reporting: 2010 Update; FAO: Rome, Italy, 2012. [Google Scholar]
- Food and Agriculture Organization (FAO). GLCN Global Land Cover Network-Africover; FAO: Rome, Italy, 2013. [Google Scholar]
- Latham, J.; Cumani, R.; Rosati, I.; Bloise, M. FAO Global Land Cover-SHARE Database Beta-Release V. 1.0; FAO: Rome, Italy, 2014. [Google Scholar]
- Hess, L.L.; Melack, J.M.; Novo, E.M.L.M.; Barbosa, C.C.F.; Gastil, M. Dual-season mapping of wetland inundation and vegetation for the central Amazon basin. Remote Sens. Environ. 2003, 87, 404–428. [Google Scholar] [CrossRef]
- Acreman, M.C.; Miller, F. Hydrological Impact assessment of wetlands. In Proceedings of the International Symposium on Groundwater Sustainability, Alicante, Spain, 24–27 January 2006; pp. 225–255.
- Palmer, S.; Kutser, T.; Hunter, P.D. Remote sensing of inland water: Challenges, progress and future directions. Remote Sens. Environ. 2015, 157, 1–8. [Google Scholar] [CrossRef]
- Darras, S.; Michou, M.; Sarrat, C. IGBP-DIS Wetland Data Initiative: A First Step Towards Identifying a Global Delineation of Wetlands; IGBP-DIS Office: Toulouse, France, 1999. [Google Scholar]
- Di Gregorio, A.; Jansen, L.J.M. Land Cover Classification System-Classification Concepts and User Manual, Software Version 2; FAO: Rome, Italy, 2005. [Google Scholar]
- Mayaux, P.; Bartholomé, E.; Fritz, S.; Belward, A. A new land-cover map of Africa for the year 2000. J. Biogeogr. 2004, 31, 861–877. [Google Scholar] [CrossRef]
- Database of Global Administrative Areas (GADM). Available online: http://www.gadm.org/ (accessed on 7 January 2015).
- Downing, J.A. Emerging global role of small lakes and ponds: Little things mean a lot. Limnetica 2010, 29, 9–24. [Google Scholar]
- Ordoyne, C.; Friedl, M.A. Using MODIS data to characterize seasonal inundation patterns in the Florida Everglades. Remote Sens. Environ. 2008, 112, 4107–4119. [Google Scholar] [CrossRef]
- Lemly, A.D.; Kingsford, R.T.; Thompson, J.R. Irrigated Agriculture and Wildlife Conservation: Conflict on a Global Scale. Environ. Manag. 2000, 25, 485–512. [Google Scholar] [CrossRef]
- Stacke, T.; Hagemann, S. Development and evaluation of a global dynamical wetlands extent scheme. Hydrol. Earth Syst. Sci. 2012, 16, 2915–2933. [Google Scholar] [CrossRef]
- Gore, A.J.P. Mires: Swamp, Bog, Fen and Moor; Elsevier: Amsterdam, Netherlands, 1983. [Google Scholar]
- Matthews, E.; Fung, I.; Lerner, J. Methane emission from rice cultivation: Geographic and seasonal distribution of cultivated areas and emissions. Glob. Biogeochem. Cycles 1991, 5, 3–24. [Google Scholar] [CrossRef]
- The Ramsar List of Wetlands of International Importance. Available online: http://ramsar.rgis.ch/cda/en/ramsar-documents-list/main/ramsar/1-31-218_4000_0__ (accessed on 20 November 2014).
- Ramsar Wetland Type Classification. Available online: http://www.environment.gov.au/water/wetlands/ramsar/wetland-type-classification (accessed on 9 April 2015).
- NASA Jet Propulsion Laboratory. Wetlands-Global Monitoring of Wetland Extent and Dynamics. Available online: http://wetlands.jpl.nasa.gov/ (accessed on 20 November 2014).
- Alaska Satellite Facility. Wetland MEaSUREs Time Series Data. Available online: https://www.asf.alaska.edu/wetlands/time-series-data/ (accessed on 11 November 2014).
- Fluet-Chouinard, E.; Lehner, B.; Rebelo, L.-M.; Papa, F.; Hamilton, S.K. Development of a global inundation map at high spatial resolution from topographic downscaling of coarse-scale remote sensing data. Remote Sens. Environ. 2015, 158, 348–361. [Google Scholar] [CrossRef]
- Hughes, R.H.; Hughes, J.S. A Directory of African Wetlands; IUCN, UNEP, WCMC: Gland, Switzerland; Nairobi, Kenya; Cambridge, UK, 1992. [Google Scholar]
- FAO. Wetland Characterization and Classification for Sustainable Agricultural Development; FAO: Harare, Zimbabwe, 1998. [Google Scholar]
- Acreman, M.C.; Hollis, G.E. Water Management and Wetlands in Sub-Saharan Africa; International Union for Conservation of Nature: Gland, Switzerland, 1996. [Google Scholar]
- UNEP; Kenya Ministry of Environment and Natural Resources. Kenya Wetlands Atlas; UNEP: Nairobi, Kenya, 2012.
- Rwanda Ministère des Resssources Naturelles; Rwanda Environmental Management Agency. Projet de Gestion Integree des Ecosystemes Critiques-Etablissement d`un Inventaire National Rapide des Marrais et Élaboration de 5 Avant-Projets d’arretés Ministériels Relatifs aux Marais. Available online: http://www.rema.gov.rw/rema_doc/publications/Rapport%20de%20l%27Inventaire%20des%20Marais%20du%20Rwanda%20Module%203.pdf (accessed on 7 January 2015).
- Rwanda Environment Management Authority. Rwanda State of Environment and Outlook; REMA: Kigali, Rwanda, 2009.
- Rwanda Environment Management Authority. Atlas of Rwanda’s Changing Environment: Implications for Climate Change Resilience; REMA: Kigali, Rwanda, 2011.
- Tanzania Ministry of Natural Resources and Tourism (MNR); Tanzania Wildlife Division; Tanzania Ministry of foreign Affairs; Danish International Development Agency (DanIDA). Sustainable Wetlands Management 2004–2009, Tanzania; MNR: Dar Es Salaam, Tanzania, 2003.
- Kamukala, G.L; Crafter, S.A. Wetlands of Tanzania-Proceedings of a Seminar on the Wetlands of Tanzania; Kamukala, G.L., Crafter, S.A., Eds.; IUCN: Morogoro, Tanzania, 1993. [Google Scholar]
- Huising, E.J. Wetland monitoring in Uganda. Int. Arch. Photogramm. Remote Sens. Spat. Inf. Sci. 2002, XXXIV(6/W6), 127–135. [Google Scholar]
- Uganda Ministry of Water, Lands and Environment-Wetlands Inspection Division. Uganda Wetlands Sector Strategic Plan 2001–2010. Available online: http://www.foodnet.cgiar.org/scrip/docs&databases/ifpristudies_ug_nonscrip/pdfs/Nationa_Wetlands_Programme/Uganda%20Wetland%20Sector%20Strategic%20Plan%202001-10.pdf (accessed on 7 January 2015).
- Kuria, D.N.; Menz, G.; Misana, S.; Mwita, E.; Thamm, H.-P.; Alvarez, M.; Mogha, N.; Becker, M.; Oyieke, H. Seasonal vegetation changes in the Malinda Wetland using bi-temporal, multi-sensor, very high resolution remote sensing data sets. Adv. Remote Sens. 2014, 3, 33–48. [Google Scholar] [CrossRef]
- Mwita, E.; Menz, G.; Misana, S.; Nienkemper, P. Detection of small wetlands with multi sensor data in East Africa. Adv. Remote Sens. 2012, 1, 64–73. [Google Scholar] [CrossRef]
- Mwita, E.; Menz, G.; Misana, S.; Becker, M.; Kisanga, D.; Boehme, B. Mapping small wetlands of Kenya and Tanzania using remote sensing techniques. Int. J. Appl. Earth Obs. Geoinf. 2013, 21, 173–183. [Google Scholar] [CrossRef]
- McCarthy, J.; Gumbricht, T.; McCarthy, T.S. Ecoregion classification in the Okavango Delta, Botswana from multitemporal remote sensing. Int. J. Remote Sens. 2005, 26, 4339–4357. [Google Scholar] [CrossRef]
- Schmidt, M.; Udelhoven, T.; Gill, T.; Röder, A. Long term data fusion for dense time series analysis with MODIS and Landsat imagery in an Australian Savanna. J. Appl. Remote Sens. 2012, 6. [Google Scholar] [CrossRef]
- European Space Agency. Copernicus Overview. Available online: http://www.esa.int/Our_Activities/Observing_the_Earth/Copernicus/Overview4 (accessed on 7 January 2015).
- European Space Agency. GlobWetland Africa user consultation. Available online: http://due.esrin.esa.int/meetings/meetings302.php (accessed on 7 January 2015).
- Haas, E.M.; Bartholomé, E.; Combal, B. Time series analysis of optical remote sensing data for the mapping of temporary surface water bodies in sub-Saharan western Africa. J. Hydrol. 2009, 370, 52–63. [Google Scholar] [CrossRef]
© 2015 by the authors; licensee MDPI, Basel, Switzerland. This article is an open access article distributed under the terms and conditions of the Creative Commons Attribution license (http://creativecommons.org/licenses/by/4.0/).
Share and Cite
MDPI and ACS Style
Amler, E.; Schmidt, M.; Menz, G. Definitions and Mapping of East African Wetlands: A Review. Remote Sens. 2015, 7, 5256-5282. https://doi.org/10.3390/rs70505256
AMA Style
Amler E, Schmidt M, Menz G. Definitions and Mapping of East African Wetlands: A Review. Remote Sensing. 2015; 7(5):5256-5282. https://doi.org/10.3390/rs70505256
Chicago/Turabian StyleAmler, Esther, Michael Schmidt, and Gunter Menz. 2015. "Definitions and Mapping of East African Wetlands: A Review" Remote Sensing 7, no. 5: 5256-5282. https://doi.org/10.3390/rs70505256