Article

Land Degradation Assessment Using Residual Trend Analysis of GIMMS NDVI3g, Soil Moisture and Rainfall in Sub-Saharan West Africa from 1982 to 2012

1
Department of Geography, Centre for Landscape and Climate Research, University of Leicester, Leicester LE1 7RH, UK
2
NASA Goddard Space Flight Centre, Mail Code 610.9, Greenbelt, MD 20771, USA
*
Author to whom correspondence should be addressed.
These authors contributed equally to this work.
Remote Sens. 2015, 7(5), 5471-5494; https://doi.org/10.3390/rs70505471
Submission received: 7 January 2015 / Revised: 14 April 2015 / Accepted: 20 April 2015 / Published: 30 April 2015
(This article belongs to the Special Issue Remote Sensing of Land Degradation in Drylands)

Abstract

:
Areas affected by land degradation in Sub-Saharan West Africa between 1982 and 2012 are identified using time-series analysis of vegetation index data derived from satellites. The residual trend (RESTREND) of a Normalized Difference Vegetation Index (NDVI) time-series is defined as the fraction of the difference between the observed NDVI and the NDVI predicted from climate data. It has been widely used to study desertification and other forms of land degradation in drylands. The method works on the assumption that a negative trend of vegetation photosynthetic capacity is an indication of land degradation if it is independent from climate variability. In the past, many scientists depended on rainfall data as the major climatic factor controlling vegetation productivity in drylands when applying the RESTREND method. However, the water that is directly available to vegetation is stored as soil moisture, which is a function of cumulative rainfall, surface runoff, infiltration and evapotranspiration. In this study, the new NDVI third generation (NDVI3g), which was generated by the National Aeronautics and Space Administration-Goddard Space Flight Center Global Inventory Modeling and Mapping Studies (NASA-GSFC GIMMS) group, was used as a satellite-derived proxy of vegetation productivity, together with the soil moisture index product from the Climate Prediction Center (CPC) and rainfall data from the Climate Research Unit (CRU). The results show that the soil moisture/NDVI pixel-wise residual trend indicates land degraded areas more clearly than rainfall/NDVI. The spatial and temporal trends of the RESTREND in the region follow the patterns of drought episodes, reaffirming the difficulties in separating the impacts of drought and land degradation on vegetation photosynthetic capacity. Therefore, future studies of land degradation and desertification in drylands should go beyond using rainfall as a sole predictor of vegetation condition, and include soil moisture index datasets in the analysis.

Graphical Abstract

1. Introduction

Livelihoods and wildlife in the Sub-Saharan West African environment depend largely on the moisture regime, which is the main limiting factor to ecosystem productivity [1]. Historically, wetter climate prevailed in the Sub-Saharan region between 1930 and 1965, which was followed by extreme widespread droughts from 1968 to 1973, 1982–1985 and in the 1990s leading to large-scale food shortage and famine [1,2]. Speculations about major causes of these droughts are still unresolved [3] and to date, there are two major multifaceted explanatory frameworks. On the one hand, it has been argued that rainfall variability in the region is influenced by large-scale sea surface temperature (SST) patterns, which is evidenced by overall changes in anomaly trends [4,5]. On the other hand, some studies have claimed that rainfall variability in the area can be traced to the overall changes in land cover and land-atmosphere interactions in the region [1,6,7].
The overall impacts of the droughts led to widespread land degradation in the Sub-Saharan West Africa, especially in the Sahel. However, the debate on the relative importance of climate and human actions as controlling factors of land degradation, and in particular vegetation degradation in the region, started in the 1930s [8]. Today, land degradation, which is sometimes used synonymously with desertification in dryland areas, is identified as one of the pressing environmental problems in the Sub-Saharan West Africa [9,10]. The term was first introduced by French forester Aubreville in 1949, when he was working in West Africa to describe the extent of vegetation degradation he found in the region. It received international attention following the Sahelian drought of 1968–1973 [2,11,12]. Later it became clear that desertification is not only confined to Africa, but is occurring across all the major global drylands [13].
To date, there are over 100 definitions of desertification covering different spatial and temporal dimensions, making the concept one of the most hotly debated fields in environmental studies [14]. The scientific discussion of land degradation is growing rapidly and in this article, we synonymously use the term “land degradation” to refer to desertification and adopt the United Nations Convention to Combat Desertification (UNCCD) definition as a “reduction or loss, in arid, semi-arid and dry sub-humid areas, of the biological or economic productivity and complexity of rain fed cropland, irrigated cropland, or range, pasture, forest and woodlands resulting from land uses or from a process or combination of processes, including processes arising from human activities and habitation patterns” ([15] art.1 a). According to this definition, land degradation implies a persistent reduction of land productivity. This reduction expresses itself in a declining provision of the land’s biological products, including forage, food, fiber, timber, etc.
In spite of this definition, the concept, the extent, alleged causes, links among the causes as well as the potential impacts and consequences of land degradation are still causing disagreement among scientists, land managers and policy makers [16,17]. Land degradation is the result of the temporal and spatial long-term decline of vegetation cover and primary productivity; therefore the temporal decline in primary productivity in drylands is a strong indicator of land degradation [18].
Evidence to support land degradation and its likely environmental, ecological and socio-economic impacts have been well documented over the last five decades [2,11,12,19]. Such evidence includes a decline in agricultural productivity, reduction in vegetation cover, change in mean climate and seasonality, migration of vegetation species to more favorable areas and rural-urban migration among others. These impacts are believed to result from natural factors (in particular drought) and human mismanagement [14,20,21]. Separating and attributing the extent of climate and human influences on land degradation remains a challenge, even to this day [22].
Research on land degradation in the Sub-Saharan West Africa from 1980 onwards has followed a new line of reasoning, enabled by the availability of increasingly long-term satellite time-series data [23]. The accessibility of NDVI data from the National Oceanic and Atmospheric Administration—Advanced Very High Resolution Radiometer (NOAA-AVHRR) has enabled intensive research in the Sahel environment. Many recent studies have questioned the continued land degradation in the area. Some studies have described a greening of the Sahel [18,23,24,25,26,27]—an increase in NDVI; others have found mixed greening and browning—a decrease in NDVI—in satellite data records of the region [28,29,30]. Finally, some studies have argued that vegetation impoverishment takes place in the Sahel through species migration and local extinctions in spite of the overall greening trend, which is evidence for continuing land degradation [31,32].
Drivers of vegetation photosynthetic capacity in the Sub-Saharan West Africa are manifold, but it is generally believed that rainfall is the main factor and strong relationships with NDVI in the area have been found [3,33,34,35]. The best correlation between NDVI and rainfall ascends to multi-month moisture totals and NDVI lagging rainfall. Rainfall is not directly available to plants but is partitioned into runoff, groundwater recharge, soil moisture and evapotranspiration. This suggests that soil moisture, an index of the portion of the rainfall that becomes directly available to plants, would be a better indicator of the greening or increased photosynthetic capacity than immediate rainfall in the area [33]. Many studies in the Sub-Saharan Africa have neglected the influence of soil moisture and focus only on rainfall when examining Sahelian vegetation greenness trends. Until recently, a lack of long-term soil moisture data for the region has limited progress in this field. Today, gridded long-term satellite and model-based soil moisture data products are available providing new opportunities to further explore the vegetation dynamics in the area.
The link between soil moisture and vegetation dynamics impacts on the structure and function of arid and semi-arid ecosystems. It has been argued that the development of dryland vegetation depends largely on the availability of soil water resources, and irregular patterns of vegetation distribution a re-current attribute of dryland environment is usually associated with heterogeneous patterns of root zones soil moisture [36]. The feedbacks between vegetation and soil moisture vary not only across various ecosystems, but also within between different vegetation life forms and canopy structure. This led to the formation of two different stable states of vegetation: one with moister sub-canopy soils that are capable of supporting woody seedlings and plant growth and another on dry inter-canopy soils that are too desiccated for woody vegetation growth and survival. As a result of non-linear changes caused by the dynamics of vegetation-soil moisture feedbacks, changes in climate forcing and the disturbance regime can lead to rapid degradation from sparsely vegetated to bare soil conditions. The abrupt nature of this change has been often associated with the rapid rate of desertification, taking place in most of the drylands around the globe [6].
Greening or increased photosynthetic capacity is generally seen as an indicator of vegetation improvement and browning or decreased photosynthetic capacity is an indicator of reduced vegetation density, which, if continued over time, results in land degradation. These observables have widely been used to study land degradation and to disentangle human impacts and climate influence on the greening-browning trends [37]. From the traditional use of rain use efficiency [38,39,40,41] to the process-based modeling approach [42] and to the more recent statistical and residual trend analyses [18,22,26,30,43,44,45], the majority of studies have assumed that correcting for climate components of greening-browning allows an examination of the status of an ecosystem, which can then be used to infer whether an area is degraded or not.
The use of rain use efficiency (RUE, a ratio between above-ground net primary productivity, ANPP, and annual rainfall) to study land degradation has been questioned by some authors [44,46]. This is due to the over-dependence of RUE on ANPP, the lack of accurate information on ANPP for very low rainfall and the discovery that some land degradation scenarios do not cause changes in ANPP. For instance, the study by [47] found a replacement of grassland by desert scrub, an indication of land degradation, with little or no reduction in average ANPP. Although the use of statistical trend analysis in detecting land degradation has its own limitations [48,49], residual trend analysis (RESTREND) [22] is today one of the most reliable trend analysis technique for disentangling the effects of climate from human-accelerated land degradation and its results were found to be more effective than that of the RUE method.
In the RESTREND method, analyzing the residuals from the NDVI-soil moisture or NDVI-rainfall regression model over time reveals the proportion of NDVI change that is not due to climatic variability. A significant increase of the residual NDVI over time is considered as an indication of an increase in vegetation photosynthetic capacity, while a gradual decrease is suggesting a decrease in vegetation photosynthetic capacity. Areas with a long-term decline in vegetation vigor are assumed to be subject to land degradation. The main limitation of most of the previous studies on land degradation using the RESTREND method is that they largely constrained themselves to the analysis of rainfall as the sole driver of vegetation productivity with little or no consideration of soil moisture, even though soil moisture is the ecological water resource that plants can access.
The present study applies the RESTREND method to assess land degradation in the Sub-Saharan West Africa using the new Global Inventory Modeling and Mapping Studies (GIMMS) Normalized Difference Vegetation Index 3rd generation (NDVI3g), rainfall and soil moisture data products. It compares the spatial and temporal distribution of degraded areas and their links to rainfall and soil moisture changes from 1982 to 2012.

2. Experimental Section

The study area is Sub-Saharan West Africa and covers an area of approximately 6,140,000 km2 and it extends from the arid and semi-arid regions to the North, down to the Atlantic Ocean to the South. The Eastern border is less precisely defined, running approximately from Mount Cameroun to Lake Chad. The vast majority of the land in the area is low-lying at <300 m above mean sea level. Isolated mountains exist in several countries along the southern shore. The northern part of the region consists of semi-arid terrain and is known as the Sahel, the transitional boundary between the Sahara and the savanna. Tropical forest forms a belt along the southern coast, ranging from 160 to 240 km in width. This zoning is determined by the rainfall gradient.
The climate of the study area is characterized by high temperatures throughout the year and a variable rainfall regime depending on the latitudinal location. The entire geography of the region is strongly determined by the climatic zones. The area has distinctive and diverse landscapes, with subtropical desert landscapes to the north, bordering the Sahara desert and tropical rainforests in the humid South and West and down to the Atlantic coast as shows in Figure 1.
Figure 1. The ecological regions of West Africa (data source [50]).
Remotesensing 07 05471 g001

2.1. Datasets

2.1.1. NDVI

NDVI is the most commonly used remote sensing dataset for vegetation and land degradation monitoring. In this study, NDVI is used to represent photosynthetic capacity of vegetation after [51] and it is widely used as a surrogate for various vegetation characteristics [24,52]. It is a sensitive indicator of the interannual variability of rainfall. This study uses the Global Inventory Modeling and Mapping Studies (GIMMS) Normalized Difference Vegetation Index 3rd generation (NDVI3g) dataset for the African continent [53]. The data is a new long-term time series of NDVI, which was derived from NOAA AVHRR instruments (sensor 7, 9, 11, 14, 16, 17, 18 and 19). The data is an improved version of the previous GIMMS NDVI [53] and processed using an adaptive Empirical Mode Decomposition (EMD) [54]. The EMD is used to find and remove artifacts from the NDVI time-series including solar zenith angle, trends associated with orbital drift, discrepancies in the AVHRR data among sensors due to their differences and other extra factors that introduce nonlinear and non-stationary effects to the dataset. In contrast to the previous version, the new dataset covers the period of July 1981 to December 2012 with a bi-weekly temporal and 8 km spatial resolution [55]. The effect of sensor change that affected the quality of the AVHRR sensor is significantly reduced in the new GIMMS NDVI3g.
The GIMMS NDVI product has been tested and compared with other products such as Spot-4 VGT and MODIS NDVI by other studies and it was found to be consistent with these products. The study by [56] showed that GIMMS NDVI explained more of the variance of Spot-4 VGT NDVI compared to PAL; therefore, it is considered the more accurate long-term AVHHR data product. Similarly, the work of [57,58] reported the consistency and strong correlation between the average annual value of GIMMS NDVI and MODIS NDVI, this relationship was found to be very strong in the semi-arid West Africa zone.
The data was processed for January 1982 to December 2012 in order to analyze only years with complete data coverage. The NDVI3g dataset comes with the different quality flags, and only flag 1 which is a good value was used for this study in order to restrict the analysis to the most reliable NDVI values [55,59]. The bi-monthly data were converted to monthly aggregates using the maximum value composite (MVC) method [60] in order to further minimize the effects of cloud contamination. They were projected to the WGS 1984 coordinate system. Finally, the data corresponding to the spatial extent of the study area, i.e., 17°W–15°E and 4°N–20°N, were extracted.

2.1.2. Rainfall

Sub-Saharan West Africa has a sparse and irregular rain gauge network [61]. In this study, the newly available Climate Research Unit (CRU) of the University of East Anglia time series (TS) version 3.21 products, released in July 2013 and covering the period 1901 to 2012 were used. The CRU TS v3.21 data is a monthly gridded rainfall estimate based on monthly observational data, which is calculated from daily or sub-daily data by National Meteorological Services and other external agencies.
The data consists of total monthly rainfall in millimeters calculated on a 0.5° grid and are based on an archive of monthly averages of daily maximum and minimum temperatures and rainfall provided by over 4000 weather stations distributed across the world [62]. The CRU v3.21 is an updated version of the CRU v3.20, and extended to 2012 record. All the errors incurred in the old version were corrected [62]. The rainfall data cover the entire period for which NDVI is available. The data were resampled to an 8-km grid using a nearest-neighbor algorithm.

2.1.3. Soil Moisture

Soil moisture estimates were generated by NOAA’s National Center for Environmental Prediction (NCEP), Climate Prediction Center (CPC), with global spatial coverage at 0.5° resolution from 1948 to present. The data are calculated on a daily time step based on the water balance in the soil by a layered hydrological model using observed rainfall and temperature [63] and converted into a monthly product (V2). The rainfall data used in the model are based on an interpolation of rain gauge observations at over 15,000 stations worldwide and collected from version 2 data sets of the Global Historical Climatology Network (GHCN) and Climate Anomaly Monitoring System (CAMS) using an optimum interpolation algorithm. The monthly temperatures used in the model were coined from the station observations.
The CPC soil moisture product was modeled based on a single column depth at 1.6 m because for a land surface process, the moisture in the upper 1–2 m is the soil moisture pool that can evaporate back to the atmosphere. It has maximum water holding capacity of 760 mm and common porosity of 0.47 [64]. The data were tested and validated with in situ soil moisture as well as other global products. In spite of its simplicity, the product matches the seasonal and interannual variability of in situ soil moisture fairly well. The results of its comparison have shown that it agrees well with most of the observed and other modeled products including the Gravity Recovery and Climate Experiment (GRACE) soil moisture product. Its column depth of 1.6 m is suitable for vegetation growth, as soil moisture content within the upper 60 cm is the key factor that restricts seed germination and seedling growth and affects vegetation growth and density [65]. The authors of [66] found the CPC soil moisture product to be suitable for a warmer climate that is marked by contrasting wet and dry seasons; hence it is suited well for the West African environment.
The data corresponding to the temporal and spatial extent of NDVI and rainfall was extracted, resampled and projected to the NDVI and the rainfall format.

2.2. Methods of Analysis

Statistical techniques were applied to evaluate the nature and the strength of the linear relationship between NDVI and rainfall, or respectively soil moisture, in order to examine the spatio-temporal patterns of the residual NDVI trends over the 31 years of the study period (January 1982 to December 2012).

2.2.1. Regression Analysis

First, pixel-wise ordinary least square (OLS) regression models of NDVI against rainfall and soil moisture were computed using mean annual data. The OLS minimizes the sum of the squared residuals and it is widely used in environmental studies [67]. The method measures the linear relationship between a dependent (y) and independent variables (x), and it is represented by the equation:
y = α + β x + ε
Where:
  • y = Dependent variable and in this case the NDVI
  • x = Independent variable i.e., rainfall and/or soil moisture
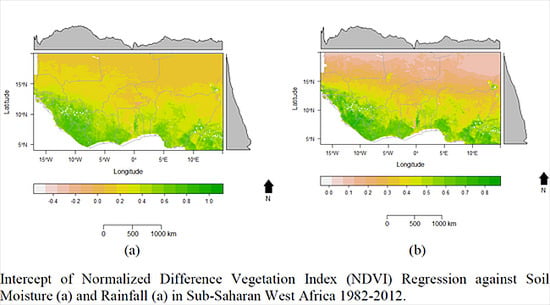
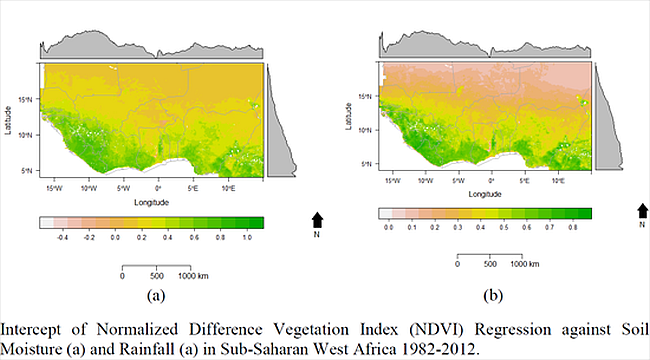
  • α = intercept, which represents the value of y when x is 0 (measured in units of the y variable).
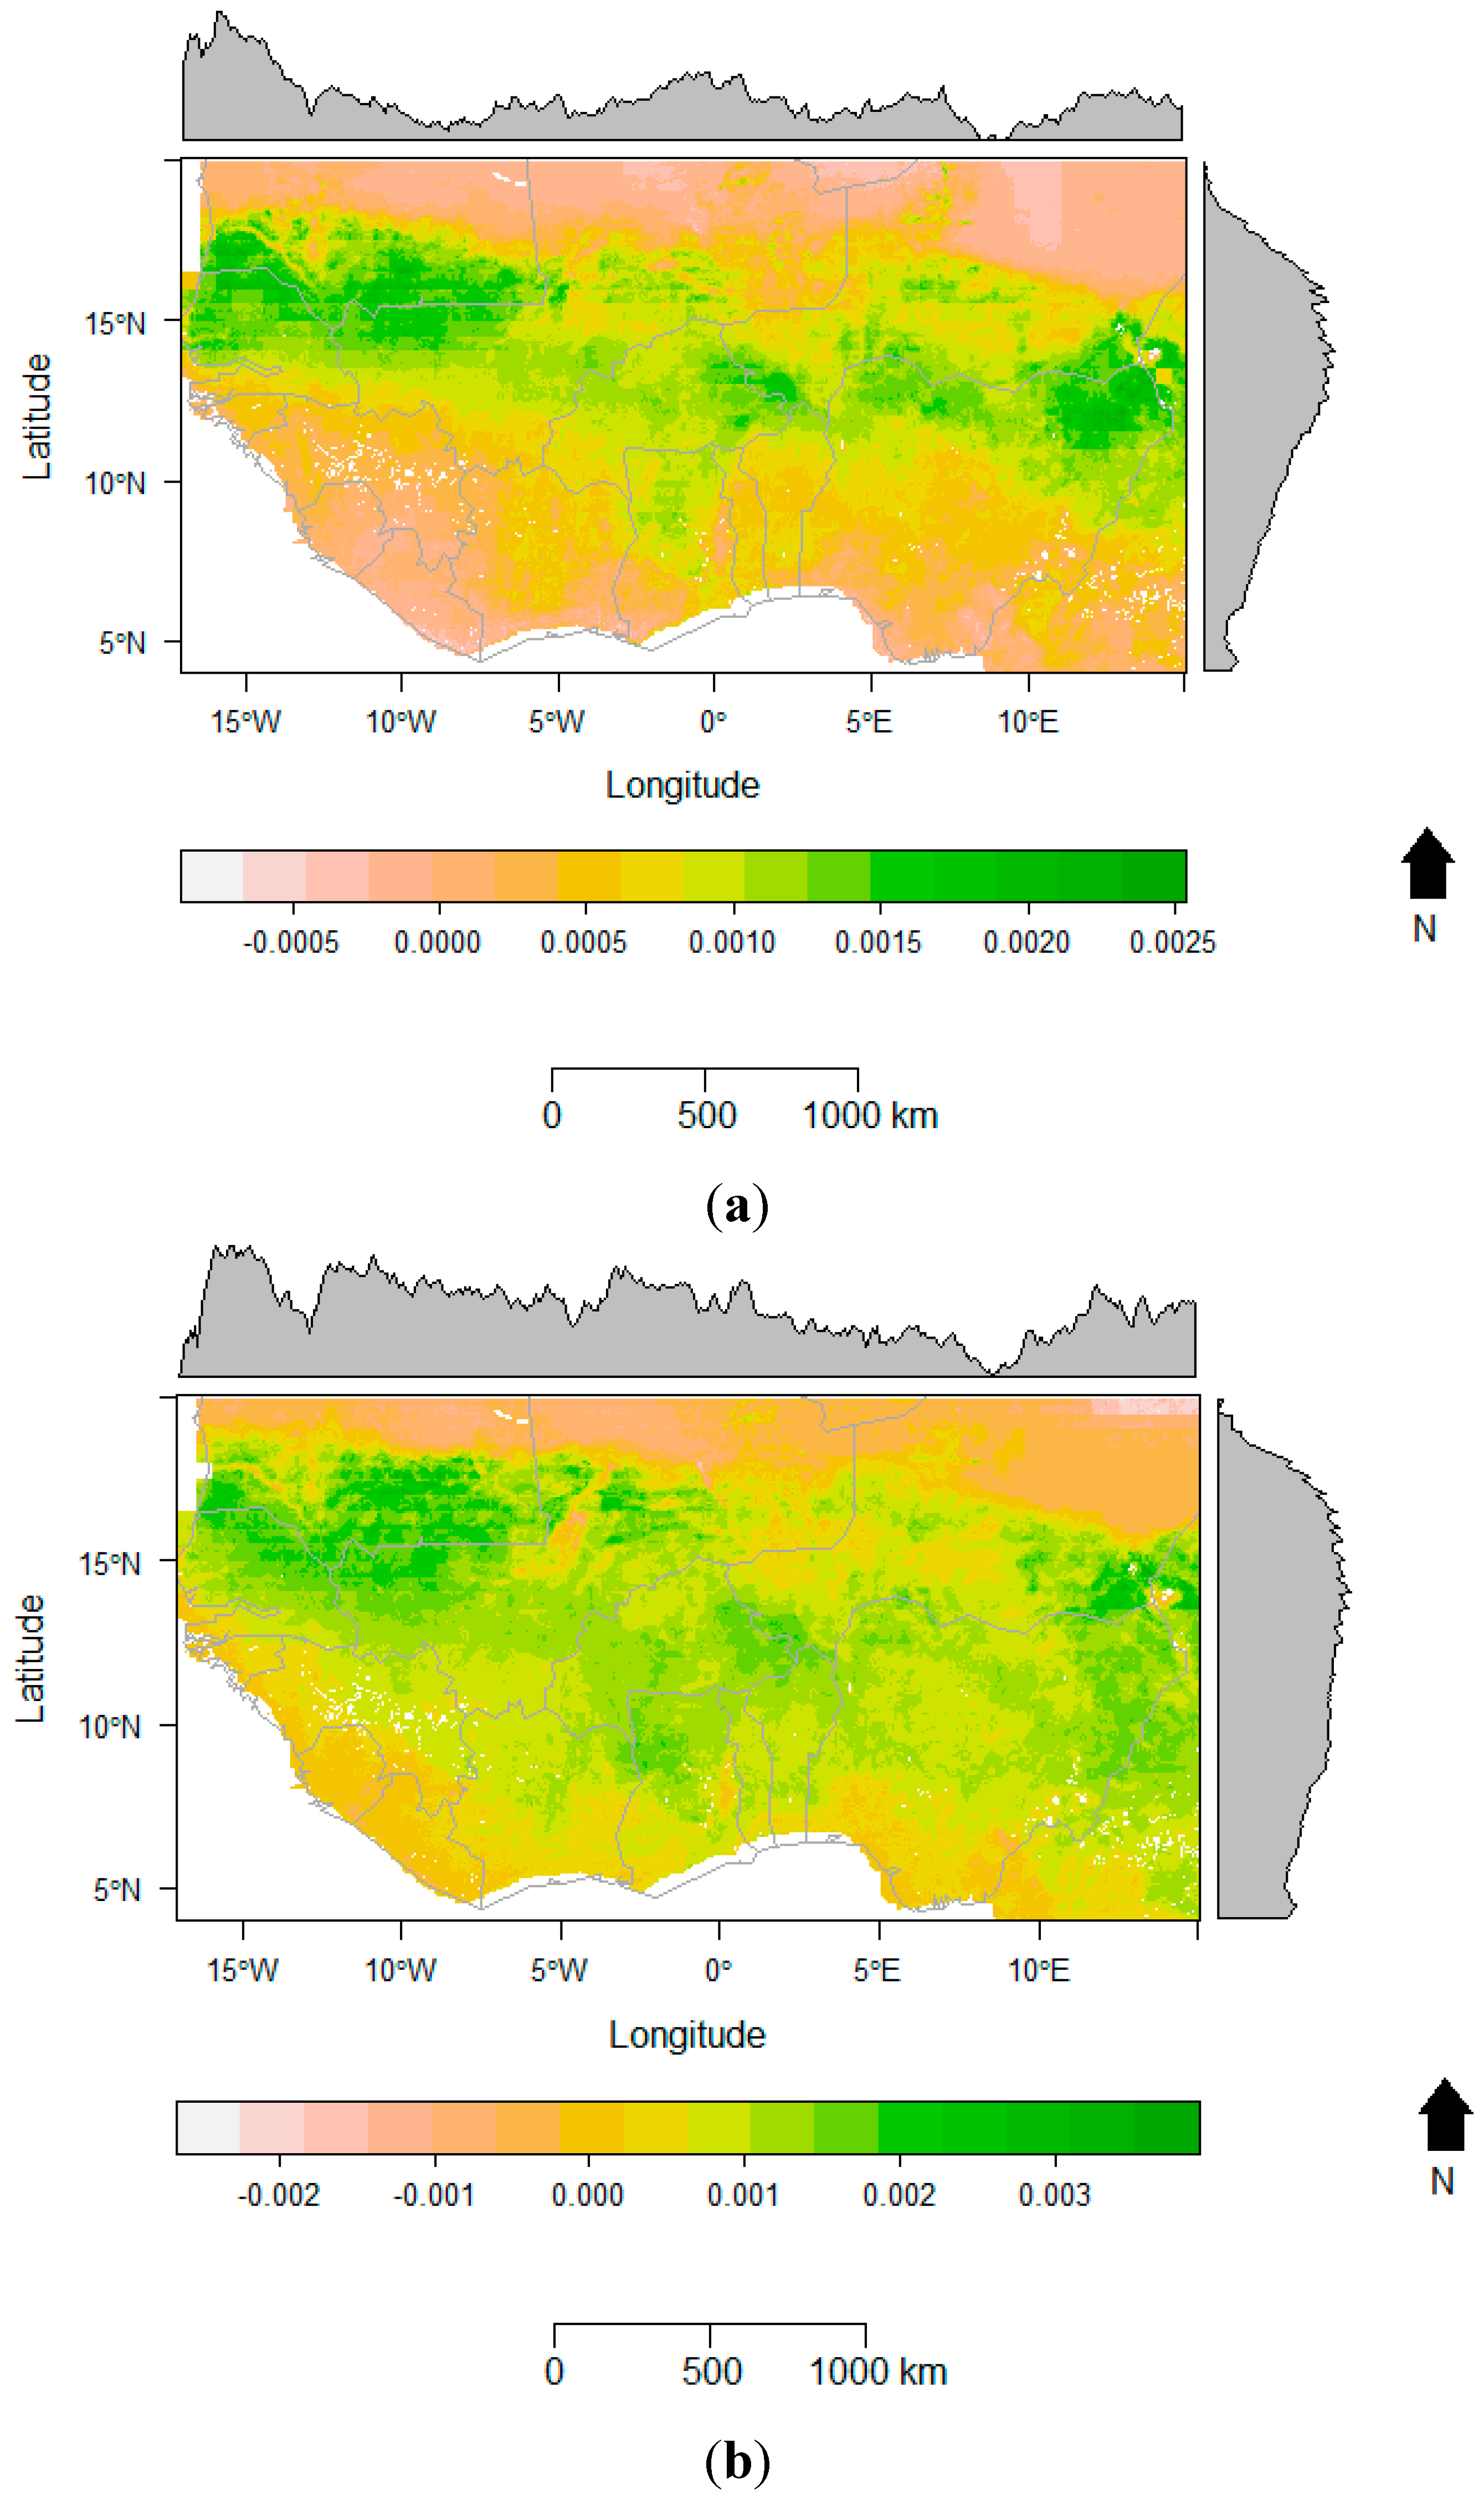
  • β = slope of the relationship between the x and y variables, and it measured the rate of change of y per unit change of x.
  • ε is the error term.

2.2.2. Residual Trend Analysis Method (RESTREND)

The RESTREND analysis method examines the trend of the residual differences between the observed NDVI and the predicted NDVI from the linear regression model with either rainfall or soil moisture as the explanatory variable. The method assumes that water is the most limiting factor to vegetation productivity in most of the dryland ecosystems and there is a strong correlation between vegetation productivity and climatic variables in dryland areas [22,30,48]. Ecosystem productivity in drylands reaches its climax in years with a very high amount of rainfall; hence, it is possible to understand the effect of human-induced activities on the general vegetation condition if the impacts of rainfall and other climatic factors, such as soil moisture, have been accounted for. The method follows three steps.
  • First, a regression model between the observed NDVI and rainfall or soil moisture is calculated for each pixel.
  • Second, the residual difference between the observed NDVI and the predicted NDVI from the linear model is calculated. This is called RESTREND residuals.
  • Third, another linear regression of the RESTREND residuals against time is carried out. Trends in these residuals are interpreted as changes in vegetation productivity that are independent of rainfall or soil moisture and are used as an indicator of land degradation.

2.2.3. Mann-Kendal Non-Parametric Trend Analysis

This non-parametric statistical method was applied to examine the consistency of RESTREND in the study area. It was first described by Mann in 1945 and has been widely used in environmental time-series data analysis [43]. Kendall’s coefficient τ measures the extent to which a trend is monotonically increasing or decreasing. It ranges from −1 to +1, where −1 indicates a trend that is consistently decreasing and never increases and +1 indicating the opposite. A value of 0 indicates no trend.

3. Results and Discussion

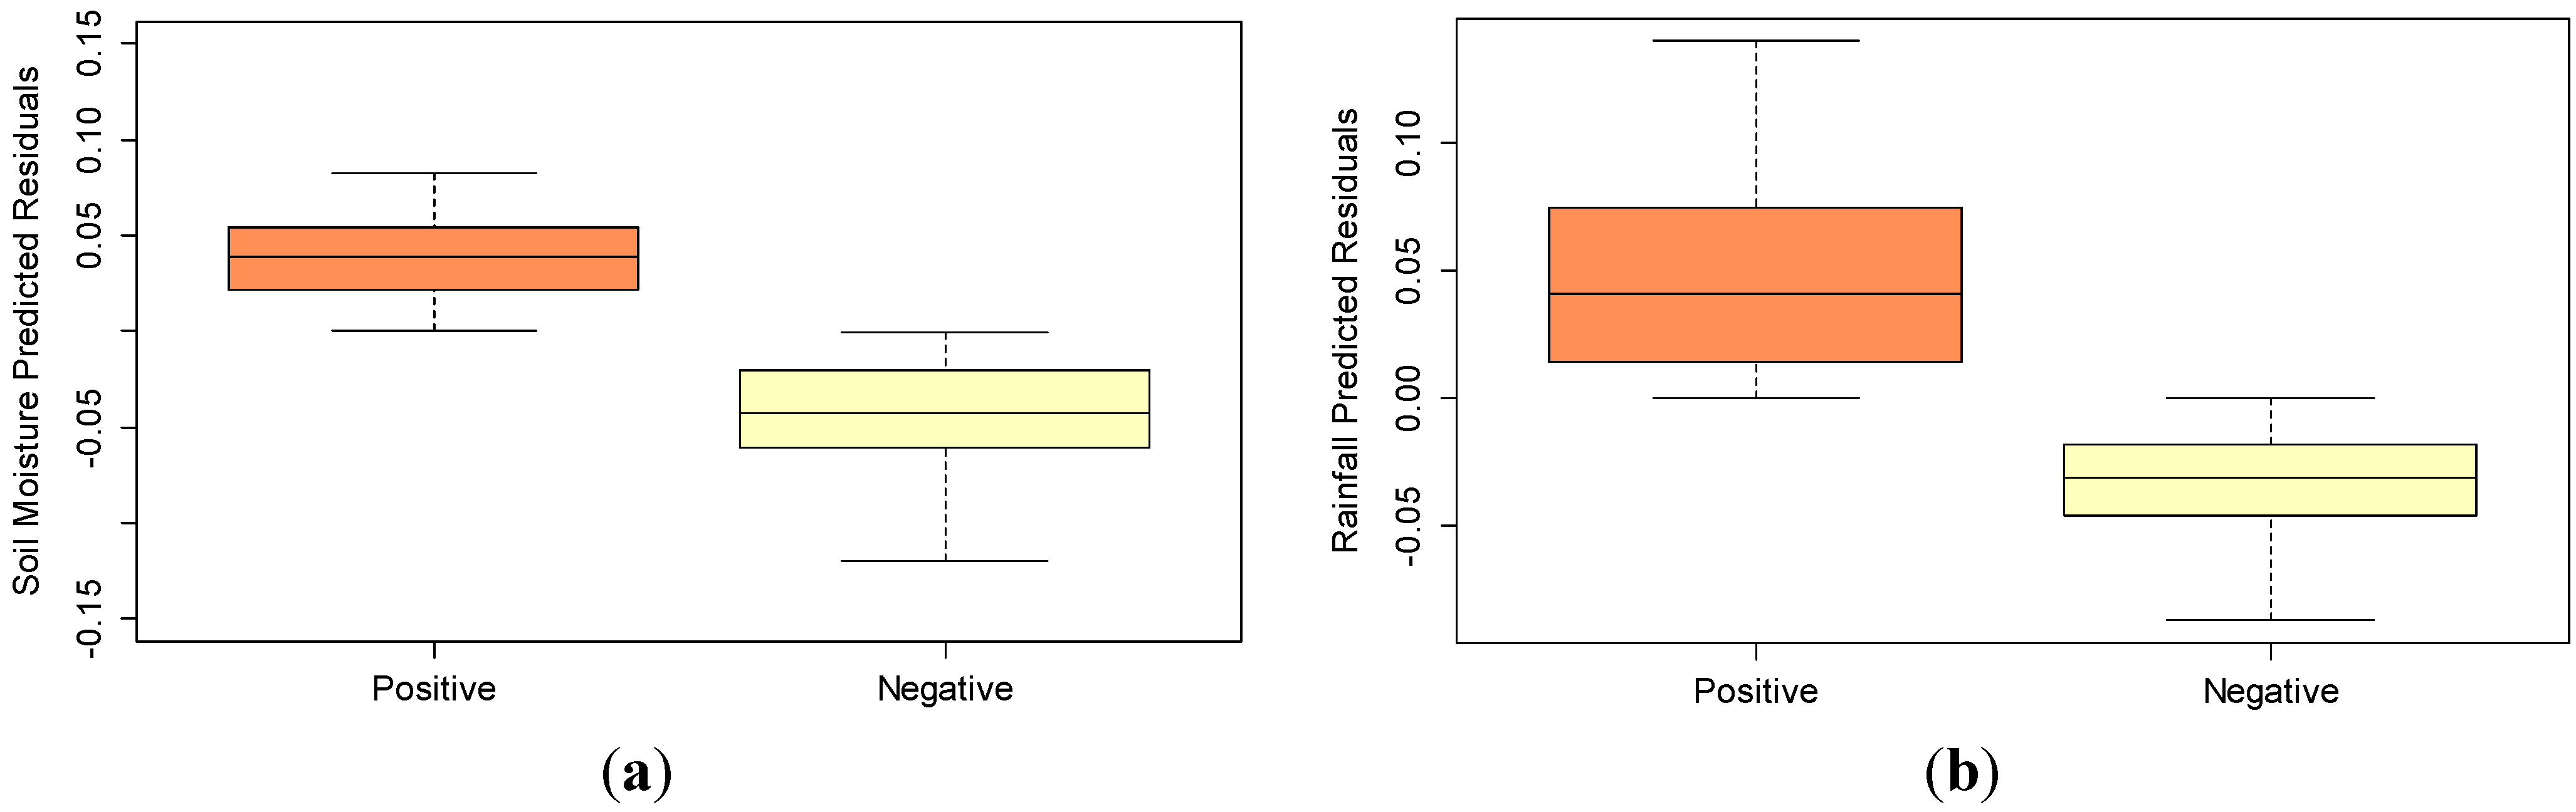
3.1. Comparison between the Rate of NDVI Change due to Changing Rainfall and Soil Moisture

Linear regression models of NDVI against rainfall or soil moisture were analyzed. The per-pixel slope (Figure 2) and intercept (Figure 3) were compared to examine the spatial patterns of the rate of change and the minimum value of NDVI and how they relate to changes in rainfall and soil moisture from 1982 to 2012. In the semi-arid Sahel zone a strongly positive increase of NDVI due to soil moisture is observed, which is less pronounced in the humid coastal areas where soil moisture is generally not in short supply (Figure 2a). NDVI increases in response to higher rainfall in the areas with positive slopes (Figure 2b).
Figure 2. Spatial pattern of slope of the linear regression of Normalized Difference Vegetation Index (NDVI) against (a) soil moisture and (b) rainfall.
Remotesensing 07 05471 g002
The intercept (Figure 3a) represents the NDVI predicted by the regression when soil moisture is zero. It shows that some scattered areas seem to be independent of soil moisture variability or do not experience low soil moisture conditions. This is likely due to the presence of water bodies like lakes and rivers or indicates continuous sufficient precipitation as reflected by the increase of the NDVI values towards the Atlantic coast. However, as a general pattern, NDVI approaches zero when rainfall is zero (Figure 3b). From 15° N latitude northwards this pattern prevails, except in very small portions where the moisture from the nearby water sources such as Lake Chad in northern Nigeria, supplied and compensate for low rainfall due to natural through flow. Also, in both figures, high value of NDVI is concentrated along the coastal areas in the southern and western parts of the study area; this is due to the availability of water in the soil throughout the year around these areas.
Figure 3. Intercept of NDVI in West Africa when (a) soil moisture is zero and (b) rainfall is zero.
Remotesensing 07 05471 g003

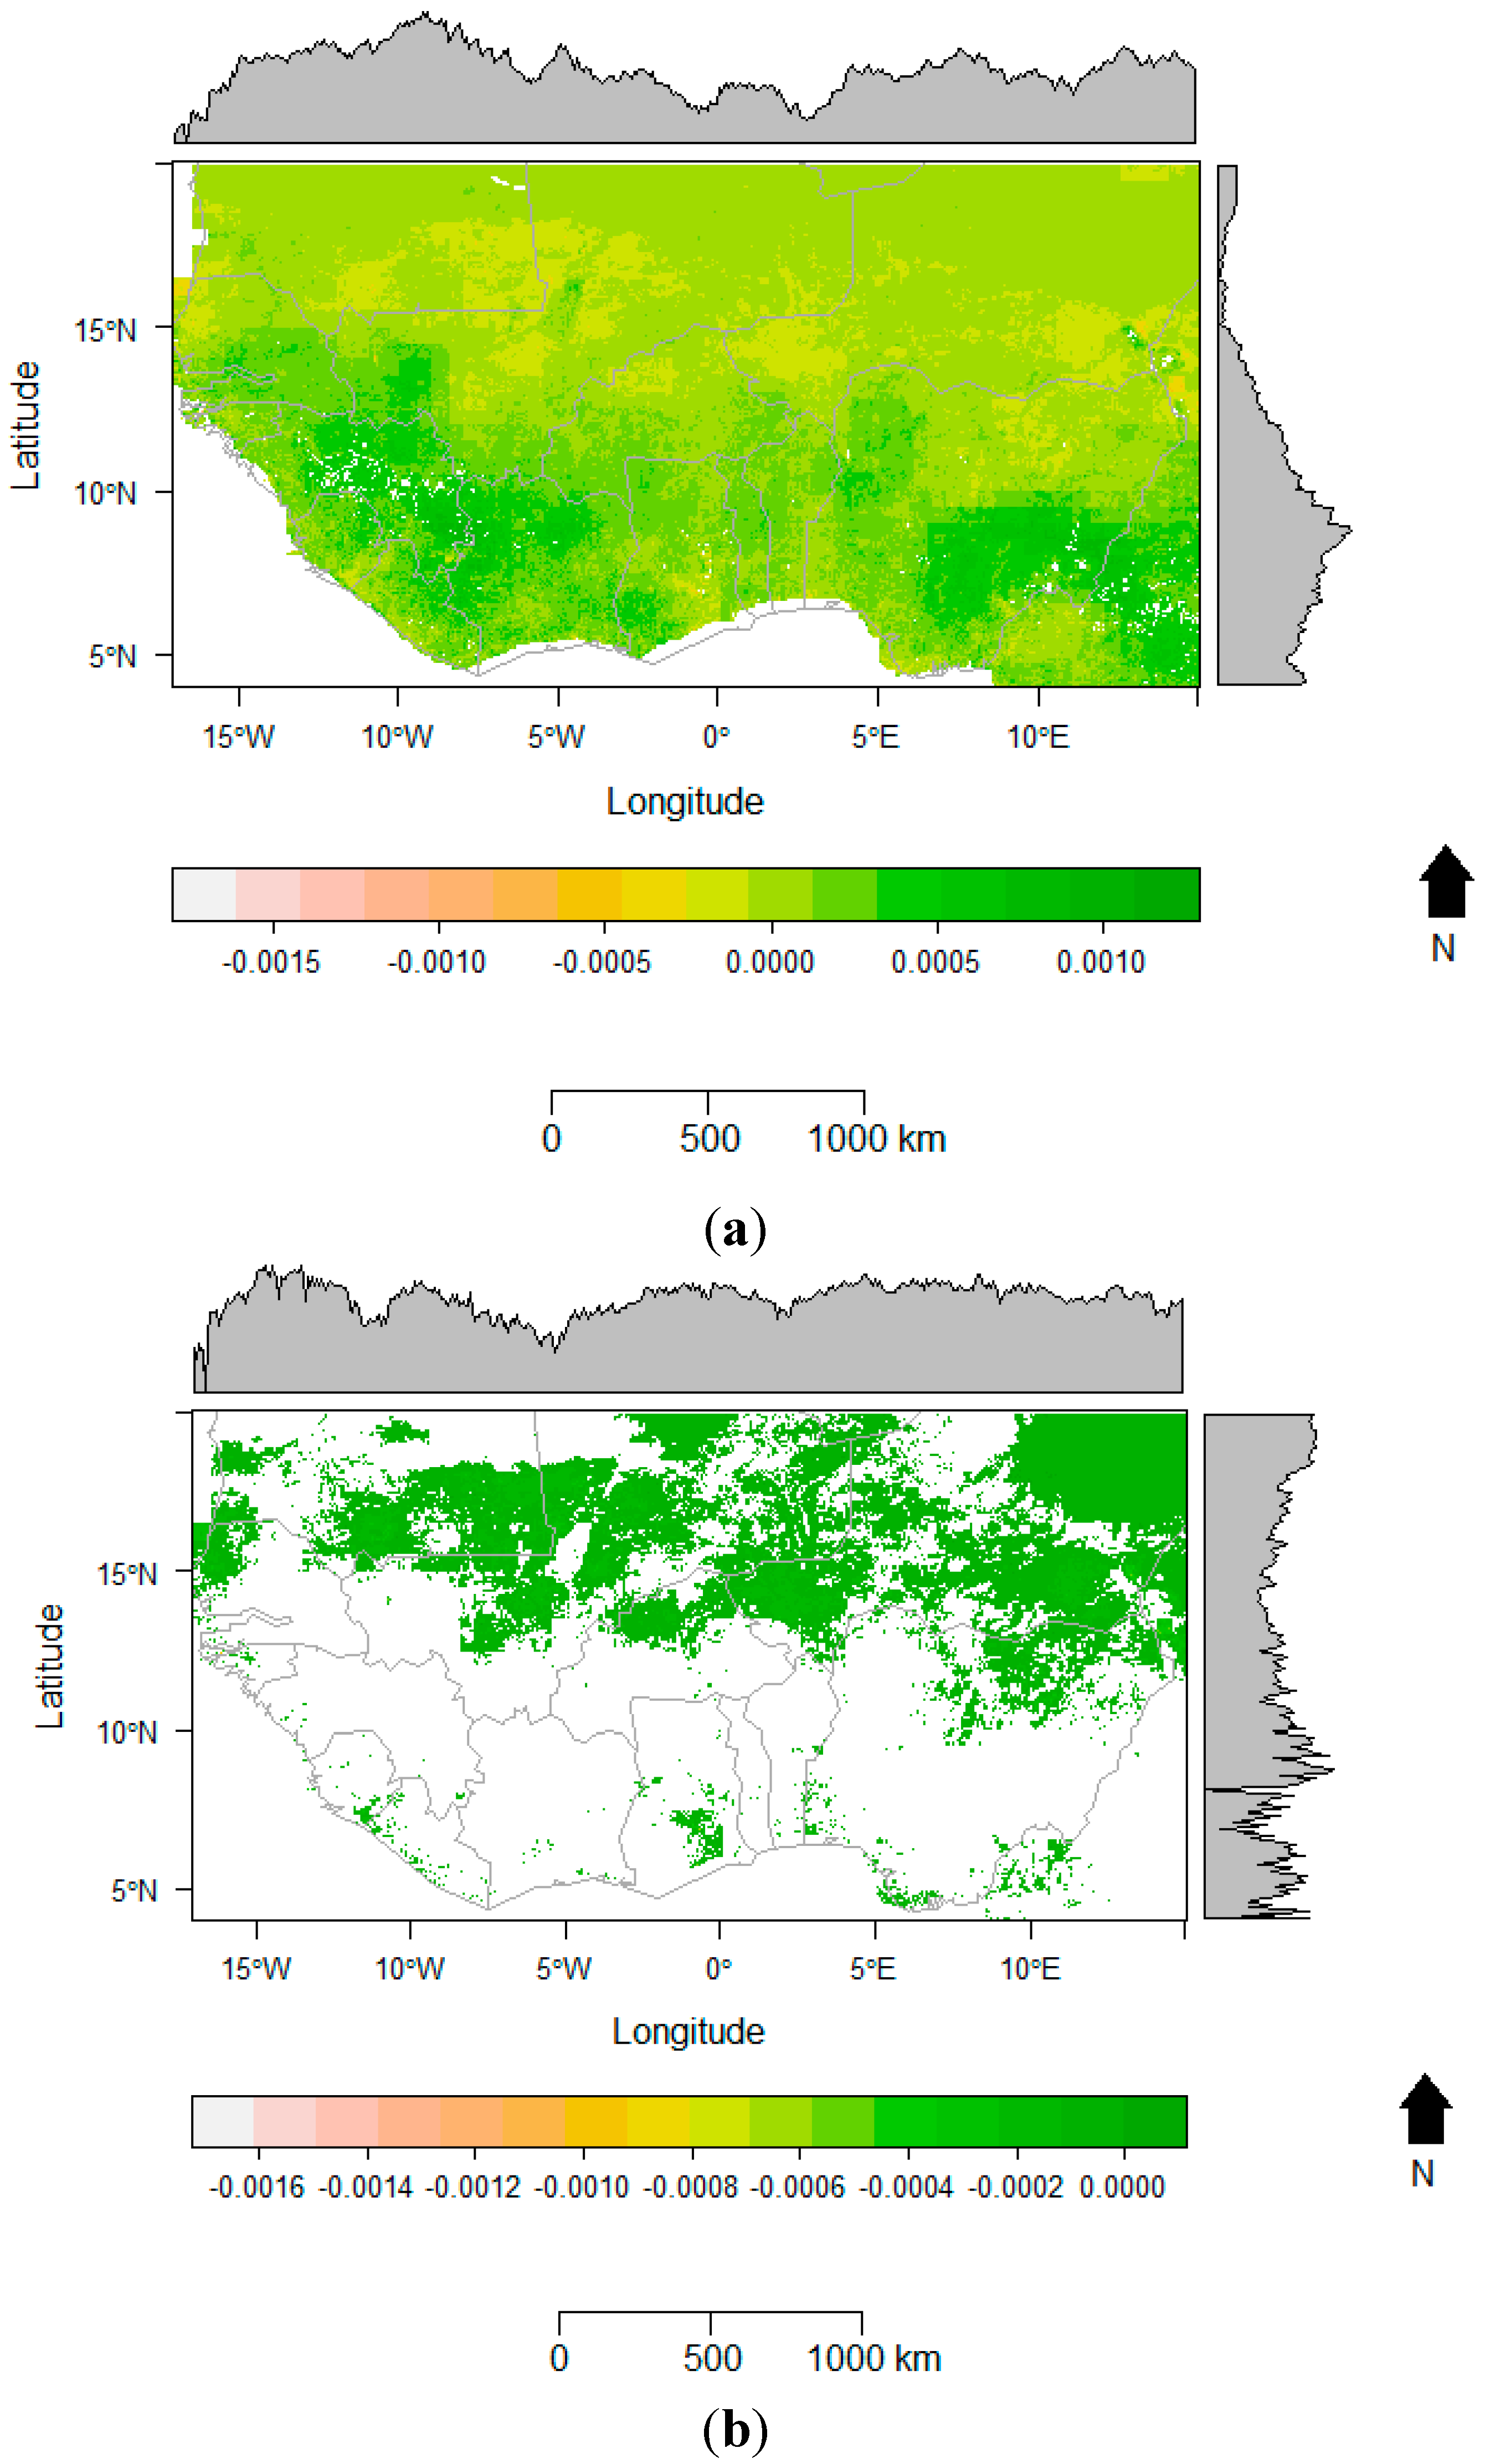
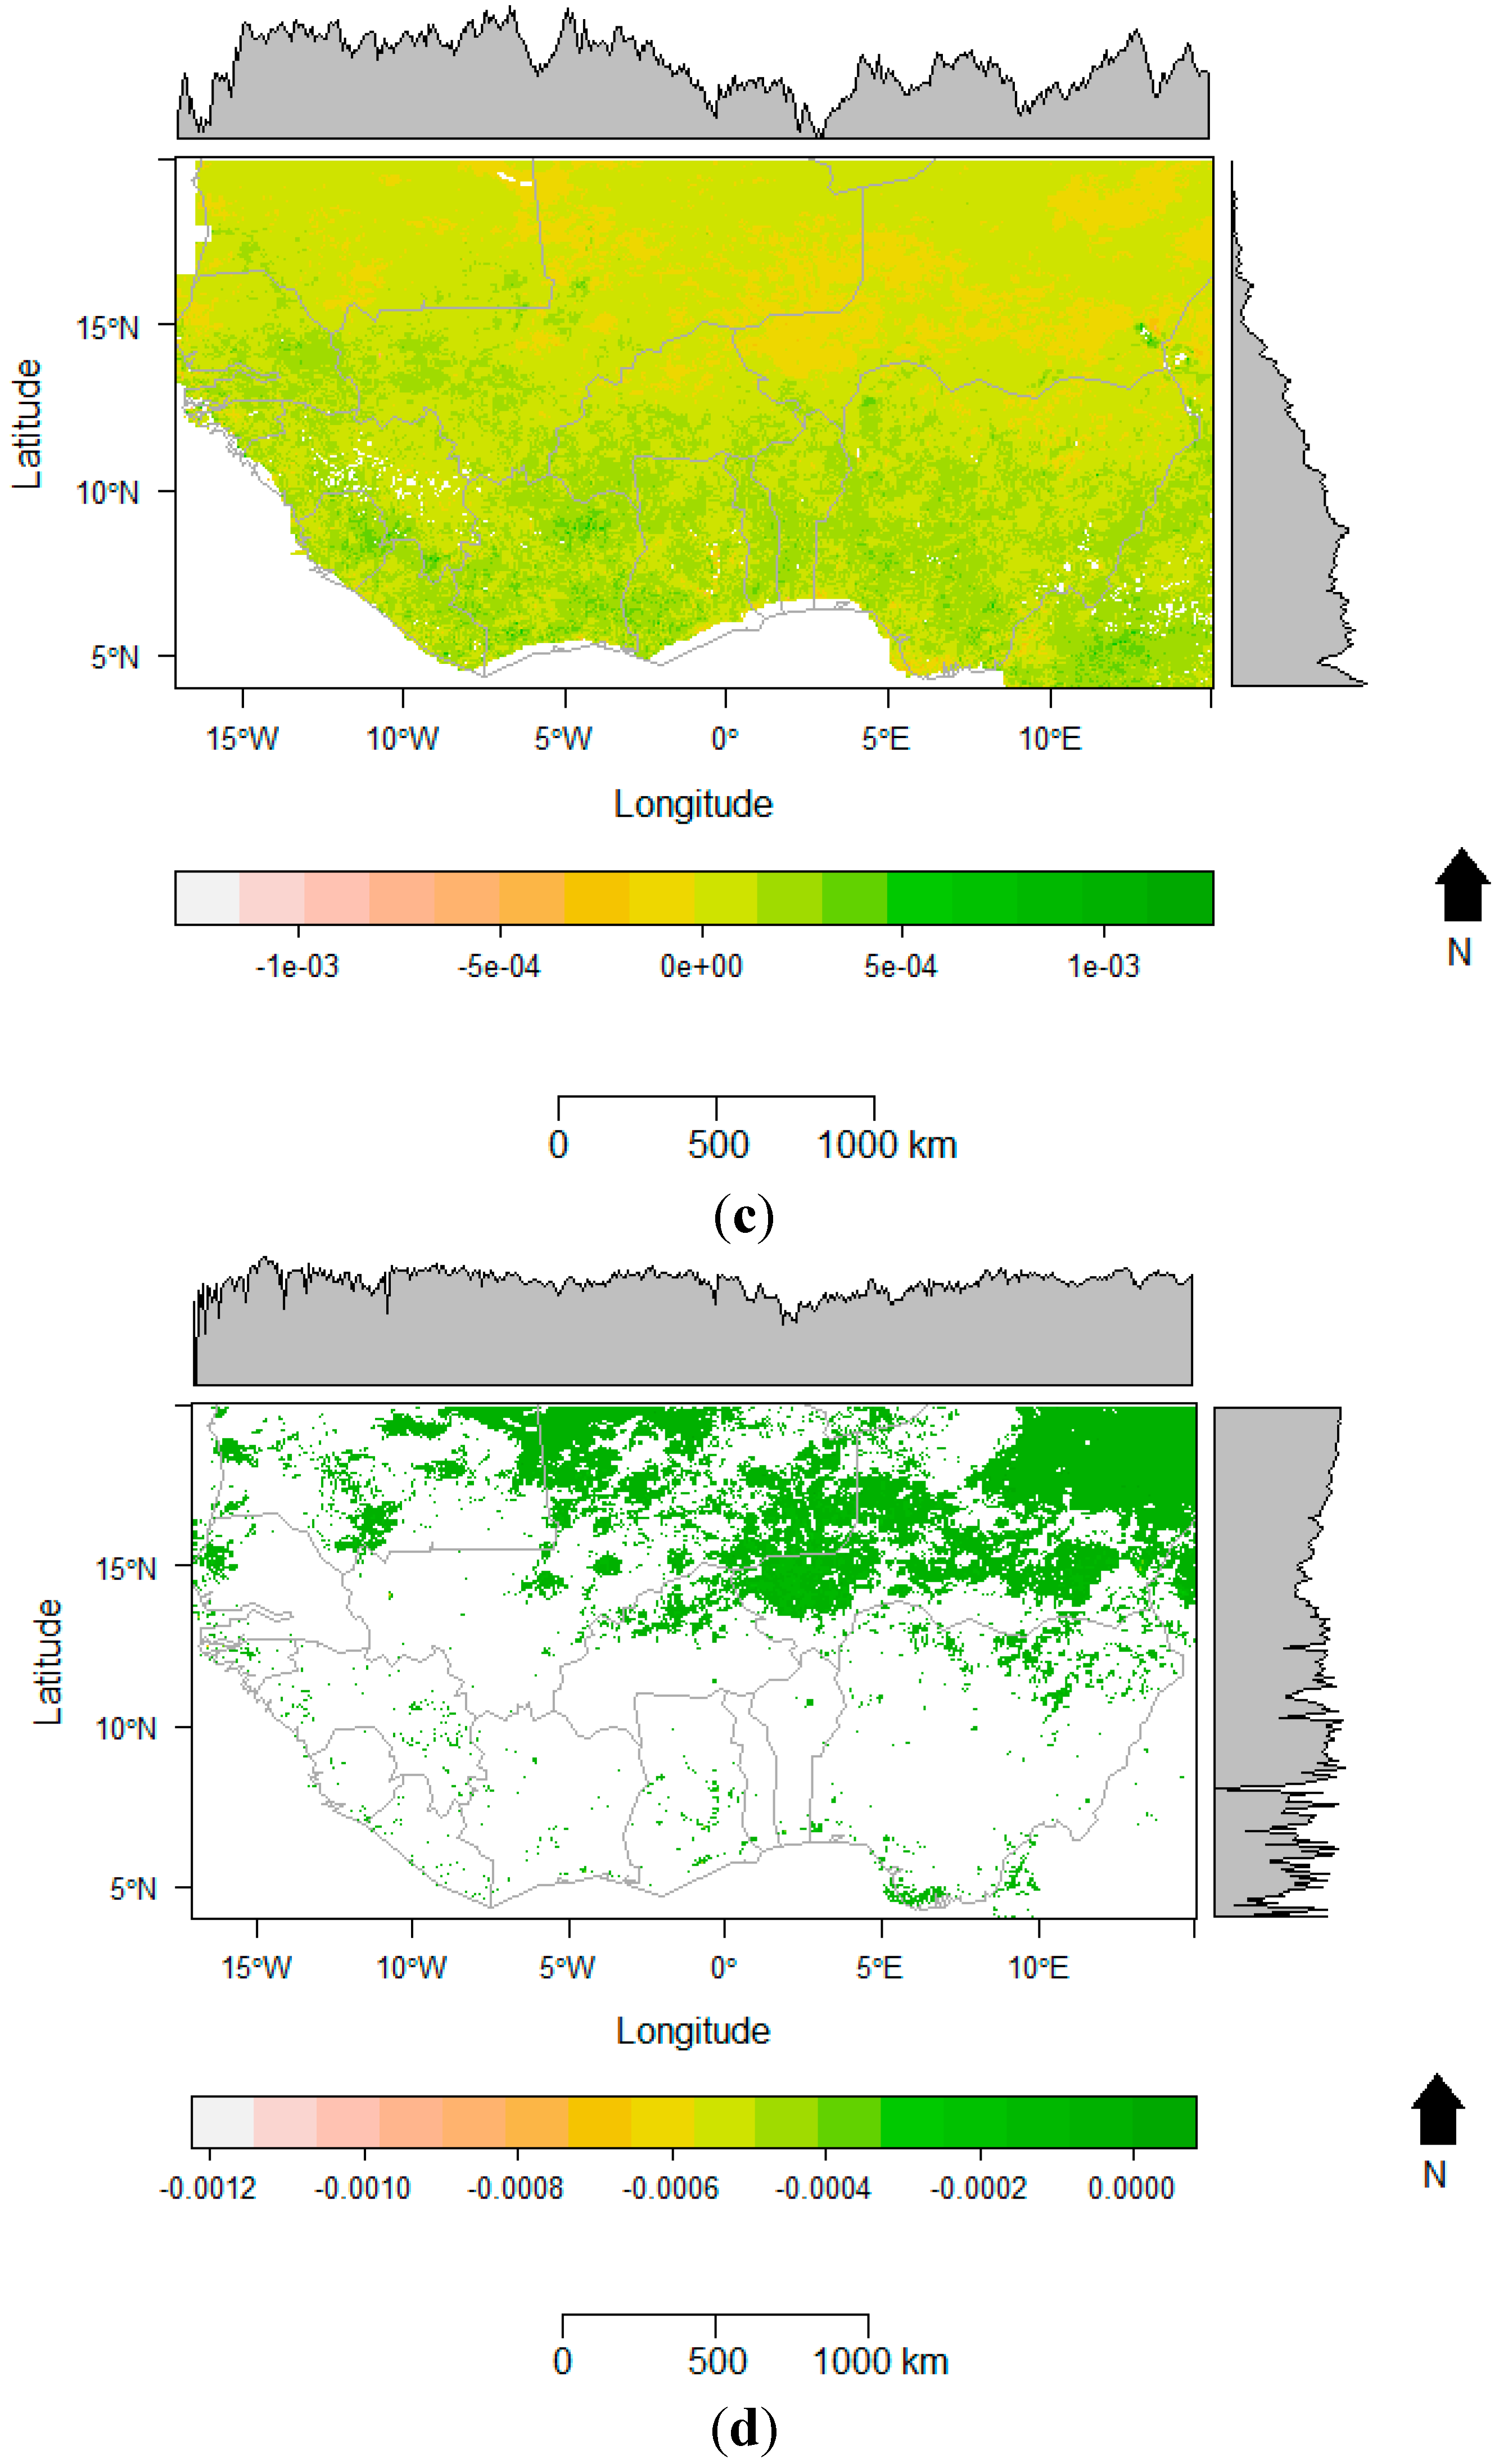
3.2. Spatial Patterns of the Residual Trends of Soil Moisture and Rainfall

An analysis of the residual NDVI that is not explained by rainfall (or soil moisture) and its trend over time provides additional information on the land degradation process. This trend was analyzed spatially to identify regions with significant negative or positive trends of the residual NDVI. Such areas show vegetation photosynthetic changes that are caused by factors other than moisture variability. The RESTREND method assumes that areas that show a negative trend are degraded, while those with a positive trend are improved or at least not degraded. Figure 4 shows the RESTREND results based on soil moisture (a,b) and rainfall (c,d).
Figure 4. Spatial distribution slopes of the residuals of regressions of NDVI against time (a) from the RESTREND analysis using soil moisture and (b) areas with significant negative trends (95% confidence) (c) from the RESTREND analysis using rainfall (d) areas with significant negative trends (95% confidence). Negative values indicate land degradation in the study area between 1982 and 2012. White color indicates areas with non-significant changes.
Remotesensing 07 05471 g004aRemotesensing 07 05471 g004b
Figure 4 shows areas with positive and negative trends of vegetation productivity that have been adjusted for either soil moisture or rainfall. In Figure 4a, the RESTREND residuals based on soil moisture show both areas with positive and negative trends. Figure 4b clearly shows areas with significant negative trends and which are considered as degraded. In contrast to the rainfall-based RESTREND residuals in Figure 4c, the trend does not clearly show desertified areas fairly well compared to soil moisture RESTREND. A closer examination of areas with significant negative trends at 95% significant level based on rainfall, as shown in Figure 4d, is also found to be fairly negative compared to areas with significant negative trend based on soil moisture Figure 4b.
Almost all parts of the study area show a mixture of degraded and non-degraded patches, raising doubts about the consistency of the results. However, areas with significant negative trends, i.e., degraded areas can be seen more clearly in Figure 4b north of 12°N latitude, especially in northern Nigeria, Niger, Mali and northern Burkina-Faso. Also in Figure 4d, rainfall-controlled RESTREND shows degradation in the same region, but less pronounced compared to Figure 4b. The two maps in Figure 4b,d show that soil moisture adjusted RESTREND provides a much more robust and consistent identification of areas that show a land degradation trend than rainfall does as shown in the figures. Land degradation is not only confined to the more arid north, but even within humid tropical regions, especially in Ghana, some parts of the Ivory Coast and other southwestern countries in the area.
An examination of the distribution of positive and negative trends of the NDVI residuals from the two models shows that the soil moisture adjusted NDVI RESTREND has a negative trend than the NDVI RESTREND that is adjusted for rainfall variability, as shown in Figure 5. In Figure 5a, the distribution of soil moisture adjusted NDVI residuals shows a predominantly negative trend. The rainfall adjusted NDVI residuals, on the other hand, show overwhelmingly a positive trend (Figure 5b). This indicates a stronger influence of soil moisture on NDVI than rainfall partly due to exogenic soil water resulting from run off from the surrounding higher areas, which fosters vegetation growth.
Figure 5. Trends of NDVI residuals that have been adjusted for (a) soil moisture and (b) rainfall with RESTREND. Note difference of scale.
Remotesensing 07 05471 g005

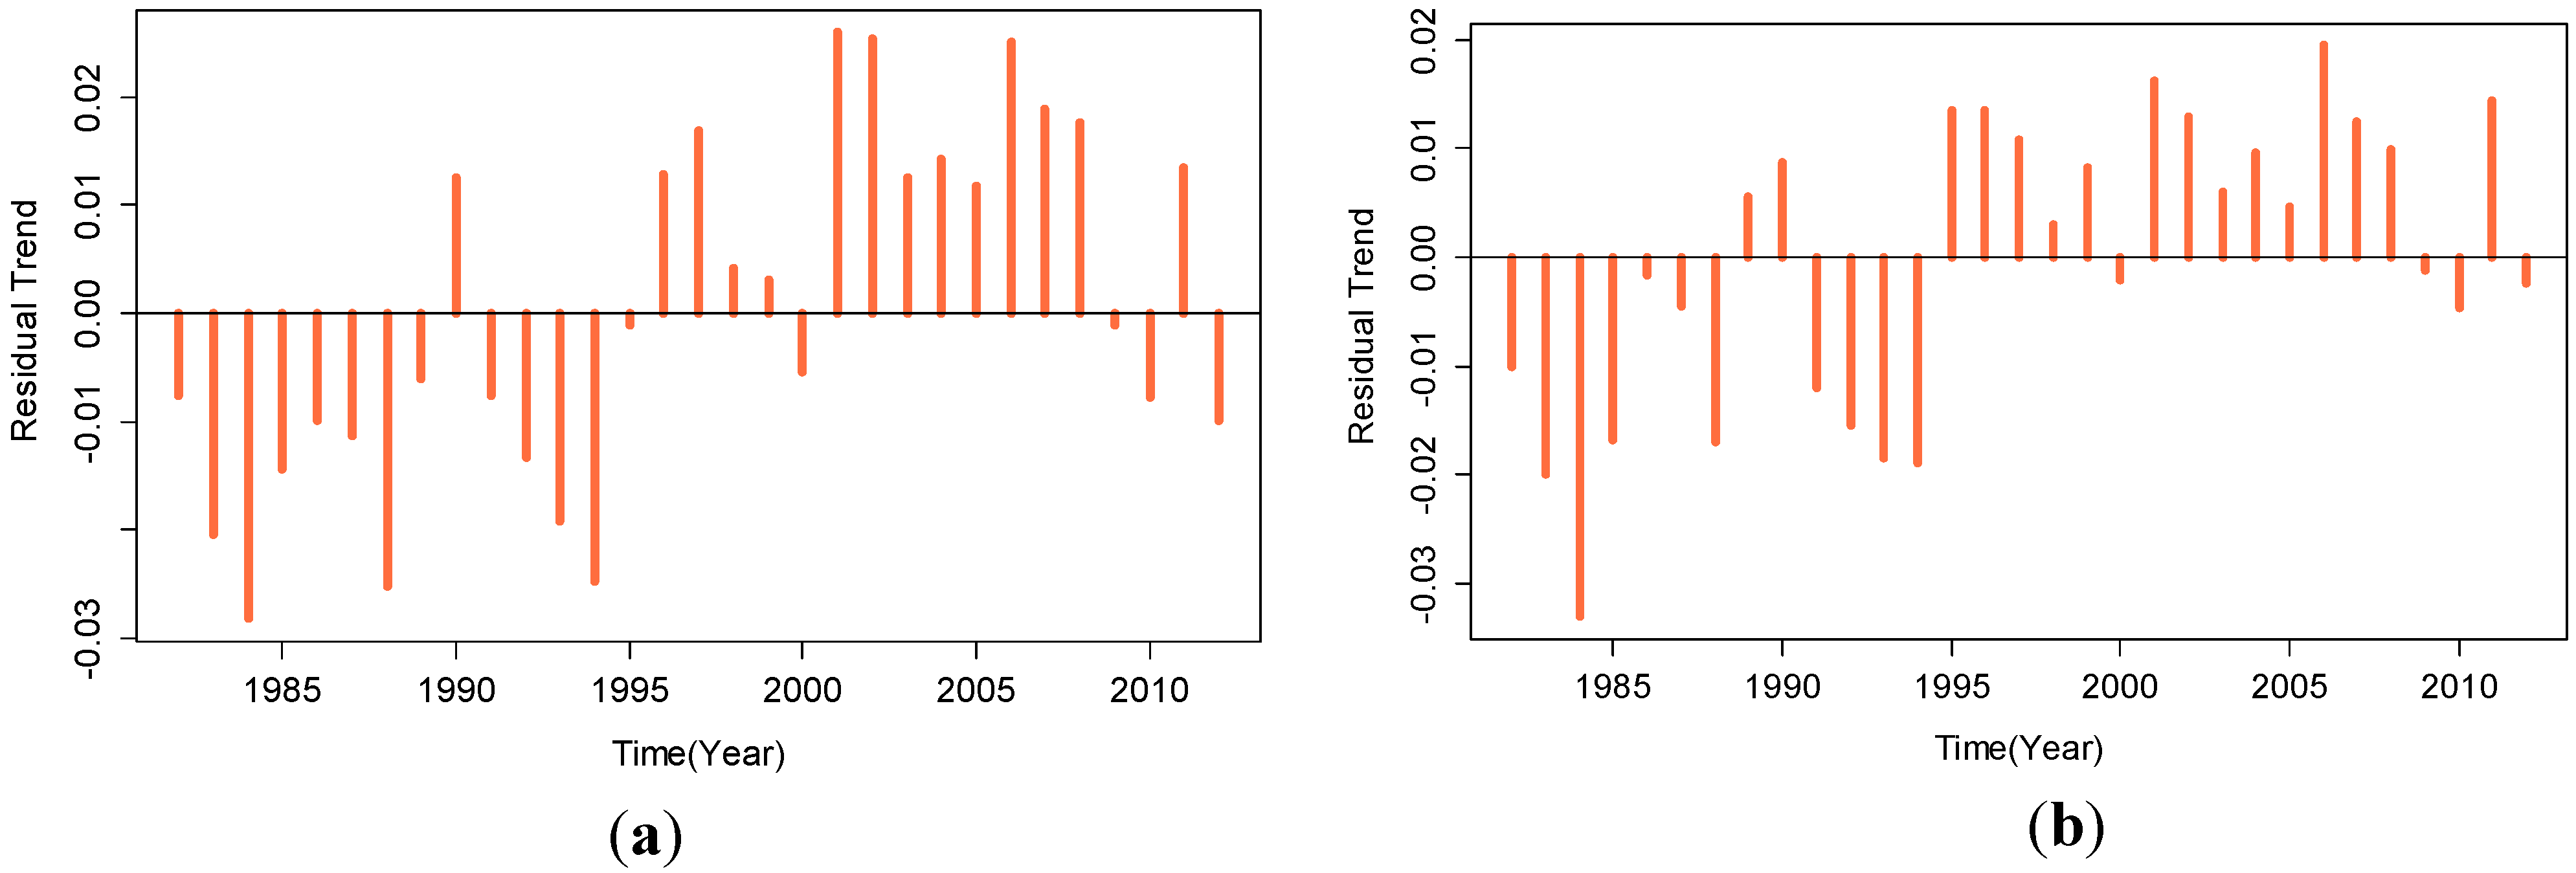
3.3. Temporal Variation of Annual NDVI Residuals from RESTREND from 1982–2012, Adjusted for Soil Moisture or Rainfall

The RESTREND maps in Figure 4a,c show areas that are likely subject to land degradation (negative trend of residuals) or not (positive residuals). The temporal trend of the mean annual residuals averaged over the study region is presented in Figure 6.
In Figure 6, the years 1984, 1988, and 1994 show the strongest negative residuals over the study period. In those years the vegetation in the study region was less green than in an average year overall. In the soil moisture adjusted RESTREND analysis, the temporal trend of the residuals in Figure 6a shows a much clearer negative extent than rainfall in Figure 6b. From 1996 onwards, a reversal of the land degradation trend is observed in most of the years, with positive residuals dominating the time-series, except in the year 2000, 2009, 2010 and 2012, where negative residuals dominate. The most extreme negative residuals are found following extreme drought periods in the area, which caused serious loss of vegetation greenness in the early 1980s.
For the rainfall adjusted NDVI residuals from the RESTREND shown in Figure 6b, the temporal trend is similar to that of soil moisture, but with less pronounced negative values, as is also indicated spatially in Figure 4. If only rainfall is used as the explanatory variable in RESTREND, the results re-affirm the greening trend of the Sahel. However, the extreme drought of the 1980s is clearly visible in the results for the rainfall adjusted RESTREND.
Figure 6. Temporal trend of annual NDVI residuals from RESTREND from 1982 to 2012 averaged over all pixels in the study region, adjusted for (a) soil moisture and (b) rainfall. Note difference of scale.
Remotesensing 07 05471 g006
The Mann-Kendall coefficient τ was calculated to test whether the residual trend is monotonic or not from 1982 to 2012 (Table 1). The Kendall coefficient was applied to annual data (τ) and rainy seasonal data (τs). Table 1 shows that the overall and seasonal trends of the RESTREND in the study area are weakly positive but highly significant (p < 0.001) for all of the RESTREND models. This means that the trend of the adjusted NDVI residuals for both soil moisture and rainfall are increasing slightly but significantly in the area.
Table 1. Mann-Kendall’s trend analysis coefficients: Annual τ and seasonal τs.
Restrendττsp
(τ)s)
Rainfall-NDVI (all years)0.1070.2170.0021 *<0.0001 *
Soil moisture-NDVI (all years)0.1280.281<0.0001 *<0.0001 *
* indicates p < 1%.
Figure 7. Comparison between the correlation coefficients of NDVI and soil moisture; and NDVI and rainfall across the six sampling sites in the study area.
Remotesensing 07 05471 g007aRemotesensing 07 05471 g007b
To examine the strength of the co-variation between soil moisture (rainfall) with NDVI, a detailed analysis of several sampling sites was carried out. Pearson’s correlation coefficient (r) was used to examine the pixel-wise relationship between NDVI and soil moisture; and NDVI and rainfall (1982–2012) in six selected sampling sites (Figure 7): Nigeria (13.15N, 7.15E); Ghana (10.00N, 0.00E); Senegal (15.00N, 15.00W); Burkina Faso (14.00N, 2.00E); Mali (18.00N, 5.00W) and Niger (15.00N, 5.00E). The results corroborate that soil moisture has a stronger relationship with NDVI than rainfall across the entire sampling sites, except for the location in Mali, where soil moisture-NDVI and rainfall-NDVI correlation coefficients were R2 = 0.18 and R2 = 0.40. For all the remaining sampling sites, soil moisture was more highly correlated to NDVI than rainfall.

3.4. Discussion

The Sahel portion of Senegal, Mali, Burkina-Faso, Niger, Northern Nigeria and Northern Ghana, show a strong response of NDVI to soil moisture, in accordance with the findings of [30]. The intercepts in Figure 3 show areas with near-zero NDVI (bare soil) for a theoretical zero-soil moisture (rainfall) limit across the area. These areas are mostly in Nigeria, Ghana, Senegal, Mali, Burkina-Faso and Niger, indicating that NDVI in these areas is strongly dependent on rainfall and soil moisture. With soil moisture near zero, NDVI was found to be very low, and in particular even lower than the NDVI response to rainfall approaching zero. Although many studies have used the RESTREND method to identify areas with negative or positive trends of vegetation indices [22,44,45,68], most do not analyze the spatial patterns of the slopes and intercepts of the models. The current study shows that the information contained in these spatial maps provides important information about spatial patterns of land degradation and greening trends.
The spatial distribution of the areas identified as degraded by the RESTREND method is presented in Figure 4. It indicates that RESTREND based on soil moisture reveals degraded areas more consistently than rainfall. Degraded areas can be found in Nigeria, Ghana, Niger, Mali, Burkina-Faso, Senegal and other areas. These areas fall under the very high to moderate land degradation vulnerability regions reported by [69]. In this context, the results presented here suggest that land degradation is not only confined to extreme climatic regions but occurs in humid tropical regions under certain circumstances. This pattern of land degradation based on the RESTREND method can be attributed to overgrazing, fuel wood extraction, and cropping intensity in these areas as reported by [12] and re-affirmed by [35], who reported a decline in on-farm tree density in Nigeria compared to Niger, even though Nigeria has a more favorable climate than Niger. Equally, evidence of land degradation in Senegal was provided by Herrmann and Tappan [31], who found vegetation impoverishment despite greening in the area.
The long-term mean temporal variation of the RESTREND residuals in Figure 6 shows that land degradation in the region is often triggered by climatic droughts, but this trend can reverse in rainy years. This is because drought and land degradation in the Sub-Saharan West Africa are inseparably coupled [10,70]. Using the data from all years (1982–2012), the pattern of extreme land degradation follows the trend of rainfall, with the 1980s experiencing considerable negative trends. From around 1995 onwards, the mean annual trend changes to positive until around 2010 were it reversed to negative again. This trend is consistent to the findings of [24,30,34], who observed that above-average greening in the Sahel occurred from the 1990s to 2007. It also reinforces earlier findings of [33] who found a large increase in rainfall over the last few decades in the region.
However, Figure 6 indicates a possible oscillating pattern of approximately five years periodicity for the residual NDVI trend after adjusting for soil moisture (rainfall). Such a pattern could be driven by the autocorrelation in climate data of the African monsoon. Even after adjusting the NDVI for soil moisture [rainfall] such a pattern is visible. This could be due to the lag effect of rainfall effects on NDVI and soil moisture in the area or reflect a longer-term climate oscillation. For example, [30] found a strong linear relationship between NDVI and rainfall three-months earlier in the Sahel.
The Mann-Kendall non-parametric test was used to test whether the temporal trend of the residual NDVI averaged over the study region was monotonic or not (Table 1). The result shows that the trend of land degradation is increasing slightly over time as the drier conditions alternate with the wetter conditions. Although land degradation involves a total decline or loss of productivity [17], the temporal trend of the RESTREND in the area shows that the seasonal trend is also statistically significant and more consistent than the overall annual trend.
Finally, the correlation analysis of selected sampling sites within the study area shows that NDVI has a strong relationship with soil moisture than with rainfall. When taking this more plausible ecological relationship into account, the soil moisture adjusted NDVI residuals show a more pronounced negative trend than is observable if only rainfall is used. The significance of this result is that studies that only focus on rainfall could potentially underestimate rates of land degradation in the study area. Soil moisture data provide a more robust way of studying land degradation.
Our findings show that land degradation is evident when the soil moisture-NDVI RESTREND model is used instead of the rainfall-NDVI model. This indicates a stronger relationship between soil moisture and NDVI than rainfall and NDVI in the study region. Although we were unable to incorporate socio-economic drivers of land degradation in the analysis, we compare our result with the findings of previous studies carried out in the region, which integrated their results with ecological and socio-economic drivers of vegetation changes and land degradation. This is because land degradation and vegetation changes are generally influenced by anthropogenic drivers such as land use conversion, irrigation and nitrogen deposition among others. It has been reported that about 20% of the variability in the global NDVI trend is attributed to human land use practices and this invariably affects the long-term trend of NDVI [36]. Several studies attributed the decline of ecosystem productivity to the availability of soil moisture within the root zone. And it has been argued that even within the wetter region, the level of moisture availability may differ due to differences in ecological and socio-economic factors, notably precipitation, variation in river water level, elevation and land form types. These factors determine the availability and variations of soil moisture content available to vegetation in different seasons [65].
Many locations within Sub-Saharan Africa in both dry and humid zones show stronger links between NDVI and soil moisture than NDVI and rainfall. The study by [71], has also found a stronger relationship between in situ soil moisture and MODIS NDVI and EVI in six study sites than with in situ rainfall. Equally, the relationship between soil moisture and EVI is stronger than soil moisture NDVI within the upper 1 m soil layer. This finding was justified by the study of [72], where soil moisture was reported to be the major limiting factor to vegetation transpiration and photosynthesis in several regions rather than rainfall, and this consequently influences the water, energy and biogeochemical cycles. Therefore, future studies of land degradation using statistical trend analysis should go one step further and integrate soil moisture and other ecological and socio-economic drivers of land degradation into their analysis approach.

4. Conclusions

This study has shown that RESTREND analysis of NDVI and soil moisture data can provide indicators of land degradation and vegetation recovery in Sub-Saharan West Africa more reliably than if only rainfall data are used. The results of correlation analysis between NDVI and soil moisture show higher value of R2 for all the sampling sites within the study area than NDVI and rainfall except in Mali, where R2 is 0.18 and 0.40 for NDVI-soil moisture and NDVI-rainfall correlation, respectively. Also the Mann Kendall seasonal trend was higher for soil moisture RESTREND (τs = 0.28) than rainfall RESTREND (τs = 0.21), which are both monotonically significant at p < 0.001. Although land degradation is a complex phenomenon, the areas identified as being subject to a land degradation process are consistent with previously published findings by other authors.
We argue that in order to draw conclusions on dryland degradation, soil moisture data should be used to adjust the NDVI time-series, and not only rainfall. Soil moisture conditions are an aggregated expression of the hydrological regime in the area, incorporating the full water balance of rainfall, evapotranspiration, surface runoff and groundwater supply. Soil moisture contains the water that is directly available to plants.

Acknowledgments

The authors are grateful and wish to acknowledge the use of the new NDVI3g provided by Jim Tucker and Jorge E. Pinzon of NASA. Special thanks to CRU for providing the CRU v3.21 rainfall data and NOAA-NCEP for CPC soil moisture (v2) data. Finally to R development team for making various library packages available which were used for the data analyses. H. Balzter was supported by the Royal Society, Wolfson Research Merit Award.

Author Contributions

The research was conceived and developed by Yahaya Z. Ibrahim; Jörg Kaduk reformatted the NDVI3g data; and Heiko Balzter advised and coordinated the study. The analysis and interpretation was done by Yahaya Z. Ibrahim with the support of Jörg Kaduk and Heiko Balzter. The manuscript was written by Yahaya Z. Ibrahim with contributions from Jörg Kaduk, Heiko Balzter and Compton J. Tucker.

Conflicts of Interest

The authors declare no conflict of interest.

References

  1. Hulme, M. Climatic perspectives on Sahelian desiccation: 1973–1998. Glob. Environ. Chang. Human Policy Dimens. 2001, 11, 19–29. [Google Scholar] [CrossRef]
  2. Helldén, U. Desertification—Time for an assessment. Ambio 1991, 20, 372–383. [Google Scholar]
  3. Olsson, L.; Eklundh, L.; Ardö, J. A recent greening of the Sahel—Trends, patterns and potential causes. J. Arid Environ. 2005, 63, 556–566. [Google Scholar] [CrossRef]
  4. Giannini, A.S.R.; Chang, P. Oceanic forcing of sahel rainfall on interannual to interdecadal time scales. Science 2003, 302, 1027–1030. [Google Scholar] [CrossRef] [PubMed]
  5. Caminade, C.; Terray, L. Twentieth century Sahel rainfall variability as simulated by the ARPEGE AGCM, and future changes. Clim. Dynam. 2010, 35, 75–94. [Google Scholar] [CrossRef]
  6. Nicholson, S. Land surface processes and Sahel climate. Rev. Geophys. 2000, 38, 117–139. [Google Scholar] [CrossRef]
  7. Myoung, B.; Choi, Y.-S.; Choi, S.-J.; Park, S.K. Impact of vegetation on land-atmosphere coupling strength and its implication for desertification mitigation over East Asia. J. Geophys. Res. 2012, 117. [Google Scholar] [CrossRef]
  8. Tucker, C.J.; Nicholson, S.E. Variation in the size of the Sahara desert from 1980 to 1997. Ambio 1999, 28, 587–591. [Google Scholar]
  9. Millennium Ecosystem Assessment. Ecosystem and Human Well-Being: Desertification Synthesis; Island Press: Washington, DC, USA, 2005. [Google Scholar]
  10. United Nations Convention to Combat Desertification. United Nations Convention to Combat Desertification (UNCCD) Madrid Declaration. 2007. Available online: http://www.unccd.int/Lists/OfficialDocuments/cop8/16eng.pdf (accessed on 12 August 2013).
  11. Middleton, N. Desertification; Oxford University Press: Oxford, UK, 1991. [Google Scholar]
  12. Geist, H.J.; Lambin, E.F. Dynamic causal patterns of desertification. BioScience 2004, 54, 817–829. [Google Scholar] [CrossRef]
  13. United Nations Environmental Program (UNEP). World Atlas of Desertification, 2nd ed.; Middleton, N., Thomas, D.S.G., Eds.; Edward Arnold: London, UK, 1997. [Google Scholar]
  14. Reynolds, J.F.; Stafford Smith, D.M. Do humans cause deserts? In Global Desertification: Do Human Cause Deserts? Reynolds, J.F., Stafford, J.F., Smith, D.M., Eds.; Dahlem University Press: Berlin, Germany, 2002. [Google Scholar]
  15. United Nations Convention to Combat Desertification (UNCCD). Text of the United Nations Convention to Combat Desertification. 1994. Available online: www.unccd.int/convention/text/convention.php (accessed on 23 February 2011).
  16. Herrmann, S.M.; Hutchinson, C.F. The changing contexts of the desertification debate. J. Arid Environ. 2005, 63, 538–555. [Google Scholar] [CrossRef]
  17. Verón, S.R.; Paruelo, J.M.; Oesterheld, M. Assessing desertification. J. Arid Environ. 2006, 66, 751–763. [Google Scholar] [CrossRef]
  18. Helldén, U.; Tottrup, C. Regional desertification: A global synthesis. Glob. Planet. Chang. 2008, 64, 169–176. [Google Scholar] [CrossRef]
  19. Grainger, A. Desertification: How People Make Deserts, How People Can Stop and Why They Don’t; Earthscan: London, UK, 1985. [Google Scholar]
  20. Dregne, H.E. Desertification of arid lands. Econ. Geogr. 1977, 53, 322–331. [Google Scholar] [CrossRef]
  21. Rasmussen, B; Fog, B; Madsen, J.E. Desertification in reverse? Observations from northern Burkina Faso. Glob. Environ. Chang. 2001, 11, 271–282. [Google Scholar]
  22. Evans, J.; Geerken, R. Discrimination between climate and human-induced dryland degradation. J. Arid Environ. 2004, 57, 535–554. [Google Scholar] [CrossRef]
  23. Nicholson, S.E.; Tucker, C.J.; Ba, M.B. Desertification, drought and surface vegetation: An example from West African Sahel. Bull. Am. Meteorol. Soc. 1998, 79, 815–829. [Google Scholar] [CrossRef]
  24. Anyamba, A.; Tucker, C.J. Analysis of Sahelian vegetation dynamics using NOAA-AVHRR NDVI data from 1981–2003. J. Arid Environ. 2005, 63, 596–614. [Google Scholar] [CrossRef]
  25. Eklundh, L.; Olsson, L. Vegetation index trends for the African Sahel 1982–1999. Geophys. Res. Lett. 2003, 30. [Google Scholar] [CrossRef]
  26. Fensholt, R.; Langanke, T.; Rasmussen, K.; Reenberg, A.; Prince, S.D.; Tucker, C.; Scholes, R.J.; Le, Q.B.; Bondeau, A.; Eastman, R.; et al. Greenness in semi-arid areas across the globe 1981–2007—An earth observing satellite based analysis of trends and drivers. Remote Sens. Environ. 2012, 121, 144–158. [Google Scholar]
  27. Eastman, J.; Sangermano, F.; Machado, E.A.; Rogan, J.; Anyamba, A. Global trends in seasonality of normalized difference vegetation index (NDVI), 1982–2011. Remote Sens. 2013, 5, 4799–4818. [Google Scholar] [CrossRef]
  28. Dardel, C.; Kergoat, L.; Hiernaux, P.; Mougin, E.; Grippa, M.; Tucker, C.J. Re-greening Sahel: 30 Years of remote sensing data and field observations (Mali, Niger). Remote Sens. Environ. 2014, 140, 350–364. [Google Scholar] [CrossRef]
  29. Brandt, M.; Verger, A.; Diouf, A.A.; Baret, F.; Samimi, C. Local vegetation trends in the Sahel of Mali and Senegal using long time series FAPAR satellite products and field measurement (1982–2010). Remote Sens. 2014, 6, 2408–2434. [Google Scholar] [CrossRef]
  30. Huber, S.; Fensholt, R.; Rasmussen, K. Water availability as the driver of vegetation dynamics in the African Sahel from 1982 to 2007. Glob. Planet. Chang. 2011, 76, 186–195. [Google Scholar] [CrossRef]
  31. Herrmann, S.M.; Tappan, G.G. Vegetation impoverishment despite greening: A case study from central Senegal. J. Arid Environ. 2013, 90, 55–66. [Google Scholar] [CrossRef]
  32. Brandt, M.; Romankiewicz, C.; Spiekermann, R.; Samimi, C. Environmental change in time series—An interdisciplinary study in the Sahel of Mali and Senegal. J. Arid Environ. 2014, 105, 52–63. [Google Scholar] [CrossRef]
  33. Nicholson, S.E.; Devenport, M.L.; Malo, A.R. A comparison of the vegetation response to rainfall in the Sahel and East Africa, using normalized difference vegetation index from NOAA AVHRR. Clim. Chang. 1990, 17, 209–241. [Google Scholar] [CrossRef]
  34. Herrmann, S.M.; Anyamba, A.; Tucker, C.J. Recent trends in vegetation dynamics in the African Sahel and their relationship to climate. Glob. Environ. Chang. 2005, 15, 394–404. [Google Scholar] [CrossRef]
  35. Sendzimir, J.; Reij, C.P.; Magnuszewski, P. Rebuilding resilience in the Sahel: Regreening in the Maradi and zinder regions of Niger. Ecol. Soc. 2011, 16. [Google Scholar] [CrossRef]
  36. Mueller, T.; Dressler, G.; Tucker, C.J.; Pinzon, J.E.; Leimgruber, P.; Dubayah, R.O.; Hurtt, G.C.; Böhning-Gaese, K.; Fagan, W.F. Human land-use practices lead to global long-term increases in photosynthetic capacity. Remote Sens. 2014, 6, 5717–5731. [Google Scholar] [CrossRef]
  37. Hoscilo, A.; Balzter, H.; Bartholomé, E.; Boschetti, M.; Brivio, P.A.; Brink, A.; Clerici, M.; Pekel, J.F. A conceptual model for assessing rainfall and vegetation trends in sub-Saharan Africa from satellite data. Int. J. Climatol. 2014. [Google Scholar] [CrossRef]
  38. Fensholt, R.; Rasmussen, K. Analysis of trends in the Sahelian “rain-use efficiency” using GIMMS NDVI, RFE and GPCP rainfall data. Remote Sens. Environ. 2011, 115, 438–451. [Google Scholar] [CrossRef]
  39. Fensholt, R.; Rasmussen, K.; Kaspersen, P.; Huber, S.; Horion, S.; Swinnen, E. Assessing land degradation/recovery in the African Sahel from long-term earth observation based primary productivity and rainfall relationships. Remote Sens. 2013, 5, 664–686. [Google Scholar] [CrossRef]
  40. Garcia, M.; Oyenarte, C.; Villagarcia, L.; Contreras, S.; Domingo, F.; Puigdefabregas, J. Monitoring land degradation using ASTER data: The non-evaporative fraction as an indicator of ecosystem function. Remote Sens. Environ. 2008, 112, 3720–3736. [Google Scholar] [CrossRef]
  41. Hein, L.; De Ridder, N. Desertification in the Sahel: A reinterpretation. Glob. Chang. Biol. 2006, 12, 751–758. [Google Scholar] [CrossRef]
  42. Seaquist, J.W.; Hickler, T.; Eklundh, L.; Ardo, J.; Heumann, B.W. Disentangling the effects of climate and people on Sahel vegetation dynamics. Biogeosciences 2009, 6, 469–477. [Google Scholar] [CrossRef]
  43. De Jong, R.; de Bruin, S.; de Wit, A.; Schaepman, M.E.; Dent, D.L. Analysis of monotonic greening and browning trends from global NDVI time-series. Remote Sens. Environ. 2011, 115, 692–702. [Google Scholar] [CrossRef] [Green Version]
  44. Wessels, K.J.; Prince, S.D.; Malherbe, J.; Small, J.; Frost, P.E.; VanZyl, D. Can human-induced land degradation be distinguished from the effects of rainfall variability? A case study in South Africa. J. Arid Environ. 2007, 68, 271–297. [Google Scholar]
  45. Wessels, K.J.; Prince, S.D.; Frost, P.E.; Van Zyl, D. Assessing the effects of human-induced land degradation in the former homelands of northern South Africa with a 1 km AVHRR NDVI time-series. Remote Sens. Environ. 2004, 91, 47–67. [Google Scholar] [CrossRef]
  46. Prince, S.D.; Wessels, K.J.; Tucker, C.J.; Nicholson, S.E. Desertification in the Sahel: A reinterpretation of a reinterpretation. Glob. Chang. Biol. 2007, 13, 1308–1313. [Google Scholar] [CrossRef]
  47. Huenneke, L.F.; Anderson, J.P.; Remmenga, M.; Schlesinger, W. Desertification alters patterns of aboveground net primary production in Chihuahuan ecosystems. Glob Chang. Biol. 2002, 8, 247–264. [Google Scholar] [CrossRef]
  48. Wessels, K.J.; van den Bergh, F.; Scholes, R.J. Limits to detectability of land degradation by trend analysis of vegetation index data. Remote Sens. Environ. 2012, 125, 10–22. [Google Scholar] [CrossRef]
  49. Forkel, M.; Carvalhais, N.; Verbesselt, J.; Mahecha, M.D.; Neigh, C.S.; Reichstein, M. Trend change detection in NDVI time series: Effects of inter-annual variability and methodology. Remote Sens. 2013, 5, 2113–2144. [Google Scholar] [CrossRef]
  50. Food and Agricultural Organization (FAO). The Global Ecofloristic Zones Mapped by United Nations Food and Agricultural Organization; FAO: Rome, Italy, 2000. [Google Scholar]
  51. Myneni, R.B.; Hall, F.G.; Sellers, P.J.; Marshak, A.L. The interpretation of spectral vegetation indexes. IEEE Trans. Geosci. Remote Sens. 1995, 33, 481–486. [Google Scholar] [CrossRef]
  52. Kogan, F.N. NOAA/AVHRR satellite data based indices for monitoring agricultural droughts. In Monitoring and Predicting Agricultural Drought: A Global Study; Boken, V.K., Cracknell, A., Heathcote, P., Eds.; Oxford University Press: New York; pp. 79–88.
  53. Pinzon, J.; Tucker, C. A Non-stationary 1981–2012 AVHRR NDVI3g Time Series. Remote Sens. 2014, 6, 6929–6960. [Google Scholar] [CrossRef]
  54. Pinzón, J.; Brown, M.E.; Tucker, C.J. EMD correction of orbital drift artefacts in satellite data stream. In The Hilbert-Huang Transform and Its Applications; Huang, N., Shen, S., Eds.; World Scientific Publishing: City, Singapore, 2005; pp. 167–183. [Google Scholar]
  55. Xu, L.; Myneni, R.B.; Chapin, F.S., III; Callaghan, T.V.; Pinzon, J.E.; Tucker, C.J.; Zhu, Z.; Bi, J.; Ciais, P.; Tommervik, H.; et al. Temperature and vegetation seasonality diminishment over northern lands. Nature Clim. Chang. 2013, 3. [Google Scholar] [CrossRef]
  56. Fensholt, R.; Nielsen, T.T.; Stisen, S. Evaluation of AVHRR PAL and GIMMS 10-day composite NDVI time series products using SPOT-4 vegetation data for the African continent. Int. J. Remote Sens. 2006, 27, 2719–2733. [Google Scholar] [CrossRef]
  57. Schucknecht, A.; Erasmi, S.; Niemeyer, I.; Matschullat, J. Assessing vegetation variability and trends in north-eastern Brazil using AVHRR and MODIS NDVI time series. Eur. J. Remote Sens. 2013, 46, 40–59. [Google Scholar] [CrossRef]
  58. Fensholt, R.; Rasmussen, K.; Nielsen, T.T.; Mbow, C. Evaluation of earth observation based long term vegetation trends—Intercomparing NDVI time series trend analysis consistency of Sahel from AVHRR GIMMS, Terra MODIS and SPOT VGT data. Remote Sens. Environ. 2009, 113, 1886–1898. [Google Scholar] [CrossRef]
  59. Tucker, C.; Pinzon, J.; Brown, M.; Slayback, D.; Pak, E.; Mahoney, R.; Vermote, E.; El Saleous, N. An extended AVHRR 8-km NDVI dataset compatible with MODIS and spot vegetation NDVI data. Int. J. Remote Sens. 2005, 26, 4485–4498. [Google Scholar] [CrossRef]
  60. Holben, B.N. Characteristics of maximum value composite images from temporal AVHRR data. Int. J. Remote Sens. 1986, 7, 1417–1434. [Google Scholar] [CrossRef]
  61. Dinku, T.; Ceccato, P.; Grover-Kopec, E.; Lemma, M.; Connor, S.J.; Ropelewski, C.F. Validation of satellite rainfall products over East Africa’s complex topography. Int. J. Remote Sens. 2007, 28, 1503–1526. [Google Scholar] [CrossRef]
  62. Jones, P.D.; Harris, I. CRU TS3.21 of High Resolution Gridded Data of Month by Month Variation in Climate (Jan. 1901–Dec. 2012). Available online: http://badc.nerc.ac.uk/view/badc.nerc.ac.uk__ATOM__ACTIVITY_0c08abfc-f2d5–11e2-a948–00163e251233 (accessed on 17 December 2013).
  63. van den Dool, H.; Huang, J.; Fan, Y. Performance and analysis of the constructed analogue method applied to US soil moisture over 1981–2001. J. Geophys. Res. Atmos. 2003, 108. [Google Scholar] [CrossRef]
  64. Fan, Y.; van den Dool, H. Climate Prediction Centre (CPC) global monthly soil moisture data set at 0.5° resolution for 1948 to present. J. Geophys. Res.: Atmos. 2004, 109. [Google Scholar] [CrossRef]
  65. Li, H.; Shen, W.; Zou, C.; Jiang, J.; Fu, L.; She, G. Spatio-temporal variability of soil moisture and its effect on vegetation in a desertified aeolian riparian ecotone on the Tibetan Plateau, China. J. Hydrol. 2013, 479, 215–225. [Google Scholar] [CrossRef]
  66. Dirmeyer, P.A.; Guo, Z.; Gao, X. Comparison, validation, and transferability of eight multiyear global soil wetness products. J. Hydrometeorol. 2004, 5, 1011–1033. [Google Scholar] [CrossRef]
  67. Foody, G.M. Spatial non-stationary and scale-dependency in the relationship between species richness and environmental determinants for the sub-Saharan endemic avifauna. Global Ecol. Biogeogr. 2005, 13, 315–320. [Google Scholar] [CrossRef]
  68. Omuto, C.T. A new approach for using time-series remote-sensing images to detect changes in vegetation cover and composition in drylands: A case study of eastern Kenya. Int. J. Remote Sens. 2011, 32, 6025–6045. [Google Scholar] [CrossRef]
  69. Reich, P.F.; Numbem, S.T.; Almaraz, R.A.; Eswaran, H. Land resource stresses and desertification in Africa. In Responses to Land Degradation. Proceedings of the 2nd International Conference on Land Degradation and Desertification, Khon Kaen, Thailand; Bridges, E.M., Hannam, I.D., Oldeman, L.R., Pening, F.W.T., de Vries, S.J., Scherr, S.J., Sompatpanit, S., Eds.; Oxford University Press: New Delhi, India, 2001. [Google Scholar]
  70. Stringer, L.C.; Dyer, J.C.; Reed, M.S.; Dougill, A.J.; Twyman, C.; Mkwambisi, D. Adaptations to climate change, drought and desertification: Local insights to enhance policy in southern Africa. Environ. Sci. Policy 2009, 12, 748–765. [Google Scholar] [CrossRef]
  71. Jamali, S.; Seaquist, J.; Ardo, J.; Eklundh, L. Investigating temporal relationships between rainfall, soil moisture and MODIS-derived NDVI and EVI for six sites in Africa. In Proceedings of The 34th International Symposium on Remote Sensing of Environment, Sydney, Australia, 10 April 2011.
  72. Seneviratne, S.I.; Corti, T.; Davin, E.L.; Hirschi, M.; Jaeger, E.B.; Lehner, I.; Orlowsky, B.; Teuling, A.J. Investigating soil moisture—Climate interactions in a changing climate: A review. Earth-Sci. Rev. 2010, 99, 125–161. [Google Scholar] [CrossRef]

