Article

Inter-Comparison of High-Resolution Satellite Precipitation Products over Central Asia

1
State Key Laboratory of Desert and Oasis Ecology, Xinjiang Institute of Ecology and Geography, Chinese Academy of Sciences, Urumqi 830011, China
2
University of Chinese Academy of Sciences, Beijing 100039, China
3
Key Laboratory of Beibu Gulf Environmental Evolution and Resources Utilization (Guangxi Teachers Education University), Ministry of Education, Nanning 530001, China
4
School of Computer Science, University of Oklahoma, Norman, OK 73072, USA
5
Hydrometeorology and Remote Sensing Laboratory and School of Civil Engineering and Environmental Science, University of Oklahoma, Norman, OK 73072, USA
6
Advanced Radar Research Center, National Weather Center, Norman, OK 73072, USA
7
State Key Laboratory of Hydraulics and Mountain River Engineering, Sichuan University, Chengdu 610065, China
*
Author to whom correspondence should be addressed.
Remote Sens. 2015, 7(6), 7181-7211; https://doi.org/10.3390/rs70607181
Submission received: 20 February 2015 / Revised: 17 April 2015 / Accepted: 18 May 2015 / Published: 1 June 2015

Abstract

:
This paper examines the spatial error structures of eight precipitation estimates derived from four different satellite retrieval algorithms including TRMM Multi-satellite Precipitation Analysis (TMPA), Climate Prediction Center morphing technique (CMORPH), Global Satellite Mapping of Precipitation (GSMaP) and Precipitation Estimation from Remotely Sensed Information using Artificial Neural Networks (PERSIANN). All the original satellite and bias-corrected products of each algorithm (3B42RTV7 and 3B42V7, CMORPH_RAW and CMORPH_CRT, GSMaP_MVK and GSMaP_Gauge, PERSIANN_RAW and PERSIANN_CDR) are evaluated against ground-based Asian Precipitation-Highly Resolved Observational Data Integration Towards Evaluation of Water Resources (APHRODITE) over Central Asia for the period of 2004 to 2006. The analyses show that all products except PERSIANN exhibit overestimation over Aral Sea and its surrounding areas. The bias-correction improves the quality of the original satellite TMPA products and GSMaP significantly but slightly in CMORPH and PERSIANN over Central Asia. 3B42RTV7 overestimates precipitation significantly with large Relative Bias (RB) (128.17%) while GSMaP_Gauge shows consistent high correlation coefficient (CC) (>0.8) but RB fluctuates between −57.95% and 112.63%. The PERSIANN_CDR outperforms other products in winter with the highest CC (0.67). Both the satellite-only and gauge adjusted products have particularly poor performance in detecting rainfall events in terms of lower POD (less than 65%), CSI (less than 45%) and relatively high FAR (more than 35%).

Graphical Abstract

1. Introduction

As a key exchange process within the hydrological cycle, precipitation represents the net heating from condensation in the atmosphere [1]. Precipitation measurement provides essential input information for hydrologic, climatologic, and agricultural studies, especially for those natural hazards linked with precipitation extremes, such as droughts, floods and landslides [2,3,4,5]. Because of its great temporal and spatial variability, rainfall measurement at fine resolution scales remains challenging to the scientific community. Conventional rain gauge network can provide relatively accurate measurement of precipitation amount with high temporal frequency at specific location, but inhomogeneous distribution and small sampling area of rain gauges limit its use for applications at regional and global scale [6,7,8]. Ground-based weather radar networks provide continuous coverage with high spatial and temporal resolution at the regional scale. However, despite the advantages of radar for rainfall retrievals, the use of such techniques does have limitations, e.g., over mountain regions, which includes beam blockage, ground clutter, cold weather and their interaction with vertical structure [1,9,10,11,12,13,14,15,16]. In addition, the high costs of radar usage also limit its application especially for the developing countries.
As an alternative method to estimate precipitation dynamics at regional and global scale, satellite-based quantitative precipitation estimates (QPE) algorithms have been developed in recent years. A series of near-real-time blended global satellite precipitation products with high spatial and temporal resolution have been successively available in the recent decades. These products are generated through combined use of infrared (IR) and passive microwave (PMW) observations from multiple satellite sensors. These satellite-only precipitation products include the raw version of CMORPH [17] and PERSIANN [18,19] (hereafter referred to as CMORPH_RAW and PERSIANN_RAW, respectively) PERSIANN-Cloud Classification System (PERSIANN-CCS) [20], Naval Research Laboratory Blended technique (NRL-Blend) [21], the version of Global Satellite Mapping of Precipitation Moving Vector with Kalman-filter (hereafter referred to as GSMaP_MVK) [22,23] and the three hourly, real-time, gridded precipitation product (3B42RT) provided by The Tropical Rainfall Measuring Mission (TRMM) Multisatellite Precipitation Analysis (TMPA 3B42 Version 7) [24]. In order to further improve the quality of precipitation analysis, rain gauge observations are also introduced by the retrieval algorithms of these bias-corrected satellite precipitation products, which include the gauge-corrected version of CMORPH (hereafter, CMORPH_CRT) [25], the Climate Data Record version of PERSIANN (hereafter, PERSIANN_CDR) [26], and the gauge-corrected version GSMaP (hereafter, GSMaP_Gauge) [27] and the gauge-adjusted, post-real-time research product of TMPA (3B42 Version7) [24].
Satellite-based precipitation products have significant importance for regional and global hydrological studies [28], especially for remote regions and developing countries [29,30,31,32] because they have large-scale coverage, high spatial and temporal resolution and are publicly available for anyone. Furthermore, these high-resolution products have been increasingly used in a wide range of applications, such as natural hazards (e.g., flood and landslide) monitoring, climate research, and hydrology-related fields [32,33,34,35]. However, the error sources associated with these products have not been well understood yet. As a result, these errors should be characterized for the usefulness of its application [21,36]. But quantification of uncertainties and errors inherent in satellite precipitation data remains a challenge [36,37,38,39,40]. The nature of the errors can change with the update of retrieval algorithms and change of data sources [41,42,43]. For the same product, performance can vary significantly between different seasons, regions and precipitation type [41,44,45]. Moreover, there is also a trade-off between the quality and the spatiotemporal resolution of product [37]. Therefore, quantification of the errors is very necessary for data assimilation, update of retrieval algorithm and appropriate use in various applications. Through this motivation, there have been extensive efforts to inter-compare and validate satellite-based precipitation products against point-scale rain gauge observations or post-research precipitation gauge products at global or regional scales [2,18,41,46,47,48,49,50,51,52,53,54,55,56,57,58]. However, precipitation over a mountainous region is complicated and depends on local macroclimate, topography and elevation [59,45]. The geographical location and highly varied topography of Central Asia make the precipitation estimation challenging over this region [60]. To our best knowledge, little effort has been reported in evaluating and quantifying the reliability and accuracy of both the satellite-only and gauge-corrected precipitation products over Central Asia.
In this paper, eight products based on four precipitation retrieval algorithms are assessed systematically and quantitatively over Central Asia. These products can be separated into two groups: the first group is the original satellite-only products without gauge correction, which include the version 7 3B42RT product provided by TMPA (hereafter, 3B42RTV7), CMORPH_RAW, PERSIANN_RAW, and GSMaP_MVK. The other group is bias-corrected products produced by combining with precipitation gauge data. The version 7 3B42 product (hereafter, 3B42V7), CMORPH_CRT, PERSIANN_CDR, and GSMaP_Gauge are included.
The primary objective of this paper is to identify the strengths and weaknesses of the currently most popular satellite-based high-resolution precipitation products (i.e., TRMM, CMORPH, GSMaP, and PERSIANN) over Central Asia. Specifically, the error structures are characterized in terms of spatial distribution, temporal variation, and frequency of precipitation with different intensities. Therefore, this study is useful to guide products users to determine the optimal selection of proper satellite precipitation products for applications over Central Asia and is helpful to algorithm developers to improve the spaceborne retrieval algorithms, especially for the lake-affected area and shallow rain area.
The remaining parts of this paper are organized as follows. Section 2 introduces the study area, the satellite-based precipitation datasets and gauge reference dataset, rainfall algorithms and evaluation metrics. Section 3 gives a thorough analysis of spatial characteristics and error quantification for different satellite-based precipitation products. Finally, a summary of the main results and conclusions are given in Section 4.

2. Study Area and Datasets
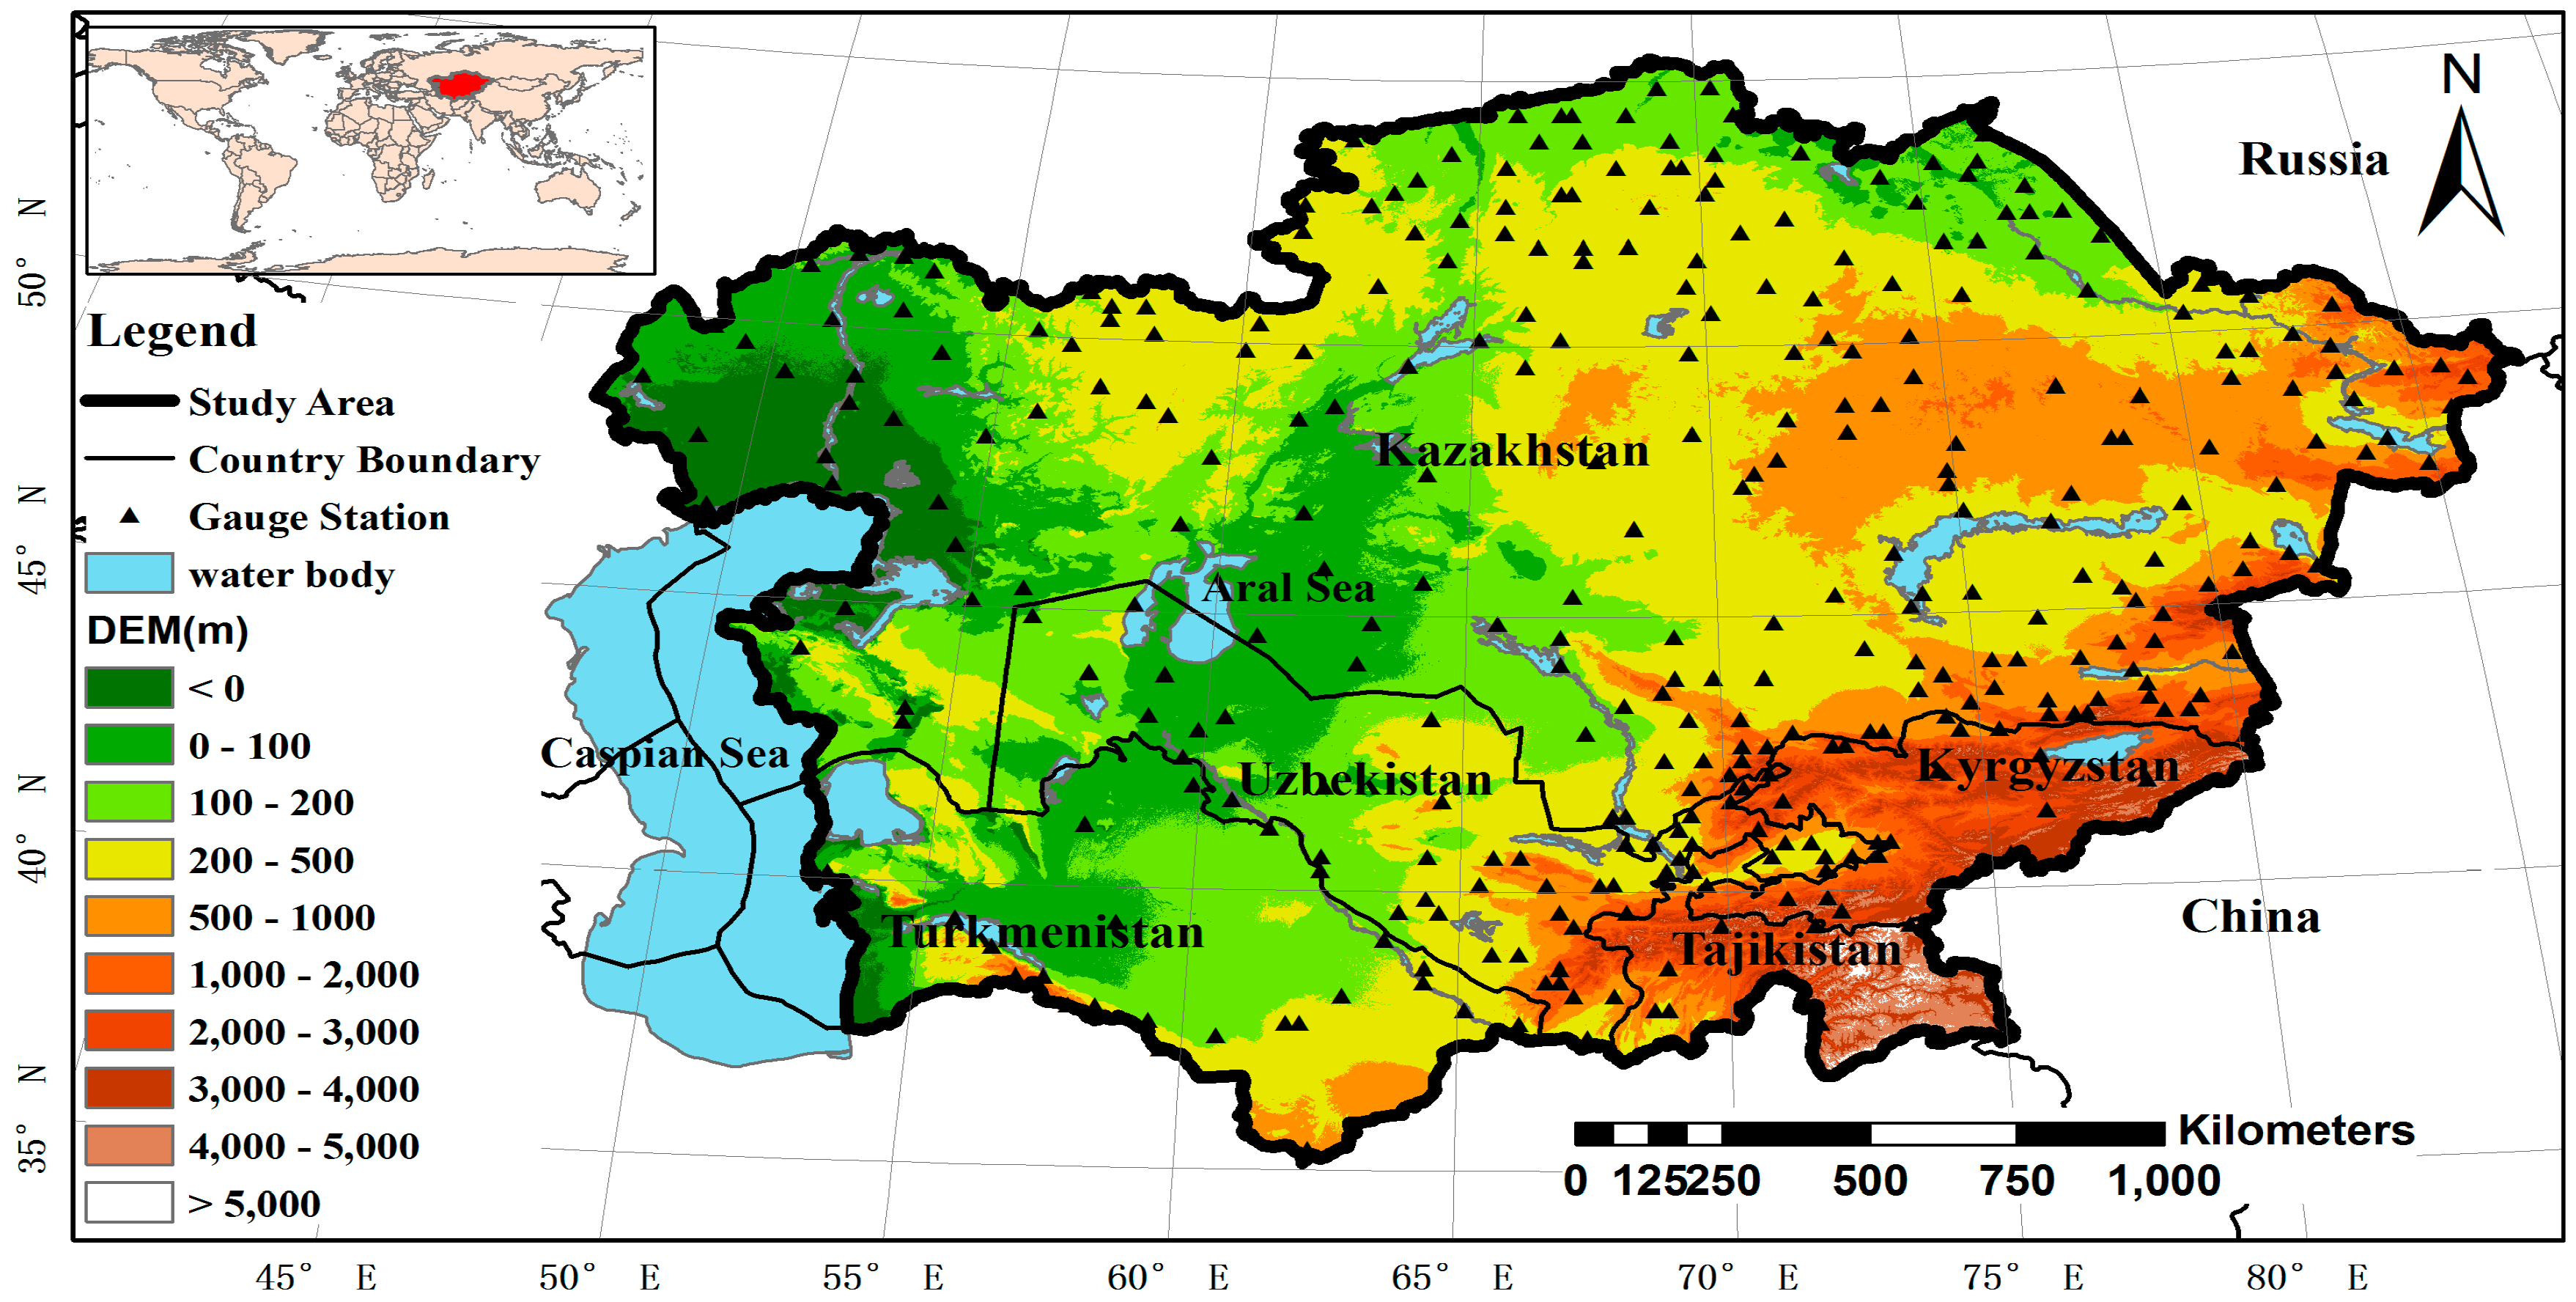
2.1. Study Area

In this study, the term Central Asia refers to the territory covered by scope of five Central Asian countries (i.e. Kazakhstan, Kyrgyzstan, Tajikistan, Turkmenistan and Uzbekistan) without the Caspian Sea marked by the black solid line in Figure 1. Central Asia is a region with diverse geography, including high mountains (Tianshan), vast deserts (Kara Kum, Kyzyl Kum, and Taklamakan), and especially treeless, grassy steppes [61]. The altitude decreases from southeast to northwest, which impacts directly in the weather conditions, through the precipitation systems over the region. The average elevation of Central Asia is about 3500 m. The elevation ranges from about −132 m in the Karagiye depression (near the Caspian Sea) to about 7500 m at Ismoil Somoni Peak (Pamir Mountains). The geographical situation determines the climatic conditions of Central Asia. It is influenced by continental climate with a significant fraction of the rainfall occurring at quite low intensities over this region. Most part of Central Asia are dominated by temperate continental semi-arid and arid climate, and only part of Pamir Mountains which is located in southeast Central Asia, belongs to Alpine climate due to the topography. The western and northwestern plains are open to cold northerly and northwesterly inflows and westerly moist from Atlantic. The southeastern mountains (i.e., the Himalayan, Pamir, Hindukush and Tien Shan mountains) almost completely isolate Central Asia from moist air masses, which originate from the Indian Ocean [62].
Figure 1. Topographic feature in Central Asia. Inland water includes lakes, rivers and canals over 10,000 km2.
Remotesensing 07 07181 g001

2.2. Datasets

2.2.1. Ground Reference Dataset

The Asian Precipitation-Highly Resolved Observational Data Integration Towards Evaluation of Water Resources (APHRODITE’s water resources) project has been conducted by the Research Institute for Humanity and Nature (RIHN) and the Meteorological Research Institute of Japan Meteorological Agency (MRI/JMA) since 2006 to develop state-of-the-art daily precipitation datasets on high-resolution grids covering the whole of Asia. In APHRODITE data, an interpolation technique is applied to grid the daily rain-gauge precipitation data obtained from meteorological and hydrological stations at a 0.05° domain. Then the 0.05° analysis is re-gridded to 0.5-degree and 0.25-degree grids (http://www.chikyu.ac.jp/precip/index.html). The interpolation algorithm is based on a modified version of distance-weighting interpolation method [63] in which the sphericity and orography are considered using sphere map [64] and the Mountain Mapper method [65]. The APHRODITE products have 0.5° and 0.25° spatial and a daily temporal resolution. In this study, the product with 0.25°-daily resolution has been used as the ground reference data. The spatial distribution of rain gauge locations used in this study is shown in Figure 1. About 1250 rain gauges over Central Asia are used in this study. The rain gauges are relatively sparse over the study area especially for the mountainous regions, deserts and big lake regions. Although relative sparse coverage of rain gauges over some regions (e.g., deserts, high elevations and big lakes) will exert an influence upon the evaluation accuracy, this study can also reveal various errors.
Regarding the quality of the APHRODITE dataset, Rajeevan and Bhate [66] validated the APHRODITE with rain gauge network (comprising more than 6000 observations) and showed that APHRODITE correlates highly with rain gauge data over most of India. Other validation studies have also been carried out by Yatagai and Xie [67] and Yatagai et al. [68,69]. In addition, APHRODITE was used in extensive studies as reference dataset [60,70,71,72,73,74] and hydrological modeling input precipitation information [75,76]. Finally, APHRODITE is the only long-term continental-scale daily product based on dense gauge observations for Asia region. For the detail description of APHRODITE, the readers are referred to Yatagai et al. [68,77].

2.2.2. Satellite-Based Precipitation Dataset

The TMPA algorithm is developed by the National Aeronautics and Space Administration (NASA) Goddard Space Flight Center (GSFC) [24]. The TMPA is a combination of two interim products: the PMW and PMW calibrated IR. First, the PMW data are calibrated by the combined TMI and precipitation radar (PR) products, and then used to calibrate the IR input data. The highest resolution of the TMPA data is three hourly at 0.25° spatial resolution. The version 7 of TMPA includes two types of products: The real-time version (3B42RTV7) covering the global latitude belt from 60°N to 60°S and the gauge-adjusted, post-real-time research product (3B42V7) with the coverage of the latitude belt from 50°N to 50°S. Both products have a spatial resolution of 0.25° × 0.25°. The difference is that no gauge correction is applied in 3B42RTV7, while the TRMM Combined Instrument (TCI) estimate, the Global Precipitation Climatology Center (GPCC) 1° monthly gauge product and the Climate Assessment and Monitoring System (CAMS, V6 only) 0.5° × 0.5° monthly gauge data are employed to generate 3B42V7.
CMORPH is generated by the National Oceanic and Atmospheric Administration (NOAA)/Climate Prediction Center (CPC) [17,78]. It produces global high spatiotemporal resolution analyses from extensive low orbiter satellite microwave observations. Geostationary satellite IR data are used as a means to transport the microwave-derived precipitation features during periods when PWM data are not available at a location. At a given location, the shape and intensity of the precipitation features are morphing by performing a time-weighting interpolation method [17]. Three spatial and temporal versions are supplied in 1.0 version of CMORPH: 8 km-30 min, 0.25°-3 hourly and 0.25°-daily. In this study, the 0.25°/daily version (i.e., CMORPH_RAW and CMORPH_CRT) is used for analysis. CMORPH_CRT is calibrated by CPC unified daily gauge analysis (over land) [25].
The GSMaP is developed by Japan Science and Technology Agency (JST) and Japan Aerospace Exploration Agency (JAXA) [22,23]. In order to get high temporal and spatial resolution of global precipitation estimates, GSMaP integrates passive microwave (PMW) retrievals and infrared (IR) retrievals with a Microwave-IR Combined Algorithm, a backward and forward morphing technique from IR images [17] and a Kalman filter [57]. The rain types from the TRMM Precipitation Radar (PR), the melting layer model, and the scattering algorithm are used in the Radiative Transfer Model (RTM) calculation to improve the rain/no-rain classification (RNC) methods [79] over land [80]. The highest resolution of GSMaP is 0.1°-daily. Three versions of GSMaP, which include the near-real-time version of GSMaP (GSMaP_NRT), GSMaP_MVK and GSMaP_Gauge, are available. GSMaP_MVK and GSMaP_Gauge are both selected for this study. GSMaP_STD is a satellite-only product without bias-correction procedure, while GSMaP_Gauge dataset is merged with NOAA Climate Prediction Center (CPC) global rain gauge data set [27]. Tian et al. [56] evaluated the GSMaP over the Contiguous United States, and the results showed that GSMaP gives comparable performance to other satellite-based precipitation products (i.e., CMORPH, PERSIANN, NRL, TMPA 3B42) with slightly better probability of detection during summer.
PERSIANN [18,19] is an algorithm based on artificial neural work, which estimates surface precipitation by using local cloud textures from IR images of the geostationary satellites. PERSIANN relies on statistical relationship between IR observations of the cloud-top temperature and precipitation rate. Given the high uncertainties in such statistical relationships, PERSIANN data are calibrated based on microwave observations with an adaptive training technique [19] whenever the microwave data are available [40]. To improve the quality of PERSIANN_RAW, GPCP monthly precipitation product at 2.5° scale is provided as adjusted input to generate the PERSIANN_CDR product throughout the entire record [26].
All the satellite-based precipitation products are summarized in Table 1. Both the original satellite and bias-corrected QPE products are evaluated in this study for two key objectives. First, it is designed to provide a quantification of bias’s adjustment in the perspective of various applications. Second, it aims to infer the suitability of near-real-time precipitation products to capture precipitation extremes in near real time. In order to eliminate the sampling biases in the comparisons, all satellite-based datasets are aggregated into 0.25° at daily scale (0–24 h) which is consistent with APHRODITE ranging from 2004 to 2006. Readers should keep in mind that some part of gauge observations used in APHRODITE might have also served as calibrated data in bias-corrected QPE algorithms.
Table 1. Introduction of satellite-based precipitation products used in this study.
NameTemporal ResolutionSpatial ResolutionDomainCorrected by GaugesReference
3B42RTV73 hr0.25°60°S–60°NNo[24]
3B42V73 hr0.25°50°S–50°NYes[24]
CMORPH-RAW1 day0.25°60°S–60°NNo[17]
CMORPH-CRT1 day0.25°60°S–60°NYes[25]
GSMaP-MVK1 hr0.1°60°S–60°NNo[22,23]
GSMaP-Gauge1 hr0.1°60°S–60°NYes[22,23,27]
PERSIANN-RAW3 hr0.25°60°S–60°NNo[18,19]
PERSIANN-CDR1 day0.25°60°S–60°NYes[18,19,26]

2.3. Statistical Evaluation Metrics

Bias, relative bias (RB), root mean square error (RMSE) and Pearson linear correlation coefficient (CC), probability of detection (POD), false alarm ratio (FAR) and critical success index (CSI) are used to evaluate the performance of all satellite-based QPE products. RB, RMSE and CC are defined as follows.
RB= i=1 N ( S i G i ) i=1 N ( G i )
RMSE= 1 N i=1 N ( S i G i )
CC= Cov( SG ) σ s σ G
where S means satellite-based QPE products and G means gauge-based reference dataset; RB and CC are dimensionless, RMSE is in mm/day. In Equation (3), “Cov()” refers to the covariance, and σ indicates the standard deviation. RB, when multiplied by 100, denotes the degree of overestimation or underestimation in percentage. All above statistics have been computed on a grid-by-grid basis over Central Asia.
Table 2. Contingency table comparing precipitation detection by QPE products and APHRODITE.
Gauge ≥ ThresholdGauge < Threshold
QPE ≥ thresholdHF
QPE < thresholdMZ
To evaluate precipitation detection capabilities of different QPE products relative to APHRODITE reference dataset, three categorical statistical indices are calculated based on a contingency table as shown in Table 2 [81]: POD represents the ratio of the number of rainfall events detected correctly by the satellite product to the number of rainfall occurrences observed by reference data; FAR denotes the proportion of cases in which the satellite records rainfall when the rain gauges do not; and CSI shows the overall proportion of rainfall events correctly diagnosed by the satellite. POD, FAR and CSI range from 0 to 1: with 1 being a perfect POD and CSI, and 0 being a perfect FAR. These metrics are computed based on Equations (4)–(6):
POD= H H+M
FAR= F H+F
CSI= H H+M+F
where the number of hits (H), false alarms (F), and misses (M), correct negatives (Z) are computed as Table 2.

3. Results and Discussion

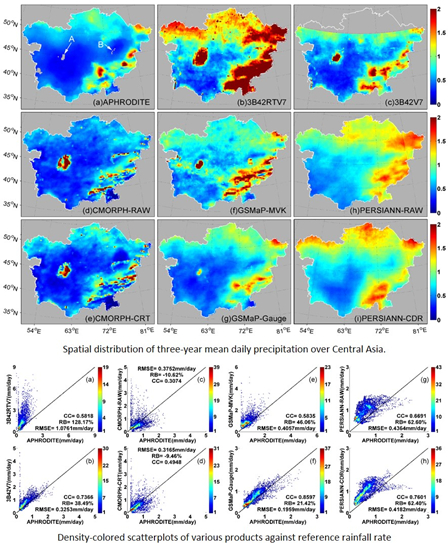
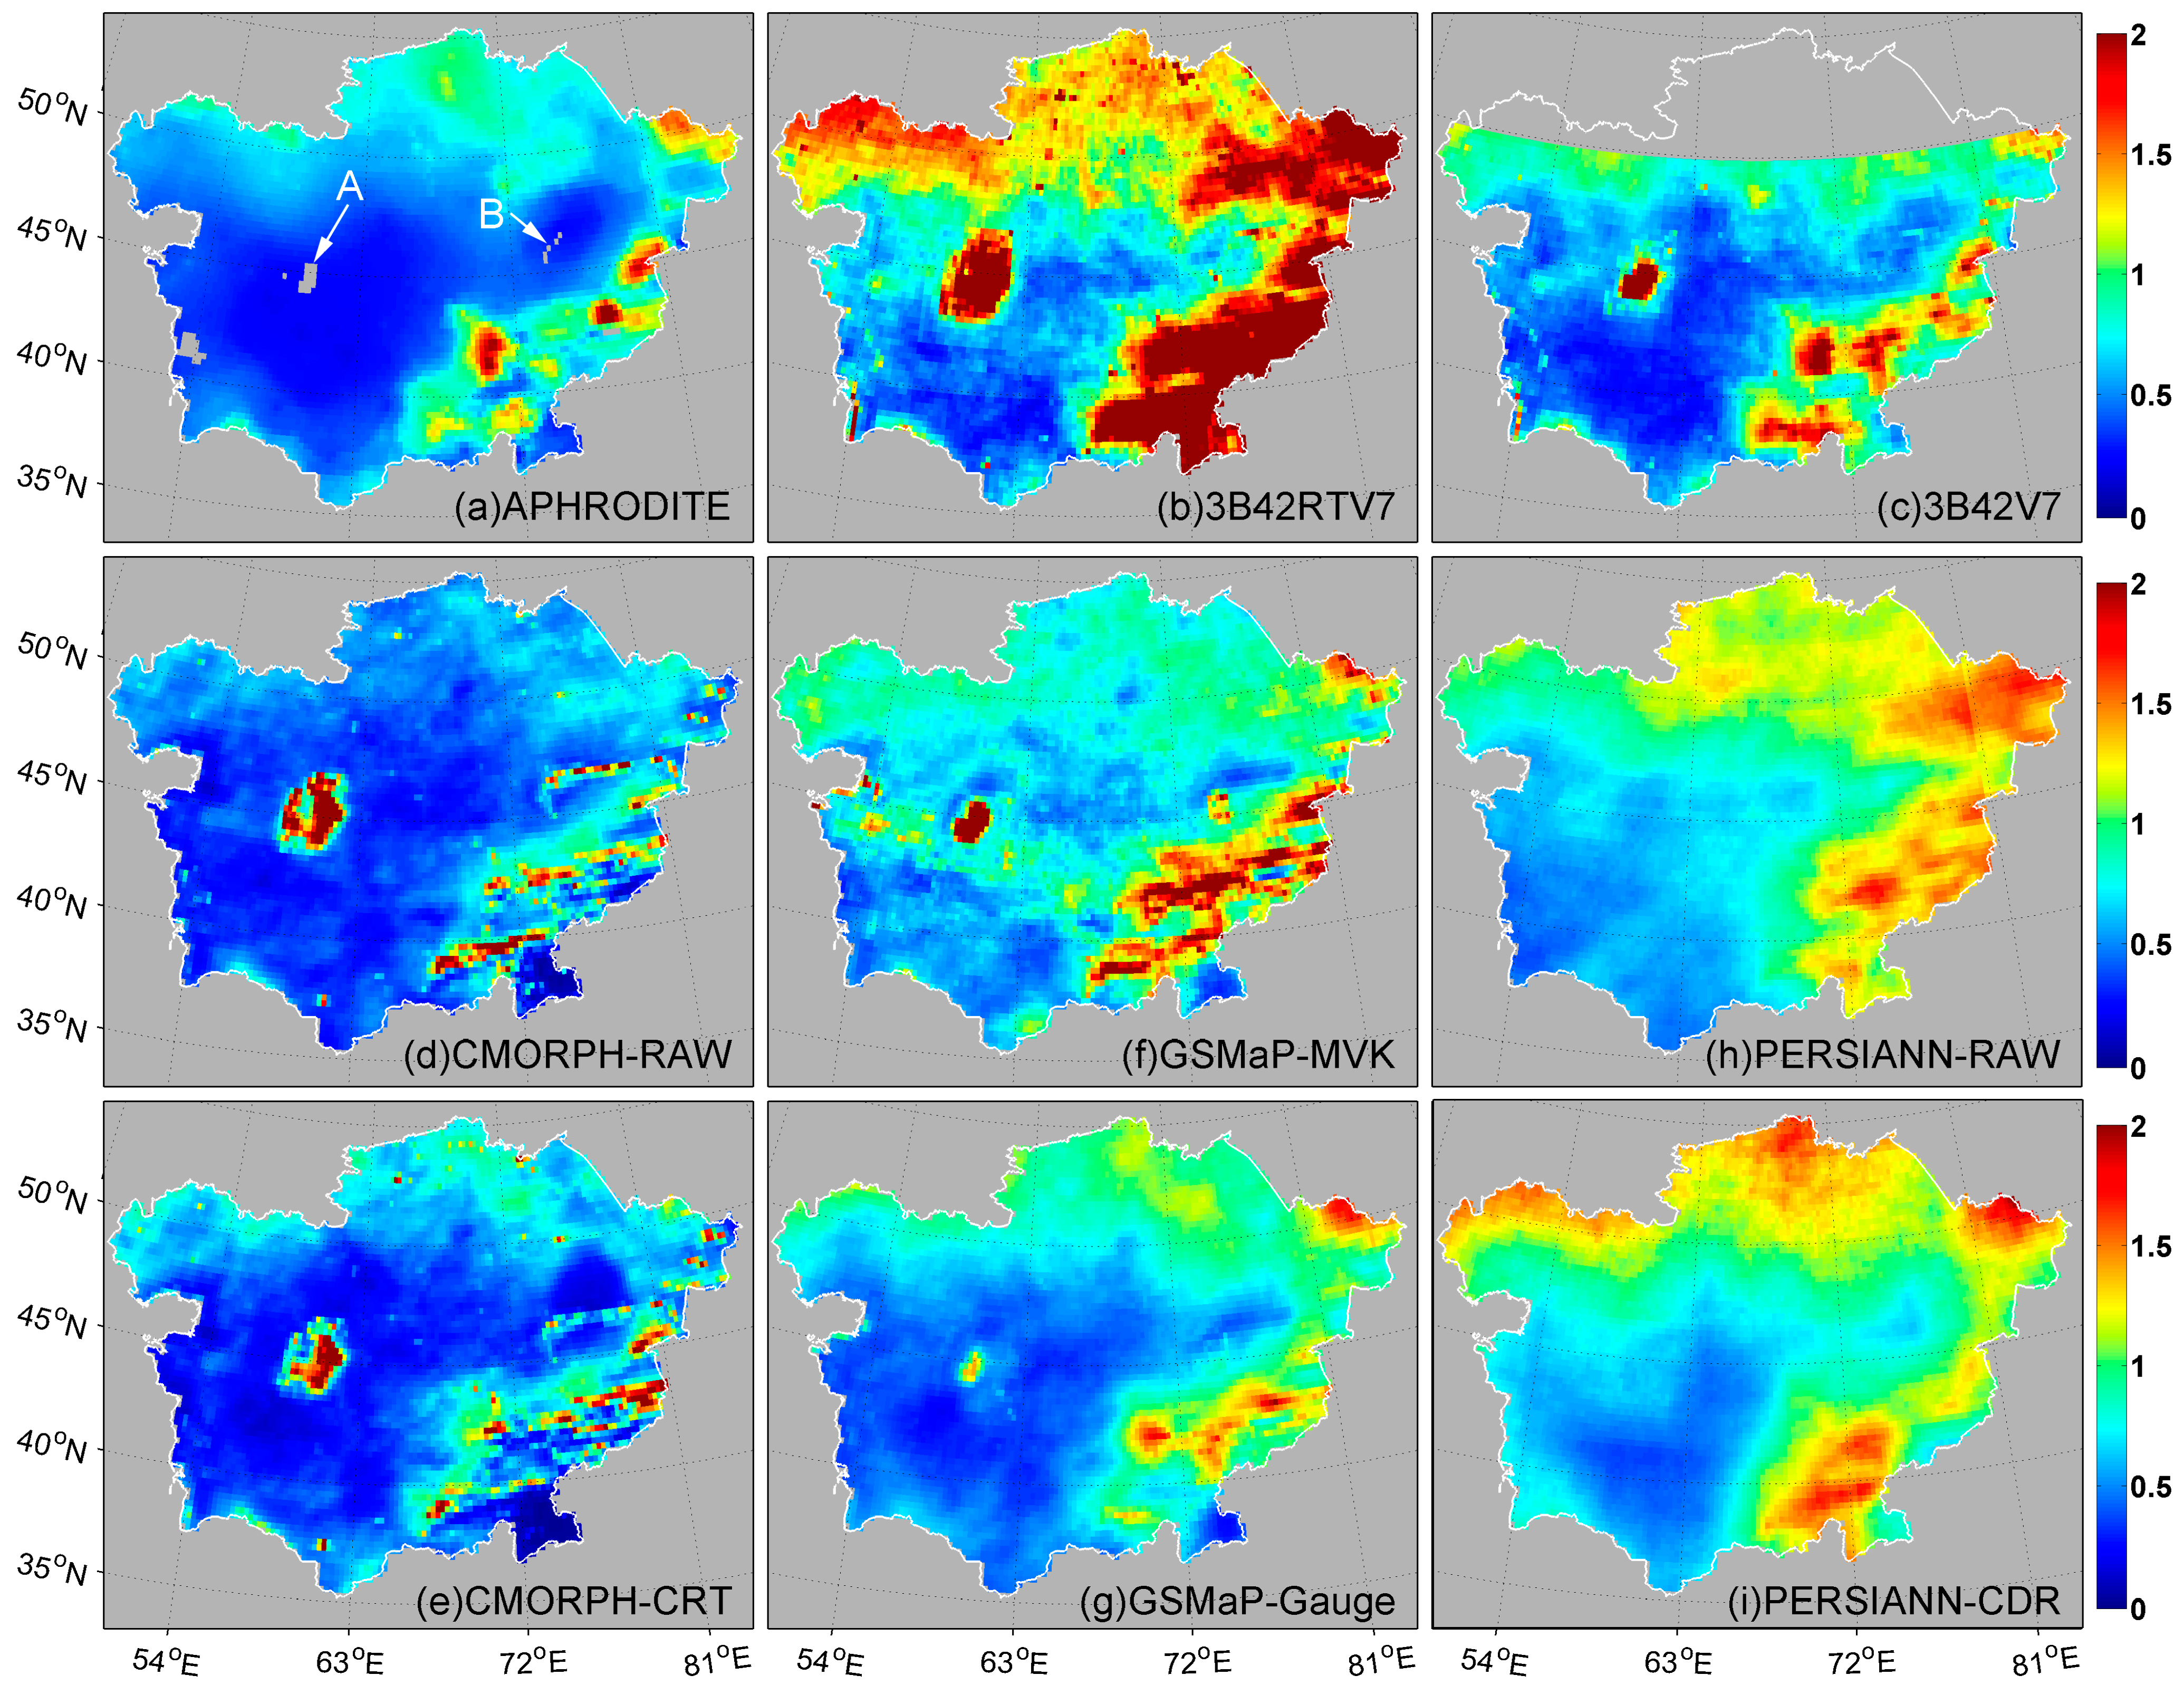
3.1. Three Year Daily Mean Precipitation

Figure 2a shows the three-year mean precipitation derived from APHRODITE over Central Asia for the period of 2004–2006. It is noted that there are several invalid data speckles marked by the character A and B in Figure 2a over the big lakes (i.e., Aral Sea and Balkhash Lake). This is because all gauge observations are located on the land surface and the interpolation technique cannot cover big waters. Qualitatively, intensive precipitation primarily distributes over the southeastern mountainous region. Moderate precipitation can be found over the northern area, whereas the central and western plains parts of Central Asia receive much less precipitation.
Compared to APHRODITE, all the satellite-based QPE products generally capture the spatial pattern of precipitation over Central Asia (Figure 2b–i). However, pronounced differences can be found between the original satellite precipitation products and bias-corrected products. Bias-corrected QPE products show lower magnitude overestimation or underestimation than their corresponding original satellite counterparts. This indicates that the bias-correction procedures can effectively improve the quality of the raw satellite rainfall estimates.
Original satellite rainfall products based on TMPA, GSMaP and PERSIANN algorithms exhibit an overestimation over Central Asia, especially for the northeastern, eastern and southeastern mountainous regions, although the bias-corrected products (i.e., 3B42V7, GSMaP_Gauge, and PERSIANN_CDR) have improved this condition greatly. This may be attributed to the following reasons: first, raindrops detected by the space-born sensors (e.g., microwave and IR sensors) may partially or totally evaporate before reaching the surface in the areas covered by semi-arid and arid climate [82,83,84,85]; second, the microwave-based algorithms are good to detect strong convective precipitation events, but tend to miss shallow and warm rains [15,86]; third, due to the land surface properties and its impact on the upwelling microwave radiation, PMW sensors, such as the Special Sensor Microwave/Imager (SSM/I), the Advanced Microwave Scanning Radiometer-Earth Observing System (AMSR-E), the Advanced Microwave Sounding Unit B (AMSU-B), are difficult to identify the precipitation over the arid area [87]; and fourth, over the mountainous regions of eastern and southeastern Central Asia, the accuracy of passive microwave retrieval of precipitation might be hampered by the snow and ice surface and the relative sparsely and unevenly rain gauges will allow the distance-weighting interpolation technique to spread nonzero precipitation into zero [83]. CMORPH QPE products show slight underestimation over the mountainous areas. This may be because CMORPH algorithm uses another different retrieval algorithm that is more conservative estimate of raining area in the presence of snow cover [56].
Figure 2. Spatial distribution of three-year mean daily precipitation derived from (a) APHRODITE, (b) 3B42RTV7, (c) 3B42V7, (d) CMORPH-RAW, (e) CMORPH-CRT, (f) GSMaP-MVK, (g) GSMaP-Gauge, (h) PERSIANN-RAW, and (i) PERSIANN-CDR over Central Asia.
Remotesensing 07 07181 g002
Impressively, severe overestimation with 3B42RTV7 occurred over Central Asia, especially the mountainous areas and near big lake area. Moreover, many isolated grid boxes of abnormal overestimation are also shown in Figure 2. Similar reports of the performances of 3B42RTV7 were also noted by Chen [83] for satellite-based precipitation estimates evaluated over China from June 2008 to May 2011. When compared with the near real time 3B42RTV7, the monthly-corrected 3B42V7 shows substantial improvement which includes smaller magnitude of overestimation over the mountainous area, a significant reduction of the speckled anomalous precipitation estimates, and also much more accurate precipitation estimates over western Central Asia. CMORPH_RAW also suffers the similar highlight overestimation speckles. However, the bias-correction procedure applied in CMORPH_CRT fails to remove these isolated overestimation grids. These overestimated grid boxes of CMORPH products were also found over China [88].
It is noteworthy that all the satellite-based precipitation products, except for products based on PERSIANN algorithm, show positive bias by different degrees over Aral Sea and its surrounding areas. After gauge-calibration, 3B42V7, GSMaP_Gauge, and CMORPH_CRT show a little overestimation over the near-lake region. Karaseva [1] validated that TMPA-3B43 product showed a remarkable overestimation of rainfall and had poor correlation with rain gauge observations over the near big lake areas in Kyrgyzstan. This special case can be explained as the mixed lake and land pixels within the PMW radiometric field of view and the poor characterization of the differences in emissivity and temperature of water surfaces in the PMW frequencies used by the retrievals [89]. In addition, the sparse coverage of rain gauge also could be partially responsible for this overestimation. Both PERSIANN_RAW and PERSIANN_CDR perform well over this region, because PERSIANN primarily uses IR brightness temperature data from geostationary satellites to estimate rainfall rate, which is different from the other three QPE retrieval algorithms [26].
Figure 3. Density-colored scatterplots of various products against APHRODITE rainfall rate shown in Figure 2 for (a) 3B42RTV7, (b) 3B42V7, (c) CMORPH-RAW, (d) CMORPH-CRT, (e) GSMaP-MVK, (f) GSMaP-Gauge, (g) PERSIANN-RAW, and (h) PERSIANN-CDR over Central Asia. The color represents the occurrence frequency. The dark oblique solid line represents 1:1 line.
Remotesensing 07 07181 g003
The density-colored scatter plots (Figure 3a–h) show a quantitative comparison between various QPE products and APHRODITE for three-year mean daily precipitation over Central Asia. Among the four satellite-only QPE products, 3B42RTV7 shows the largest magnitude of RB (128.17%) and RMSE (1.08 mm/day), which agrees well with Figure 2b. PERSIANN_RAW exhibits the highest CC (0.67) but relatively high RB and RMSE (62.60% and 0.44 mm/day, respectively). It is noted that CMORPH_RAW performs the lowest RB and RMSE (−10.62% and 0.38 mm/day, respectively) but also yields the lowest CC (0.31). This is partially due to the contribution from the aforementioned isolated overestimation speckles, which may be partially influenced by the complex terrain shown in Figure 2d. [14]. In addition, the bias-correction procedure fails to correct this kind of overestimation found in CMORPH_CRT. GSMaP_Gauge displays the highest CC (0.86) and smallest RMSE (0.20 mm/day) and low RB (21.42%) over Central Asia.
The bias-corrected QPE products perform better than the original satellite QPE products with lower RB, RMSE and higher CC. But the magnitudes of improvement vary significantly. After the bias correction being applied to 3B42RTV7 (to create 3B42V7) and GSMaP_MVK (to create GSMaP_Gauge), both a great reduction of RBs (from 128.17% to 38.49% and from 46.06% to 21.42%, respectively), RMSEs (from 1.08 to 0.33 mm/day and from 0.41 to 0.20 mm/day, respectively) and a dramatic increase in CCs (from 0.58 to 0.74 and from 0.58 to 0.86, respectively) are noted for the 3B42 and GSMaP products. Similarly, after the gauge correction is applied to CMORPH_RAW and PERSIANN_RAW (creating CMORPH_CRT and PERSIANN_CDR, respectively), the reduction in RBs is from −10.62% to −9.46% and from 62.60% to 62.40%, respectively, and the reduction in RMSEs is from 0.38 to 0.32 mm/day and from 0.44 to 0.42 mm/day, respectively. The increase in CC is relatively small, from 0.31 to 0.49 and 0.67 to 0.76, respectively.

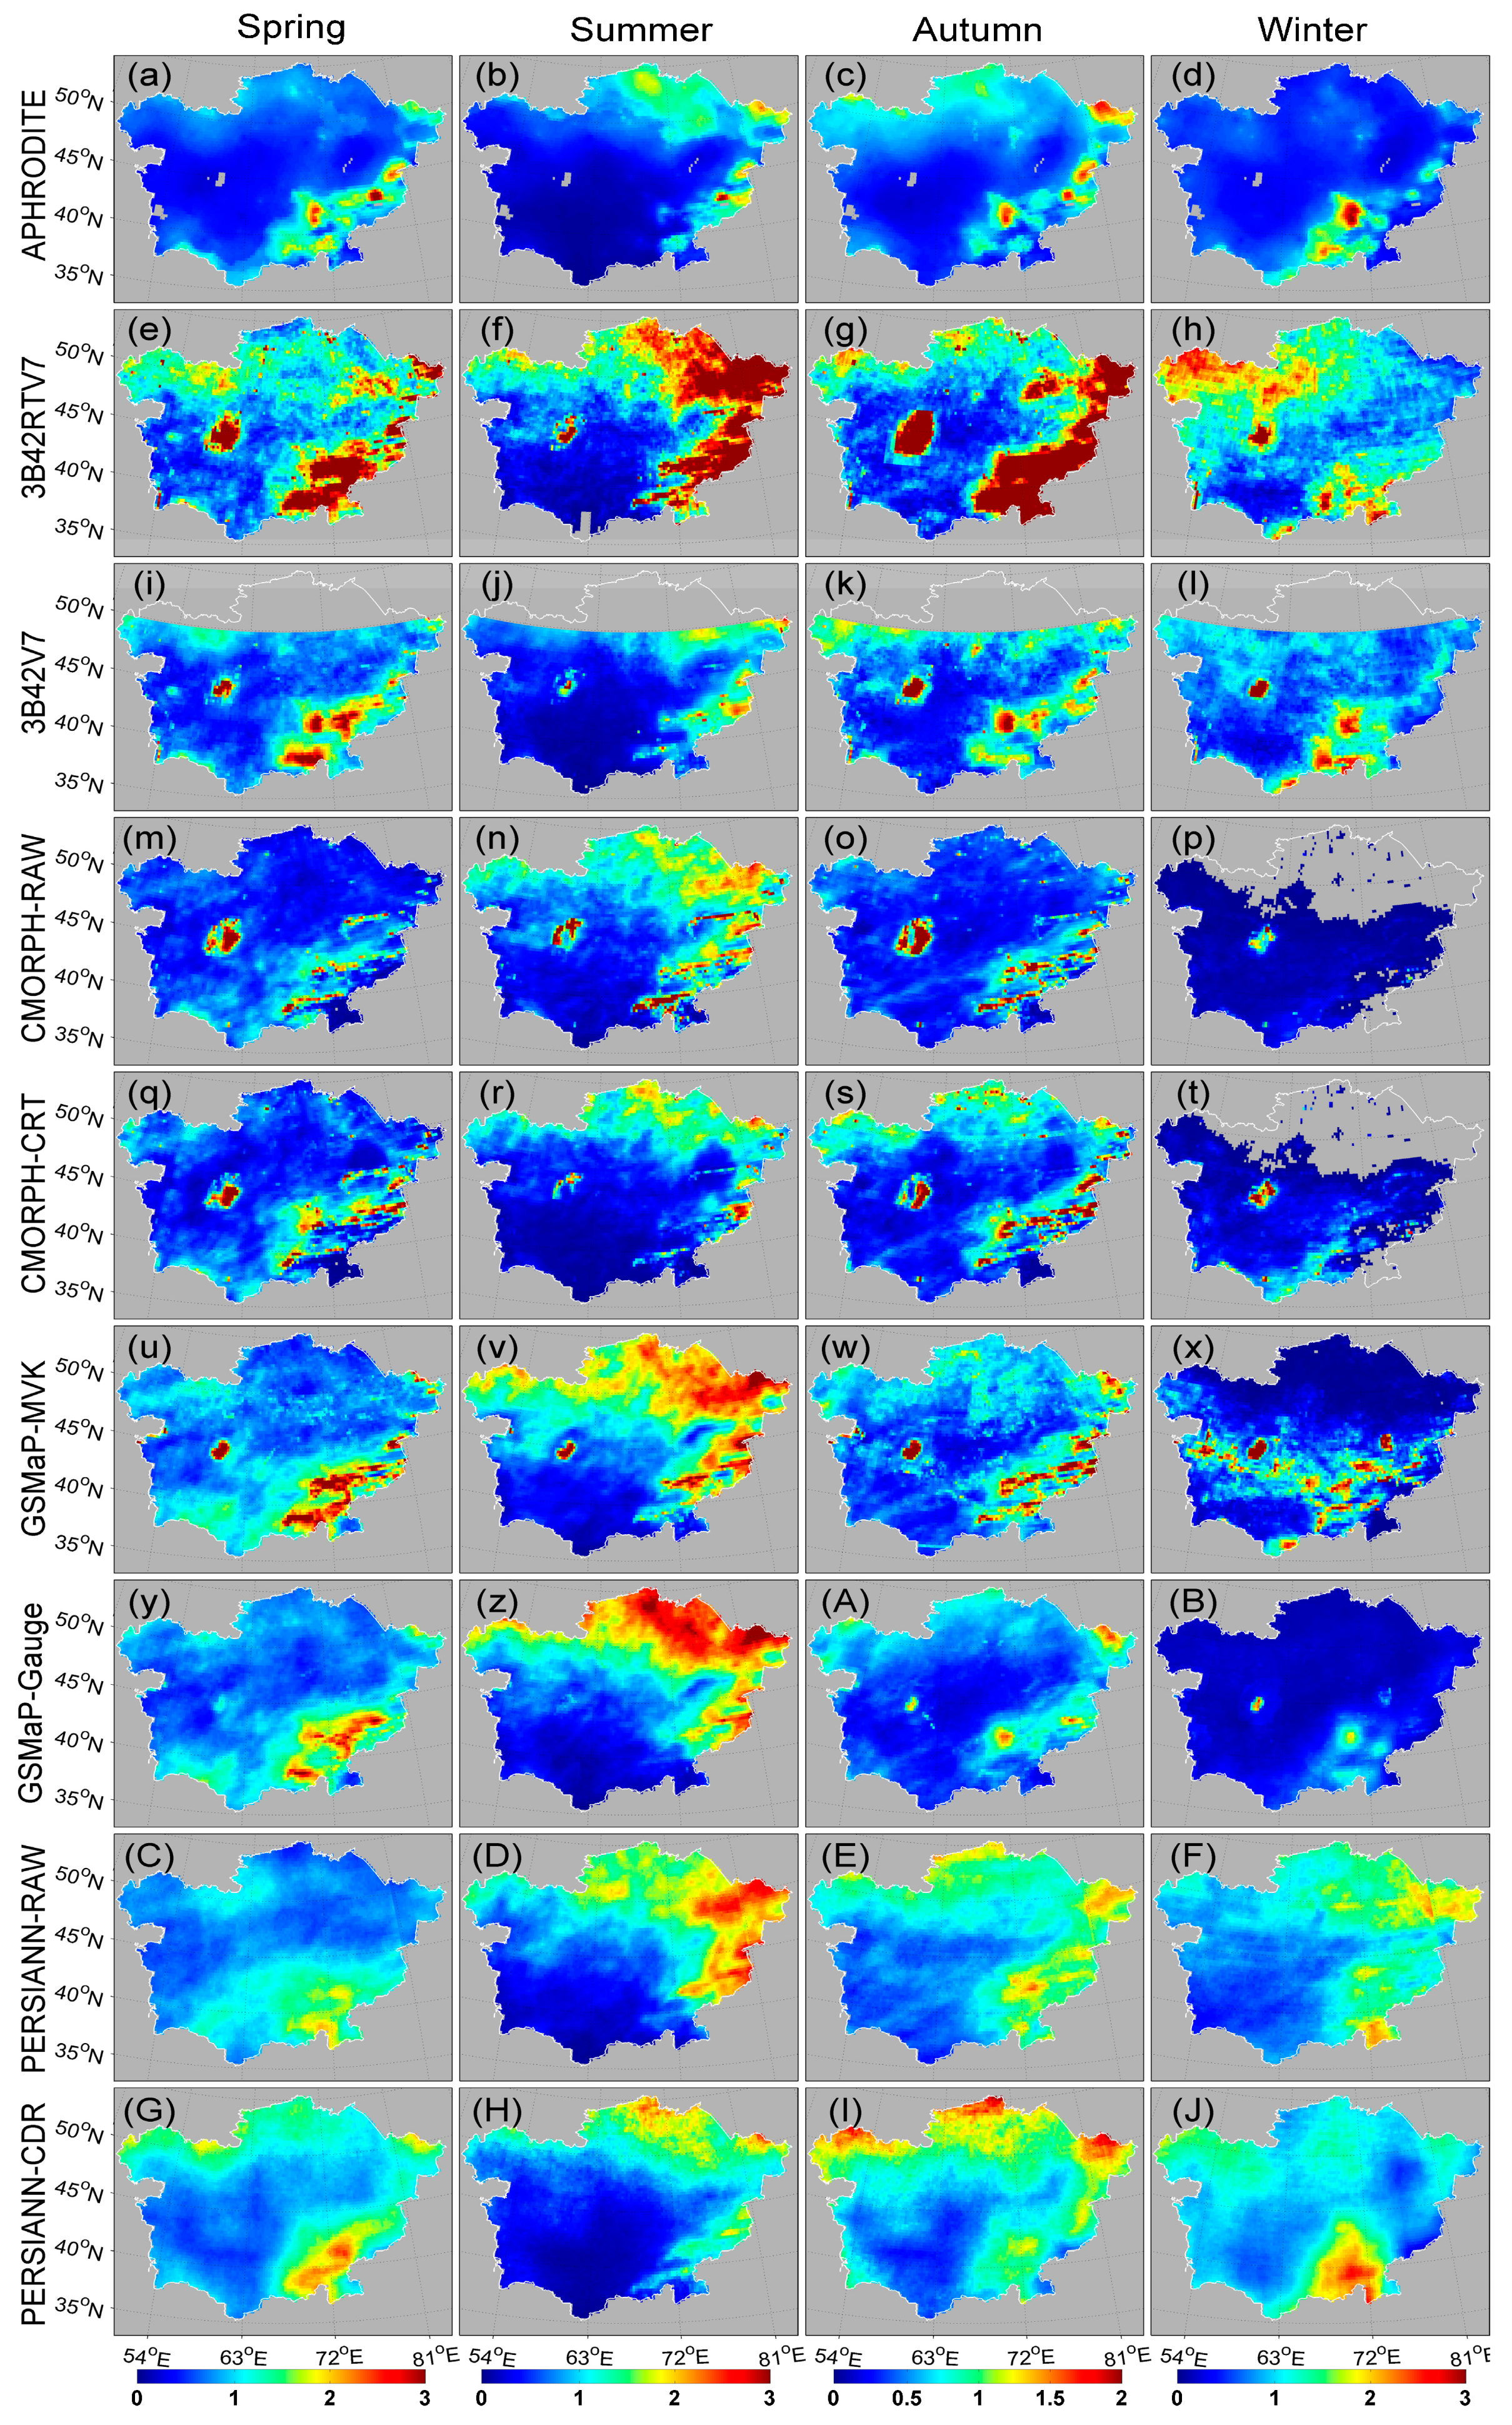
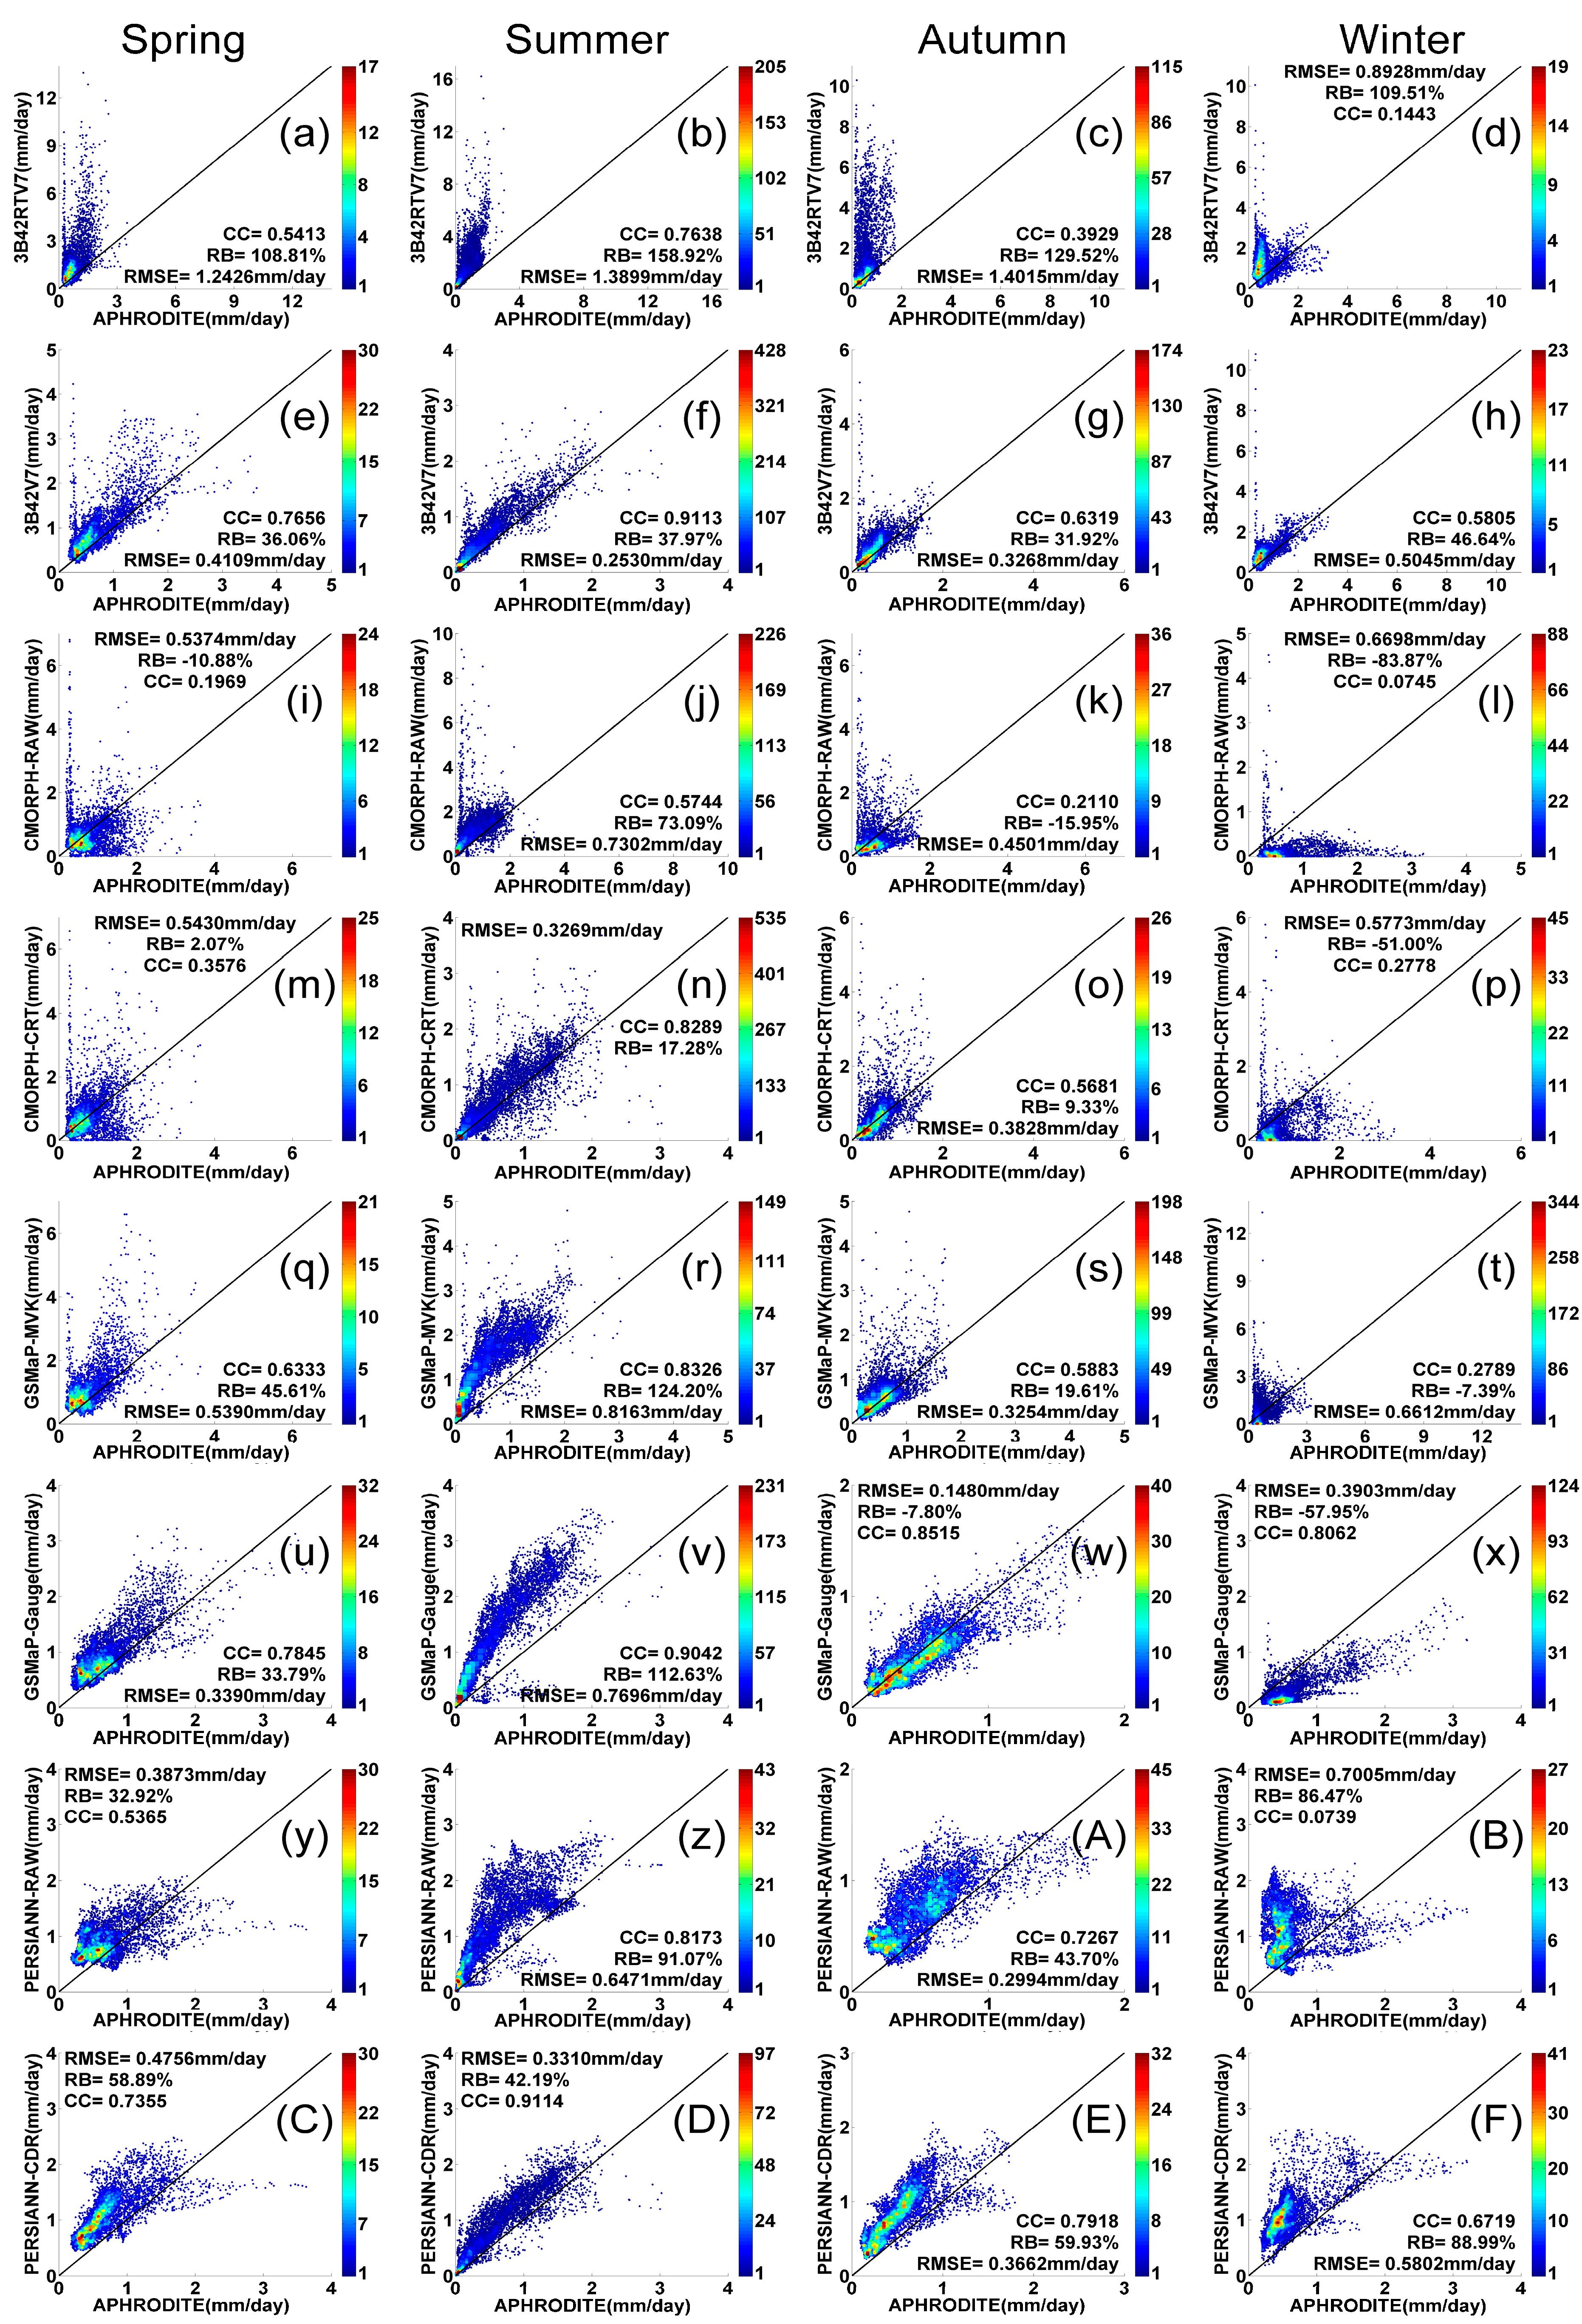
3.2. Seasonal Daily Mean Precipitation

Figure 4 reveals the seasonal precipitation patterns derived from APHRODITE and various satellite-based precipitation products over Central Asia. Seasonal performances of the eight QPE products are quantified in Figure 5. The statistics of RB, RMSE and CC are computed from the seasonal mean daily precipitation accumulations shown in Figure 4.
Because the northern part is under the strong influence of the Siberian High during winter and spring, and cyclones carry moist air masses from the north, north-west, or west to Central Asia in winter. As suggested by seasonal precipitation patterns derived from APHRODITE (Figure 4 a–d), summer and autumn are the “rainy” seasons, while few little precipitation events are measured during winter and spring over northern Central Asia. Western, central and southwestern part of Central Asia, are characterized by very distinctive continental climate with few rainfall throughout all the year. The interception of humid air by the mountains generally produces a large amount of precipitation over the southern and southeastern mountainous regions. The seasonal feature of precipitation distribution pattern can be generally captured by all satellite-based QPE products, but gauge-calibrated QPE products preform much better than their corresponding original satellite-only counterparts in capturing the pattern of precipitation during all seasons. 3B42RTV7 shows significant overestimation with large RB (>108.81%) and RMSE (>0.89 mm/day) over regions where a large amount of precipitation is observed for four seasons. The performance has been improved much in 3B42V7 with RB less than 46.64% and RMSE less than 0.50 mm/day, although the northern part is invalid for its limited spatial coverage.
Figure 4. Seasonal three-year daily mean precipitation distributions over Central Asia for TMPA, GSMaP, CMORPH and PERSIANN products and APHRODITE (aJ).
Remotesensing 07 07181 g004
Figure 5. Density-colored scatterplots of different products against APHRODITE rainfall rate shown in Figure 4. The color represents the occurrence frequency (aF).
Remotesensing 07 07181 g005
Both the original satellite-only and gauge-corrected QPE products give best (worst) performance with the highest (lowest) CC, but relatively high RB and RMSE in summer (winter). All the products give a striking overestimation in summer. This may be primarily a result of the greater volume and higher frequency of rain during the summer than winter. In addition, this result also could be related to the evaporation of precipitation before reaching the surface during the hot dry season [82,83,84,85]. The RMSEs of satellite-only products remains more than 0.66 mm/day and CC less than 0.28 in winter. GSMaP_MVK shows underestimation over the southern region and estimated many heavy rain speckles in winter over the central and western Central Asia, which is covered by desert. So the little negative RB (−7.39) is from the cancelling effect of the positive overestimation values and negative underestimation values. The bias-correction procedure improves the quality of GSMaP_Gauge with an increasing CC from 0.27 to 0.81 and a decreasing RMSE from 0.66 to 0.39 mm/day, but also an increasing RB from −7.39% to −57.95%. Both CMORPH_RAW and CMORPH_CRT estimate large range of abnormal zero precipitation over the high-latitude areas and high-altitude areas in winter. This is likely due to the following reasons: on the one hand, ice and snow surface tends to influence PWM-based accurate retrievals over land [86]; on the other hand, PMW-based algorithms used in GSMaP and CMORPH are good at detecting strong, convective precipitation events, but tends to miss shallow precipitation events [15]. This result is consistent with previous study over China [88]. This should be partially responsible for the large RMSE (0.67 mm/day and 0.58 mm/day), RB (−83.87% and −51.00%) and low CC (0.07 and 0.28) in winter.
Over Aral Sea and its surrounding areas, 3B42RTV7, CMORPH_RAW and GSMaP_MVK have high positive biases during the entire period. Such abnormal evaluations likely result from the aforementioned poor identification between the land emissivity and temperature of water surfaces in PMW-based retrievals [89]. After bias-correction, the near-big-lake overestimations have been greatly improved but the errors still persist. GSMaP_Gauge succeeds in removing most lake-around overestimation problem in spring and summer but the corrected effectiveness decrease in autumn and winter. PERSIANN products perform well with little overestimation over Aral Sea and the surrounding area in each season. As discussed in Section 3.1, this may be because the PERSIANN algorithms are mainly based on IR data, which are less affected by large water bodies.

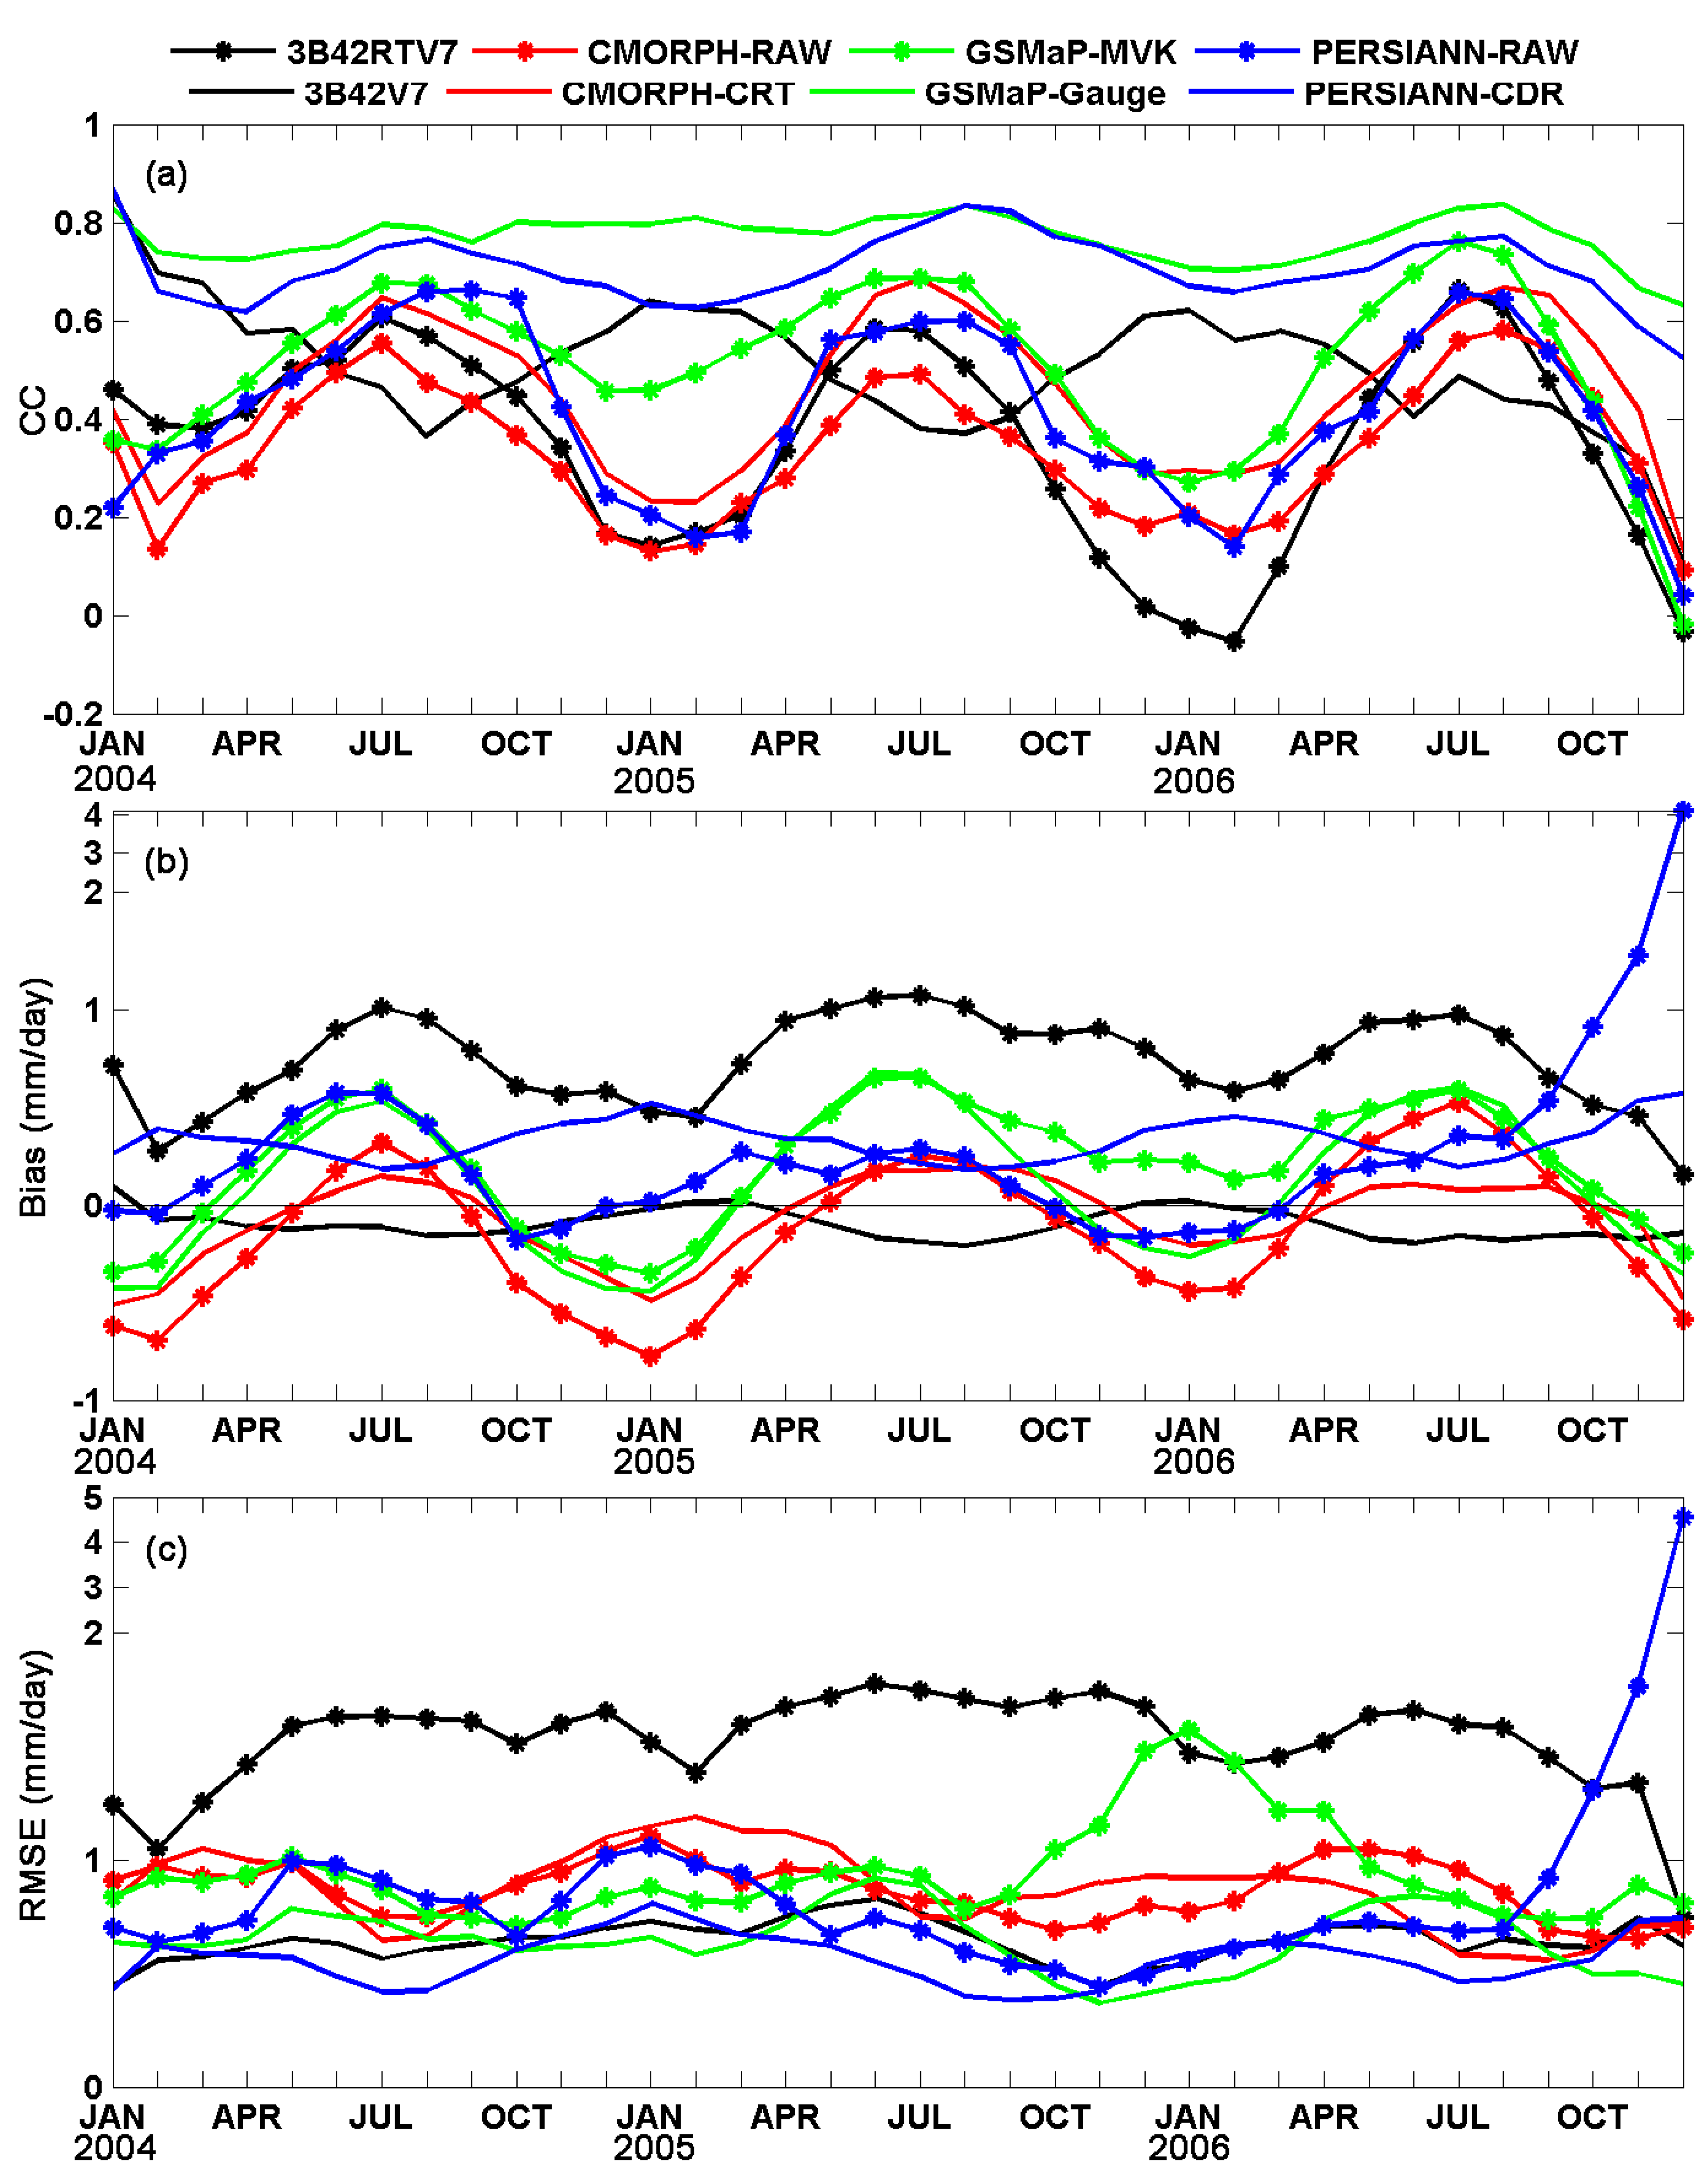
3.3. Time Series Monthly Precipitation

In order to investigate the temporal behavior of Bias, CC and RMSE of satellite-based products over Central Asia, comparison statistics are calculated for each month during 2004 to 2006 in Figure 6. It is reported that a sparse station network degrades the quality of gauge-based analysis [90]. In addition, a substantial magnitude of both bias and random errors may occur in the gauge-based analysis over grid boxes with no gauge reports available nearby [91]. Therefore, statistics here are computed using monthly-mean data and grid cells only where/when at least one gauge observation is available. The analysis is performed only for rainfall event condition.
Figure 6. Time series of (a) Correlation Coefficient (CC), (b) Bias, and (c) Root-Mean-Square Error (RMSE) between various products and APHRODITE over continuous China on 0.25° lat/lon grid box. Statistics are computed by using monthly-mean data and grid cells only where/when there is at least one reporting gauge and both APHRODITE and the satellite-based precipitation estimates are above zero can be selected for computation.
Remotesensing 07 07181 g006
The pattern of monthly-mean CC (Figure 6a) for all original satellite precipitation products is relatively low during the cold seasons (from October to April) when the climate is dry. Then it reaches a stable and higher level during mild and warm seasons (from April to October). The reasons behind this may be related to the following: first, there is a much higher frequency of intense/convective precipitation events, which are detected relatively well by PMW sensors (due to a more developed ice-phase) during the warmer seasons (from April to October), while more shallow precipitation events that are difficult detected accurately by PMW sensors occur during the colder seasons (from October to April); second, both the quality of PMW-based retrievals, e.g., AMSE-E, AMSU-B and SSM/I and the accuracy of PMW-based algorithms are influenced by the aforementioned snow/ice surface in winter. Among the original satellite QPE products, GSMaP_MVK is strongly correlated with gauge observations, with CC up to nearly 0.65 in the warm seasons, although CC is as low as about 0.3 in the cold seasons of 2006 and 2007. Gauge-calibrated products show quite different performance due to bias-correction algorithms' differences. On the contrary, 3B42V7 shows large fluctuating pattern, which gives a higher CC during cold seasons and a relatively low CC in warm seasons. Furthermore, 3B42V7 presents a consistent slight bias and a relatively stable lower RMSE (less than 1 mm/day). These results suggest that correction procedure works more effectively in removing bias but does not perform well in improving CC over Central Asia. CMORPH_CRT demonstrates a minor improvement with a similar season-dependent pattern as compared to the original satellite estimate counterpart in terms of CC, Bias and RMSE. This can be the evidence that the bias-corrected algorithms in CMORPH_CRT cannot perform well over semi-arid and arid areas in improving CC, removing bias and decreasing season-dependent variability. After bias-correction, GSMaP_Gauge has a stably highest correlation among the satellite-based precipitation products, but the improvements in Bias and RMSE are not obvious. PERSIANN_CDR gives an overestimation consistently with high CC and small RMSE over Central Asia throughout the three-year comparison period.
It is impressing that PERSIANN_RAW shows an abnormal overestimation during October to December 2006. This phenomenon was also noted in the semi-arid and arid regions of China from October 2006 to July 2007 [88]. This may be attributed to the poor input IR data, which lead to poor results of the IR based PERSIANN algorithms from October 2006 to April 2007. In addition, raindrops detected by the microwave and precipitation radar onboard the satellites may partially or totally evaporate before reaching the surface in the areas with semi-arid climate [82,83]. This can be also explained by the lack of training of the artificial neural network parameters over Central Asia and China since PERSIANN is only adequately trained over the United States [92].

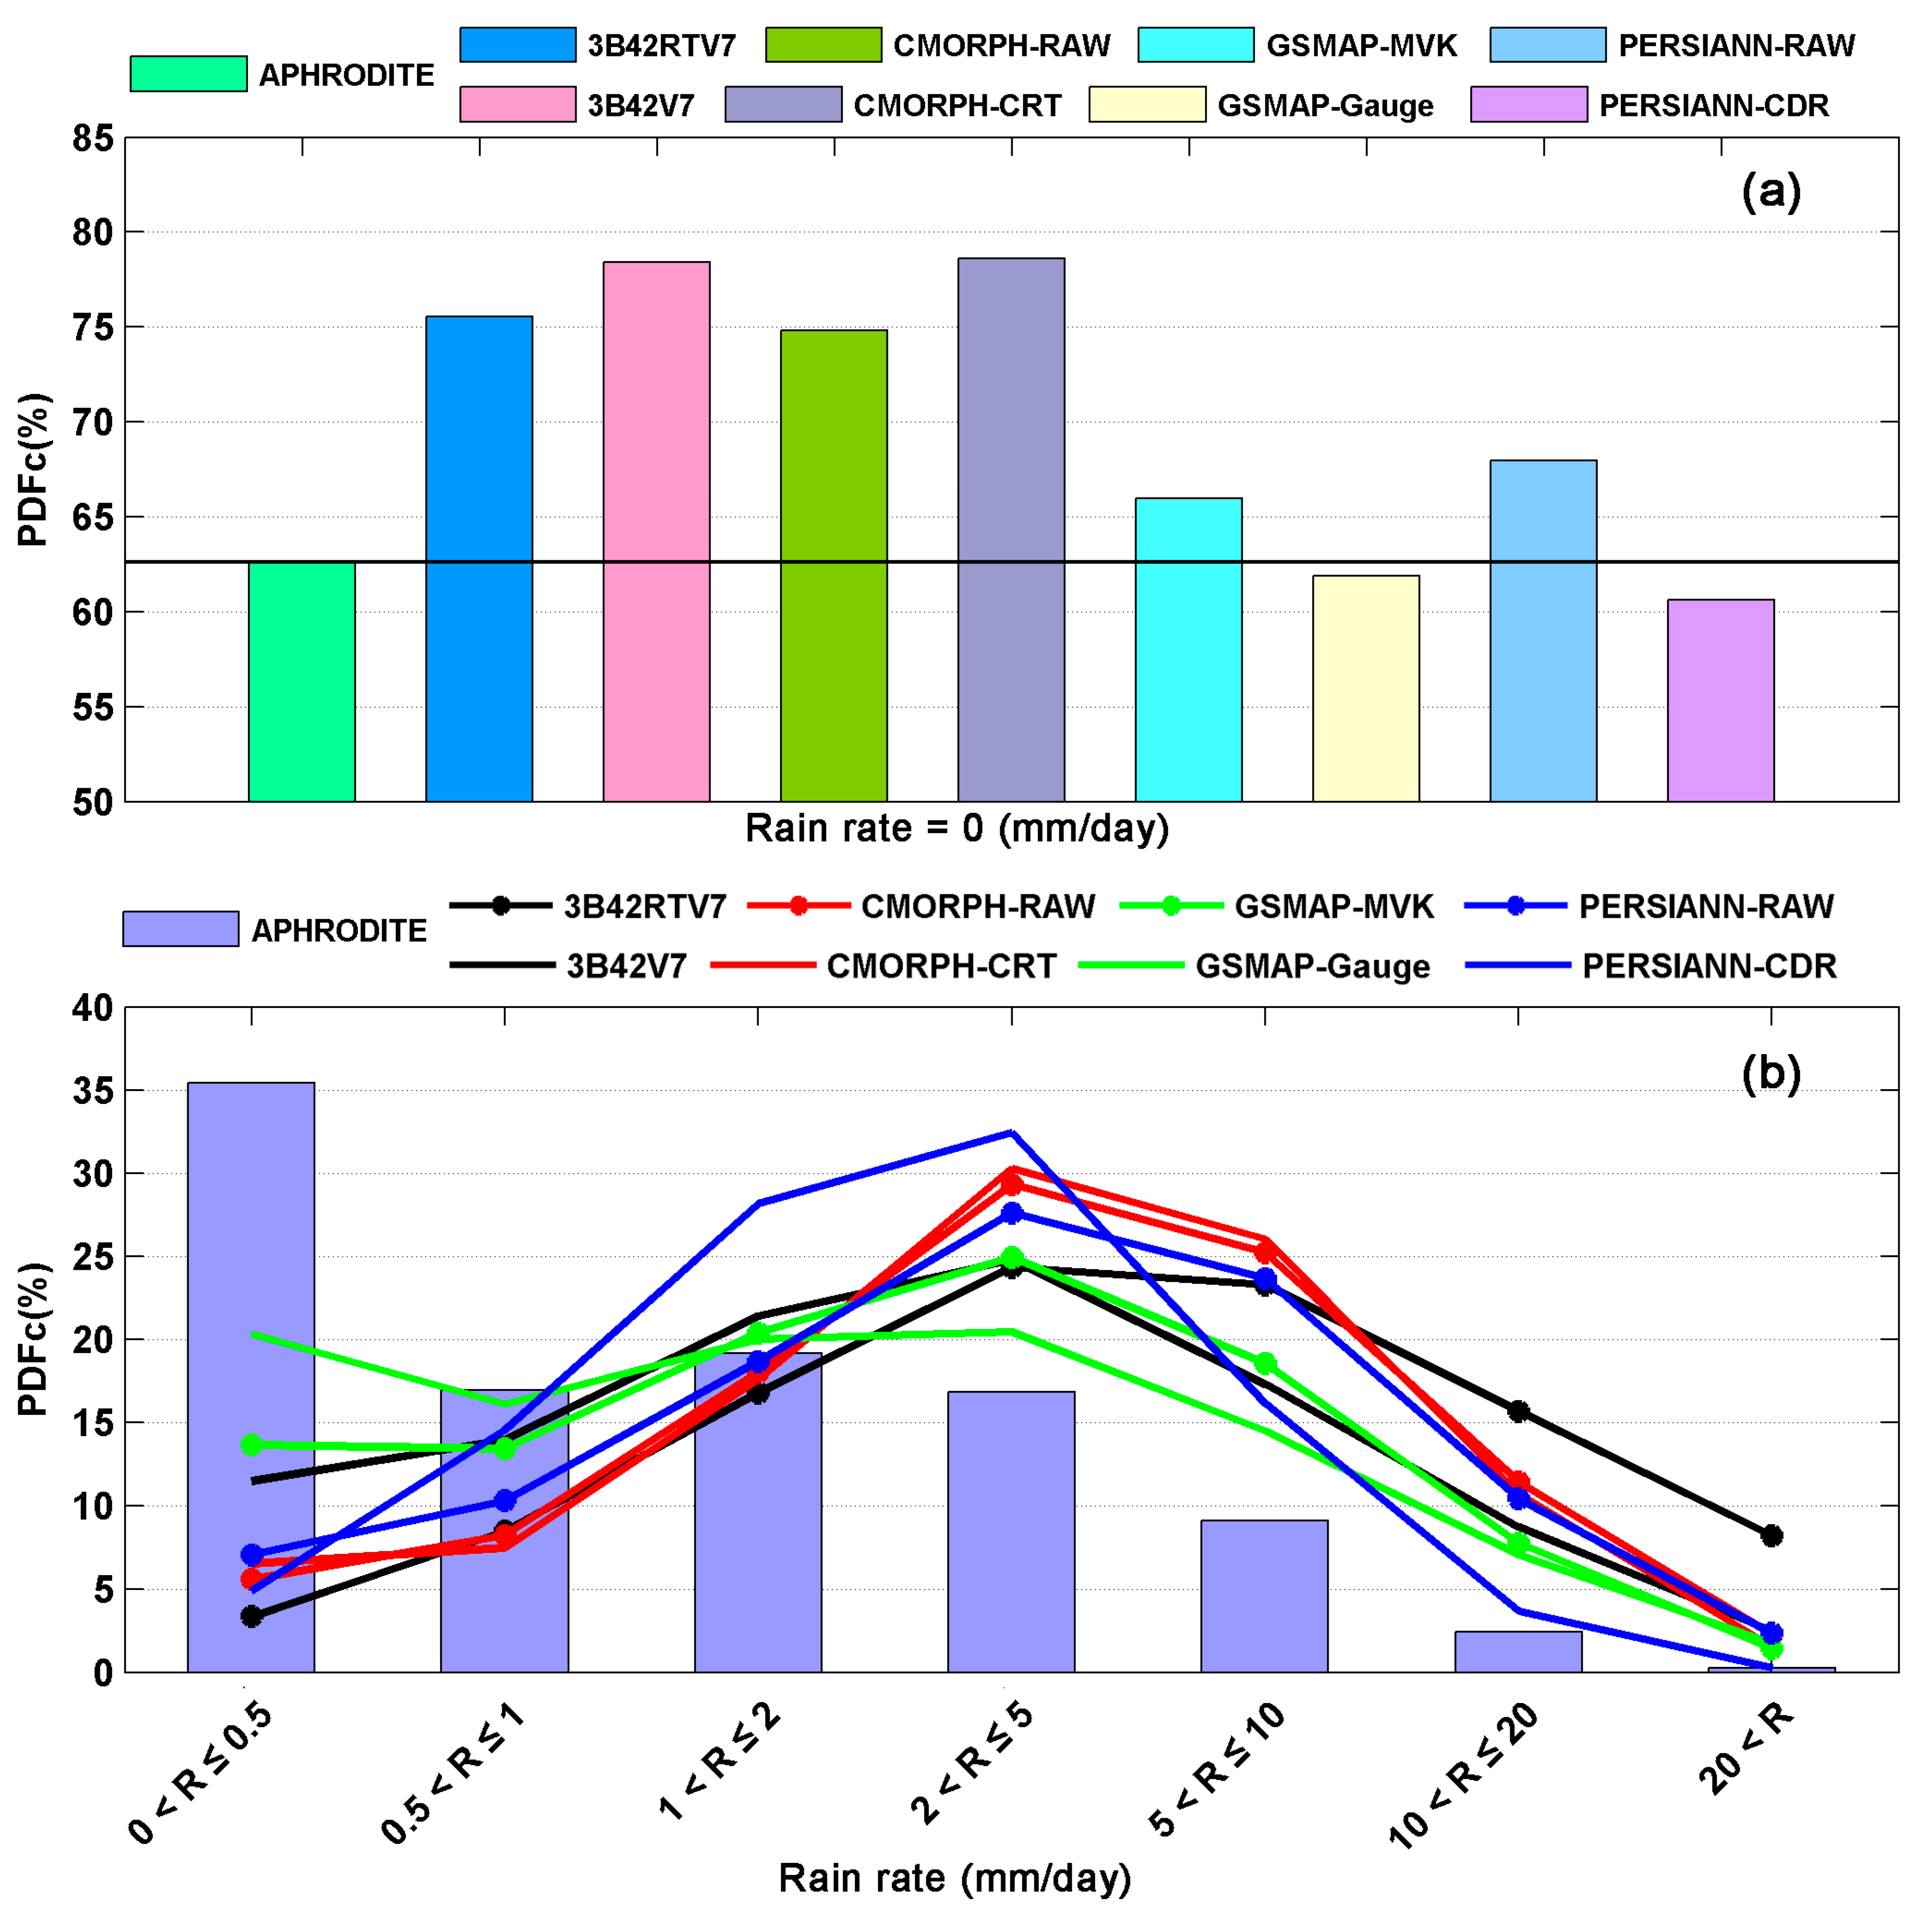
3.4. Probability Distribution by Occurrence

To understand the overall characteristics of rainfall, the rainfall frequency with different intensities is equally important as knowing the mean and spatial/temporal variation patterns of precipitation [86]. Because the same rainfall amount in the form of long-lasting light rain or a short-duration storm will yield quite different impacts in natural hazards, e.g., flood and landslide [92,93]. In this regard, probability distribution function (PDF) can provide us with detailed information about the frequency of rainfall with different intensities.
In this section, all the satellite-based products are examined against the reference data APHRODITE in capturing the occurrence of rainfall and statistical characteristics of precipitation intensity over Central Asia in the three-year period from 2004 to 2006. The PDF of daily rainfall occurrence is computed as a ratio between the number of times the precipitation occurs inside each bin (as in a histogram) and the total number of times precipitation occurs overall. And the precipitation intensities (R) are grouped into eight bins: (1) no-rain (R = 0); (2) 0< R ≤ 0.5 mm/day; (3) 0.5 mm/day < R ≤ 1 mm/day; (4) 1 mm/day < R ≤ 2 mm/day; (5) 2 mm/day < R ≤ 5 mm/day; (6) 5 mm/day < R ≤ 10 mm/day; (7) 10 mm/day < R ≤ 20 mm/day; and (8) R > 20 mm/day.
When spatially interpolated from point measurements, the reference data will lead to more events with reduced intensities because strong events tend to “spill” to adjacent grid boxes [86]. In order to avoid the errors from interpolation, only the cells where there is at least one reporting gauge in APHRODITE can be selected for computation. The frequency of no-rain cases and the PDF of daily precipitation with different intensities are shown in Figure 7a,b, respectively.
About 63% are reported by reference dataset (APHRODITE) in the frequency of no-rain events. In general, all satellite-based precipitation products, except for GSMaP_Gauge and PERSIANN_CDR, tend to detect more no rain events than the ground measurements, which indicate that satellite-based precipitation products missed some raining cases. Products based on TMPA and CMORPH algorithms show significant over-detection (more than 75%) of no-rain events. After correction, 3B42V7 and CMORPH_CRT perform even worse than their corresponding original satellite counterparts with a higher proportion of no-rain events; this indicates that the two products tend to miss some rainfall events. While products based on GSMaP and PERSIANN algorithms present the frequency of no-rain events closer to that of gauge observations. GSMaP_Gauge agrees best with APHRODITE in terms of occurrence frequency. The gauge-calibrated GSMaP_Gauge and PERSIANN_CDR exhibit slightly less percentage of no rain events than APHRODITE, with values around 62% and 60%, respectively.
All the precipitation products capture less precipitating events than the reference dataset for light rain (0–1 mm/day), mainly between 0 to 0.5 mm/day. This partially explains the over-detection of no-rain events. And this may be, at least partially, related to the interpolation process used in APHRODITE. Because the interpolation from point scale to 0.05 degrees and then from 0.05 degrees gridding to 0.25 degrees will “spread” the areas of precipitation. For rainfall 2 mm/day and above, the trend is reversed that there are more precipitating days detected by satellite-based products. In other words, the satellite-based QPE products detected more heavy precipitation events than the ground measurements. These results may be attributed to the following aspects: first, the satellite-based algorithms are good in detecting strong, convective precipitation events, but tend to miss shallow and warm rain; second, raindrops detected by the microwave and precipitation radar onboard the satellites may partially or totally evaporate before reaching the surface in semi-arid and arid areas [82,83]; and third, the bias correction procedures will also boost the amplitude of detected events to compensate for the would-be contribution from missed events [86]. Consequently, this will likely shift the precipitation distribution “spectrum” to the higher intensity and cause great differences for the various applications, such as runoff production.
GSMaP_Gauge outperforms all other products for the precipitation intensity in the range of 0 to 10 mm/day. When the rain rate is more than 10 mm/day, PERSIANN_CDR shows the closest performance with APHRODITE. As demonstrated by PDF of precipitation, the magnitude of the detected events will be reduced at the expense of the missed events, skewing the intensity distribution [86]. In fact, the gauge adjustment can modify the daily rainfall amounts but not the occurrence of rain [94,95].
Figure 7. (a) Probability density function (PDF) of daily precipitation for no rain case. (b) PDF of daily precipitation for cases with different intensities. Only grid cells where there is at least one reporting gauge and both the reference and the satellite-based precipitation estimates are nonzero can be selected for computing the PDF.
Remotesensing 07 07181 g007

3.5. Contingency Statistics

Probability of detection (POD), False Alarm Ratio (FAR) and Critical successful index (CSI) clarify the nature of the occurrence errors [41]. The contingency statistics (POD, FAR and CSI Scores) of satellite-based QPE products as a function of daily precipitation rate are shown in Figure 8. During the rain rate range from 0.1 to 25 mm/day, the superiority of GSMaP_Gauge is clearly evident, with a much higher POD and CSI than other satellite-based products, which have the similar POD and CSI pattern over Central Asia. This result is consistent with the precipitation occurrence distribution shown in Figure 7. While all the products differ in the performances of FAR as shown in Figure 8b. PERSIANN_CDR and GSMaP_Gauge show the lowest FAR in different rainfall range (0.1–2 mm/day and 2–18 mm/day, respectively). However, the FAR percentage of PERSIANN_CDR increases rapidly and reaches about 100% at near 17 mm/day. 3B42V7 outperforms other products when the rain rate is from 18 to 40 mm/day. CMORPH products give the relative poor performances with the highest FAR from 0.1 to 8 mm/day and relative high FAR when rain rate is greater than 8 mm/day.
Figure 8. (a) Probability of detection (POD); (b) False Alarm Rate (FAR); and (c) Critical Successful Index (CSI) contingency statistical scores over Central Asia.
Remotesensing 07 07181 g008

3.6. Spatial Analysis

The spatial distribution’s patterns of satellite-based products are helpful to provide insights to analyze the error propagation in regional hydrological and climatological applications [15]. The spatial distribution maps of Bias, RB, RMSE and CC of the satellite-based products versus APHRODITE are given in Figure 9. The Bias, RB, RMSE and CC are computed grid by grid with three-year samples of daily precipitation rates.
As shown in Figure 9, all gauge-calibrated QPE products have smaller magnitudes of Bias, RB, RMSE and higher CC than their corresponding uncorrected counterparts. Generally, the bias-correction procedure can decrease the errors of the four groups of satellite-based precipitation products. Among the original satellite precipitation products, as it has been discussed in aforementioned sections, 3B42RTV7 exhibits overestimation with lower CC and higher Bias, RB, and RMSE, especially for the mountainous areas and near Aral Sea regions. Figure 9t shows a large amount of significant error grid boxes of GSMaP_MVK, although these error gird boxes are not obvious in Bias and RB (Figure 9q,r). It is noted that GSMaP_Gauge shows the best performance according to the spatial distribution of Bias, RB, RMSE and CC, especially for the relatively higher CC. The bias adjustment procedure in GSMaP_Gauge succeeds to remove these error speckles.
Figure 9. Spatial distribution of Bias, RB, RMSE and CC between different satellite-based products and APHRODITE of three years daily mean precipitation over Central Asia on a 0.25° lat/lon grid (aF).
Remotesensing 07 07181 g009
All the QPE products except for PERSIANN algorithms show an overestimation over Aral Sea and its surrounding areas. This is likely attributed to the aforementioned combined effect of lake and land pixels within the PMW sensors' footprint and contamination of the temperature of water surfaces. However, the IR sensors are less influenced by this contamination, so PERSIANN based products, which mainly rely on IR retrievals, avoid this abnormal overestimation problem over near Aral Sea area. The gauge adjustments in non-PERSIANN products reduce the near-lake overestimation significantly, whereas correction in GSMaP_Gauge performing best. This indicates that the gauge-adjustment algorithms in TMPA and CMORPH need to be improved further.
Although the bias-correction processes have reduced the magnitude of errors, TMPA, GSMaP and PERSIANN products overestimate much precipitation over Central Asia, especially over the mountainous areas with high Bias, RB and RMSE, while CMORPH QPE products, in general, underestimate except some overestimation speckles. The overestimation or underestimation over mountainous regions indicates that accurate estimation by satellite-based QPE products remains a challenge because the non-uniform beam filling (NUBF) problem for remote sensing instruments, which is a common problem in the scientific community [16,96,97,98,99,100].
A snow screening process to discriminate between precipitation and snow-ice at the surface and to set nonzero rainfall estimates to values missing over snow/ice covered regions is applied in CMORPH algorithms [17,51]. This may be partially responsible for the underestimation of CMORPH products over mountainous areas. This overestimation or underestimation of different satellite-based precipitation may also be related to the errors generated from the interpolation technique and sparsely distribution of rain gauges.
Figure 10. Probability (cumulative) distribution functions PDFc (CDFc) for spatial Bias, RB, RMSE and CC values shown in Figure 9. (a) Bias PDFc, (b) RB PDFc, (c) CC PDFc, (d) RMSE PDFc, (e) Bias CDFc, (f) RB CDFc, (g) CC CDFc, (h) RMSE CDFc.
Remotesensing 07 07181 g010
Figure 10 shows the corresponding Probability Distribution Function (PDFc) and Cumulative Distribution Function (CDFc) of Bias, RB, RMSE and CC. Quantitatively, both CMORPH_RAW and CMORPH_CRT show similar PDFs skewed toward the left of 0, while other QPE products’ PDFcs of Bias and RB skew to the right (Figure 10a,b). This is consistent with the result shown in Figure 9 that CMORPH-based products underestimate precipitation, and other QPE products overestimate precipitation. GSMaP_Gauge gives the best performance with a relatively high proportion of low Bias (peaking ~35% around 0.2 mm/day), RB (peaking ~18% around 20%), RMSE (peaking ~70% around 2 mm/day) than its corresponding satellite-only counterpart and other products. GSMaP_Gauge also has a fairly high proportion of CC from 0.4 to 0.8. However, 3B42RTV7 exhibits great positive bias over Central Asia with a lower peak skewed to right much in Bias, RB and RMSE (about 10%, 7% and 28% respectively). CMORPH_CRT and CMORPH_RAW, as well as PERSIANN_CDR and PERSIANN_RAW show the similar distribution of Bias, RB and RMSE but a small shift from low CC to high CC. These results suggest that the bias-corrections techniques in both CMORPH and PERSIANN cannot reduce bias significantly although they can help to improve the CC. Overall, the gauge-correction techniques in TMPA and GSMaP show good tendency to reduce the magnitudes of Bias, RB and RMSE and improve the magnitudes of CC over Central Asia.

4. Conclusions

As alternative sources of precipitation information, future developments of satellite precipitation algorithms and utilization of satellite datasets in operational applications rely on a more in-depth understanding of satellite errors and biases across different spatial and temporal scales. This paper provides an early thorough quantitative study of error characteristics for eight satellite-based QPE products based on four different satellite precipitation algorithms. Each algorithm includes both original satellite and bias-corrected satellite-based QPE products. The quantitative analysis is based on daily, seasonal and inter-annual rainfall comparisons with gauge-based APHRODITE product through the study period ranging from 2004 to 2006 over Central Asia. In addition to the conventional statistical indices, frequency and spatial analyses have also been conducted in this study. The major findings of this study are summarized as follows:
(1)
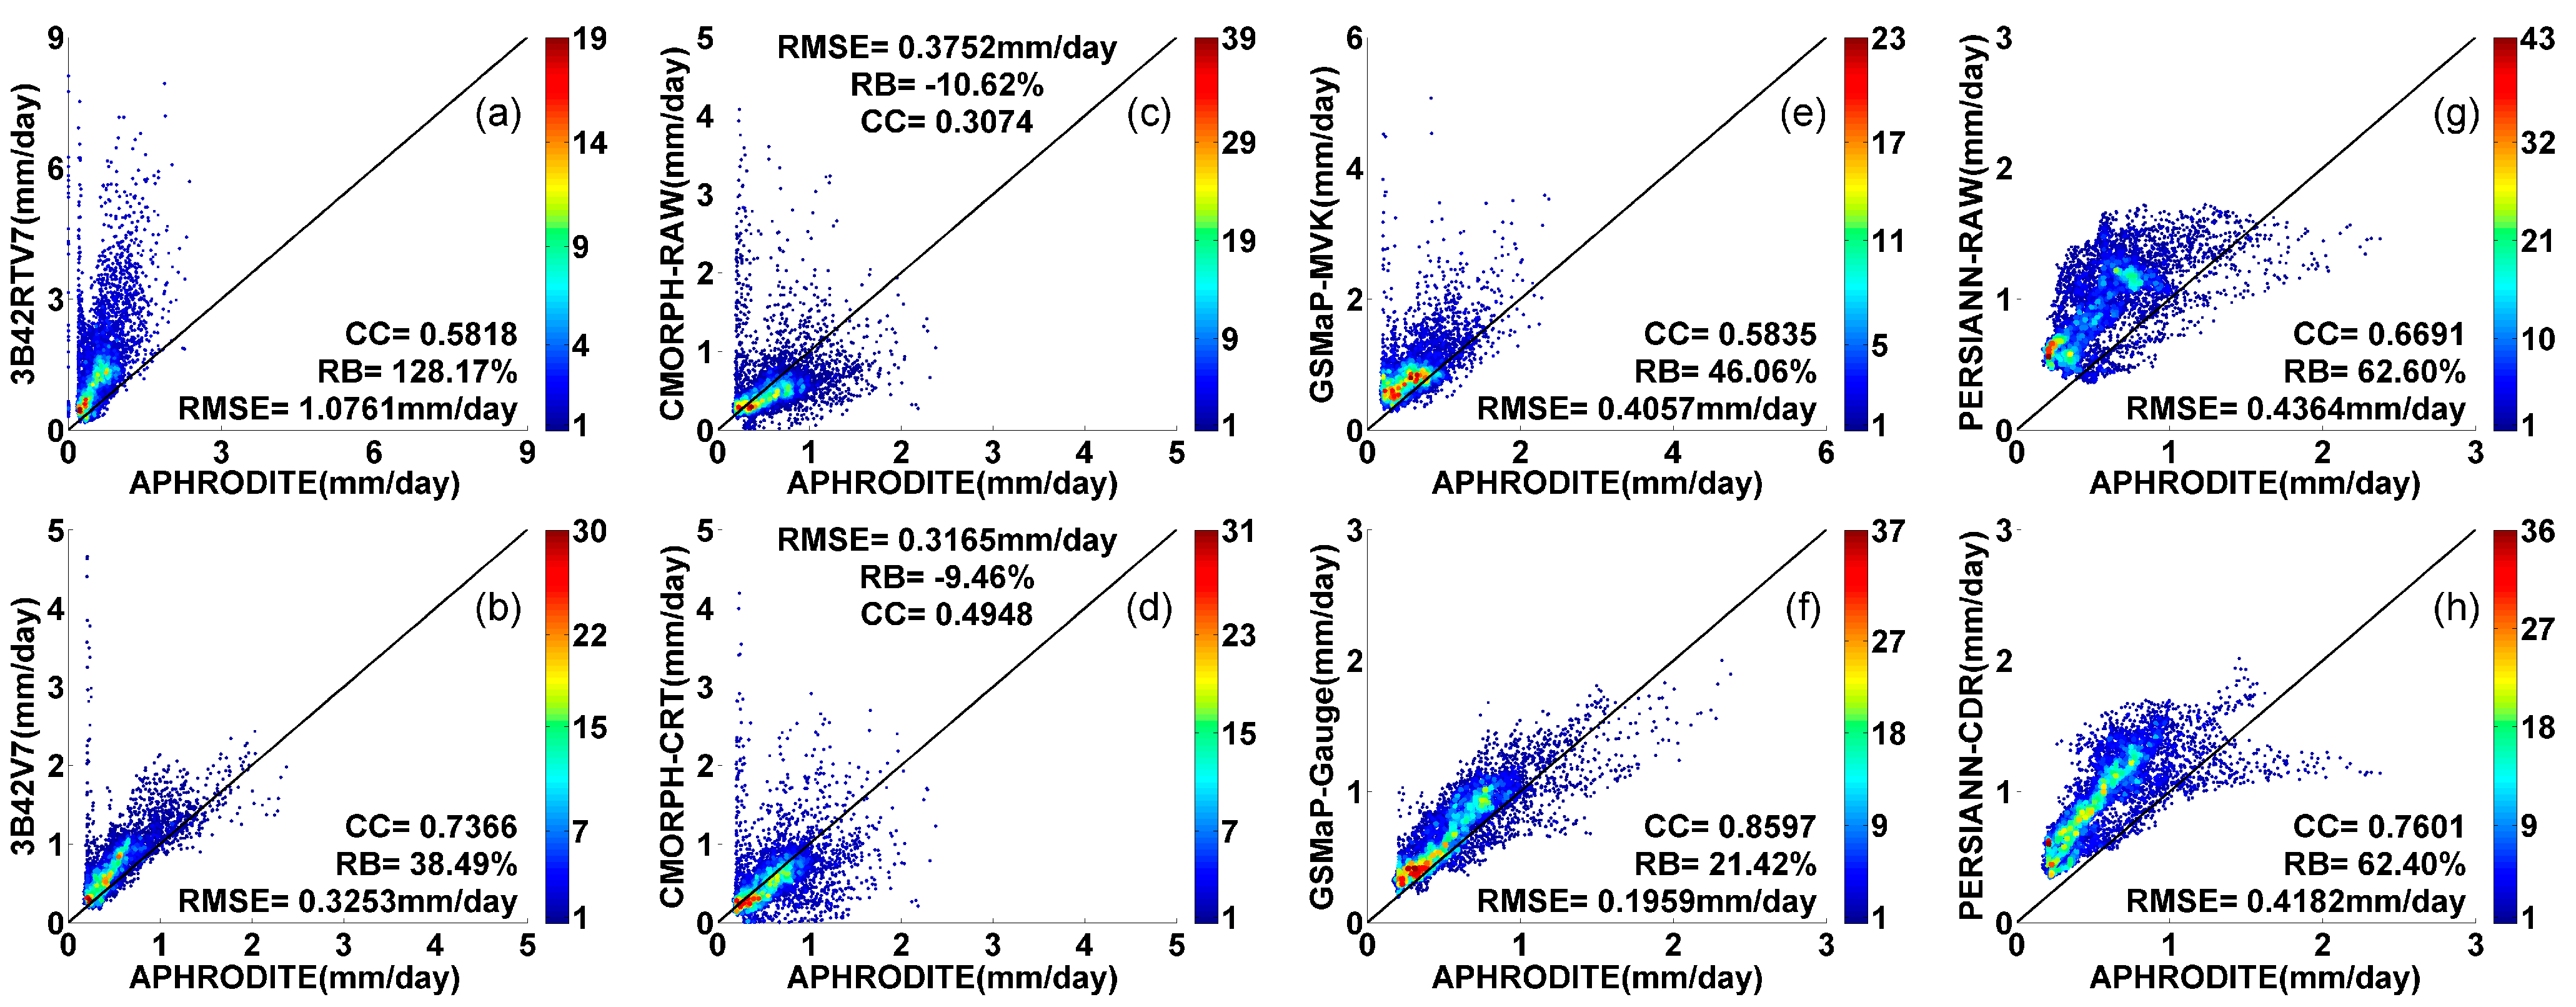
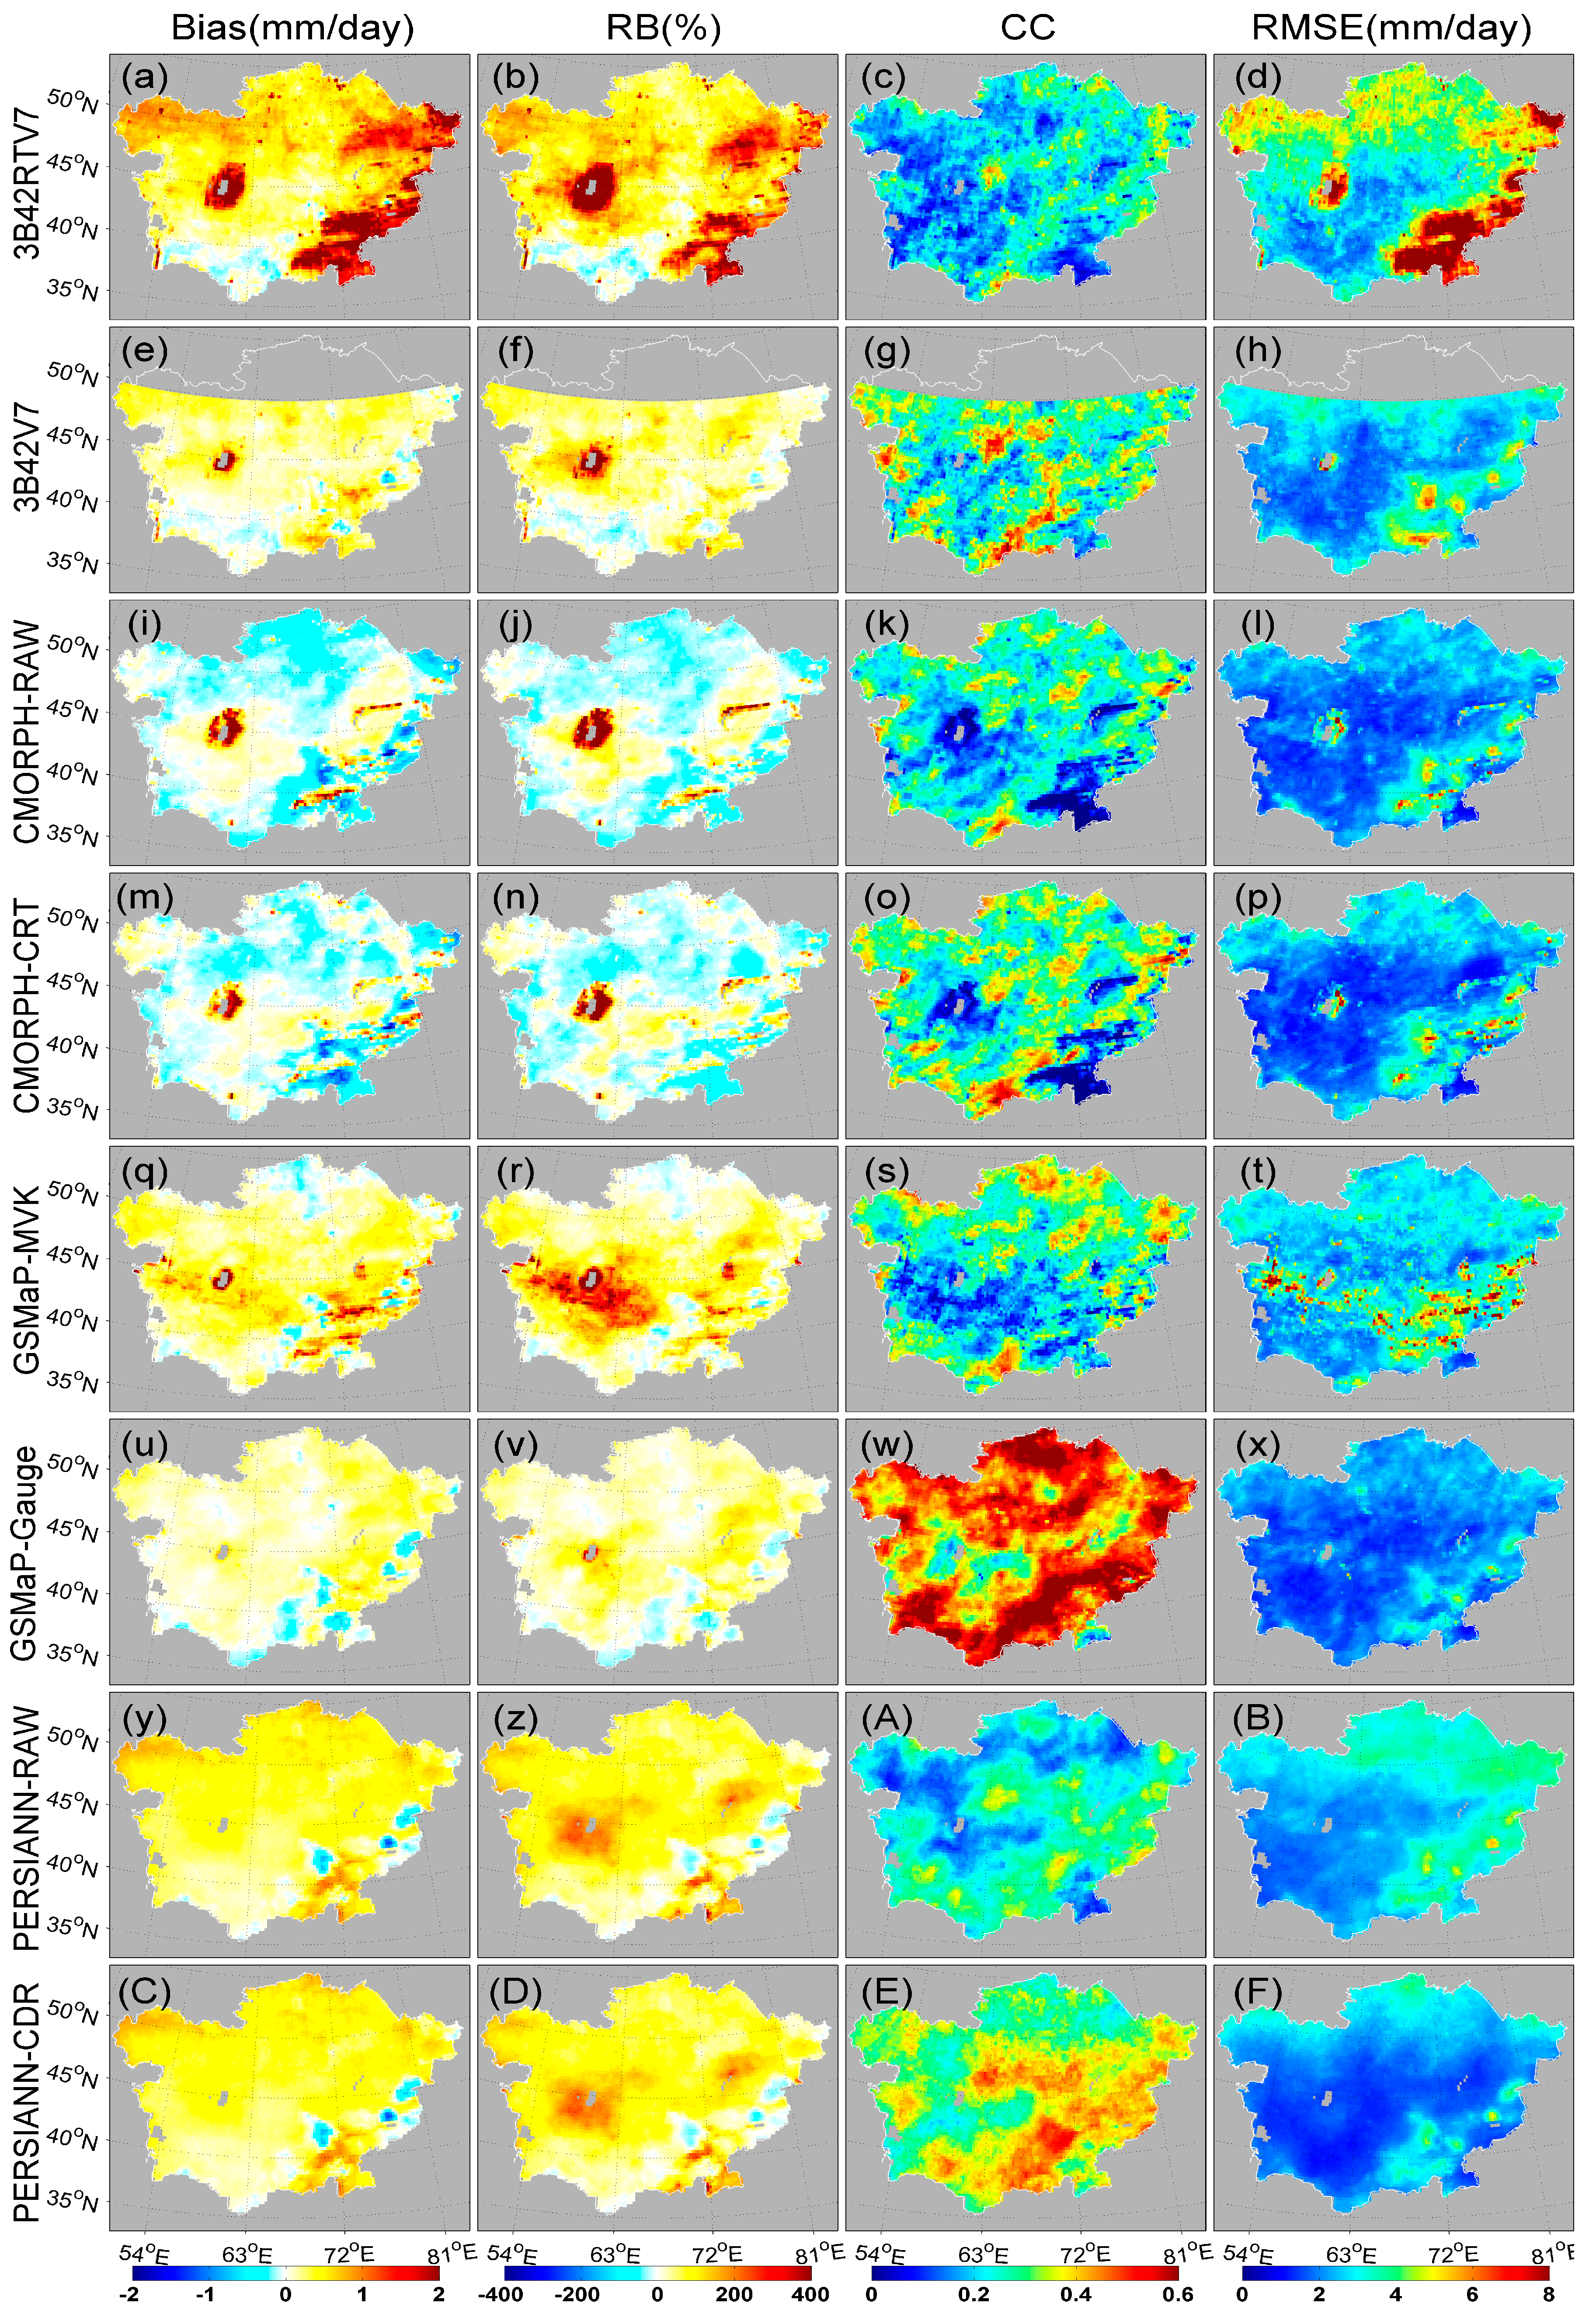
Overall, the bias-correction procedures successfully decrease error of four groups of satellite-based precipitation products. The effectiveness of improvement varies for different bias-correction algorithms during 2004–2006 over Central Asia. The gauge-correction procedures in TMPA and GSMaP perform better with the reduction of RBs (from 128.17% to 38.49% and from 46.06% to 21.42%, respectively), RMSEs (from 1.08 to 0.33 mm/day and from 0.41 to 0.20 mm/day, respectively) and a dramatic increase in CCs (from 0.58 to 0.74 and from 0.58 to 0.86, respectively). On the other side, the bias correction could not bring significant change for CMORPH and PERSIANN products (for RBs from –10.62% to –9.46% and from 62.60% to 62.40%, respectively), and for RMSEs from 0.38 to 0.32 mm/day and from 0.44 to 0.42 mm/day, respectively. However, the improvement in CC shows from 0.31 to 0.49 and 0.67 to 0.76, respectively. The gauge-correction procedure in GSMaP exhibits best performance in improving CC and reducing various errors, such as regional errors, near-big-lake overestimation, mountainous error, season-dependent error.
(2)
Qualitatively, all the satellite-based QPE products present overestimation or underestimation over southeastern Central Asia with high altitude, although these mountainous errors are largely reduced by different bias-correction techniques. Furthermore, all the PMW-based satellite-based precipitation products (i.e., 3B42RTV7 and 3B42V7, CMORPH_RAW and CMORPH_CRT, GSMaP_MVK and GSMaP_Gauge) overestimate much precipitation over the near-big-lake areas (e.g. Arial Sea and surrounding regions), while the IR-based PERSIANN products avoid this overestimation problem caused by large water bodies. This result provides additional support for the hypothesis of Tian et al. [89] that the PMW algorithms over land are affected by the small inland water bodies. In addition, these kinds of problems also existed in large inland water bodies. Therefore, satellite-based precipitation algorithms need to be improved further by developing screening strategies to discriminate land pixels and with false rainfall signatures (water bodies, snow or ice surface and complicated mountains) for the accurate estimation of precipitation over regions near large water bodies, areas covered by ice or snow and mountainous areas.
(3)
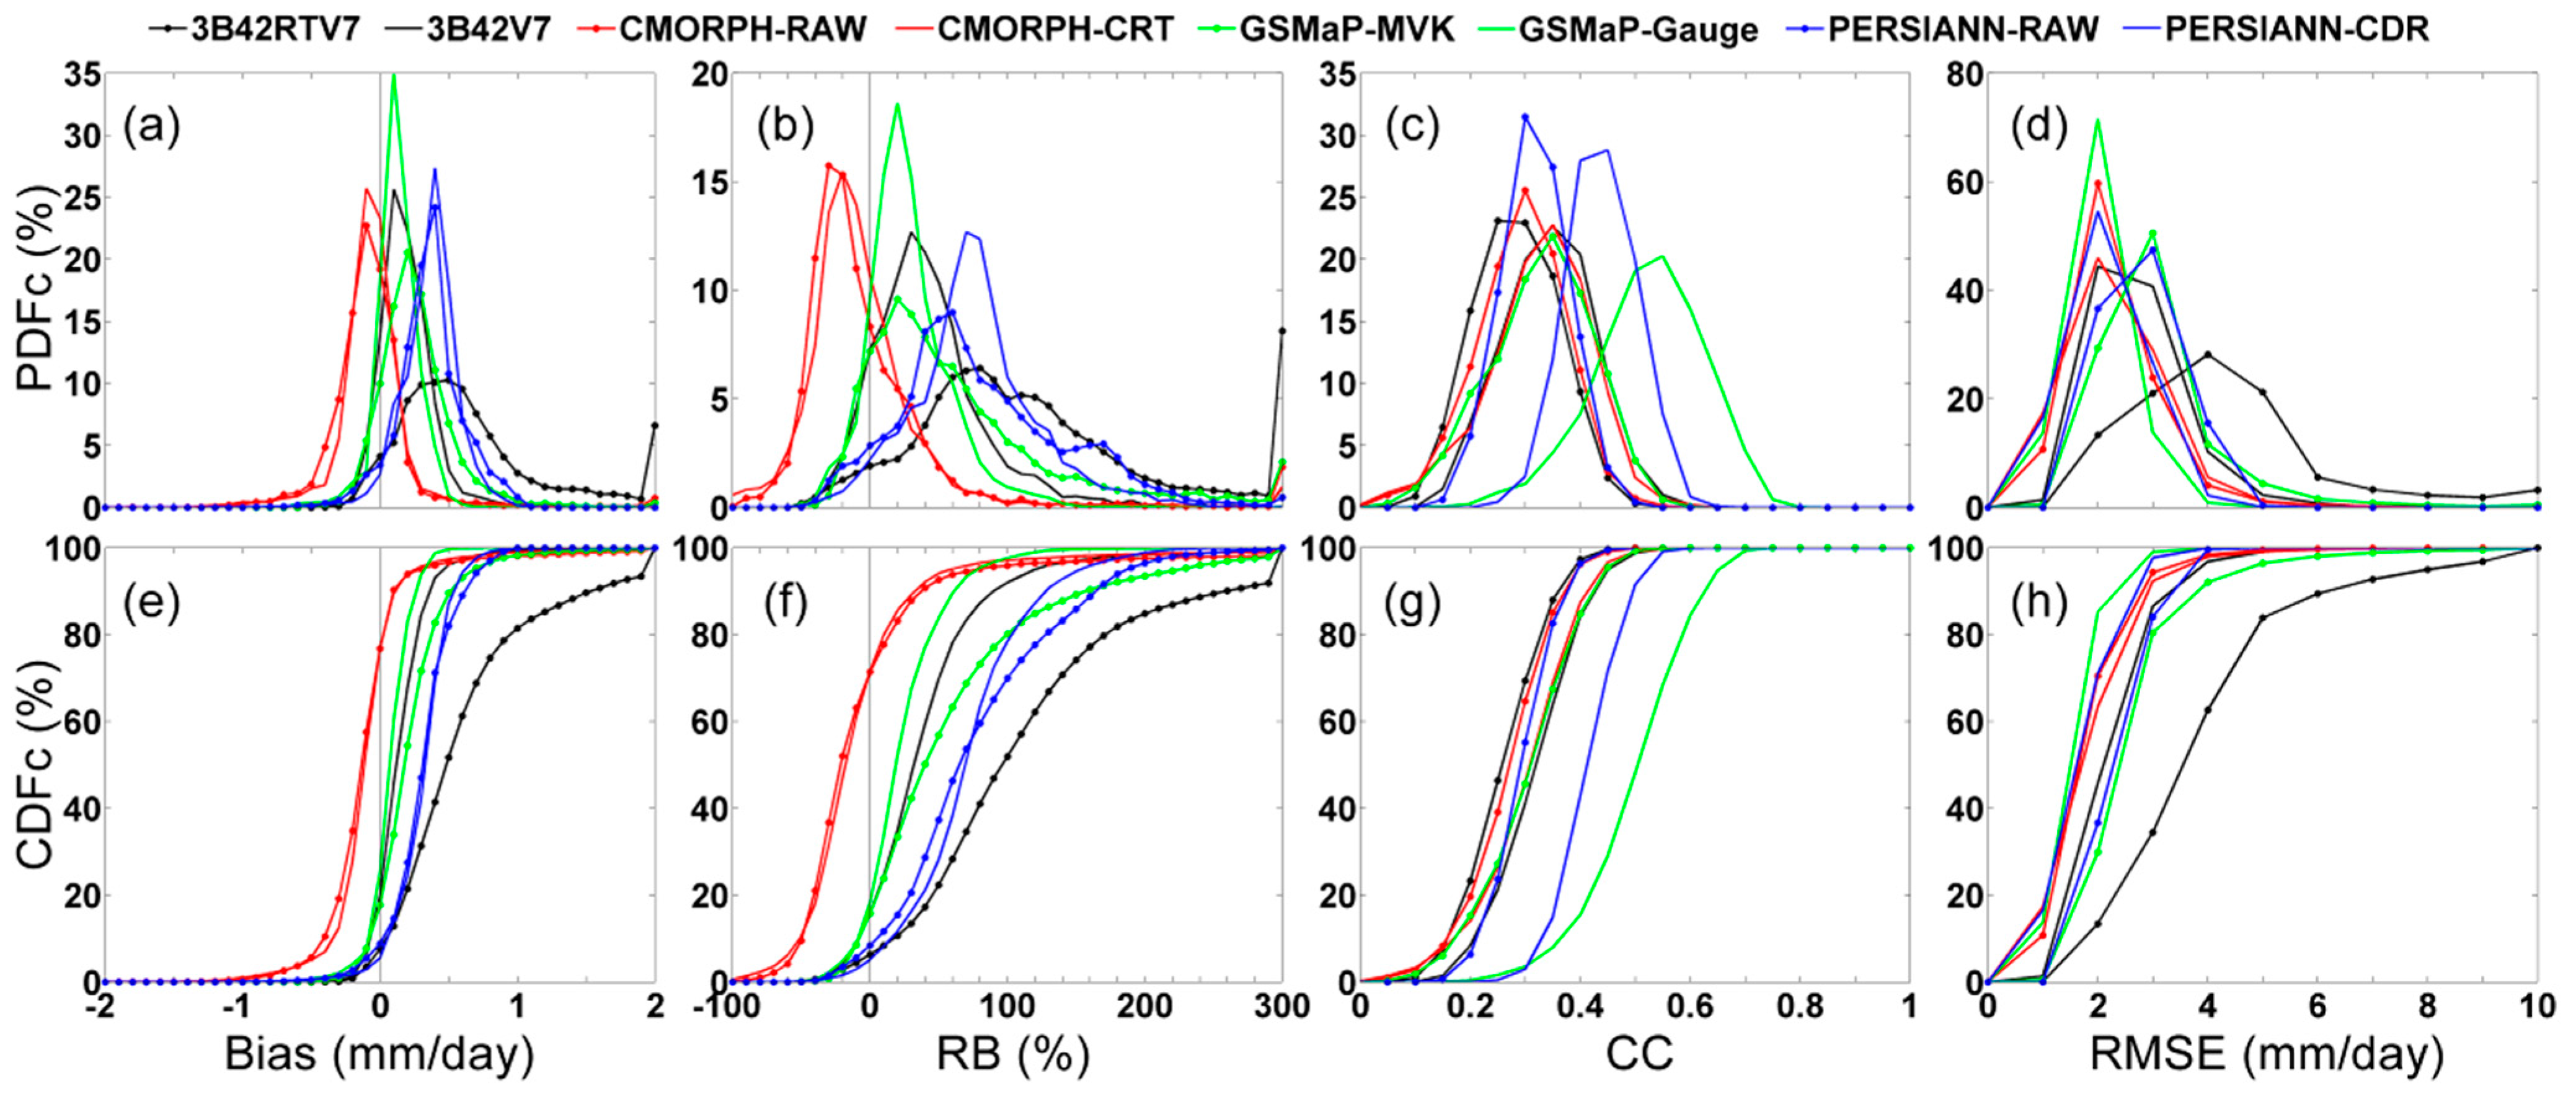
For the three-year daily mean precipitation, all the eight satellite products are capable of capturing the overall spatial pattern of precipitation (Figure 2 and Figure 3). Among the four satellite-only QPE products, 3B42RTV7 demonstrates the poorest performance with the largest magnitude of RB (128.17%) and RMSE (1.08 mm/day). PERSIANN_RAW exhibits the highest CC (0.67), but relatively high RB and RMSE (62.60% and 0.44 mm/day, respectively). In the comparison of bias-corrected satellite products, GSMaP_Gauge represents the highest CC (0.86) and smallest RMSE (0.20 mm/day), as well as low RB (21.42%) over Central Asia compared to other bias-corrected products.
(4)
Seasonally, both gauge-corrected and the original satellite QPE products give best (worst) performance with the highest (lowest) CC, but relatively high RB and RMSE in summer (winter) as shown in Figure 4 and Figure 5. The RMSEs of satellite-only products remains more than 0.66 mm/day and CC less than 0.28 in winter. 3B42RTV7 shows significant overestimation with RB more than 108.81% and RMSE more than 0.89 mm/day, although these conditions are much improved with RB less than 46.64% and RMSE less than 0.50 mm/day in 3B42V7.
(5)
Gauge-calibrated products give quite different performance in the monthly series of behavior due to different bias-correction algorithms (Figure 6). 3B42V7 displays a consistent slight Bias and RMSE but relatively reversed season-dependent CC fluctuated from ~0.3 in cold seasons to ~0.85 in warm seasons. Bias-correction technique in CMORPH_CRT cannot perform well over semi-arid and arid areas in improving CC, removing bias and decreasing season-dependent variability. GSMaP_Gauge exhibits the best correlation against APHRODITE with high and stable CC over ~0.7 but cannot reduce Bias and RMSE significantly. PERSIANN_CDR gives an overestimation consistently with a CC (>0.55) and small RMSE (<0.8) over Central Asia during 2004–2006.
(6)
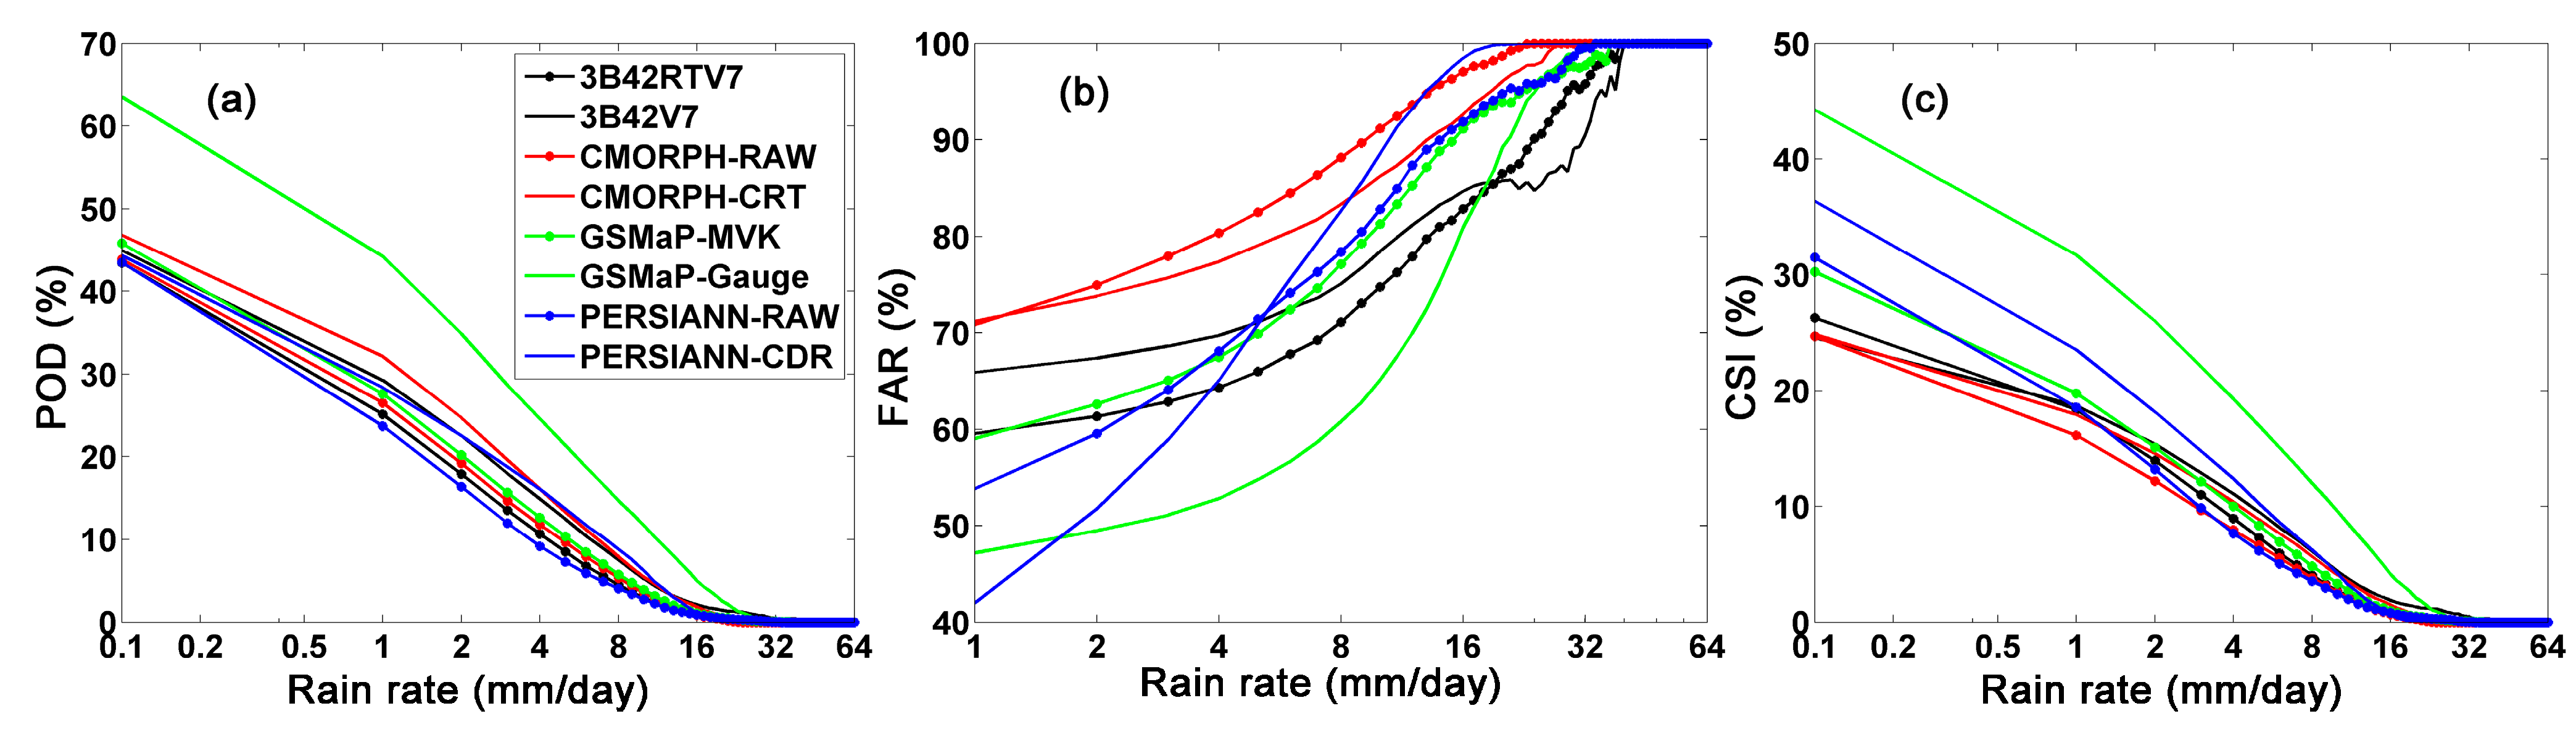
All the satellite original precipitation products, as well as bias-corrected 3B42V7 and CMORPH_CRT, tend to detect much more non-rain events than the ground measurements, while GSMaP_Gauge and PERSIANN_CDR display similar non-rain events, with under-detection of about 1% and 2%, respectively. 3B42RTV7 and CMORPH over-detect non-rain occurrence with values more than 75% while their corresponding bias-corrected counterparts (3B42V7 and CMORPH_CRT) detect even more occurrence of no rain. GSMaP_Gauge gives the closest percentage of non-rain with APHRODITE. All products detect less precipitating days than the reference dataset at the light rain range (0–1 mm/day) and detect moderate precipitation events over 2 mm/day. GSMaP_Gauge (PERSIANN_CDR) demonstrates the closest PDF with APHRODITE in the range of 0 to 10 mm/day (more than 10 mm/day). It is noted that all QPE products except GSMaP_Gauge show similar low POD and CSI pattern, and GSMaP_Gauge outperforms other products with higher POD and CSI. PERSIANN_CDR, GSMaP_Gauge and 3B42V7 show the lowest FAR percent during 0.1–2 mm/day, 2–18 mm/day, and 18–40 mm/day, respectively.
The identification and quantification of the performances of 3B42RTV7 and 3B42V7, CMORPH_RAW and CMORPH_CRT, GSMaP_MVK and GSMaP_Gauge, PERSIANN_RAW and PERSIANN_CDR over Central Asia in this study should provide useful information for various hydrological applications and satellite-based algorithm improvements. Specifically, this study also provides the end users with an insight into QPE product uncertainty and helps them to select the proper QPE products for particular applications and study domain. This study shows that all four satellite-only QPE products could benefit from gauge-based bias-correction, but the efficiency differs in various correction algorithms. Specifically, the performances of various QPEs over the near-big-lake and mountainous regions need to be evaluated quantitatively in future work for the development of different satellite-based algorithms. Fundamentally, more efforts should be devoted to reducing the errors in the input data with better calibration and algorithm improvement. The retrievals offered by Global Precipitation Measurement (GPM) mission may improve accuracy of input data for precipitation evaluation with higher spatial and temporal resolution and coverage.

Acknowledgments

The authors acknowledge the many providers of operational satellite precipitation products for their data available to us. Comments and suggestions from anonymous reviewers are acknowledged. This study was supported by Natural Science Foundation of China under Grant No. 41371419; Special program for International Science & Technology Cooperation under Grant No. 2010DFA92720-04.

Author Contributions

Sheng Chen designed the framework of this study, and Hao Guo conducted the data processing. Sheng Chen, Anming Bao, Junjun Hu, Abebe S. Gebregiorgis, Xianwu Xue, Xinhua Zhang and Guo Hao contributed together to the writing of this manuscript.

Conflicts of Interest

The authors declare no conflict of interest.

References

  1. Karaseva, M.; Prakash, S.; Gairola, R.M. Validation of high-resolution TRMM-3B43 precipitation product using rain gauge measurements over Kyrgyzstan. Theor. Appl. Climatol. 2012, 108, 147–157. [Google Scholar] [CrossRef]
  2. Habib, E.; Haile, A.T.; Tian, Y.; Joyce, R.J. Evaluation of the high-resolution cmorph satellite rainfall product using dense rain gauge observations and radar-based estimates. J. Hydrometeorol. 2012, 13, 1784–1798. [Google Scholar] [CrossRef]
  3. Hong, Y.; Adler, R.; Huffman, G. Evaluation of the potential of NASA multi-satellite precipitation analysis in global landslide hazard assessment. Geophys. Res. Lett. 2006, 33, L22402. [Google Scholar] [CrossRef]
  4. Aragão, L.E.O.C.; Malhi, Y.; Roman-Cuesta, R.M.; Saatchi, S.; Anderson, L.O.; Shimabukuro, Y.E. Spatial patterns and fire response of recent Amazonian droughts. Geophys. Res. Lett. 2007, 34, L07701. [Google Scholar] [CrossRef]
  5. Wu, H.; Adler, R.F.; Hong, Y.; Tian, Y.; Policelli, F. Evaluation of global flood detection using satellite-based rainfall and a hydrologic model. J. Hydrometeorol. 2012, 13, 1268–1284. [Google Scholar] [CrossRef]
  6. Xie, P.; Arkin, P.A. An intercomparison of gauge observations and satellite estimates of monthly precipitation. J. Appl. Meteorol. 1995, 34, 1143–1160. [Google Scholar] [CrossRef]
  7. Xie, P.; Arkin, P.A. Analyses of global monthly precipitation using gauge observations, satellite estimates, and numerical model predictions. J. Clim. 1996, 9, 840–858. [Google Scholar] [CrossRef]
  8. Anagnostou, E.N.; Maggioni, V.; Nikolopoulos, E.I.; Meskele, T.; Hossain, F.; Papadopoulos, A. Benchmarking high-resolution global satellite rainfall products to radar and rain-gauge rainfall estimates. IEEE Trans. Geosci. Remote Sens. 2010, 48, 1667–1683. [Google Scholar] [CrossRef]
  9. Ciach, G.J.; Krajewski, W.F.; Villarini, G. Product-error-driven uncertainty model for probabilistic quantitative precipitation estimation with NEXRAD data. J. Hydrometeorol. 2007, 8, 1325–1347. [Google Scholar] [CrossRef]
  10. Germann, U.; Galli, G.; Boscacci, M.; Bolliger, M. Radar precipitation measurement in a mountainous region. Q. J. R. Meteorol. Soc. 2006, 132, 1669–1692. [Google Scholar] [CrossRef]
  11. Piccolo, F.; Chirico, G.B. Sampling errors in rainfall measurements by weather radar. Adv. Geosci. 2005, 2, 151–155. [Google Scholar] [CrossRef]
  12. Anagnostou, E. Overview of overland satellite rainfall estimation for hydro-meteorological applications. Surv. Geophys. 2004, 25, 511–537. [Google Scholar] [CrossRef]
  13. Sharif, H.O.; Ogden, F.L.; Krajewski, W.F.; Xue, M. Numerical simulations of radar rainfall error propagation. Water Resour. Res. 2002, 38. [Google Scholar] [CrossRef]
  14. Chen, S.; Gourley, J.J.; Hong, Y.; Kirstetter, P.E.; Zhang, J.; Howard, K.; Flamig, Z.L.; Hu, J.; Qi, Y. Evaluation and uncertainty estimation of NOAA/NSSL next-generation national mosaic quantitative precipitation estimation product (Q2) over the continental United States. J. Hydrometeorol. 2013, 14, 1308–1322. [Google Scholar] [CrossRef]
  15. Chen, S.; Hong, Y.; Cao, Q. Inter-comparison of precipitation estimates from WSR-88D radar and TRMM measurement over continental United States. IEEE Trans. Geosci. Remote Sens. 2015, 53, 4444–4456. [Google Scholar]
  16. Chen, S.; Hong, Y.; Cao, Q.; Kirstetter, P.-E.; Gourley, J.J.; Qi, Y.; Zhang, J.; Howard, K.; Hu, J.; Wang, J. Performance evaluation of radar and satellite rainfalls for typhoon Morakot over Taiwan: Are remote-sensing products ready for gauge denial scenario of extreme events? J. Hydrol. 2013, 506, 4–13. [Google Scholar] [CrossRef]
  17. Joyce, R.J.; Janowiak, J.E.; Arkin, P.A.; Xie, P. Cmorph: A method that produces global precipitation estimates from passive microwave and infrared data at high spatial and temporal resolution. J. Hydrometeorol. 2004, 5, 487–503. [Google Scholar] [CrossRef]
  18. Sorooshian, S.; Hsu, K.-L.; Gao, X.; Gupta, H.V.; Imam, B.; Braithwaite, D. Evaluation of PERSIANN system satellite-based estimates of tropical rainfall. Bull. Am. Meteorol. Soc. 2000, 81, 2035–2046. [Google Scholar] [CrossRef]
  19. Hsu, K.-L.; Gao, X.; Sorooshian, S.; Gupta, H.V. Precipitation estimation from remotely sensed information using artificial neural networks. J. Appl. Meteorol. 1997, 36, 1176–1190. [Google Scholar] [CrossRef]
  20. Hong, Y.; Hsu, K.-L.; Sorooshian, S.; Gao, X. Precipitation estimation from remotely sensed imagery using an artificial neural network cloud classification system. J. Appl. Meteorol. 2004, 43, 1834–1853. [Google Scholar] [CrossRef]
  21. Turk, F.J.; Arkin, P.; Sapiano, M.R.P.; Ebert, E.E. Evaluating high-resolution precipitation products. Bull. Am. Meteorol. Soc. 2008, 89, 1911–1916. [Google Scholar] [CrossRef]
  22. Okamoto, K.; Ushio, T.; Iguchi, T.; Takahashi, N.; Iwanami, K. The global satellite mapping of precipitation (GSMaP) project. In Proceedings of 2005 IEEE International Geoscience and Remote Sensing Symposium (IGARSS 2005), Seoul, Korea, 25–29 July 2005; pp. 3414–3416.
  23. Kubota, T.; Shige, S.; Hashizurne, H.; Aonashi, K.; Takahashi, N.; Seto, S.; Hirose, M.; Takayabu, Y.N.; Ushio, T.; Nakagawa, K.; et al. Global precipitation map using satellite-borne microwave radiometers by the GSMaP project: Production and validation. IEEE Trans. Geosci. Remote Sens. 2007, 45, 2259–2275. [Google Scholar] [CrossRef]
  24. Huffman, G.J.; Adler, R.F.; Bolvin, D.T.; Gu, G.J.; Nelkin, E.J.; Bowman, K.P.; Hong, Y.; Stocker, E.F.; Wolff, D.B. The TRMM multisatellite precipitation analysis (TMPA): Quasi-global, multiyear, combined-sensor precipitation estimates at fine scales. J. Hydrometeorol. 2007, 8, 38–55. [Google Scholar] [CrossRef]
  25. Xie, P.; Yoo, S.-H.; Joyce, R.; Yarosh, Y. Bias-corrected CMORPH: A 13-year analysis of high-resolution global precipitation. Availeble online: http://ftp.cpc.ncep.noaa.gov/precip/CMORPH_V1.0/REF/EGU_11462 (accessed on 11 December 2014).
  26. Ashouri, H.; Hsu, K.-L.; Sorooshian, S.; Braithwaite, D.K.; Knapp, K.R.; Cecil, L.D.; Nelson, B.R.; Prat, O.P. PERSIANN-CDR: Daily precipitation climate data record from multi-satellite observations for hydrological and climate studies. Bull. Am. Meteorol. Soc. 2014, 96, 69–83. [Google Scholar] [CrossRef]
  27. Mega, T.; Ushio, T.; Kubota, T.; Kachi, M.; Aonashi, K.; Shige, S. Gauge adjusted global satellite mapping of precipitation (GSMaP_Gauge). In Proceedings of 2014 XXXIth URSI General Assembly and Scientific Symposium (URSI GASS), Beijing, China, 16–23 August 2014; pp. 1–4.
  28. Aonashi, K.; Shibata, A.; Liu, G. An over-ocean precipitation retrieval using SSM/I multichannel brightness temperatures. J. Meteorol. Soc. Jpn. 1996, 74, 617–637. [Google Scholar]
  29. Shrestha, M.S.; Artan, G.A.; Bajracharya, S.R.; Gautam, D.K.; Tokar, S.A. Bias-adjusted satellite-based rainfall estimates for predicting floods: Narayani basin. J. Flood Risk Manag. 2011, 4, 360–373. [Google Scholar] [CrossRef]
  30. Bitew, M.M.; Gebremichael, M. Assessment of satellite rainfall products for streamflow simulation in medium watersheds of the Ethiopian highlands. Hydrol. Earth Syst. Sci. 2011, 15, 1147–1155. [Google Scholar] [CrossRef]
  31. Nikolopoulos, E.; Anagnostou, E.; Hossain, F. Error propagation of satellite-rainfall in flood prediction applications over complex terrain: A case study in northeastern Italy. In Satellite rainfall Applications for Surface Hydrology; Gebremichael, M., Hossain, F., Eds.; Springer: Dordrecht, The Nederlands, 2010; pp. 215–227. [Google Scholar]
  32. Xue, X.; Hong, Y.; Limaye, A.S.; Gourley, J.J.; Huffman, G.J.; Khan, S.I.; Dorji, C.; Chen, S. Statistical and hydrological evaluation of TRMM-based multi-satellite precipitation analysis over the Wangchu basin of Bhutan: Are the latest satellite precipitation products 3B42V7 ready for use in ungauged basins? J. Hydrol. 2013, 499, 91–99. [Google Scholar] [CrossRef]
  33. Chen, S.; Liu, H.; You, Y.; Mullens, E.; Hu, J.; Yuan, Y.; Huang, M.; He, L.; Luo, Y.; Zeng, X.; et al. Evaluation of high-resolution precipitation estimates from satellites during July 2012 Beijing flood event using dense rain gauge observations. PLoS ONE 2014, 9, e89681. [Google Scholar] [CrossRef] [PubMed]
  34. Yong, B.; Chen, B.; Gourley, J.J.; Ren, L.; Hong, Y.; Chen, X.; Wang, W.; Chen, S.; Gong, L. Intercomparison of the version-6 and version-7 TMPA precipitation products over high and low latitudes basins with independent gauge networks: Is the newer version better in both real-time and post-real-time analysis for water resources and hydrologic extremes? J. Hydrol. 2014, 508, 77–87. [Google Scholar]
  35. Stisen, S.; Sandholt, I. Evaluation of remote-sensing-based rainfall products through predictive capability in hydrological runoff modelling. Hydrol. Process. 2010, 24, 879–891. [Google Scholar] [CrossRef]
  36. Hong, Y.; Hsu, K.-L.; Moradkhani, H.; Sorooshian, S. Uncertainty quantification of satellite precipitation estimation and Monte Carlo assessment of the error propagation into hydrologic response. Water Resour. Res. 2006, 42, W08421. [Google Scholar] [CrossRef]
  37. Sorooshian, S.; AghaKouchak, A.; Arkin, P.; Eylander, J.; Foufoula-Georgiou, E.; Harmon, R.; Hendrickx, J.M.H.; Imam, B.; Kuligowski, R.; Skahill, B.; et al. Advanced concepts on remote sensing of precipitation at multiple scales. Bull. Am. Meteorol. Soc. 2011, 92, 1353–1357. [Google Scholar] [CrossRef]
  38. AghaKouchak, A.; Mehran, A.; Norouzi, H.; Behrangi, A. Systematic and random error components in satellite precipitation data sets. Geophys. Res. Lett. 2012, 39, L09406. [Google Scholar] [CrossRef]
  39. Tian, Y.; Peters-Lidard, C.D.; Eylander, J.B.; Joyce, R.J.; Huffman, G.J.; Adler, R.F.; Hsu, K.-L.; Turk, F.J.; Garcia, M.; Zeng, J. Component analysis of errors in satellite-based precipitation estimates. J. Geophys. Res.: Atmos. 2009, 114, D24101. [Google Scholar] [CrossRef]
  40. Mehran, A.; AghaKouchak, A. Capabilities of satellite precipitation datasets to estimate heavy precipitation rates at different temporal accumulations. Hydrol. Process. 2014, 28, 2262–2270. [Google Scholar] [CrossRef]
  41. Ebert, E.E.; Janowiak, J.E.; Kidd, C. Comparison of near-real-time precipitation estimates from satellite observations and numerical models. Bull. Am. Meteorol. Soc. 2007, 88, 47–64. [Google Scholar] [CrossRef]
  42. Hirpa, F.A.; Gebremichael, M.; Hopson, T. Evaluation of high-resolution satellite precipitation products over very complex terrain in Ethiopia. J. Appl. Meteorol. Climatol. 2010, 49, 1044–1051. [Google Scholar] [CrossRef]
  43. Jiang, S.; Ren, L.; Hong, Y.; Yong, B.; Yang, X.; Yuan, F.; Ma, M. Comprehensive evaluation of multi-satellite precipitation products with a dense rain gauge network and optimally merging their simulated hydrological flows using the Bayesian model averaging method. J. Hydrol. 2012, 452–453, 213–225. [Google Scholar] [CrossRef]
  44. Dinku, T.; Ruiz, F.; Connor, S.J.; Ceccato, P. Validation and intercomparison of satellite rainfall estimates over Colombia. J. Appl. Meteorol. Climatol. 2009, 49, 1004–1014. [Google Scholar] [CrossRef]
  45. Gebregiorgis, A.S.; Hossain, F. Understanding the dependency of satellite rainfall uncertainty on topography and climate for hydrologic model simulation. IEEE Trans. Geosci. Remote Sens. 2011, 51, 704–718. [Google Scholar] [CrossRef]
  46. Sapiano, M.R.P.; Arkin, P.A. An intercomparison and validation of high-resolution satellite precipitation estimates with 3-hourly gauge data. J. Hydrometeorol. 2009, 10, 149–166. [Google Scholar] [CrossRef]
  47. Wei, C.-C.; Roan, J. Retrievals for the rainfall rate over land using special sensor microwave imager data during tropical cyclones: Comparisons of scattering index, regression, and support vector regression. J. Hydrometeorol. 2012, 13, 1567–1578. [Google Scholar] [CrossRef]
  48. Bitew, M.M.; Gebremichael, M. Evaluation through independent measurements: Complex terrain and humid tropical region in Ethiopia. In Satellite Rainfall Applications for Surface Hydrology; Springer Netherlands: Berlin, Germany, 2010; pp. 205–214. [Google Scholar]
  49. Romilly, T.G.; Gebremichael, M. Evaluation of satellite rainfall estimates over Ethiopian river basins. Hydrol. Earth Syst. Sci. 2011, 15, 1505–1514. [Google Scholar] [CrossRef]
  50. Hsu, K.-L.; Sorooshian, S. Satellite-based precipitation measurement using Persiann system. In Hydrological Modelling and the Water Cycle; Sorooshian, S., Hsu, K.-L., Coppola, E., Tomassetti, B., Verdecchia, M., Visconti, G., Eds.; Springer: Berlin/Heidelberg, Germany, 2008; Volume 63, pp. 27–48. [Google Scholar]
  51. Yamamoto, K.M.; Ueno, K.; Nakamura, K. Comparison of satellite precipitation products with rain gauge data for the Khumb region, Nepal Himalayas. J. Meteorol. Soc. Jan. Ser. II 2011, 89, 597–610. [Google Scholar] [CrossRef]
  52. Kubota, T.; Ushio, T.; Shige, S.; Kida, S.; Kachi, M.; Okamoto, K.I. Verification of high-resolution satellite-based rainfall estimates around Japan using a gauge-calibrated ground-radar dataset. J. Meteorol. Soc. Jan. Ser. II 2009, 87A, 203–222. [Google Scholar] [CrossRef]
  53. Ngo-Duc, T.; Matsumoto, J.; Kamimera, H.; Bui, H.-H. Monthly adjustment of global satellite mapping of precipitation (GSMaP) data over the VuGia-ThuBon river basin in central Vietnam using an artificial neural network. Hydrol. Res. Lett. 2013, 7, 85–90. [Google Scholar] [CrossRef]
  54. Shrestha, M.; Takara, K.; Kubota, T.; Bajracharya, S. Verification of GSMaP rainfall estimates over the central Himalayas. J. Jan. Soc. Civil Eng., Ser. B1 (Hydraul. Eng.) 2011, 67. [Google Scholar] [CrossRef]
  55. Taniguchi, A.; Shige, S.; Yamamoto, M.K.; Mega, T.; Kida, S.; Kubota, T.; Kachi, M.; Ushio, T.; Aonashi, K. Improvement of high-resolution satellite rainfall product for typhoon Morakot (2009) over Taiwan. J. Hydrometeorol. 2013, 14, 1859–1871. [Google Scholar] [CrossRef]
  56. Tian, Y.D.; Peters-Lidard, C.D.; Adler, R.F.; Kubota, T.; Ushio, T. Evaluation of GSMaP precipitation estimates over the contiguous united states. J. Hydrometeorol. 2010, 11, 566–574. [Google Scholar] [CrossRef]
  57. Ushio, T.; Sasashige, K.; Kubota, T.; Shige, S.; Okamoto, K.I.; Aonashi, K.; Inoue, T.; Takahashi, N.; Iguchi, T.; Kachi, M.; et al. A kalman filter approach to the global satellite mapping of precipitation (GSMaP) from combined passive microwave and infrared radiometric data. J. Meteorol. Soc. Jan. Ser. II 2009, 87, 137–151. [Google Scholar] [CrossRef]
  58. Veerakachen, W.; Raksapatcharawong, M.; Seto, S. Performance evaluation of global satellite mapping of precipitation (GSMaP) products over the Chaophraya river basin, Thailand. Hydrol. Res. Lett. 2014, 8, 39–44. [Google Scholar] [CrossRef]
  59. Baopu, F. The effects of orography on precipitation. Bound-Lay Meteorol. 1995, 75, 189–205. [Google Scholar] [CrossRef]
  60. Gebregiorgis, A.S.; Hossain, F. How well can we estimate error variance of satellite precipitation data across the world? . Atmos. Res. 2015, 154, 39–59. [Google Scholar] [CrossRef]
  61. Mughal, M.A.Z. Pamir alpine desert and tundra. In Biomes and Ecosystems; Warren Howarth, R., Ed.; Salem Press: Ipswich, MA, USA, 2013; Volume 3, pp. 978–980. [Google Scholar]
  62. Schiemann, R.; Lüthi, D.; Vidale, P.L.; Schär, C. The precipitation climate of central Asia—Intercomparison of observational and numerical data sources in a remote semiarid region. Int. J. Climatol. 2008, 28, 295–314. [Google Scholar] [CrossRef]
  63. Shepard, D. A two-dimensional interpolation function for irregularly-spaced data. In Proceedings of the 1968 23rd ACM National Conference; ACM: New York, NY, USA, 1968; pp. 517–524. [Google Scholar]
  64. Willmott, C.J.; Matsuura, K. Smart interpolation of annually averaged air temperature in the United States. J. Appl. Meteorol. 1995, 34, 2577–2586. [Google Scholar] [CrossRef]
  65. Schaake, J.; Henkel, A.; Cong, S. Application of PRISM climatologies for hydrologic modeling and forecasting in the western U.S. In Proceedings of 18th Conference on Hydrology, Seattle, WA, USA, 15 January 2004.
  66. Rajeevan, M.; Bhate, J. A high resolution daily gridded rainfall dataset (1971–2005) for mesoscale meteorological studies. Curr. Sci. India 2009, 96, 558–562. [Google Scholar]
  67. Yatagai, A.; Xie, P. Utilization of a rain-gauge-based daily precipitation dataset over Asia for validation of precipitation derived from TRMM/PR and JRA-25. Proc. SPIE 2006. [Google Scholar] [CrossRef]
  68. Yatagai, A.; Arakawa, O.; Kamiguchi, K.; Kawamoto, H.; Nodzu, M.I.; Hamada, A. A 44-year daily gridded precipitation dataset for Asia based on a dense network of rain gauges. Sola 2009, 5, 137–140. [Google Scholar] [CrossRef]
  69. Yatagai, A.; Xie, P.; Kitoh, A. Utilization of a new gauge-based daily precipitation dataset over monsoon Asia for validation of the daily precipitation climatology simulated by the MRI/JMA 20-km-mesh AGCM. Sola 2005, 1, 193–196. [Google Scholar] [CrossRef]
  70. Andermann, C.; Bonnet, S.; Gloaguen, R. Evaluation of precipitation data sets along the Himalayan front. Geochem. Geophys. Geosyst. 2011, 12, Q07023. [Google Scholar] [CrossRef]
  71. Shrivastava, R.; Dash, S.K.; Hegde, M.N.; Pradeepkumar, K.S.; Sharma, D.N. Validation of the TRMM multi satellite rainfall product 3B42 and estimation of scavenging coefficients for 131I and 137Cs using TRMM 3B42 rainfall data. J. Environ. Radioact. 2014, 138, 132–136. [Google Scholar] [CrossRef] [PubMed]
  72. Kim, Y.; Kang, B.; Adams, J.M. Opposite trends in summer precipitation in South and North Korea. Int. J. Climatol. 2012, 32, 2311–2319. [Google Scholar] [CrossRef]
  73. Raziei, T.; Bordi, I.; Santos, J.A.; Mofidi, A. Atmospheric circulation types and winter daily precipitation in Iran. Int. J. Climatol. 2013, 33, 2232–2246. [Google Scholar] [CrossRef]
  74. Raziei, T.; Mofidi, A.; Santos, J.A.; Bordi, I. Spatial patterns and regimes of daily precipitation in Iran in relation to large-scale atmospheric circulation. Int. J. Climatol. 2012, 32, 1226–1237. [Google Scholar] [CrossRef]
  75. Andermann, C.; Longuevergne, L.; Bonnet, S.; Crave, A.; Davy, P.; Gloaguen, R. Impact of transient groundwater storage on the discharge of Himalayan rivers. Nature Geosci. 2012, 5, 127–132. [Google Scholar] [CrossRef] [Green Version]
  76. Mishra, V.; Kumar, D.; Ganguly, A.R.; Sanjay, J.; Mujumdar, M.; Krishnan, R.; Shah, R.D. Reliability of regional and global climate models to simulate precipitation extremes over India. J. Geophys. Res.: Atmos. 2014, 119, 9301–9323. [Google Scholar] [CrossRef]
  77. Yatagai, A.; Kamiguchi, K.; Arakawa, O.; Hamada, A.; Yasutomi, N.; Kitoh, A. Aphrodite: Constructing a long-term daily gridded precipitation dataset for Asia based on a dense network of rain gauges. Bull. Am. Meteorol. Soc. 2012, 93, 1401–1415. [Google Scholar] [CrossRef]
  78. Joyce, R.J.; Xie, P. Kalman filter-based CMORPH. J. Hydrometeorol. 2011, 12, 1547–1563. [Google Scholar] [CrossRef]
  79. Seto, S.; Takahashi, N.; Iguchi, T. Rain/no-rain classification methods for microwave radiometer observations over land using statistical information for brightness temperatures under no-rain conditions. J. Appl. Meteorol. 2005, 44, 1243–1259. [Google Scholar] [CrossRef]
  80. Takahashi, N.; Awaka, J. Introduction of a melting layer model to a rain retrieval algorithm for microwave radiometers. IEEE Int. Geosci. Remote Sens. Symp. 2005, 5, 3404–3409. [Google Scholar]
  81. Wilks, D.S. Statistical Methods in the Atmospheric Sciences; Academic Press: Amsterdam, Boston, USA, 2011; Volume 100, p. 676. [Google Scholar]
  82. Tesfagiorgis, K.; Mahani, S.E.; Khanbilvardi, R. Bias correction of satellite rainfall estimation using a radar-gauge product. Hydrol. Earth Syst. Sci. Discuss. 2010, 7, 8913–8945. [Google Scholar] [CrossRef]
  83. Chen, S.; Hong, Y.; Cao, Q.; Gourley, J.J.; Kirstetter, P.E.; Yong, B.; Tian, Y.; Zhang, Z.; Shen, Y.; Hu, J. Similarity and difference of the two successive V6 and V7 TRMM multisatellite precipitation analysis performance over China. J. Geophys. Res.: Atmos. 2013, 118, 13060–13074. [Google Scholar] [CrossRef]
  84. Story, G.J.; Forecaster, H.; Center, W.G.R.F. Determining WSR-88D Precipitation Algorithm Performance Using the Stage III Precipitation Processing System. Available online: http://ftp.hydro.washington.edu/pub/lettenma/cee_599/radar_precipitation/Determining%20WSR-88D%20Precation%20Processing%20System.pdf (accessed on 4 November 2014).
  85. Surussavadee, C.; Staelin, D.H. Correcting microwave precipitation retrievals for near-surface evaporation. In Proceedings of 2010 IEEE International Geoscience and Remote Sensing Symposium (IGARSS), Honolulu, HI, USA, 25–30 July 2010; pp. 1312–1315.
  86. Tian, Y.; Peters-Lidard, C.D.; Choudhury, B.J.; Garcia, M. Multitemporal analysis of TRMM-based satellite precipitation products for land data assimilation applications. J. Hydrometeorol. 2007, 8, 1165–1183. [Google Scholar] [CrossRef]
  87. Grody, N.C.; Weng, F. Microwave emission and scattering from deserts: Theory compared with satellite measurements. IEEE Trans. Geosci. Remote Sens. 2008, 46, 361–375. [Google Scholar] [CrossRef]
  88. Yang, Y.; Luo, Y. Evaluating the performance of remote sensing precipitation products CMORPH, PERSIANN, and TMPA, in the arid region of Northwest China. Theor. Appl. Climatol. 2014, 118, 429–445. [Google Scholar] [CrossRef]
  89. Tian, Y.; Peters-Lidard, C.D. Systematic anomalies over inland water bodies in satellite-based precipitation estimates. Geophys Res. Lett. 2007, 34, L14403. [Google Scholar] [CrossRef]
  90. Xie, P.; Chen, M.; Yang, S.; Yatagai, A.; Hayasaka, T.; Fukushima, Y.; Liu, C. A gauge-based analysis of daily precipitation over East Asia. J. Hydrometeorol. 2007, 8, 607–626. [Google Scholar] [CrossRef]
  91. Chen, M.; Shi, W.; Xie, P.; Silva, V.B.S.; Kousky, V.E.; Wayne Higgins, R.; Janowiak, J.E. Assessing objective techniques for gauge-based analyses of global daily precipitation. J. Geophys. Res.: Atmos. 2008, 113, D04110. [Google Scholar]
  92. Li, Z.; Yang, D.W.; Hong, Y. Multi-scale evaluation of high-resolution multi-sensor blended global precipitation products over the Yangtze River. J. Hydrol. 2013, 500, 157–169. [Google Scholar] [CrossRef]
  93. Shen, Y.; Xiong, A.; Wang, Y.; Xie, P. Performance of high-resolution satellite precipitation products over China. J. Geophys. Res.: Atmos. 2010, 115, D02114. [Google Scholar] [CrossRef]
  94. Gosset, M.; Viarre, J.; Quantin, G.; Alcoba, M. Evaluation of several rainfall products used for hydrological applications over West Africa using two high-resolution gauge networks. Q. J. R. Meteorol. Soc. 2013, 139, 923–940. [Google Scholar] [CrossRef]
  95. Behrangi, A.; Tian, Y.; Lambrigtsen, B.H.; Stephens, G.L. What does CloudSat reveal about global land precipitation detection by other spaceborne sensors? Water Resour. Res. 2014, 50, 4893–4905. [Google Scholar] [CrossRef]
  96. Huang, Y.; Chen, S.; Cao, Q.; Hong, Y.; Wu, B.; Huang, M.; Qiao, L.; Zhang, Z.; Li, Z.; Li, W.; et al. Evaluation of version-7 TRMM multi-satellite precipitation analysis product during the Beijing extreme heavy rainfall event of 21 July 2012. Water 2013, 6, 32–44. [Google Scholar] [CrossRef]
  97. Aonashi, K.; Liu, G. Passive microwave precipitation retrievals using TMI during the BAIU period of 1998. Part I: Algorithm description and validation. J. Appl. Meteorol. 2000, 39, 2024–2037. [Google Scholar]
  98. Bohren, C.F.; Battan, L.J. Radar backscattering by inhomogeneous precipitation particles. J. Atmos. Sci. 1980, 37, 1821–1827. [Google Scholar] [CrossRef]
  99. Lehning, M.; Löwe, H.; Ryser, M.; Raderschall, N. Inhomogeneous precipitation distribution and snow transport in steep terrain. Water Resour. Res. 2008, 44, W07404. [Google Scholar] [CrossRef]
  100. Smith, P.L.; Liu, Z.; Joss, J. A study of sampling-variability effects in raindrop size observations. J. Appl. Meteorol. 1993, 32, 1259–1269. [Google Scholar] [CrossRef]

