
The Challenges of Remote Monitoring of Wetlands


Geological Survey, Earth Resources Observation and Science Center, 47914 252nd Street, Sioux Falls, SD 57198, USA
Remote Sens. 2015, 7(8), 10938-10950; https://doi.org/10.3390/rs70810938
Submission received: 13 August 2015
/
Accepted: 13 August 2015
/
Published: 24 August 2015
(This article belongs to the Special Issue Towards Remote Long-Term Monitoring of Wetland Landscapes)
Abstract
:Wetlands are highly productive and support a wide variety of ecosystem goods and services. Various forms of global change impose compelling needs for timely and reliable information on the status of wetlands worldwide, but several characteristics of wetlands make them challenging to monitor remotely: they lack a single, unifying land-cover feature; they tend to be highly dynamic and their energy signatures are constantly changing; and steep environmental gradients in and around wetlands produce narrow ecotones that often are below the resolving capacity of remote sensors. These challenges and needs set the context for a special issue focused on wetland remote sensing. Contributed papers responded to one of three overarching questions aimed at improving remote, large-area monitoring of wetlands: (1) What approaches and data products are being developed specifically to support regional to global long-term monitoring of wetland landscapes? (2) What are the promising new technologies and sensor/multisensor approaches for more accurate and consistent detection of wetlands? (3) Are there studies that demonstrate how remote long-term monitoring of wetland landscapes can reveal changes that correspond with changes in land cover and land use and/or changes in climate?

1. Importance of Wetlands
Wetlands are highly productive [1] and support a host of ecosystem goods and services. At local scales wetlands provide food, fiber, filtering of contaminants, sediment storage, flood control, wildlife habitat, recreation, aesthetics, and other functions [2]. At broader scales wetland-rich landscapes help regulate regional climate (e.g., [3]) and provide critical habitat for continental and intercontinental migratory species (e.g., [4,5]). Despite these important benefits, wetlands have been drained extensively worldwide to increase acreage for cultivation of crops and accommodate expansion of human settlement [6,7]. Wetlands continue to be vulnerable to changes in land use and management, but accelerated rates of climate change have added to the complexity of maintaining functioning wetlands [8,9].
There is a compelling need to monitor the status of wetlands. Field monitoring is highly informative about changes in wetland functioning and the related environmental drivers and consequences of those changes. However, monitoring in situ is expensive, and many wetlands are in remote locations or are otherwise logistically challenging to monitor or have restricted access. Thus, it is only practical to monitor a small subset of the world’s wetlands in situ. Moreover, we need information at broader scales to provide regional, national, and global context to complement what can be learned in situ. Remote monitoring of wetlands is attractive because it is comparatively inexpensive and provides information over a range of broader scales [10,11,12,13], but it has been difficult to map wetlands remotely with levels of accuracy and consistency sufficient to monitor change (e.g., see [14,15,16,17,18,19,20]).
2. Difficulty in Monitoring Wetlands
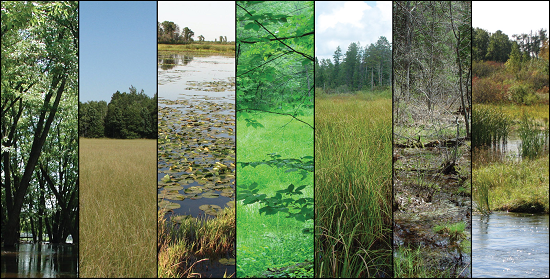
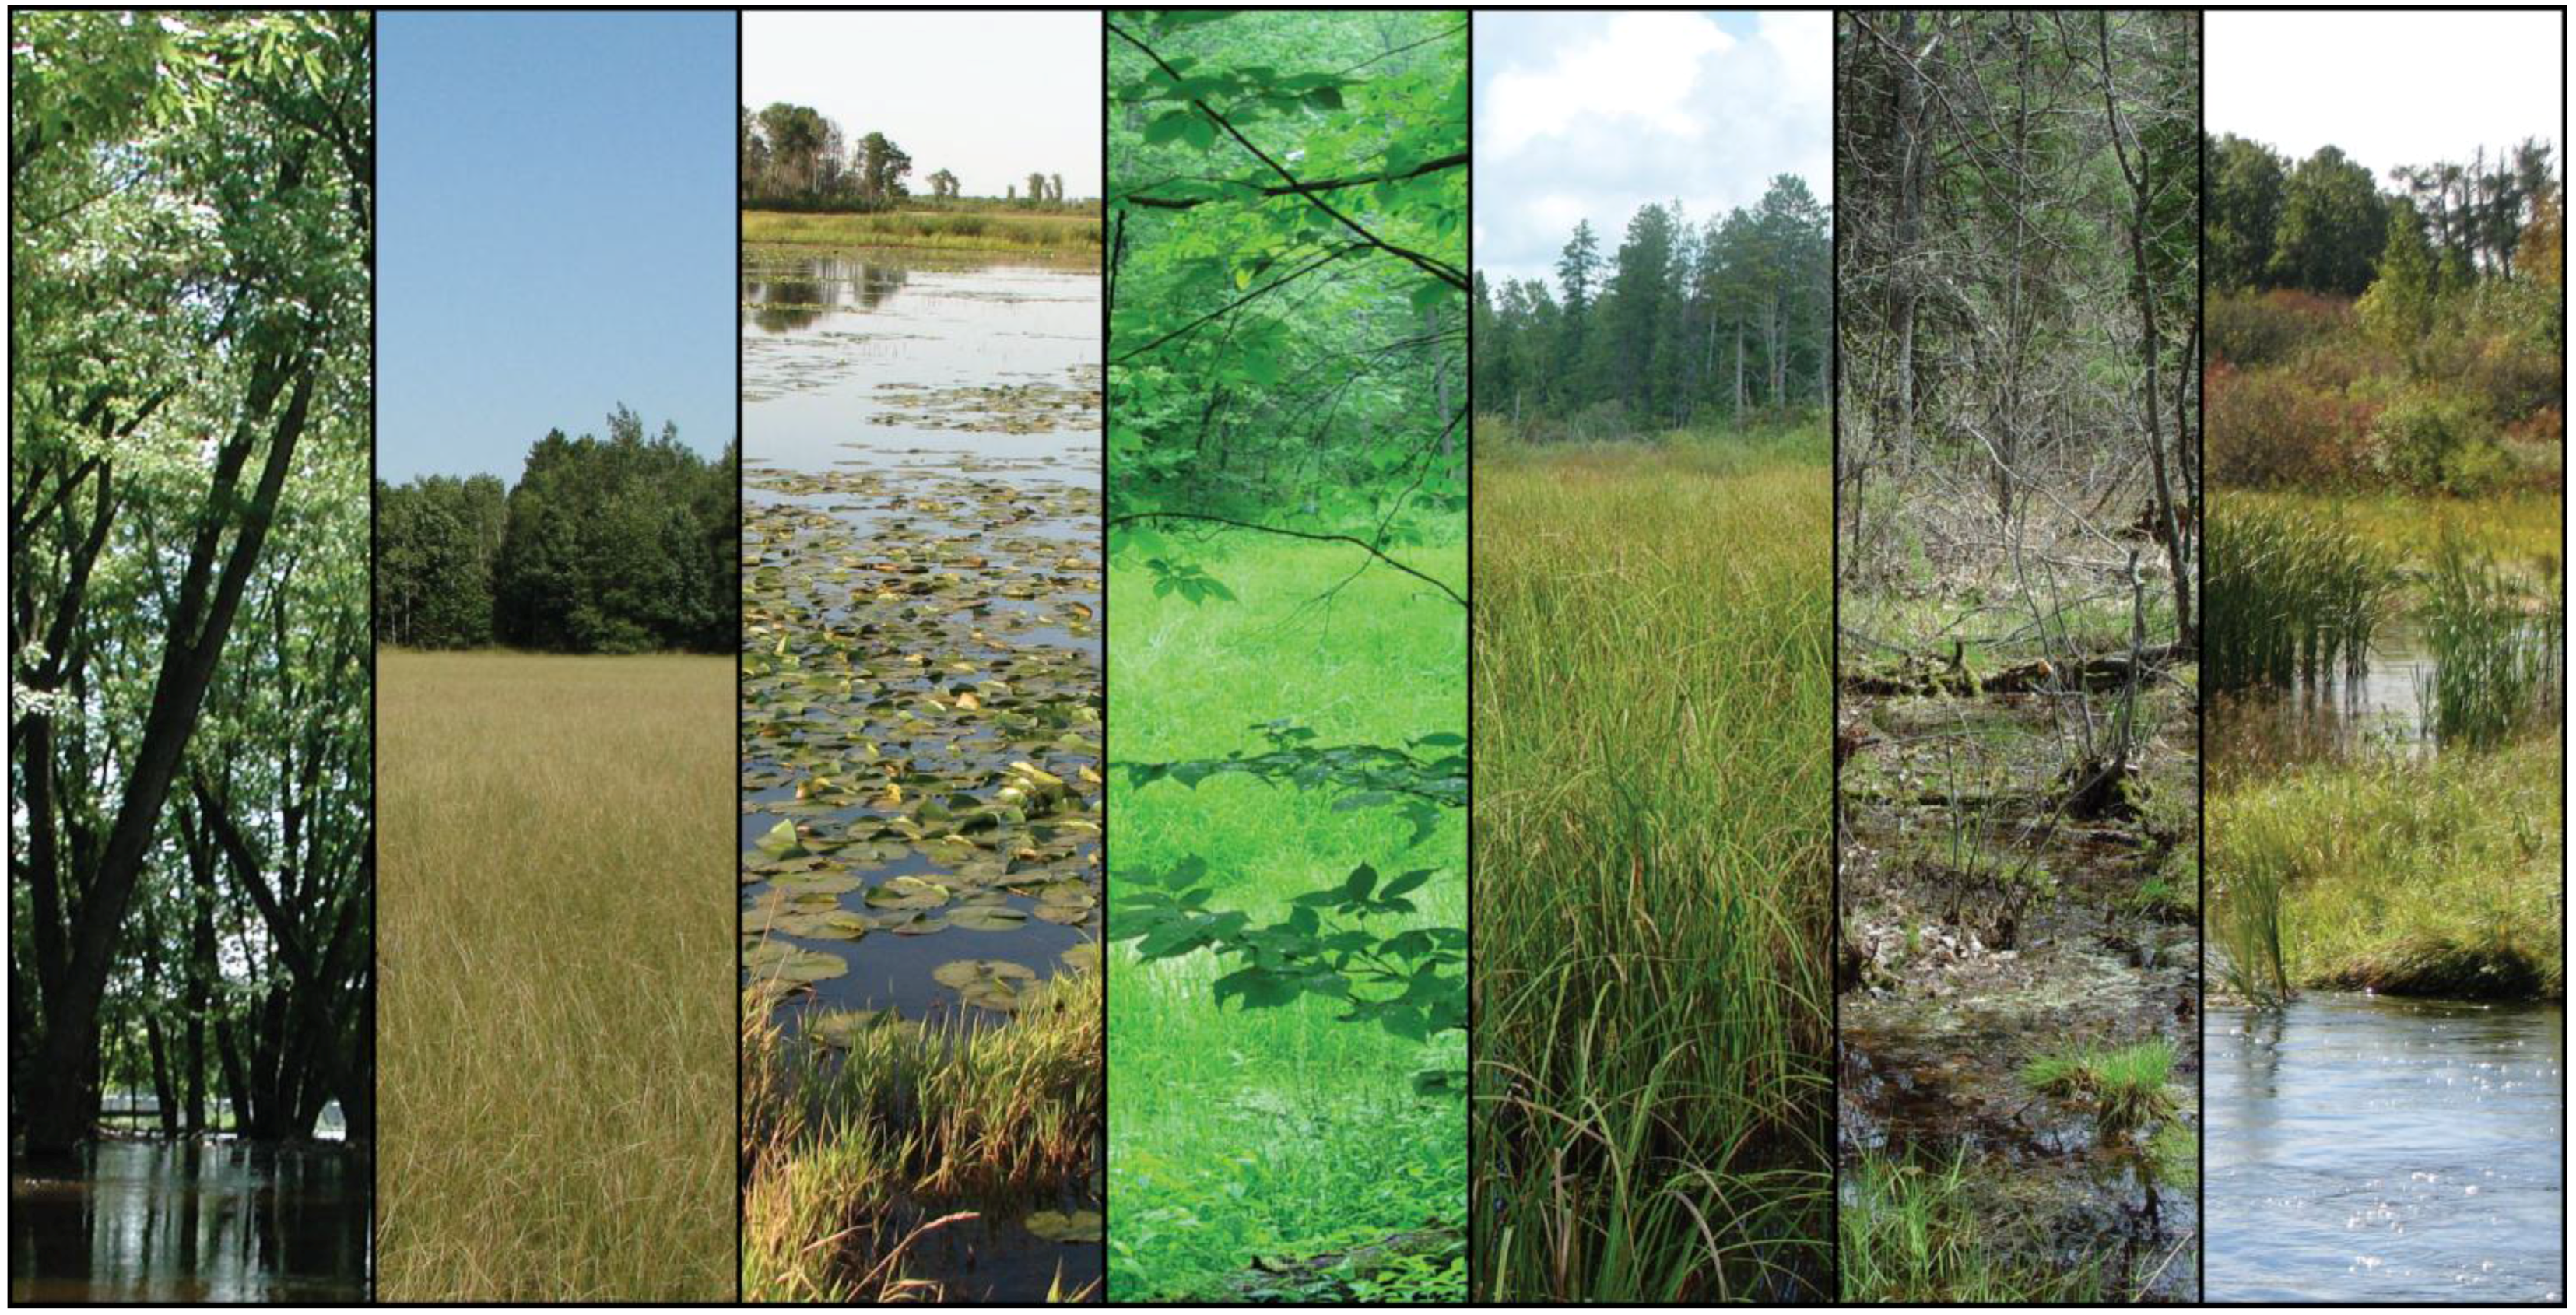
Why is it so hard to map wetlands from the skies? One main factor is that wetlands are not unified by a common land-cover type or vegetation form in the way that forests are populated with trees, grasslands with grasses, and shrublands with shrubs (Figure 1). Wetlands share a characteristic presence of water, but it can be at the Earth’s surface or below the surface in the rooting zone of plants. This water may be present all the time, seasonally, or only in some years, but is in residence enough to influence the development and condition of the soil and support vegetation adapted to wet conditions [21,22]. The interplay among water, soils, and vegetation results in a wide variety of wetland types and features, as well as processes and functions. Daily tidal actions add further complexity in coastal settings. Wetlands can support submerged, floating-leaved, and emergent herbaceous species, as well as hydrophytic shrub and tree species, and wetland communities can be dominated by a single or few species or be a heterogeneous mixture of multiple species and life forms.
A second factor that makes wetlands so challenging to map remotely is that they are highly dynamic in ways that substantially alter their reflectance and energy backscatter properties [23,24,25,26,27], sometimes within hours or days [28,29]. Individual species can exhibit significant variation in energy responses (spectrally and in terms of backscatter geometry) within a growing season at different stages of their development [11,26]. Density of spatial coverage by vegetation also alters the energy response received by remote sensors [27]; wetland cover can range from open water (devoid of plants) to vegetation-choked surfaces within a growing season as well as across years (e.g., [26]). Water levels impose strong controls in wetlands, and the magnitude of change in water levels influences the relative abundance of species and rate of vegetation succession [30]. Water depths can change rapidly from snowmelt, storm surge, and major precipitation events. Water levels in wetlands with no hydrologic connections to groundwater can be especially responsive to these events. Water depth affects the establishment of different plant species based on their respective tolerances to flooding and altered water chemistry [31]. Climatic oscillatory fluctuations in water levels can be relatively frequent in some regions (e.g., see [30]) and favor the establishment of different species in different years, as fed by the local seed bank stored from past climate cycles [31]. Land cover, use, and management in the contributing watershed further influence amount and quality of wetland water and type of aquatic vegetation [10,32,33,34,35,36]. Runoff from surrounding uplands can alter water clarity or color (e.g., [37,38]) through delivery of sediments or a variety of nutrients and chemicals that affect growth of wetland biota (e.g., [39]). Conversely, drying of wetlands will cause water stress, altering leaf optical properties [11] and, at some point, structural properties that also affect energy backscatter.
Figure 1.
There is no single, unifying landsurface feature common to all wetlands, not even the presence of exposed water. Their variety in surface features, coupled with highly dynamic conditions in moisture availability and vegetation development, make wetlands exceptionally difficult to map remotely with the consistency and accuracy required for monitoring (Photos variously by M. Roth and A. Gallant, U.S. Geological Survey).
A third factor is that steep environmental gradients in and around the edges of wetlands produce narrow ecotones [11] that are often below the spatial resolving capacity of remote sensors. Sharp contrasts in characteristics of energy response at the land-water interface can be exploited to aid mapping in some wetland settings (e.g., [40,41]), though boundaries between vegetation types may be too narrow to distinguish with data from most satellite sensors [11]. In forested landscapes it is not uncommon for smaller wetlands to be completely obscured by the canopies of wetland-adjacent trees.
From a remote sensing perspective wetlands are a “moving target,” representing more of a moisture regime than a cover type. Interrelations among environmental dynamics and potential wetland land covers and conditions result in an ever-changing variety of energy responses that make it highly challenging to train algorithms that can map wetlands with levels of accuracy and consistency sufficient for monitoring. This is evidenced by the myriad ways in which researchers have approached remote mapping of wetlands and the lack of consistency in results.
3. Past Approaches to Remote Sensing of Wetlands
Aerial photography, multispectral and hyperspectral sensors, light detection and ranging (lidar), and synthetic aperture radar (SAR), interferometric SAR (InSAR), and other microwave systems, (e.g., Gravity Recovery and Climate Experiment (GRACE)) all have provided source data used to map and characterize wetlands and related water dynamics [11,13,27,42,43,44,45]. Aerial photography offers the high spatial resolution desirable for detecting many wetland features, but typically involves time- and experience-intensive manual interpretation or manipulation, and repeat acquisitions have historically been limited [43,46,47,48], although certain programs are supporting annual or biennial flyovers in recent years (e.g., U.S. National Agriculture Imagery Program [49]). Data from multispectral sensors have been widely used for classifying land cover, including wetlands. Landsat sensor data have been the traditional choice [42], owing to the wide geographic coverage, temporal depth of the archive, and, since 2008, the availability of the data at no charge to users. Practitioners of wetland mapping also have used multispectral data of higher spatial resolution to map wetlands (e.g., [50,51]). Alternatively, data of high temporal resolution, though low spatial resolution, have enabled better opportunity for cloud-free monitoring of seasonal wetland dynamics across large geographic extents (e.g., [52]).
Generally, more emphasis has been invested in remote sensing research of coastal wetlands than inland wetlands [12,42,43,47,53,54], but the need for long-term monitoring of wetlands in both types of settings is acute because of escalating rates of multiple forms of global change. Land use and management actions already have been responsible for substantial losses and alterations of wetlands [55,56], and anthropogenic activities continue to alter the surface of the Earth across large geographic extents at rapid rates (e.g., [57]). Presence of water and quality of habitat in wetlands can be manipulated through direct actions (e.g., [58]), but wetlands also are heavily influenced by many biotic and abiotic exogenous factors, and drivers of change, especially socioeconomic drivers, may be geographically removed from wetlands (e.g., [59,60]). As the human population continues to increase across the planet, so do concomitant increases in demands for ecosystem services [61]. These demands will be coupled with potentially unprecedented rates of climate change over the next century that will engender a host of environmental changes across the landscape [62]. For all these reasons and more there is an urgent need to improve our capabilities to characterize and monitor the status of wetlands worldwide.
4. Purpose of this Special Issue
The concept for the special issue, Towards Remote Long-Term Monitoring of Wetland Landscapes [63], was to solicit papers that responded to three overarching questions aimed at improving remote, large-area monitoring of wetlands: (1) What approaches and data products are being developed specifically to support regional to global long-term monitoring of wetland landscapes? (2) What are the promising new technologies and sensor/multisensor approaches for more accurate and consistent detection of wetlands? (3) Are there studies that demonstrate how remote long-term monitoring of wetland landscapes can reveal changes that correspond with changes in land cover and land use and/or changes in climate?
In the resulting collection of papers, none centered on long-term studies of wetland landscapes in response to Question #3. However, Moffett and colleagues [64] contributed a paper that considers how long-term remote monitoring could be focused to test ecological theory of wetland dynamics in coastal settings. It is an interesting crossover paper not typical of the remote sensing literature and provides inspiration for applying the tools from one discipline to test the theories of another.
Several of the papers in the collection responded to Question #1 and describe approaches and data products aimed to support consistent, large-area, long-term monitoring of wetlands. These types of efforts typically have been undertaken in response to monitoring missions of large agencies, and that is the case with these contributed papers as well. The National Aeronautics and Space Administration (NASA) has been a strong supporter of the use of satellite measurements to provide consistent science data products to improve understanding of Earth systems. NASA’s MEaSUREs project (Making Earth System Data Records for Use in Research Environments; [65]) has supported the work behind two of the papers in this special issue. The papers reflect two complementary components of NASA’s interests in global monitoring of wetland extent and dynamics [66]. Chapman and colleagues [67] compiled inundation products at 25 km cell resolution to enable analyses of wetland dynamics at continental scales based on space-borne L-band SAR data from the ALOS PALSAR instrument, assisted with digital elevation data from the Shuttle Radar Topography Mission (see [68]). The authors distinguished open water from inundated vegetation and demonstrated results for South America. Clewley and colleagues [69] derived a map of vegetated wetlands in Alaska at 50 m cell resolution with L-band SAR data from ALOS PALSAR and ancillary data on slope, elevation, and location. Data from Chapman et al. [67] and Clewley et al. [69] are served through NASA's Distributed Active Archive Centers (see [70]).
The U.S. Geological Survey (USGS) is another agency with a mission aimed at monitoring the environment and providing science data to a wide user community. The USGS is home to the Landsat archive, containing data from 1972 to present and representing the longest-running civilian satellite series in the world. The standard Landsat products served by the USGS are terrain-corrected data (see [71]), but recently the agency has begun developing and testing higher-level science data products. The paper by Jones [72] describes a candidate algorithm to identify Dynamic Surface Water Extent (DWSE) for mapping ground surface inundation. The DSWE currently is targeted as an on-demand Landsat Science Data Product for the United States and its territories, with the potential to be expanded globally, as inputs to the algorithm—Landsat and digital elevation data—are available globally.
The U.S. Environmental Protection Agency (EPA) has a regulatory mission related to air and water quality and a long history of supporting large-area assessments of resource status, which includes the work described by Bourgeau-Chavez and colleagues [73]. Their efforts support a binational (U.S. and Canada) assessment of coastal wetlands within the basin surrounding the North American Great Lakes. The authors combined three-season Landsat TM and PALSAR data to provide the first comprehensive map of wetland types and adjacent upland land cover and potential wetland stressors for the Great Lakes region, developing a repeatable methodology to support long-term monitoring.
The Centre National D’Etudes Spatiales (France’s government agency responsible for space policy) and NASA jointly supported the work undertaken by Frappart and colleagues [74], who used a multi-satellite approach to develop time-series maps of surface-water storage at approximately 25 km spatial resolution as part of a global project to track intra- and interannual patterns of water storage. The contributed paper includes results for the Orinoco Basin, South America, derived from integrating surface inundation maps from Global Inundation Extent Multi-Satellites (GIEMS) and radar altimetry heights from Envisat to compile water-level maps for the basin. The authors incorporated data from the Gravity Recovery and Climate Experiment (GRACE) to determine the contribution of the surface-water storage they mapped to total water storage across the Orinoco Basin.
The value of all these large-area efforts to develop wetland-related products that are consistent across the landscape is underscored by Amler and colleagues [75], who detailed the difficulties encountered when trying to piece together data from multiple sources to monitor wetlands across East Africa. The authors documented the inconsistencies with which wetlands have been defined and mapped around the world and called for a common lexicon for use by practitioners of wetland mapping.
The majority of papers contributed for this special issue addressed Question #2, describing new techniques or technologies or combinations thereof. Lane and colleagues [76] evaluated the information content of “new” coastal (400–450 nm), yellow (585–625 nm), red-edge (705–745 nm), and near-infrared-2 (860–900 nm) bands offered by the WordView-2 sensor in addition to its four more typical bandwidths for optical sensors (red-, green-, and blue-visible and near-infrared-1 [770–895 nm]). The authors found the new bands contributed a few percent improvement in overall accuracy for mapping wetland vegetation in their study area in southeastern Siberia, Russia, with considerably more improvement in discriminating certain wetland communities. Optical sensor data were also the choice of Luo and colleagues [77] for mapping aquatic vegetation in Taihu Lake in Jiangsu Province, China. They used data from the Charge-Coupled Device sensors on China’s HJ-1A and HJ-1B satellites, which provide spectral bandwidths and spatial resolution comparable with the first four bands of Landsat TM and ETM+ sensors, but offer a combined revisit time of two days. The authors addressed the longstanding challenge of how to train and validate classification algorithms for time-series studies when field data are only available for a portion of the time analyzed; their resultant approach extends classification-tree models across time. Similarly, Blakey and colleagues [78] also applied a method that extended a classifier back in time, prior to years when field data were available. In this case, the optical data were from Landsat-5 and were used to map changes in seagrass extent and density through time along the southern Florida coast, USA. The authors borrowed techniques usually used for terrestrial land-cover mapping and applied them for aquatic mapping, incorporating corrections for water-column properties. Their results achieved levels of accuracy similar to those achieved via the more typical approach of using spectral libraries to map seagrass, but with much less effort. Ceron and colleagues [79] also used optical data, but rather than map wetland vegetation, they used thermal data from MODIS, in conjunction with solar radiation data from weather stations, to generate maps of estimated actual evapotranspiration (AET) for an extensive wetland landscape in southern Florida, USA. Their goal was to provide a way to monitor the condition of wetland vegetation using the surrogate of AET status.
Two papers in the collection describe applications with active optical sensors. Wu and colleagues [80] used lidar-derived elevation data and ancillary high spatial resolution information on land use, land cover, and hydrography to identify locations and boundaries of potential vernal pools in a fine-grained landscape in Massachusetts, USA, that included many woody wetlands. Their approach identified numerous small wetlands that had previously not been included in a statewide database. Medeiros and colleagues [81] incorporated lidar data with data from a passive optical sensor (MODIS) and interferometric SAR to tackle improvements needed for digital elevation models in coastal salt marshes. They adjusted initial bare-earth elevation estimates based on vegetation canopy heights and densities to generate an improved bare-earth elevation layer for their study area in northwestern Florida, USA.
Three papers focused on application of data from SAR systems to map wetland landscapes. White and colleagues [82] summarized a set of techniques relevant for characterizing wetlands with SAR data. The authors variously used data from Radarsat-2 for wetland landscapes in northern Alberta and southern Manitoba in Canada and Hunan Province in China to provide demonstrations of grey-level thresholding to map and monitor surface-water extent, polarimetric decompositions to map flooded vegetation, and two recent methods developed to assist in change detection with multitemporal polarimetric SAR data—a Curvelet-based approach, which operates on whole structures found in the images, and the Wishart-Chernoff Distance, which operates at the pixel level. Chen and colleagues [83] also used polarimetric SAR data. They borrowed object-oriented image characterization and a classification-tree approach from the optical data community and applied them to a wide variety of polarimetric SAR decompositions generated from ALOS PALSAR data for an area along the eastern coast of China in Jiansu Province to map cover types in a coastal wetland landscape. A comparison of land-cover outputs resulting from this approach with several other approaches showed it provided substantial improvement in mapping accuracy. Hong and colleagues [84] also applied an object-oriented analysis for mapping a wetland landscape. They applied it to a new decomposition method they developed for use with polarimetric SAR data, which they obtained from TerraSAR-X for their study area in the Everglades of South Florida, USA. They found the scattering components from their decomposition to be especially advantageous for mapping mangroves along tidal channels.
Two sets of authors focused on the influence that training data selection can have on wetland classification results, a topic not well covered in the literature for applications using the Random Forests [85] classifier. Corcoran and colleagues [86] evaluated the benefits of using points, point-centered windows, and image objects to train the Random Forests decision-tree classifier, then considered the benefits contributed by different variables derived from color-infrared orthoimagery and lidar data to generate classifications for two wetland landscapes in Minnesota, USA. Millard and Richardson [87] used lidar-derived variables to evaluate a suite of effects of different characteristics of training data selection on the Random Forests classifier. They analyzed the benefits of limiting input to uncorrelated variables, tested the influence of the size of the training dataset and the associated distribution of samples across cover types, and assessed the effects of spatial autocorrelation on classification results for a peatland landscape in southern Ontario, Canada.
The contributions in this collection of papers towards addressing the challenges of remote monitoring of wetlands span fine to global scales of mapping and demonstrate new ways to combine data across sensors and techniques. The papers range from describing new wetland-related products generated for the user community to new, borrowed, or enhanced techniques to improve wetland mapping. The studies have used data from new sensors and long-established sensor series, active and passive sensors, and optical and radar systems, sometimes integrated with ground-based data. An opportunity is even offered for readers to step back and consider how remote sensing studies can be framed to test wetland ecological theory, such as in making theories and models spatially explicit and in scaling relations from local to broader landscapes. These contributions are greatly appreciated and will help forward our way towards remote long-term monitoring of wetland landscapes.
Conflicts of Interest
The author declares no conflict of interest.
References
- Barbour, M.G.; Burk, J.H.; Pitts, W.D. Terrestrial Plant Ecology, 2nd ed.; The Benjamin/Cummings Publishing Company, Inc.: Menlo Park, CA, USA, 1987. [Google Scholar]
- Millenium Ecosystem Assessment. Ecosystems and Human Well-Being: Wetlands and Water Synthesis; World Resources Institute: Washington, DC, USA, 2005. [Google Scholar]
- Marshall, C.H.; Pielke, R.A.; Steyaert, L.T. Has the conversion of natural wetlands to agricultural land increased the incidence and severity of damaging freezes in South Florida? Mon. Weather Rev. 2004, 132, 2243–2258. [Google Scholar] [CrossRef]
- Myers, J.P. Conservation of migrating shorebirds: Staging areas, geographic bottlenecks, and regional movements. Migr. Conserv. 1983, 37, 23–25. [Google Scholar]
- Webb, E.B.; Smith, L.M.; Vrtiska, M.P.; Lagrange, T.G. Effects of local and landscape variables on wetland bird habitat use during migration through the Rainwater Basin. J. Wildl. Manag. 2010, 74, 109–119. [Google Scholar] [CrossRef]
- Baldassarre, G.A.; Bolen, E.G. Waterfowl Ecology and Management; John Wiley and Sons: New York, NY, USA, 1994. [Google Scholar]
- Fraser, L.H.; Keddy, P.A. The future of large wetlands: A global perspective. In The World’s Largest Wetlands—Ecology and Conservation; Fraser, L.H., Keddy, P.A., Eds.; Cambridge University Press: New York, NY, USA, 2005; pp. 446–468. [Google Scholar]
- Karl, T.R.; Melilo, J.M.; Peterson, T.C. Global Climate Change Impacts in the United States; Cambridge University Press: Cambridge, MA, USA, 2009. [Google Scholar]
- Intergovernmental Panel on Climate Change (IPCC). Climate Change 2014: Impacts, Adaptation, and Vulnerability; IPCC: Cambridge, UK, 2014. [Google Scholar]
- Euliss, N.H., Jr.; Mushet, D.M.; Newton, W.E.; Otto, C.R.V.; Nelson, R.D.; LaBaugh, J.W.; Scherff, E.J.; Rosenberry, D.O. Placing prairie pothole wetlands along spatial and temporal continua to improve integration of wetland function in ecological investigations. J. Hydrol. 2014, 513, 490–503. [Google Scholar] [CrossRef]
- Adam, E.; Mutanga, O.; Rugege, D. Multispectral and hyperspectral remote sensing for identification and mapping of wetland vegetation: A review. Wetl. Ecol. Manag. 2010, 18, 281–296. [Google Scholar] [CrossRef]
- Klemas, V. Remote sensing of emergent and submerged wetlands: An overview. Int. J. Remote Sens. 2013, 34, 6286–6320. [Google Scholar] [CrossRef]
- Kuenzer, C.; Bluemel, A.; Gebhardt, S.; Vo Quoc, T.; Dech, S. Remote sensing of mangrove ecosystems: A review. Remote Sens. 2011, 3, 878–928. [Google Scholar] [CrossRef]
- Brisco, B.; Kapfer, M.; Hirose, T.; Tedford, B.; Liu, J. Evaluation of C-band polarization diversity and polarimetry for wetland mapping. Can. J. Remote Sens. 2011, 37, 82–92. [Google Scholar] [CrossRef]
- Brisco, B.; Schmitt, A.; Murnaghan, K.; Kaya, S.; Roth, A. SAR polarimetric change detection for flooded vegetation. Int. J. Digit. Earth 2013, 6, 103–114. [Google Scholar] [CrossRef]
- Brisco, B.; Short, N.; van der Sanden, J.; Landry, R.; Raymond, D. A semi-automated tool for surface water mapping with Radarsat-1. Can. J. Remote Sens. 2009, 35, 336–344. [Google Scholar] [CrossRef]
- Rover, J.; Wylie, B.K.; Ji, L. A self-trained classification technique for producing 30 m percent-water maps from Landsat data. Int. J. Remote Sens. 2010, 31, 2197–2203. [Google Scholar] [CrossRef]
- Wickham, J.D.; Stehman, S.V.; Fry, J.A.; Smith, J.H.; Homer, C.G. Thematic accuracy of the NLCD 2001 land cover for the conterminous United States. Remote Sens. Environ. 2010, 114, 1286. [Google Scholar] [CrossRef]
- Wickham, J.D.; Stehman, S.V.; Gass, L.; Dewitz, J.; Fry, J.A.; Wade, T.G. Accuracy assessment of NLCD 2006 land cover and impervious surface. Remote Sens. Environ. 2006, 130, 294. [Google Scholar] [CrossRef]
- Corcoran, J.M.; Knight, J.F.; Gallant, A.L. Influence of multi-source and multi-temporal remotely sensed and ancillary data on the accuracy of Random Forest classification of wetlands in northern Minnesota. Remote Sens. 2013, 5, 3212–3238. [Google Scholar] [CrossRef]
- Mitsch, W.J.; Gosselink, J.G. Wetlands, 2nd ed.; Van Nostrand Reinhold: New York, NY, USA, 1993. [Google Scholar]
- Cowardin, L.M.; Carter, V.; Golet, F.C.; LaRoe, E.T. Classification of Wetlands and Deepwater Habitats of the United States; FWS/OBS-79/31; U.S. Fish and Wildlife Service: Washington, DC, USA, 1979; p. 131.
- Kasischke, E.S.; Smith, K.B.; Bourgeau-Chavez, L.L.; Romanowicz, E.A.; Brunzell, S.; Richardson, C.J. Effects of seasonal hydrologic patterns in South Florida wetlands on radar backscatter measured from ERS-SAR imagery. Remote Sens. Environ. 2003, 88, 423–441. [Google Scholar] [CrossRef]
- Ollinger, S.V. Sources of variability in canopy reflectance and the convergent properties of plants. New Phytol. 2010, 189, 375–394. [Google Scholar] [CrossRef] [PubMed]
- Kaasalainen, S.; Niittymaki, H.; Krooks, A.; Koch, K.; Kaartinen, H.; Vain, A.; Hyyppa, H. Effect of target moisture on laser scanning intensity. IEEE Trans. Geosci. Remote Sens. 2010, 48, 2128–2136. [Google Scholar] [CrossRef]
- Gallant, A.L.; Kaya, S.G.; White, L.; Brisco, B.; Roth, M.F.; Sadinski, W.; Rover, J. Detecting emergence, growth, and senescence of wetland vegetation with polarimetric synthetic aperture radar (SAR) data. Water 2014, 6, 694–722. [Google Scholar] [CrossRef]
- Silva, T.S.F.; Costa, M.P.F.; Melack, J.M.; Novo, E.M.L. Remote sensing of aquatic vegetation: Theory and applications. Environ. Monit. Assess. 2008, 140, 131–145. [Google Scholar] [CrossRef] [PubMed]
- Refice, A.; Capolongo, D.; Pasquariello, G.; D’Addabbo, A.; Bovenga, F.; Nutricato, R.; Lovergine, F.P.; Pietranera, L. SAR and InSAR for flood monitoring: Examples with COSMO-SkyMed data. IEEE J. Sel. Top. Appl. Earth Observ. Remote Sens. 2014, 7, 2711–2722. [Google Scholar] [CrossRef]
- Ticehurst, C.; Guerschman, J.P.; Chen, Y. The strengths and limitations in using the daily MODIS open water likelihood algorithm for identifying flood events. Remote Sens. 2014, 6, 11791–11809. [Google Scholar] [CrossRef]
- Van der Valk, A.G. Water-level fluctuations in North American prairie wetlands. Hydrobiologia 2005, 539, 171–188. [Google Scholar] [CrossRef]
- Euliss, N.H., Jr.; LaBaugh, J.W.; Fredrickson, L.H.; Mushet, D.M.; Laubhan, M.K.; Swanson, G.A.; Winter, T.C.; Rosenberry, D.O.; Nelson, R.D. The wetland continuum: A conceptual framework for interpreting biological studies. Wetlands 2004, 24, 448–458. [Google Scholar] [CrossRef]
- Gleason, R.A.; Euliss, N.H., Jr.; Hubbard, D.E.; Duffy, W.G. Effects of sediment load on emergence of aquatic invertebrates and plants from wetland soil egg and seed banks. Wetlands 2003, 23, 26–34. [Google Scholar] [CrossRef]
- Hidding, B.; Sarneel, J.M.; Bakker, E.S. Flooding tolerance and horizontal expansion of wetland plants: Facilitation by floating mats? Aquat. Bot. 2014, 113, 83–89. [Google Scholar] [CrossRef]
- Chu, S.; Molano-Flores, B. Impacts of agricultural to urban land-use change on floristic quality assessment indicators in northeastern Illinois wetlands. Urban Ecosyst. 2013, 16, 235–246. [Google Scholar] [CrossRef]
- Ewing, J.M.; Vepraskas, M.J.; Broome, S.W.; White, J.G. Changes in wetland soil morphological and chemical properties after 15, 20, and 30 years of agricultural production. Geoderma 2012, 179–180, 73–80. [Google Scholar] [CrossRef]
- Gleason, R.A.; Laubhan, M.K.; Euliss, N.H., Jr. Ecosystem Services Derived from Wetland Conservation Practices in the United States Prairie Pothole Region with an Emphasis on the U.S. Department of Agriculture Conservation Reserve and Wetlands Reserve Programs; U.S. Geological Survey Professional Paper 1745; U.S. Geological Survey: Reston, VA, USA, 2008; p. 58.
- Olmanson, L.G.; Brezonik, P.L.; Bauer, M.E. Geospatial and temporal analysis of a 20-year record of Landsat-based water clarity in Minnesota’s 10,000 lakes. J. Am. Water Resour. Assoc. 2014, 50, 748–761. [Google Scholar] [CrossRef]
- Sawaya, K.E.; Olmanson, L.G.; Heinert, N.J.; Brezonik, P.L.; Bauer, M.E. Extending satellite remote sensing to local scales: Land and water resource monitoring using high-resolution imagery. Remote Sens. Environ. 2003, 88, 144–156. [Google Scholar] [CrossRef]
- Trebitz, A.S.; Brazner, J.C.; Tanner, D.K.; Meyer, R. Interacting watershed size and landcover influences on habitat and biota of Lake Superior coastal wetlands. Aquat. Ecosyst. Health Manag. 2011, 14, 443–455. [Google Scholar] [CrossRef]
- White, L.; Brisco, B.; Pregitzer, M.; Tedford, B.; Boychuk, L. Radarsat-2 beam mode selection for surface water and flooded vegetation mapping. Can. J. Remote Sens. 2014, 40, 135–151. [Google Scholar]
- Wright, C.; Gallant, A. Improved wetland remote sensing in Yellowstone National Park using classification trees to combine TM imagery and ancillary environmental data. Remote Sens. Environ. 2007, 107, 582–605. [Google Scholar] [CrossRef]
- Klemas, V. Remote sensing of coastal wetland biomass: An overview. J. Coast. Res. 2013, 29, 1016–1028. [Google Scholar] [CrossRef]
- Klemas, V. Remote sensing techniques for studying coastal ecosystems: An overview. J. Coast. Res. 2011, 27, 2–17. [Google Scholar] [CrossRef]
- Lee, H.; Beighley, R.E.; Alsdorf, D.; Jung, H.C.; Shum, C.K.; Duan, J.; Guo, J.; Yamazaki, D.; Andreadis, K. Characterization of terrestrial water dynamics in the Congo Basin using GRACE and satellite radar altimetry. Remote Sens. Environ. 2011, 115, 3530–3538. [Google Scholar] [CrossRef]
- Tiner, R.W.; Lang, M.W.; Klemas, V.V. Remote Sensing of Wetlands; CRC Press: Boca Raton, FL, USA, 2015. [Google Scholar]
- Wilen, B.O.; Bates, M.K. The US Fish and Wildlife Service’s National Wetlands Inventory project. Vegetation 1995, 118, 153–169. [Google Scholar] [CrossRef]
- Yang, X. Remote sensing and GIS applications for estuarine ecosystem anaysis: An overview. Int. J. Remote Sens. 2005, 26, 5347–5356. [Google Scholar] [CrossRef]
- Hardisky, M.A.; Gross, M.F.; Klemas, V. Remote sensing of coastal wetlands. Bioscience 1986, 36, 453–460. [Google Scholar] [CrossRef]
- U.S. Department of Agriculture, Farm Service Agency. NAIP Imagery. Available online: http://www.fsa.usda.gov/programs-and-services/aerial-photography/imagery-programs/naip-imagery/index (accessed on 7 November 2015).
- Carle, M.V.; Wang, L.; Sasser, C.E. Mapping freshwater marsh species distributions using WorldView-2 high-resolution multispectral satellite imagery. Int. J. Remote Sens. 2015, 35, 4698–4716. [Google Scholar] [CrossRef]
- Laba, M.; Downs, R.; Smith, S.; Welsh, S.; Neider, C.; White, S.; Richmond, M.; Philpot, W.; Baveye, P. Mapping invasive wetland plants in the Hudson River National Estuarine Research Reserve using QuickBird satellite imager. Remote Sens. Environ. 2008, 112, 286–300. [Google Scholar] [CrossRef]
- Hu, Y.; Huang, J.; Du, Y.; Han, P.; Huang, W. Monitoring spatial and temporal dynamics of flood regimes and their relation to wetland landscape patterns in Dongting Lake from MODIS time-series imagery. Remote Sens. 2015, 7, 7494–7520. [Google Scholar] [CrossRef]
- Ozesmi, S.L.; Bauer, M.E. Satellite remote sensing of wetlands. Wetl. Ecol. Manag. 2002, 10, 381–402. [Google Scholar] [CrossRef]
- Klemas, V. Airborne remote sensing of coastal features and processes: An overview. J. Coast. Res. 2012, 29, 239–255. [Google Scholar] [CrossRef]
- Millennium Ecosystem Assessment. Appendix B. Assessment report tables of contents. In Ecosystems and Human Well-Being: Wetlands and Water—Synthesis; World Resources Institute: Washington, DC, USA, 2005; p. 68. [Google Scholar]
- Gallant, A.L.; Klaver, R.W.; Casper, G.S.; Lannoo, M.J. Global rates of habitat loss and implications for amphibian conservation. Copeia 2007, 2007, 967–979. [Google Scholar] [CrossRef]
- Kim, D.-H.; Sexton, J.O.; Townshend, J.R. Accelerated deforestation in the humid tropics from the 1990s to the 2000s. Geophys. Res. Lett. 2015, 42, 3495–3501. [Google Scholar] [CrossRef]
- McCauley, L.A.; Anteau, M.J.; van der Burg, M.P.; Wiltermuth, M.T. Land use and wetland drainage affect water levels and dynamics of remaining wetlands. Ecosphere 2015, 6, 1–22. [Google Scholar] [CrossRef]
- Ogden, J.C.; Davis, S.M.; Barnes, T.K.; Jacobs, K.J.; Gentile, J.H. Total system conceptual ecological model. Wetlands 2005, 25, 955–979. [Google Scholar] [CrossRef]
- Van Asselen, S.; Verburg, P.H.; Vermaat, J.E.; Janse, J.H. Drivers of wetland conversion: A global meta-analysis. PLoS ONE 2013, 8, e81292. [Google Scholar] [CrossRef] [PubMed]
- Cleland, J. World population growth; Past, present and future. Environ. Resour. Econ. 2013, 55, 543–554. [Google Scholar] [CrossRef]
- Diffenbaugh, N.S.; Field, C.B. Changes in ecologically critical terrestrial climate conditions. Science 2013, 341, 486–492. [Google Scholar] [CrossRef] [PubMed]
- Special Issue: Towards Remote Long-Term Monitoring of Wetland Landscapes. Available online: https://www.mdpi.com/journal/remotesensing/special_issues/wetland-landscapes (accessed on 4 August 2015).
- Moffett, K.B.; Nardin, W.; Silvestri, S.; Qang, C.; Temmerman, S. Multiple stable states and catastrophic shifts in coastal wetlands: Progress, challenges, and opportunities in validating theory using remote sensing and other methods. Remote Sens. 2015, 7, 10184–10226. [Google Scholar] [CrossRef]
- National Aeronautics and Space Administration. MEaSUREs Projects. Available online: https://earthdata.nasa.gov/community/community-data-system-programs/measures-projects (accessed on 4 August 2015).
- National Aeronautics and Space Administration, Jet Propulsion Laboratory. Wetlands—Global Monitoring of Wetland Extent and Dynamics. Available online: http://wetlands.jpl.nasa.gov/index.html (accessed on 4 August 2015).
- Chapman, B.; McDonald, K.; Shimada, M.; Rosenqvist, A.; Schroeder, R.; Hess, L. Mapping regional inundation with spaceborne L-band SAR. Remote Sens. 2015, 7, 5440–5470. [Google Scholar] [CrossRef]
- Global Land Cover Facility. Shuttle Radar Topography Mission (SRTM). Available online: http://glcf.umd.edu/data/srtm (accessed on 4 August 2015).
- Clewley, D.; Whitcomb, J.; Moghaddam, M.; McDonald, K.; Chapman, B.; Bunting, P. Evaluation of ALOS PALSAR data for high-resolution mapping of vegetated wetlands in Alaska. Remote Sens. 2015, 7, 7272–7297. [Google Scholar] [CrossRef]
- University of Alaska-Fairbanks, Alaska Satellite Facility. Wetlands through Remote Sensing. Available online: https://www.asf.alaska.edu/wetlands (accessed on 4 August 2015).
- U.S. Geological Survey. Landsat Processing Details. Available online: http://landsat.usgs.gov/Landsat_Processing_Details.php (accessed on 4 August 2015).
- Jones, J.W. Efficient wetland surface water detection and monitoring via Landsat: Comparison with in situ data from the Everglades Depth Estimation Network. Remote Sens. 2015, in press. [Google Scholar]
- Bourgeau-Chavez, L.; Endres, S.; Battaglia, M.; Miller, M.E.; Banda, E.; Laubach, Z.; Higman, P.; Chow-Fraser, P.; Marcaccio, J. Development of a bi-national Great Lakes coastal wetland and land use map using three-season PALSAR and Landsat imagery. Remote Sens. 2015, 7, 8655–8682. [Google Scholar] [CrossRef]
- Frappart, F.; Papa, F.; Malbeteau, Y.; Leon, J.G.; Ramillien, G.; Prigent, C.; Seoane, L.; Seyler, F.; Calmant, S. Surface freshwater storage variations in the Orinoco floodplains using multi-satellite observations. Remote Sens. 2015, 7, 89–110. [Google Scholar] [CrossRef]
- Amler, E.; Schmidt, M.; Menz, G. Definitions and mapping of East African wetlands: A review. Remote Sens. 2015, 7, 5256–5282. [Google Scholar] [CrossRef]
- Lane, C.R.; Liu, H.; Autrey, B.C.; Anenkhonov, O.A.; Chepinoga, V.V.; Wu, Q. Improved wetland classification using eight-band high resolution satellite imagery and a hybrid approach. Remote Sens. 2014, 6, 12187–12216. [Google Scholar] [CrossRef]
- Luo, J.; Ma, R.; Duan, H.; Hu, W.; Zhu, J.; Huang, W.; Lin, C. A new method for modifying thresholds in the classification of tree models for mapping aquatic vegetation in Taihu Lake with satellite images. Remote Sens. 2014, 6, 7442–7462. [Google Scholar] [CrossRef]
- Blakey, T.; Melesse, A.; Hall, M.O. Supervised classification of benthic reflectance in shallow subtropical water using a generalized pixel-based classifier across a time series. Remote Sens. 2015, 7, 5098–5116. [Google Scholar] [CrossRef]
- Ceron, C.N.; Melesse, A.M.; Price, R.; Dessu, S.B.; Kandel, H.P. Operational actual wetland evapotranspiration estimation for South Florida using MODIS imagery. Remote Sens. 2015, 7, 3613–3632. [Google Scholar] [CrossRef]
- Wu, Q.; Lane, C.; Liu, H. An effective method for detecting potential woodland vernal pools using high-resolution lidar data and aerial imagery. Remote Sens. 2014, 6, 11444–11467. [Google Scholar] [CrossRef]
- Medeiros, S.; Hagen, S.; Weishampel, J.; Angelo, J. Adjusting lidar-derived digital terrain models in coastal marshes based on estimated aboveground biomass density. Remote Sens. 2015, 7, 3507–3525. [Google Scholar] [CrossRef]
- White, L.; Brisco, B.; Dabboor, M.; Schmitt, A.; Pratt, A. A collection of SAR methodologies for monitoring wetlands. Remote Sens. 2015, 7, 7615–7645. [Google Scholar] [CrossRef]
- Chen, Y.; He, X.; Wang, J.; Xiao, R. The influence of polarimetric parameters and an object-based approach on land cover classification in coastal wetlands. Remote Sens. 2014, 6, 12575–12592. [Google Scholar] [CrossRef]
- Hong, S.-H.; Kim, H.-O.; Wdowinski, S.; Feliciano, E. Evaluation of polarimetric SAR decomposition for classifying wetland vegetation types. Remote Sens. 2015, 7, 8563–8585. [Google Scholar] [CrossRef]
- Breiman, L. Random Forests. Mach. Learn. 2001, 45, 5–32. [Google Scholar] [CrossRef]
- Corcoran, J.; Knight, J.; Pelletier, K.; Rampi, L.; Wang, Y. The effects of point or polygon based training data on randomForest classification accuracy of wetlands. Remote Sens. 2015, 7, 4002–4025. [Google Scholar] [CrossRef]
- Millard, K.; Richardson, M. On the importance of training data sample selection in Random Forest image classification: A case study in peatland ecosystem mapping. Remote Sens. 2015, 7, 8489–8515. [Google Scholar] [CrossRef]
© 2015 by the authors; licensee MDPI, Basel, Switzerland. This article is an open access article distributed under the terms and conditions of the Creative Commons Attribution license (http://creativecommons.org/licenses/by/4.0/).
Share and Cite
MDPI and ACS Style
Gallant, A.L. The Challenges of Remote Monitoring of Wetlands. Remote Sens. 2015, 7, 10938-10950. https://doi.org/10.3390/rs70810938
AMA Style
Gallant AL. The Challenges of Remote Monitoring of Wetlands. Remote Sensing. 2015; 7(8):10938-10950. https://doi.org/10.3390/rs70810938
Chicago/Turabian StyleGallant, Alisa L. 2015. "The Challenges of Remote Monitoring of Wetlands" Remote Sensing 7, no. 8: 10938-10950. https://doi.org/10.3390/rs70810938