
Caveats Concerning the Use of SRTM DEM Version 4.1 (CGIAR-CSI)

Sarmap SA, 6989 Purasca, Switzerland
Remote Sens. 2016, 8(10), 793; https://doi.org/10.3390/rs8100793
Submission received: 12 August 2016
/
Revised: 13 September 2016
/
Accepted: 20 September 2016
/
Published: 24 September 2016
Abstract
:This paper provides some recommendations concerning the use of version 4.1 of the near-global 3 arcsec Shuttle Radar Topography Mission (SRTM) Digital Elevation Model (DEM) distributed by the Consortium for Spatial Information (CGIAR-CSI). This product is considered by most users to be a void-filled version of the finished grade NASA SRTM DEM. However, in non-void areas, these DEMs can exhibit relative geolocation shifts and spatially correlated elevation differences up to tens of meters, the location and extent of which depends on the geographical location and on the download mirror of the version 4.1 product. Such differences are found to be partly due to changes introduced by NASA SRTM version 2.1, with respect to NASA SRTM version 2.0, on which CGIAR-CSI version 4.1 is based, and partly to processing and/or annotation errors affecting the CGIAR-CSI version 4.1 DEMs.
1. Introduction
For over a decade, the near-global Digital Elevation Model (DEM) derived from the Shuttle Radar Topography Mission (SRTM) [1] has been exploited for a broad range of applications, including, hydrology, geomorphology, volcanology, seismology, glaciology and forest ecology [2,3]. This study itself stems from an application, namely Differential Synthetic Aperture Radar Interferometry (DInSAR), in which a DEM is used to separate the contribution of topography from that of surface deformation due to a variety of geophysical phenomena [4].
Several SRTM DEM versions have been distributed by different public and private providers, featuring refinements of the original “unfinished” DEM released by NASA JPL [5]. In particular, version 4.1 of the 3 arcsec DEM distributed by CGIAR-CSI [6] and version 2.1 distributed by NASA [7], have been the most up-to-date near-global SRTM products since their release in 2008 and 2009 respectively, until the recent availability of the NASA SRTM version 3.0 DEMs in 2015 [8]. Furthermore, versions 4.1 and 2.1 are among the few near-global DEMs, which can be accessed simply through an FTP or HTTP URL, without interacting with a graphical selection/download API, and without any restriction on the number of tiles, which can be downloaded. These features simplify data access, in particular for large-scale data analysis, and allow applications to create DEMs by automatically downloading and subsequently cutting/merging the relevant SRTM tiles.
This paper describes a global inter-comparison of SRTM DEM versions 4.1 (CGIAR-CSI) and 2.1 (NASA), which results in a set of caveats concerning the use of the SRTM version 4.1 products. Section 2 provides the necessary background information on the evolution of the SRTM DEMs and on their relevant properties. The methods used to carry out the inter-comparison are described in Section 3, and the results are detailed in Section 4. Finally conclusions and recommendations are presented in Section 5.
2. SRTM DEM Products
2.1. NASA/NGA SRTM Versions
The NASA SRTM products result from the joint effort of NASA JPL and of the National Geospatial-Intelligence Agency (NGA) [8]. The first near-global SRTM DEMs were released by JPL between 2003 and 2004, and are referred to as the “unfinished” version 1.0 products. These included a 1 arcsec DEM (NASA SRTM-1), publicly released for the contiguous United States area (CONUS), and a 3 arcsec product (NASA SRTM-3), generated by 3 × 3 pixels averaging of the SRTM-1 DEM, and covering the rest of the world between latitudes 56°S and about 60°N.
NGA contractors carried out an editing of NASA SRTM-1, which involved mainly identification, delineation and height determination of coastlines and water bodies exceeding specified sizes, as well as the removal of single-pixel outliers, and the filling of small voids [9]. The outcome was a “finished” DEM, compliant with the Digital Terrain Elevation Data (DTED®) Level 2 standard [10], and referred to as DTED-2 in the following. The DTED-2 product was sampled at a 1 arcsec posting in latitude and longitude, between latitudes 50°S and 50°N, and at a 2 arcsec posting below 50°S and above 50°N. From the DTED-2 DEM, a “finished” DTED® Level 1 DEM (DTED-1 in the following) was also generated, by sub-sampling the DTED-2 at even 3 arcsec intervals in latitude and longitude. The DTED-1 and DTED-2 DEMs were then returned to NASA for public distribution through the USGS EROS Data Center and through the USGS/NASA Land Process Distributed Active Archive Center (LP DAAC), via the USGS EROS FTP server [11]. Each distributor converted the DTED products to non-proprietary data formats, and over the course of 2005 publicly released their version 2.0 “finished” products, resampled to a uniform 1 arcsec grid for CONUS, and to a 3 arcsec grid for all land-masses between latitudes 56°S and about 60°N. The 3 arcsec version 2.0 products distributed by USGS EROS and LP DAAC differed, since the former was created by sub-sampling of the DTED-2 DEM and the latter by 3 × 3 pixels averaging [12]. At a later stage, both of these “finished” products were also made available through the Global Land Cover Facility [13], together with an interpolated void-filled product. An independent void-filled product, not publicly available, was also generated by NGA [14], using data from commercial and non-commercial sources.
In 2009 NASA JPL released version 2.1 of its 3 arcsec DEM, by “averaging the full-resolution edited data” to correct some “occasional artifacts” of version 2.0, in particular a slight vertical banding above latitude 50°N and below latitude 50°S [12]. This DEM is currently available from the USGS EROS FTP server [7].
The latest NASA SRTM products, publicly released during 2015, are version 3.0 (a.k.a. SRTM Plus), and include a near-global 1 arcsec product and two 3 arcsec datasets, created respectively by sub-sampling and by averaging of the 1 arcsec product. The averaged 3 arcsec DEM is identical to NASA version 2.1 in non-void areas. The latter, however, were filled in the version 3.0 products, using non-commercial DEMs, such as the ASTER GDEM version 2.
2.2. CGIAR-CSI SRTM Versions
Since 2004, CGIAR-CSI has made several void-filled 3 arcsec DEM products available, based on the NASA SRTM DEMs. The version numbering of these is independent from the one followed by NASA [6]. In particular, from version 3.0 onwards, the CGIAR-CSI products are based on the 3 arcsec “finished” NASA version 2.0 DEM product, distributed by the LP DAAC via the USGS EROS FTP server until summer 2009, when it was replaced by NASA version 2.1 [7]. As detailed in the previous sub-section, the LP DAAC NASA version 2.0 DEM was obtained by pixel averaging, rather than by sub-sampling, of the corresponding 1 arcsec product.
The latest (and only) currently available CGIAR-CSI SRTM product is version 4.1, which was released in August 2008 [6]. Void-filling of NASA version 2.0 was carried out using the techniques described in [15]. This product is available from the CGIAR-CSI server [6], as well as from several mirror sites. At the time of writing, the active mirrors include Harvest Choice [16] and GISLAB [17], although in the past also other mirrors have been available, including King’s College (UK), TelaScience (USA), and the Joint Research Centre—European Soil Data Centre (JRC-ESDAC). In particular, the latter was accessible through [18] when this study was carried out and could therefore be included in the analysis. The same results presented in the following for the Harvest Choice mirror apply also to the version 4.1 product formerly distributed through JRC-ESDAC.
2.3. Expected Differences between NASA and CGIAR-CSI SRTM Products
Few previous studies have inter-compared the CGIAR-CSI and the NASA SRTM products. In [19] a comparison of several SRTM versions was carried out over northern Greece, including NASA version 2.0 and CGIAR-CSI version 4.1 (referred to as version 4 in [19]). Versions 2.0 and 4.1 were found to be numerically identical in non-void areas. In [20] a comparison of freely available DEMs over the whole Australian territory, highlighted a relative geolocation shift of 1 pixel between latitudes 30.01°S and 29°S, when comparing NASA SRTM version 2.1 and CGIAR-CSI version 4.1 (downloaded from [6]), as well as an overall elevation difference RMS of 1.2 m, including the latitude band affected by the geolocation shift. Outside this area, the differences between the two SRTM versions were found to be small but not identically zero and correlated with the spatial distribution of NASA SRTM version 2.0 voids (cfr. Figure 3B in [20] and Figure 1 in [15]).
Based on the product annotations, some differences with respect to the NASA version 2.1 DEM are also expected between the various CGIAR-CSI version 4.1 providers. The DEM available from the CGIAR-CSI server [6], and hereafter referred to as SRTM-CGIAR-v4.1, is distributed in 5° longitude × 5° latitude tiles. According to the data annotations, each tile covers the same area as that of 25 corresponding 1° × 1° tiles of the NASA version 2.1 product (hereafter referred to as SRTM-NASA-v2.1). For instance, if we consider tile 38_03 of the SRTM-CGIAR-v4.1 DEM, the geographical coordinates of its top-left pixel are (4.999583°E, 50.000417°N), according to the GeoTIFF annotations (“Model Tiepoint” tag), and these refer to the top-left corner of the pixel area (since a “PixelIsArea” raster space is specified), implying that the coordinates of the top-left pixel center are (5°E, 50°N). The latter are the same as the top-left pixel center coordinates of SRTM-NASA-v2.1 tile N49E005 [12]. Thus, for every SRTM-NASA-v2.1 tile within the coverage of a 5° × 5° SRTM-CGIAR-v4.1 product, a 1° × 1° Sub-tile with exactly the same coverage can be extracted from the latter without any resampling.
In principle, the same considerations should apply for the products distributed by each CGIAR-CSI DEM mirror, since these should be identical to the DEM available through the CGIAR-CSI server [6]. However, this is currently not the case. If we consider once again tile 38_03, downloaded this time through the Harvest Choice mirror (hereafter referred to as SRTM-HC-v4.1) [16], the GeoTIFF annotations (“Model Tiepoint” tag) state that the top-left pixel has geographical coordinates (5°E, 50°N), and these refer to the top-left corner of the pixel area (since “PixelIsArea” raster space is specified), implying that the coordinates of the top-left pixel center are (5.000417°E, 49.999583°N). Thus, for a given SRTM-NASA-v2.1 tile, it should not be possible to extract a corresponding 1° × 1° SRTM-HC-v4.1 sub-tile without resampling, since the SRTM-HC-v4.1 product should be shifted by half a pixel (1.5 arcsec) southwards and eastwards with respect to the SRTM-NASA-v2.1 product. Furthermore, all 5° × 5° SRTM-HC-v4.1 tiles have 6000 rows and 6000 columns, whereas the corresponding tiles available through the CGIAR-CSI server have 6001 rows and 6001 columns. As previously mentioned, the same considerations which apply to the Harvest Choice mirror can be extended to the formerly active JRC mirror [18], whereas, as detailed in Section 4, the GISLAB mirror [17] currently distributes a product (hereafter referred to as SRTM-GISLAB-v4.1), which consists partly of SRTM-CGIAR-v4.1 tiles and partly of SRTM-HC-v4.1 tiles.
3. Methods
For each SRTM-NASA-v2.1 tile and each available CGIAR-CSI provider, the corresponding SRTM-v4.1 sub-tile (1° × 1°) was extracted, assuming the top-left coordinates of the original 5° × 5° SRTM-v4.1 tile to be aligned with those of the corresponding SRTM-NASA-v2.1 tile. As discussed in Section 2.3, this assumption is consistent with the data annotations of the SRTM-CGIAR-v4.1 product, whereas the SRTM-HC-v4.1 (and formerly also the JRC) product would be expected to be misaligned by half a pixel (1.5 arcsec) in latitude and longitude. The same applies to the fraction of SRTM-GISLAB-v4.1 tiles, which are identical to the SRTM-HC-v4.1 product. This assumption is equivalent to assuming the SRTM-CGIAR-v4.1 annotations to apply even to the SRTM-HC-v4.1 and SRTM-GISLAB-v4.1 products. As shown in the following, this approach allows a product inter-comparison to be carried out without any resampling.
The possibility of a relative 1-pixel geolocation shift in longitude and/or latitude between each SRTM-NASA-v2.1 tile and its corresponding SRTM-v4.1 1° × 1° Sub-tile was tested, by applying each of the nine possible 1-pixel shifts in turn to the SRTM-v4.1 sub-tile. The two-dimensional shift minimizing the number of non-zero elevation differences was estimated. In fact, it is anticipated here that, regardless of the CGIAR-CSI download mirror, and under the aforementioned assumption, it is always possible to find a two-dimensional 1-pixel shift, for which a significant percentage of the pixels in the shifted SRTM-v4.1 sub-tile are numerically identical to those of the corresponding SRTM-NASA-v2.1 tile, so that an optimal 2D shift can easily be identified.
The height differences between each optimally-shifted SRTM-v4.1 sub-tile and the corresponding SRTM-NASA-v2.1 tile were then analyzed by computing the following parameters: the percentage of pixels with a not-a-number (NaN) value in at least one of the two DEMs, the percentage of pixels with a non-zero elevation difference, and the mean and standard deviation of the elevation differences, as well as their minimum and maximum values.
4. Results
4.1. SRTM Product Inter-Comparison
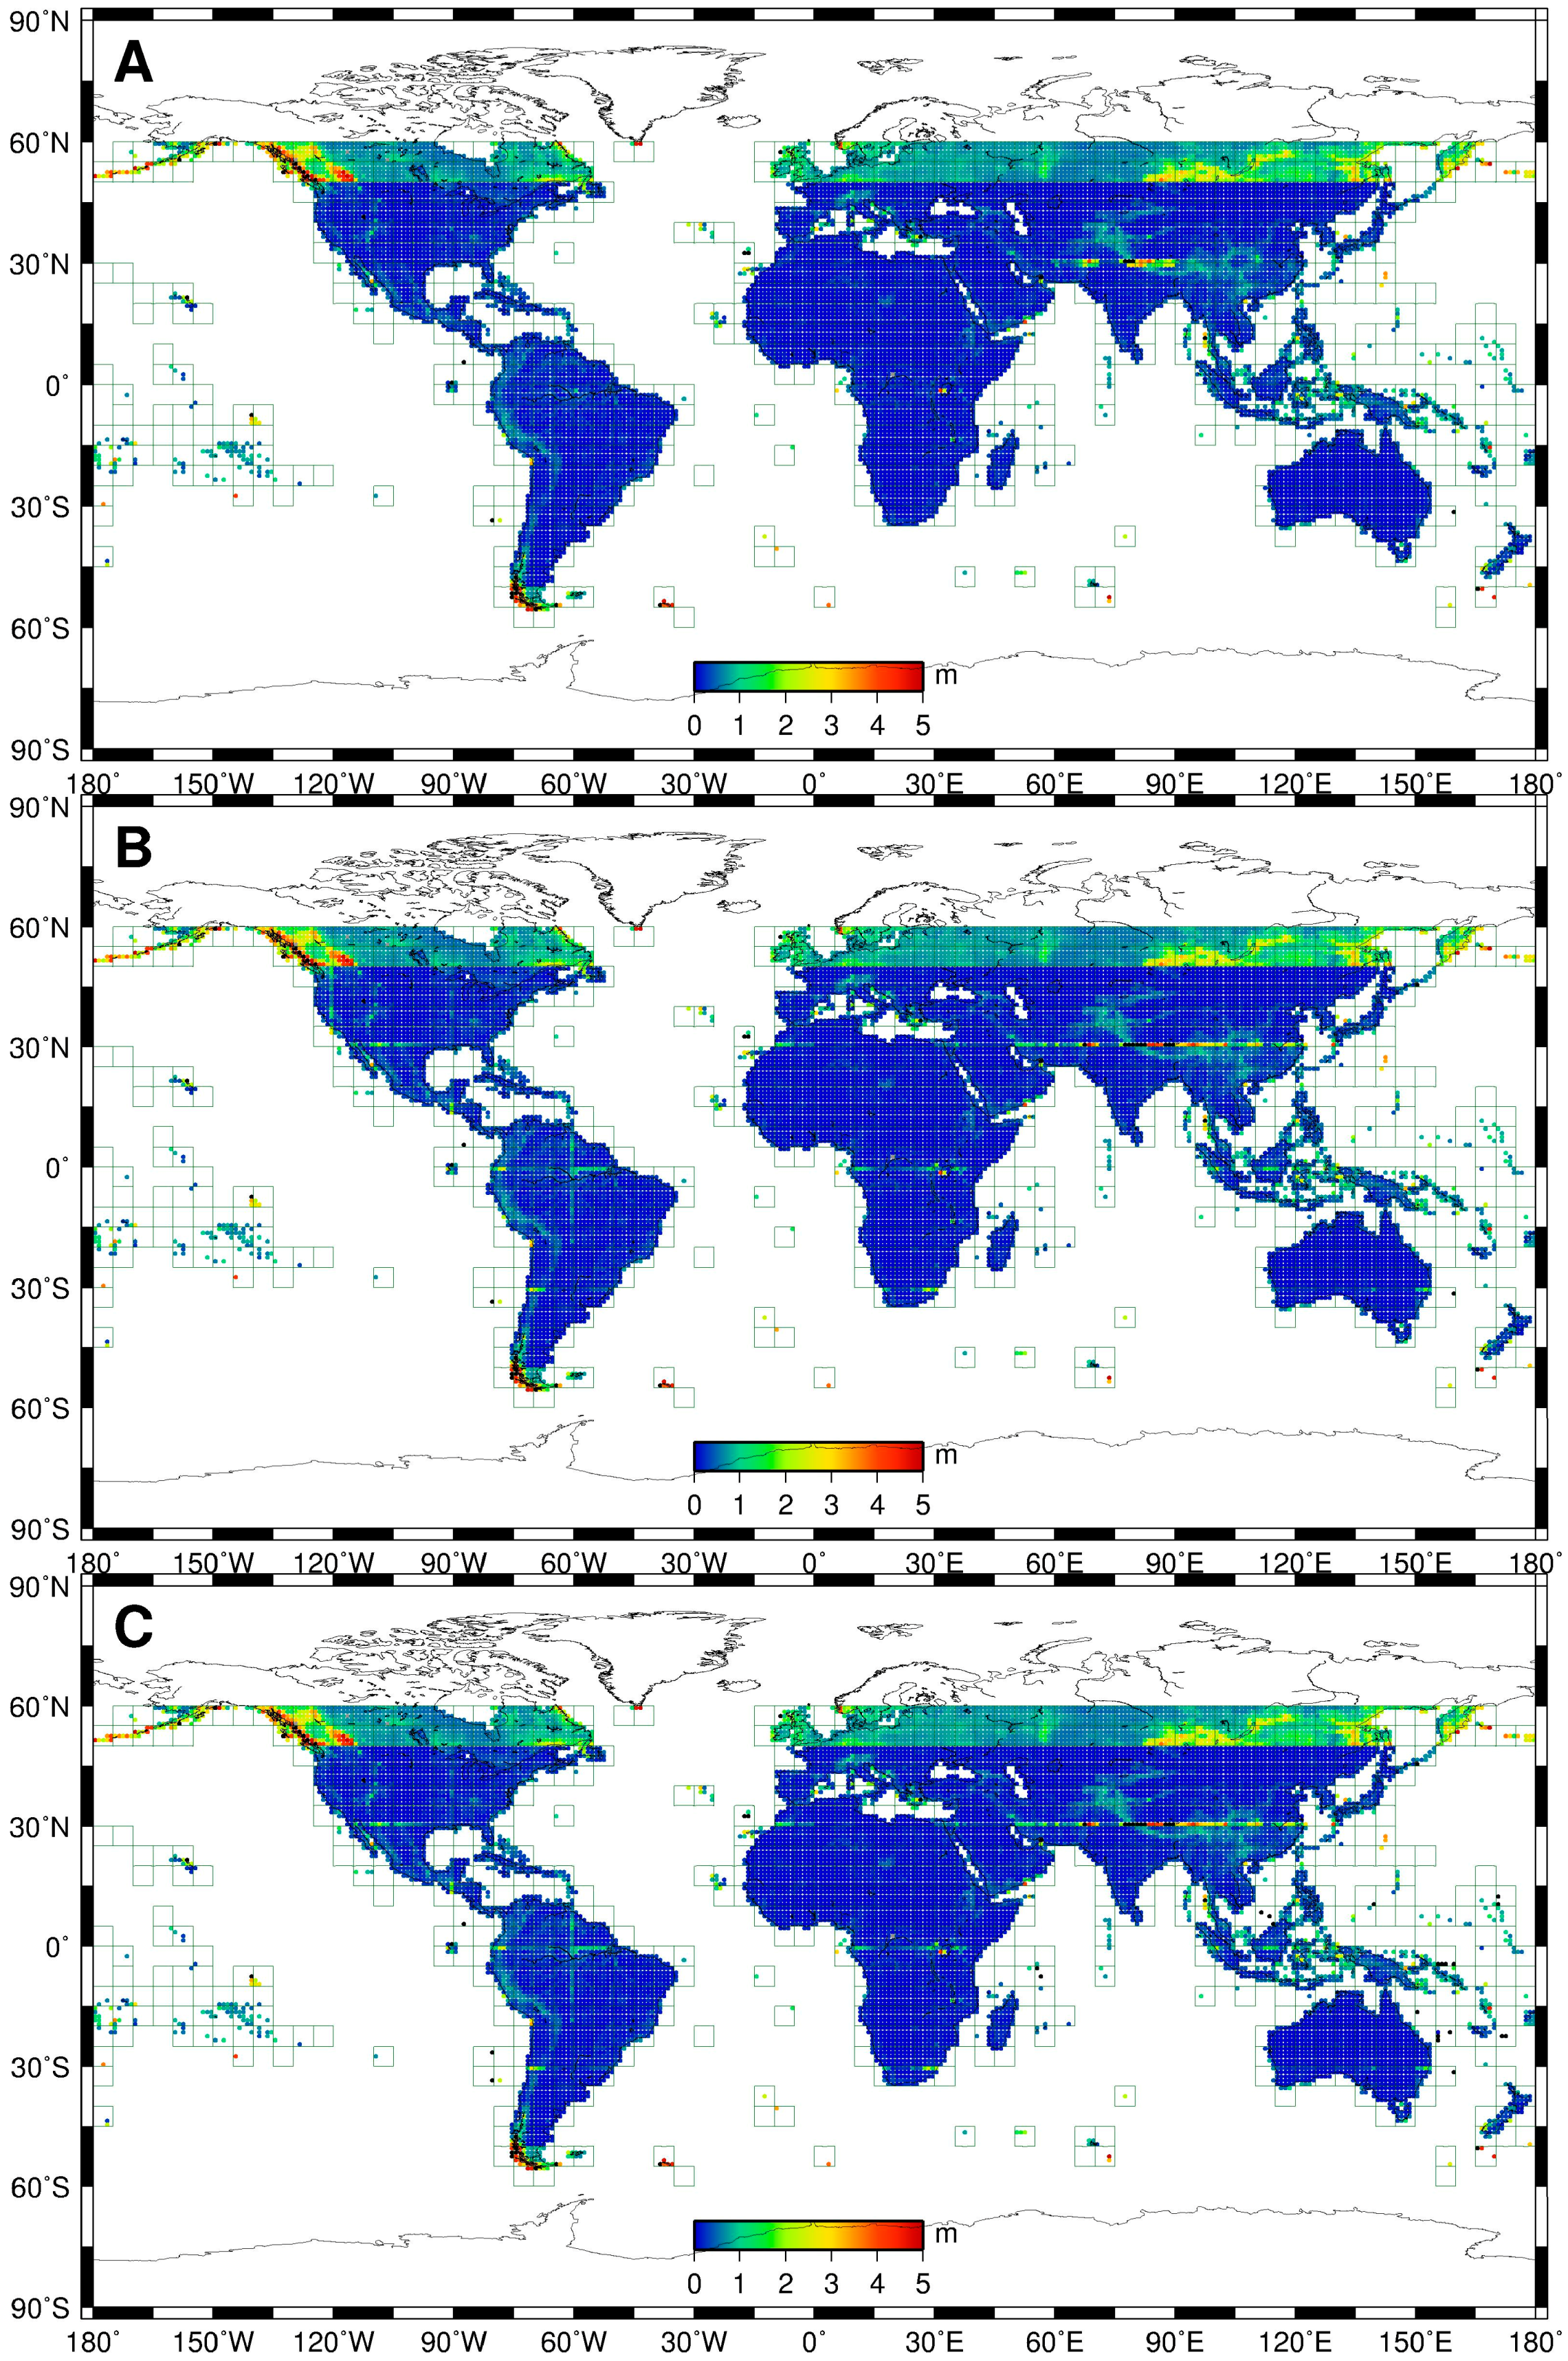
For each of the CGIAR-CSI SRTM-v4.1 DEM providers analyzed, Figure 1 shows global maps of the 1-pixel geolocation shifts which, once applied to 1° × 1° Sub-tiles of the version 4.1 DEMs, minimize the differences with the corresponding SRTM-NASA-v2.1 products. Only tiles containing at least 0.1% of valid pixels were considered. The results for the JRC mirror are identical to that of the Harvest Choice one (Figure 1B), and are omitted. Due to the fact that the SRTM-CGIAR-v4.1 coordinate annotations were assumed for all SRTM-v4.1 providers, whereas these actually differ in the way described in Section 2.3, the correspondence between the shifts shown in Figure 1 and the actual geolocation differences depends on the provider, as detailed below.
For the SRTM-CGIAR-v4.1 product (Figure 1A), the observed shifts have a one-to-one correspondence with the relative geolocation errors with respect to the SRTM-NASA-v2.1 DEM. Thus, the sub-tiles shown in cyan in Figure 1A correspond to a null geolocation difference, whereas for the points shown in purple, if we temporarily attribute geolocation errors only to the SRTM-v4.1 products, the top-left pixel coordinates of the sub-tile would require a northward shift by 1 pixel (3 arcsec) to minimize the differences with the SRTM-NASA-v2.1 DEM.
For the SRTM-HC-v4.1 products (and the formerly available JRC ones), a null shift in Figure 1B (marked in cyan) actually implies that the top-left coordinates of the sub-tile should be shifted northwards and westwards by 0.5 pixels (1.5 arcsec), since this is the shift required to convert the annotated coordinates of the SRTM-HC-v4.1 product to the ones of the corresponding SRTM-CGIAR-v4.1 product, which were assumed for shift calculation. Likewise, a 1-pixel southward shift in Figure 1B (marked in orange) implies that the SRTM-HC-v4.1 sub-tile’s top-left coordinate would need to be shifted southwards and westwards by 0.5 pixels, whereas a 1-pixel northward shift (purple in Figure 1B) would require the sub-tile’s top-left coordinate to be shifted northwards by 1.5 pixels and westwards by 0.5 pixels.
Figure 1 shows that the analyzed SRTM-v4.1 products, which should be mirrors of each other, actually show spatially-variable geolocation differences. For the SRTM-CGIAR-v4.1 DEM, these are confined roughly between latitudes 30°N and 31°N, and longitudes 60°E and 90°E (purple in Figure 1A). More precisely, these differences affect the last 1159 lines of SRTM-CGIAR-v4.1 tiles 49_06 through 54_06, and the first 42 lines of tiles 49_07 through 54_07. For the SRTM-HC-v4.1 product, as well as for the formerly available JRC one (Figure 1B), the vast majority of the tiles show a common geolocation shift, constant-latitude bands following a different behavior can be found as well. Interestingly over Australia and southern Tasmania, these bands correspond to those reported by [20]. Finally, the SRTM-GISLAB-v4.1 product is found to be identical to the SRTM-CGIAR-v4.1 product west of longitude 115°W and identical to the SRTM-HC-4.1 (and JRC) product elsewhere.
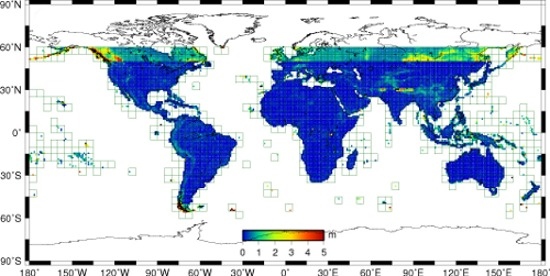
Once the shifts in Figure 1 are applied to the SRTM-v4.1 sub-tiles, the height difference standard deviations with respect to SRTM-NASA-v2.1 can be computed, as shown in Figure 2. Although most height differences are found to be identically zero, their standard deviation shows a correlation with latitude (above 50°N and below 50°S) and with the location of data voids in the original SRTM-NASA-v2.1 product, as detailed further in this section. NaNs in any of the two DEM products were discarded from the analysis, and thus do not directly influence the statistics shown in Figure 2. For the SRTM-v4.1 product some care is required due to the fact that the NaN value (GeoTIFF tag “42113”) is −32768 for most tiles, but for some the value 255 is used instead.
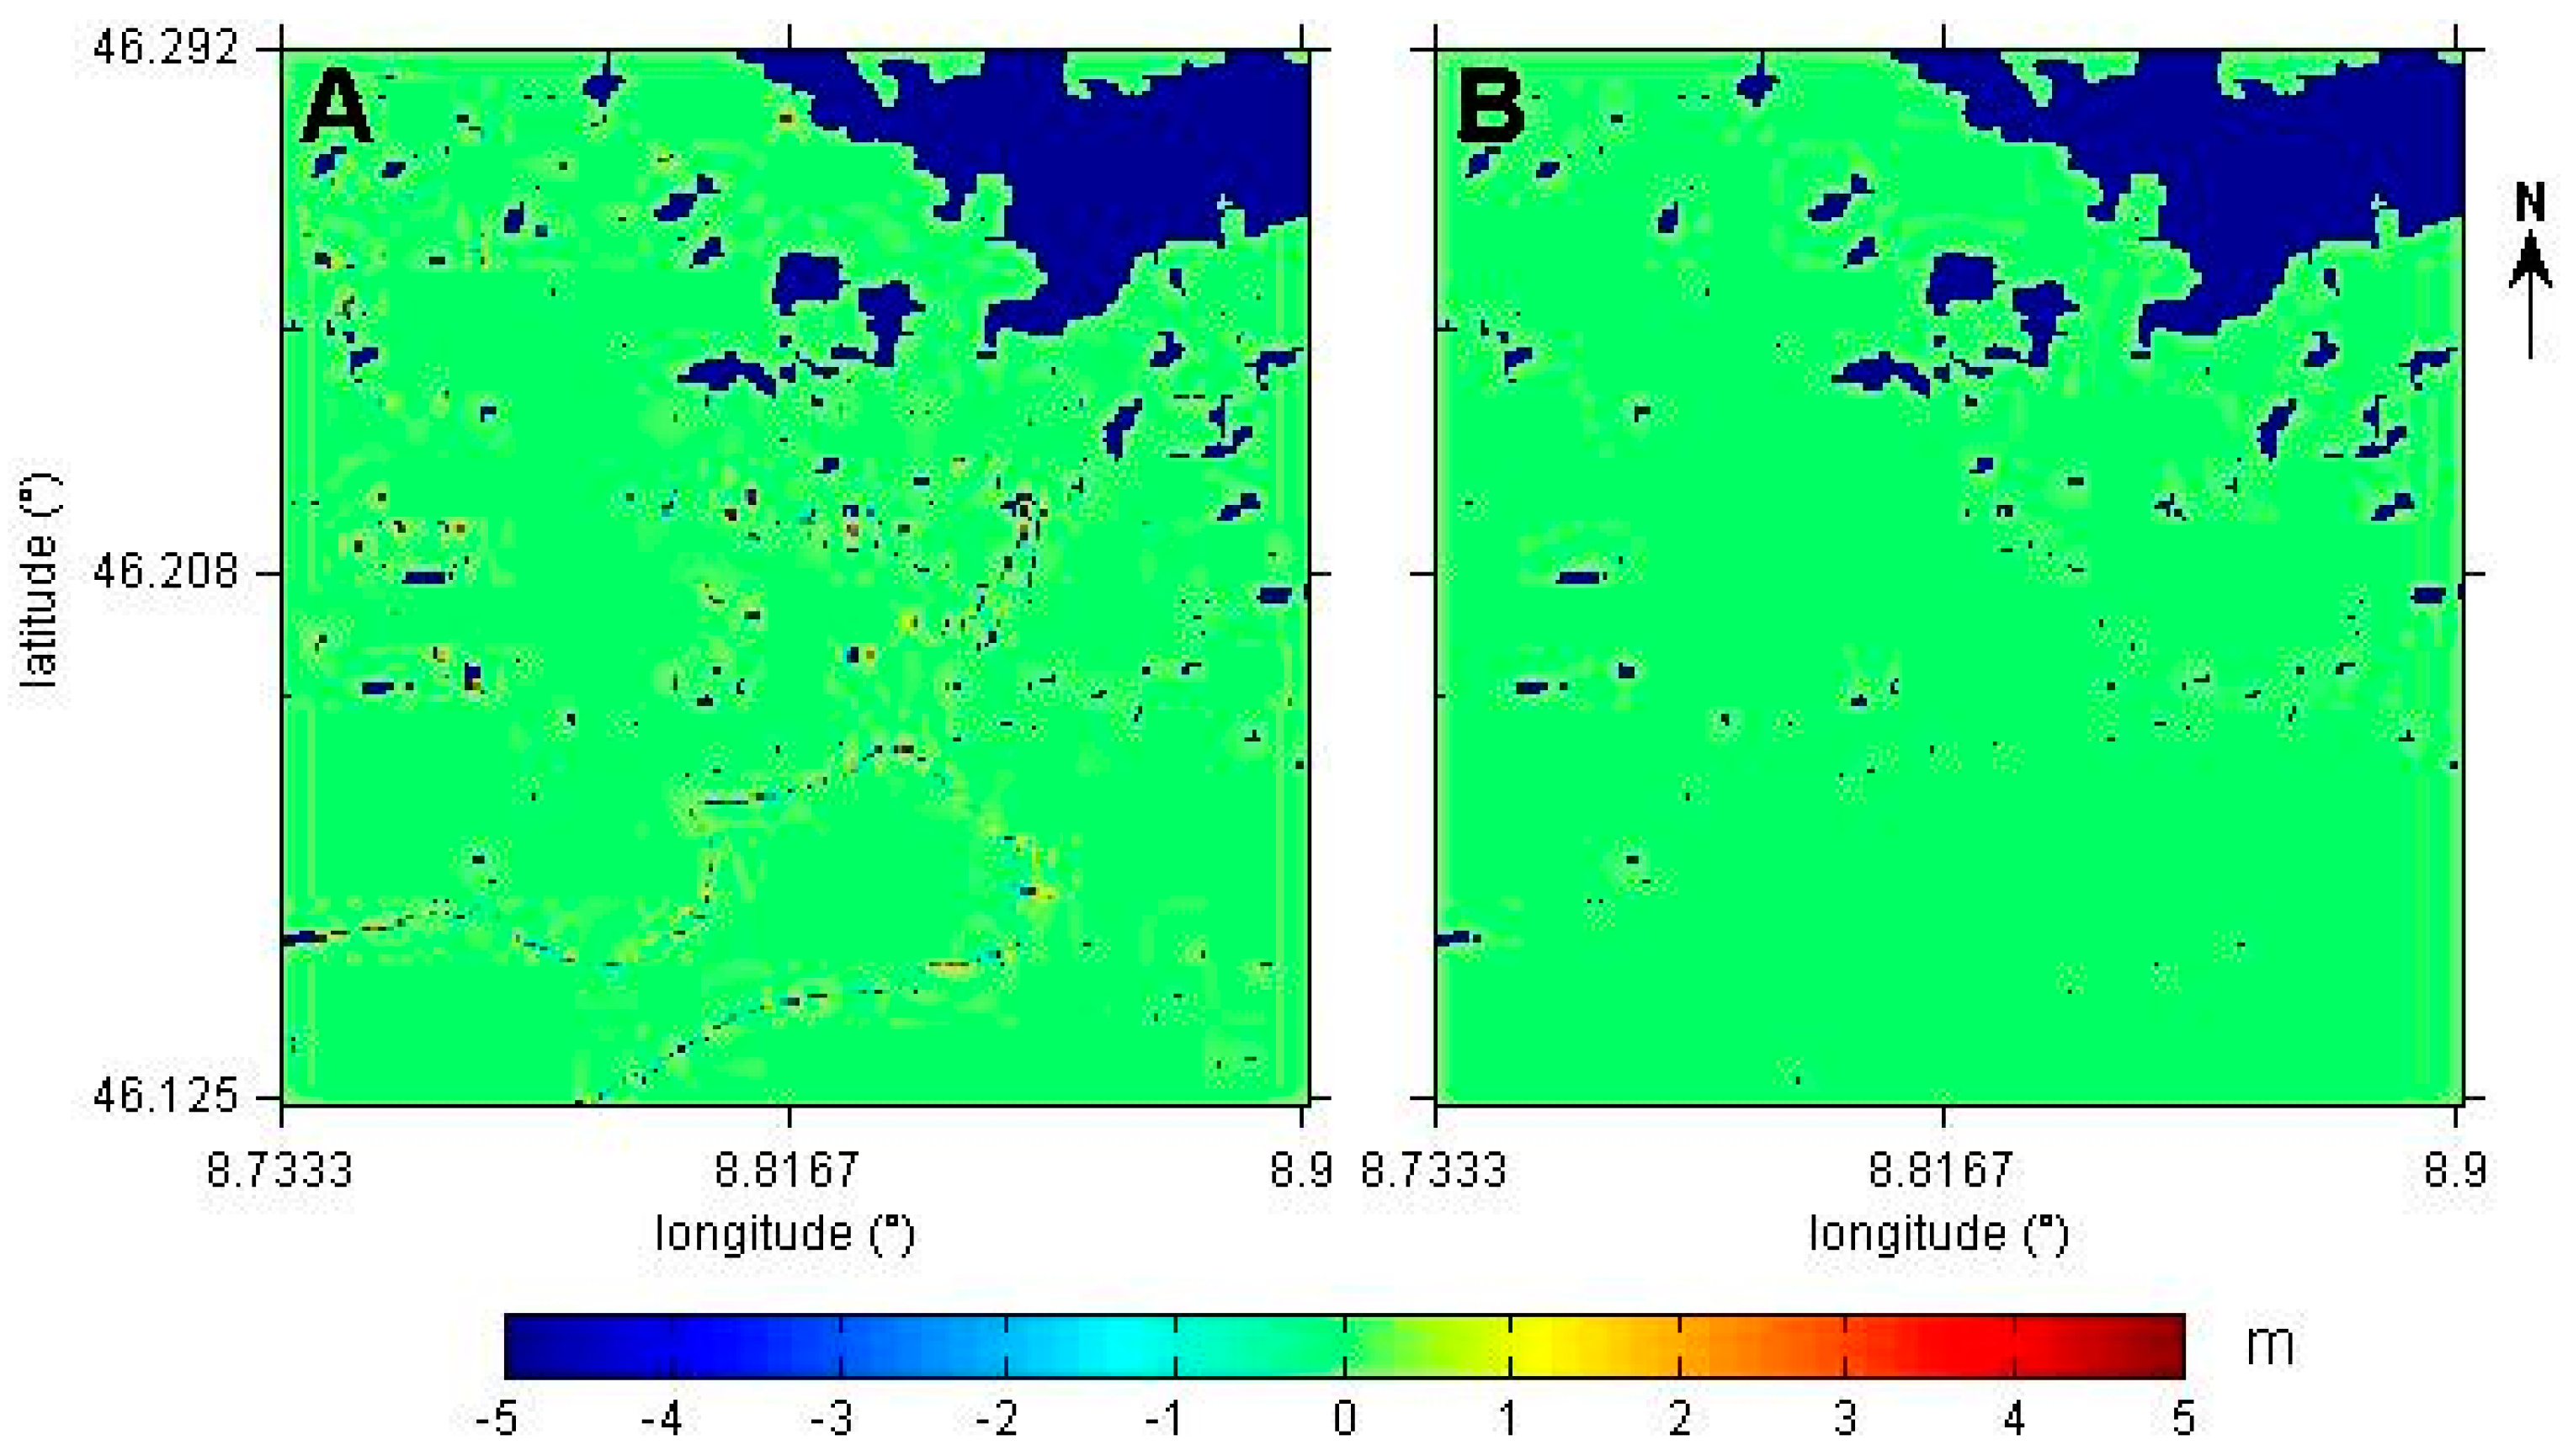
Based on Figure 1 and Figure 2, the elevation differences can be grouped into three categories. The first (Type I) applies to 1° × 1° SRTM-v4.1 sub-tiles located between latitudes 50°N and 50°S, for which a constant 2D geolocation shift with respect to the corresponding SRTM-v2.1 products is observed for all pixels within the sub-tile. Once this shift is applied, the height values are mostly identical to those of the SRTM-v2.1 product, albeit in the neighborhood of data voids. An example of a sub-tile falling in this category is shown in Figure 3, for which the optimal geolocation shift is null. On a global scale, most SRTM-v4.1 sub-tiles fall in this category, and are characterized by a low standard deviation of the elevation difference with respect to SRTM-NASA-v2.1, which is typically <1 m (Figure 2), although for single pixels such differences can reach tens of meters (Table 1, first column). As exemplified in Figure 4A, elevation differences occur in the neighborhood of data voids, which are typically found in high relief areas, deserts, and in regions including or bordering water-bodies (e.g., a lake in Figure 4A) [15].
The second difference category (Type II) applies to SRTM-v4.1 sub-tiles, for which the optimal geolocation shift is common to most but not all the pixels within the sub-tile. An example is shown in Figure 5B, for which an eastward and northward (dE,dN) shift of (0, 1) pixels respectively, causes most differences with the SRTM-v2.1 DEM to be zero, albeit for the first 42 rows, for which a (0, 0) shift would be required (as seen from Figure 5E). This feature causes the percentage of pixels with height values identical to the SRTM-v2.1 DEM to decrease and the height difference standard deviation to increase (Table 1, column 2). The global distribution of Type II SRTM-v4.1 sub-tiles can be inferred from the horizontal and vertical banding seen in Figure 2, between latitude 50°N and 50°S, which corresponds to the transition areas between sub-tiles exhibiting a different shift in Figure 1. In particular the vertical banding seen in Figure 2B for the SRTM-HC-v4.1 DEM, e.g., in South and North America for longitudes 60°W and 120°W, implies that even when the dominant geolocation shift shown in Figure 1B is (dE, dN) = (0, 0), this is not necessarily applicable to the whole SRTM-v4.1 sub-tile (i.e., situations like the one shown in Figure 4B,E, sometimes occur also at the east-west sub-tile boundaries).
The third difference category (Type III) applies to tiles above latitude 50°N and below latitude 50°S. For these, the SRTM-v4.1 and SRTM-v2.1 differences are mainly due to a vertical banding, partially also correlated with topography (e.g., Figure 6). Compared to Type I sub-tiles, the banding increases the height difference standard deviation, and significantly reduces the percentage of pixels with an identical height value (Table 1, column 3).
4.2. Causes of the Observed Elevation Differences
The elevation differences in the neighborhood of data voids are most likely due to a different handling of NaNs and edited water bodies, during the averaging of 1 arcsec heights for the generation of NASA SRTM versions 2.1 and 2.0, respectively. In fact, as shown in Figure 4B, these elevation differences are not present when comparing SRTM-CGIAR-v4.1 with SRTM-NASA-v2.0. This is consistent with the regional analysis carried out in [19], in which the NASA SRTM versions 2.0 and the SRTM-CGIAR-v4.1 DEMs are found to be numerically identical in 100% of the non-void areas. It would be hard to establish whether one DEM version is systematically better than the other in the neighborhood of data voids. However, due to their limited spatial extent and magnitude, this category of elevation differences is unlikely to have a significant impact for most user applications.
Concerning the geolocation shifts, similar errors to the ones observed in this study were previously reported for version 3.0 of the CGIAR-CSI DEM [19]. To confirm whether these shifts are due to errors in the SRTM-CGIAR_v4.1 DEM, a subset of the shifted sub-tiles in Figure 1A (shown in purple), namely corresponding to SRTM-NASA-v2.1 tiles N30E075, N30E076, N30E077, N30E078, and N30E079, were compared to the ASTER GDEM version 2.0 products (which follow the same naming convention). Both the SRTM-CGIAR_v4.1 and the ASTER GDEM products were resampled to the geometry of each SRTM-NASA-v2.1 tile, based on the coordinate annotations, using the SARscape® remote sensing software. The same method described in Section 3 was applied to determine the two-dimensional 1-pixel geolocation shift minimizing the difference between each DEM and the resampled ASTER GDEM tile. For each case, the optimal (dE, dN) shift was found to be (0, 0) pixels for the SRTM-NASA-v2.1 DEM and (0, 1) for the SRTM-CGIAR-v4.1 product, as shown in Figure 7 and Figure 8 respectively for one of the analyzed tiles. This confirms that the geolocation shifts in Figure 1a are due to errors in the SRTM-v4.1 DEM.
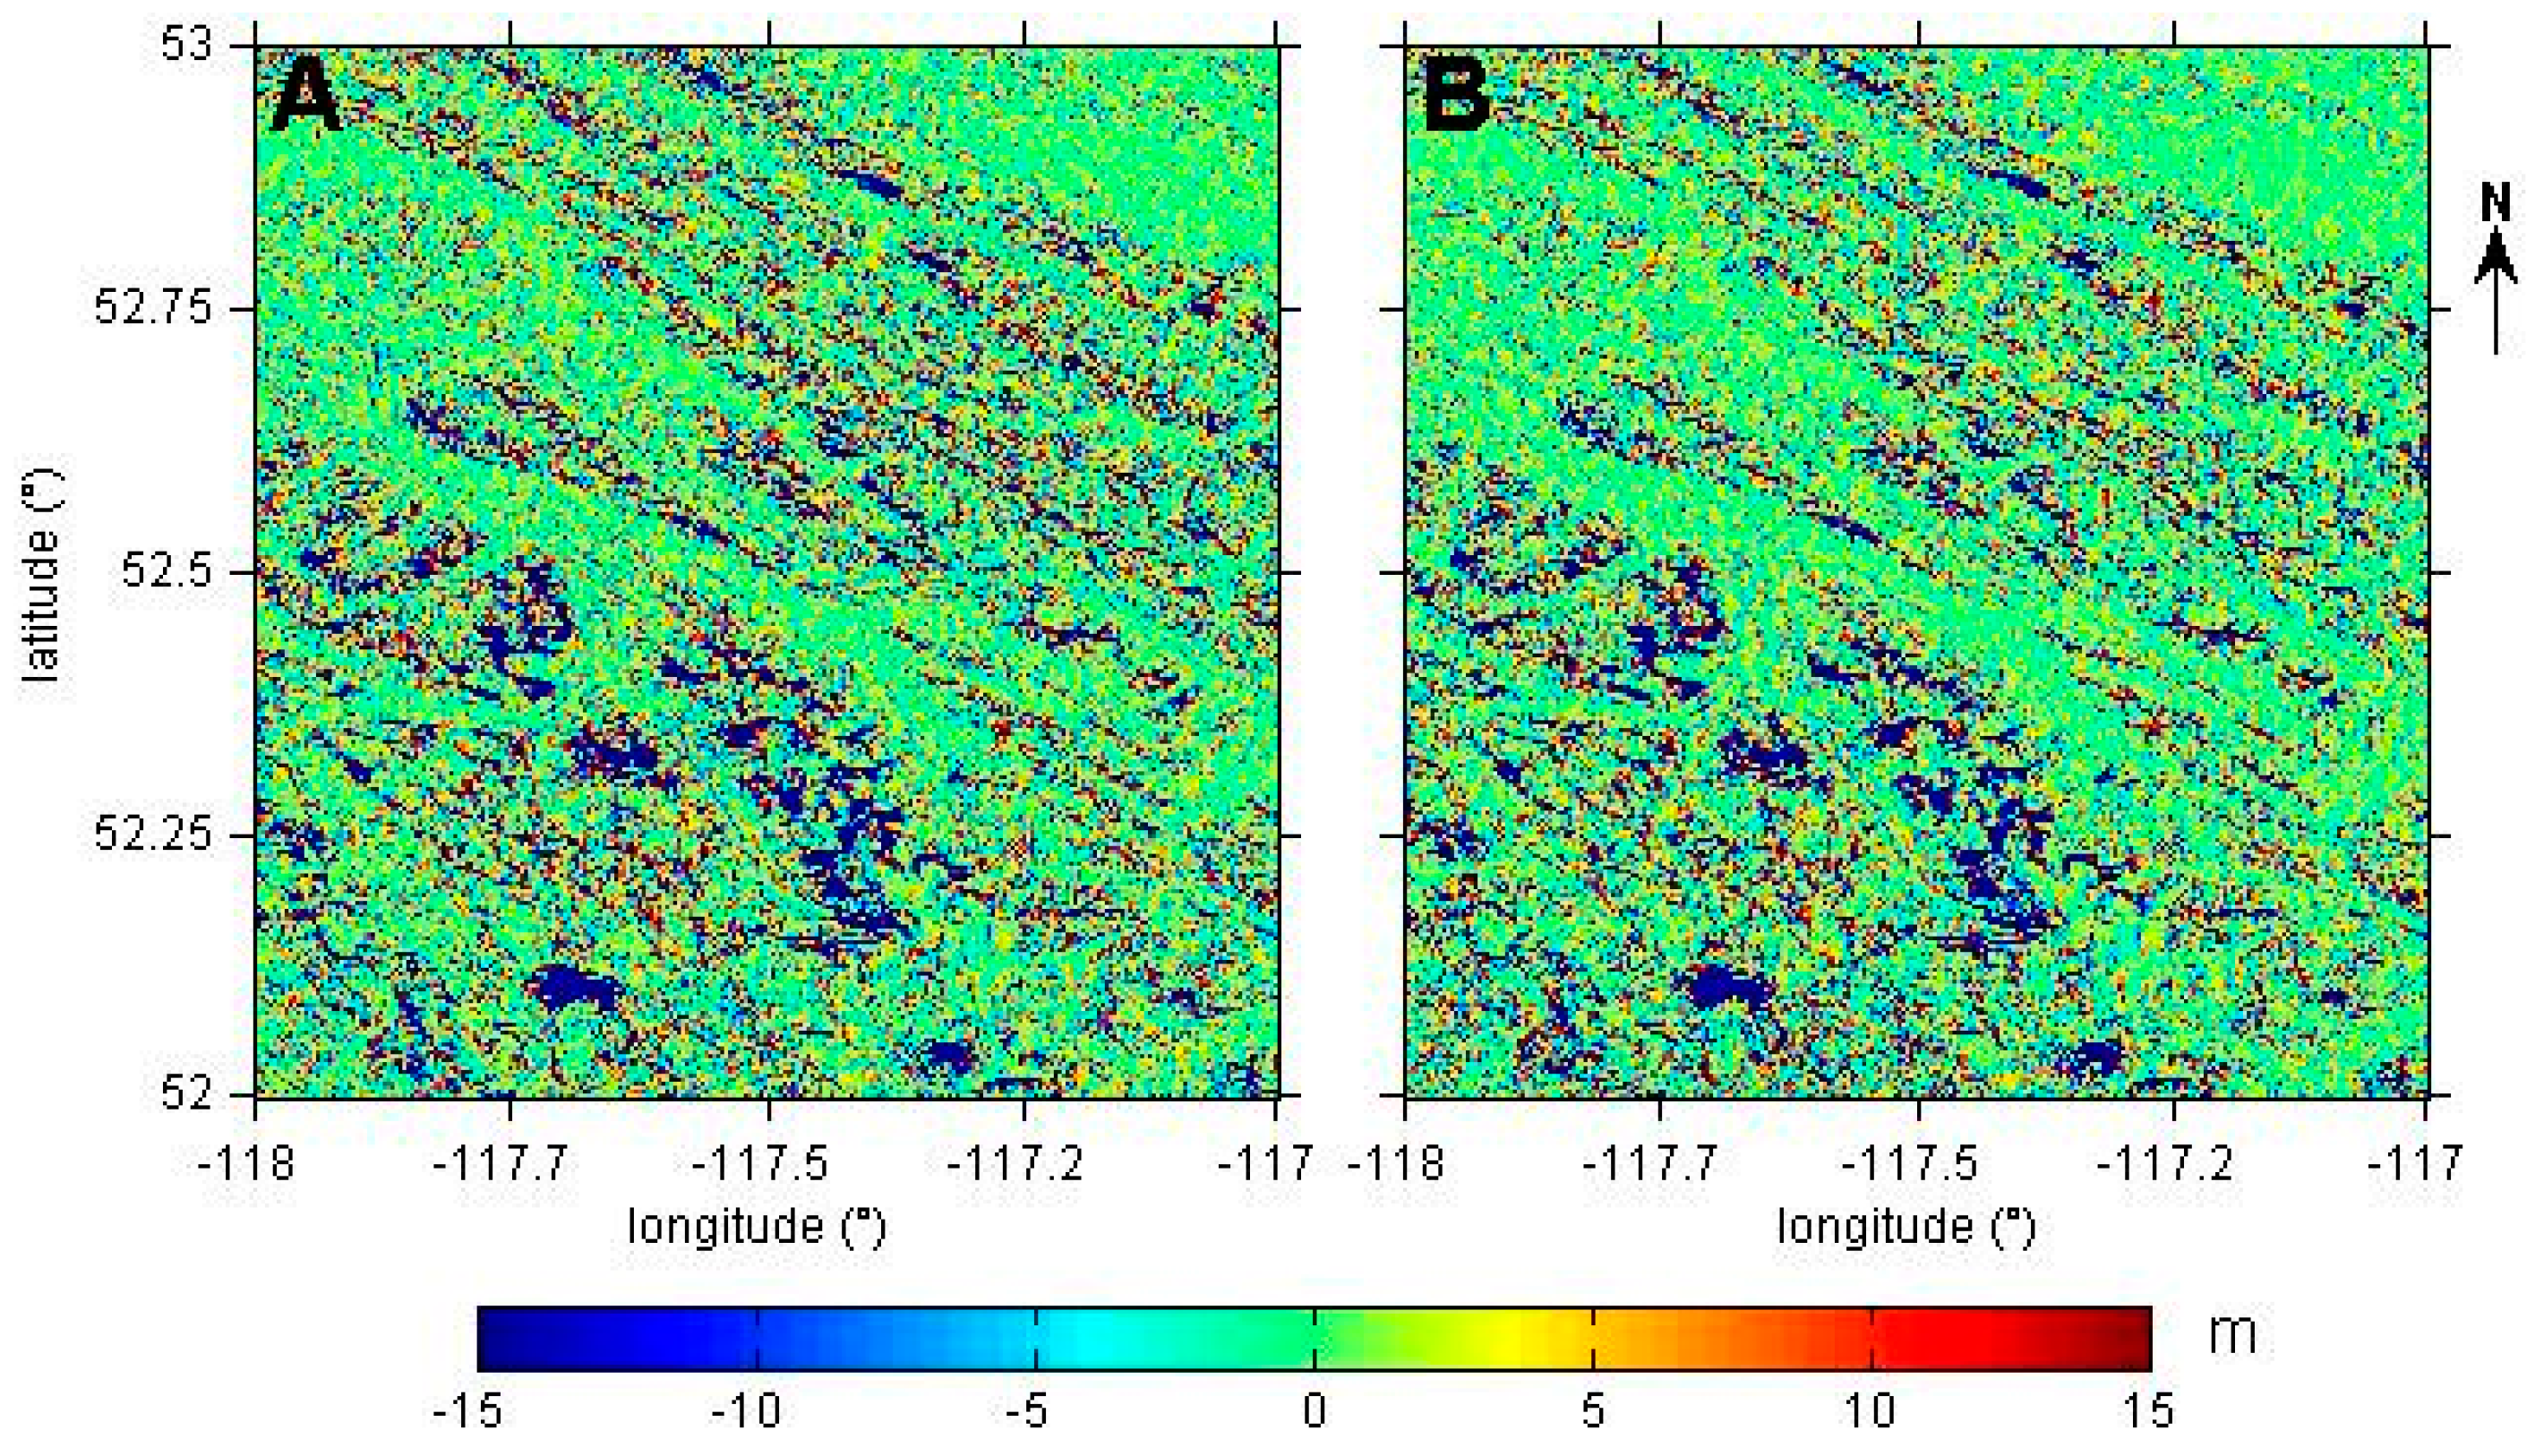
High-latitude banding is instead a documented artefact of NASA version 2.0 [12], on which the SRTM-CGIAR-v4.1 was based, and which was later corrected in NASA version 2.1. To confirm this, tile n53w118 of the 3 arcsec National Elevation Dataset (NED) [21] was considered as an external reference. Both the SRTM-CGIAR_v4.1 product and the NED DEM, were resampled to the geometry of SRTM-NASA-v2.1 tile N52W118 (the NED and SRTM tiles follow a different naming convention), based on the coordinate annotations, using the SARscape® software. The longitudinal derivative of the resampled elevation differences was taken, to emphasize variations in this direction, and is shown in Figure 9. While no banding is seen for the map based on the difference between the SRTM-NASA-v2.1 and NED DEMs (Figure 9A), this feature is apparent in the SRTM-CGIAR-v4.1 case (Figure 9B), confirming that the high-latitude banding is an artefact of the SRTM-NASA-v2.0 and SRTM-v4.1 products (regardless of the download mirror, as seen from Figure 2).
5. Conclusions
The CGIAR-CSI version 4.1 SRTM DEM is considered by most users to be simply a hole-filled version of the finished-grade NASA SRTM 2.0 and 2.1 products. This study, however, shows that several distinctions are in order.
Firstly, the CGIAR-CSI version 4.1 DEM available from the CGIAR-CSI server [6] is a different and better product than the one currently available through the analyzed download mirrors, namely Harvest Choice [16], GISLAB [17], and JRC [18]. For the latter three sources, spatially varying geolocation errors between 0.5 and 1.5 arcsec are found to be widespread (Figure 1B,C), whereas for the SRTM-CGIAR-v4.1 product, a 1 arcsec northward shift is confined roughly between latitudes 30°N and 31°N, and longitudes 60°E and 90°E (Figure 1A). In areas of steep terrain such a shift is relevant, since it can amount to height errors of tens or even hundreds of meters.
Another systematic error of the CGIAR-CSI products is inherited from a documented, though poorly known, artefact in the NASA SRTM version 2.0 DEM [12], on which all CGIAR-CSI version 4.1 products are based. This consists in a vertical banding (Figure 6) above latitude 50°N and below latitude 50°S, with an error standard deviation between 2 and 5 m (Figure 2). This error was corrected in subsequent NASA SRTM versions 2.1 and 3.0.
For most geographical areas, the SRTM-NASA-v2.1 and the SRTM-CGIAR-v4.1 DEMs are indeed identical, and for pixels with a valid height value in both DEMs, differences are only observed in the vicinity of voids in the SRTM-NASA-v2.1 product or in the neighborhood of pixels (e.g., water body contours), which were edited during the “finishing” process, leading to the release of NASA SRTM version 2.0. Examples of these differences are shown in Figure 4A. These are not due to the hole-filling methods carried out for the generation of SRTM-CGIAR-v4.1, but are most likely due to a different handling of NaNs in the averaging processes used to generate NASA SRTM versions 2.1 and 2.0.
Based on these considerations, the following recommendations can be provided concerning the use of 3 arcsec CGIAR-CSI version 4.1 SRTM products:
- Above latitude 50°N and below 50°S, the SRTM-NASA-v2.1 product is to be preferred to the SRTM-CGIAR-v4.1 one.
- Between latitude 50°N and below 50°S, the SRTM-CGIAR-v4.1 may be preferable to the SRTM-NASA-v2.1, depending on the quality of the hole-filling, except between latitude 30°N and 31°N, and longitude 60°E and 90°E (see Section 4.1 for a list of corresponding SRTM-CGIAR-v4.1 tiles). Within this region, if the SRTM-NASA-v2.1 product exhibits an unacceptably high number of voids, the SRTM-CGIAR-v4.1 product can still be used, although an editing of the latter is required to compensate for the geolocation errors detailed in Section 4.1.
Acknowledgments
Conflicts of Interest
The author declares no conflict of interest.
References
- Farr, T.G.; Rosen, P.A.; Caro, E.; Crippen, R.; Duren, R.; Hensley, S.; Kobrick, M.; Paller, M.; Rodriguez, E.; Roth, L.; et al. The Shuttle Radar Topography Mission. Rev. Geophys. 2007, 45, 1–33. [Google Scholar] [CrossRef]
- Yang, L.; Meng, X.; Zhang, X. SRTM DEM and its application advances. Int. J. Remote Sens. 2011, 32, 3875–3896. [Google Scholar]
- Zandbergen, P. Applications of Shuttle Radar Topography Mission elevation data. Geogr. Compass 2008, 2, 1404–1431. [Google Scholar] [CrossRef]
- Massonnet, D.; Feigl, K. Radar interferometry and its application to changes in the Earth’s surface. Rev. Geophys. 1998, 36, 441–500. [Google Scholar] [CrossRef]
- Farr, T.G.; Kobrick, M. Shuttle Radar Topography Mission produces a wealth of data. Eos Trans. AGU 2000, 81, 583–585. [Google Scholar] [CrossRef]
- Jarvis, A.; Reuter, H.I.; Nelson, A.; Guevara, E. Hole-Filled SRTM for the Globe Version 4.1. 2008. Available online: http://www.cgiar-csi.org/data/srtm-90m-digital-elevation-database-v4-1 (accessed on 10 August 2016).
- Shuttle Radar Topography Mission, 3 Arc Second, Version 2.1. Available online: http://dds.cr.usgs.gov/srtm/version2_1/SRTM3/ (accessed on 10 August 2016).
- SRTM Quick Guide. Available online: https://lpdaac.usgs.gov/sites/default/files/public/measures/docs/SRTM%20Quick%20Guide.pdf (accessed on 10 August 2016).
- Slater, J.A.; Garvey, G.; Johnston, C.; Haase, J.; Heady, B.; Kroenung, G.; Little, J. The SRTM data “Finishing” process and products. Photogramm. Eng. Remote Sens. 2006, 72, 237–247. [Google Scholar] [CrossRef]
- Performance Specification Digital Terrain Elevation Data (DTED). 2000; MIL-PRF-89020B. Available online: https://dds.cr.usgs.gov/srtm/version2_1/Documentation/MIL-PDF-89020B.pdf (accessed on 6 September 2016).
- Gamache, M. Free and Low Cost Datasets for International Mountain Cartography. Available online: http://www.terrainmap.com/downloads/Gamache_final_web.pdf (accessed on 10 August 2016).
- SRTM Topography. Available online: http://dds.cr.usgs.gov/srtm/version2_1/Documentation/SRTM_Topo.pdf/ (accessed on 10 August 2016).
- Shuttle Radar Topography Mission. Available online: http://glcfapp.glcf.umd.edu/data/srtm/description.shtml (accessed on 10 August 2016).
- Grohman, G.; Kroenung, G.; Strebeck, J. Filling SRTM voids: The Delta Surface Fill method. Photogramm. Eng. Remote Sens. 2006, 72, 213–216. [Google Scholar]
- Reuter, H.I.; Nelson, A.; Jarvis, A. An evaluation of void filling interpolation methods for SRTM data. Int. J. Geogr. Inf. Sci. 2007, 21, 983–1008. [Google Scholar] [CrossRef]
- Hole-Filled SRTM for the Globe Version 4.1 (Harvest Choice Mirror, USA). Available online: http://droppr.org/srtm/v4.1/6_5x5_TIFs/ (accessed on 10 August 2016).
- Hole-Filled SRTM for the Globe Version 4.1 (GISLAB Mirror, RUS). Available online: http://gis-lab.info/data/srtm-tif/ (accessed on 10 August 2016).
- Hole-Filled SRTM for the Globe Version 4.1 (JRC Mirror, IT). Available online: http://esdac.jrc.ec.europa.eu/projects/srtmshuttle-radar-topogr (accessed on 10 August 2016).
- Mouratidis, A.; Briole, P.; Katsambalos, K. SRTM 3″ DEM (versions 1, 2, 3, 4) validation by means of extensive kinematic GPS measurements: A case study form North Greece. Int. J. Remote Sens. 2010, 31, 6205–6222. [Google Scholar] [CrossRef]
- Rexer, M.; Hirt, C. Comparison of free high-resolution digital elevation data sets (ASTER GDEM2, SRTM v2.1/v4.1) and validation against accurate heights from the Australian National Gravity Database. Aust. J. Earth Sci. 2014, 61, 213–226. [Google Scholar] [CrossRef]
- USGS NED 1 Arc-Second n53w118 1 × 1 Degree GridFloat. US Geological Survey: Reston, VA. Available online: http://nationalmap.gov/elevation.html/ (accessed on 10 August 2016).
- Wessel, P.; Smith, W.H.F. New, improved version of the generic mapping tools released. EOS Trans. AGU 1998, 79, 579. [Google Scholar] [CrossRef]
Figure 1.
Geolocation shifts which minimize the height difference standard deviation between each SRTM-NASA-v2.1 tile and the corresponding 1° × 1° version 4.1 DEM sub-tiles available from (A) the CGIAR-CSI server; (B) the Harvest Choice and JRC mirrors; and (C) the GISLAB mirror. The colors represent all possible integer 1-pixel (3 arcsec) shifts, assuming the top-left coordinates of the original 5° × 5° CGIAR-CSI tiles (green squares) to be aligned with those of the corresponding SRTM-NASA-v2.1 tile (see Section 4.1 for a quantification of the shifts, which depends on the data annotations of each product). Sub-tiles with less than 0.1% of valid pixels are marked as gray dots and are excluded from the analysis.
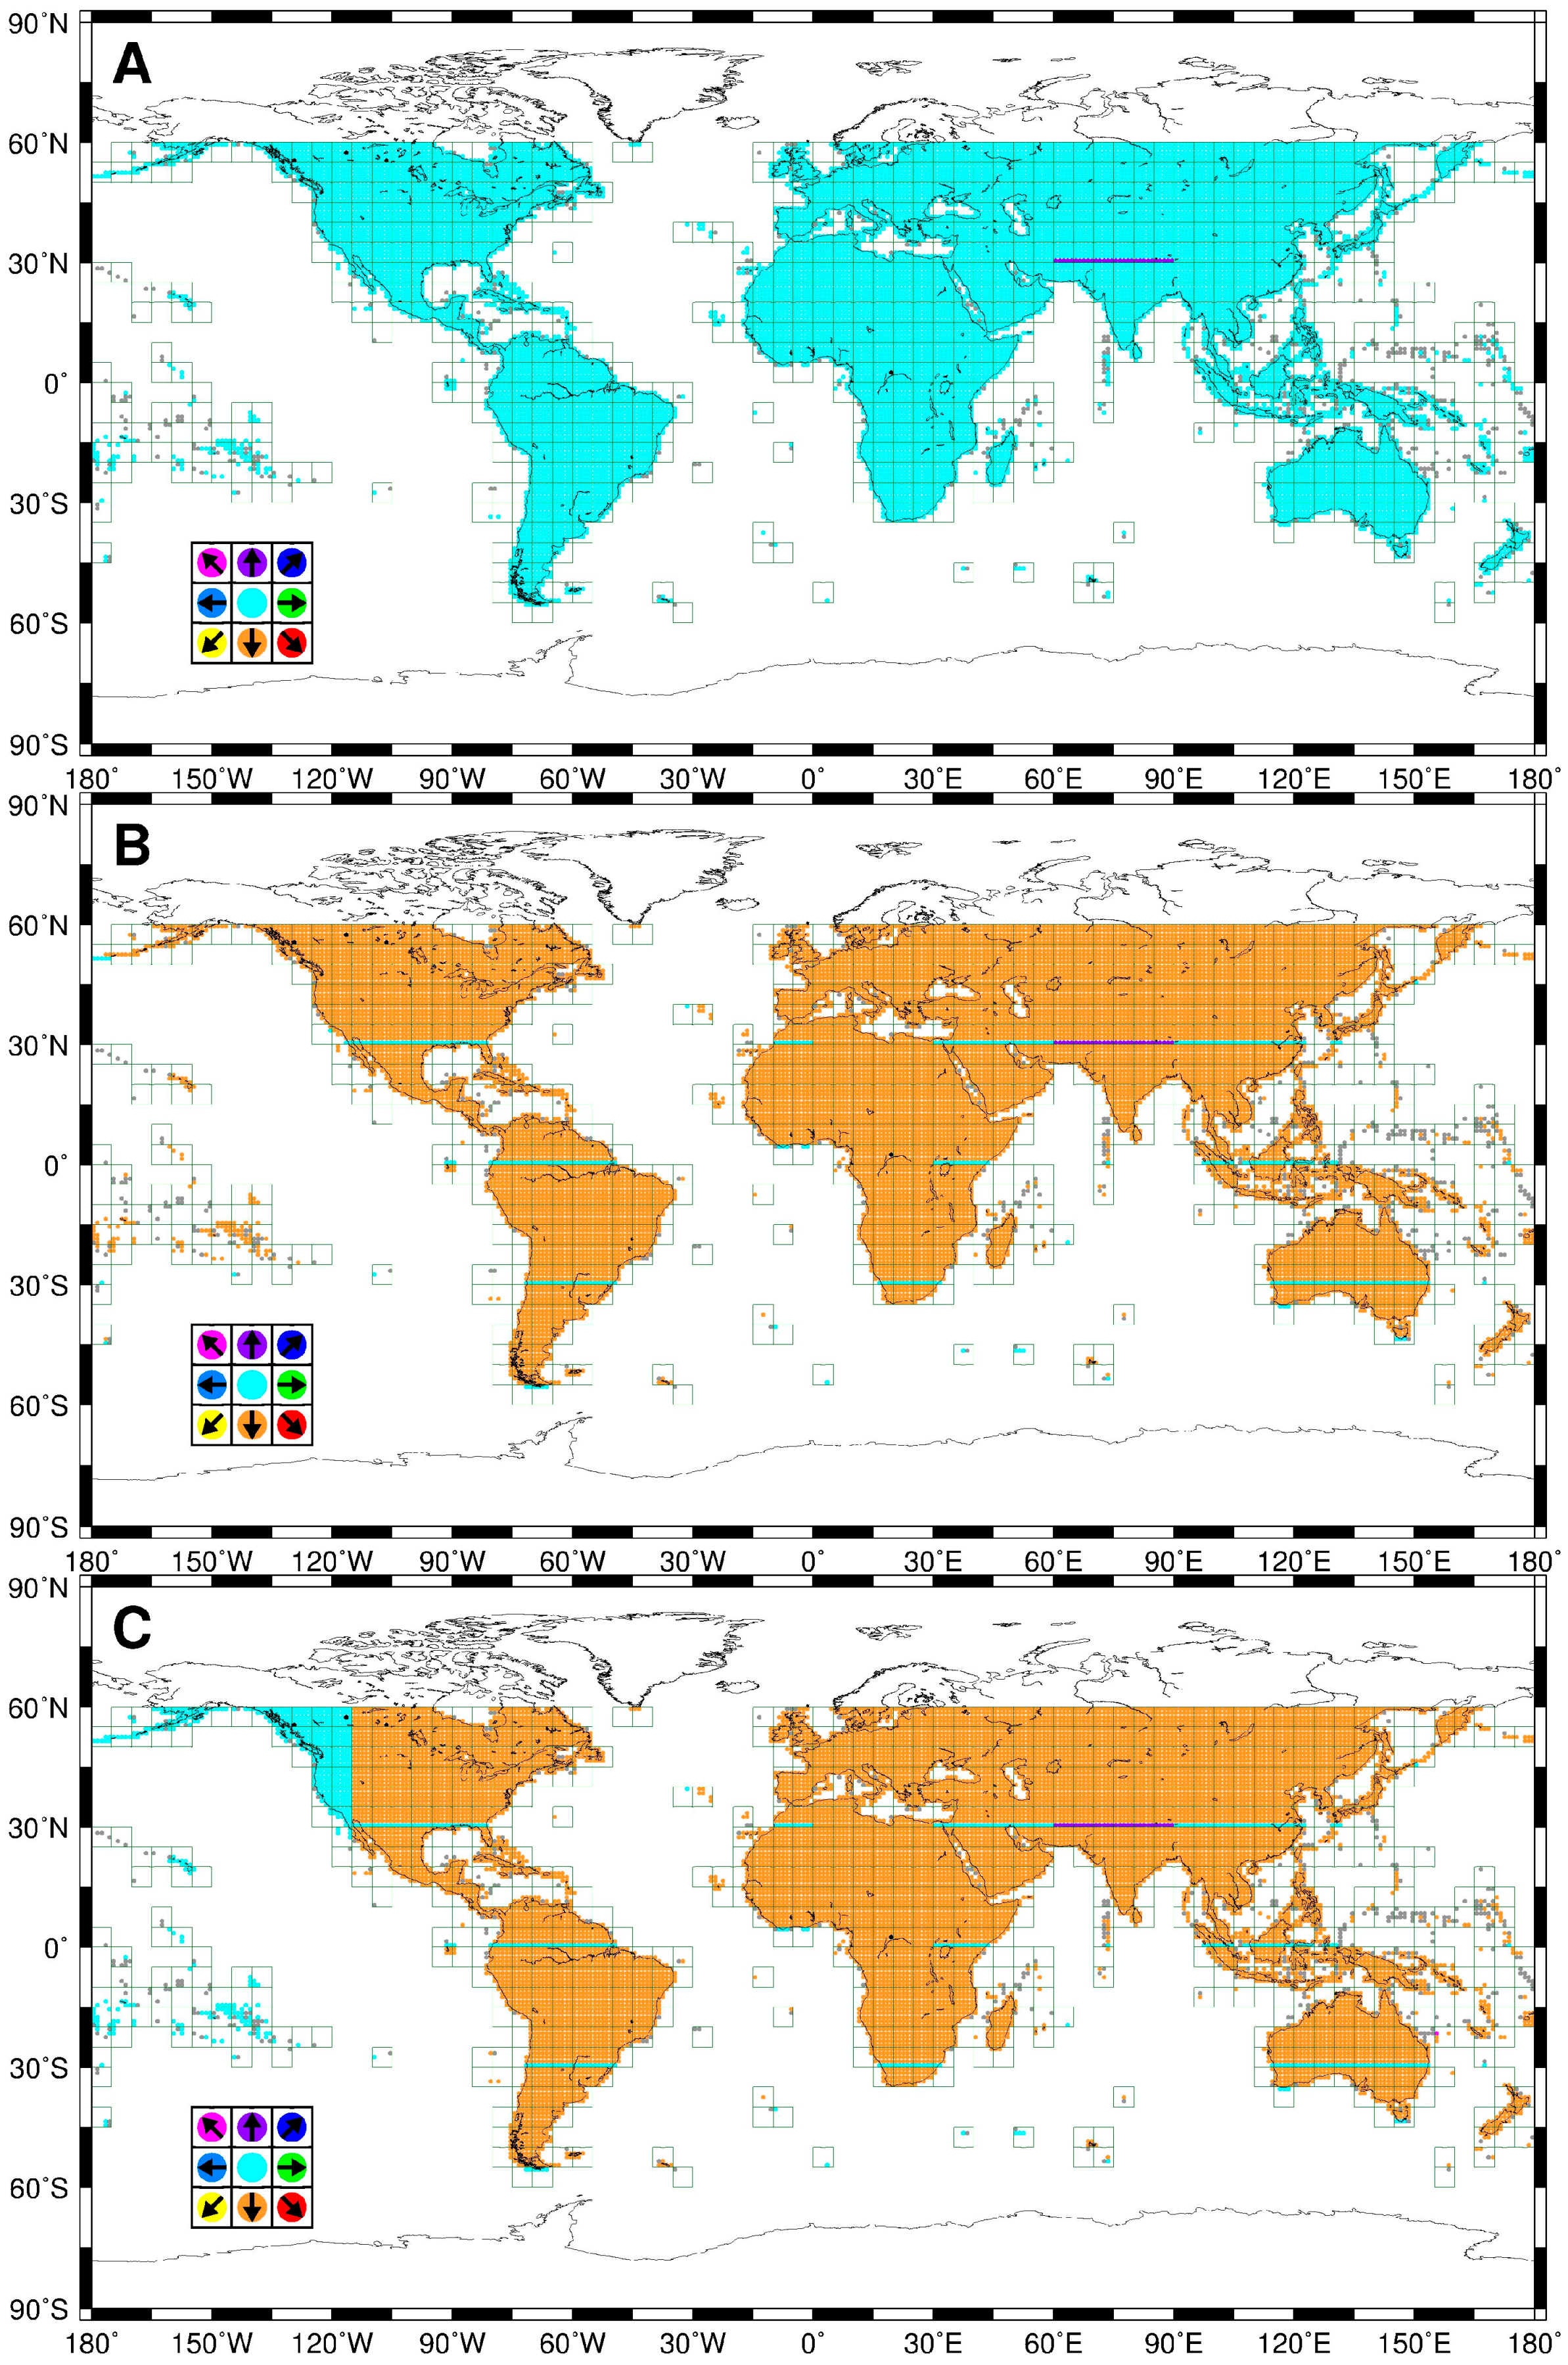
Figure 2.
Standard deviation of the height difference with respect to the SRTM-NASA-v2.1 DEM of the corresponding 1° × 1° version 4.1 DEM sub-tiles, available from (A) the CGIAR-CSI server; (B) the Harvest Choice and JRC mirrors; and (C) the GISLAB mirror. The geolocation shifts shown in Figure 1 were applied to each version 4.1 DEM sub-tile before computing the height differences.

Figure 3.
(A–I) Height difference between SRTM-NASA-v2.1 tile N31E076 and shifted versions of the corresponding SRTM-CGIAR-v4.1 sub-tile (extracted from tile 52_06), for each possible 1-pixel trial shift.
Figure 3.
(A–I) Height difference between SRTM-NASA-v2.1 tile N31E076 and shifted versions of the corresponding SRTM-CGIAR-v4.1 sub-tile (extracted from tile 52_06), for each possible 1-pixel trial shift.
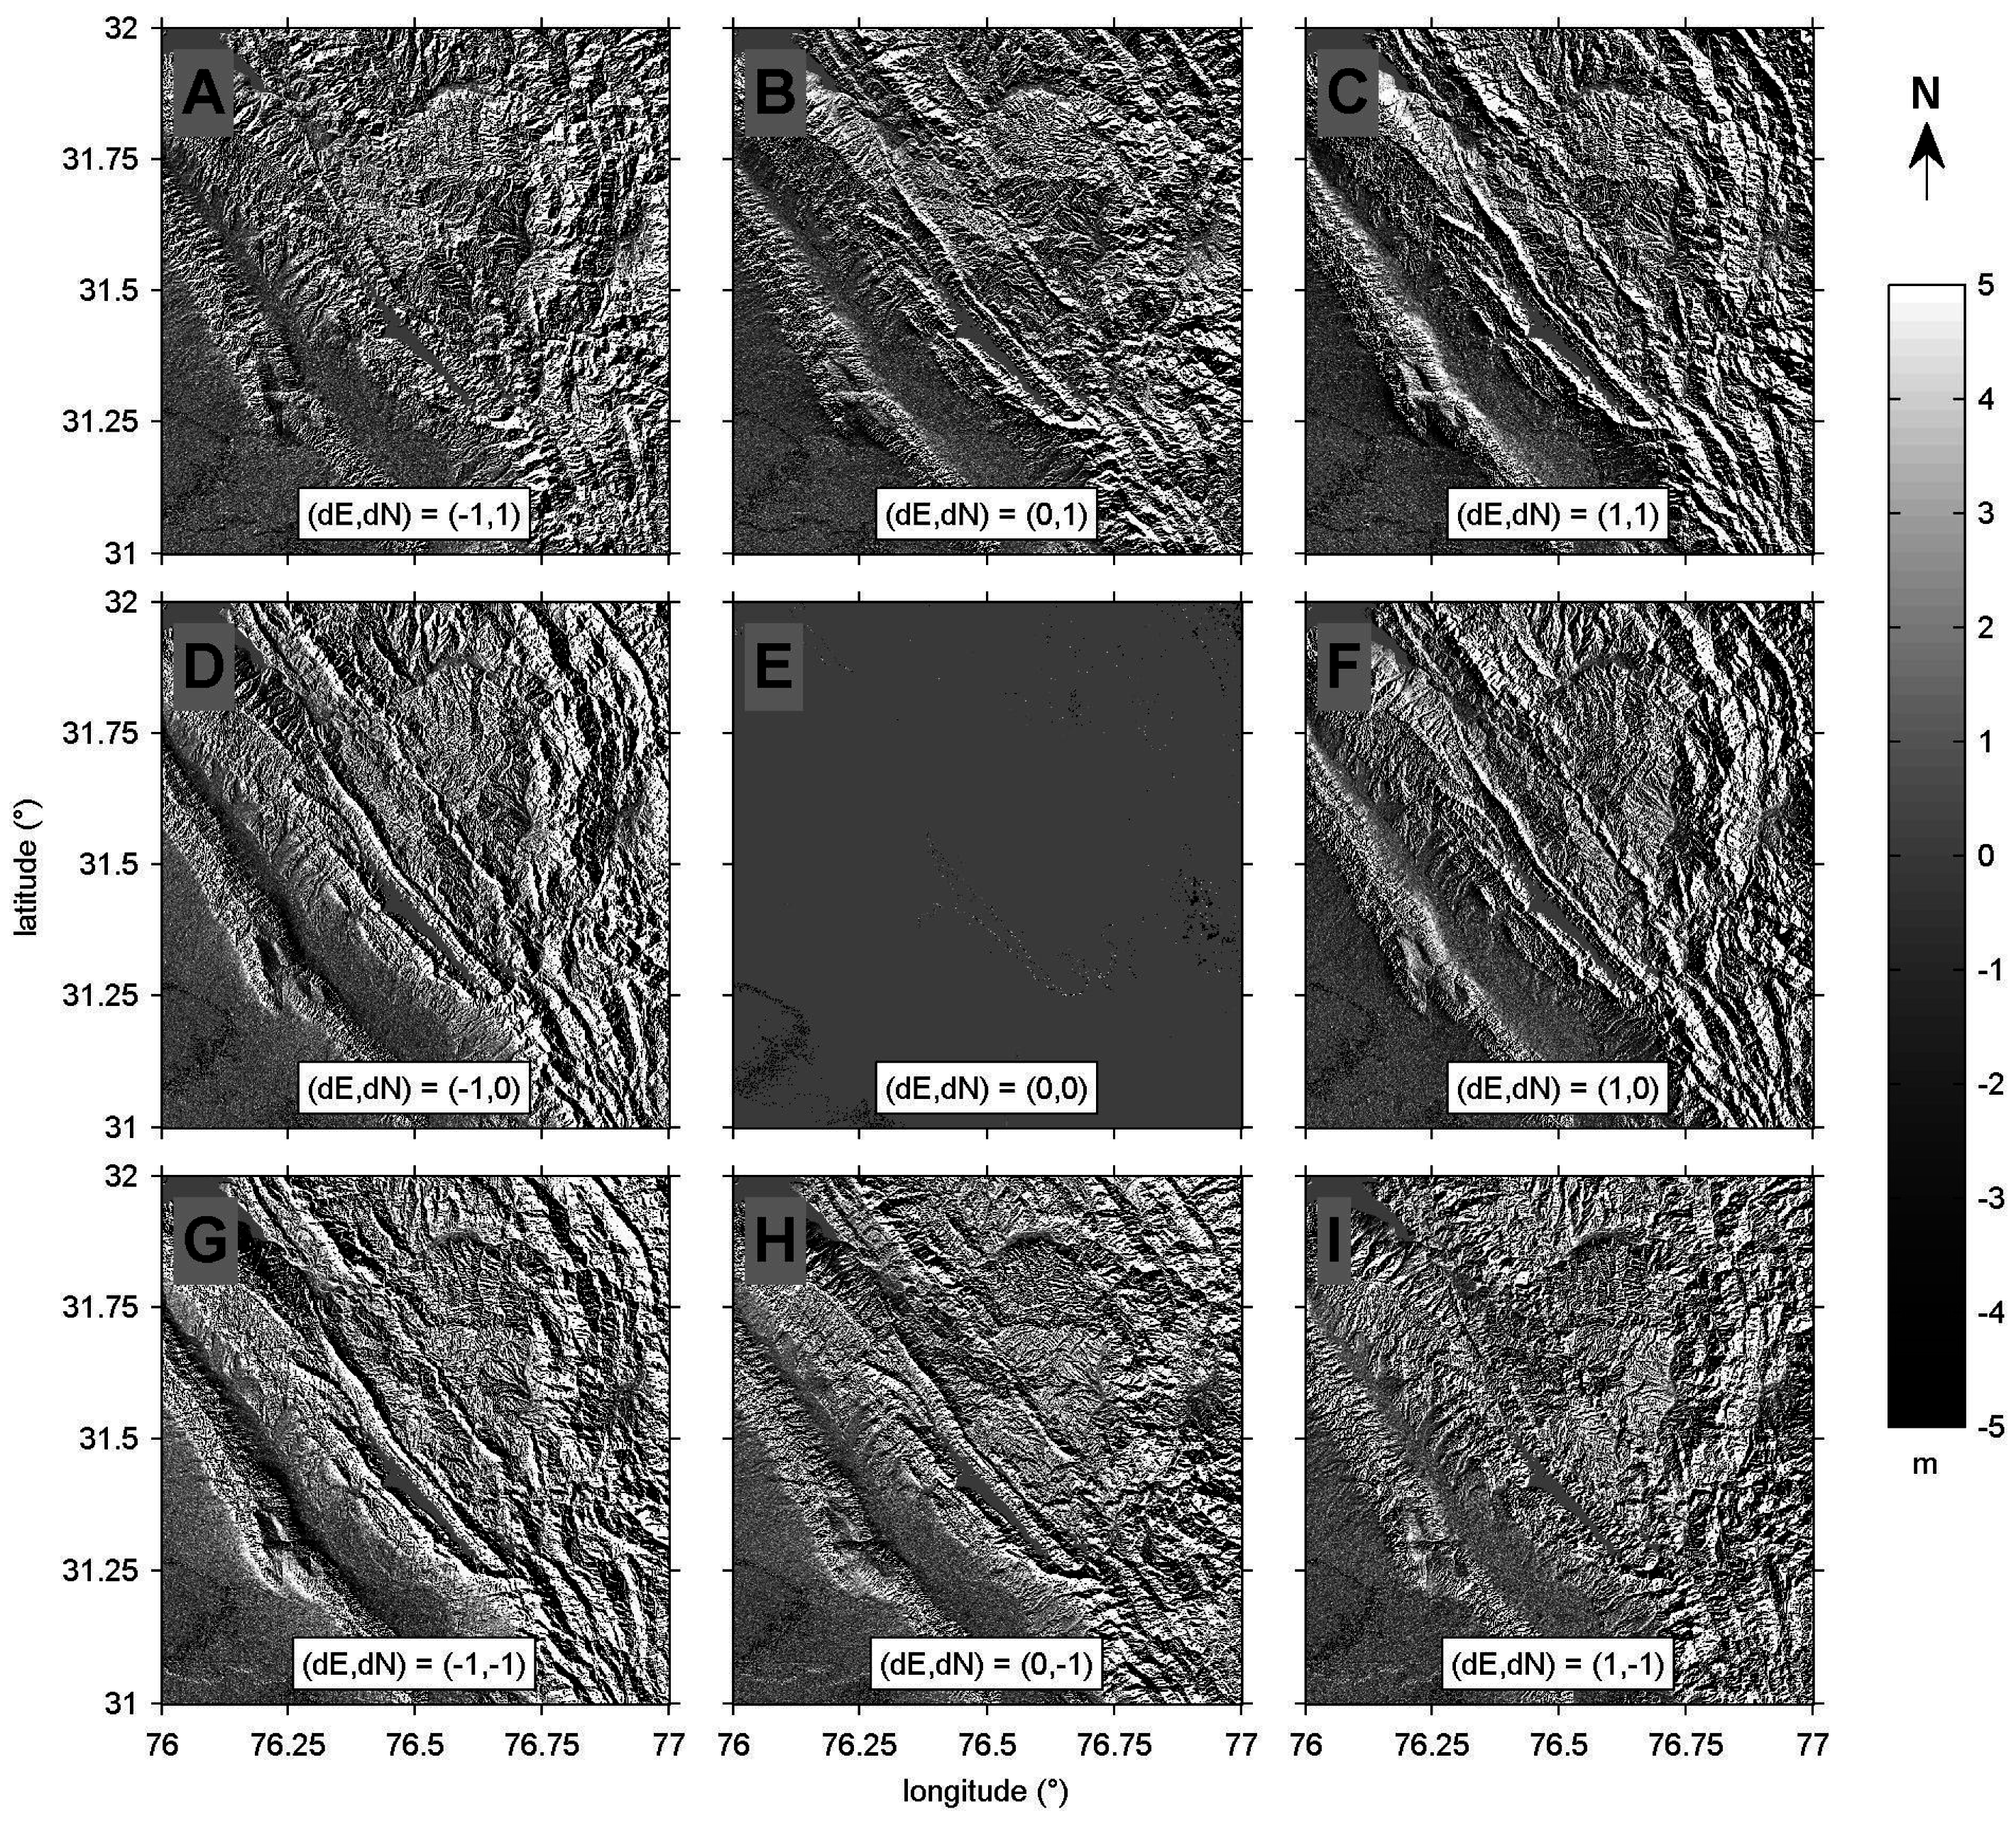
Figure 4.
Height differences between a portion of SRTM-CGIAR-v4.1 tile 38_03 and tile N46E008 from SRTM-NASA-v2.1 (A) and from SRTM-NASA-v2.0 (B). Voids in the NASA DEMs are shown in dark blue.
Figure 4.
Height differences between a portion of SRTM-CGIAR-v4.1 tile 38_03 and tile N46E008 from SRTM-NASA-v2.1 (A) and from SRTM-NASA-v2.0 (B). Voids in the NASA DEMs are shown in dark blue.

Figure 5.
(A–I) Height difference between SRTM-NASA-v2.1 tile N30E077 and shifted versions of the corresponding SRTM-CGIAR-v4.1 sub-tile (extracted from tile 52_06).
Figure 5.
(A–I) Height difference between SRTM-NASA-v2.1 tile N30E077 and shifted versions of the corresponding SRTM-CGIAR-v4.1 sub-tile (extracted from tile 52_06).
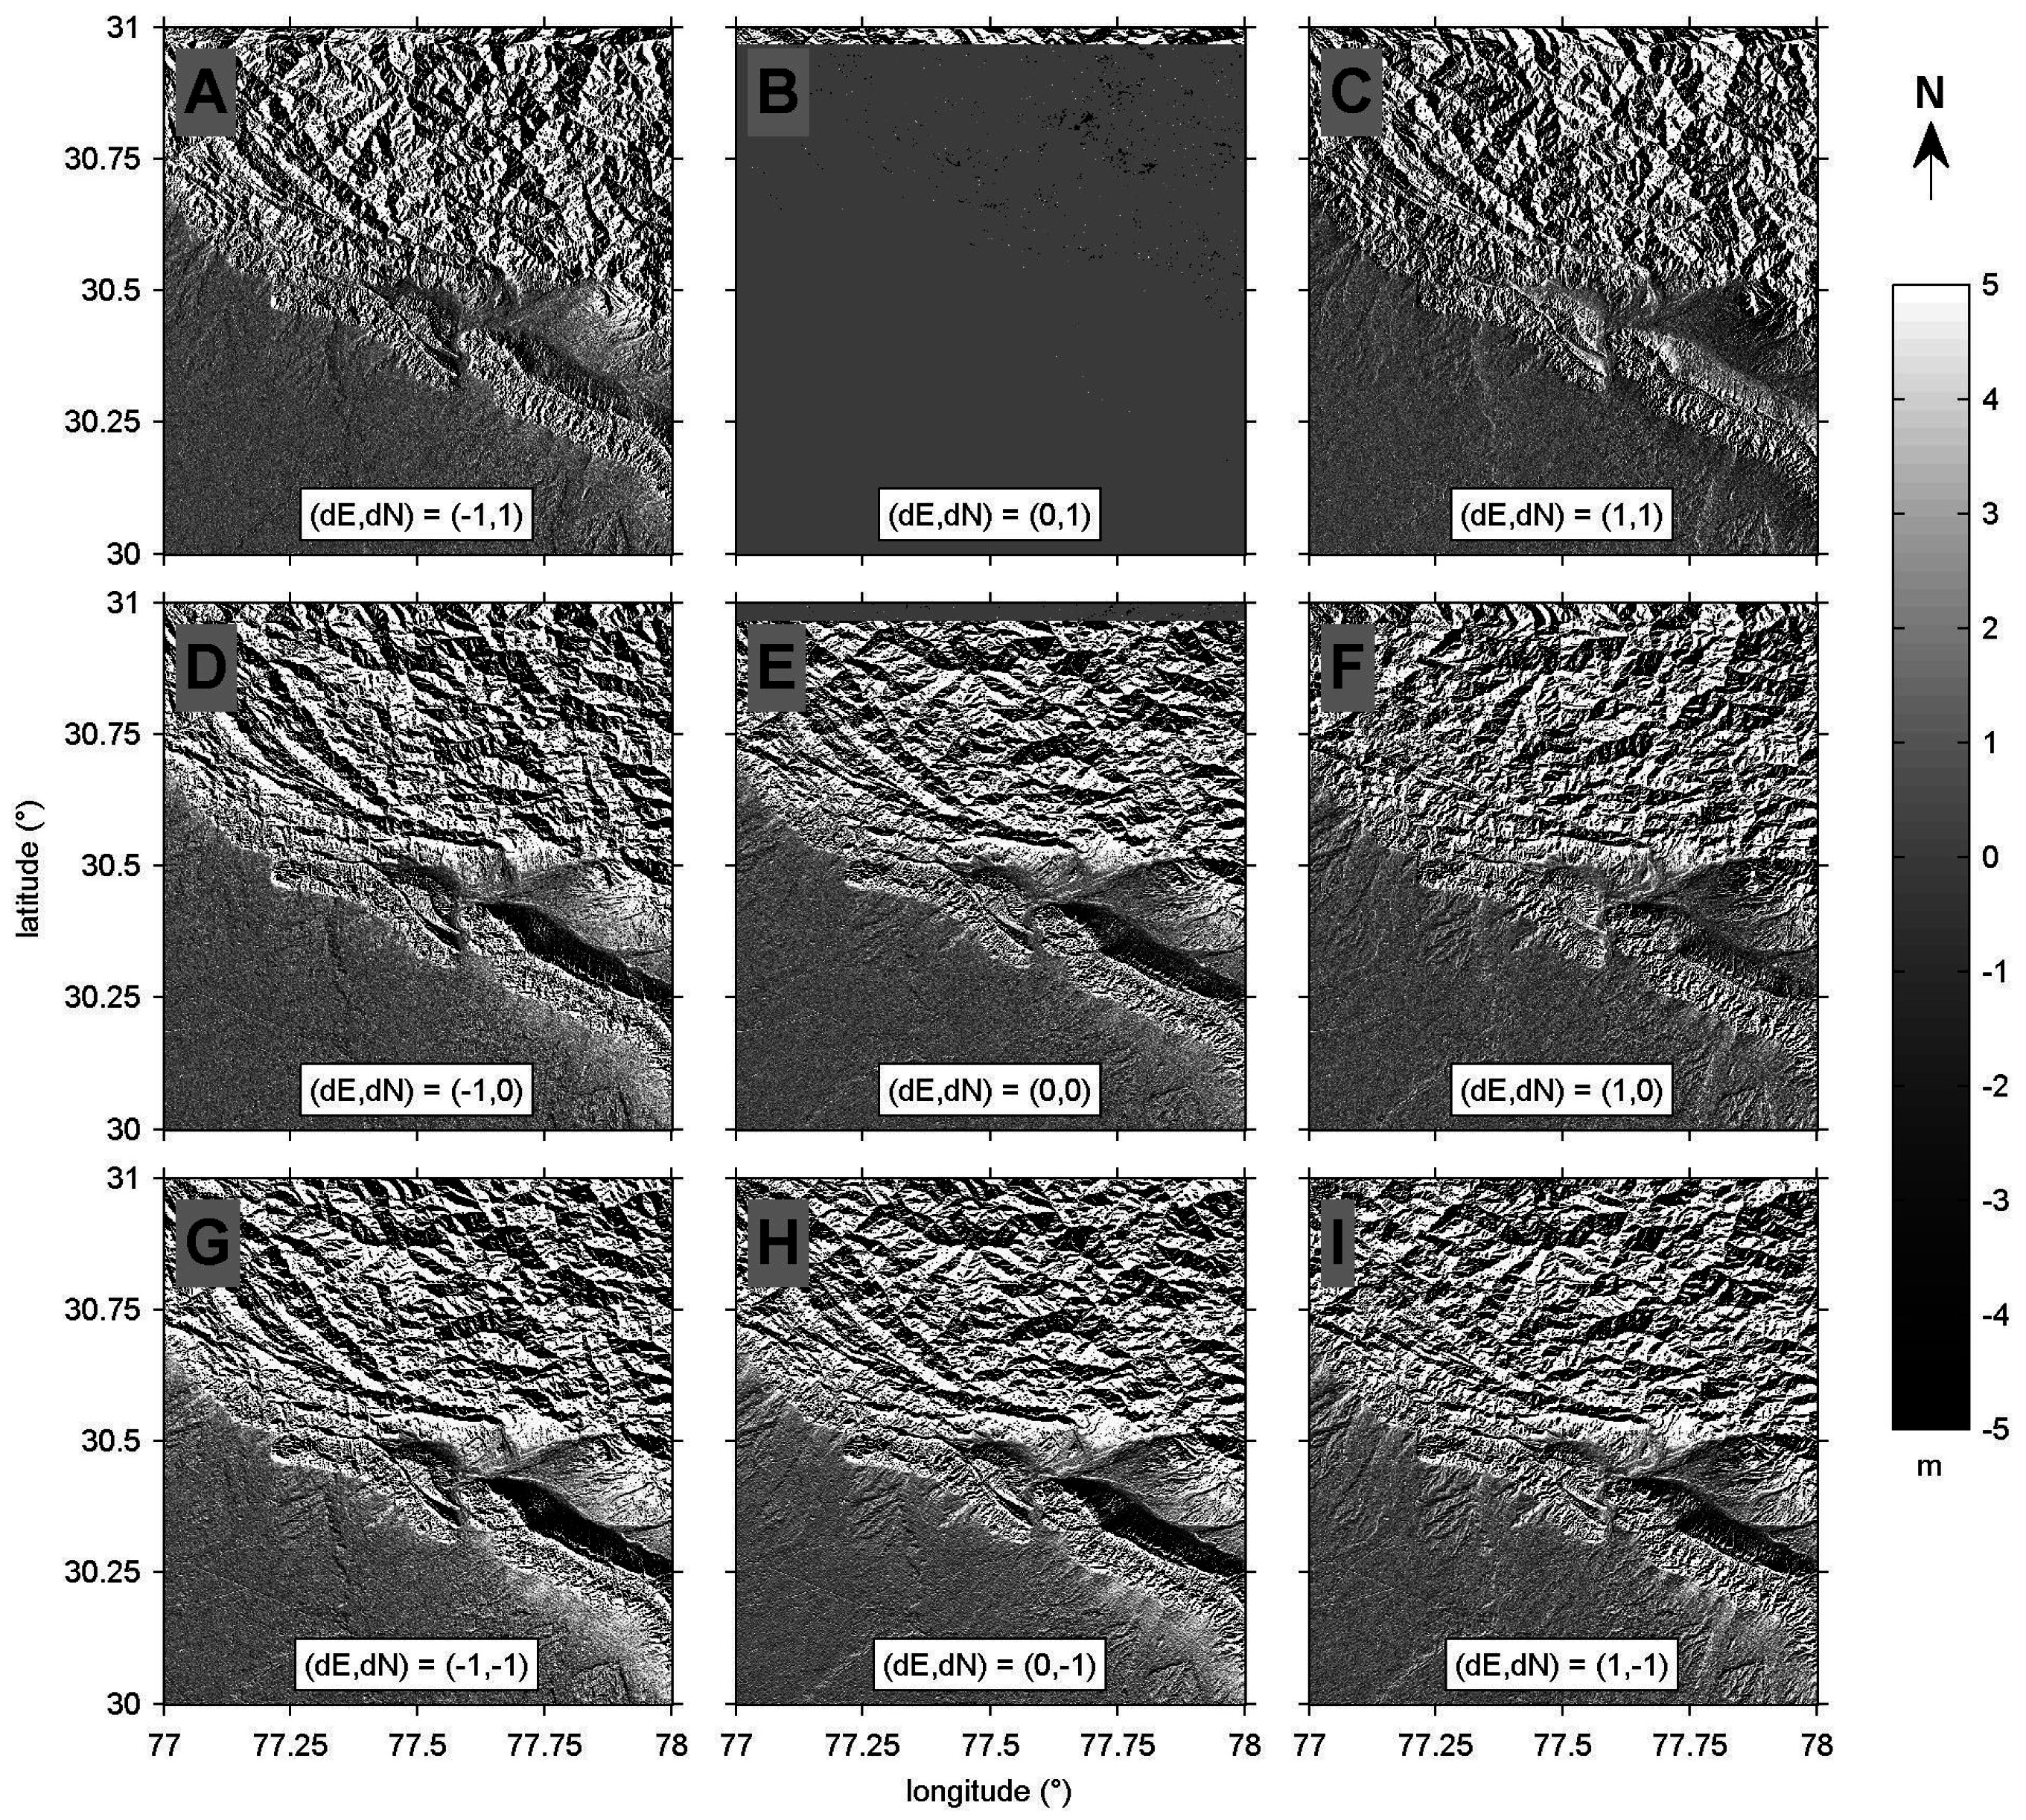
Figure 6.
Height difference between SRTM-NASA-v2.1 tile N52W118 and the corresponding SRTM-CGIAR-v4.1 sub-tile (extracted from tile 13_02). Voids in are shown in dark blue.
Figure 6.
Height difference between SRTM-NASA-v2.1 tile N52W118 and the corresponding SRTM-CGIAR-v4.1 sub-tile (extracted from tile 13_02). Voids in are shown in dark blue.
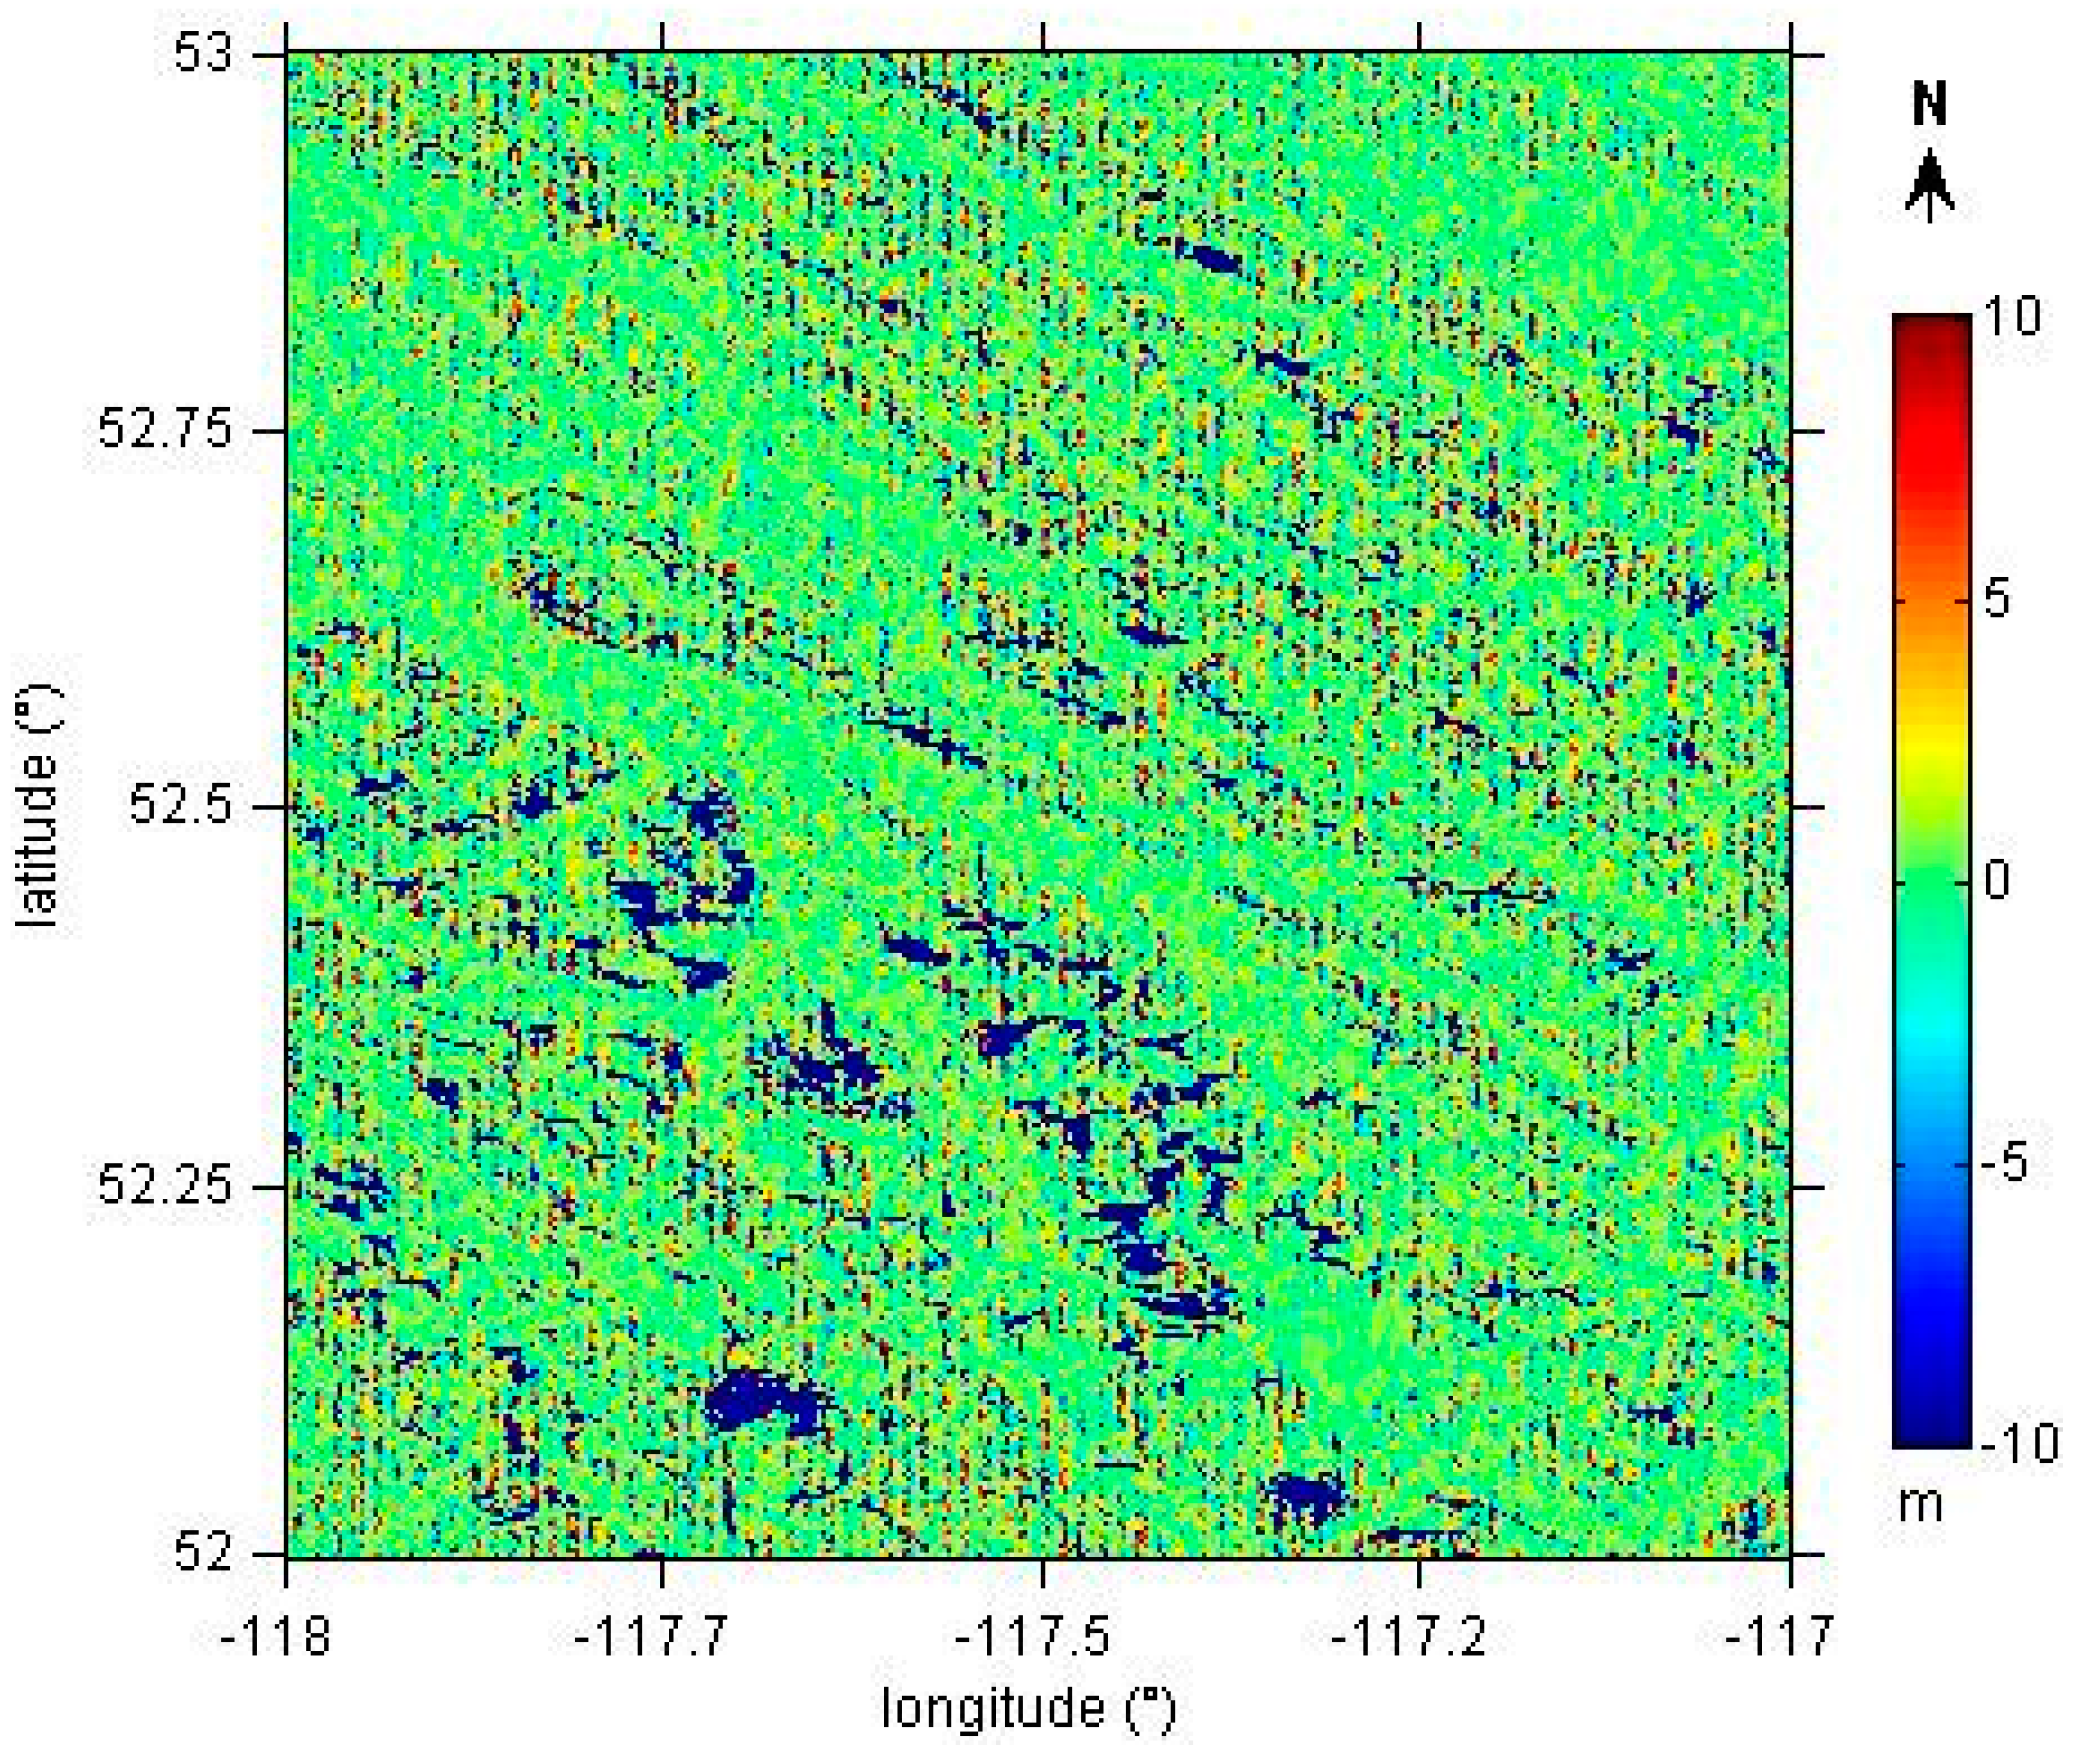
Figure 7.
(A–I) Height difference between SRTM-NASA-v2.1 tile N30E077 and shifted versions of the corresponding ASTER GDEM version 2 tile (resampled to the geometry of the SRTM-NASA-v2.1 tile), for each possible 1-pixel trial shift.
Figure 7.
(A–I) Height difference between SRTM-NASA-v2.1 tile N30E077 and shifted versions of the corresponding ASTER GDEM version 2 tile (resampled to the geometry of the SRTM-NASA-v2.1 tile), for each possible 1-pixel trial shift.
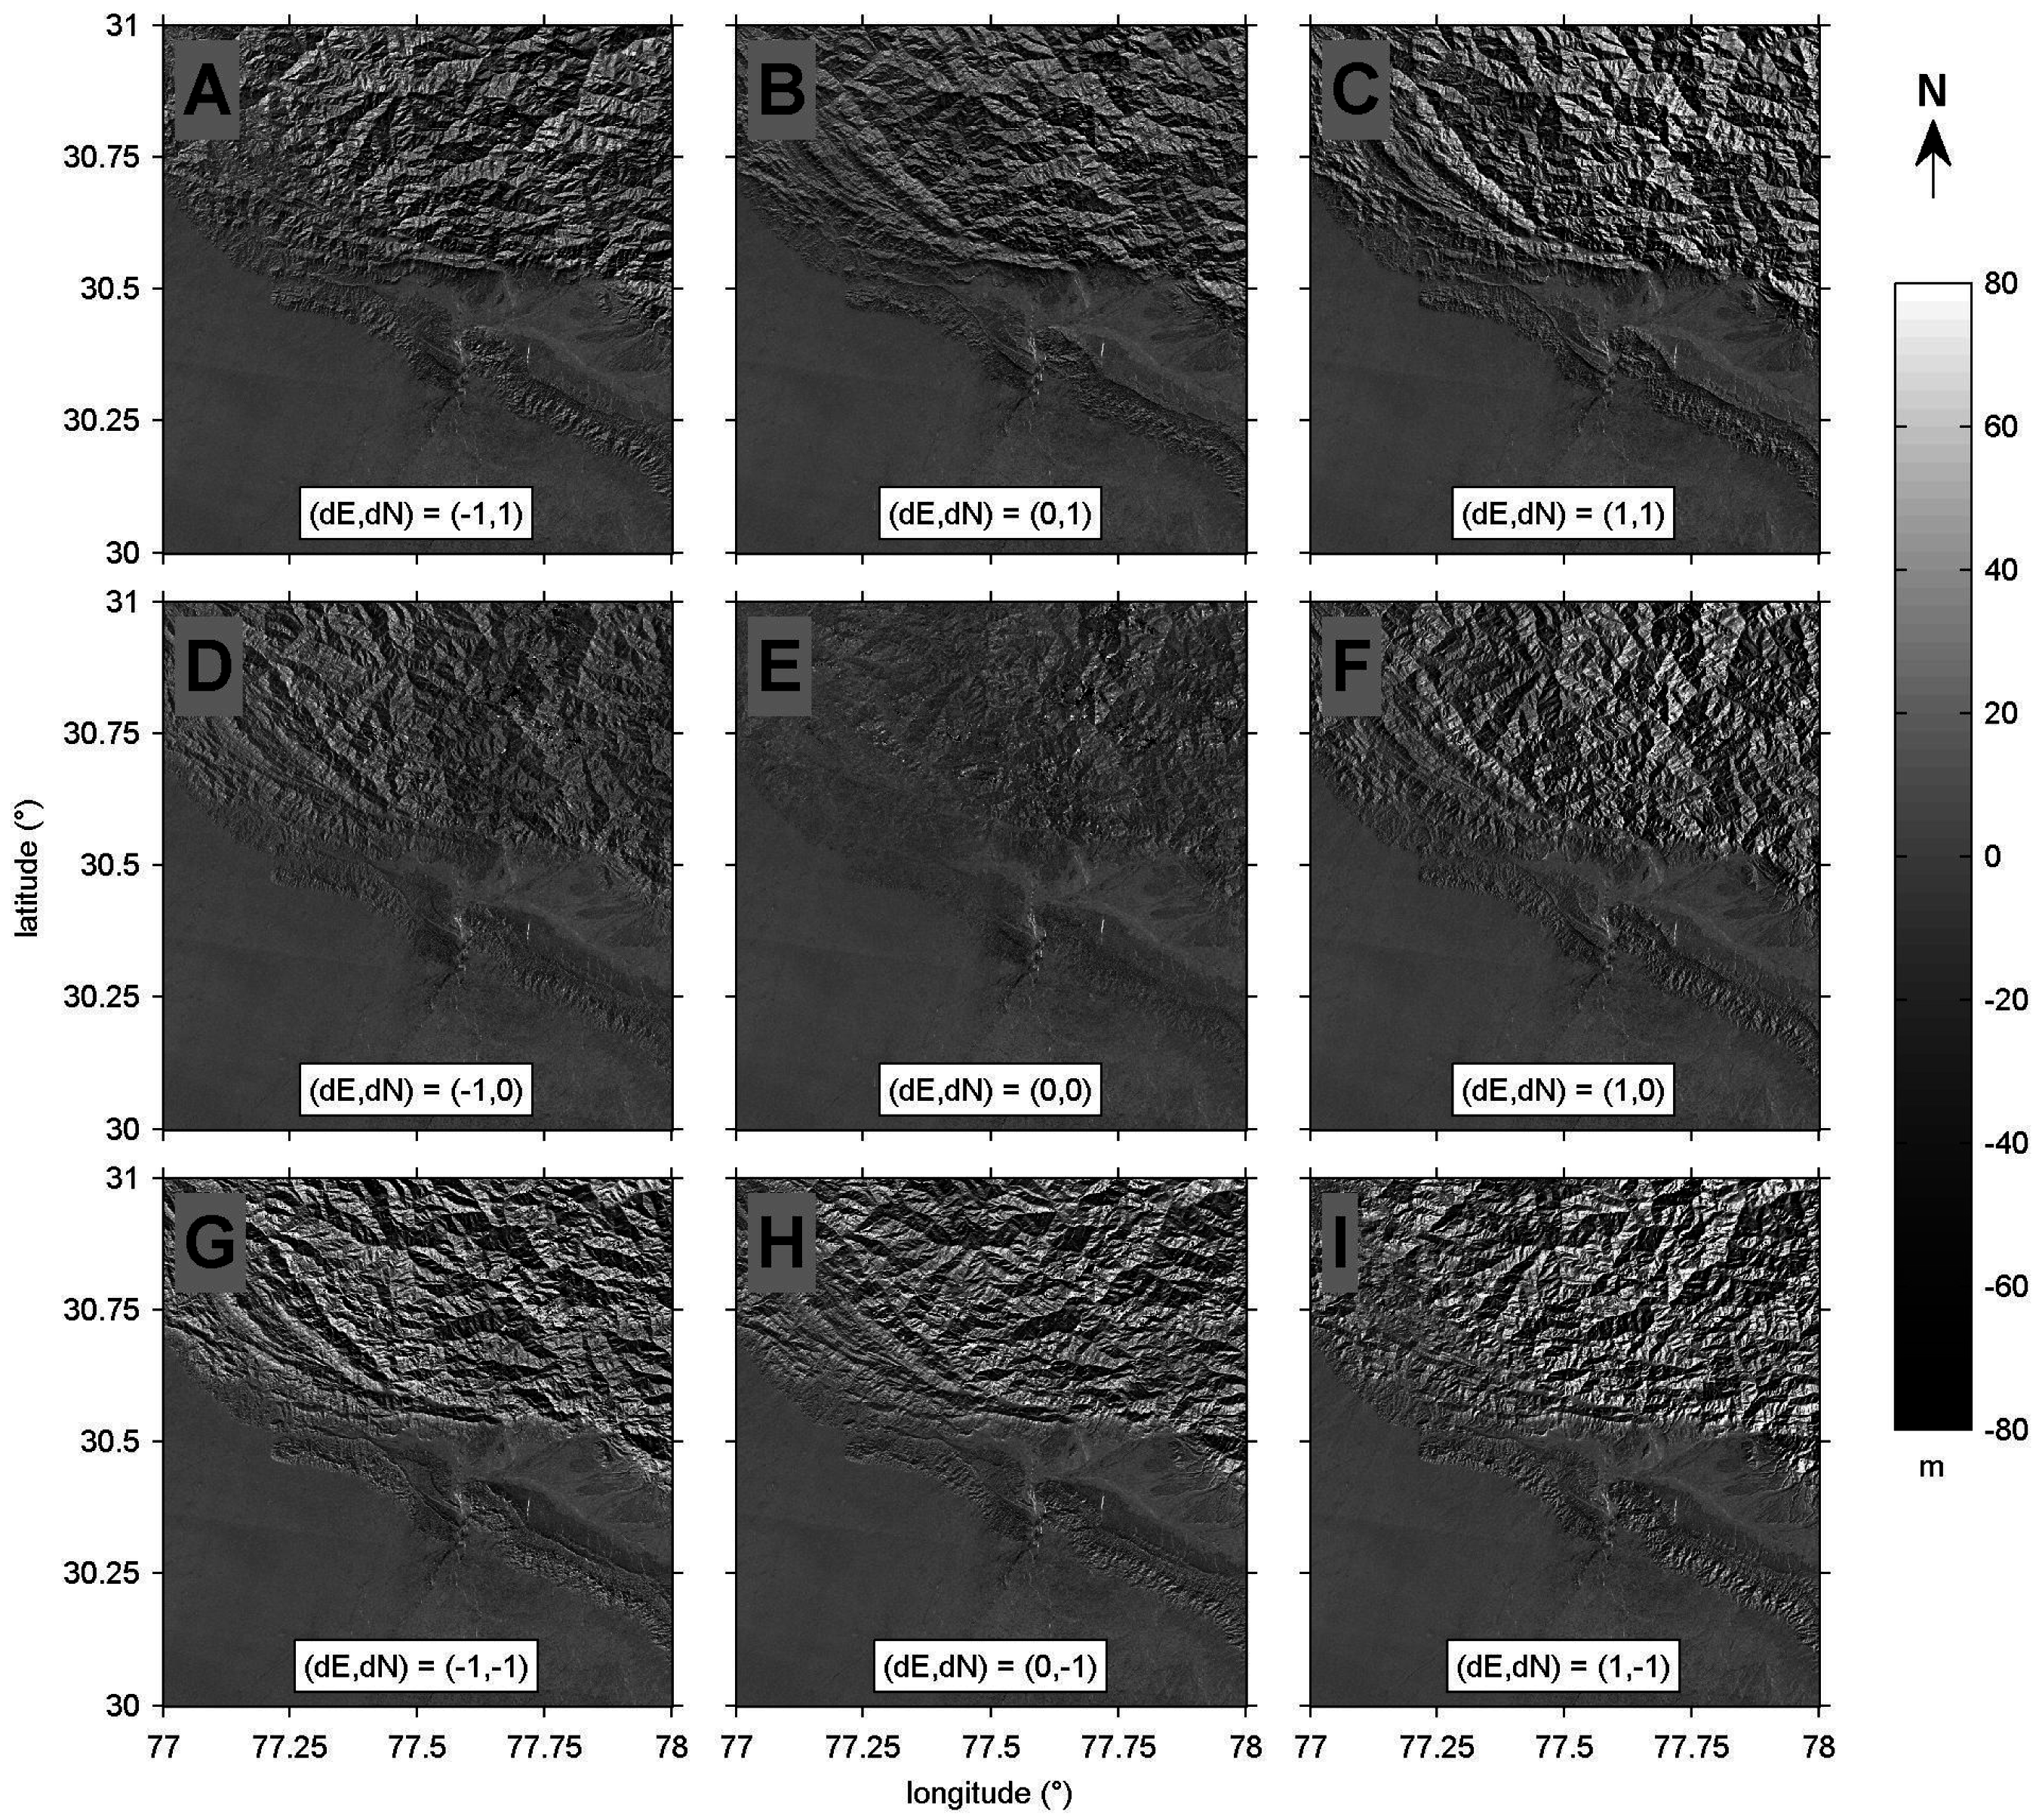
Figure 8.
(A–I) Height difference between the 1° × 1° SRTM-CGIAR-v4.1 sub-tile corresponding to the coverage of SRTM-NASA-v2.1 tile N30E077, and shifted versions of the corresponding ASTER GDEM version 2 (resampled to the geometry of the SRTM-NASA-v2.1 tile), for each possible 1-pixel trial shift.
Figure 8.
(A–I) Height difference between the 1° × 1° SRTM-CGIAR-v4.1 sub-tile corresponding to the coverage of SRTM-NASA-v2.1 tile N30E077, and shifted versions of the corresponding ASTER GDEM version 2 (resampled to the geometry of the SRTM-NASA-v2.1 tile), for each possible 1-pixel trial shift.
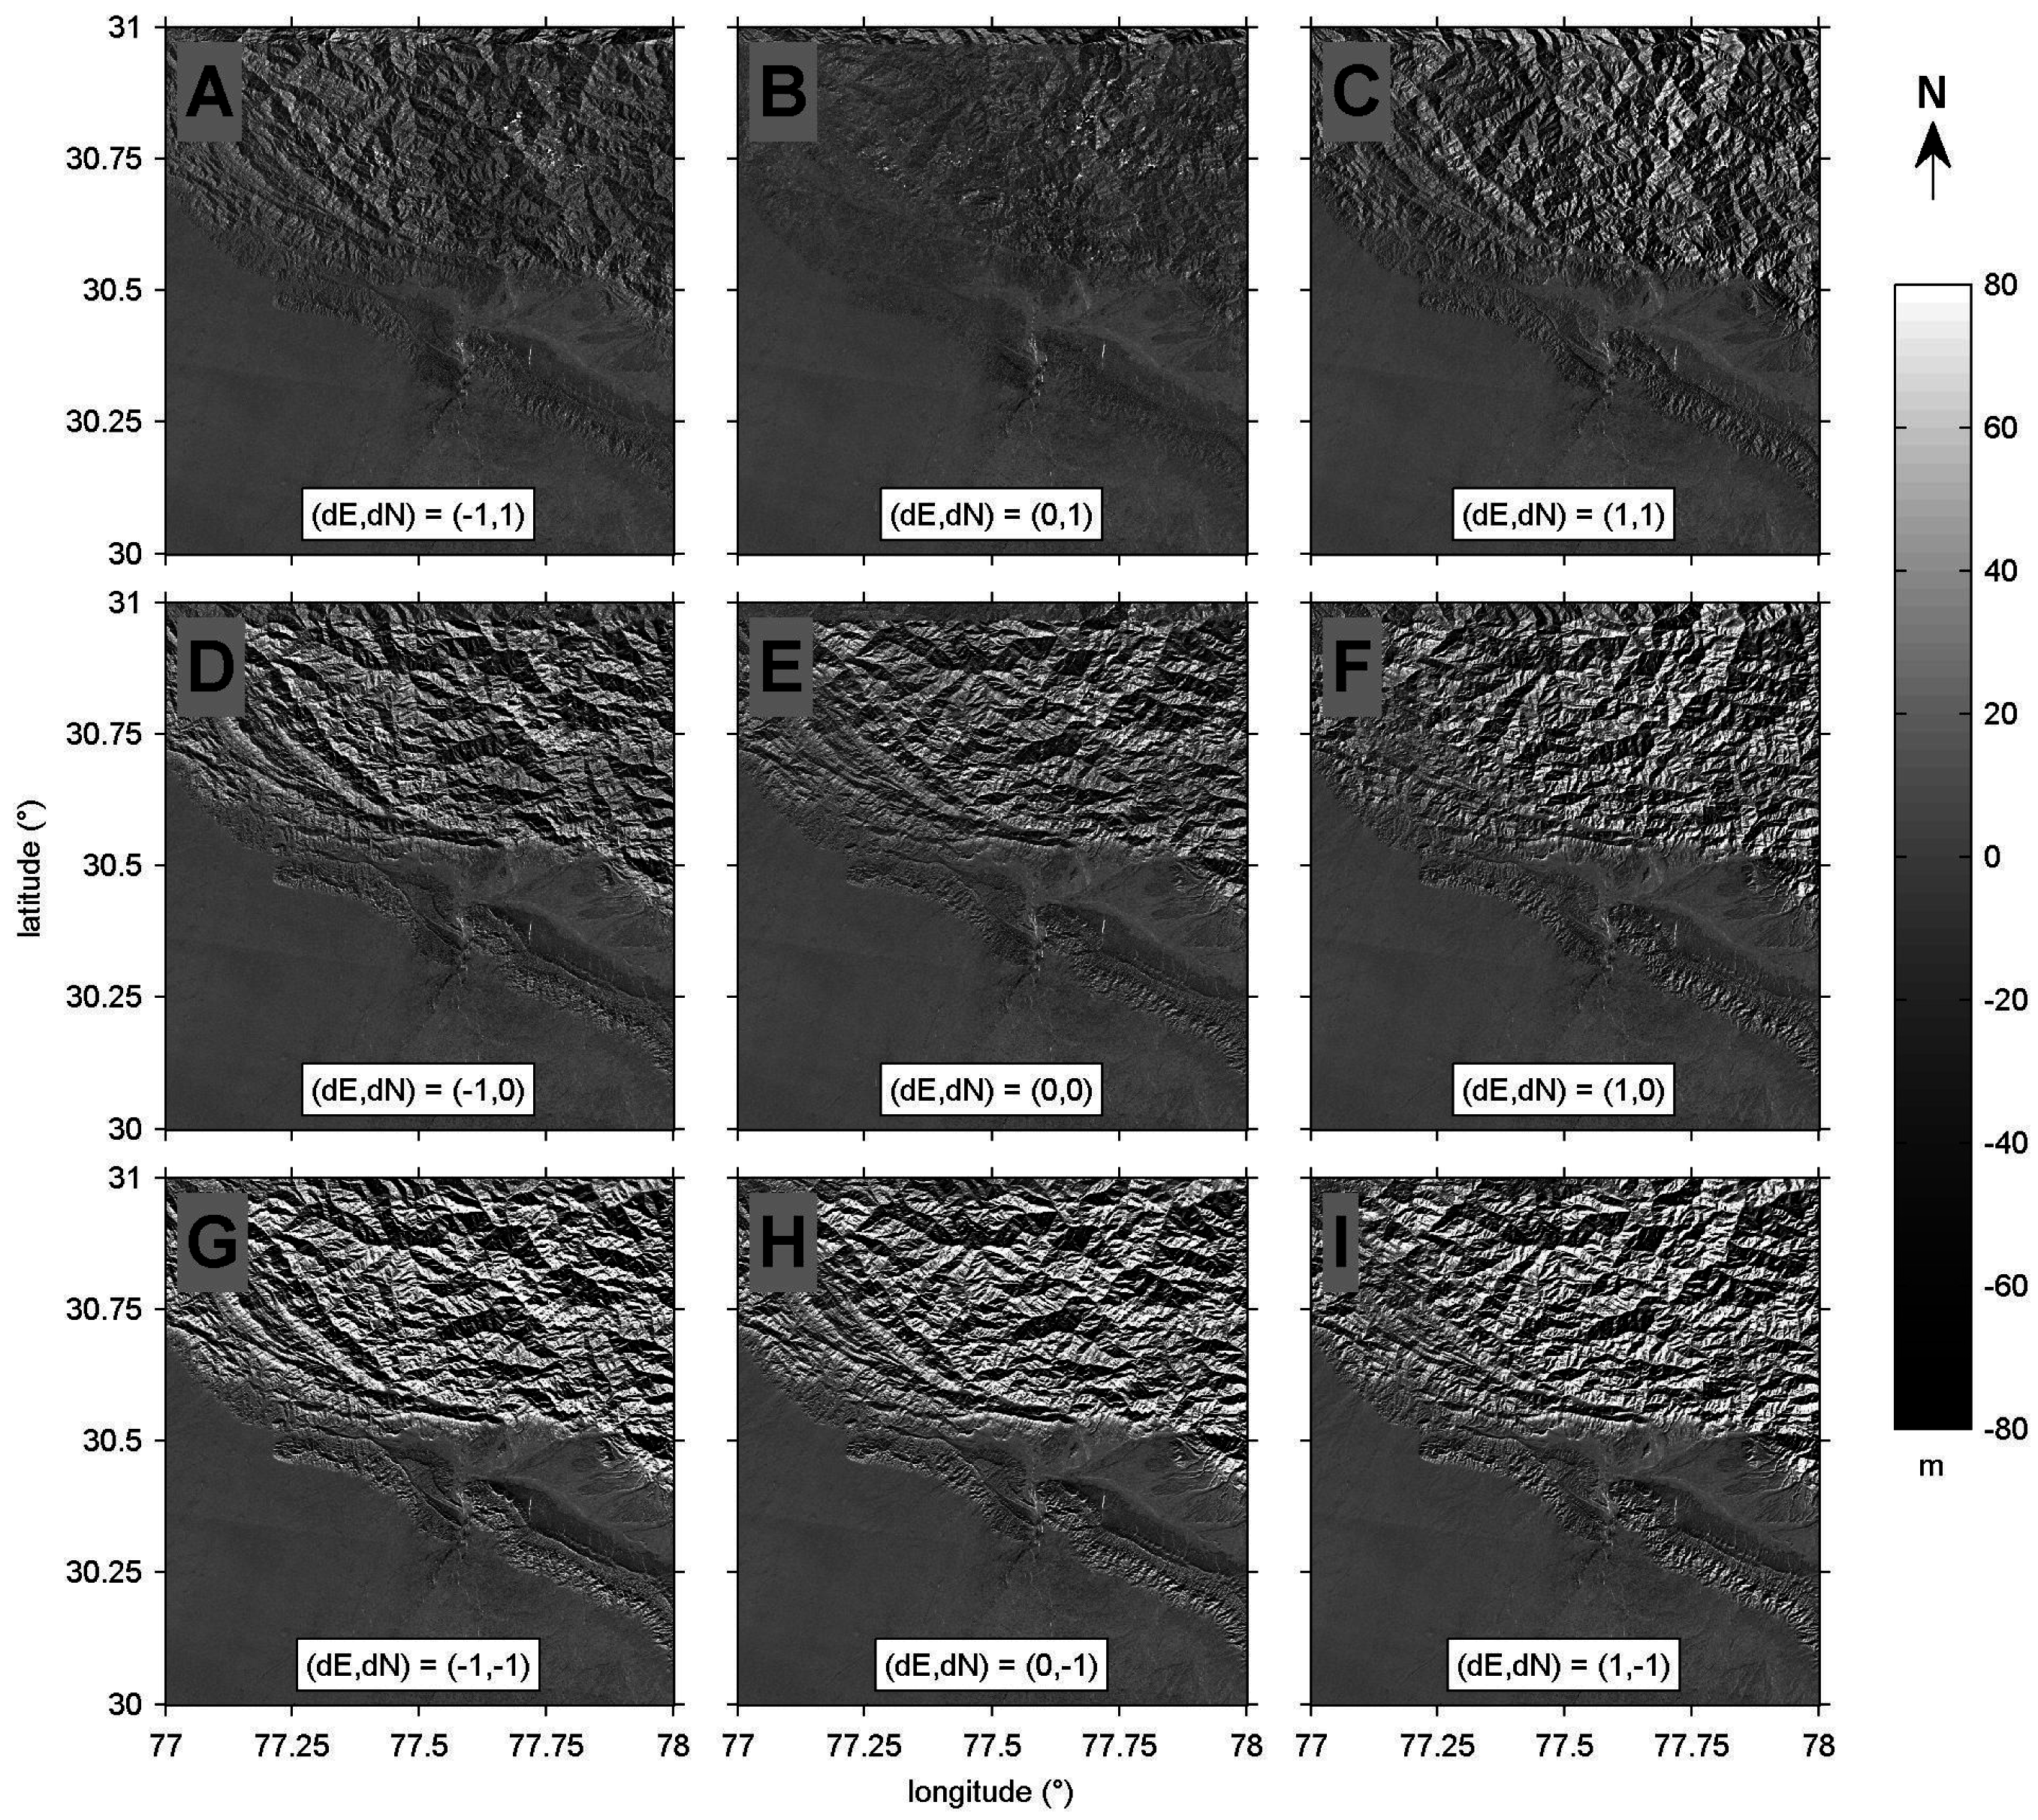
Figure 9.
Spatial derivative in the longitudinal direction of the height difference between (A) SRTM-NASA-v2.1 and 3 arcsec NED DEM (B) SRTM-CGIAR-v4.1 and 3 arcsec NED DEM. The area corresponds to SRTM-NASA-v2.1 tile N52W118. Data voids are shown in dark blue.
Figure 9.
Spatial derivative in the longitudinal direction of the height difference between (A) SRTM-NASA-v2.1 and 3 arcsec NED DEM (B) SRTM-CGIAR-v4.1 and 3 arcsec NED DEM. The area corresponds to SRTM-NASA-v2.1 tile N52W118. Data voids are shown in dark blue.

| Description | Difference Category | ||
|---|---|---|---|
| Type I | Type II | Type III | |
| SRTM-CGIAR-v4.1 tile | 52_06 | 52_06 | 13_02 |
| SRTM-NASA-v2.1 tile | N31E076 | N30E077 | N52W118 |
| dE (pixels) a | 0 | 0 | 0 |
| dN (pixels) b | 0 | 1 | 0 |
| µdh (m) c | 0.00 | −0.04 | −0.02 |
| σdh (m) d | 0.30 | 6.84 | 4.84 |
| Mindh (m) e | −58 | −171 | −278 |
| Maxdh (m) f | 59 | 217 | 297 |
| Valid pixels g (%) | 99.42 | 99.64 | 96.55 |
| Identical pixels h (%) | 99.65 | 96.81 | 32.9 |
a,b Eastward and northward shifts which, if applied to a 1° × 1° SRTM-CGIAR-v4.1 sub-tile, minimize the height differences with the corresponding SRTM-NASA-v2.1 tile; c,d Mean and standard deviation of the height difference between the shifted SRTM-CGIAR-v4.1 sub-tile and the corresponding SRTM-NASA-v2.1 tile; e,f Minimum and maximum height differences; g Percentage of pixels with a valid height value in both DEMs; h Percentage of valid pixels with the same height value in both DEMs.
© 2016 by the author; licensee MDPI, Basel, Switzerland. This article is an open access article distributed under the terms and conditions of the Creative Commons Attribution (CC-BY) license (http://creativecommons.org/licenses/by/4.0/).
Share and Cite
MDPI and ACS Style
Merryman Boncori, J.P. Caveats Concerning the Use of SRTM DEM Version 4.1 (CGIAR-CSI). Remote Sens. 2016, 8, 793. https://doi.org/10.3390/rs8100793
AMA Style
Merryman Boncori JP. Caveats Concerning the Use of SRTM DEM Version 4.1 (CGIAR-CSI). Remote Sensing. 2016; 8(10):793. https://doi.org/10.3390/rs8100793
Chicago/Turabian StyleMerryman Boncori, John Peter. 2016. "Caveats Concerning the Use of SRTM DEM Version 4.1 (CGIAR-CSI)" Remote Sensing 8, no. 10: 793. https://doi.org/10.3390/rs8100793
Note that from the first issue of 2016, this journal uses article numbers instead of page numbers. See further details here.