Article

Capability Assessment and Performance Metrics for the Titan Multispectral Mapping Lidar

1
National Center for Airborne Laser Mapping (NCALM), Houston, TX 77204, USA
2
Department of Civil and Environmental Engineering, University of Houston, Houston, TX 77204, USA
*
Author to whom correspondence should be addressed.
Remote Sens. 2016, 8(11), 936; https://doi.org/10.3390/rs8110936
Submission received: 17 August 2016 / Revised: 20 October 2016 / Accepted: 3 November 2016 / Published: 10 November 2016
(This article belongs to the Special Issue Airborne Laser Scanning)

Abstract

:
In this paper we present a description of a new multispectral airborne mapping light detection and ranging (lidar) along with performance results obtained from two years of data collection and test campaigns. The Titan multiwave lidar is manufactured by Teledyne Optech Inc. (Toronto, ON, Canada) and emits laser pulses in the 1550, 1064 and 532 nm wavelengths simultaneously through a single oscillating mirror scanner at pulse repetition frequencies (PRF) that range from 50 to 300 kHz per wavelength (max combined PRF of 900 kHz). The Titan system can perform simultaneous mapping in terrestrial and very shallow water environments and its multispectral capability enables new applications, such as the production of false color active imagery derived from the lidar return intensities and the automated classification of target and land covers. Field tests and mapping projects performed over the past two years demonstrate capabilities to classify five land covers in urban environments with an accuracy of 90%, map bathymetry under more than 15 m of water, and map thick vegetation canopies at sub-meter vertical resolutions. In addition to its multispectral and performance characteristics, the Titan system is designed with several redundancies and diversity schemes that have proven to be beneficial for both operations and the improvement of data quality.

Graphical Abstract

1. Introduction

Over the past two decades airborne mapping light detection and ranging (lidar), also known as airborne laser scanning (ALS), has become one of the prime remote sensing technologies for sampling the Earth’s surface and land cover in three dimensions (3D), especially in areas covered by vegetation canopies [1]. In addition to the range (spatial) information derived from time-of-flight (ToF) measurements, pulsed airborne lidar sensors deliver an arbitrarily scaled measure of the strength of the optical backscattered signal that is proportional to the radiance incident on the detector, typically referred to as intensity. Intensity is correlated with a target’s reflectance at the given laser wavelength, making it useful in the interpretation of the lidar spatial information [2] or as a standalone data source for identifying the characteristics of the likely backscattering surface for each return [3]. The intensity also depends on other target characteristics such as roughness and the lidar cross-section and on sensor-target geometry parameters including range and incidence angle. Currently the general practice is to digitally scale the “intensity” signal to normalize it to a given range. However, the quality of intensity information can be improved through geometric and radiometric corrections for other factors such as incidence angle, and atmospheric attenuation [4,5,6]. Taken a step further, radiometric calibration methods transform intensities to physical quantities such as target reflectance [7], allowing interpretation with respect to known material spectra.
In the past, intensity information has been used for various applications, including land cover classification [3,5]; enhancement of lidar ground return classification [8,9]; fusion with multispectral and hyperspectral data to enable a better characterization of terrain or land cover [10]; derivation of forest parameters and tree species mapping [11,12,13]; and production of greyscale stereo-pair imagery to generate breaklines traditionally used in photogrammetry through a technique named lidargrammetry [14]. However, the usefulness of lidar intensity information has been fundamentally limited because it provides a measure of backscatter at a single, narrow laser wavelength band. This is usually a near-infrared (NIR) wavelength (1064 or 1550 nm) for topographic lidar systems and a green-blue wavelength [15] for bathymetric lidar systems. Currently, the second harmonic of neodymium-doped yttrium aluminum garnet (Nd:YAG) lasers, 532 nm, is a common choice for bathymetric lidars [16]. This single wavelength spectral limitation has been previously recognized and several experiments have attempted to mitigate it by combining data obtained from individual sensors that operate at different laser wavelengths [17,18] or by observations from prototype multispectral lidar systems [19,20,21]. These multispectral lidar experiments are testament to the potential of this newly developing remote sensing technique, and as with any other technology, the potential is coupled with challenges. Some of these challenges are related to physical principles (atmospheric transparency, background solar radiation, etc.) and hardware limitations (available laser wavelengths, eye safety) [22], while other limitations are related to software and algorithms (e.g., radiometric calibration of the raw lidar intensities) [17].
This paper presents a general overview of the design and performance of the first operational multispectral airborne laser scanner that collects range, intensity and optionally full waveform return data at three different laser wavelengths (1550, 1064, 532 nm) through a single scanning mechanism. This airborne multispectral lidar scanner is the Teledyne Optech Titan MW (multi-wavelength) which was developed based on the specifications and technical requirements of the National Science Foundation (NSF) National Center for Airborne Laser Mapping (NCALM). The system was delivered to the University of Houston (UH) in October of 2014. Since then, the sensor has undergone significant testing, improvement and fine tuning in a wide range of environments [23].
This paper is intended to highlight the flexibility of the Titan to perform 3D and active multispectral mapping for different applications (bathymetry, urban mapping, ground cover classification, forestry, archeology, etc.) without delving too deeply into one specific application. Individual papers that provide more details for specific applications are currently in preparation. The basic research question addressed in this paper relates to the performance of the Titan system, which, given its operational flexibility, has to be assessed using a variety of metrics that vary according to the application. The performance metrics discussed within this work are: (a) the accuracy of experimental ground cover classification based on un-calibrated multispectral lidar return intensity and structural metrics in an urban environment (Houston, TX, USA); (b) maximum water penetration, and (c) accuracy of the measured water depths under ideal bathymetric mapping conditions (Destin, FL, USA, and San Salvador Island, Bahamas); (d) canopy penetration; (e) range resolution in tropical rain forests (Guatemala, Belize and Mexico); and (f) precision and accuracy of topographically derived elevations.
It is important to clarify that since the delivery of NCALM’s original Titan system, the manufacturer has produced other Titan sensors; however, not all units have the same engineering specifications or system design. The design of the sensor is flexible, allowing the exact configuration and performance of the unit to be adapted to the specific needs of a customer. The discussion presented below is specific to the design and performance of the NCALM unit and may not be applicable or reproducible for other Titan units, even though they carry the same make and model designation.
This paper is structured as follows: Section 2 presents a high-level description of the Titan system design and operational characteristics; Section 3 presents the results and discussion of performance tests related to (a) ground cover classification based on multispectral intensity; (b) bathymetric capabilities; (c) canopy penetration and characterization; (d) redundancy and diversity design schemes; and (e) vertical positional precision and accuracy; finally, conclusions are presented in Section 4.

2. Titan Instrument Description

The first Titan MW lidar sensor (Serial number 14SEN/CON340) was developed to meet operational specifications and requirements established by NCALM. The specifications called for a multipurpose integrated multichannel/multispectral airborne mapping lidar unit, with an integrated high resolution digital camera that could seamlessly map terrain and shallow water bathymetry environments from flying heights between 300 and 2000 m above ground level (AGL). NCALM’s operational experience with airborne lidar units operating at 1064 and 532 nm wavelengths, and the requirement to perform simultaneous terrestrial and bathymetry mapping, determined two of the three laser wavelengths. There were several laser wavelengths considered for the third channel, including 950 and 1550 nm; however, the 1550 nm option was selected because of the ease in complying with eye safety regulations, the proven reliability of the laser sources, and because it results in nearly equally spaced (500 nm) spectral sampling wavelengths when combined with the 1064 and 532 nm wavelengths (Figure 1).
NCALM’s Titan has two fiber laser sources. The first source “Laser A” has a primary output at 1064 nm. Part of the 1064 nm output is directly used as channel two for the lidar and another part of the output is passed through a frequency-doubling crystal to obtain 532 nm wavelength pulses for channel three of the lidar unit. The second laser source, “Laser B”, has its output at the 1550 nm wavelength and is used as the source for lidar channel one. Both lasers are synchronized and can produce pulse rates between 50 and 300 kHz, programmable at 25 kHz intervals. The laser output of the Titan corresponds to Class IV as per United States Food and Drug Administration, 21 Code of Federal Regulations 1040.10 and 1040.11; International Electrotechnical Commission 60825-1. The characteristics of the individual laser sources as well as other characteristics of each lidar channel required for assessing system behavior and performance are presented in Table 1.
Other equipment providers offer single-pass multispectral lidar systems by mounting, either in tandem or side by side, individual sensor heads operating at different wavelengths [22]. However, for the Titan system, we required the operation of the different wavelengths’ lasers through a single scanning mechanism to provide near-identical swaths from the three wavelength channels. The channels are arranged such that the 1064 nm channel points at the nadir, and the 1550 and 532 nm channels are pointed 3.5° and 7° forward of the nadir, respectively. The primary reason for this configuration was to minimize returns from the water surface and maximize the probability of water penetration for the 532 nm pulses. A secondary reason was to maximize correlation with legacy lidar datasets collected with a 1064 channel pointing to the nadir. The Titan scanner has a ±30° field of scan and a maximum scanner product (half scan angle × scan frequency) of 800 degrees-Hertz. The beam divergence values are close to 0.3 milliradians for the 1064 and 1550 nm channels and one milliradian for the 532 nm channel (see Table 1). Boresight parameters for each channel are currently determined independently, and combined with the sensor model in the manufacturer’s proprietary software to obtain a geometrically correct and consistent point cloud. Individual point cloud files are generated for each flight line and channel.
The laser return signal is analyzed in real time through an analogue constant fraction discriminator (CFD) [24,25] which detects and records discrete laser returns (range and intensities) at all pulse repetition frequencies. While the system can detect a large number of returns per pulse, it only records up to four returns for each outgoing laser pulse (first, second, third and last). In addition to the analogue CFD, the outgoing and return waveforms of all the channels can optionally be digitized at a 12 bit amplitude quantization resolution and at a rate of 1 gigasample/s. Currently, this digitization can only be done for each outgoing pulse and return waveforms at a maximum PRF of 100 kHz; for higher PRFs, full waveform digitization is only performed for a decimated subset of the emitted pulses.
The Titan is capable of ranging beyond the single pulse-in-the-air limit (range ambiguity), meaning that it is able to obtain accurate ranges at high PRFs when there are several laser pulses from each channel in the air simultaneously before a return from the first emitted pulse is obtained [26,27]. The Titan is capable of measuring in a fixed multi-pulse mode, which means that the sensor needs to be aware of how many pulses are planned to simultaneously be in the air in order to compute accurate ranges. This is done in the planning phase of the data collection. If, for some reason, the actual number of pulses-in-the-air (PIA) is different than the planned value, the system will produce erroneous range values. This fixed multi-pulse capability has certain combinations of ranges and PRFs where the sensor is not able to resolve the range ambiguities and which the manufacturer calls “blind zones”. The PRFs and range regions where the Titan can work without suffering range ambiguity for a given PRF are displayed in Figure 2 as the white regions between the colored bands and labeled according the number of pulses-in-the-air (PIA) at a given time.
Technically, the range ambiguity only occurs at a specific range or multiples of this range value. However, due to the wide scan angle and the forward-looking channels on the Titan (channel 1 and channel 3), the specific range at which the ambiguity occurs turns into a band of range values as it applies to the entire sensor. These blind zones, or, more accurately, ambiguity zones, are depicted as the solid color bands in Figure 2. Figure 2 also illustrates that as the PRF increases, the different PIA regions of operation get smaller. Another way of visualizing these regions of operation is to relate them to how much range variation the sensor can experience within a single flight line as the result of terrain variation or elevation of manmade structures. The higher the PRF, the less terrain relief can be tolerated by the sensor without entering into the range ambiguity regions depicted in the figure.
The laser shot densities obtainable with the Titan are mainly a function of instrument parameters (laser PRF, scan angle, scan frequency), and flying parameters (ground speed and flying height above terrain). However, eye safety regulations and range ambiguity also limit the maximum measurement density obtainable for a specific flying height. Figure 3 illustrates the laser shot density operational envelope of the Titan as a function of the flying height for a single channel and single pass (i.e., no swath overlap). The figure is for reference only and is based on the specific assumptions described below; density values outside the envelope can be obtained under specific circumstances but are not considered to be normal mapping operations.
In Figure 3, the lower limit of the envelope is obtained by assuming the lowest PRF of 50 kHz, a ground speed of 150 knots and a scanner operating at 25 Hz at the maximum field of view (±30°). At lower flight heights the maximum density is limited by eye safety considerations. Each laser PRF has a nominal ocular hazardous distance (NOHD) that increases as the PRF increases. While it is technically possible to operate at higher PRFs at low altitudes, this does not comply with applicable eye safety regulations and thus it is necessary to use the maximum PRF that ensures exceeding the NOHD at ground level (see Figure 3). The upper limit of the envelope is obtained by assuming the highest possible PRF for a given flying height (taking into account the range ambiguity regions), a ground speed of 150 knots and a scanner operating at 70 Hz and a very narrow field of view (±10°). The peaks and valleys in the upper envelope limit are caused by the range ambiguity regions (Figure 2) given that for specific flying heights the Titan’s maximum operation PRF of 300 kHz per channel falls within a range ambiguity region and thus the PRF has to be reduced to measure unambiguous ranges.
The digital camera integrated into the Titan sensor is a DIMAC Ultralight (also known as D-8900). The D-8900 is based on a charged coupled device (CCD) with 60 megapixels, each with a dimension of 6 μm × 6 μm. The pixels are arranged in an array of 8984 pixels oriented perpendicular to the flight direction and 6732 pixels along the flight direction, which translates to a CCD physical frame size of 5.39 cm × 4.04 cm. The image is formed on the focal plane through a compound lens with a nominal focal length of 70 mm. The combination of the lens and CCD array yields a total field-of-view (FOV) of 42.1 × 32.2 and a ground sample distance (GSD) of 0.0000825 × flying height. The position of the CCD is adjusted during flight by a piezo actuator to compensate for the motion of the aircraft during an exposure, reducing the pixel smear at very small GSDs. The digital camera can be triggered in a variety of modes (time interval, position) from the Titan control software, or independently through its own control software. In addition to its integrated camera, the Titan system can interface with other imaging sensors; for example, NCALM has integrated the Titan with an ITRES CASI-1500 hyperspectral camera.
Physically, the Titan consists of a sensor head and sensor control rack. The sensor rack in its base configuration consists of an electrical power unit and a control computer. Depending on what components are being operated in conjunction with the lidar sensor, the control rack can also incorporate up to three additional control computers for the waveform digitizers (one per channel) and the control computer for the digital camera. The sensor head is basically a cylinder with a box on the top; the cylinder houses the optical components (scanner, camera, lasers) and the system inertial measurement unit (IMU), and the box on top encloses the electronic components of the sensor. The cylinder has an approximate diameter of 45 cm and a height 55.5 cm. The sensor control rack is enclosed in an Edak transit case with a standard 19-in-wide rack and a footprint of 2600 cm2. Figure 4 shows photos of the Titan sensor integrated on a DHC-6 Twin Otter airplane.

3. Field Testing of Capabilities

Since the delivery of the Titan sensor to NCALM in October 2014, the sensor has been used to collect data for more than 30 projects across the United States and in remote locations such as Antarctica and the Petén jungle in Guatemala. With over 140 h of laser-on operation, the Titan sensor has been tested in a wide variety of environments, for diverse applications and throughout its design operational envelope. Table 2 presents details of the mapping and test projects acquired with the Titan sensor. In addition to project data collection, NCALM has also performed tests to assess the performance of the sensor under different operational conditions. This paper presents results from some of these performance tests focused on ground cover classification based on multispectral lidar intensity and structural metrics in urban environments, bathymetry (maximum detectable depth and accuracy of bathymetric elevations), the ability to penetrate thick tropical forest canopies, the ability to finely resolve the vertical structure of vegetated environments (range resolution), and its vertical positional accuracy.

3.1. Multispectral Capabilities

The Titan senor was designed as a flexible multi-purpose and multi-application system; therefore, it may not outperform systems that were designed exclusively for bathymetry or for topographic mapping from high altitudes. However, one application for which it can excel is providing high resolution active multispectral data derived from lidar intensity. In theory and in practice, multispectral lidar intensity can be used for many applications, including return/target classification [28,29]; individual tree identification, parameterization and classification [30]; water/land interface identification; and archaeological feature detection [31], among many others. Several years will go by before scientists in each of the above-mentioned fields will have an opportunity to assess the utility of the Titan multispectral lidar datasets as compared to what has been theorized or experimented so far. For brevity, this paper will only briefly describe the use of Titan multispectral data to generate active lidar intensity images, describe the advantages and limitations of these intensity products and provide an example of ground cover classification using Titan data.
It does not take much imagination to realize that the simplest way to use multispectral lidar intensity is to enhance the visualization of lidar data, just as single-wavelength intensity values have been used in the past. As such, the most basic way of utilizing the multispectral intensity is for rendering false colored point clouds, where the intensity of each return is used to assign hue saturation and brightness values. In this application, the hue and saturation are assigned based on the laser wavelength and the lidar return intensity value determines or modulates the brightness value. The advantage of this approach is that the renderings can retain the precise and complex 3D spatial nature of the lidar data despite the return locations being irregularly spaced.
Multispectral lidar intensity can also be used to generate two-dimensional (2D) active intensity images by combining the spatial and spectral information of each laser return. There are several approaches to produce intensity imagery from irregularly spaced lidar point cloud data. The first and simpler method consists of assigning a greyscale value corresponding to the lidar intensity to each return and then rendering the point cloud in two dimensions to create a top-view intensity image. A second approach, which is more elaborate and provides more control over the spatial integrity of the image, consists of interpolating the intensity values into a regular two-dimensional horizontal array (grid) using methods such as triangulation with linear interpolation, kriging, or inverse distance weighting, etc. This method is particularly useful when the horizontal distribution of the lidar returns is sparse as compared to the desired grid (raster) resolution.
When the return density is high enough to provide several laser returns per raster cell, it is possible to use a third approach. This approach consists of deriving a single intensity value for each raster cell from the intensity values of all the returns within the given raster cell. The resultant intensity raster can be produced by averaging intensity values using simple or weighted methods or determining minimum, maximum, standard deviation or any other statistical metric to characterize the returns’ intensity within the raster [32]. Herein, we refer to this approach as “binning”. One advantage of binning, especially when it uses some sort of averaging mechanism, is that it reduces the variability of intensity values due to factors that are difficult to account for, such as irregular incidence angles and varying surface roughness. However, the greatest advantage of this method is that it enables the generation of false color imagery from multi-wavelength lidar intensities even when the centers of the footprints at the different wavelengths may not be exactly collocated, which is the case for the Titan sensor.
Figure 5a–c show intensity images generated using the binning method for data collected with the Titan sensor over the campus of the University of Houston. When intensity information is available for three or more independent wavelengths, it is possible to generate false color RGB imagery. In the case of the Titan, with three different wavelengths, it is possible to combine the intensity images in six different arrangements. Figure 5d shows a false color RGB combination using the intensity from the 1550 nm wavelength as the red channel and the 1064 and 532 nm wavelengths’ intensities for the green and blue image channels, respectively. By combining independent intensity images into a false color RGB image, it is possible to access the multidimensionality of the color space which can highlight features that perhaps are not easily identified in a single-wavelength grayscale intensity image.
In addition to using binning to generate intensity rasters, the same technique can be applied to the elevation values of the returns within a bin to generate what in this paper are referred to as “structural” images (Figure 5e–g), as they provide information on the vertical structure of the targets within a raster cell. Similar to the way the intensity images are produced, the structural images are produced by assigning a single value to the raster based on some statistical measure derived from the elevations of the returns within a cell. These structural rasters can be generated from either absolute geodetic elevations (ellipsoidal or orthometric) or relative elevations such as height above local ground. For land cover classification purposes, statistical dispersion metrics such as elevation spread and standard deviation can be computed from either absolute or relative elevation values. However, for averaged elevation metrics to be of any use for classification, they need to be computed from relative elevation above local ground values. These structural images have great potential for assisting land cover classification tasks because different kinds of targets (buildings, roads, trees, power lines, etc.) have very distinct elevation signatures. Other structural metrics can be derived not only from elevation values but from return statistics such as the number of returns detected from a given raster cell (return density) and the ratio of returns to laser shots (Figure 5g). These return metrics images can be used to segregate impervious (roads, ground, building roofs) and diffuse targets (vegetation and water). Structural metrics from different lidar wavelengths can also aid in land cover classification. For example, a difference in mean elevation between structural images based on the 532 nm and either of the NIR wavelengths, for a given set of pixels, will indicate a potential water body, because the 532 nm wavelength may produce multiple returns from the water surface, the water column and the benthic layer, while the NIR wavelengths will detect returns only from the water surface or no returns at all.
Active intensity and structural images have some advantages over traditional passive images; specifically they: (a) eliminate the dependency on solar illumination (imagery can be collected at night or below the cloud ceiling); (b) greatly reduce the effects of shadowing and occlusions caused by buildings and topography; (c) provide good knowledge of the illumination source (wavelength, amplitude, phase, polarization, etc.) which, in principle, should allow for easier calibration to remotely obtain target physical properties; and (d) provide images that are almost perfectly orthorectified, only limited by the positional accuracy of the lidar returns. However, there are also limitations or disadvantages of active intensity imagery, including: (a) the limited number of available laser wavelengths defined by the energy level transitions of the lasing materials and processes; (b) atmospheric attenuation of laser energy in the visible and near-infrared wavelengths by low altitude (below sensor flying level) atmospheric phenomena such as clouds, haze and fog; and (c) the target surface is only partially illuminated (spatial sampling) by the lidar beams rather than fully illuminated as in the case of passive imagery where almost the entire area (with the exception of areas with shadows) is illuminated by the sun. The active lidar intensity and structural images can be analyzed with the same techniques that are used to analyze images derived from passive optical sensors, for example to generate land cover classification maps (Figure 5h).

3.1.1. Land Cover Classification Based on Active Spectral and Structural Data

To illustrate the multispectral capabilities of the Titan sensor, this section presents and discusses results from an experiment conducted with the goal of assessing the value of lidar multispectral intensities for the purpose of ground cover classification. Data for this experiment was collected with the Titan sensor on 16 October 2014 over the campus of the University of Houston located in Houston, Texas. The collection was performed from 500 m AGL with the scanner running at full scan angle (±30°) and a PRF of 250 kHz per channel; the swaths had a lateral overlap of 50% (edge of swath over the centerline of the adjacent swath).
For this experiment, the raw intensities obtained by the sensor were only normalized by range and no further geometric or radiometric calibration or correction was performed. The intensity information from each of the Titan channels was binned into 2 m resolution images by averaging the intensity of all the returns within the bin. The raw images were then rescaled to a range of 0–255, assigning the 99th percentile of the intensity values a digital number of 255 (Figure 5a–c). In addition, five structural images with a 2 m resolution were generated by binning height values of the returns (Figure 5e–g). These structural images are based on the average height of returns above ground, the spread of the returns’ height (max height–min height), the number of returns per pulse, the number of first returns and the number of total returns. All of these structural metrics were generated from Titan channel 1 data.
Five ground cover classes were targeted for classification: grass/lawn, road/parking, trees and short vegetation, commercial buildings and residential buildings. The training and validation samples used to run and assess the accuracy of the classification were selected from the training and validation datasets originally prepared for use in the 2013 Institute of Electrical and Electronics Engineers (IEEE) Geoscience and Remote Sensing Society (GRSS) data fusion contest [33]. The contest dataset was developed based on the analysis of high resolution imagery and ground verification collected in 2012, and contains samples from 15 ground cover classes. For the experiments presented here, the 15 ground classes were merged into the five classes previously described. Because of the temporal difference between the collection of the validation and the test data, some areas in the test data were masked due to the significant changes that occurred in the interim time period. Table 3 presents the number of pixels used for training and validation for each of the target classification classes.
Eight different image stacks were generated, based on the combination of different spectral and structural images (refer to Table 4). The contents of these image stacks were varied and included stacks that contained: (a) only the five structural bands (what was available from the first-generation lidar systems without intensity measurements); (b) five structural bands plus one intensity band (what was available from the early generation of lidar systems); (c) five structural and the three intensity images (what is available with the Titan system); and (d) only the spectral information from the three Titan channels. The purpose of generating these sets of images that contained progressively more information was to assess how the quality of classification improves as more spectral information is made available, representing the technological progression of lidar systems.
Two supervised parametric classification methods were selected for the analysis: the Mahalanobis distance and the maximum likelihood classifiers. The Mahalanobis distance is the most rigorous of the minimum-distance-to-means supervised classifiers that do not consider training sample variance, while the maximum likelihood classifier not only considers the distance between training sample means but also considers the sample variance [34]. Using two different classification approaches allows an assessment of trends in the classification accuracy analysis. The results for the classification experiments are presented in Table 4. The results are consistent with initial expectations: having more independent spectral and structural data sources enables higher-accuracy classification results. With only structural information, the classification accuracy is only at 55%–65%; once spectral information from one intensity channel is added, the accuracy rises to 90% (for the maximum likelihood classifier and the image stack that contains the 1064 nm intensity). The results indicated that the intensity band that provides the most separability between the selected classes is 1064 nm. If only spectral information from the three different channels is utilized, the classification accuracy ranges between 74% and 78%. It is interesting to note that the best classification accuracy obtained (90.22%) was from an image stack that contained all structural images and only two of the intensity images (1064 and 532 nm). The best classification accuracy based on the image stack that contained all the spectral and structural images was 88.15%, which is just marginally below the overall best result.
The reason behind this reduction in the classification accuracy, when going from two to three intensity bands, has to do with the role of the intensity bands in training the classification algorithms for the residential and commercial building classes. These two classes are very similar in structural bands (most of the difference is from the height above ground band). With more intensity bands, the within-class variance of the commercial buildings increases drastically (given the wide variety of materials used in constructing or covering of the rooftops). This in turn increases the correlation between commercial and residential building classes and results in misclassification of residential buildings into the commercial buildings class and, therefore, a higher omission error for the residential buildings class and a higher commission error for the commercial buildings class.
This classification experiment is relatively basic; however, it does showcase the usefulness and promising future of active intensity images and multispectral lidar even when the intensity values have not been calibrated or corrected to reflectance estimates. Performing more complex intensity corrections and ground cover classification experiments is outside of the scope of this paper. However, it is worth mentioning that other research groups are performing such experiments based on Titan data with very promising results [29,35], while others have been actively working on the field of radiometric calibration of single and multispectral lidar intensities [4,6,7,17,36].

3.1.2. Qualitative Multispectral Observations

Besides the analytical classification results described in Section 3.1.1, it is also possible to combine the false color active multispectral images with other structurally derived products to produce data visualizations that exploit the complementary nature of the three-dimensional spatial and three-wavelength spectral information of the Titan data. Figure 6c illustrates the combination of spectral and spatial information obtained with the Titan sensor for the Mesoamerican archaeological site of Teotihuacan in central Mexico. Figure 6c was generated by overlaying a false color image derived from the Titan’s multispectral intensity (Figure 6a) over a 3D surface model derived from the lidar spatial data (Figure 6b). Figure 6a is the 2D active multispectral image where the information for the red, green and blue image channels was derived from the 1550, 532 and 1064 nm intensities, respectively.
Renderings like the one presented in Figure 6c enable researchers to visualize the relationship between topography and spectral features in a single hybrid domain. In this case, because the archaeological site is only sparsely covered with vegetation, it is possible to visually discriminate among a multitude of surface differences. Areas with short shrubs and grasses appear in yellowish-brown tones, areas with loose gravel or bare compacted soil that are used for pedestrian traffic appear in greenish tones, and areas that are used for parking lots appear as bright red-pinkish areas. It is even possible to discriminate between vegetated areas that appear to be under different levels of water stress. One such area is the quasi-circular feature characterized by a reddish-brownish tone marked with a black arrow in Figure 6a. This type of combined height relief and spectral data and visualization are very promising for the field of archaeology, especially in deserts and sparsely vegetated areas, as illustrated here and by a previous experiment in a Roman cultural setting and European landscape [37]. As more multispectral lidar data is made available to the research community, its utility for identifying archaeological features will become more apparent.
Similar discrimination capabilities based solely on lidar intensity have been observed in other datasets. For instance, in data collected at the US McMurdo Antarctic Station it was possible to discriminate between snow that was mechanically compacted to make ice roads from snow that was not disturbed. Figure 7 illustrates this differentiation between compacted and loose snow. Figure 7c,d are active intensity images generated from channels 1 (1550 nm) and 2 (1064 nm), respectively, where the ice roads have been marked with the aid of yellow arrows. These roads are also evident in Figure 7b which is a perspective view of a 3D digital surface model that has been overlaid with a false color multispectral lidar image.
Other spectral characteristic that will prove very useful in the future, specifically for automatic bathymetric processing, will be the ability to automatically delineate the water-land interface based solely on multispectral intensity. Several studies have already been conducted into this water-land interface delineation with single-wavelength lidar sensors [38,39], but the improvement based on multispectral intensity still needs to be investigated.

3.2. Bathymetric Capabilities

A principal design criterion for the Titan was the ability to perform seamless high resolution bathymetric and topographic mapping in areas where the terrestrial and aquatic domains overlap (marshes, rivers, lakes, coastal and estuarine). This criteria was meant to improve upon the capabilities obtained with the single-wavelength Aquarius lidar bathymetric sensor described in [16]. The Titan bathymetric channel is designed based on a performance specification of 1.5/Kd considering a flying height of 400 m above water and a benthic reflectivity of 20%. Kd is the diffuse attenuation coefficient [40] for water at the 532 nm wavelength and can be conceptually simplified as a measure of the “transparency” of the water. The 1.5/Kd performance specification establishes a theoretical limit for the water penetration capabilities of the Titan for a given benthic reflectivity and flying height. For example, if the Kd of the water body is 0.5 m−1, then the maximum water penetration would be 1.5/0.5 = 3 m. If the Kd is 0.1 m−1, the maximum depths that could be mapped would be around 15 m, assuming the same bottom reflectivity and flying height.
Bathymetric projects have been performed in river, coastal and ocean environments (see Table 2). The results presented below are from experiments performed near Destin, FL, USA, more specifically over the East Pass, which is the entrance to Choctawhatchee Bay from the Gulf of Mexico, and it is located to the west of Destin (Figure 8). The East Pass is protected from the shifting sands of the Gulf of Mexico by twin channel jetties, which were constructed by the U.S. Army Corps of Engineers (USACE). The East Pass channel is regularly dredged to maintain the mean channel depth. This is a good location for testing the bathymetric performance of the system under close to ideal conditions, meaning very clear water and a very reflective benthic layer. The East Pass is also a good test location because within a relatively small geographic area the water depth changes dramatically from very shallow to depths of more than 15 m. In addition, the constant flow of water moving in and out of the inlet produces complex sand features which are ideal for elevation accuracy assessment, and the subaquatic environment contains areas of bare sand and areas covered by sea grass which provide variation in the benthic reflectance.
The red line on Figure 8 represents the flight line track that was flown for the tests, with one end on the Gulf side of the inlet and the other on the bay side. Bathymetric testing in this area was conducted twice, the first time on 19 August 2015 and the second time on 11 May 2016. This double collection was due to the fact that, during the first data collection, it was discovered that the energy output of the 532 nm channel, which is the one responsible for the bathymetry measurement, was severely degraded. The laser source for the 1064 and 532 nm channels was eventually replaced and the test repeated. The results from the water penetration test come from the data collected in May 2016 and the data for the accuracy assessment of measured water depths comes from the August 2015 collection. It is important to note that the results presented in the sections below are derived from the discrete output of the bathymetric channel. Full waveform data were also collected during these bathymetric tests; however, processing and analysis of the waveform data is outside the scope of this paper.

3.2.1. Maximum Water Penetration

For the water penetration tests, the flight line was acquired a total of six times from two different altitudes above the water level (300 and 500 m). These altitudes represent the upper and lower limits of the recommended bathymetric operational envelope for the Titan. Each time the line was flown, the system PRF was varied between 75 and 200 kHz. These configurations of altitudes and PRFs allow for an assessment of the bathymetric performance of the Titan across the bathymetric PRF-altitude envelope.
The results summarized in Table 5 indicate a fairly uniform performance across the PRF operational spectrum, which is a considerable improvement with respect to the Aquarius system, which displayed better penetration performance for lower PRFs [16] due to the higher energy per pulse at lower PRFs. As expected, there was a small decrease in the penetration performance as the flying height was increased from 300 to 500 m above the water. The maximum mapped depths obtained from the Titan are comparable to the ones obtained with the Aquarius sensor at its highest PRF of 70 kHz. Some deeper measurements were obtained by the Aquarius on the bay side of the pass at its lowest PRF of 33 KHz [16]. However, the Titan performance is superior to the Aquarius with respect to bathymetric return densities, doubling the Aquarius densities even when the Titan returns are spread over a wider swath. The penetration depths are lower on the bay side of the pass mainly for two reasons: (a) the Kd parameter value is higher on the bay side due to organic and other suspended solids; and (b) the presence of sea grass reduces the reflectivity of the benthic layer.
As previously discussed, the maximum detectable depth of the sensor is extremely dependent on both the water transparency and bottom reflectance. The 10.4 m obtained for the Destin test are by no means the deepest that the Titan sensor can map. On a mapping project on the island of San Salvador, Bahamas, depths greater than 15 m were detected from a flying height of 500 m and a PRF of 175 kHz for the bathymetric channel. Figure 9 presents a small sample of the bathymetric results obtained in the Bahamas. Figure 9a is a rendering of the first return point cloud for the Titan bathymetric channel, colored by flight line and intensity. This point cloud rendering illustrates segments of three overlapping flight lines. Figure 9b is an image map generated from the topographic and first-order-corrected bathymetric DEM. The map is color-coded by elevation from the water surface at the time of collection. Figure 9a illustrates that laser pulses were fired and produced water surface returns for the entire length of the flight line segment. However, bathymetric returns (Figure 9b) were only detected for a subsection of each of the swaths lengths. The bathymetric detection cutoff runs at an azimuth of about 35° east of north and it occurs at an acute angle with respect to the orientation of the flight swaths which have an azimuth of 10° east of north (Figure 9a). This bathymetric detection cutoff aligns with the San Salvador Island shelf, and the maximum detected depth along the cutoff boundary for this section of the project area was 16.8 m.
Additional experiments that require complementary measurements, such as water turbidity, Kd values, Secchi depths and bathymetric reflectance and elevations, are necessary to rigorously determine if the Titan performs to the 1.5/Kd specification. However, the initial results from tests and mapping flights are very promising both in terms of depth penetration and bathymetric density.

3.2.2. Accuracy Assessment of Measured Water Depths and Bathymetric Elevations

The maximum lidar bathymetric mapping depth is just one of the important bathymetry performance metrics; another critical factor is the accuracy of the measured water depths and bathymetric elevations. The accuracy of the determined water depth is of importance, because the position of the bathymetric returns needs to be corrected for the refraction of the laser path in proportion to the distance the laser beam traveled through the water. To perform an independent water depth accuracy assessment, validation data were collected with a SonTek acoustic Doppler current profiler (ADCP) (San Diego, CA, USA) during the August 2015 bathymetric tests near Destin, FL, USA. The ADCP was mounted on a small catamaran that was towed with a pontoon boat. A geodetic-grade dual frequency marine antenna (Ashtech 700700; Sunnyvale, CA, USA) was mounted over the ADCP electronics box and connected to a Trimble NetR9 receiver to provide precise post-processed differential GPS positions using a GPS reference station no more than 10 km away (see Figure 10a). The ADCP sensor head has three transducers and takes depth and water flow measurements every 5 s. A total of 2489 measurements were collected along the boat track, the white trajectory in Figure 8. SonTek reports a depth resolution of 0.001 m and a best scenario accuracy of 1% over the range from 0.2 to 15 m.
The ADCP data were collected on 20 August 2015, while the lidar data were collected the previous day (19 August) around the same time of day, making the tidal difference negligible. The water height at the time of the airborne survey was determined based on the information from Titan channels 1 and 2. Water depths were determined by applying a 1.33 [41] first-order refraction correction (correction just for the vertical component) to the differences between the infrared channels and channel 3 (532 nm) elevations. A geographic subset contained within the main section of the East Pass was considered for the accuracy assessment. A total of 423 ADC samples and coincident lidar-derived depths were utilized. Figure 10b shows a dispersion plot of the validation and lidar depth samples; the agreement between these data sets is good with an R2 of 0.92 and an root mean square error (RMSE) of 0.26 m. This RMSE value is consistent with other various bathymetric depth or elevation accuracy values reported for the Aquarius bathymetric Lidar system [16,42,43], and for the Experimental Advanced Airborne Research Lidar-B (EAARL-B) system [44].
From Figure 10b it should be noted that there is a higher dispersion between the lidar-derived water depths and the reference ADCP data at larger depths. This is due to several factors which include the selection of the 1.33 refraction correction factor and only applying a refraction correction to the vertical component of the benthic return. The vertical component correction is a simplification that allows for a faster computation of the benthic elevations without introducing a significant vertical error for very shallow water depths. For the Destin project site, which has a gentle bathymetric slope that, on average, is less than 0.1 m/m, the maximum modeled vertical error induced by not considering the horizontal refraction correction is 0.08 m at a water depth of 10 m.

3.3. Canopy Penetration and Canopy Characterization Capabilities

ALS or airborne mapping lidar has become the de facto standard remote sensing technique to obtain ground surface elevations underneath forest and vegetation canopies and it has enabled multiple scientific applications in fields that range from archaeology to tectonics [1]. It has also been used extensively for forestry studies over both large scales [45] and for individual tree detection and biophysical parameter estimation [46,47]. Two important capabilities of ALS systems related to forested environments concern both the ability of the laser signal to penetrate the canopy to produce accurate and dense ground returns and the ability to finely and precisely define the vertical structure of the canopy (related to range resolution). The following sections will present and discuss experimental results aimed at characterizing the performance of the Titan sensor with respect to canopy penetration and laser range resolution in vegetated environments. The tests for these characteristics were performed in the tropical rain forests of Central America and Mexico. The complex and thick canopies of these forests represent the most challenging and, thus, the ideal location to perform these assessments. It is important to note that the data used for the following analyses comes from the analogue discrete detector of the Titan. In theory, if similar analyses were performed from data derived from the analysis of full waveform returns, the performance of the system could be better. However, the analyses using the waveform data are outside the scope of this paper.

3.3.1. Canopy Penetration

There have been several experiments aimed at understanding the influence of sensor configuration and forest physical parameters on the canopy penetration performance for lidar systems [48,49,50,51,52]. All of these experiments have produced interesting and promising results; however, these studies have been limited in several aspects: (a) they analyze canopy penetration by isolating one system or flight parameter at a time without considering the tradeoff between different parameters (altitude, PRF, divergence, etc.); (b) they have been performed for a single homogenous study area; (c) while they provide metrics on the detection of ground returns as a ratio of ground returns to total returns, these metrics do not account for how much of the target area was illuminated or how the energy per pulse varies as a function of the system PRF; (d) finally, they analyze data collected from single sensors that are from older technological generation(s) and are not representative of the current state-of-the-art.
NCALM has conducted similar experiments aimed at understanding how to optimize the configuration of lidar systems to maximize the detection of ground returns through canopies in different types of forests [53]. Besides conducting canopy penetration experiments in different kinds of forested environments, NCALM experiments are unique because emphasis has been placed on understanding the pulse energy characteristics of the laser source as a function of the pulse repetition frequency. Previously reported experiments [53] were performed with legacy lidar systems (Optech 3100, Gemini and Aquarius). These systems were powered by Q-switched solid-state laser sources. An operational characteristic of such laser sources is that the output laser energy of each laser pulse decreases when the PRF is increased [53]. Based on this characteristic, maximizing canopy penetration with these older systems is achieved by a tradeoff between illuminating as much of the target area as possible, which is directly proportional to the PRF while maintaining enough energy per pulse to ensure the round trip of the laser pulse through the canopy and back to the sensor (which is inversely proportional to the PRF). Of course, both of these factors are also affected by the flying height of the system. An advantage of the Titan fiber laser sources is that the energy per pulse does not degrade significantly as the PRF increases (Table 1).
The experiments conducted to date with the Titan, the results of which are presented in Table 6 below, reinforce the importance of the energy budget for canopy penetration. However, the energy characteristics of the Titan laser sources allow for good canopy penetration even at high PRFs. Similar to the bathymetric performance tests, these canopy penetration tests are conducted by flying the same flight line over a densely vegetated area several times with varying PRFs and/or flying heights. These experiments have been performed in the tropical forest near the archeological sites of Calakmul in Campeche, Mexico (test area 280,020 m2), Lamanai in central Belize (test area 640,726 m2) and El Ceibal in el Petén, Guatemala (test area 407,694 m2). Once the point cloud data were produced for each of the test flight strips, data samples common to all of the test strips were cropped to produce identical areas that were then processed to obtain shot and return statistics including ground return statistics. The returns are processed to obtain ground returns using the Axelsson algorithm [54] implemented in the Terrasolid Terrascan software. For consistency, all the above described test areas have been processed using the same classification parameters (maximum building size 30 m, maximum terrain angle 88°, maximum iteration angle 12°, maximum iteration distance 3 m). The statistical results recorded for these experiments include: the number of laser shots fired, the number of first, second, third and last returns obtained, the number of returns per fired shot, the number of ground returns detected, the fraction of shots that produced secondary, tertiary, last and ground returns, as well as the associated densities. All of these metrics were analyzed, but for brevity only a subset of these are summarized in Table 6.
As previously stated, to ensure good canopy penetration and good ground sampling, it is important that there is enough energy per laser pulse to ensure two-way travel from the sensor to the ground and back. In a complex multi-story canopy this also translates into the ability of the sensor to detect multiple returns as the laser pulse propagates through the canopy. This is why Table 6 includes information related to the average number of returns produced per laser pulse. The higher the number of returns per pulse, the higher the probability that a fraction of those returns will be from the ground. The table also presents the number of returns that were classified as ground by the Axelsson algorithm as well as a fraction of returns for which ground returns were detected; it also summarizes the shot and ground return densities.
The first seven rows in Table 6 present results from tests performed in Calakmul and compare results obtained with the Optech Gemini (rows two to four) and Titan lidar sensors (rows five to seven). The Gemini data were collected on 23–24 May 2014 and the Titan data were collected on 18 May 2016. All data were collected from a flying height of 500 m above ground level. The results for the Gemini data are meant to illustrate how the canopy penetration performance for that sensor degraded as the system PRF was increased while all other parameters remained constant. The results indicate a reduction of 22% in the number of returns produced per laser shot when the PRF is increased from 70 kHz to 125 kHz. Perhaps more important was a reduction of 65% in the number of shots that produced ground returns which varied from 26.9% of shots at 70 kHz to only 9.4% of shots at 125 kHz. Another interesting comparison is that despite a shot density that was more than double for the 125 kHz (as compared to 70 kHz), the ground return density was 20% higher for the 70 kHz test line. This last comparison illustrates that for canopy penetration and ground return detection, it is not the quantity of fired laser shots that matters but, more importantly, the quality of the shots, which is determined by the energy contained in each laser pulse.
The Titan data for the Calakmul test area is not directly comparable to the Gemini data due to the temporal separation between the collections, which was compounded by a severe drought that hit the region after 2014. However, it is worth highlighting certain key points in the comparison of the Titan and Gemini data for Calakmul. First, despite the thinner canopy during the Titan collection as a result of the drought, the number of returns per laser pulse obtained in all of the channels of the Titan sensor is higher than the comparable results obtained with the Gemini at the same system PRF of 100 kHz, and for that matter, to all tested Gemini PRFs (70, 100 and 125 kHz). Second, the results from the Titan data are separated by channel. This is important because (a) each channel has different beam divergences and pulse energy values, which modify the energy density of their resultant footprint; and (b) each channel has different look angles, as previously described. Even if energy or power density were the same for all channels, the imaging geometry of the channel pointing at the nadir enables better canopy penetration performance as compared to the channels that look forward of the nadir. This factor can be observed in the test results summarized in Table 6 where, for a given test, the statistics for ground returns per laser shot and ground return density for channel 2 (C2, which points to the nadir) are higher than the results for the other channels. Note that this is true for the results presented for the Calkamul and the Lamanai test sites, but it is not the case for the El Ceibal test site due to technical malfunctions that will be expanded below.
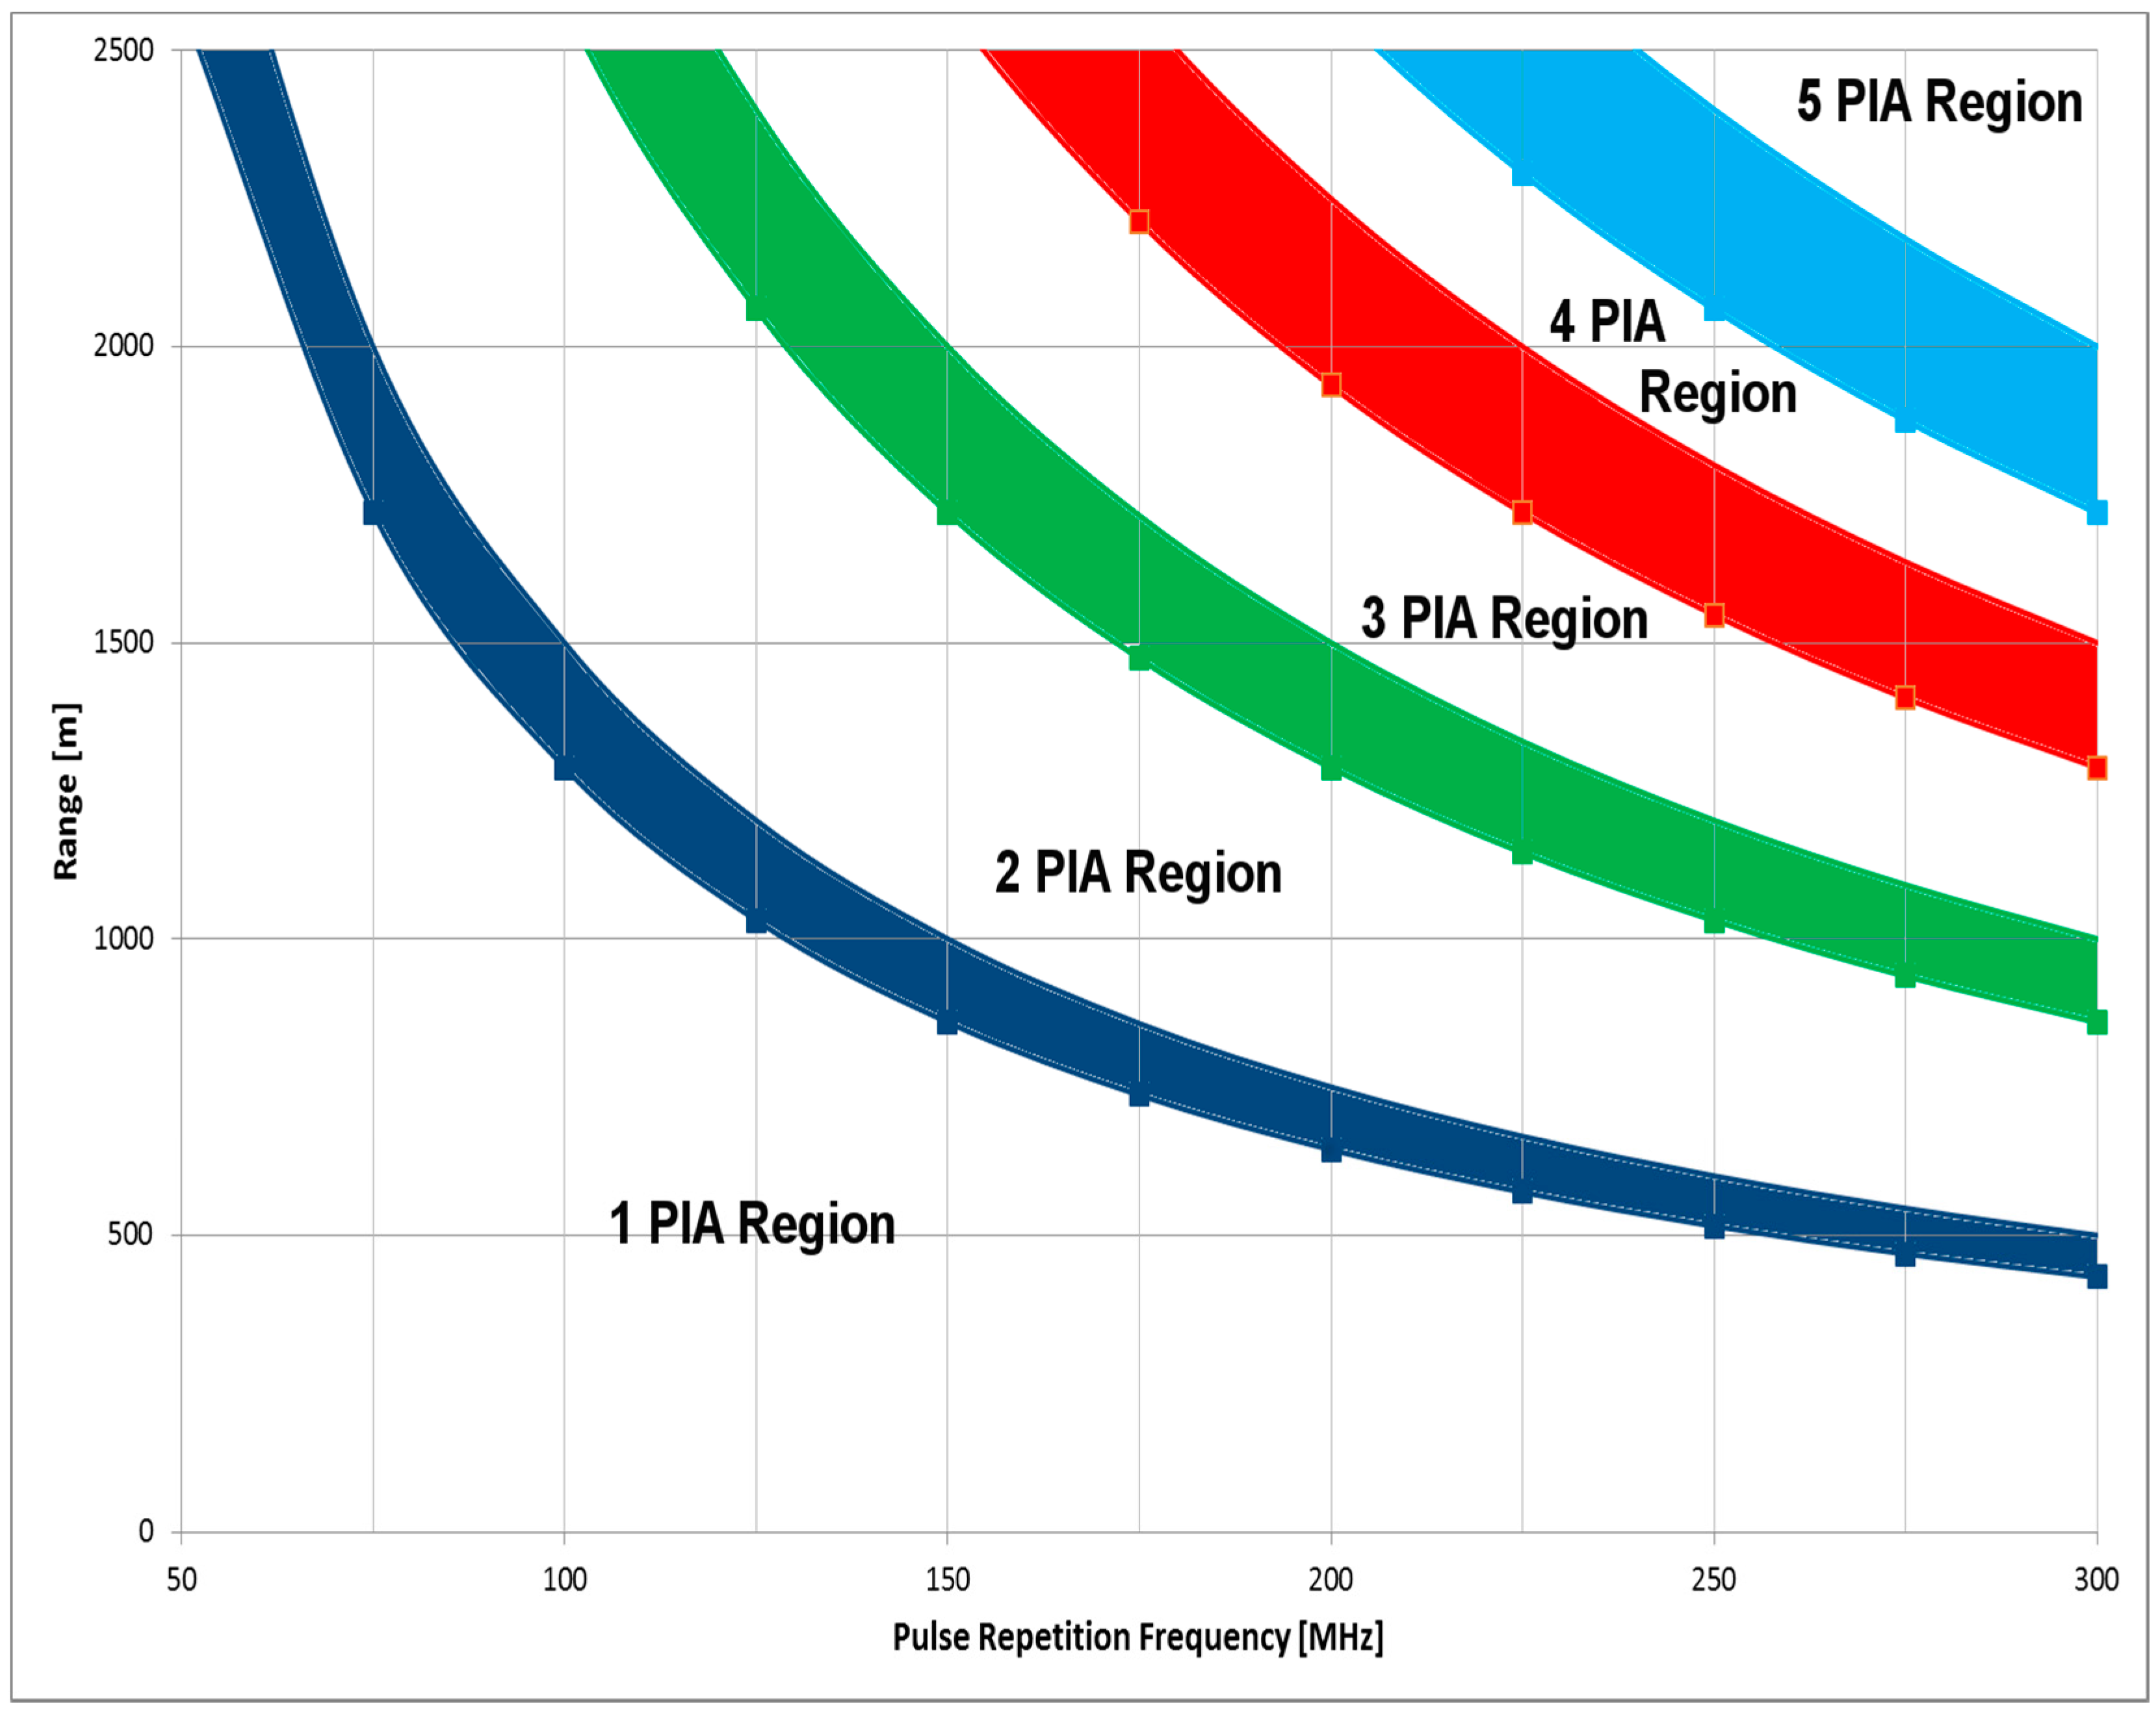
The Lamani test was conducted to characterize the canopy penetration performance of the Titan as a function of the system PRF and to determine the optimal configuration (height and PRF) that maximized the detection of ground returns. The same test line was flown three different times at PRFs that are representative of the operational envelope of the Titan: 75 kHz, 175 kHz and 300 kHz. Because of the range ambiguity region, the 300 kHz test flight had to be collected at 650 m above ground which is considerably higher than the 550 m that was used for the test collections at 75 and 175 kHz. However, these combinations of PRF and height are close to the normal operational conditions that would be used in a survey project. The first conclusion from analyzing the Lamanai test results is that the number of returns produced per laser shot does not vary as much for the Titan as they did for the earlier-generation Gemini sensor. This is mostly true for channels 2 and 3, for which the energy per pulse characteristics do not vary much with the increasing PRF. The number of returns per pulse varied by only about 7.5% for channel 2 (1064 nm) and 4% for channel 3 (532 nm). The energy pulse characteristics of the laser source for channel 1 (1550 nm) do degrade by a small amount with increasing pulse repetition rates but not as widely as the solid-state source that powered the Gemini lidar. The variation in the number of returns produced per pulse for channel 1 only varied by 20% from 75 kHz all the way to 300 kHz (225 kHz), which is close to the 22% variation observed for the Gemini sensor for a 55 kHz variation of PRF.
A second lesson derived from the Lamanai results is that the fraction of laser shots that produce detectable ground returns is significantly affected by the lower energy per pulse and the need to fly at higher altitudes at the higher end of the PRF operational range (300 kHz) when compared to the fraction of laser shots obtained at the lower PRFs. For channel 1, for which the pulse energy characteristics are the most affected with increased PRF, the variation in the fraction of pulses with detectable ground returns was 49.3% between the test line flown at 650 m and 300 kHz and the line flown at 550 m and 75 kHz. For channels 2 and 3, the variation in the results for the same metric of the fraction of shots with ground returns and for the same configurations listed above was close of 31.5% and 28.6%, respectively. The same conclusion can be reached by analyzing the return and ground return density metrics. While the line flown at 300 kHz produces much higher shot densities, the highest ground return densities were obtained from the line flown at 175 kHz and at lower elevation. This demonstrates again that it is not the quantity of the shots that produce the higher number of ground returns but the quality of the shots, which is determined by the energy budget (energy per pulse and ranging distance).
The El Ceibal test was conducted to characterize the canopy penetration performance of the Titan sensor at varying flying heights above the ground. As mentioned earlier, when this test was performed, the optical energy output of the laser source that powers channels 2 and 3 was starting to degrade. The laser source was repaired by the laser manufacturer after the completion of the Guatemala and Mexico mapping campaign (see Table 1). In addition, the receiver optics of channel 2 were out of alignment (this issue was also corrected after the laser source was replaced), which also caused a degraded canopy penetration performance. The results from this test, while not representative in absolute terms of nominal sensor performance, do provide comparative performance metrics and important insights into canopy penetration. This test was conducted by flying the same line at different heights above the ground while maintaining the system PRF at 150 kHz. A pair of lines was also flown at the maximum test height of 700 m above the terrain but at two different PRFs (100 and 150 kHz).
By comparing the results of the test lines flown at 100 and 150 kHz from 700 m above ground level, a few of the previous conclusions are reinforced. Based on the returns per shot and shots that produced ground return metrics, it can be noted that while the performances for channels 2 and 3 do not vary significantly between PRF settings, the performance of channel 1 does vary slightly with better performance at the lower PRF. The lines flown at 700, 600 and 400 m confirm the expected trend: the metrics of returns per laser pulse and pulses with detected ground returns increase as the flying height decreases. This is due to the spreading of the laser energy during its two-way trip from the sensor to the ground and back, as a function of the range to the fourth power (R4) as defined by the lidar equation [1]. These results from the El Ceibal test serve to reinforce the conclusion that canopy penetration for the production of ground returns is mostly dominated by energy considerations. There has to be enough energy within each pulse to withstand the two-way attenuation caused by its normal propagation through the atmosphere and by the scattering of the forest canopies. When trying to maximize ground detection (maximize ground return density), it is important to optimize the tradeoff between surface illumination, which is related to shot density (determined by system PRFs and flying height), and the laser energy budget, which is affected by the laser source pulse energy characteristics and by the flying height.
It is important to note that a research group in Canada has used Titan data and other multi-sensor lidar data to assess the impact of multispectral lidar data on forestry studies [35]. They have observed similar return ratio differences among the Titan channels as the ones presented in this section. However, they conclude that these differences are mainly due to the wavelength-dependent characteristics of penetration, absorption and reflection of the forest canopies. While the spectral dependence of the light and matter interactions are definitely a factor, the researchers neglect the hardware characteristics such as energy per pulse, beam divergence, power density and look angles that vary from channel to channel, and which also have a significant impact on the system’s ability to map the forest canopies.

3.3.2. Range Resolution/Canopy Characterization

Another important operational performance characteristic of a lidar is the system range resolution, which is defined as the ability of a sensor to separate targets along the range direction within a single lidar footprint. This assumes that the targets are illuminated by the same laser pulse/footprint and that the first target(s) do not completely occlude the laser footprint. As a proxy, because of the narrow birds-eye-view scanning geometry of airborne lidar systems, the range resolution can be simplified to be approximately equivalent to the vertical resolution capability of the lidar. This characteristic is important for applications in forestry or ecology where researchers are interested in describing the canopy structure accurately to model habitats [55] or to assess biomass [56]. It is also important when trying to obtain reliable ground returns in areas covered by vegetation. It is well known that the range resolution of a sensor is mainly determined by the laser pulse width [57]; however, it also depends on other factors including the electronic characteristics of the detector sub-systems. While some laboratory experiments have been conducted to assess the range resolution of lidar systems [58], a field experimental approach was taken to assess the Titan’s range resolution and ability to finely characterize forest canopies. This field approach consisted of computing the range separation between successive returns for the same laser pulse generated by tropical forest canopies. The same test data that were used to characterize canopy penetration obtained from the forest canopies near Calakmul, Lamanai and El Ceibal were used for this purpose. Data from all of the test flights were analyzed; however, for brevity, only some returns are presented and discussed in the following paragraphs.
First, the discrete return data were segregated and classified depending on the number of returns produced per pulse. Because of its four-stop recording capability, the Titan data can be segregated into four groups: pulses with single returns, pulses with only two returns, pulses with three returns and pulses with more than three returns. For this analysis, the groups of pulses with two returns and the pulses with more than three returns were selected as representing the extreme cases. The pulses that produced more than three returns were the ones that traveled through a significant cross-section of canopy, while the ones with only two returns and that have a relatively short inter-return separation (case analyzed here) likely did not interact much with the canopy structure. It is important to note that in this type of field experiment, the actual distribution of the separation between returns is determined by the canopy structure. However, the lowest percentile values for the separation between returns are determined by the system capabilities. In essence, this analysis is aimed at determining the minimum separations that were detected by the sensor.
Table 7 and Table 8 summarize results from the analysis of the data collected near Calakmul and Lamani for different test configurations and for the different Titan channels. These tables present statistics for the number of shots that produced two, three and more than three returns. They also present the values for the minimum as well as the one and three percentile distribution values for the detected return separations for the two cases (shots with only two returns and shots with more than three returns). For the case of shots that produced more than three returns, the minimum and percentile values are presented for the separation between the first and second returns, the second and third returns, and the third and last returns. The last returns are not necessarily a fourth return; it could have been a fifth, sixth, seventh or even higher return. The Titan can detect multiple returns within its range gate, but only records the first three and the last return.
Table 7 presents results from the Calakmul test and also compares the range resolution of the Titan with respect to the older-generation Gemini sensor. The results summarized in the Table 7 show some significant trends. First, the values for the minimum separation between returns, while consistent with the theoretical minimum range resolution value (equivalent to half of the laser pulse width) can be outliers and have to be treated with caution. For this reason, first and third percentile measurements are reported. Second, irrespective of the minimum values, the separation between returns for the Gemini sensor increase as the PRF increases. These results are expected as the laser source for that system produces pulses with increasing width as the PRF is increased. Finally, from the last three columns that correspond to the results obtained from Titan data, it can be observed that while there is a small variation in the range resolution between the different channels, this variation is usually less than 10 cm in most cases and the range resolutions for channel 1 and channel 3 are almost the same.
Table 8 summarizes the results from the range resolution experiments conducted near Lamanai, Belize, which were aimed at assessing performance differences related to changing PRF values. Because results for all channels and all PRFs tested would not fit in the table below, only the results for channels 1 and 2 are presented, given that the range resolutions results for channel 1 and 3 have already been shown to be comparable (Table 7). The most important conclusion that can be drawn from the data presented in Table 8 is that the range resolution for the Titan system is not significantly affected by the selection of system PRF, which is different from the result for the Gemini sensor. Also, as noted from the data of the previous table, the variation between Titan channels is less than 10 cm in most cases.
A final crucial observation that can be made based on the results presented in both Table 7 and Table 8, particularly from the range resolution results of those pulses that produce more than three returns, is that as the system detects returns from deeper within the canopy, the range resolution is degraded. This would perhaps indicate that the ability to detect and discriminate closely spaced pulses is a function of the received signal strength.

3.4. Special Operational Capabilities

Besides the multispectral, bathymetric and canopy penetrating/mapping capabilities that have already been discussed, it is important to briefly highlight other operational advantages or capabilities that are enabled by the sensor’s unique multispectral and multichannel design. The first advantage is significantly higher target surface illumination in a single instrument pass. Until recently, lidar systems have only sparsely sampled the mapped surface. A few returns per square meter has been considered sufficient to derive topographic maps for certain engineering or scientific applications [59]. However, certain applications, such as small target detection or archaeology, benefit from sampling or illuminating 100% or more of the surface of interest [59,60,61]. The combination of three different look angles (nadir, 3.5° and 7° forward of the nadir) for the different channels, the varied beam divergence and the larger scan product (product of scan angle and scan frequency) allow for almost full surface illumination in a single pass (Figure 11a). Figure 11b shows a detailed view of a graph that plots both the position and footprint of the laser returns for the Titan’s three channels sampled from the central portion of a test flight swath from Figure 11a.
This test flight swath was collected by Teledyne Optech during the first test flight of the Titan system. The system was configured with a PRF of 200 kHz per channel (600 kHz combined), a scan angle of ±25° and a scan frequency of 32 Hz (scan product of 800 degrees-Hertz) and flown at an altitude of 1000 m above ground level. In Figure 11b, the footprints for each of the returns for the three Titan channels are plotted at a proper scale. The footprints of the returns from channel 1 (1550 nm) are depicted in blue, while the footprints for channels 2 and 3 are represented with red and green, respectively. The sample square that was cropped from the swath has an area of 1033 m2, and the number of shots and the area illuminated by the laser footprints (not counting the overlap between footprints of the same channel) are summarized in Table 9. Due to the larger divergence of channel 3 (532 nm), the footprints from the laser shots illuminate 83.3% of the sample area, while a single infrared channel (channel 1) illuminates 25% of the sample area. When combining the footprints of the three channels, and not counting the area overlap, the fraction of the surface area that is illuminated by the main portion of the laser beams totals 88.2%. Of course, the surface illumination can be increased significantly by utilizing a 50% lateral overlap or by flying lines in an orthogonal fashion. This near-full-surface illumination is critical for other capabilities of the Titan sensor, for example canopy penetration, small target detection and active intensity image generation.
Some might characterize the multichannel and multi-laser source design of the Titan as being redundant, and while this is true, perhaps a better engineering descriptor for the Titan design would be “diversity”. In telecommunications, a diversity scheme is a design feature that improves the reliability of a system by using two or more channels with different technical or physical characteristics [62,63]. There is equipment diversity when two or more radios are used to transmit the same information; there is frequency diversity where different radios will transmit the same information over two different frequency channels; and there is spatial diversity where multiple antennas are used to transmit the same signal. The Titan sensor has several diversity schemes built into its design. The way the different channels interrogate the target at different angles represents a diversity of look angles, the three different laser wavelengths represent spectral diversity and the two laser sources constitute equipment diversity.
The look angle diversity brings several operational advantages: as mentioned previously, it provides for a more complete and uniform surface illumination even in a single pass, it provides multiple points of view to pierce through vegetation covers, and it allows for a better mapping of vertical structures. Having equipment diversity or laser source redundancy ensures an operational sensor even if one of the laser sources fails. The sensor will continue to collect data, at two-thirds or one-third of the maximum desired measurement rate. Collecting a decimated data set is better than no data at all, and therefore, having this redundancy is valuable when mapping in remote areas where having manufacturer technical support might not be an option or for time-critical collections that cannot wait a couple of days for a repair. The spectral diversity provides some operational advantages besides providing the spectrally rich data sets described through this paper. The Titan will be able to detect relatively strong returns over a large variety of land covers and throughout its operational envelope for at least one of it channels, something that single-wavelength systems may have a hard time doing.
An example of how the diversity of equipment and the spectral diversity of the Titan system proved to be advantageous for the successful completion of a project comes from NCALM’s experience mapping the McMurdo Dry Valleys in Antarctica [23]. The Dry Valleys are perhaps one of the most challenging places to map with airborne lidar systems. Besides its remoteness and harsh temperature conditions, the terrain relief can vary more than 1000 m in just a few kilometers which make it challenging to fly (see Figure 12a). The ground cover also alternates between frozen soil, snow and ice. A single-wavelength lidar system that operates in the 1550 nm wavelength would have a hard time obtaining strong returns from the snow and ice at safe flying heights (~2000 m AGL) because of the low reflectance of snow and ice at the 1550 nm wavelength (see Figure 1). Figure 12b shows a density map of lidar returns detected from the Titan system from one of these valleys; despite a uniform number of flight lines through the areas of interest, it is obvious that the return density varies significantly through the valleys. The lower-density areas are due to dropouts (laser shots with no return detected) that result from the combination of flying height and the low reflectance of ice and snow that cover the area. These lower-density areas would have been voids if not for the spectral diversity of the Titan system.

3.5. Precision and Accuracy Assessments of Topographic Elevations

As a final performance analysis of the Titan system, this section examines the positional precision and accuracy of the lidar returns. It is important to note that while precision (also known as repeatability or internal accuracy) is an intrinsic performance characteristic of a lidar system, accuracy is extrinsic because it depends on several factors external to the system. Among these factors are the geometrical strength of the GNSS constellation at the time of collection, the distance from the aircraft to the reference base stations, the performance of the integrated navigation system (INS), the aircraft dynamics, and the INS data processing algorithms, among many others [64]. As such, it is important to note that the accuracy values presented below should be considered as representative values; the actual accuracy of a dataset will be dependent on the specific conditions particular to each project’s collection and processing. It is also important to note that the positional accuracy of airborne lidar returns can be broken down into vertical and horizontal components. The accuracy results presented below relate only to the vertical component.
The airborne data for this analysis were collected in October 2014 (medium altitude) and August 2016 (low altitude) and consist of repeat passes of a flight line perpendicular to the runway at the Baytown airport (KHPY) located in Baytown, Texas. The test line was flown six times for three different PRFs and at flight heights in the middle and lower end of the Titan operational envelope and within the PIA regions of operation allowable for each PRF (see Figure 2). The precision (repeatability) of the datasets was computed by selecting planar surfaces within the dataset (the test surface had an area of 420 m2), fitting a plane based on the XYZ coordinates of the returns that define the plane and then computing the distance between individual returns and the fitted plane. Dispersion statistics of the distances between returns and the fitted plane define the precision of the dataset.
To conduct an absolute vertical accuracy assessment of the airborne test data validation, elevations were collected by installing a geodetic grade dual frequency GPS antenna (Trimble Zephyr Model 2) and a Trimble NetR9 receiver on a vehicle and performing a kinematic survey along the runway and taxiways of the Baytown airport. A reference ground station was located at the airport during the time of the survey and its coordinates were determined through the online positioning user service (OPUS) of the US National Geodetic Survey (NGS). The distance between the rover and the reference station was less than 2 km at any time. The Novatel software GrafNav (Calgary, AB, Canada) was used to obtain dual-frequency carrier-based solutions for the rover GPS antenna trajectory that was then used as the validation data. An algorithm was used to perform a nearest neighbor search for airborne lidar returns that are located within a preset distance (30–50 cm) to the kinematic survey reference points. Once the pairs of lidar returns and reference measurements are identified, the vertical separations between these datasets were computed and RMSE values were reported. Table 10 presents vertical precision and accuracy results for these experiments for each of the different combinations of PRFs and flying heights, segregated by channel (C1, C2, C3) as well with all three channels combined (C123).
The results presented in Table 10 are within the expected limits, with precision values better than 2 cm and height accuracy values better than 10 cm. Some higher values were obtained from channel 2 with respect to the other channels. This was the result of the misalignment of the receiver optics for that channel. The results also indicate no significant variation in the precision or accuracy performance of the sensor for the different tested PRFs or flying heights. It can be seen that the precision and accuracy do degrade when data from all channels is considered for the assessment (column C123) as compared to analyzing a single channel at a time. These results are expected and are the product of the complexity of a multichannel system where the scanning geometries of each channel are so varied. However, these combined channel precision and accuracy metrics indicate that the channel by channel calibration parameters and the sensor geometric model are adequate and produce consistent and accurate data within very good limits exceeding the USGS lidar base specification quality level 1 (QL1) [65].
One of the limitations of the experimental data presented in Table 10 is that it is based on single-swath data and not data from overlapping swaths that may cause degradation in data precision and accuracy. As also mentioned earlier, the accuracy of a lidar system is to subject to many external factors. Therefore, in order to provide some additional data points related to the Titan’s accuracy, results from height accuracy assessment measurements performed for mapping projects executed with different system configurations are presented in Table 11. These accuracy assessment exercises follow the same procedures described above related to the collection and processing of the height validation data and the computations of vertical difference between the airborne and validation data. However, some differences include: (a) the assessment of data originating from different flight swaths; (b) processing of DGPS validation data with the Ashtech office suite (AOS) software instead of GrafNav; and (c) larger rover and reference station separations that may have extended to distances of up to 10 km. The results presented in Table 11 are similar to the results in Table 10, indicating good levels of height accuracy, which again exceed the quality level 1 (QL1) of the USGS lidar base specifications.

4. Conclusions

This paper presents an overview of the design and performance of the Teledyne Optech Titan multispectral lidar system based on almost two years of operational experience in varied conditions, landscapes and environments. The paper is intended to provide a wide overview of the capabilities and applications enabled by the unique multipurpose design of the Titan sensor in a way that is useful to researchers that work with data from this sensor and for lidar technology specialists. This paper describes and discusses experiments and results aimed at quantifying the performance of the Titan system as it applies to ground cover classification, bathymetry, forestry, ground return detection, and geometrical accuracy, among others. Because of brevity and scope considerations, this paper is not intended to explore in detail certain aspects of specific applications such as radiometric calibration of multispectral lidar intensity or three-dimensional refraction correction of bathymetric returns. Topics such as these merit research papers on their own and it is our hope that future papers on such topics will draw upon the general description presented here.
The Titan sensor has proven to be extremely flexible and reliable due to the equipment, spectral and view/scan geometry diversity scheme incorporated in it design. Its multispectral capabilities provide spectrally rich and consistent datasets that were not available before. The multispectral capabilities enable applications that include: land cover and target classification based on both spectral and 3D spatial information, and high resolution seamless topographic and very shallow water bathymetry. Ground cover classification accuracies of 90% have been achieved with simple methodologies and with intensity data that has not been corrected to represent reflectance values. It is expected that classifications with a larger number of classes and higher levels of accuracy can be obtained with more advanced methods and algorithms. Other researchers have written about the challenges of achieving good multispectral intensity radiometric calibration; while this was not explored in this work, it is definitely a challenge and future avenue to be investigated.
The bathymetric performance in terms of detected depths and accuracy of derived water depths and bathymetric elevations is within the performance expectations of a low-optical-power 1.5/Kd bathymetric lidar. The accuracy of benthic elevations can be improved with more rigorous three-dimensional refraction correction of the returns; this, however, is mainly limited by the ability to obtain a good representation of the water surface at the exact place where the 532 nm beam penetrates the water. The first-order approximation that corrects only for the vertical component of the returns is good for water depths less than 5 m, but it can introduce vertical bathymetric errors larger than a decimeter in deeper water (>10 m).
The combination of varied look angles, full surface illumination, almost-uniform pulse energy versus PRF characteristics of the laser sources, and short pulse widths enables characterizing and penetrating forest canopies at spatial resolutions and performance levels at least twice as effective as were possible with previous-generation airborne lidar mapping systems. The three-channel, three-wavelength and three-look angle design also provides redundancy and diversity which is beneficial not only from a technical/operational point of view but also reduces operational costs. One disadvantage of the design when compared to a single-channel system has to do with the complexity of achieving a good inter-channel calibration. While achieving this is not impossible, it has taken considerably more effort and attention to detail than what was required with older, single-channel systems. However, the precision and accuracy assessment experiments conducted for this study indicate that despite these challenges, good and accurate geometric calibrations have yielded point clouds that are better than USGS lidar base specifications quality level 1 (QL1). Visual and analytical inspection of shaded relief maps based on digital elevation models produced over the past two-year period have identified very little inter-channel or intra-channel elevation artifacts.
The capability to provide two independent streams of range/intensity data for each channel through both its analogue discrete return detector and the full waveform recording capabilities will enable a proper comparison of the advantages and disadvantages of both of these data processing and return detection approaches. Despite its advantages, the Titan system does have a few limitations. The 2 km operation range limit as well as the fixed multiple pulse mechanism limit the performance and applicability of the system in regions with extreme topographic variability. The analogue detection is also limited by only recording up to four returns, as the sensor has enough energy budget and range resolution to detect more than four returns in thick vegetation canopies. While this limitation is overcome by using the waveform digitizers, they unfortunately are currently limited to recording waveforms at PRF rates of values of only 100 kHz. It is clear that future iterations of the sensor will attempt to overcome these limitations.
Over the next few years the research community will develop new applications and new scientific approaches based on the unique capabilities and design characteristics of the Titan senor. However, there is no need to wait for the results of those new applications or approaches to be published to realize that the Titan sensor represents a significant leap forward in the evolution of airborne mapping lidar systems.

Acknowledgments

The authors would like to acknowledge Paul LaRocque, Brent Smith and Jon Henderson of Teledyne Optech for their constant support and communication during the design, integration, testing, operation and ongoing improvement of the Titan sensor. We would also like to acknowledge the principal investigators of the different mapping projects that have been performed with the Titan across the United States, Mexico, Central America, the Caribbean, and Antarctica; their projects have enabled a thorough testing of the system across multiple environments and applications. This work is supported by grant number EAR 1339015 provided by the United States National Science Foundation Division of Earth Sciences, Instrumentation and Facilities Program.

Author Contributions

All authors participated in the drafting and editing of the paper text and the review of the experimental results. Juan Carlos Fernandez-Diaz conceived and designed the experiments which were performed with the assistance of Zhigang Pan and Nima Ekhtari under the supervision of Craig Glennie, William E. Carter and Ramesh L. Shrestha. Collection and processing of the data used for the experiments was conducted by Michael Sartori, Abhinav Singhania, Darren Hauser and Juan Carlos Fernandez-Diaz.

Conflicts of Interest

The authors declare no conflicts of interest.

References

  1. Glennie, C.L.; Carter, W.E.; Shrestha, R.L.; Dietrich, W.E. Geodetic imaging with airborne lidar: The earth’s surface revealed. Rep. Prog. Phys. Phys. Soc. 2013, 76, 086801. [Google Scholar] [CrossRef]
  2. Antonarakis, A.; Richards, K.S.; Brasington, J. Object-based land cover classification using airborne lidar. Remote Sens. Environ. 2008, 112, 2988–2998. [Google Scholar] [CrossRef]
  3. Stevens, C.W.; Wolfe, S.A. High-resolution mapping of wet terrain within discontinuous permafrost using lidar intensity. Permafr. Periglac. Process. 2012, 23, 334–341. [Google Scholar] [CrossRef]
  4. Höfle, B.; Pfeifer, N. Correction of laser scanning intensity data: Data and model-driven approaches. ISPRS J. Photogramm. Remote Sens. 2007, 62, 415–433. [Google Scholar] [CrossRef]
  5. Yan, W.Y.; Shaker, A.; Habib, A.; Kersting, A.P. Improving classification accuracy of airborne lidar intensity data by geometric calibration and radiometric correction. ISPRS J. Photogramm. Remote Sens. 2012, 67, 35–44. [Google Scholar] [CrossRef]
  6. Kashani, A.; Olsen, M.; Parrish, C.; Wilson, N. A review of lidar radiometric processing: From AD HOC intensity correction to rigorous radiometric calibration. Sensors 2015, 15, 28099. [Google Scholar] [CrossRef] [PubMed]
  7. Kaasalainen, S.; Hyyppa, H.; Kukko, A.; Litkey, P.; Ahokas, E.; Hyyppa, J.; Lehner, H.; Jaakkola, A.; Suomalainen, J.; Akujarvi, A. Radiometric calibration of lidar intensity with commercially available reference targets. IEEE Trans. Geosci. Remote Sens. 2009, 47, 588–598. [Google Scholar] [CrossRef]
  8. Goepfert, J.; Soergel, U.; Brzank, A. Integration of intensity information and echo distribution in the filtering process of lidar data in vegetated areas. In Proceedings of the SilviLaser, Edinburgh, UK, 17–19 September 2008.
  9. Wang, C.; Glenn, N.F. Integrating lidar intensity and elevation data for terrain characterization in a forested area. IEEE Geosci. Remote Sens. Lett. 2009, 6, 463–466. [Google Scholar] [CrossRef]
  10. Dalponte, M.; Bruzzone, L.; Gianelle, D. Fusion of hyperspectral and lidar remote sensing data for classification of complex forest areas. IEEE Trans. Geosci. Remote Sens. 2008, 46, 1416–1427. [Google Scholar] [CrossRef]
  11. Hopkinson, C.; Chasmer, L. Using discrete laser pulse return intensity to model canopy transmittance. Photogramm. J. Finl. 2007, 20, 16–26. [Google Scholar]
  12. Hopkinson, C.; Chasmer, L. Testing lidar models of fractional cover across multiple forest ecozones. Remote Sens. Environ. 2009, 113, 275–288. [Google Scholar] [CrossRef]
  13. Donoghue, D.N.; Watt, P.J.; Cox, N.J.; Wilson, J. Remote sensing of species mixtures in conifer plantations using lidar height and intensity data. Remote Sens. Environ. 2007, 110, 509–522. [Google Scholar] [CrossRef]
  14. Renslow, M.S. Manual of Airborne Topographic Lidar; American Society for Photogrammetry and Remote Sensing: Bethesda, MD, USA, 2012. [Google Scholar]
  15. Feigels, V.; Kopilevich, Y.I. Lasers for lidar bathymetry and oceanographic research: Choice criteria. In Proceedings of the IEEE International Geoscience and Remote Sensing Symposium, IGARSS’94, Surface and Atmospheric Remote Sensing: Technologies, Data Analysis and Interpretation, Amherst, MA, USA, 8–12 August 1994; pp. 475–478.
  16. Fernandez-Diaz, J.C.; Glennie, C.L.; Carter, W.E.; Shrestha, R.L.; Sartori, M.P.; Singhania, A.; Legleiter, C.J.; Overstreet, B.T. Early results of simultaneous terrain and shallow water bathymetry mapping using a single-wavelength airborne lidar sensor. IEEE J. Sel. Top. Appl. Earth Obs. Remote Sens. 2013, 7, 623–635. [Google Scholar] [CrossRef]
  17. Briese, C.; Pfennigbauer, M.; Lehner, H.; Ullrich, A.; Wagner, W.; Pfeifer, N. Radiometric calibration of multi-wavelength airborne laser scanning data. ISPRS Ann. Photogramm. Remote Sens. Spat. Inf. Sci. 2012, 1, 335–340. [Google Scholar] [CrossRef]
  18. Hartzell, P.; Glennie, C.; Biber, K.; Khan, S. Application of multispectral lidar to automated virtual outcrop geology. ISPRS J. Photogramm. Remote Sens. 2014, 88, 147–155. [Google Scholar] [CrossRef]
  19. Chen, Y.; Räikkönen, E.; Kaasalainen, S.; Suomalainen, J.; Hakala, T.; Hyyppä, J.; Chen, R. Two-channel hyperspectral lidar with a supercontinuum laser source. Sensors 2010, 10, 7057–7066. [Google Scholar] [CrossRef] [PubMed]
  20. Woodhouse, I.H.; Nichol, C.; Sinclair, P.; Jack, J.; Morsdorf, F.; Malthus, T.J.; Patenaude, G. A multispectral canopy lidar demonstrator project. IEEE Geosci. Remote Sens. Lett. 2011, 8, 839–843. [Google Scholar] [CrossRef]
  21. Wei, G.; Shalei, S.; Bo, Z.; Shuo, S.; Faquan, L.; Xuewu, C. Multi-wavelength canopy lidar for remote sensing of vegetation: Design and system performance. ISPRS J. Photogramm. Remote Sens. 2012, 69, 1–9. [Google Scholar] [CrossRef]
  22. Pfennigbauer, M.; Ullrich, A. Multi-wavelength airborne laser scanning. In Proceedings of the International Lidar Mapping Forum, ILMF, New Orleans, LA, USA, 7–9 February 2011.
  23. Fernandez Diaz, J.C.; Carter, W.E.; Glenie, C.; Shrestha, R.L. Multicolor terrain mapping documents critical environments. Eos Trans. Am. Geophys. Union 2016, 97, 10–15. [Google Scholar] [CrossRef]
  24. Spieler, H. Class Notes: Introduction to Radiation Detectors and Electronics. Available online: http://www-physics.lbl.gov/~spieler/physics_198_notes/ (accessed on 7 November 2016).
  25. Lackowicz, J.R. Principle of Fluorescence Spectroscopy, 3rd ed.; Springer: New York, NY, USA, 2006; Volume 1, p. 954. [Google Scholar]
  26. Optech_Inc. Overcoming the Timing Limit with Multipulse Technology Altm Gemini. 2007. Available online: http://www.geo-konzept.de/data/downloads/AltMaxPaperWEB.pdf (accessed on 7 November 2016).
  27. Roth, R.; Thompson, J. Practical application of multiple pulse in air (mpia) lidar in large area surveys. Int. Arch. Photogramm. Remote Sens. Spat. Inf. Sci. 2008, 37, 183–188. [Google Scholar]
  28. Wang, C.K.; Tseng, Y.H.; Chu, H.J. Airborne dual-wavelength lidar data for classifying land cover. Remote Sens. 2014, 6, 700–715. [Google Scholar] [CrossRef]
  29. Morsy, S.; Shaker, A.; El-Rabbany, A.; LaRocque, P. Airborne multispectral lidar data for land-cover classification and land/water mapping using different spectral indexes. ISPRS Ann. Photogramm. Remote Sens. Spat. Inf. Sci. 2016, 217–224. [Google Scholar] [CrossRef]
  30. Wallace, A.M.; McCarthy, A.; Nichol, C.J.; Ren, X.; Morak, S.; Martinez-Ramirez, D.; Woodhouse, I.H.; Buller, G.S. Design and evaluation of multispectral lidar for the recovery of arboreal parameters. IEEE Trans. Geosci. Remote Sens. 2014, 52, 4942–4954. [Google Scholar] [CrossRef]
  31. Doneus, M.; Briese, C. Airborne laser scanning in forested areas—Potential and limitations of an archaeological prospection technique. In Remote Sensing for Archaeological Heritage Management; Cowley, D.C., Ed.; Europae Archaeologica Consilium (EAC): Brussels, Belgium, 2011. [Google Scholar]
  32. Hartzell, P.J.; Fernandez-Diaz, J.C.; Wang, X.; Glennie, C.L.; Carter, W.E.; Shrestha, R.L.; Singhania, A.; Sartori, M.P. Comparison of Synthetic Images Generated from Lidar Intensity and Passive Hyperspectral Imagery. In Proceedings of the 2014 IEEE International Geoscience and Remote Sensing Symposium (IGARSS), Quebec City, QC, Canada, 13–18 July 2014; pp. 1345–1348.
  33. Debes, C.; Merentitis, A.; Heremans, R.; Hahn, J.; Frangiadakis, N.; van Kasteren, T.; Liao, W.; Bellens, R.; Pižurica, A.; Gautama, S. Hyperspectral and lidar data fusion: Outcome of the 2013 grss data fusion contest. IEEE J. Sel. Top. Appl. Earth Obs. Remote Sens. 2014, 7, 2405–2418. [Google Scholar] [CrossRef]
  34. Richards, J.A.; Jia, X. Remote Sensing Digital Image Analysis; Springer: Berlin, Germany, 1999; Volume 3. [Google Scholar]
  35. Hopkinson, C.; Chasmer, L.; Gynan, C.; Mahoney, C.; Sitar, M. Multisensor and multispectral lidar characterization and classification of a forest environment. Can. J. Remote Sens. 2016, 42, 501–520. [Google Scholar] [CrossRef]
  36. Habib, A.F.; Kersting, A.P.; Shaker, A.; Yan, W.-Y. Geometric calibration and radiometric correction of lidar data and their impact on the quality of derived products. Sensors 2011, 11, 9069–9097. [Google Scholar] [CrossRef] [PubMed]
  37. Briese, C.; Pfennigbauer, M.; Ullrich, A.; Doneus, M. Multi-wavelength airborne laser scanning for archaeological prospection. Int. Arch. Photogramm. Remote Sens. Spat. Inf. Sci. 2013, 40, 119–124. [Google Scholar] [CrossRef]
  38. Starek, M.J.; Vemula, R.K.; Slatton, K.C.; Shrestha, R.L.; Carter, W.E. Shoreline based feature extraction and optimal feature selection for segmenting airborne lidar intensity images. In Proceedings of the 2007 IEEE International Conference on Image Processing, San Antonio, TX, USA, 16–19 September 2007; pp. IV-369–IV-372.
  39. Crasto, N.; Hopkinson, C.; Forbes, D.; Lesack, L.; Marsh, P.; Spooner, I.; van der Sanden, J. A lidar-based decision-tree classification of open water surfaces in an arctic delta. Remote Sens. Environ. 2015, 164, 90–102. [Google Scholar] [CrossRef]
  40. Baker, K.; Smith, R. Quasi-inherent characteristics of the diffuse attenuation coefficient for irradiance. In Ocean Optics VI; International Society for Optics and Photonics: Bellingham, WA, USA, 1980; pp. 60–63. [Google Scholar]
  41. Austin, R.W.; Halikas, G. The Index of Refraction of Seawater. 1976. Available online: https://escholarship.org/uc/item/8px2019m#page-1 (accessed on 7 November 2016).
  42. Pan, Z.; Glennie, C.; Hartzell, P.; Fernandez-Diaz, J.; Legleiter, C.; Overstreet, B. Performance assessment of high resolution airborne full waveform lidar for shallow river bathymetry. Remote Sens. 2015, 7, 5133–5159. [Google Scholar] [CrossRef]
  43. Legleiter, C.; Overstreet, B.; Glennie, C.; Pan, Z.; Fernandez-Diaz, J.; Singhania, A. Evaluating the capabilities of the casi hyperspectral imaging system and aquarius bathymetric lidar for measuring channel morphology in two distinct river environments. Earth Surf. Process. Landf. 2015. [Google Scholar] [CrossRef]
  44. Wright, C.W. Eaarl-B missions, calibration and validation. In Proceedings of the 15th Annual JALBTCX Airborne Coastal Mapping and Charting Workshop, Mobile, AL, USA, 10–12 June 2014.
  45. Wulder, M.A.; White, J.C.; Nelson, R.F.; Næsset, E.; Ørka, H.O.; Coops, N.C.; Hilker, T.; Bater, C.W.; Gobakken, T. Lidar sampling for large-area forest characterization: A review. Remote Sens. Environ. 2012, 121, 196–209. [Google Scholar] [CrossRef]
  46. Jakubowski, M.K.; Li, W.; Guo, Q.; Kelly, M. Delineating individual trees from lidar data: A comparison of vector-and raster-based segmentation approaches. Remote Sens. 2013, 5, 4163–4186. [Google Scholar] [CrossRef]
  47. Wallace, L.; Lucieer, A.; Watson, C.S. Evaluating tree detection and segmentation routines on very high resolution uav lidar data. IEEE Trans. Geosci. Remote Sens. 2014, 52, 7619–7628. [Google Scholar] [CrossRef]
  48. Hopkinson, C. The influence of lidar acquisition settings on canopy penetration and laser pulse return characteristics. In Proceedings of the 2006 IEEE International Symposium on Geoscience and Remote Sensing, Denver, CO, USA, 31 July–4 August 2006; pp. 2420–2423.
  49. Chasmer, L.; Hopkinson, C.; Treitz, P. Investigating laser pulse penetration through a conifer canopy by integrating airborne and terrestrial lidar. Can. J. Remote Sens. 2006, 32, 116–125. [Google Scholar] [CrossRef]
  50. Hopkinson, C. The influence of flying altitude, beam divergence, and pulse repetition frequency on laser pulse return intensity and canopy frequency distribution. Can. J. Remote Sens. 2007, 33, 312–324. [Google Scholar] [CrossRef]
  51. Massaro, R.; Zinnert, J.; Anderson, J.; Edwards, J.; Crawford, E.; Young, D. Lidar flecks: Modeling the influence of canopy type on tactical foliage penetration by airborne, active sensor platforms. In SPIE Defense, Security, and Sensing; International Society for Optics and Photonics: Bellingham, WA, USA, 2012; pp. 836008–836010. [Google Scholar]
  52. Hsu, W.C.; Shih, P.T.Y.; Chang, H.C.; Liu, J.K. A study on factors affecting airborne lidar penetration. Terr. Atmos. Ocean. Sci. 2015, 26, 241–251. [Google Scholar] [CrossRef]
  53. Fernandez-Diaz, J.C.; Lee, H.; Glennie, C.L.; Carter, W.E.; Shrestha, R.L.; Singhania, A.; Sartori, M.P.; Hauser, D.L. Optimizing ground return detection through forest canopies with small footprint airborne mapping lidar. In Proceedings of the 2014 IEEE International Geoscience and Remote Sensing Symposium (IGARSS), Quebec City, QC, Canada, 13–18 July 2014; pp. 1963–1966.
  54. Axelsson, P. DEM generation from laser scanner data using adaptive tin models. Int. Arch. Photogramm. Remote Sens. 2000, 33, 111–118. [Google Scholar]
  55. Vierling, K.T.; Vierling, L.A.; Gould, W.A.; Martinuzzi, S.; Clawges, R.M. Lidar: Shedding new light on habitat characterization and modeling. Front. Ecol. Environ. 2008, 6, 90–98. [Google Scholar] [CrossRef]
  56. Zolkos, S.; Goetz, S.; Dubayah, R. A meta-analysis of terrestrial aboveground biomass estimation using lidar remote sensing. Remote Sens. Environ. 2013, 128, 289–298. [Google Scholar] [CrossRef]
  57. Baltsavias, E.P. Airborne laser scanning: Basic relations and formulas. ISPRS J. Photogramm. Remote Sens. 1999, 54, 199–214. [Google Scholar] [CrossRef]
  58. Parrish, C.E.; Jeong, I.; Nowak, R.D.; Smith, R.B. Empirical comparison of full-waveform lidar algorithms. Photogramm. Eng. Remote Sens. 2011, 77, 825–838. [Google Scholar] [CrossRef]
  59. Slatton, K.C.; Carter, W.E.; Shrestha, R.L.; Dietrich, W. Airborne laser swath mapping: Achieving the resolution and accuracy required for geosurficial research. Geophys. Res. Lett. 2007, 34. [Google Scholar] [CrossRef]
  60. Cossio, T.K.; Slatton, K.C.; Carter, W.E.; Shrestha, K.Y.; Harding, D. Predicting small target detection performance of low-snr airborne lidar. IEEE J. Sel. Top. Appl. Earth Obs. Remote Sens. 2010, 3, 672–688. [Google Scholar] [CrossRef]
  61. Fernandez-Diaz, J.; Carter, W.; Shrestha, R.; Glennie, C. Now you see it… now you don’t: Understanding airborne mapping lidar collection and data product generation for archaeological research in mesoamerica. Remote Sens. 2014, 6, 9951–10001. [Google Scholar] [CrossRef]
  62. Penttinen, J.T. The Telecommunications Handbook: Engineering Guidelines for Fixed, Mobile and Satellite Systems; John Wiley & Sons: Chichester, UK, 2015. [Google Scholar]
  63. Laneman, J.N.; Martinian, E.; Wornell, G.W.; Apostolopoulos, J.G. Source-channel diversity for parallel channels. IEEE Trans. Inf. Theory 2005, 51, 3518–3539. [Google Scholar] [CrossRef]
  64. Glennie, C. Rigorous 3D error analysis of kinematic scanning lidar systems. J. Appl. Geod. Jag 2007, 1, 147–157. [Google Scholar] [CrossRef]
  65. Heidemann, H.K. Lidar Base Specification (Version 1.2, November 2014). Available online: https://pubs.usgs.gov/tm/11b4/pdf/tm11-B4.pdf (accessed on 7 November 2016).
Figure 1. The Titan’s operational wavelengths with reference to reflectance spectra of different land cover features and the Landsat 8 Operational Land Imager (OLI) passive imaging bands.
Remotesensing 08 00936 g001
Figure 2. Pulse repetition frequency (PRF) versus range operation regions for NCALM’s Titan sensor. The graph shows both regions of operation (white) as well as range ambiguity regions depicted as the solid colored bands.
Remotesensing 08 00936 g002
Figure 3. Laser shot density envelope for a single pass and single channel of the Titan sensor.
Remotesensing 08 00936 g003
Figure 4. The Titan multspectral lidar sensor integrated into a DHC-6 Twin Otter aircraft: (a) Overview of installation layout from the port side of sensor head; (b) View from front looking aft, sensor control rack is in the foreground, sensor head in the background; (c) View of the sensor head through the mapping port of the aircraft. The laser output window is the rectangular window on the right, and the DIMAC camera lens is behind the circular window.
Remotesensing 08 00936 g004
Figure 5. Intensity and structural images generated from the Titan multispectral data. (a) Intensity image generated from the 1550 nm channel; (b) intensity image for the 1064 nm channel; (c) intensity image for the 532 nm channel; (d) false color multispectral intensity image generated by using the 1550 nm intensity for the red channel and the 1064 and 532 nm intensities for the green and blue channels; (e) structural image based on the spread of the returns height; (f) structural image based on the height above ground; (g) structural image based on the number of returns per pulse; (h) ground cloud classification results map.
Remotesensing 08 00936 g005
Figure 6. Spectral and spatial data products derived with the Titan sensor of the archaeological site of Teotihuacan in central Mexico. (a) False color multispectral lidar intensity image generated by using the 1550 nm intensity for the red channel and the 532 and 1064 nm intensities for the green and blue channels; (b) digital surface model (DSM) derived from the lidar spatial data; (c) perspective view generated by overlaying the false color multispectral intensity image over a 3D surface model based on the lidar DSM.
Remotesensing 08 00936 g006
Figure 7. Potential spectral separability of loose and compacted snow, roads with compacted ice and snow are marked with yellow arrows in the figures. (a) Aerial oblique image of McMurdo Station at the time of lidar data collection; (b) Perspective view of a 3D surface model overlaid with a false color lidar intensity image; (c) Active intensity image generated from the 1550 nm channel; (d) Active intensity image generated from the 1064 nm channel.
Remotesensing 08 00936 g007
Figure 8. Illustration of the bathymetric test area: the East Pass near Destin, FL, USA. The solid red line represents the test line that was flown multiple times with different configurations. The white solid line represents the track of the validation samples obtained with an acoustic Doppler current profiler. The yellow rectangle represents the coverage of one the acquired test lines, and the bathymetric elevations derived from that test line dataset are presented as a color map that is offset to the east of the pass.
Remotesensing 08 00936 g008
Figure 9. Small sample of a bathymetric survey surrounding the Green Cay, Bahamas: (a) Rendering of the point cloud of the first returns of the bathymetric channel colored by flight line and intensity; (b) Topographic and bathymetric color map showing water depths and island elevations.
Remotesensing 08 00936 g009
Figure 10. Bathymetric depth accuracy assessment equipment and results. (a) Photo of the SonTek acoustic Doppler current profiler (ADCP) and GPS antenna mounted on a small catamaran; (b) Dispersion plot showing results from the bathymetric depth accuracy assessment.
Remotesensing 08 00936 g010
Figure 11. Illustration of Titan’s footprints and surface illumination from a single pass of the sensor. (a) Intensity rendering of a test swath generated from Titan channel 1; (b) Graph that plots the position and footprints of returns from all of Titan’s channels for the red square sample of the test swath. This graphs illustrated how much of the target surface is illuminated by the laser beams.
Remotesensing 08 00936 g011
Figure 12. Image maps for the Taylor and Pearse valleys in Antarctica. (a) Image map showing the topographic relief of the valleys based on the lidar DEM; (b) Image map showing the laser return density obtained from the valleys.
Remotesensing 08 00936 g012
Table 1. Performance specifications of each of the Titan’s channels.
Channel 1Channel 2Channel 3
Laser Wavelength (nm)15501064532
Look angle (degrees)3.5 forwardnadir7.0 forward
Pulse Repetion Frequency (kHz)50–30050–30050–300
Beam Divergence (mRad)~0.36~0.3~1.0
Pulse Energy (μJ)50–20~15~30
Pulse Width (ns)~2.73–4~3.7
Table 2. Summary of projects and test collections to date with the Titan system.
Project/Test LocationCollection Year and Day of YearPrimary ApplicationLaser on Time (H)
Baytown, TX, USA2014: 289, 300
2015: 47, 222
2016: 127–129
System test
Houston, TX, USA2014: 289System test0.4
Jordan, MT, USA2014: 291Geomorphology0.7
Hebgen Lake, MT, USA2014: 292Tectonics1.1
Big Creek River, ID, USA2014: 293River bathymetry1.0
Greys River, WY, USA2014: 295River bathymetry1.3
Bishop, CA, USA2014: 296Geomorphology0.7
Wheeler Ridge, CA, USA2014: 296Geomorphology0.8
Yucaipa, CA, USA2014: 297Forestry0.9
Beaver, UT, USA2014: 299River morphology0.7
McMurdo Dry Valleys, Antractica2014: 338 to 2015: 19Geomorphology47.5
El Ceibal, Peten, Guatemala2015: 77–82Archaeology5.5
Zacapu, Michoacan, Mexico2015: 88Archaeology0.7
Angamuco, Michoacan, Mexico2015: 88Archaeology0.8
Teotihuacan, Mexico2015: 91–92Archaeology1.69
Laser Servicing
Trinity River, TX, USA2015: 219–222River morphology4.8
NASA JSC Clear Lake, TX, USA2015: 223–227Climate change resiliency5.1
Barataria Bay, LA, USA2015: 228–230Marsh response to oil spill6.8
Destin Inlet, FL, USA2015: 231Bathymetry test1.5
Apalachicola, FL2015: 232–233Aquatic ecosystem1.6
Redfish Bay, TX2015: 235Bathymetry test0.8
Texas Gulf Coast, USA2015: 235Coastal morphology0.5
Reynolds Creek, ID, USA2015: 289, 294Ecology2.6
Santa Clara River, CA, USA2015: 291–293River morphology3.4
Calhoun Creek, SC, USA2016: 057Ecology2.2
Laser Servicing
Campeche, Mexico2016: 138–141Archaeology7.6
Lake Peak Fault, CA, USA2016: 155Tectonics1
Inyo Domes, CA, USA2016: 158Geomorphology0.5
Monterey, CA, USA2016: 157, 159Urban spectral classification0.7
Bastrop, TX, USA2016: 161Orthophotos0.3
NorthWestern Belize2016: 184–186Archaeology, Geomorphology5.0
San Salvador, Bahamas2016: 189–191Island hydrology7.0
Mayan Biosphere Reserve, Peten, Guatemala2016: 197–207Archeaology, Ecology23.7
Table 3. Detail of the number of training and validation samples used for each ground cover class.
ClassTrainingValidation
Grass1691269
Tree123771
Residential24412
Commercial1721089
Road5201203
Table 4. Accuracy assessment results from ground cover classification experiments.
Image StackMahalanobis DistanceMaximum Likelihood
Overall Accuracy (%)Kappa CoefficientOverall Accuracy (%)Kappa Coefficient
1550, 1064, 532 nm + 5 st80.590.7588.150.85
1550, 1064 nm + 5 st76.940.787.270.83
1064, 532 nm + 5 st82.330.7790.220.87
1550 nm + 5 st63.410.5367.960.58
1064 nm + 5 st77.160.7189.890.87
532 nm + 5 st60.150.580.310.74
5 st (only structural)55.630.4563.120.52
1550, 1064 and 532 nm74.180.6778.640.72
Table 5. Results from the water penetration tests under almost ideal bathymetric conditions near Destin, FL, USA.
Flying HeightPRFDepth Cutoff (m)Return Density (m)
(m)(kHz)BayGulfBayGulf
300755.9102.83
3001505.710.15.86
3002006.010.47.58
500755.89.122.1
5001505.89.644.1
5001755.79.04.65
Table 6. Detailed results from the canopy penetration experiments conducted in tropical rain forests.
ConfigurationLaser ShotsShots/m2Returns/ShotGround ReturnsShots W GrndGrnd/m2
Calakmul
125 kHz·W 500 m1,732,7706.191.54162,8609.4%0.58
100 kHz·W 500 m1,018,0283.641.71163,02416.0%0.58
70 kHz·W 500 m725,0782.591.98195,38226.9%0.70
100 kHz 500 C1591,3522.112.58395,74866.9%1.41
100 kHz 500 C2596,1282.133.04448,27775.2%1.6
100 kHz 500 C3587,3352.102.18350,69659.7%1.25
Lamanai
300 kHz 650 m C13,291,4395.141.34160,2394.9%0.25
300 kHz 650 m C23,314,8845.171.85234,8737.1%0.37
300 kHz 650 m C33,282,4825.121.69140,4924.3%0.22
175 kHz 550 m C12,709,1594.231.57198,7137.3%0.31
175 kHz 550 m C22,715,9264.241.97242,5708.9%0.37
175 kHz 550 m C32,708,2994.231.79147,4435.4%0.23
75 kHz 550 m C11,026,0811.601.6898,6139.6%0.15
75 kHz 550 m C21,035,3401.622.00107,09710.3%0.17
75 kHz 550 m C31,019,5461.591.7661,1546.0%0.10
El Ceibal
100 kHz 700 m C1933,9152.291.7859,4176.4%0.15
100 kHz 700 m C2933,5502.291.7540,5724.3%0.10
100 kHz 700 m C3905,7002.221.3619,6432.2%0.05
150 kHz 700 m C11,382,9533.391.7176,7005.5%0.19
150 kHz 700 m C21,383,8953.391.7757,6074.2%0.14
150 kHz 700 m C31,333,6203.271.3326,1782.0%0.06
150 kHz 600 m C11,558,9673.821.8193,0866.0%0.22
150 kHz 600 m C21,557,6773.821.9174,2694.8%0.18
150 kHz 600 m C31,545,0703.791.5137,2942.4%0.09
150 kHz 400 m C12,978,3017.312.11188,5876.3%0.46
150 kHz 400 m C22,969,7627.282.31174,9805.9%0.42
150 kHz 400 m C32,958,4317.262.17125,7774.3%0.31
Table 7. Comparative results from minimum separation between returns test obtained from the Gemini and Titan lidar systems near the Calakmul Mayan site in Campeche, Mexico. Range separation results are given in meters.
2014 Gemini2016 Titan @ 100 kHz
125 kHz100 kHz70 kHzC1C2C3
Number of Shots694,825381,483262,265226,802229,250223,838
Shots with 2 Returns214,904129,27092,12367,33647,74782,178
Shots with 3 Returns78,03064,08761,02467,98064,07857,482
Shots with >3 Returns828910,71217,60746,09293,87320,073
Only 2 Returns
Min1.5351.5771.5020.6780.6660.662
1%2.7822.6062.4340.9890.8880.928
3%3.2173.0152.8281.2081.0441.103
1st–2nd
Min1.4951.4751.3210.6650.6630.675
1%2.1222.0311.8940.8320.7890.83
3%2.4522.3422.190.9650.8830.937
2nd–3rd
Min1.511.6521.550.6590.6620.7
1%2.432.2472.0840.8630.7740.848
3%2.7462.5532.3791.0020.8910.971
3rd–Last
Min1.6831.731.5820.6910.6530.71
1%2.3862.2782.1121.060.9861.03
3%2.732.5552.361.2411.1971.256
Table 8. Comparative results from minimum separation between returns test obtained from the Titan sensor running at different PRFs near the Lamani Mayan site in Belize. Range separation results are given in meters.
300 kHz650 m175 kHz550 m75 kHz550 m
C1C2C1C2C1C2
Number of Shots3,292,0633,315,4932,709,6692,716,4241,026,4081,035,563
Shots with 2 Returns827,0191,118,222819,056894,329320,157338,856
Shots with 3 Returns133,990544,008272,968501,007128,830196,336
Shots with >3 Returns8973208,02562,132250,04738,421102,401
Only 2 Returns
Min0.6670.6620.6690.6610.6660.662
1%0.9070.8040.8960.810.8980.808
3%1.0440.9421.0640.9531.0760.949
1st–2nd
Min0.7050.6580.6680.6630.6730.666
1%0.8370.7690.8240.770.8090.767
3%0.9360.8810.9520.8850.9530.883
2nd–3rd
Min0.670.6640.6430.6480.6610.659
1%0.8720.7840.8420.7770.8480.778
3%0.9680.8960.9760.8940.9810.894
3rd–Last
Min0.6840.6380.6780.6530.6750.66
1%0.8790.8030.890.8040.8790.804
3%0.9780.9331.0230.9431.0230.943
Table 9. Shot densities and fraction of surface illuminated in a single pass of the Titan sensor.
ChannelNumber of ShotsShot Density 1/m2Illuminated Surface m2% of Surface Illuminated
C126662.58257.7625.0%
C226502.56186.3718.0%
C326992.61861.0983.3%
All Channels80157.75910.7388.2%
Table 10. Results from a precision and accuracy assessment of height values for different system PRFs at the middle of the sensor operational flying height envelope.
PRFRangeNumber of SamplesHeight RMSE (m)
(kHz)(m)C1C2C3C1C2C3C123
Precision
100900658-6670.02-0.0180.030
20090014119315420.0180.0280.0180.020
300800253575647660.0190.0260.0170.048
1005001038106110600.0190.0180.0210.045
2005002208228022550.0200.0180.0210.022
3003507476721873800.0170.0160.0160.027
Accuracy
100900207-1790.051-0.0820.048
200900347273240.0550.0370.0600.044
300800420824650.0730.0440.0590.0649
1005002192362420.0220.0370.0220.042
2005004344875000.0180.0350.0200.030
3003509178959140.0190.0330.0210.026
Table 11. Results from height accuracy assessments performed as part of mapping projects with different sensor PRFs and flying heights.
LocationConfigurationNumber of Test PointsRMSE (m)
Teotihuacan, Mexico250 × 3 kHz, 900 m5810.041
University of Houston, Texas250 × 3 kHz, 500 m10180.035
Orange Walk, Belize175 × 3 kHz, 550 m22380.044
NASA JSC, Texas150 × 3 kHz, 750 m29230.049
Calhoun Creek, South Carolina100 × 3 kHz, 700 m63140.033
Monterey, California100 × 3 kHz, 700 m10860.037

