
The Customized Automatic Processing Framework for HY-2A Satellite Marine Advanced Products

Abstract
:
1. Introduction
2. Products and Related Work
2.1. The Onboard Sensors of HY-2A Satellite and Their Products
2.2. The Ground Application System
2.3. Related Work and Problems
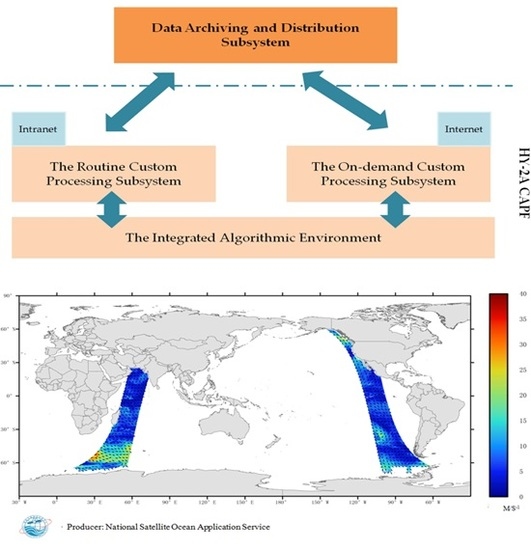
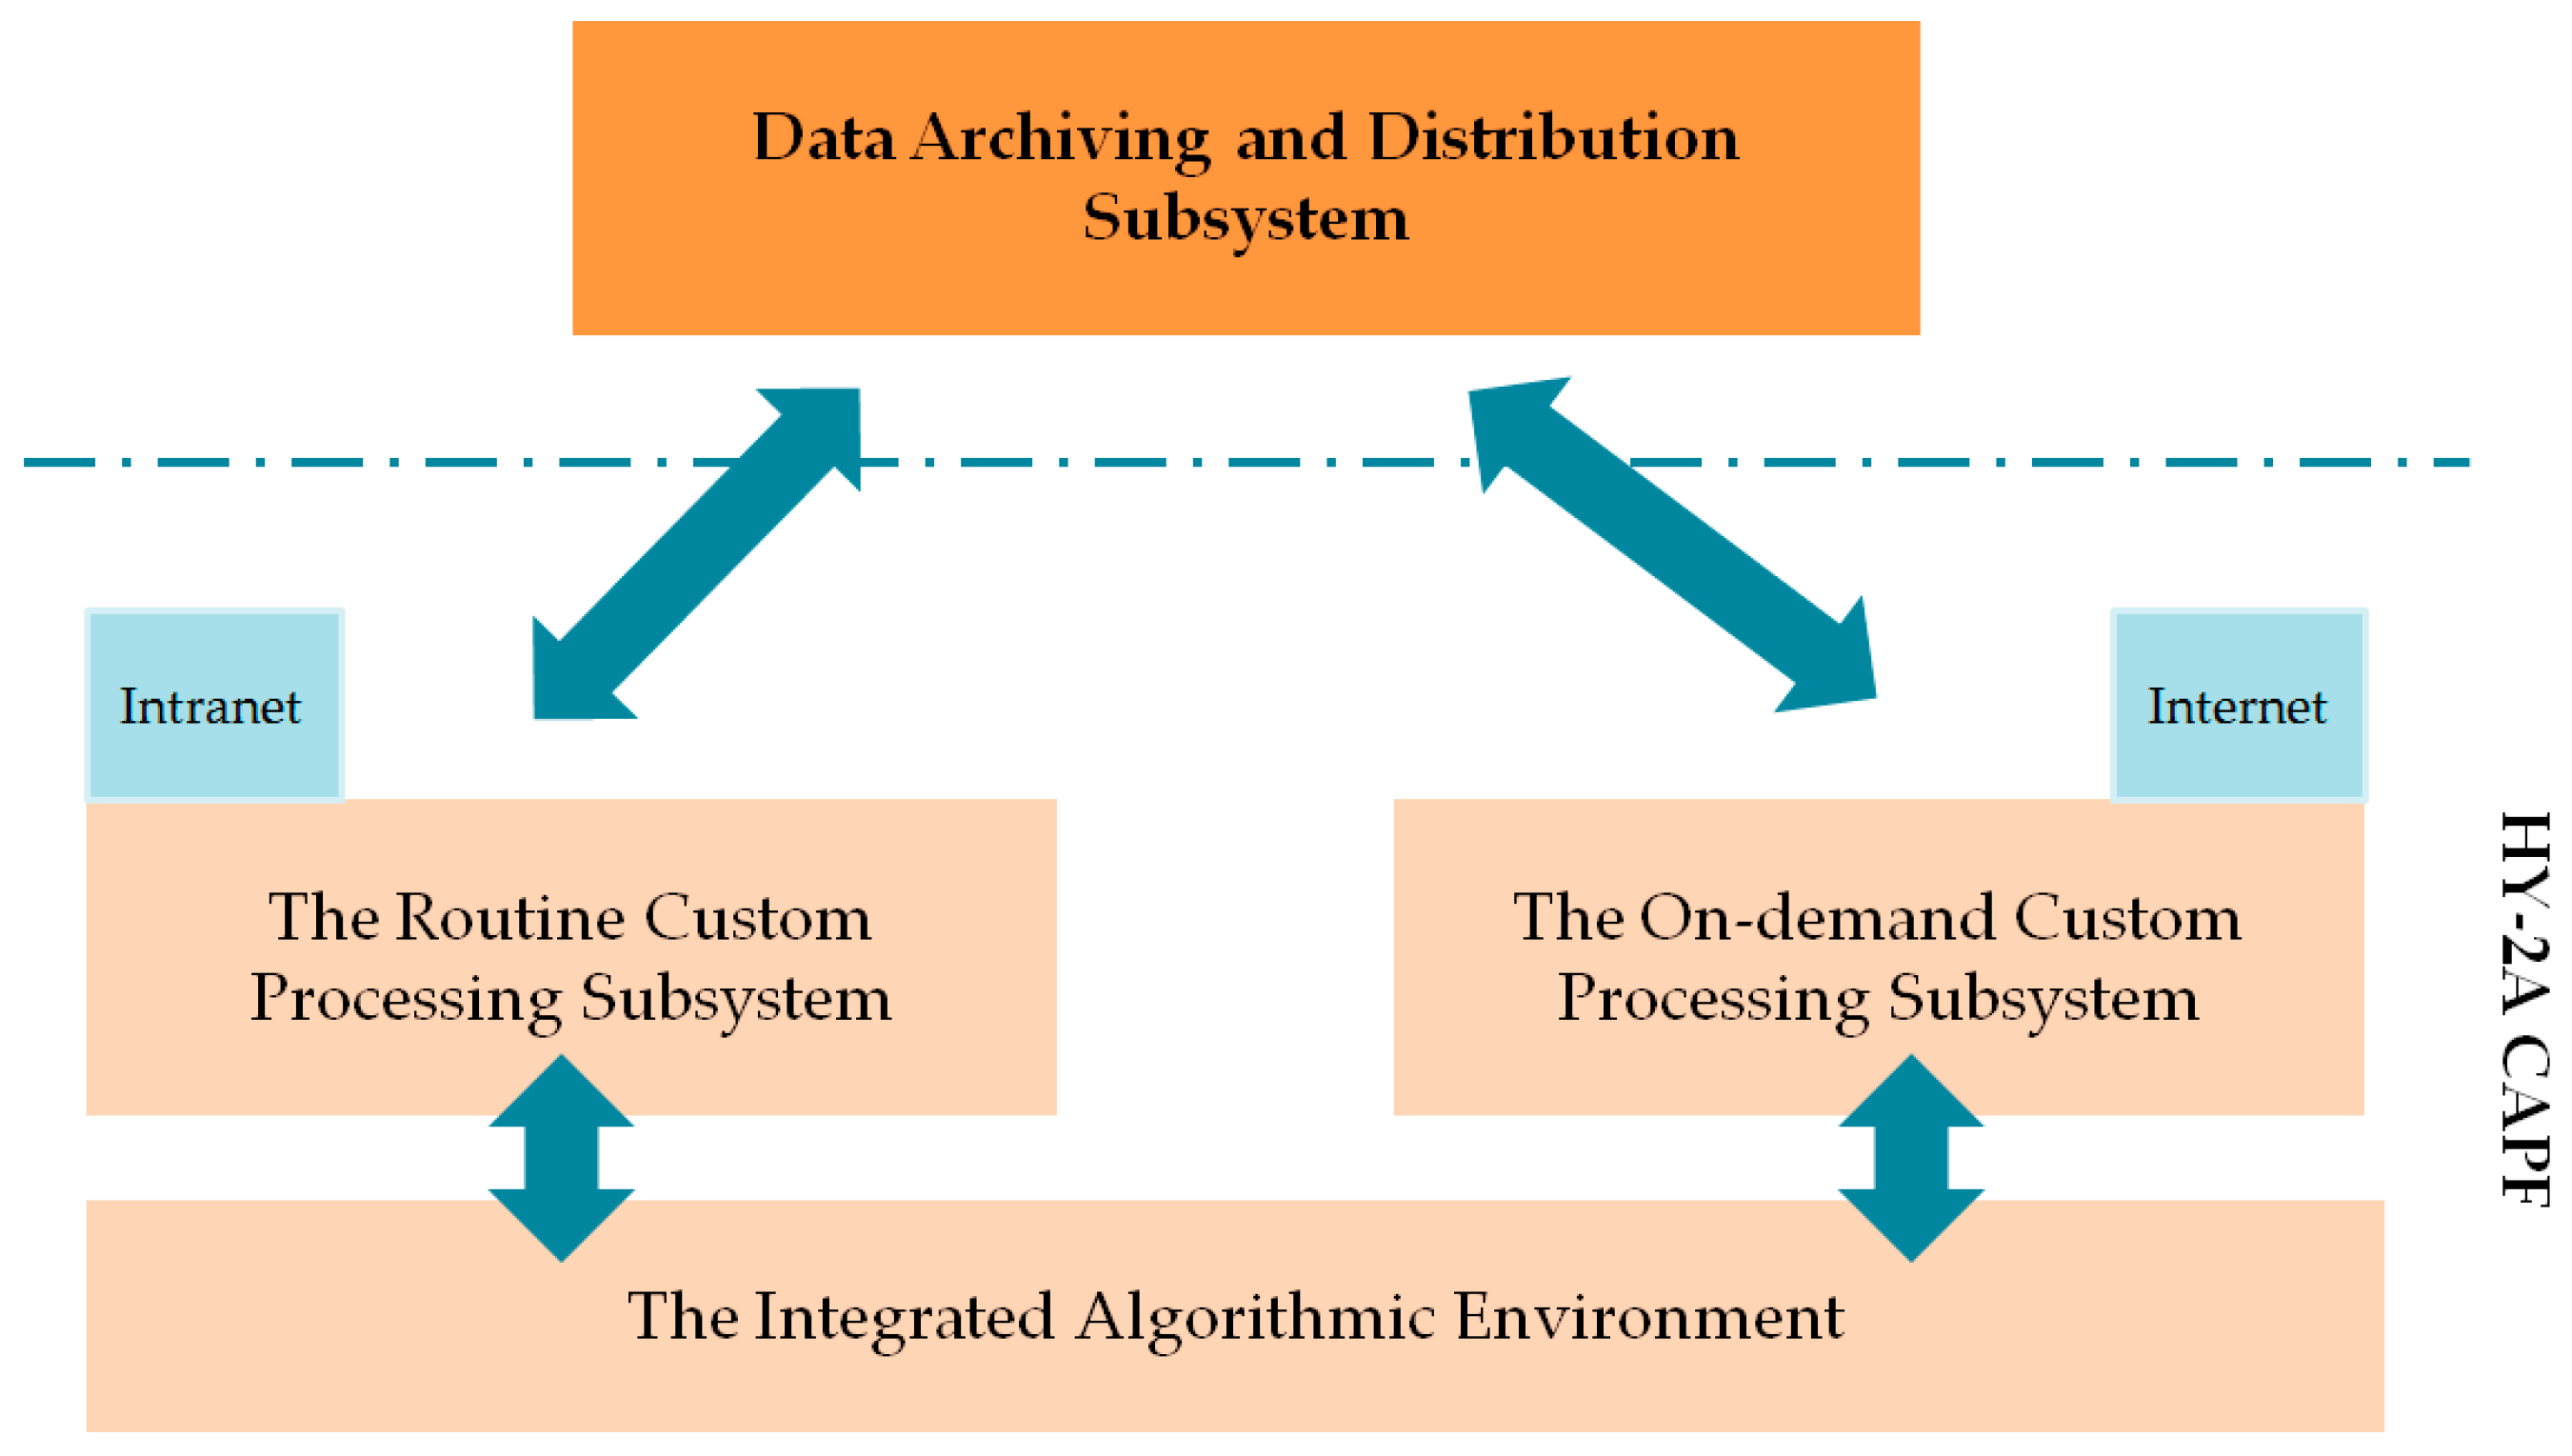
3. The Components of HY-2A CAPF
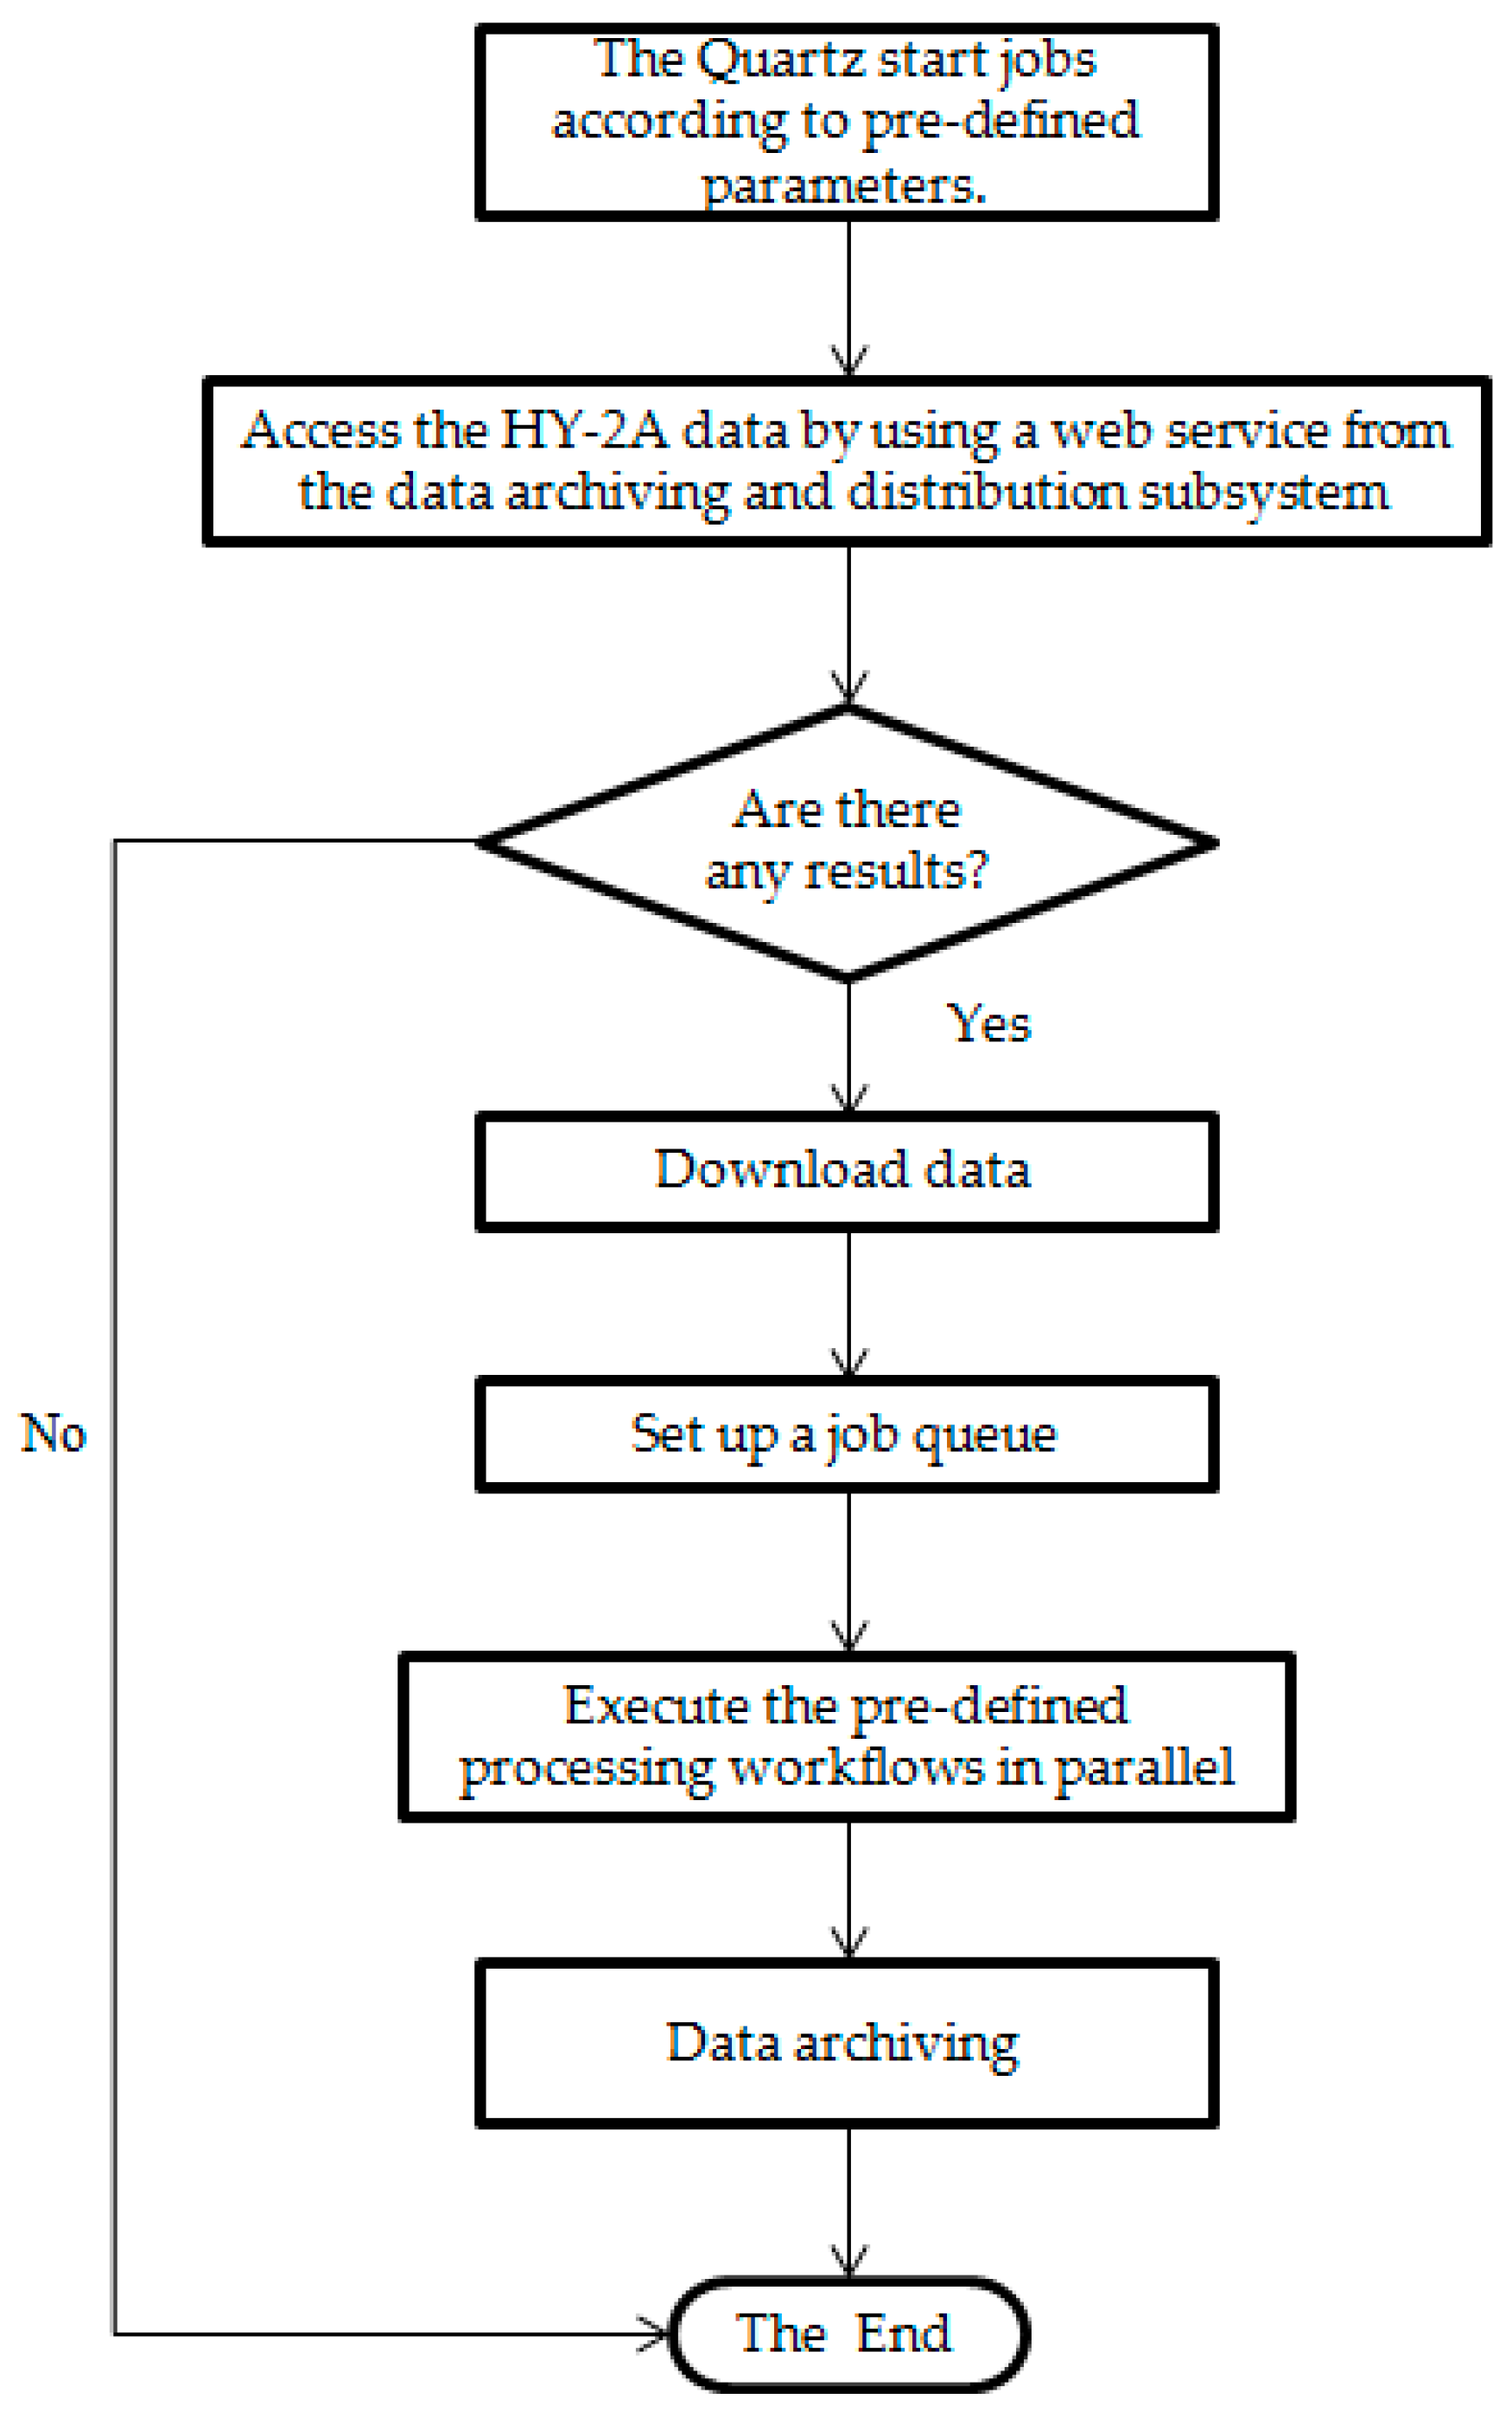
3.1. The Routine Customized Processing Subsystem
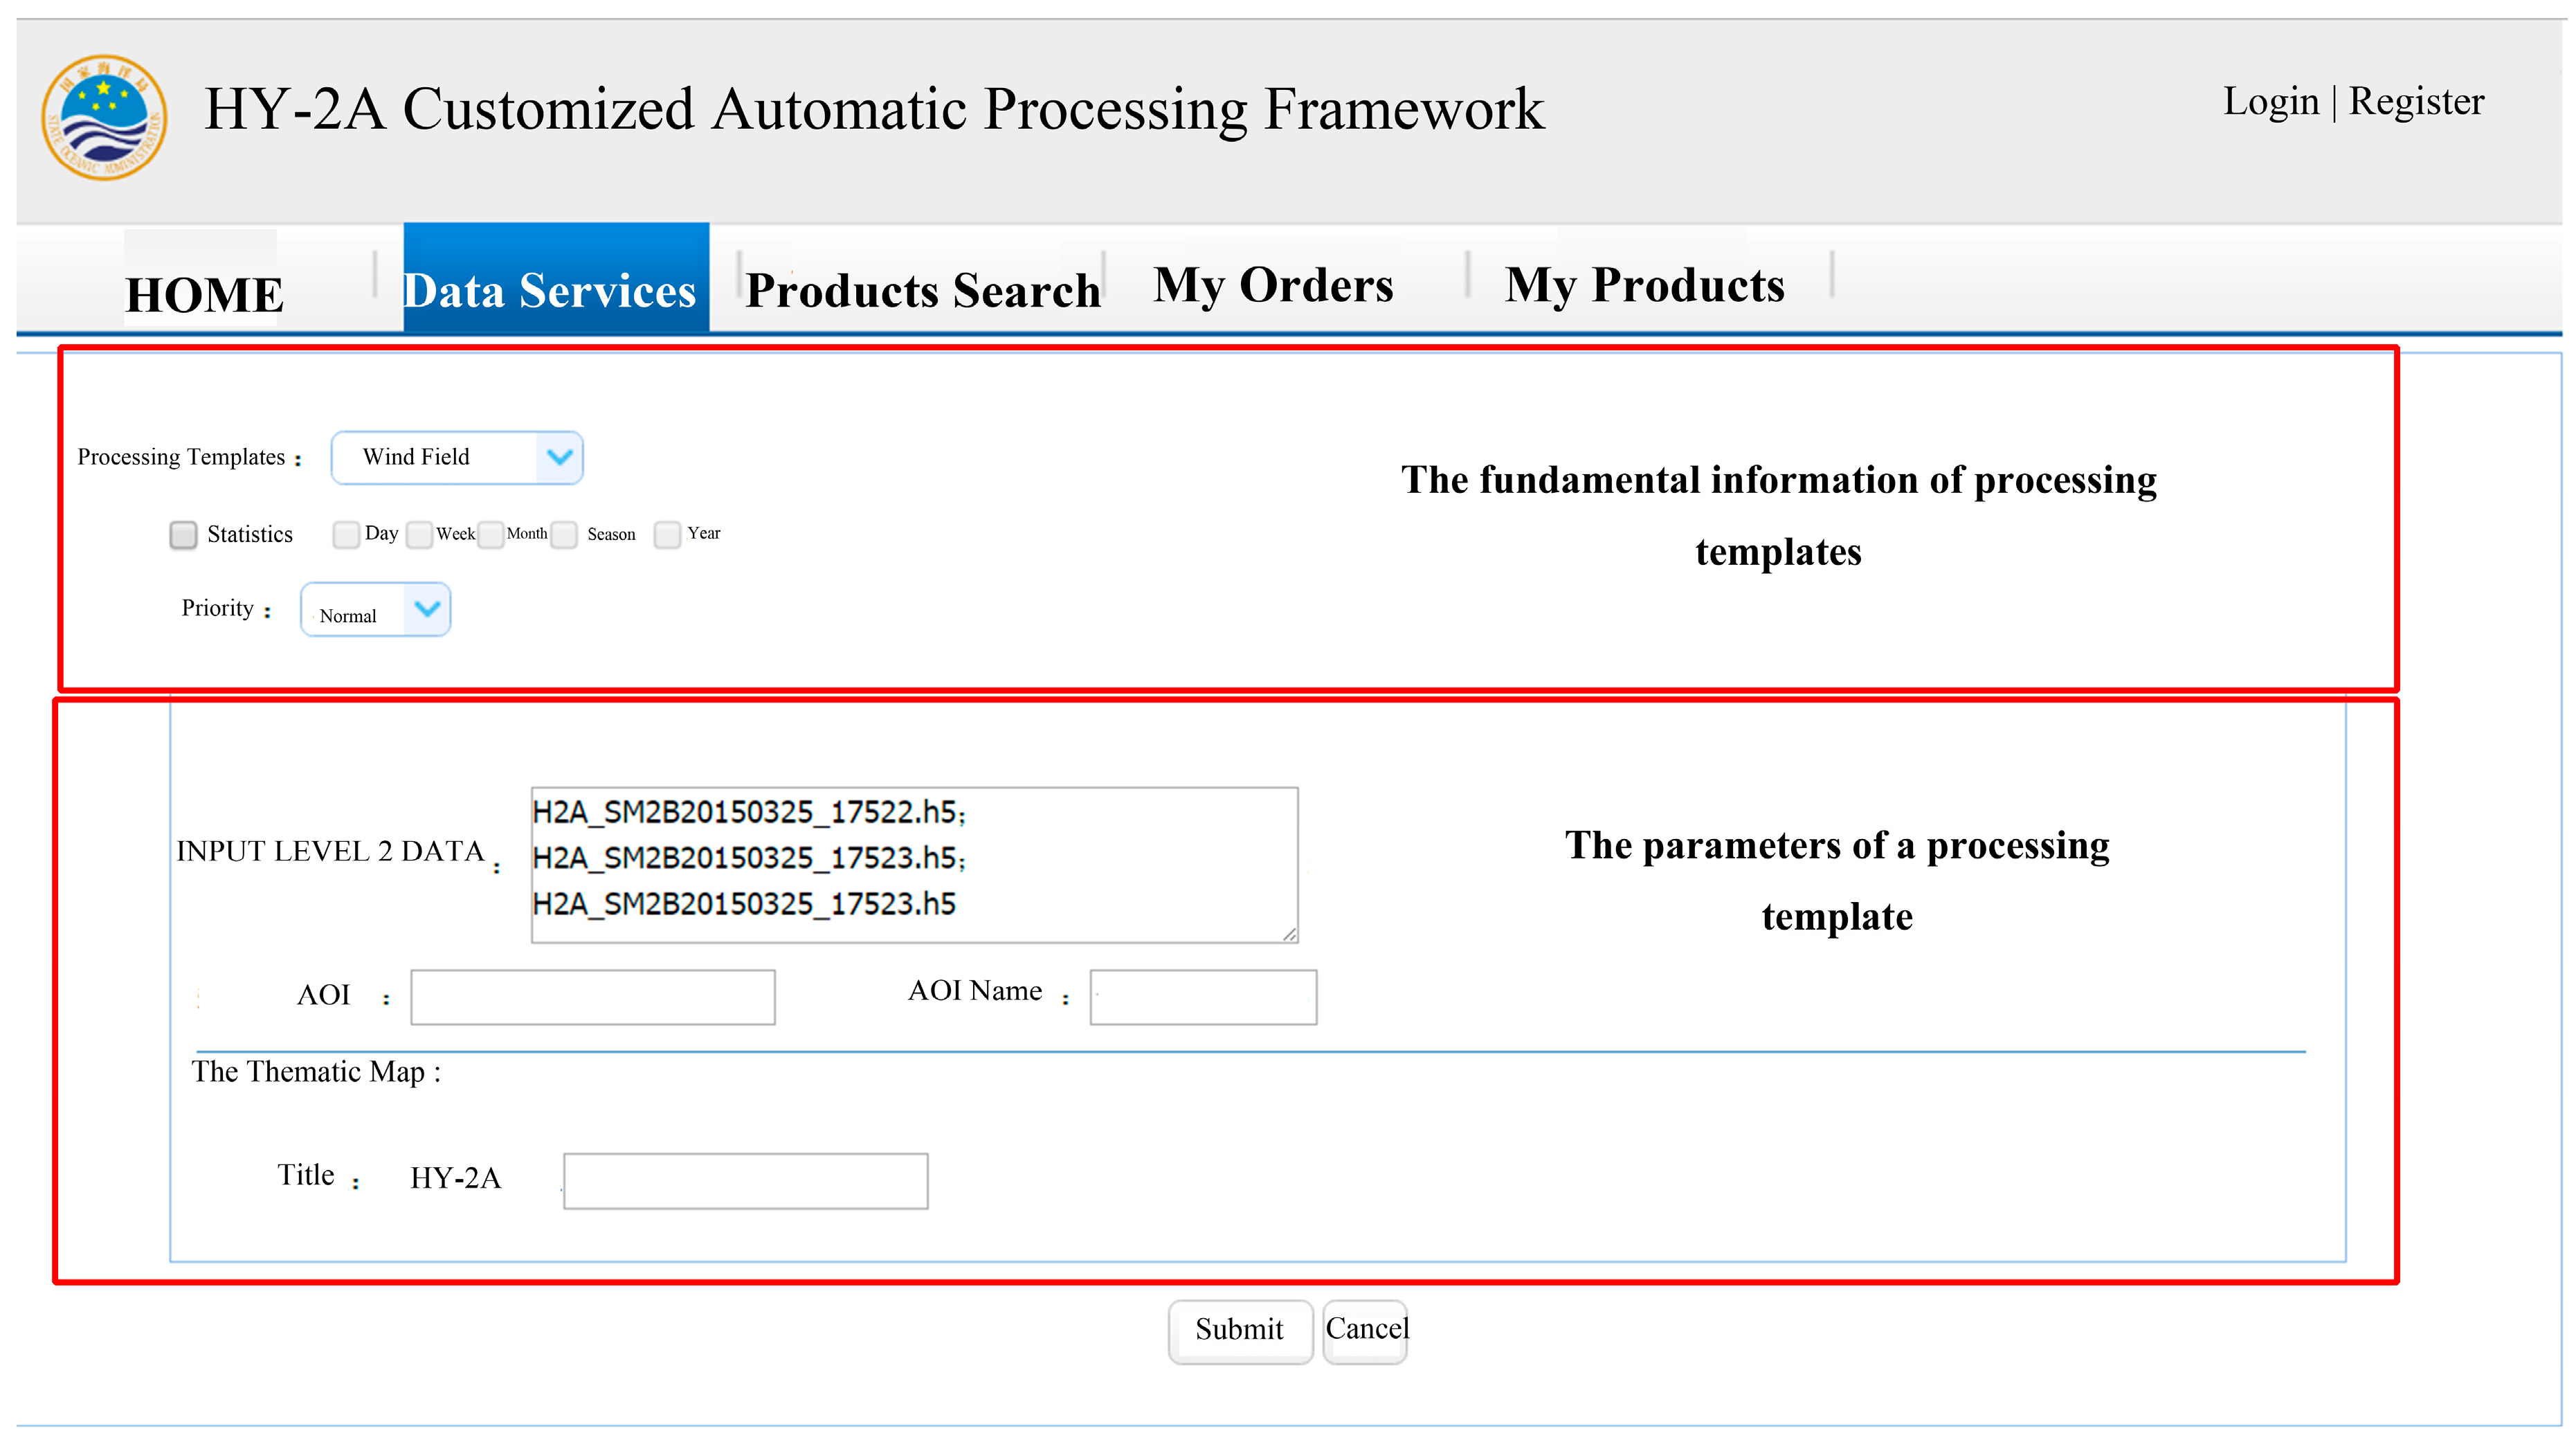
3.2. The On-Demand Customized Processing Subsystem
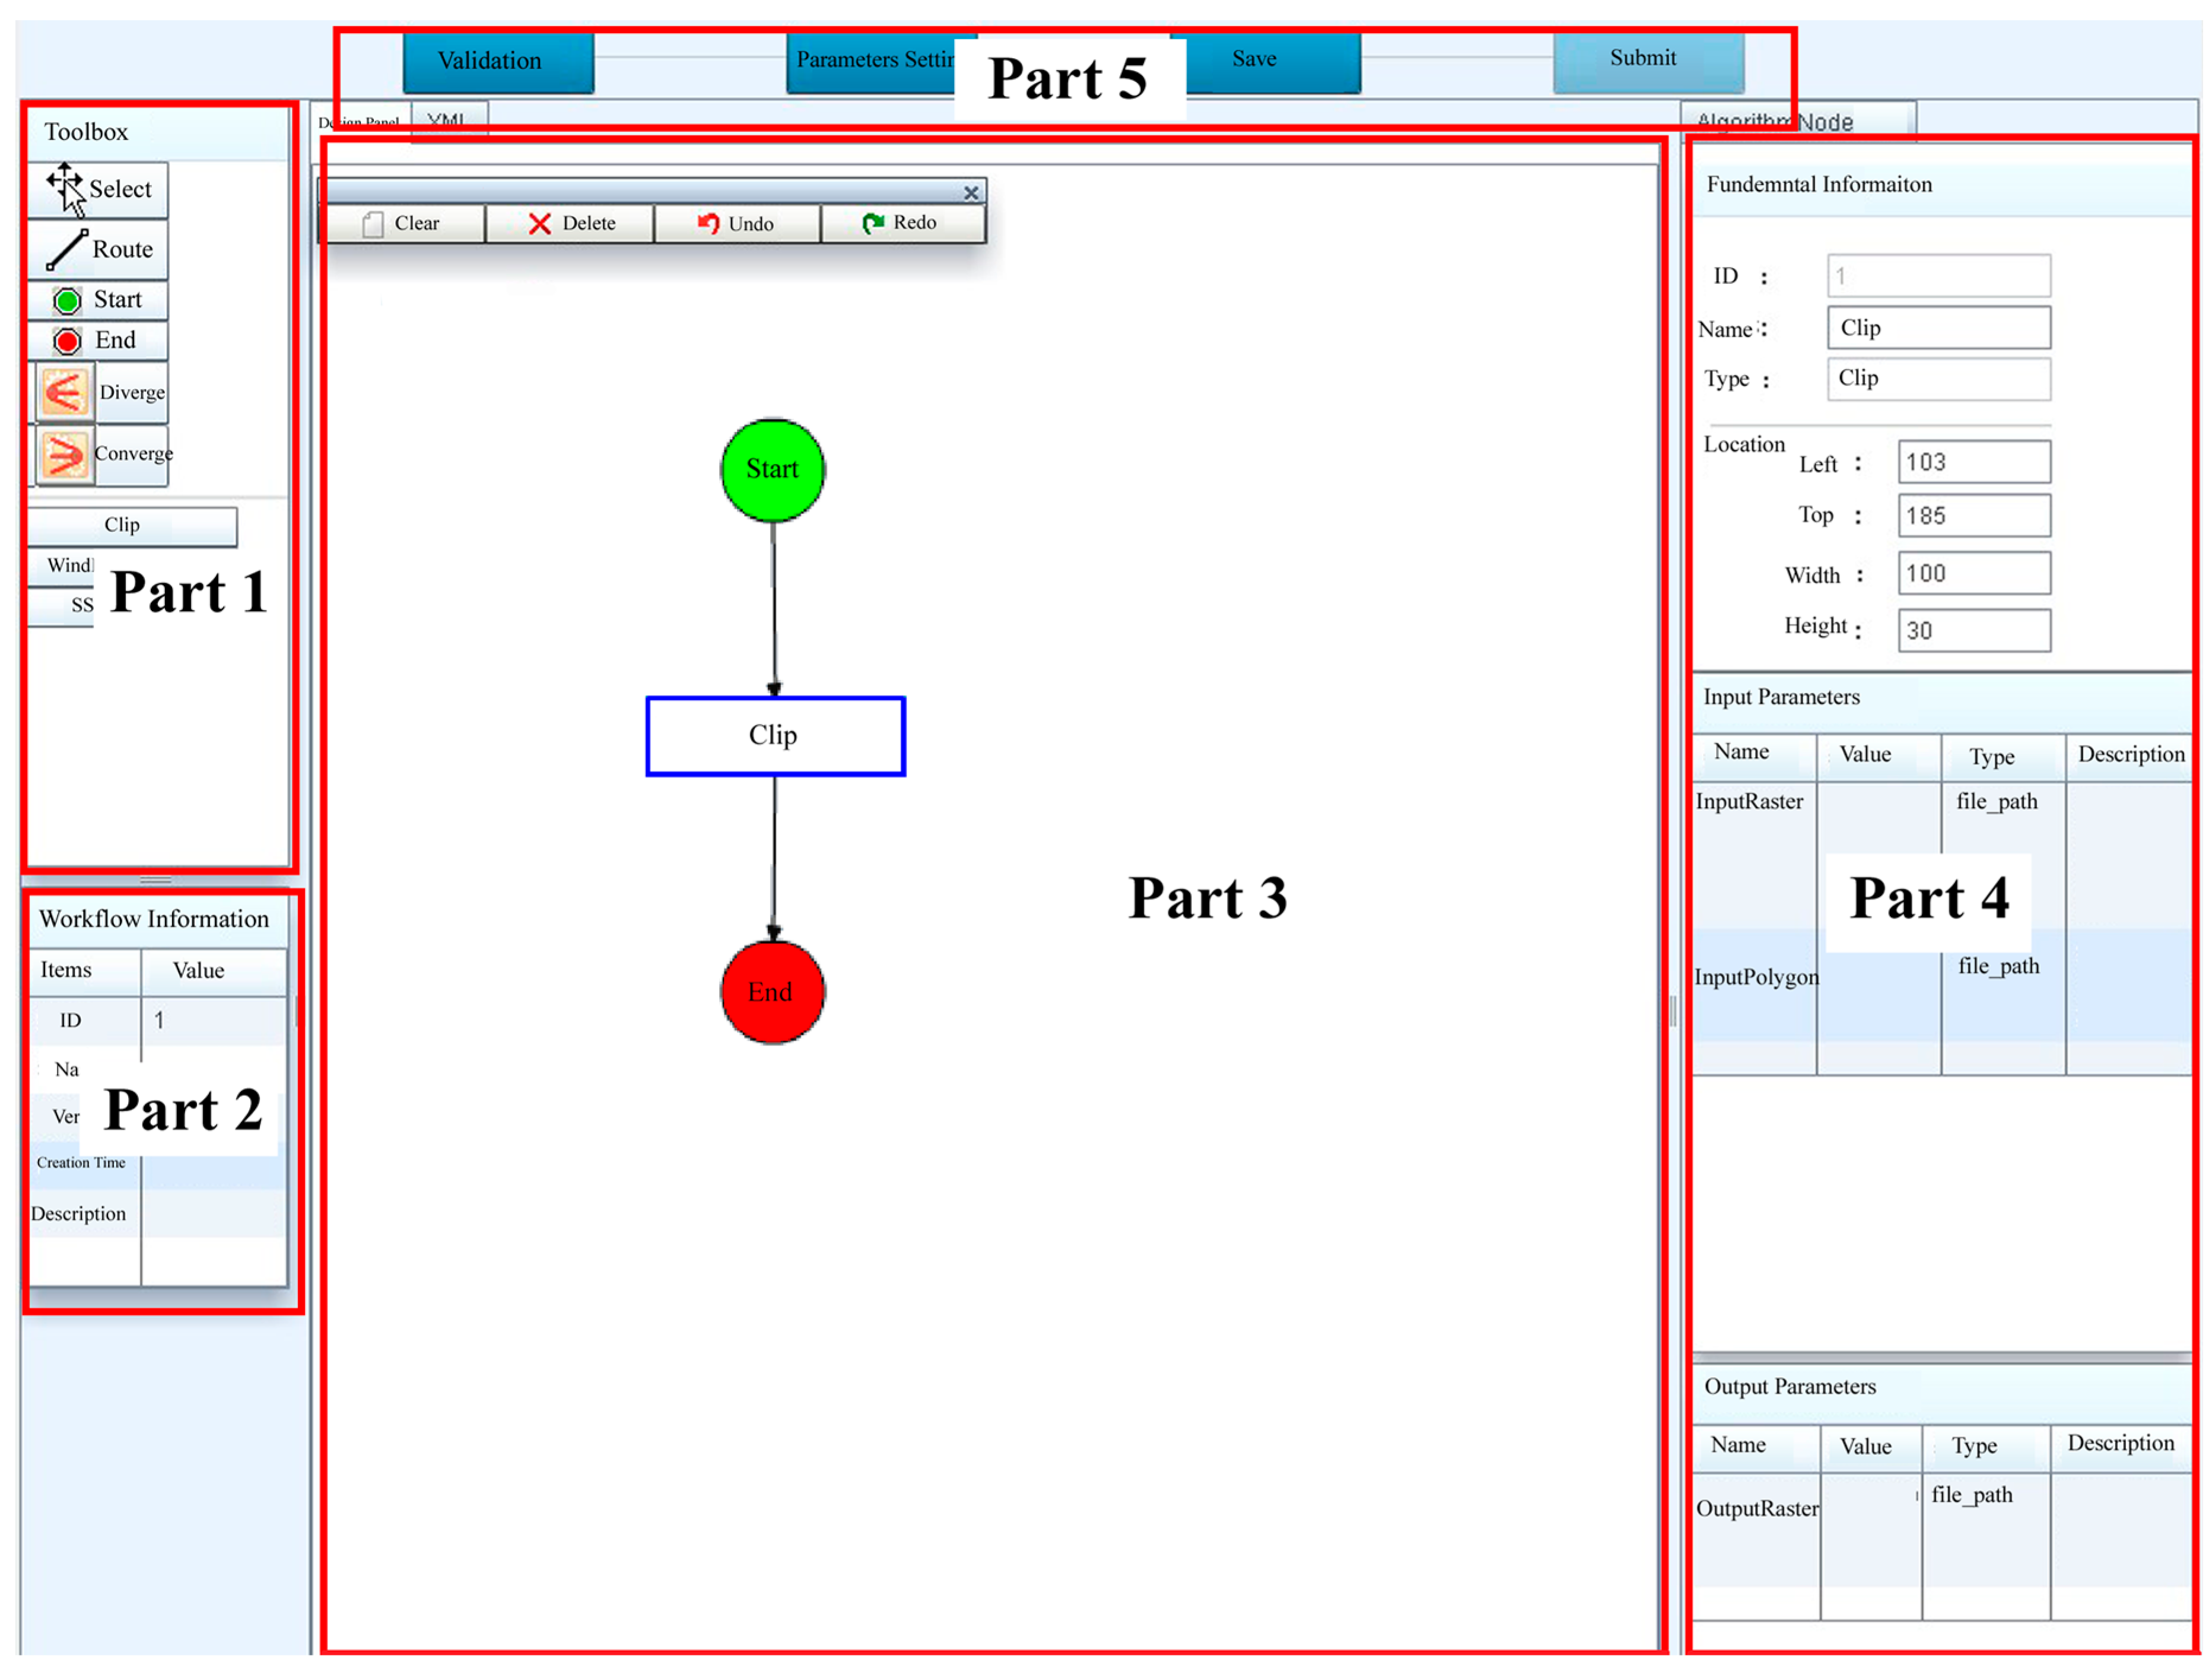
3.3. The Integrated Algorithmic Environment
4. Case Studies
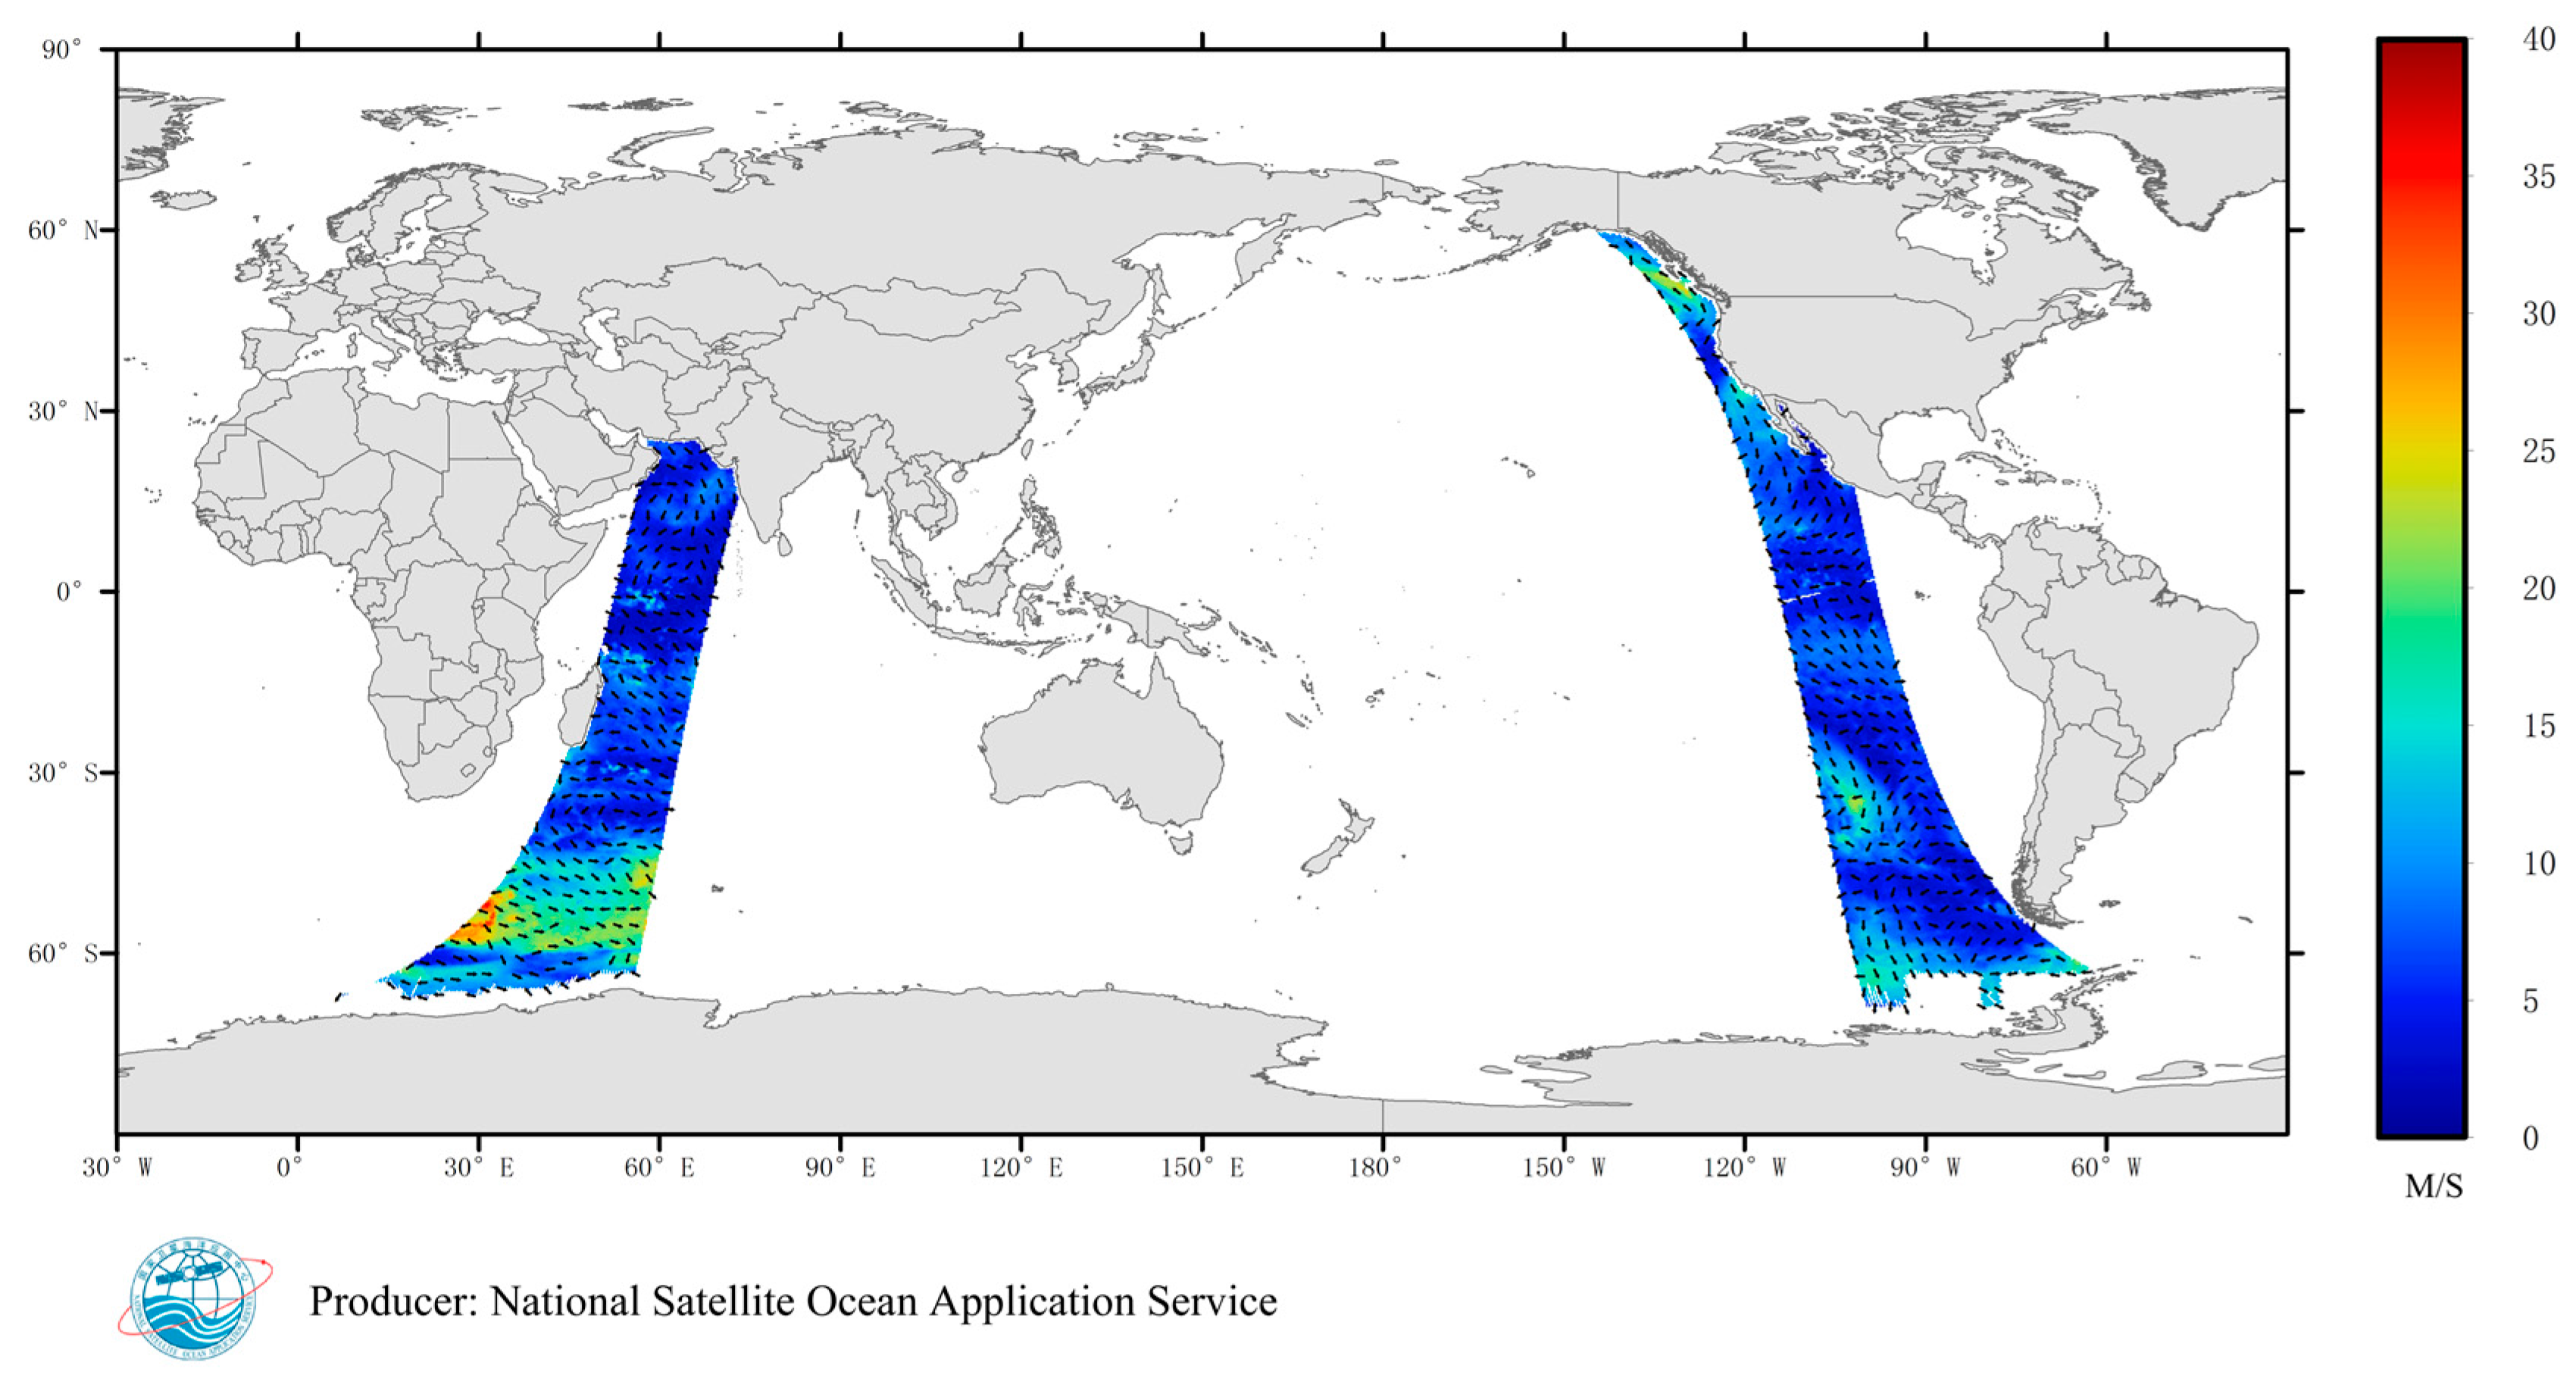
4.1. Wind Field
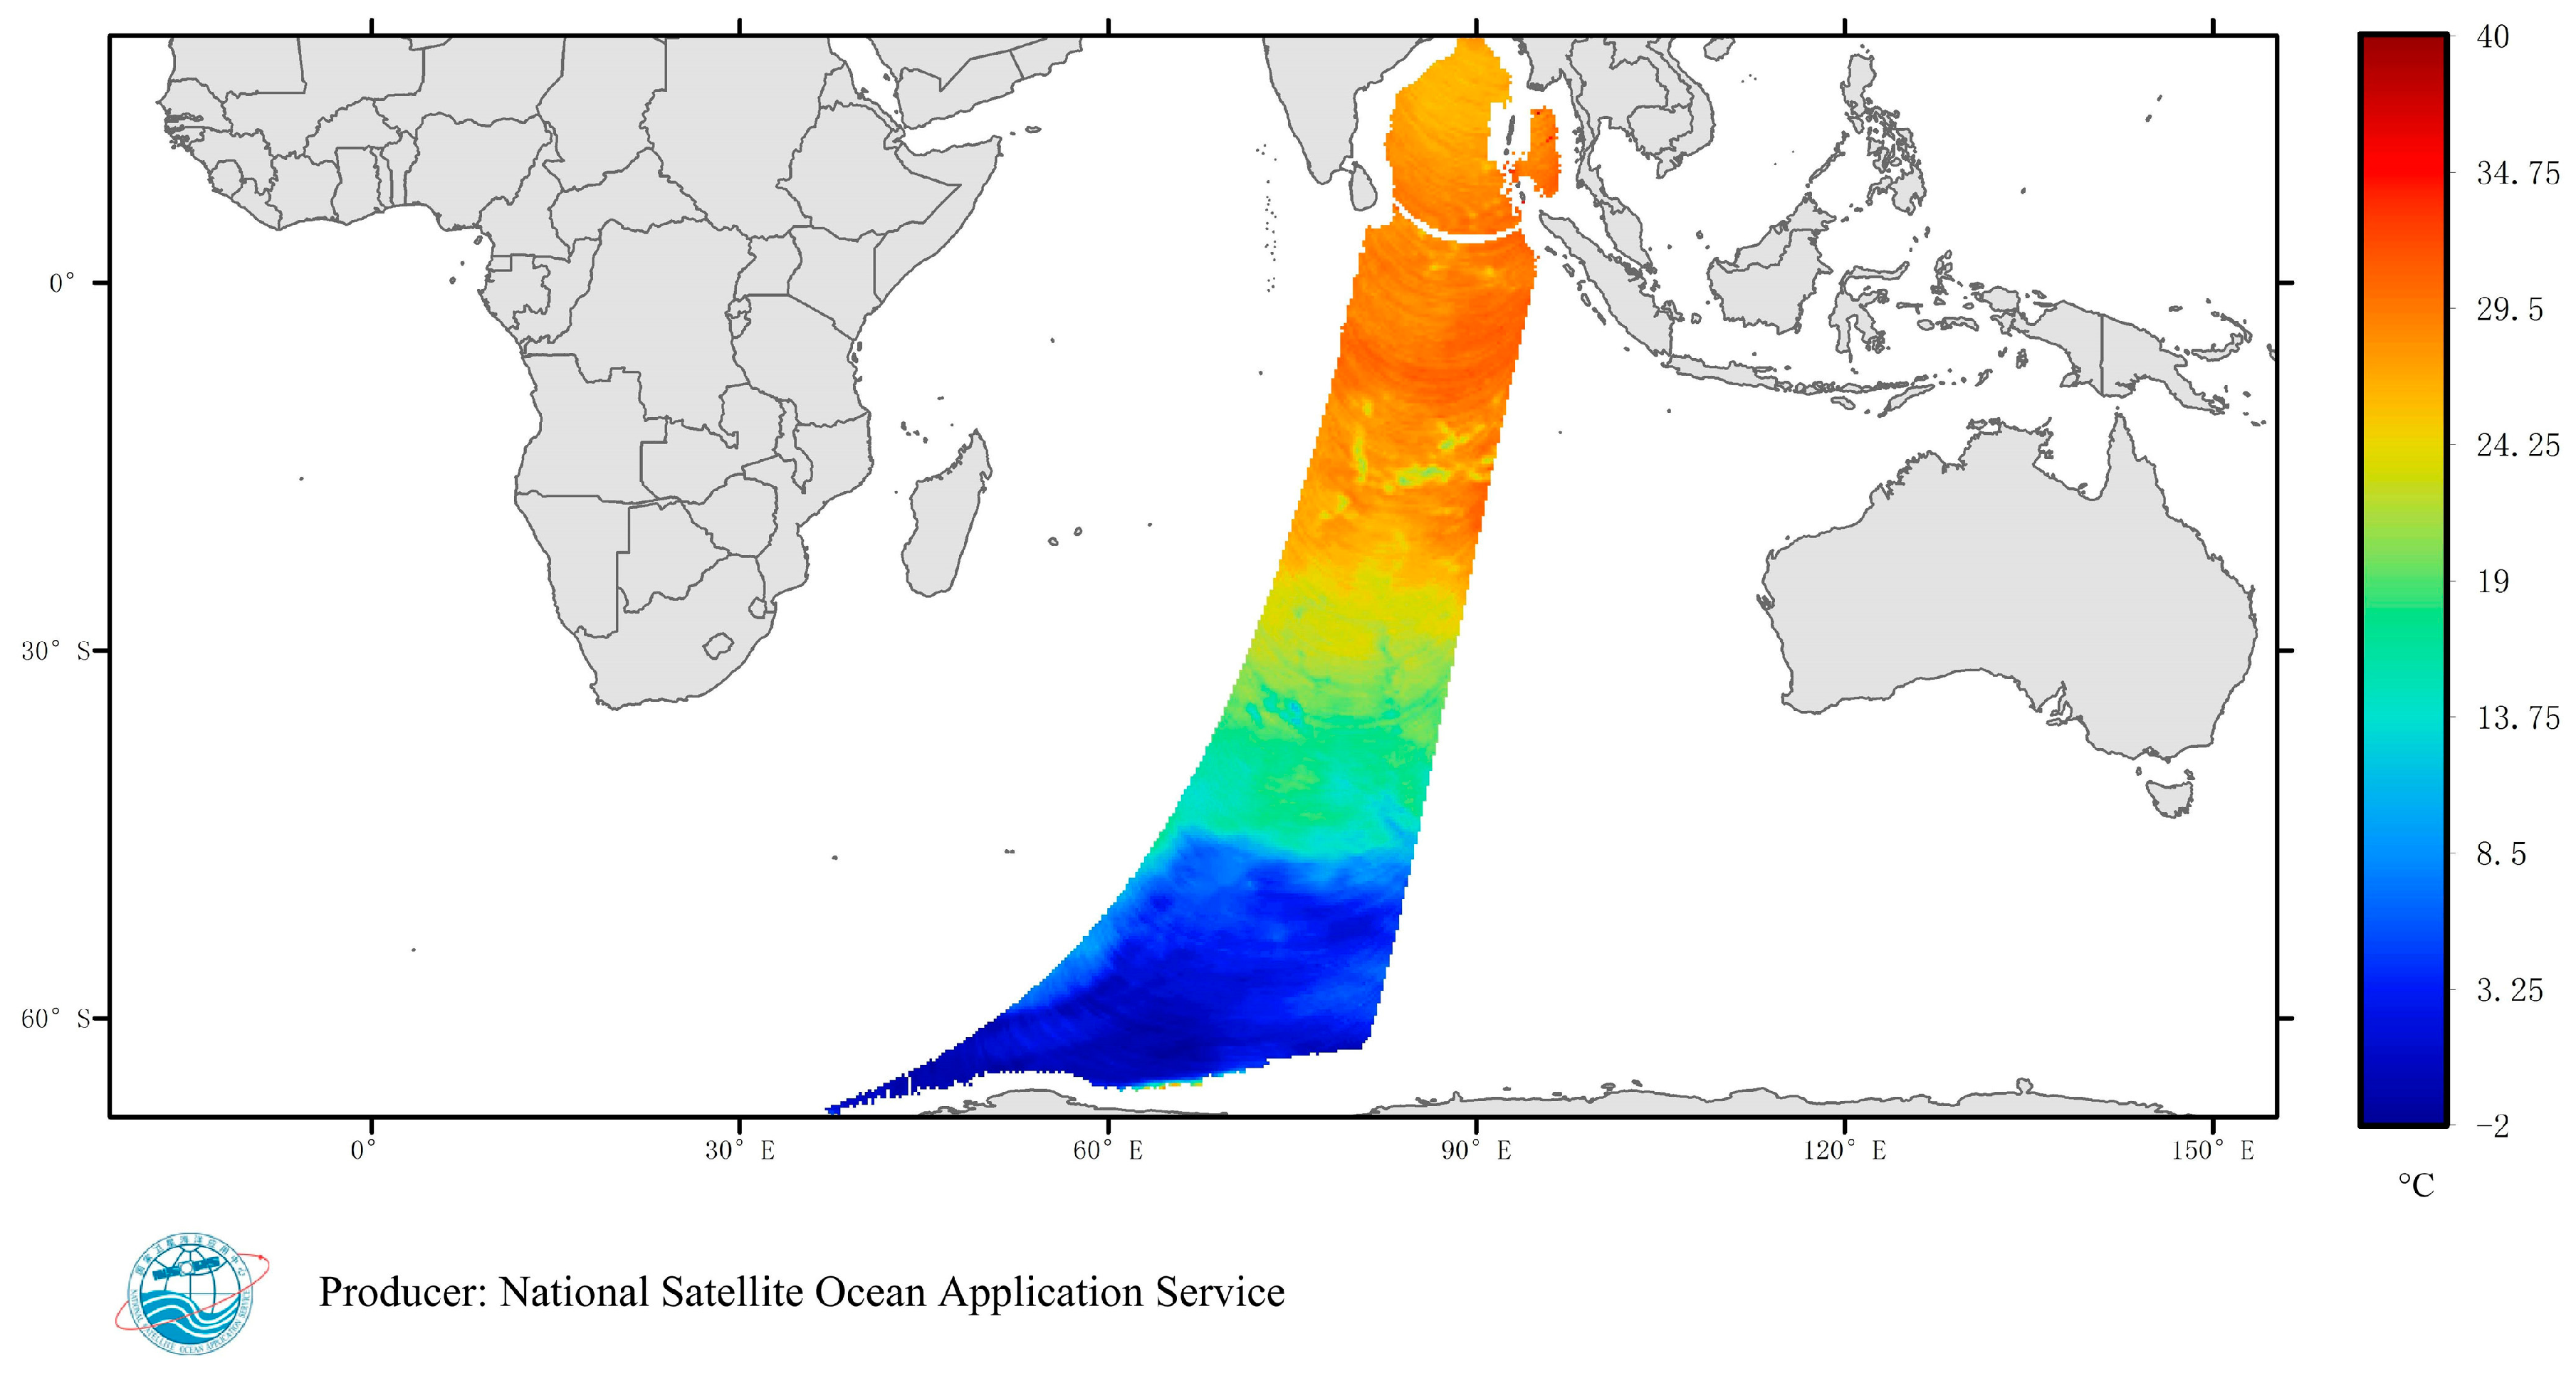
4.2. Sea Surface Temperature
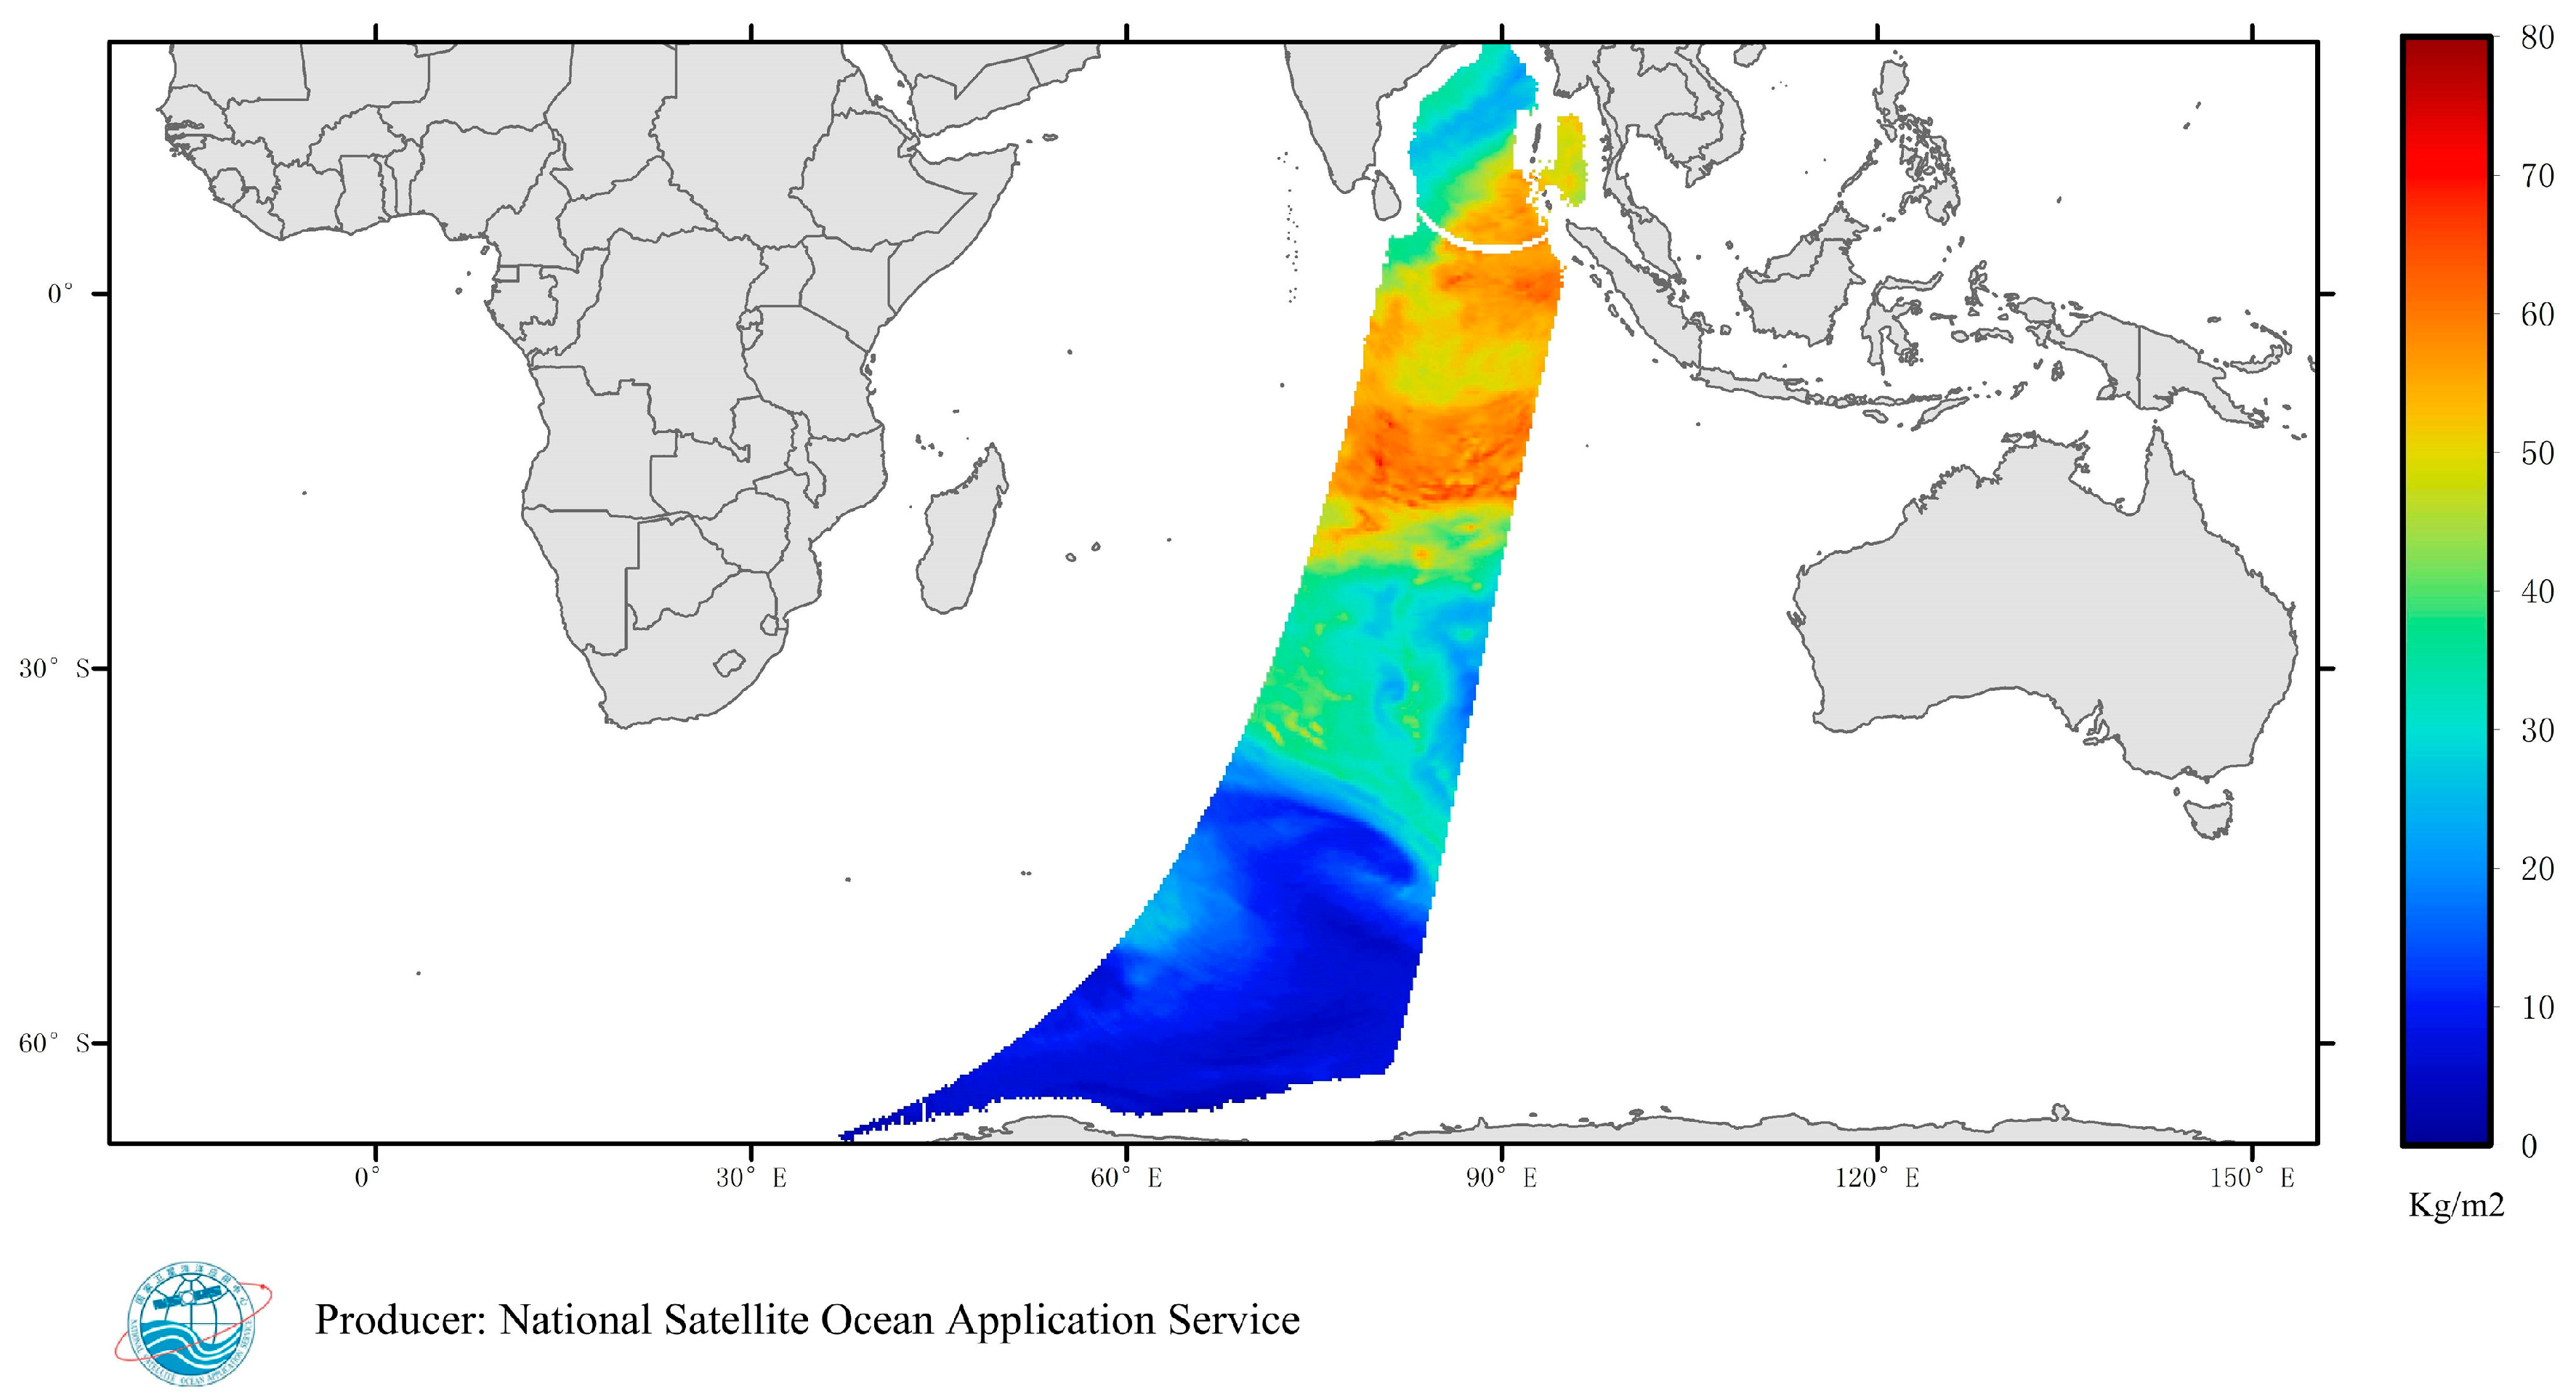
4.3. Water Vapor
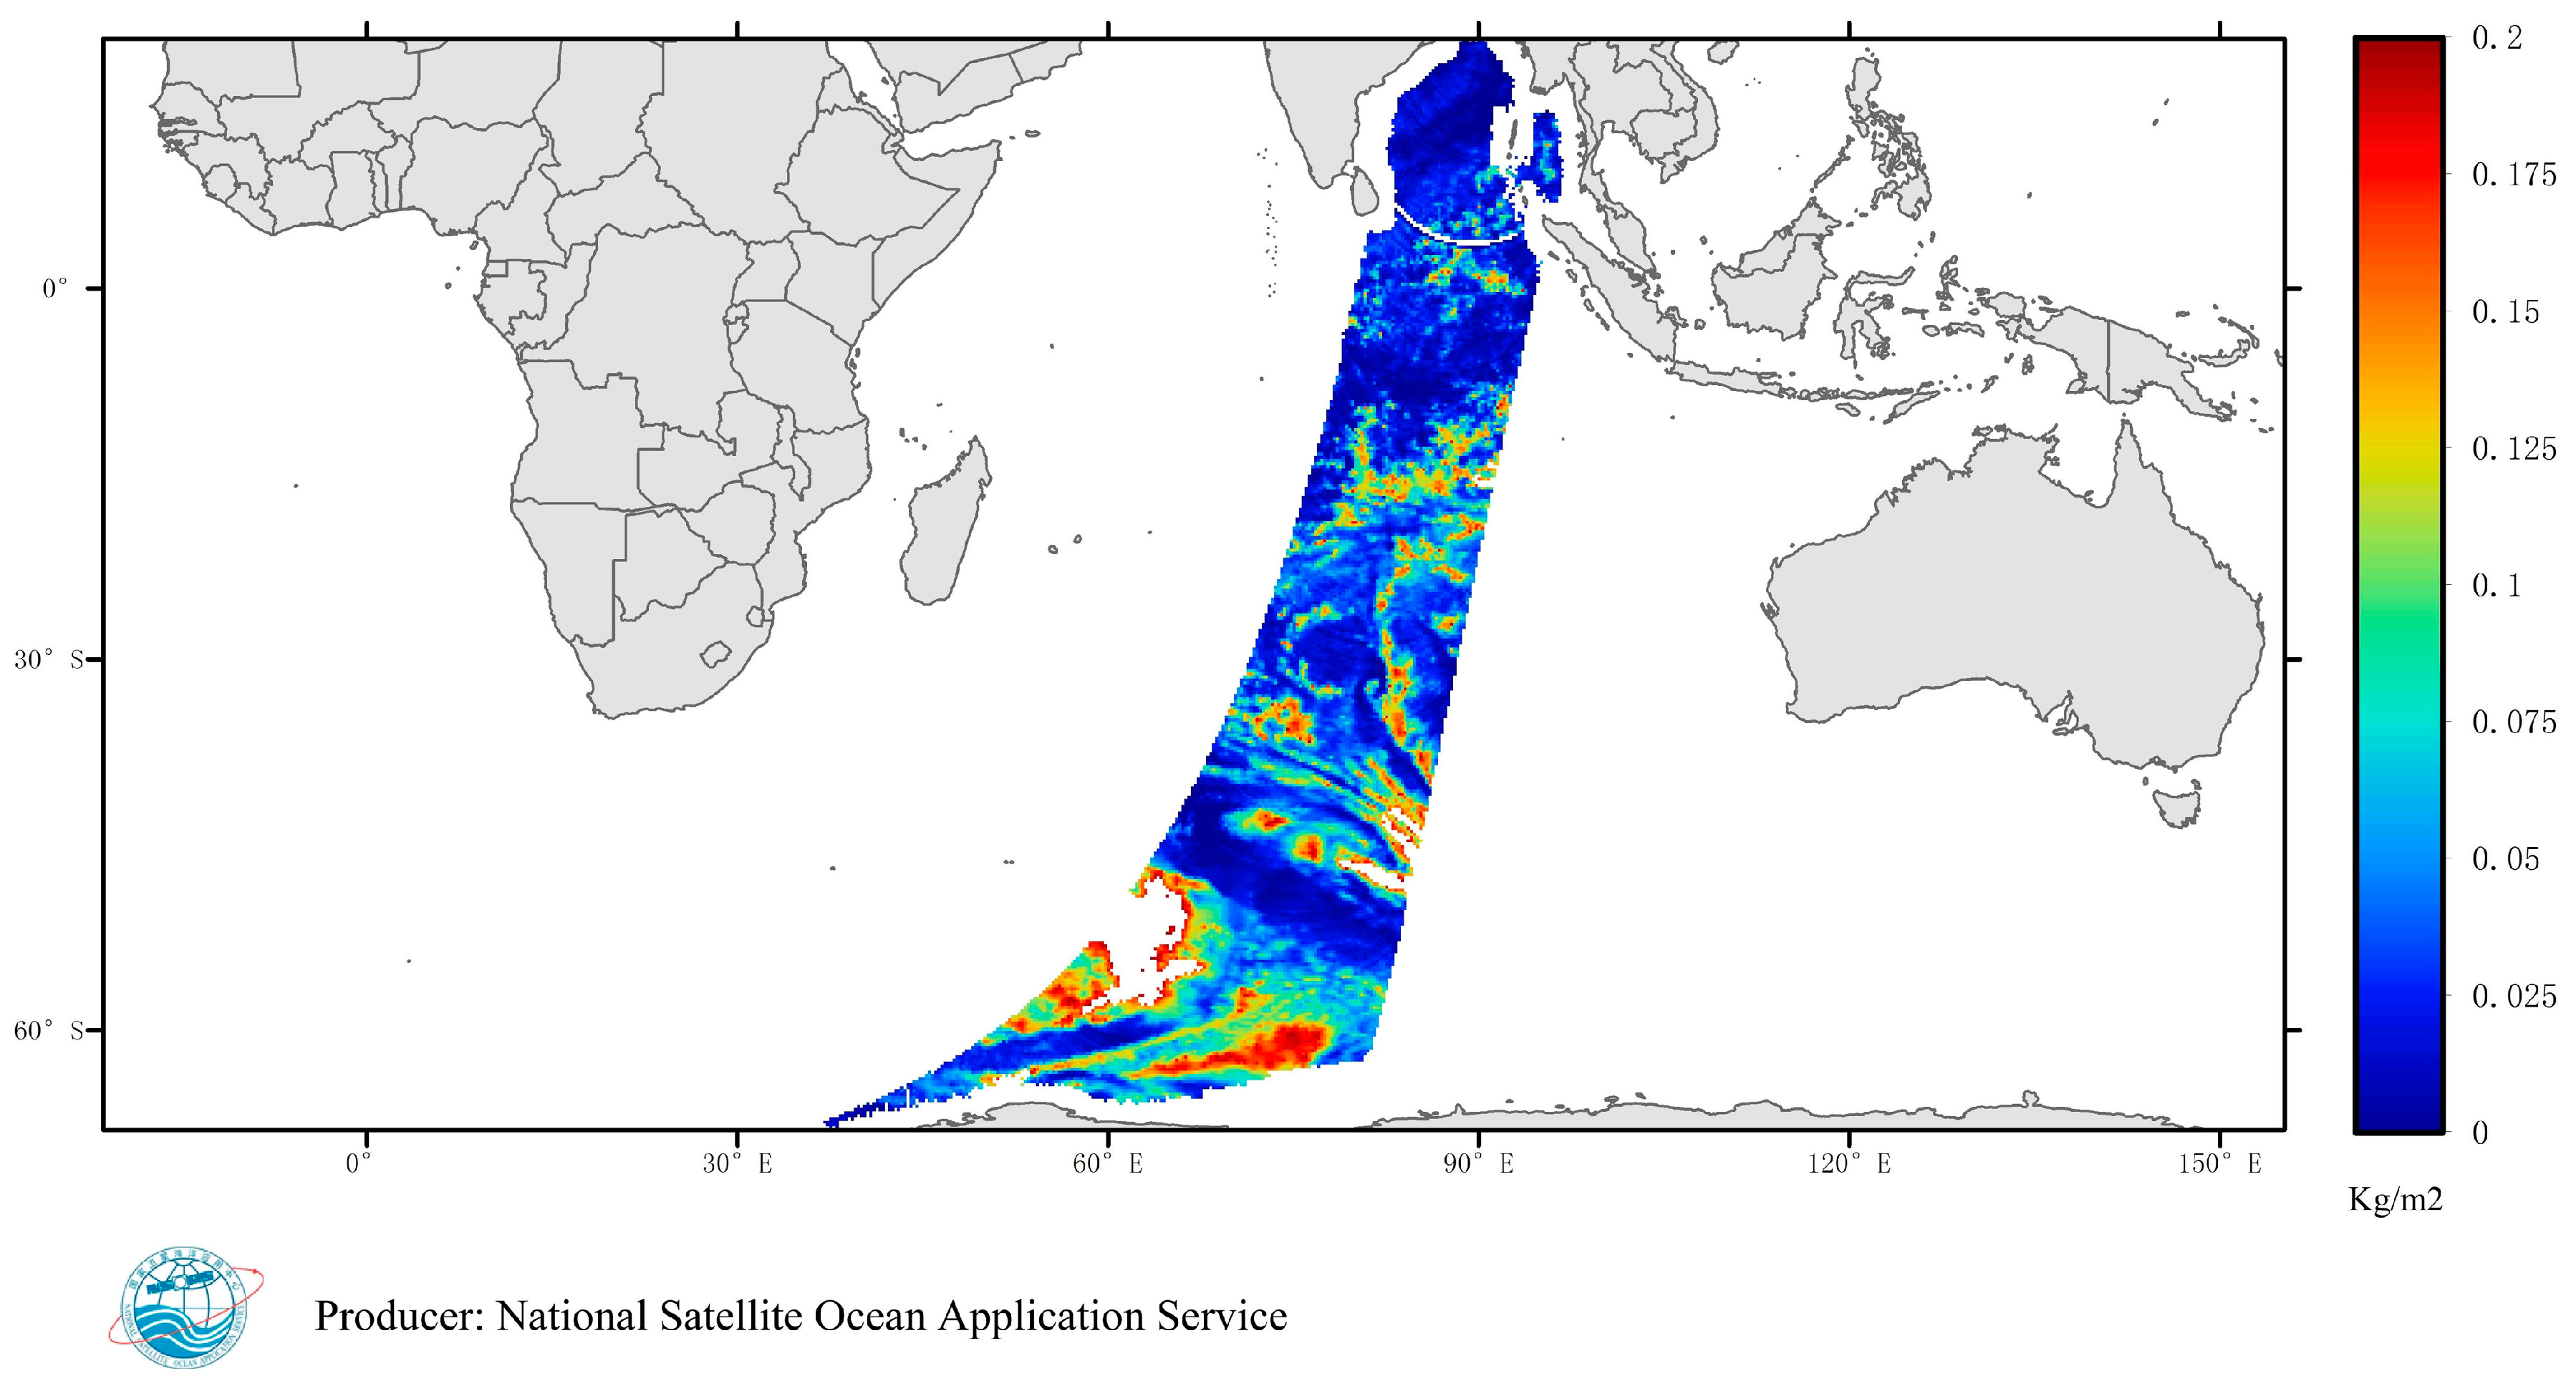
4.4. Cloud Liquid Water
5. Discussion
6. Conclusions
Acknowledgments
Author Contributions
Conflicts of Interest
Abbreviations
| AJAX | Asynchronous Javascript and XML |
| AOI | Area of Interest |
| CAPF | Customized Automatic Processing Framework |
| CD | Compact disc |
| ESA | European Space Agency |
| EUMETSAT | European Organisation for the Exploitation of Meteorological Satellites |
| FTP | File Transfer Protocol |
| GISTDA | Geo-Informatics and Space Technology Development Agency |
| GloVis USGS | Global Visualization Viewer |
| GMF | Geophysical Model Function |
| GUI | Graphical User Interface |
| HDF | Hierarchical Data Format |
| HH | Antenna that transmits and receives with an H-polarization |
| HY-2A | Hai Yang 2A Satellite |
| IDL | Interactive Data Language |
| JPEG | Joint Photographic Experts Group |
| JSON | JavaScript Object Notation |
| NASA | National Aeronautics and Space Administration |
| NetCDF | Network Common Data Format |
| NSOAS | National Satellite Ocean Application Service |
| RADI | Institute of Remote Sensing and Digital Earth, Chinese Academy of Sciences |
| REST | Representational State Transfer |
| SOA | State Oceanic Administration |
| TIFF | Tagged Image File Format |
| USGS | United States Geological Survey |
| UCAR | University Corporation for Atmospheric Research |
| VV | Antenna that transmits and receives with a V-polarization |
| XML | eXtensible Markup Language |
References
- Martin, S. An introduction to Ocean Remote Sensing, 2nd ed.; Cambridge University Press: Cambridge, UK, 2014; pp. 4–363. [Google Scholar]
- Hu, C.; Weisberg, R.H.; Liu, Y.; Zheng, L.; Daly, K.L.; English, D.C.; Zhao, J.; Vargo, G.A. Did the northeastern Gulf of Mexico become greener after the Deepwater Horizon oil spill? Geophys. Res. Lett. 2011, 38, L09601. [Google Scholar] [CrossRef]
- Blondeau-Patissier, D.; Gower, J.F.R.; Dekker, A.G.; Phinn, S.R.; Brando, V.E. A review of ocean color remote sensing methods and statistical techniques for the detection, mapping and analysis of phytoplankton blooms in coastal and open oceans. Prog. Oceanogr. 2014, 123, 123–144. [Google Scholar] [CrossRef] [Green Version]
- Gentemann, C.L.; Donlon, C.J.; Stuart-Menteth, A.; Wentz, F.J. Diurnal signals in satellite sea surface temperature measurements. Geophys. Res. Lett. 2003, 30, 1140. [Google Scholar] [CrossRef]
- Liu, Y.; Weisberg, R.H.; He, R. Sea surface temperature patterns on the West Florida Shelf using Growing Hierarchical self-organizing maps. J. Atmos. Ocean. Technol. 2006, 23, 325–338. [Google Scholar] [CrossRef]
- Fu, L.-L.; Chelton, D.B. Temporal variability of the Antarctic Circumpolar Current observed from satellite altimetry. Science 1984, 226, 343–346. [Google Scholar] [CrossRef] [PubMed]
- Le Traon, P.Y.; Faugere, Y.; Hernandez, F.; Dorandeu, J.; Merttz, F.; Ablain, M. Can we merge GEOSAT-follow-on with TOPEX/Poseidon and ERS-2 for an improved description of the ocean circulation? J. Atmos. Ocean. Technol. 2003, 20, 889–895. [Google Scholar] [CrossRef]
- Jiang, X.W.; Lin, M.S.; Zou, Y.R. The development and applications of Chinese oceanographic satellites. Satell. Appl. 2016, 6, 17–23. (In Chinese) [Google Scholar]
- Jiang, X.W.; Lin, M.S.; Song, Q.T. Active and passive microwave remote sensing technology of the HY-2A ocean satellite mission. Eng. Sci. 2013, 15, 4–11. [Google Scholar]
- Lin, M.S. The user requirements analysis of HY-2A satellite. Satell. Appl. 2003, 11, 7–13. (In Chinese) [Google Scholar]
- Liu, Y.; Weisberg, R.H.; Vignudelli, S.; Mitchum, G.T. Evaluation of altimetry-derived surface current products using Lagrangian drifter trajectories in the eastern Gulf of Mexico. J. Geophys. Res. Oceans 2014, 119, 2827–2842. [Google Scholar] [CrossRef]
- Wu, G.P.; Liu, Y.B. Satellite retrieval of important ocean hydrological parameters: An overview. Adv. Water Sci. 2016, 27, 139–151. [Google Scholar]
- Xing, J.; Shi, J.; Lei, Y.; Huang, X.-Y.; Liu, Z. Evaluation of HY-2A Scatterometer Wind Vectors Using Data from Buoys, ERA-Interim and ASCAT during 2012–2014. Remote Sens. 2016, 8, 390. [Google Scholar] [CrossRef]
- Bao, L.F.; Gao, P.; Peng, H.L.; Jia, Y.J.; Shum, C.K.; Lin, M.S.; Guo, Q. First accuracy assessment of the HY-2A altimeter sea surface height observations: Cross-calibration results. Adv. Space Res. 2015, 55, 90–105. [Google Scholar] [CrossRef]
- Jiang, X.W.; Liu, M.S.; Zhang, Y.G. An overviewof HY-2 satellite ground appliation syste. Eng. Sci. 2014, 16, 4–12. [Google Scholar]
- Lan, Y.G.; Lin, M.S.; Xie, C.H. Design scheme and implementation for HY-2 ground segment mission control. Eng. Sci. 2014, 16, 13–20. [Google Scholar]
- Ji, X.P. Design and Implementation of HY-2 Product Distribution System. Master’s Thesis, Beijing Jiaotong University, Beijing, China, 2013. [Google Scholar]
- Multi-Satellites Data Service Platform from Institute of Remote Sensing and Digital Earth, Chinese Academy of Sciences. Available online: http://ids.ceode.ac.cn/EN/ (accessed on 6 October 2016).
- Dai, Q.; Liu, J.B.; Liu, S.B. Key techniques of massive remote sensing data sharing. Comput. Eng. 2008, 34, 283–285. [Google Scholar]
- China Centre for Resources Satellite Data and Application. Land Observation Satellites Data Service Platform. Available online: http://218.247.138.121/DSSPlatform/index.html#/ (accessed on 6 October 2016).
- Remote Sensing Technology Center of Japan. Data Service Platform. Available online: http://www.restec.or.jp/english/satellite/index.html (accessed on 6 October 2016).
- Geo-Informatics and Space Technology Development Agency of Thailand. GISTDA Data Service System. Available online: http://www.gistda.or.th/main/en/node/568 (accessed on 6 October 2016).
- European Space Agency. Earth Online platform. Available online: https://earth.esa.int/web/guest/home (accessed on 6 October 2016).
- Wulder, M.A.; Masek, J.G.; Cohen, W.B.; Loveland, T.R.; Woodcock, C.E. Opening the Archive: How Free Data Has Enabled the Science and Monitoring Promise of Landsat, Landsat Legacy Special Issue. Remote Sens. Environ. 2012, 122, 2–10. [Google Scholar] [CrossRef]
- The USGS Global Visualization Viewer. Available online: http://glovis.usgs.gov/ (accessed on 6 October 2016).
- The USGS Earth Explorer System. Available online: http://earthexplorer.usgs.gov/ (accessed on 6 October 2016).
- Liu, S.B.; Liu, W.; Peng, H.L. The Design and Implementation of the HY-1B Product Archive System. In Proceedings of the SPIE, Sixth International Symposium on Digital Earth: Models, Algorithms, and Virtual Reality, Beijing, China, 2010; Volume7840, p. 78400Y.
- Li, J.G.; Liu, S.B.; Liu, W. The Design and Implementation of the IDS Catalogue Data Archive System. In Instrumentation, Measurement, Circuits and Systems; Springer: Berlin/Heidelberg, Germany, 2012; Volume 127, pp. 837–844. [Google Scholar]
- Tsou, M. Integrating Web-based GIS and image processing tools for environmental monitoring and natural resource management. J. Geogr. Syst. 2004, 6, 155–174. [Google Scholar] [CrossRef]
- Goor, E.; Dries, J.; Daems, D.; Paepen, M.; Niro, F.; Goryl, P.; Mougnaud, P.; Della Vecchia, A. PROBA-V Mission Exploitation Platform. Remote Sens. 2016, 8, 564. [Google Scholar] [CrossRef]
- Liu, J.B.; Yang, J.; Chen, F.; Dai, Q.; Zhang, J. Location-based instant satellite image service: Concept and system design. Int. J. Digit. Earth 2014, 8, 91–101. [Google Scholar] [CrossRef]
- The Giovanni. Available online: http://giovanni.gsfc.nasa.gov/giovanni/ (accessed on 6 October 2016).
- The Sentinels Scientific Data Hub. Available online: https://scihub.copernicus.eu/ (accessed on 6 October 2016).
- The AVISO. Available online: http://www.aviso.altimetry.fr/en/data/data-access.html (accessed on 6 October 2016).
- The Copernicus Marine Serivce Platform. Available online: http://marine.copernicus.eu/ (accessed on 6 October 2016).
- Hierarchical Data Format (HDF) Group. Available online: https://www.hdfgroup.org/ (accessed on 6 October 2016).
- Network Common Data Form. Available online: http://www.unidata.ucar.edu/software/netcdf/ (accessed on 6 October 2016).
- HDF Viewer. Available online: https://support.hdfgroup.org/products/java/hdfview/ (accessed on 6 October 2016).
- Quartz Job Scheduling Library. Available online: http://www.quartz-scheduler.org/ (accessed on 6 October 2016).


| Frequency (GHz) | Swath Width (km) | Accuracy of Sea Surface Height at the Nadir Point (cm) | Range of the Significant Wave Height (m) |
|---|---|---|---|
| 13.58/5.25 | ≤2 | ≤8 | 0.5–20 |
| Frequency (GHz) | Polarization | Ground Resolution (km) | Swath Width (km) | Accuracy of Wind Speed (m/s) | Range of Wind Speed (m/s) | Accuracy of Wind Direction (°) |
|---|---|---|---|---|---|---|
| 13.256 | HH and VV | better than 50 | H polarization 1350, V polarization 1700 | 2 | 2–24 | 20 |
| Frequency (GHz) | Polarization | Swath Width (km) | Ground Resolution (km) | Noise-Equivalent Sensitivity (K) | Dynamic Range (K) | Calibration Precision (K) |
|---|---|---|---|---|---|---|
| 6.6 | VH | 1600 | 100 | Better than 0.5 | 3–350 | 1.0 (180–350 K) |
| 10.7 | VH | 70 | ||||
| 18.7 | VH | 40 | ||||
| 23.8 | V | 35 | ||||
| 37 | VH | 25 | Better than 0.8 |
| Frequencies (GHz) | Polarization | Noise-Equivalent Sensitivity (K) | Dynamic Range (K) | Calibration Precision (K) |
|---|---|---|---|---|
| 18.7 | linear polarization | 0.4 | 3–300 | 1.0 (180–320 K) |
| 23.8 | 0.4 | |||
| 37 | 0.4 |
© 2016 by the authors; licensee MDPI, Basel, Switzerland. This article is an open access article distributed under the terms and conditions of the Creative Commons Attribution (CC-BY) license (http://creativecommons.org/licenses/by/4.0/).
Share and Cite
Liu, W.; Liu, S.; Huang, L.; Duan, J.; Zhang, J.; Li, X.; Liu, J. The Customized Automatic Processing Framework for HY-2A Satellite Marine Advanced Products. Remote Sens. 2016, 8, 1009. https://doi.org/10.3390/rs8121009
Liu W, Liu S, Huang L, Duan J, Zhang J, Li X, Liu J. The Customized Automatic Processing Framework for HY-2A Satellite Marine Advanced Products. Remote Sensing. 2016; 8(12):1009. https://doi.org/10.3390/rs8121009
Chicago/Turabian StyleLiu, Wei, Shibin Liu, Lei Huang, Jianbo Duan, Jing Zhang, Xinpeng Li, and Jianbo Liu. 2016. "The Customized Automatic Processing Framework for HY-2A Satellite Marine Advanced Products" Remote Sensing 8, no. 12: 1009. https://doi.org/10.3390/rs8121009