1. Introduction
The period 2015–2016 has been determined as an El Niño year [
1]. A severe “drought” and an associated unprecedented outbreak of fires have been observed in the north of the Republic of Congo from January to April 2016. First observations report [
2] that the fires took place in specific open forest formations, the Marantaceae forests.
While the forests of the Congo Basin are second only to the Amazon Basin in extent, unlike the latter, these forests have, in general, been spared important deforestation due to large scale exploitation driven by commercial food production and farming [
3,
4,
5]. However, selective logging activities, where specific species of trees are extracted from the forest, are widespread in most of the basin [
6]. Of concern, to both the national forest service and to the local management, is the occurrence of fires in active logging concessions, threatening current commercial extraction of round-wood, future regeneration of stock and biodiversity.
Fire is a very common event on the African continent, however, the Congo Basin rain forests are usually too humid to burn [
7]. In southeast Asia and in the Amazon Basin, tropical rainforests fires are observed more frequently, as a consequence of current land-use practices [
8]. Under normal conditions, fire remains rare in tropical rainforests and, consequently, most plants and animals are poorly adapted [
9]. Pan-tropical forest fires are often more severe during El Niño events [
8]. In 1997–1998, fires associated with an exceptional drought caused by El Niño devastated large areas of tropical rain forests in Indonesia [
10]. Wooster et al., 2012 [
11] observed a relationship between monthly rainfall deficit and fires in Borneo during El Niño events for the years 1980–2000. In Amazonia, Nepstad et al., 1999 [
12] highlight an increased vulnerability of the Brazilian Amazonian forests to fire during drought events caused by El Niño. In addition, the hypothesis of a positive feedback between recent logging activities and fire is made for Amazonian [
13] and Indonesian forests [
10]. In contrast, very little is known about increased vulnerability of Central African tropical forests to fire due to El Niño related droughts and/or logging activities.
In the last decades, remote sensing has been widely used to monitor active fires and burnt areas at the global scale. Sensors like Advanced Very High Resolution Radiometer (AVHRR), VEGETATION (VGT), Moderate Resolution Imaging Spectroradiometer (MODIS) and MEdium Resolution Imaging Spectrometer (MERIS) with spatial resolutions between 300 m and 1 km are generally used [
14,
15]. Their daily revisit cycle is useful to capture active fire signatures or burn scars, however, the relatively coarse spatial resolution causes underestimations in the case of small burnt area extent [
16]. Comparisons between different burnt area products generally show high variation in results [
16].
Coarse spatial resolution satellite data also present methodological challenges in terms of assigning the correct vegetation class to the burnt area, which is important either for estimating emissions or for evaluating the ecological impact of fires [
17]. For tropical rainforests specifically, more knowledge is needed about which vegetation formation is burning in order to understand why the fire is occurring at specific locations and times. Fusion between coarser and medium to high spatial resolution (5–30 m) satellite data have been used e.g. by Boschetti et al., [
18] to overcome the problem of reduced temporal resolution of higher resolution satellite such as Landsat, ASTER or RapidEye. In tropical evergreen forests, an important challenge is the persistent cloud cover, requiring frequent acquisitions of optical data. Synthetic Aperture Radar (SAR) sensors can be used to overcome this problem because of their ability to penetrate clouds and haze [
8,
19]. High spatial resolution SAR data have been used together with coarse optical data in a few studies [
19,
20]. However, the use of SAR data in an operational way has been limited by the availability of time series of SAR acquisitions and the pre-processing requirements [
21].
The new European Space Agency (ESA) Sentinel satellites (funded by the European Union and ESA member states) are expected to provide useful information for a wide range of land applications [
22]. The two first missions, Sentinel-1 (S1) and Sentinel-2 (S2) operational since October 2014 and December 2015, respectively, provide time series that can already be assessed for monitoring tropical forests. For the mapping of burnt areas, optical satellite data from the Multi Spectral Instrument (MSI) on S2 with a potential five-day temporal resolution (when the two satellites are operational) fits the requirement for a higher spatial resolution burnt area product. Images from the radar C-SAR sensor on S1 can overcome cloud cover limitations in tropical evergreen forests. The complementarity of the two sensors can be used for the design of a joint passive and active burnt area mapping products at regular intervals for this region.
The objective of this study is to review the recent occurrence of forest fires in the north of the Republic of Congo and to evaluate the potential of a joint use of S1 and S2 satellites to detect and monitor burnt areas in tropical evergreen forests.
The exceptional character of the fire event for this region and the rainfall anomaly will be illustrated by reviewing climatic data and historical fire record. The vegetation types in the study area will be investigated to assess which type of forest has been burnt. Active fires detected by the MODIS sensor on board the Aqua and Terra satellites are used as a first evidence of the location and timing of this event. S1 and S2 time series are used to map the location, extent and speed at which these fires have progressed. The burnt area maps produced are used to validate the hypothesis that the fires happened almost exclusively in Marantaceae forests. The proximity of the burnt areas to logging roads is also evaluated.
2. Materials and Methods
2.1. Study Area
The study area is situated in the north of the Republic of Congo in the Sangha department. The climate across the study area is tropical humid characterized by an annual precipitation of 1600–2000 mm per year, with two dry seasons, one in June to August and a stronger one from December through to February [
23,
24,
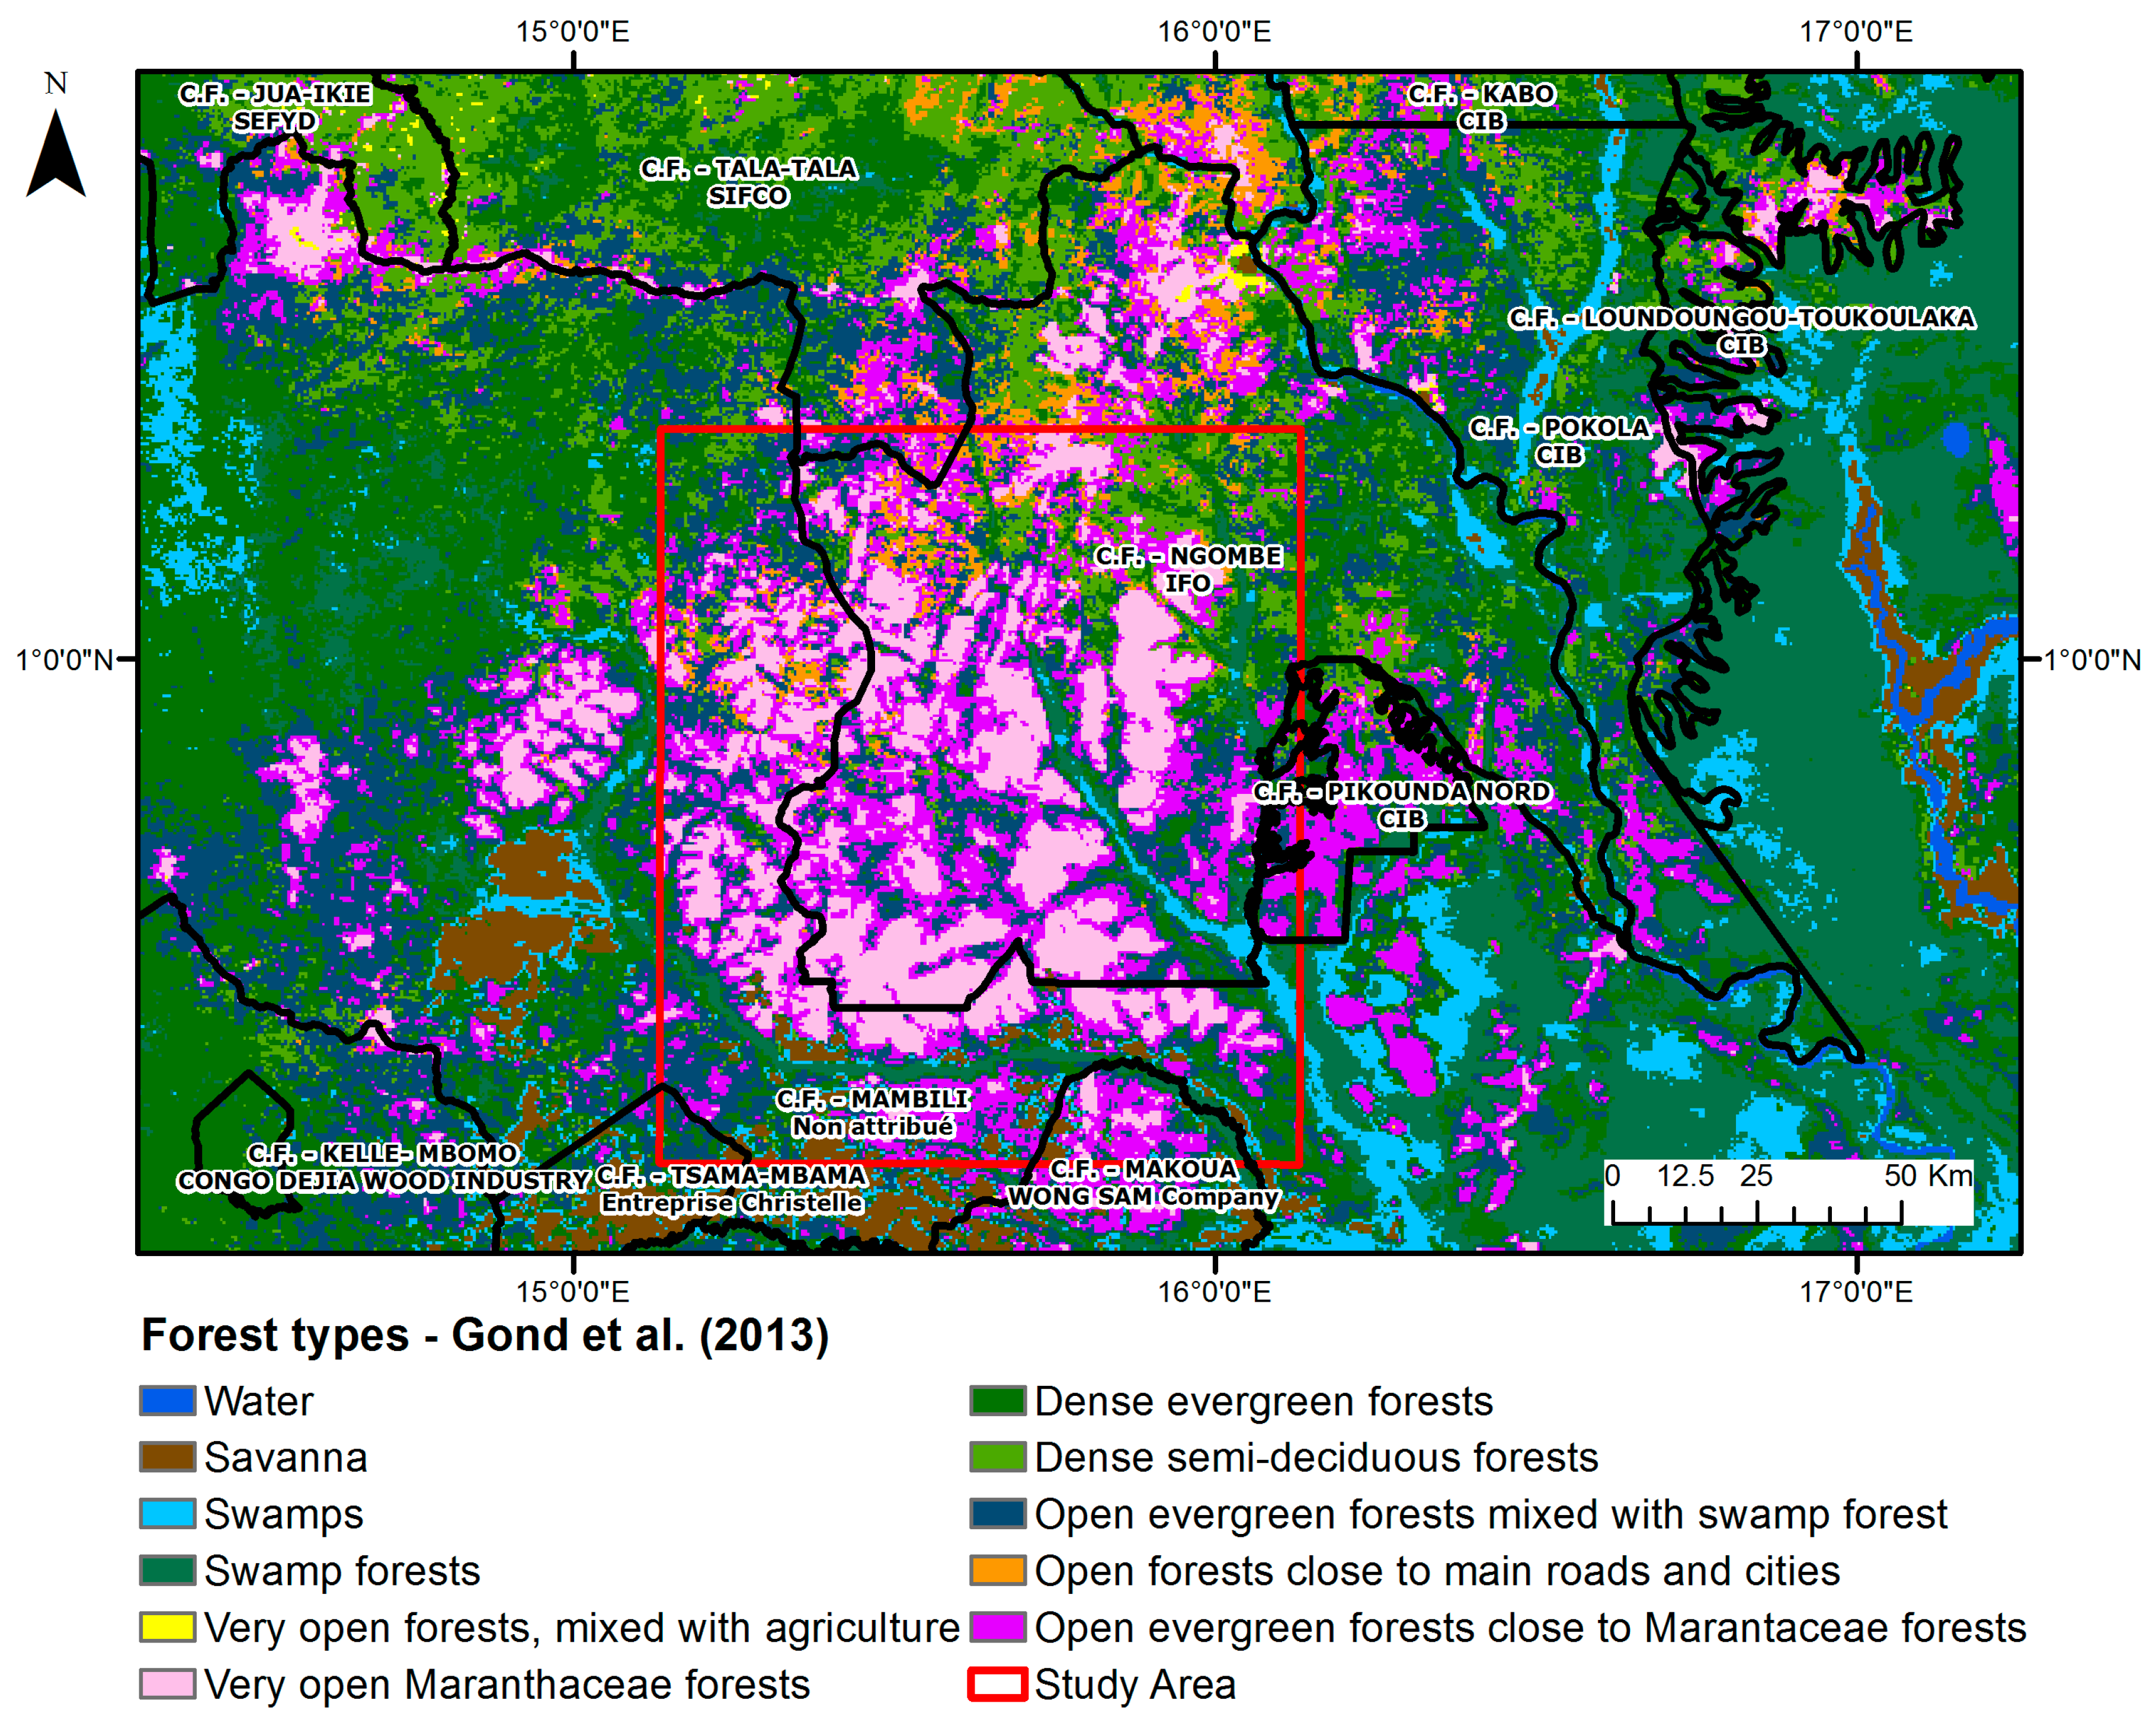
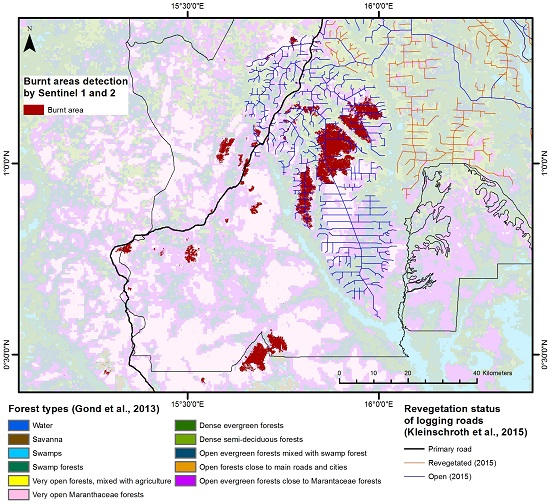
25]. The area is dominated by forests, which cover over 95% of the region. The different forest classes occurring in the study area are detailed by Gond et al., [
26] (illustrated in
Figure 1). This map classifies humid forests into sub-classes according to their structure and phenology. Sub-classes such as swamp forests are found along the river network, while open to very open Marantaceae forests cover the majority of the study area. At the southern edge of the study area, savanna formations start to dominate. Fires in the region are relatively infrequent due to the high percentage of humid forest cover, and occur almost exclusively in the savanna regions in the south, the aquatic grasslands in the east and in and around villages where fields are being cleared.
The main commercial activity in the area is the extraction of round wood from concessions which are leased from the national authorities by private companies. These concessions cover an extensive part of forest in the north of the country, with wood quotas being extracted according to a management plan set out by concession managers in conjunction with the national authorities. Three UFA (unité forestière d’aménagement) encompass the Marantaceae forests as illustrated in
Figure 1: Pokola and Ngombé in the Sangha department and Loundoungou Toukalaka in the Likouala department. The Ngombé concession contains the largest proportion of the Marantaceae forests and the subsequent fires in 2016. The analyses presented in this study are focused on this area (the red box in
Figure 1).
The population density is very low (less than 1 inhabitant per km
2 [
28,
29]). Indigenous populations occupy specific areas allocated in the logging concessions.
The network of logging roads in the study area [
30,
31] is used as a proxy of human accessibility to the forest and related risk of human induced fire outbreak. In concessions managed for timber production, secondary roads are usually closed after exploitation and a rapid regrowth of vegetation is observed after abandonment. Kleinschroth et al., [
30] observed a median persistence of four years for open roads before reverting to a vegetated state and 20 years before complete disappearance (no longer distinguishable from the surrounding forest).
2.2. Climatic Data
Information on rainfall is available from the Climate Hazards Group InfraRed Precipitation with Station data (CHIRPS) product [
32]. Starting in 1981, CHIRPS is a 30-year quasi-global rainfall dataset. Spanning 50°S to 50°N (and all longitudes) CHIRPS incorporates 0.05° resolution satellite imagery with in-situ station data to create gridded monthly time series for seasonal drought monitoring and water resource management [
33]. The monthly mean average of the CHIRPS dataset for 1981–2015 highlights the two dry seasons; a short dry period in July and a longer dry season in December–February characteristic of the north of the Republic of Congo.
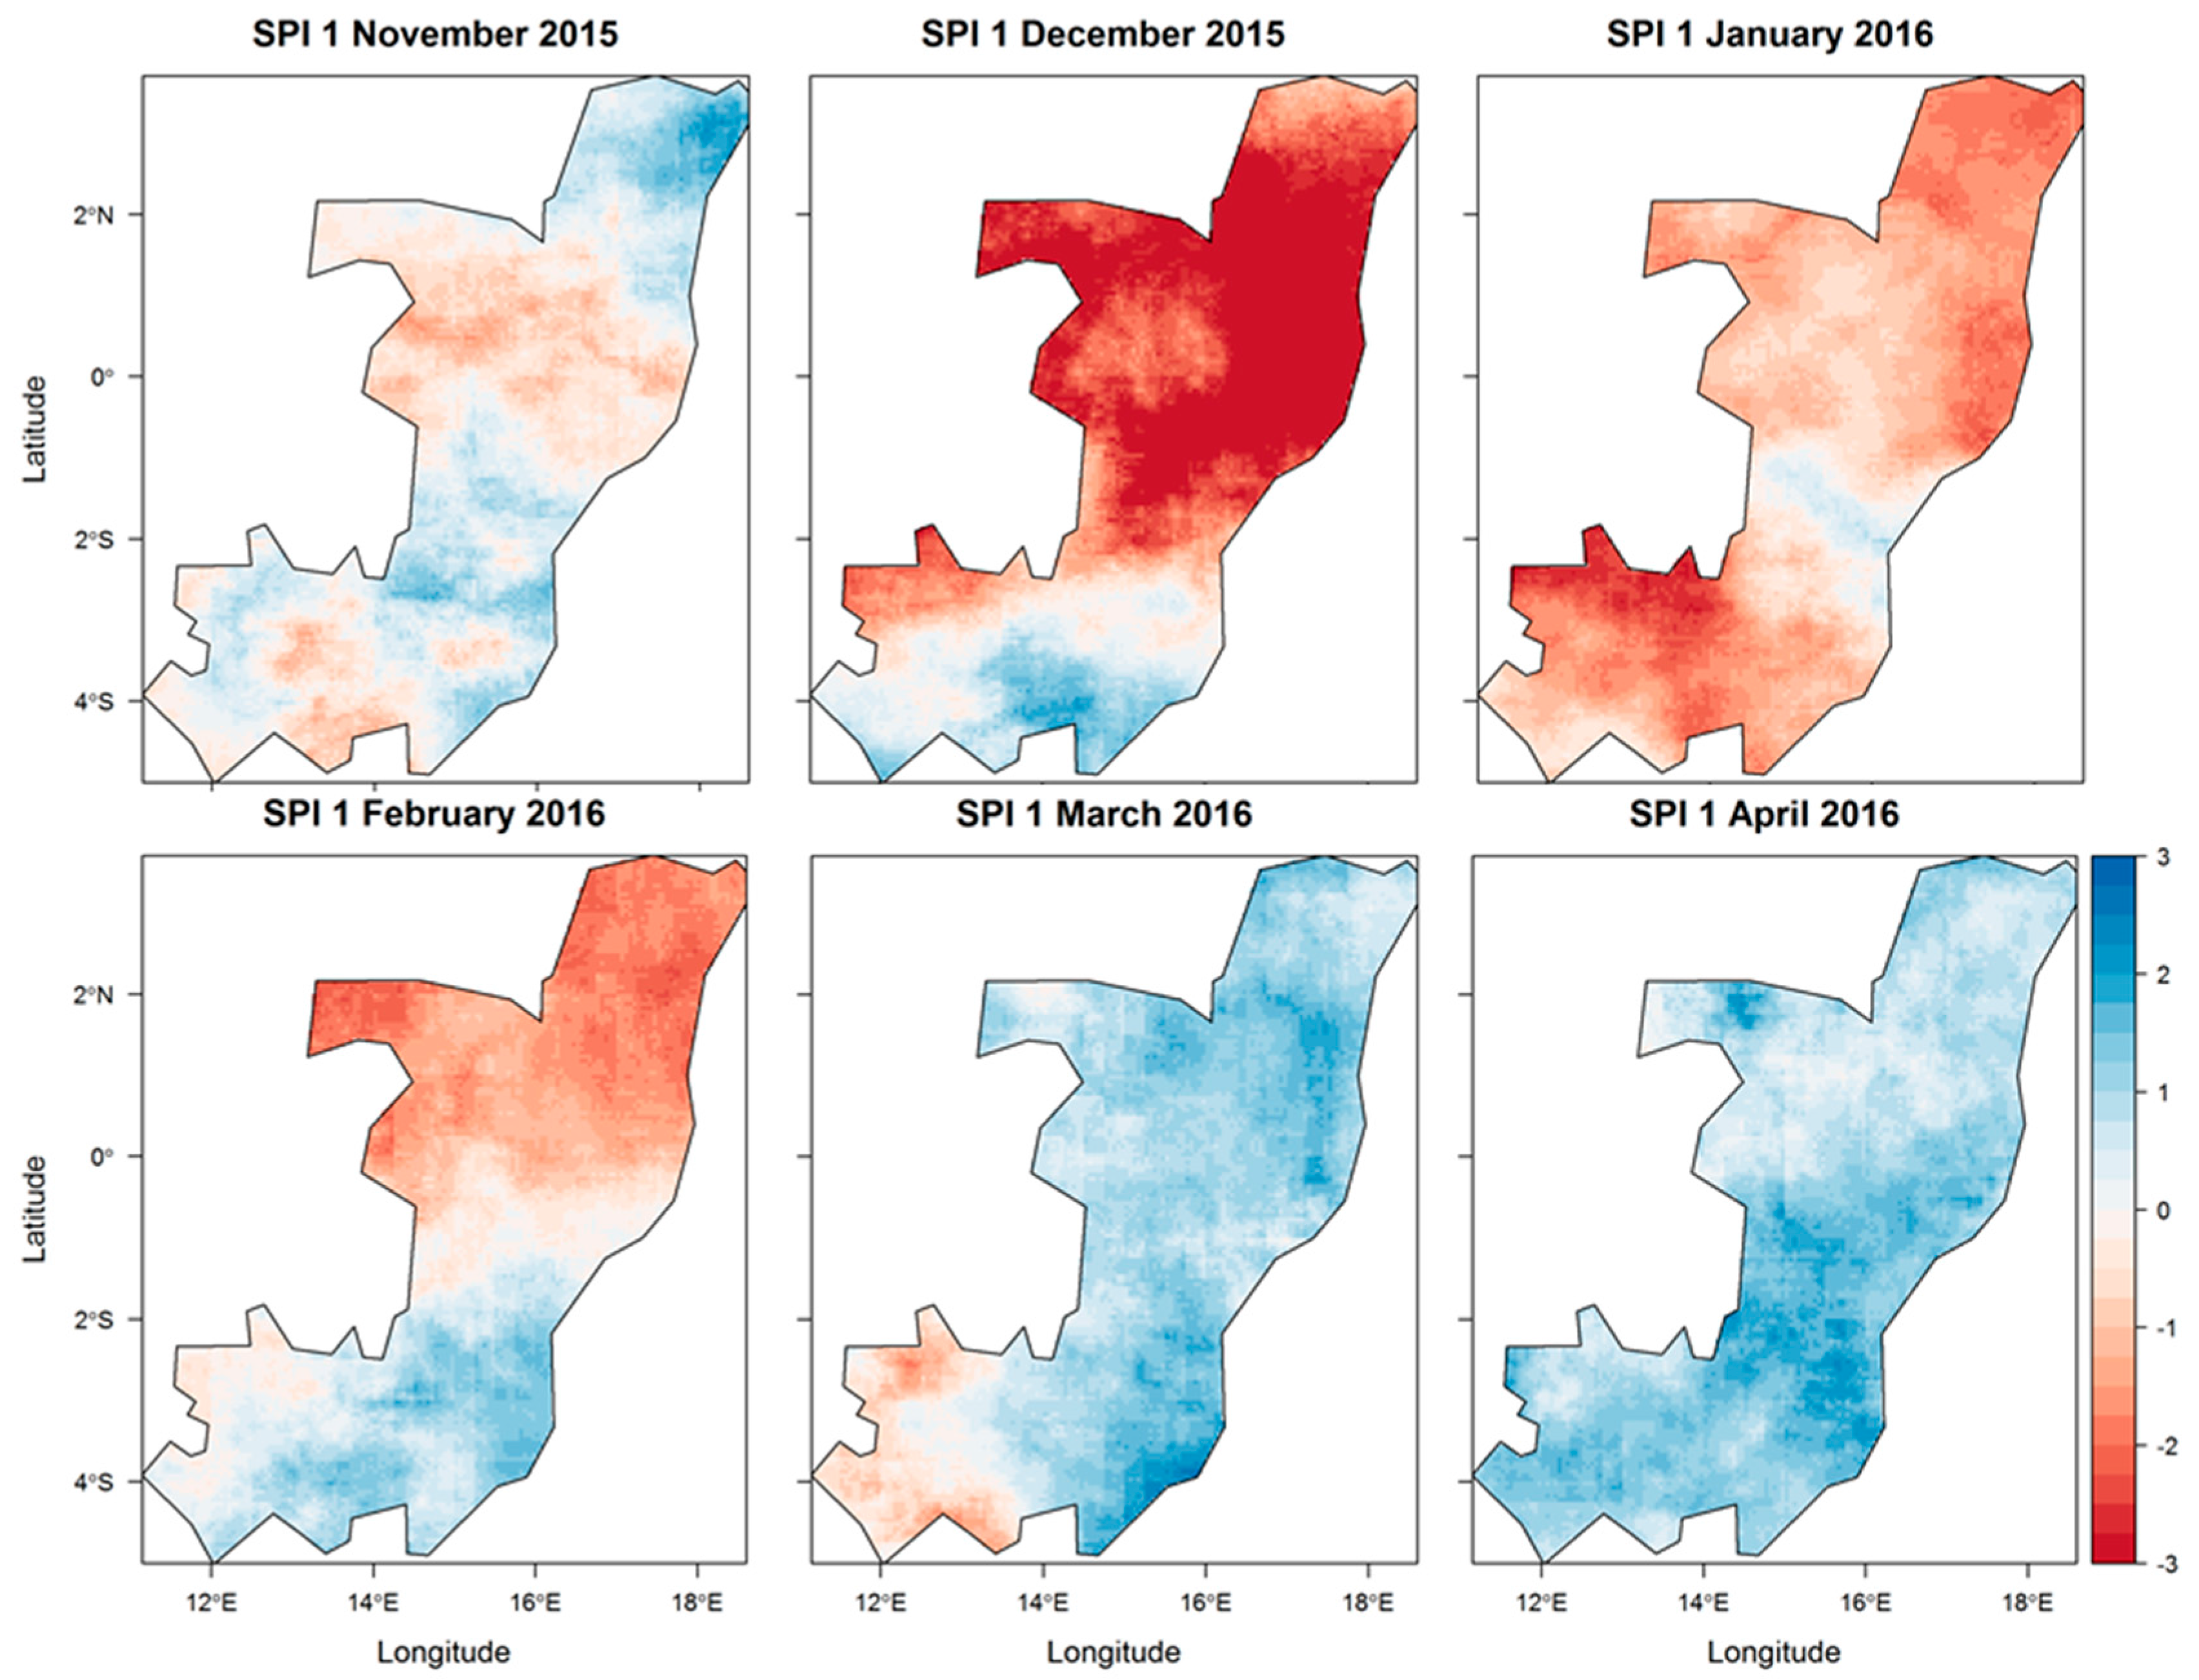
To highlight rainfall anomalies from these data, the Standardized Precipitation Index (SPI) is used. The SPI is the standard index for quantifying and reporting meteorological drought. SPI quantifies precipitation as a standardized departure from a selected probability distribution function that models the precipitation records [
34]. Precipitation records are fitted to a gamma distribution, and then transformed to a normal distribution. The SPI values represent the number of standard deviations that the observed value would deviate from the long-term mean for a normally distributed variable. The SPI can be retrieved for different periods, generally ranging from 1 to 36 months, using monthly input data. For this study, the SPI is calculated at monthly time scales. On short timescales, the SPI is closely related to soil moisture.
The strength of the 2015–2016 El Niño climatic event is characterized by the value of the Oceanic Niño Index (ONI). The ONI represents the three-month moving average of the Sea Surface Temperature (SST) anomalies in the Niño 3.4 regions (5°N–5°S, 120°–170°W). For the 2015–2016 period, the ONI indicates an El Niño event from February 2015 to June 2016 with maximum anomaly of 2.3°C which is considered as a very strong event. In the last decade, two weak El Niño events have been observed in 2004–2005 and 2006–2007 and two moderate events in 2002–2003 and 2009–2010. The last time an El Niño event was classified as very strong was during the 1997–1998 period [
1].
2.3. Marantaceae Forests
The Marantaceae forests, central to the study, are conspicuous by an unusual physiognomy with a giant herbaceous continuous stratum in association with a scattered tree component. This vegetation, arranged as a heterogeneous patchwork within the lowland semi-deciduous forests, is widely distributed in northern Republic of Congo [
35]. The Marantaceae are part of the arrowroot family, flowering plants known for their large starchy rhizomes. The preferential propagation mode of these herbs is vegetative, through the scattering of underground stems or rhizomes [
35,
36].
The presence of Marantaceae forests is not easily explained; it is not linked to the availability of soil water content and there are no signs of recent changes in their distribution. One hypothesis is that anthropogenic perturbations in earlier times (1550 Before Present (BP)) such as cutting or burning of the understory is at the origin of the colonization of the forest by the Marantaceae. The herbaceous layer would then dominate and inhibit woody regeneration [
35]. Maley et al., [
37] make the hypothesis that a fragmentation of forest formations caused by a climatic drought 2500 years ago also favored the development of these open forest formations.
Marantaceae forests are often assigned low conservation and research priorities; however, they not only have great importance to several large mammal species (gorillas, and forest elephants) [
38] by providing a dependable year-round supply of vegetative food, but also store large quantities of carbon per unit area [
39].
2.4. Active Fire Data
Active fire data over the area from the Moderate Resolution Imaging Spectroradiometer (MODIS) were acquired from the Fire Information for Resource Management System (FIRMS) MODIS Fire Archive Download webpage [
40]. The data are from the Collection 5 Near Real Time (NRT), extracted from the standard MCD14ML fire product produced at the MODIS Fire Science Computing Facility (SCF).
The MODIS data are available from 2000 to date, comprising of 1 km detections from the combined 4 overpasses of the sensors on the Aqua and Terra satellites. The fires that are actively burning at the time of the satellite overpass are detected using thresholds in the middle and thermal infra-red channels [
41]. A quality control channel accompanies the data. Although such data have a number of sampling issues, the comparison of the current number of fire counts in a given region with the long term (i.e., 2000–2015) average can be useful to highlight possible anomalies.
2.5. Burnt Areas Detection
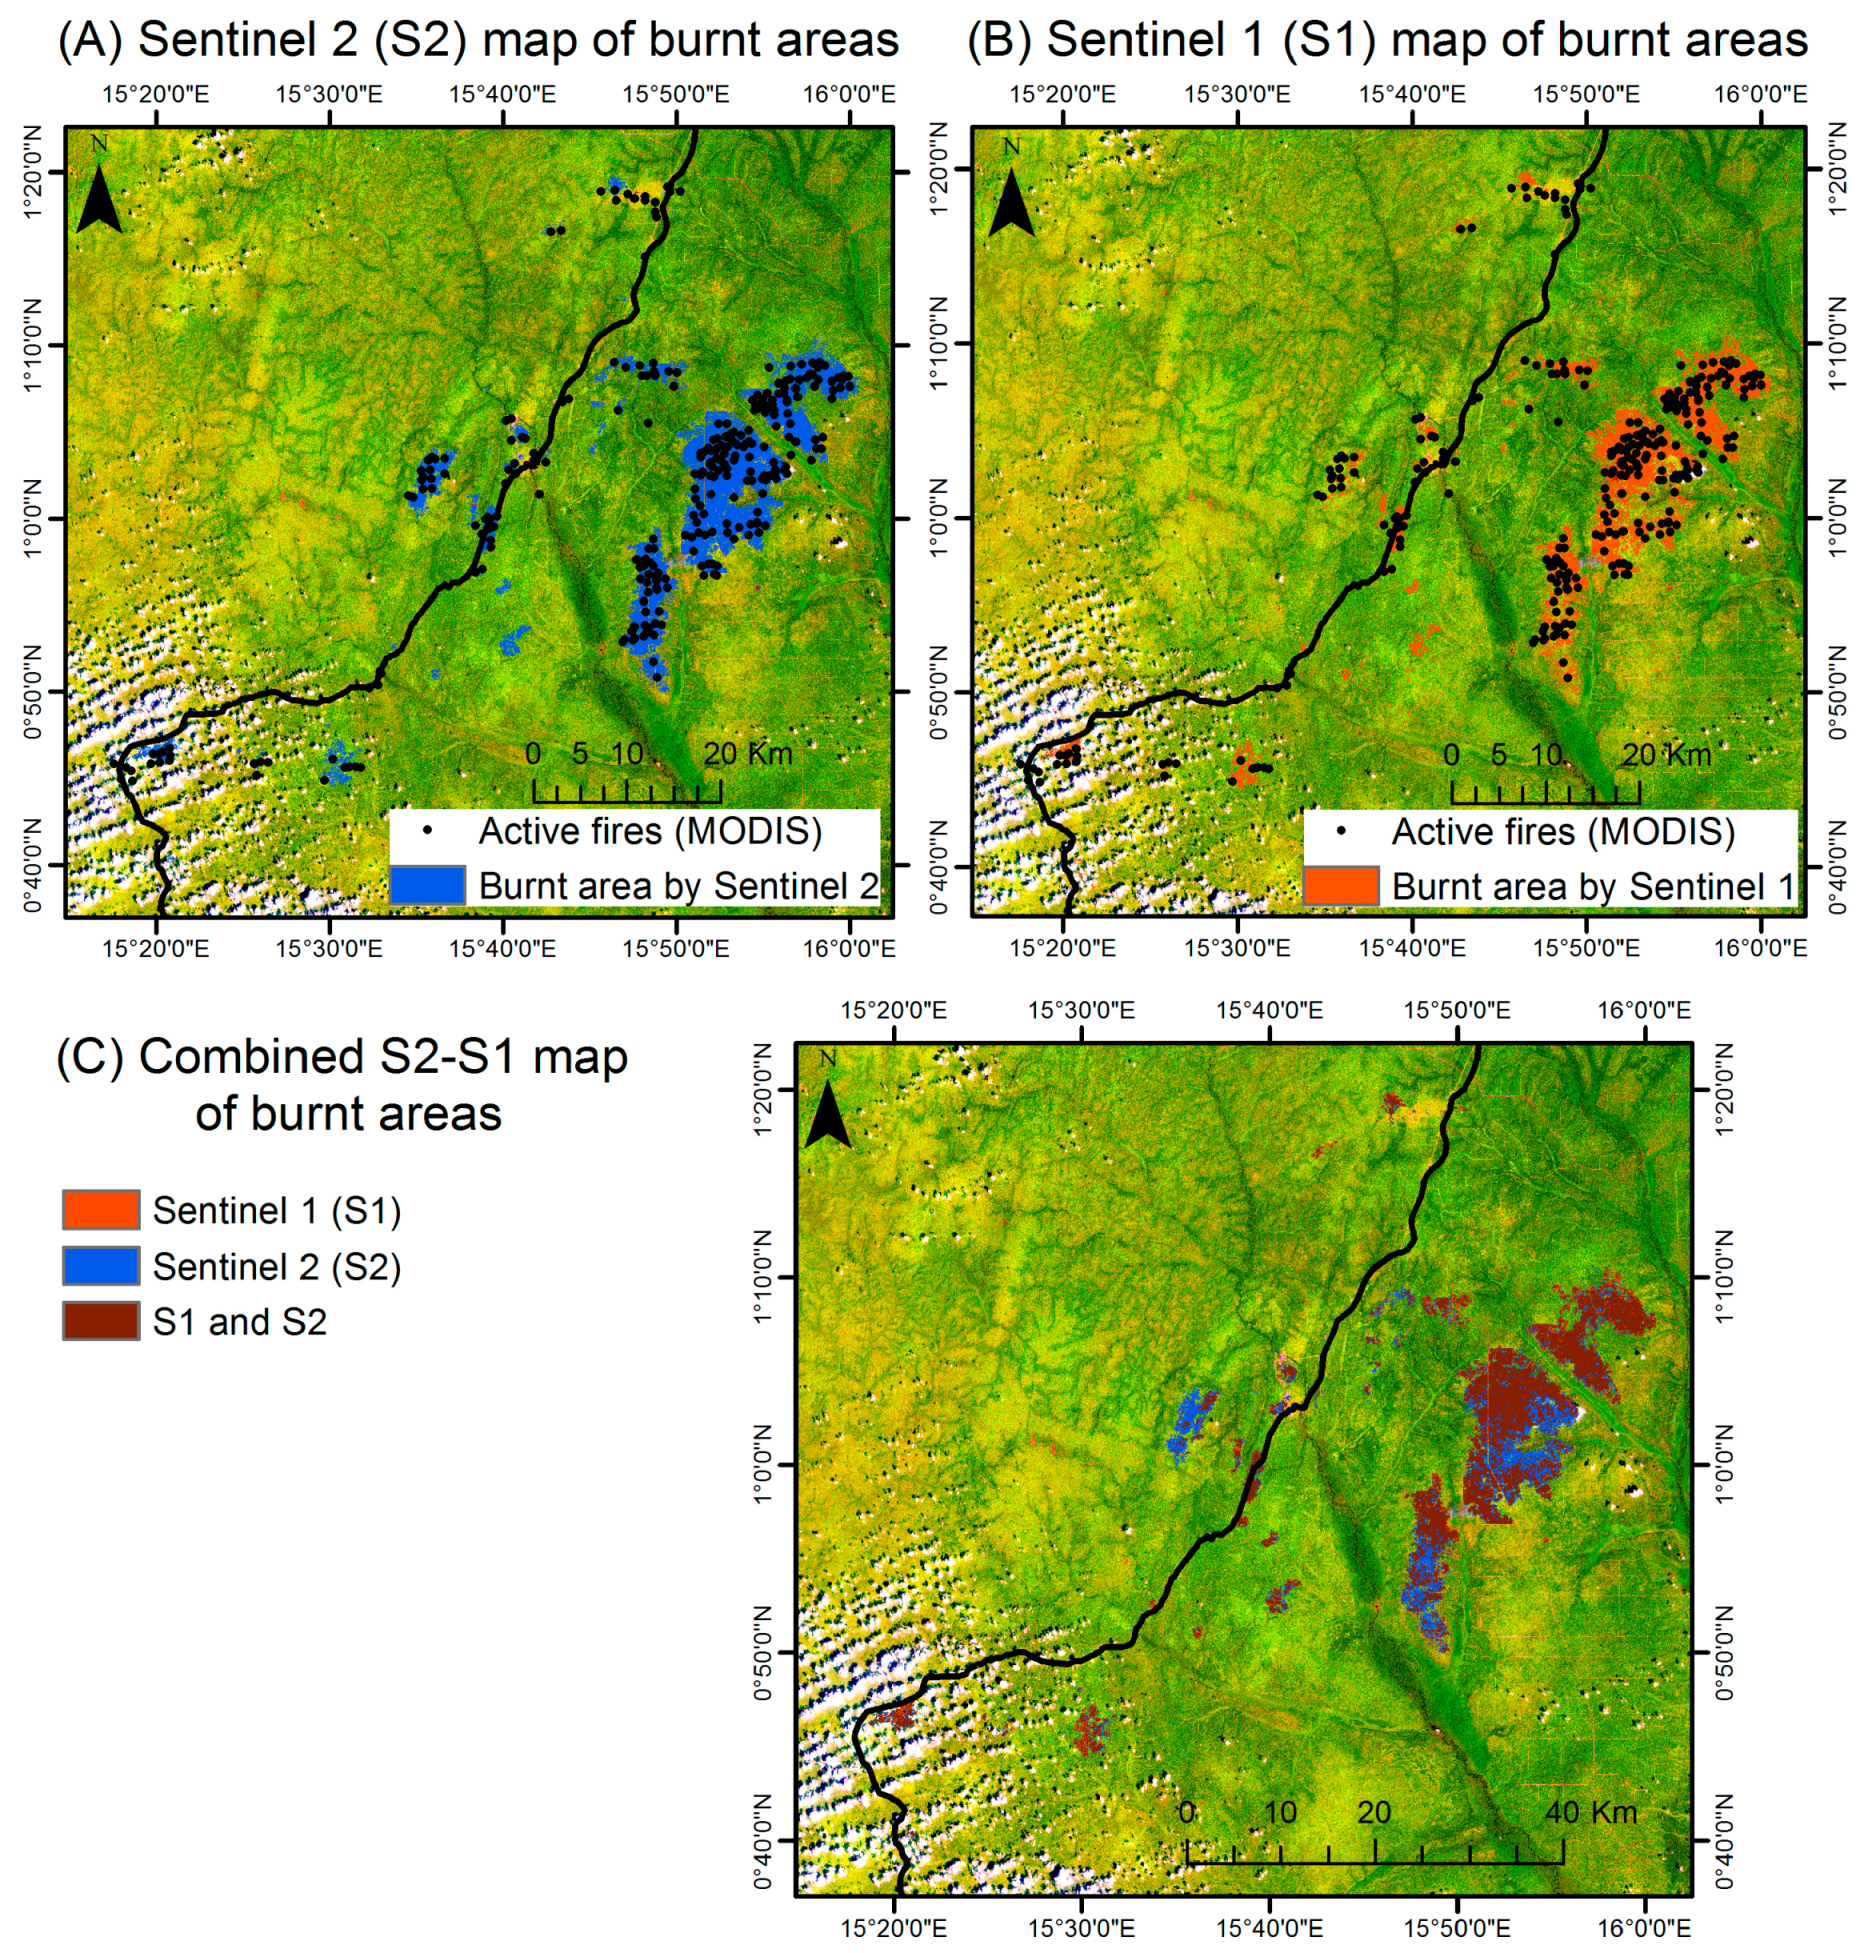
Burnt area mapping is carried out using S1 and S2 datasets independently and all pixels detected as burnt will be combined into a map composite. Independent burnt area maps will be generated from the images acquired respectively by the sensors on S1 and S2 during the period of the 1 November 2015 to the 30 April 2016 for S1 and the 3 December 2015 to the 21 May 2016 for S2. The maps will then be combined at a 20-m resolution. Three different scenarios are foreseen when generating the map composite: (i) a pixel is detected as burnt in either S1 or S2 maps; (ii) both S1 and S2 detected a pixel as burnt; and (iii) neither S1 nor S2 detect a pixel as burnt. The different results are presented and discussed but the final goal is to combine S2-based and S1-based maps to take advantage of the sensors complementarity.
The S1 and S2 images are processed using the Google Earth Engine cloud environmental analysis platform.
A field visit to one of the sites was carried out in May 2016, noting the damage to trees and the regrowth of the burned herbaceous vegetation.
Sentinel 2
The S2-A satellite was successfully launched on the 23 June 2015, as part of the European Copernicus program (European Commission funding, ESA implementation) and the first images were delivered four days later [
42]. S2 satellites carry an innovative wide-swath, high-resolution Multi Spectral Instrument with 13 spectral bands spanning from the visible and the near infrared to the short wave infrared. The spatial resolution varies from 10 m to 60 m depending on the spectral band. The swath is 290 km. The temporal resolution of the S2-A satellite is 10 days. A revisit period of five-days at the equator will be ensured when the S2-B twin satellite becomes operational [
43].
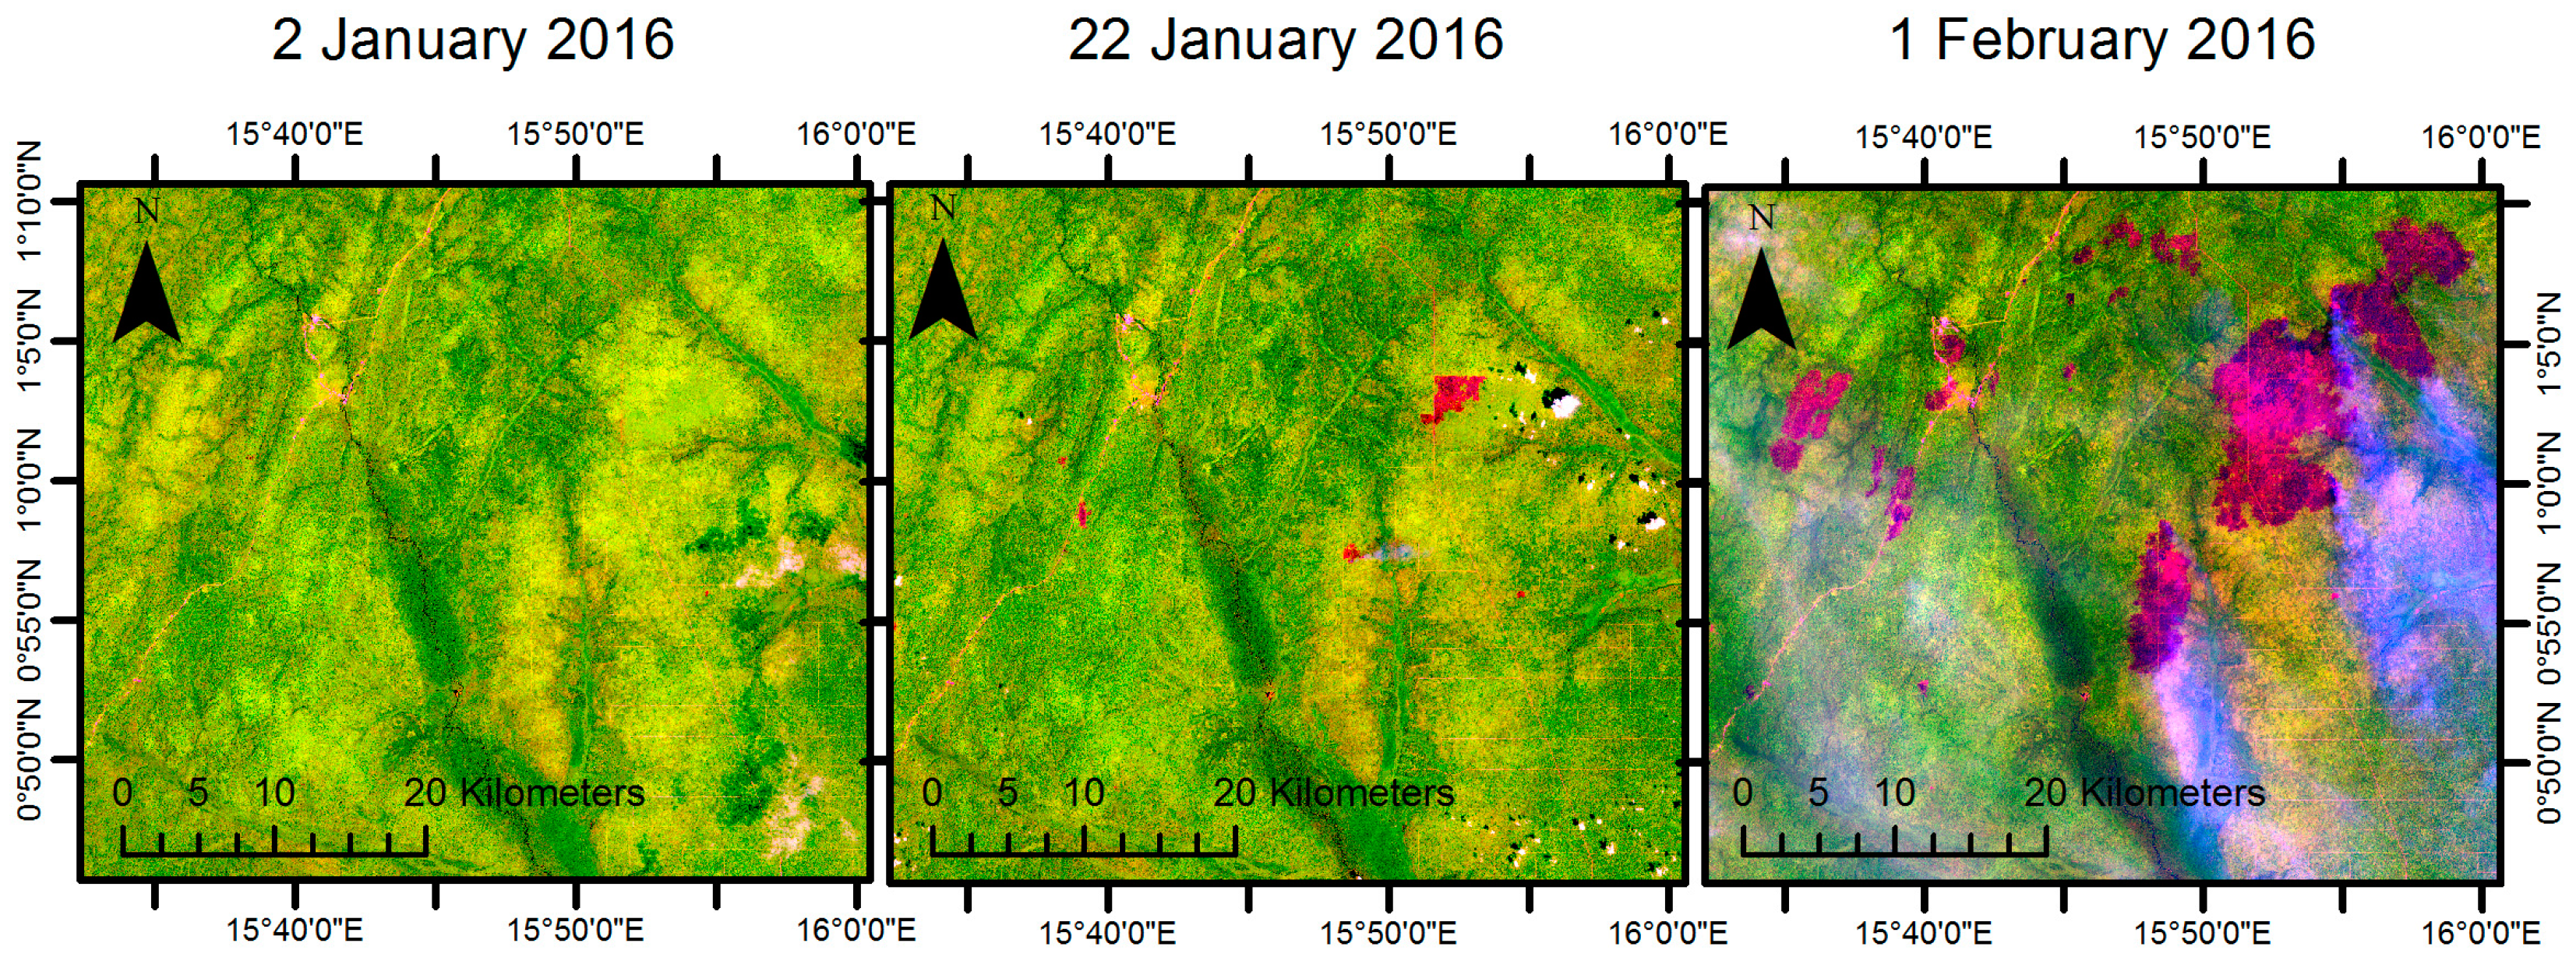
Over the study area, a time series of fifteen Level 1C (Top of Atmosphere reflectance) S2 images is available from the 3 December 2015 to the 21 May 2016. These show the progression of the fires in the area (
Figure 2). A gap in the 10-day temporal acquisition occurred during two weeks (from the 21 February to 2 March 2016) due to an anomaly in the ground segment production chain. This anomaly affects the radiometric quality of the S2 L1C products.
The Level 1C S2 images are contaminated with cloud and aerosols which need to be masked out before further processing. No robust cloud masking for S2 was available at the time of processing. Together with the Level 1C product, ESA provides a quality band (QA60) masking cloud and cirrus. However, a visual check revealed that this quality band does not give sufficiently reliable results for the study area. A cloud mask therefore is based on band 1 (sensitive to aerosols), the blue band 2 (sensitive to atmospheric contaminations), the near infrared band 8A and the short-wave infrared band 11. Thresholds are defined on the combination of these bands to eliminate clouds and cloud shadows from the S2 images.
The detection of burnt areas is based on the difference of two vegetation indices computed on the 10-days time series of S2 cloud-free images and a pre-fire baseline value. The first step of the burnt area detection is a baseline cloud free mosaic which is built taking the median value of the first four images (3 and 23 December 2015, 1 and 12 January 2016). In the second step, the acquisitions from the 12 January 2016 to the 21 May 2016 are compared to the baseline mosaic to determine the precise timing and location of the fire events.
Burnt areas are identified according to the difference in the value of two vegetation indices between each date and the base mosaic. Both the Normalized Difference Water Index (NDWI; also known as the Normalized Difference Moisture Index, NDMI) [
44,
45] and the Normalized Difference Vegetation Index (NDVI) [
46] are used to detect burnt areas on the S2 images. The NDWI is calculated according to the formula of Gao [
44] and adapted to S2, using the NIR band 8 (842 nm) and the SWIR band 11 (1610 nm). The use of the band 11 constrains the spatial resolution of the product to 20 meters. The NDVI is calculated using the NIR band 8 (842 nm) and the Red band 4 (665 nm). The recent passage of fire causes a drop in the two indices’ values (the respective thresholds for the difference value are set to 0.18 for NDWI and 0.19 for NDVI). Very few fires occurred before the 12 January 2016 and the few burnt areas present on the 1 January 2016 image have been delimitated on that image with a specific threshold for NDWI and NDVI values.
Sentinel 1
With a temporal resolution of 10 days, S2 images should allow a precise mapping of the timing and extent of fire event. However, the Congo Basin region has extensive cloud cover at various times of the year [
25] limiting the use of optical sensors. Observations from S1 can complement S2 optical acquisitions due to the high sensitivity to structural properties of vegetation and day and night observing capabilities of the radar sensor. S1 is a two satellite constellation with prime objectives of Land and Ocean monitoring. The satellites carry a C-SAR sensor, which offers medium and high resolution imaging in all weather conditions [
47]. The C-band SAR instrument supports operation in single polarization (HH or VV) and dual polarization (HH + HV or VV + VH). The first satellite, Sentinel-1A, currently has a revisit time of once every ~15 days over Congo. After its sister Sentinel-1B (launched in April 2016) comes into service, coverage will be further improved, allowing for more frequent updates.
Severe fires remove vegetation constituents such as trunks and branches which results in changes in the SAR intensity signal. Multi-temporal SAR images have been often used for burned area detection by computing the difference in backscatter before and after fire events [
19,
21,
48,
49,
50,
51,
52]. Kurum [
53] developed a method to detect fire affected areas using SAR series in C band (such as S1) with the co-polarized VV channel. Similarly, Main et al., [
54] used cross-polarized (i.e., VH) C-band to assess woody structure and changes in deciduous savannas.
The basic assumption of this study is that most of the C-band radar backscatter of intact forests comes from surface, volume and multiple volume-surface scattering. After a fire, the surface scattering becomes the major contributor to the return signal [
55,
56]. At this stage, the difference between radar backscatter before and after the fire can be used to delineate the fire-affected area from its surroundings. However, changes in the ground moisture can also contribute to the SAR backscatter signal [
57]. Hence limitations in the use of SAR are the soil moisture changes and the fact that the vegetation structure must be severely modified in order for a fire to be detected.
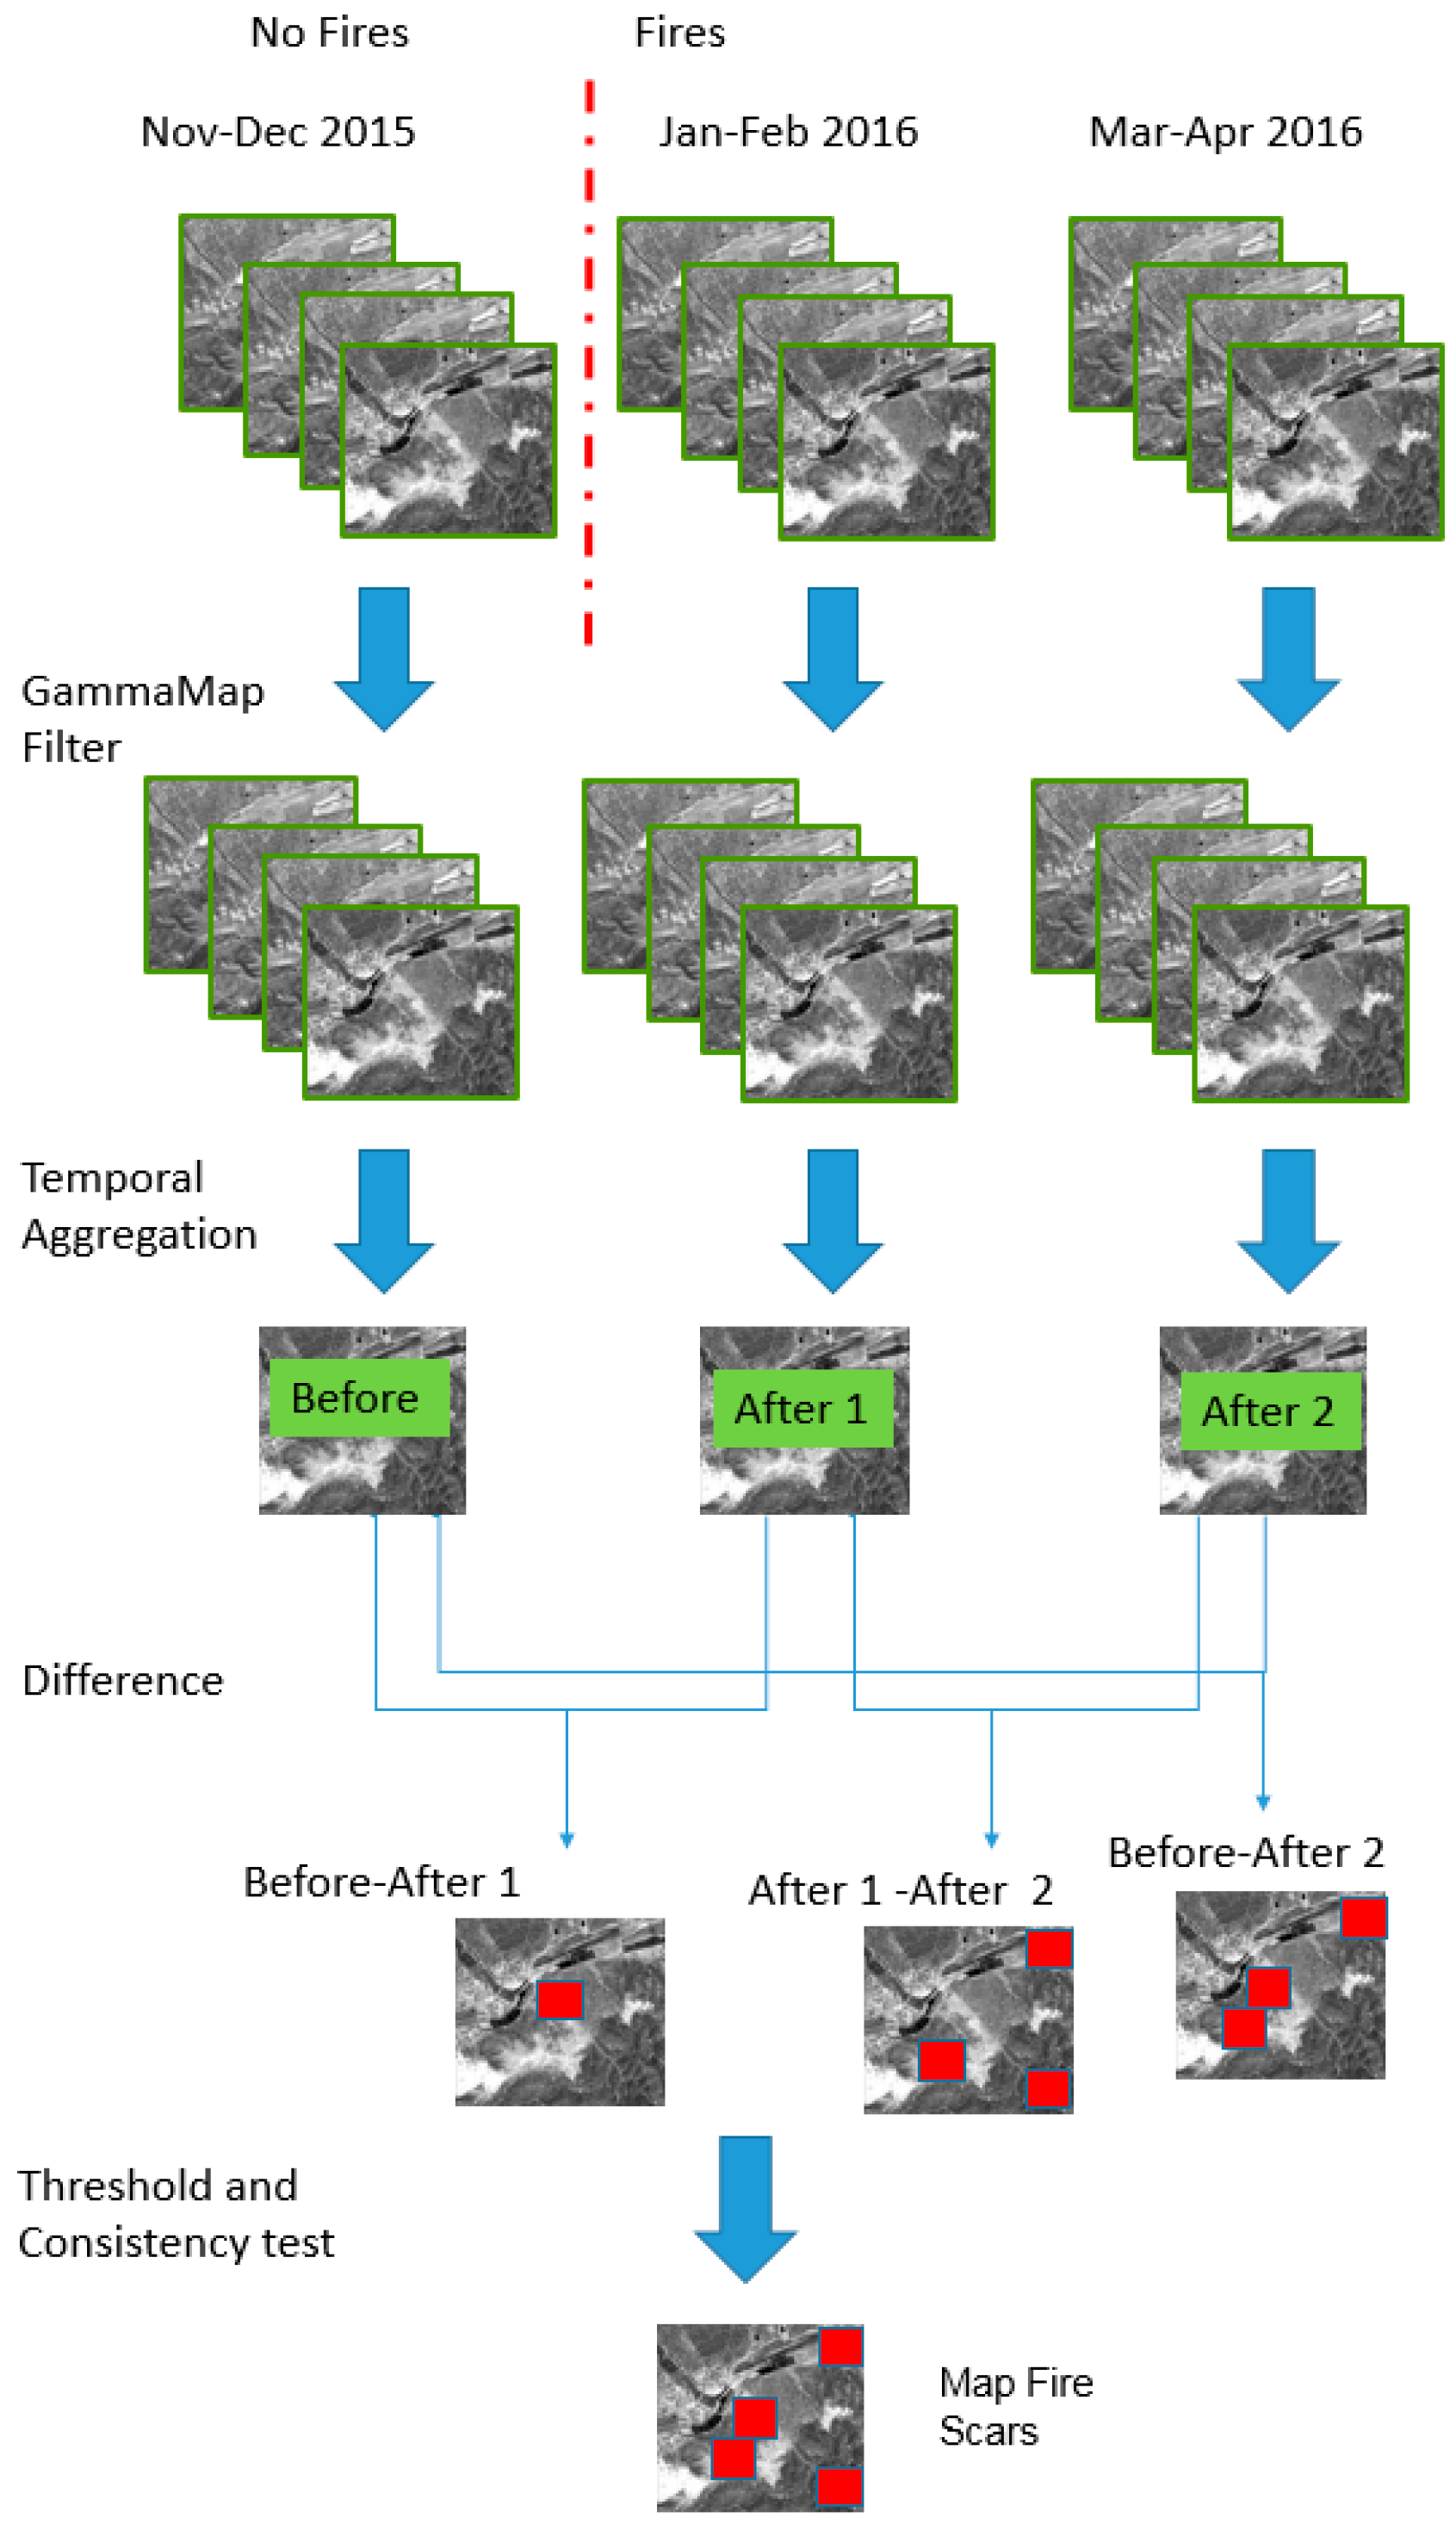
The S1 images available in this study were acquired with the Interferometric Wide swath (IW) acquisition mode at 25 m spatial resolution. In total, 24 images are available from December 2015 to April 2016. The methodology employed to delineate the fire-affected area is carried out in the following steps and summarized in
Figure 3: (1) map Gamma filter correction; (2) temporal aggregation of S1 imagery; (3) calculation of backscatter differences between consecutive periods; and (4) threshold application and consistency test. All SAR images are first corrected using Map Gamma filter technique described in Lopes et al., [
58] to reduce speckle. Map Gamma is an adaptive filters that reduces the variance (i.e., speckle) within the image while preserving both radiometric and spatial resolution. The filter is based on the assumption that the (unspeckled) intensity of the scene is gamma distributed. The filter minimizes the loss of texture information and it is thus suitable for a wide range of gamma distributed scenes, such as forest and agriculture areas.
The S1 temporal aggregation is performed on bi-monthly basis calculating the average of the SAR stack. The 2-month time span is necessary to further reduce the noise of SAR data records. The calculation of backscatter differences between consecutive periods allow to detect fire scars that exhibit large differences in backscatter. The difference in the signal between different periods is simply computed by subtracting the backscatter of the second period to the backscatter of the first one.
Pixels that display a difference greater than a specific threshold are labeled as fire scars. The threshold is land cover dependent. The variation of backscatter in evergreen forest is relatively stable due to the homogeneous forest canopy. Conversely, croplands and other land uses exhibit important variation in backscatter signal over time. In order to quantify the S1 forest-fires backscatter threshold, artificial test cases have been designed over the study area. The test was carried out using different threshold differences between S1 backscatter from different periods ranging from −0.1 to −2.0 dB with a step of −0.1 dB. A backscatter difference of −1.0 dB provided the optimal threshold value for the assessment of fire scars in the evergreen forests of the study area. A lower threshold value would have increased the data noise, whereas, at higher values, the fire scars effects would have been less evident.
A simple threshold difference approach can however introduce commission errors. S1 data, although filtered through the Map Gamma, still suffer from speckle noise and the backscatter strongly depends on the soil moisture content of the ground. A difference between two consecutive periods, e.g., due to soil moisture across intact forests may thus be detected as fire scar.
To mitigate the negative effect of these commission errors a “coherency test” between three consecutive periods (i.e., the S1 bi-monthly aggregations described above) is introduced. The test is carried out by detecting fire scars between: (1) the first and the second period (i.e., March–April aggregation vs. January–February one); and (2) the first and the third period (i.e., March–April aggregation vs. December–January one). Fire scars found for the first pair that are not subsequently confirmed by the second pair are rejected. Therefore, pixels classified as burned that do not display a time-consistent change in backscatter signals are considered as outliers. This procedure is applied to ensure that changes in backscatter signal are due to the vegetation structure rather than to temporary differences in soil moisture.
To remove possible errors caused by topography, SAR data are usually first corrected using a maximum slope threshold. As the terrain is flat in the study area, such correction is neither needed nor applied.
The procedure has been applied with both VV and VH polarizations, but only VV shows results coherent with S2 results.
2.6. Forest Cover Percentage Using VHR Data
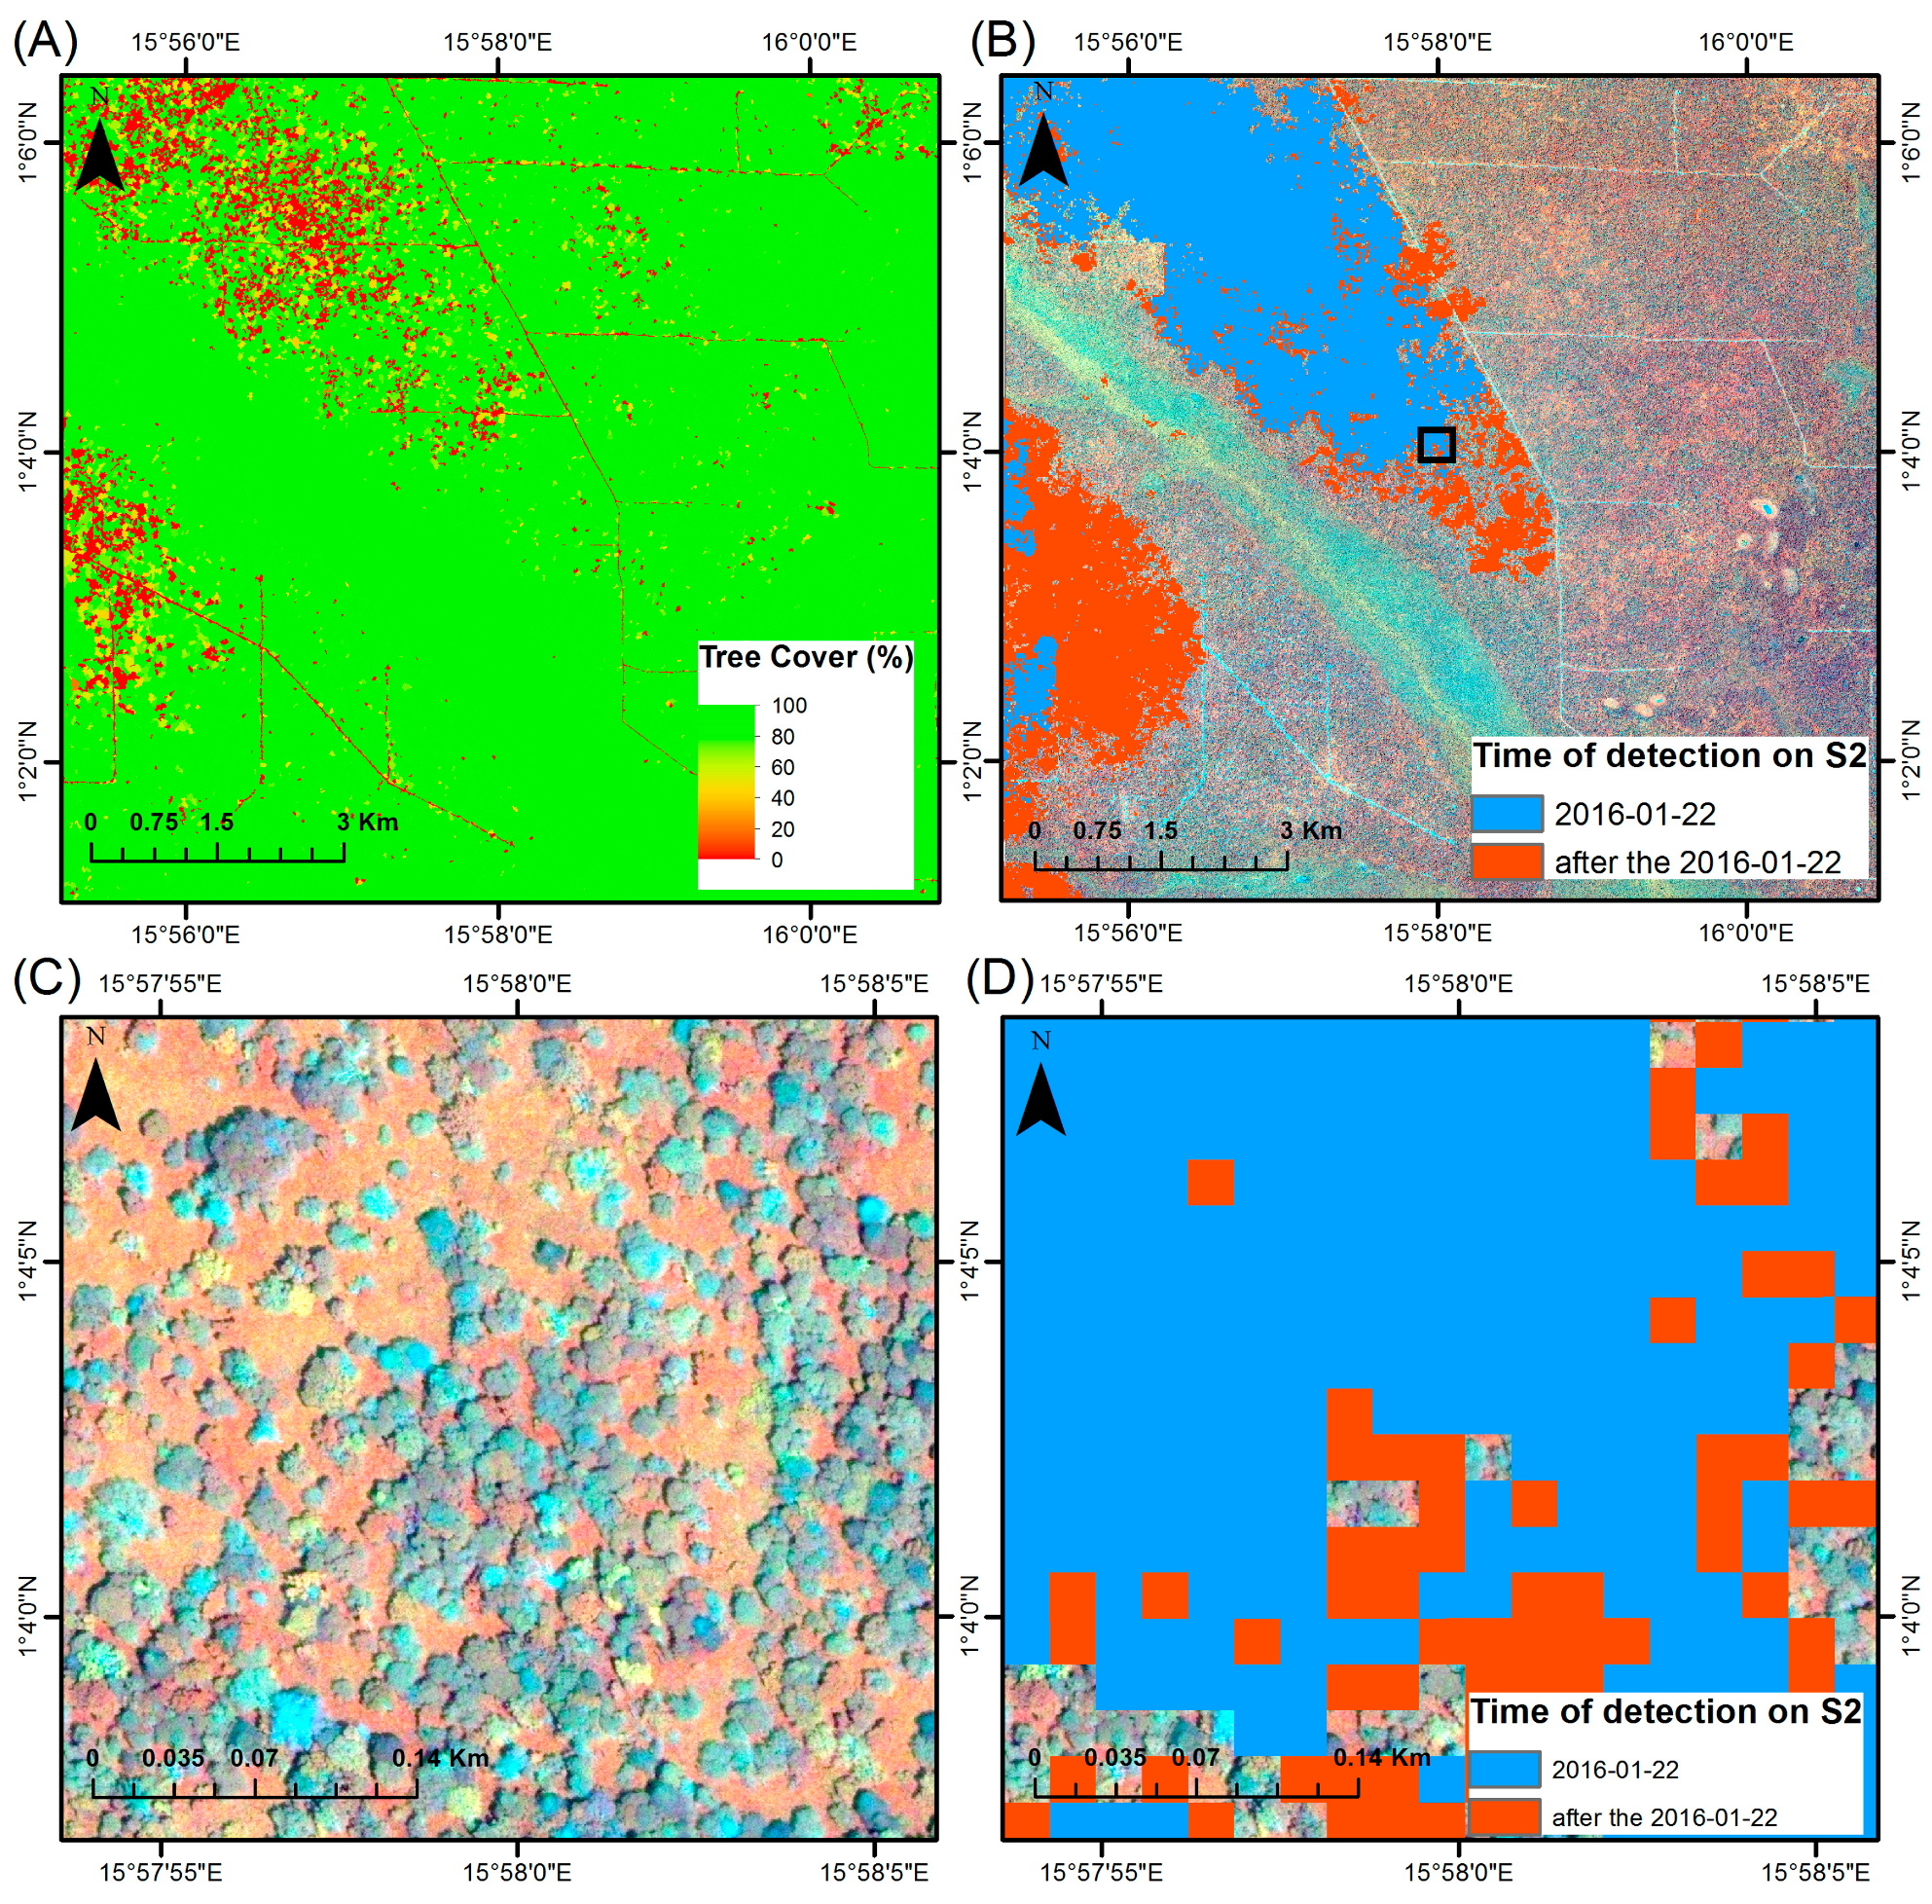
In order to assess the opening of the forest canopy and whether the fires were limited to the most open areas, a very high resolution image (VHR) was analysed to calculate the percentage tree cover of the forest over a small part (100 km2) of the study. The image is a GeoEye-1 four band pan sharpened image at a nominal spatial resolution of 0.4 m acquired the 28 November 2011. GeoEye-1 spectral bands are the following, Blue (450–510 nm), Green (510–580 nm), Red (655–690 nm) and Near Infra-Red (780–920 nm).
The opening of the canopy is evaluated by segmenting the image into homogeneous textural objects. The data were segmented with the eCognition software to an average of 0.2 ha objects with a scale factor of 70 (shape and compactness of 0.5 and 0.7). A decision tree classifier was used to separate out four classes, bare soil (mainly logging roads), grass, shrubs and tree cover. Apart from the original spectral channels, the NDVI and the standard deviations of the red and near infra-red channels were used for the segmentation and the classification. The decision tree classifier was trained using 100 randomly selected points visually interpreted into the 4 classes. A second level of segmentation with a scale factor of 200 (shape and compactness of 0.5 and 0.9) was undertaken to obtain 0.5 ha polygons. The relative proportion of forests in each 0.5 ha segment was calculated from the first level segmentation of 0.2 ha.
The joint S2-S1 map of burnt areas was compared to this estimation of tree cover to evaluate the occurrence of fires in the more open forests types.
4. Discussion
4.1. Exceptional Fire Outbreak
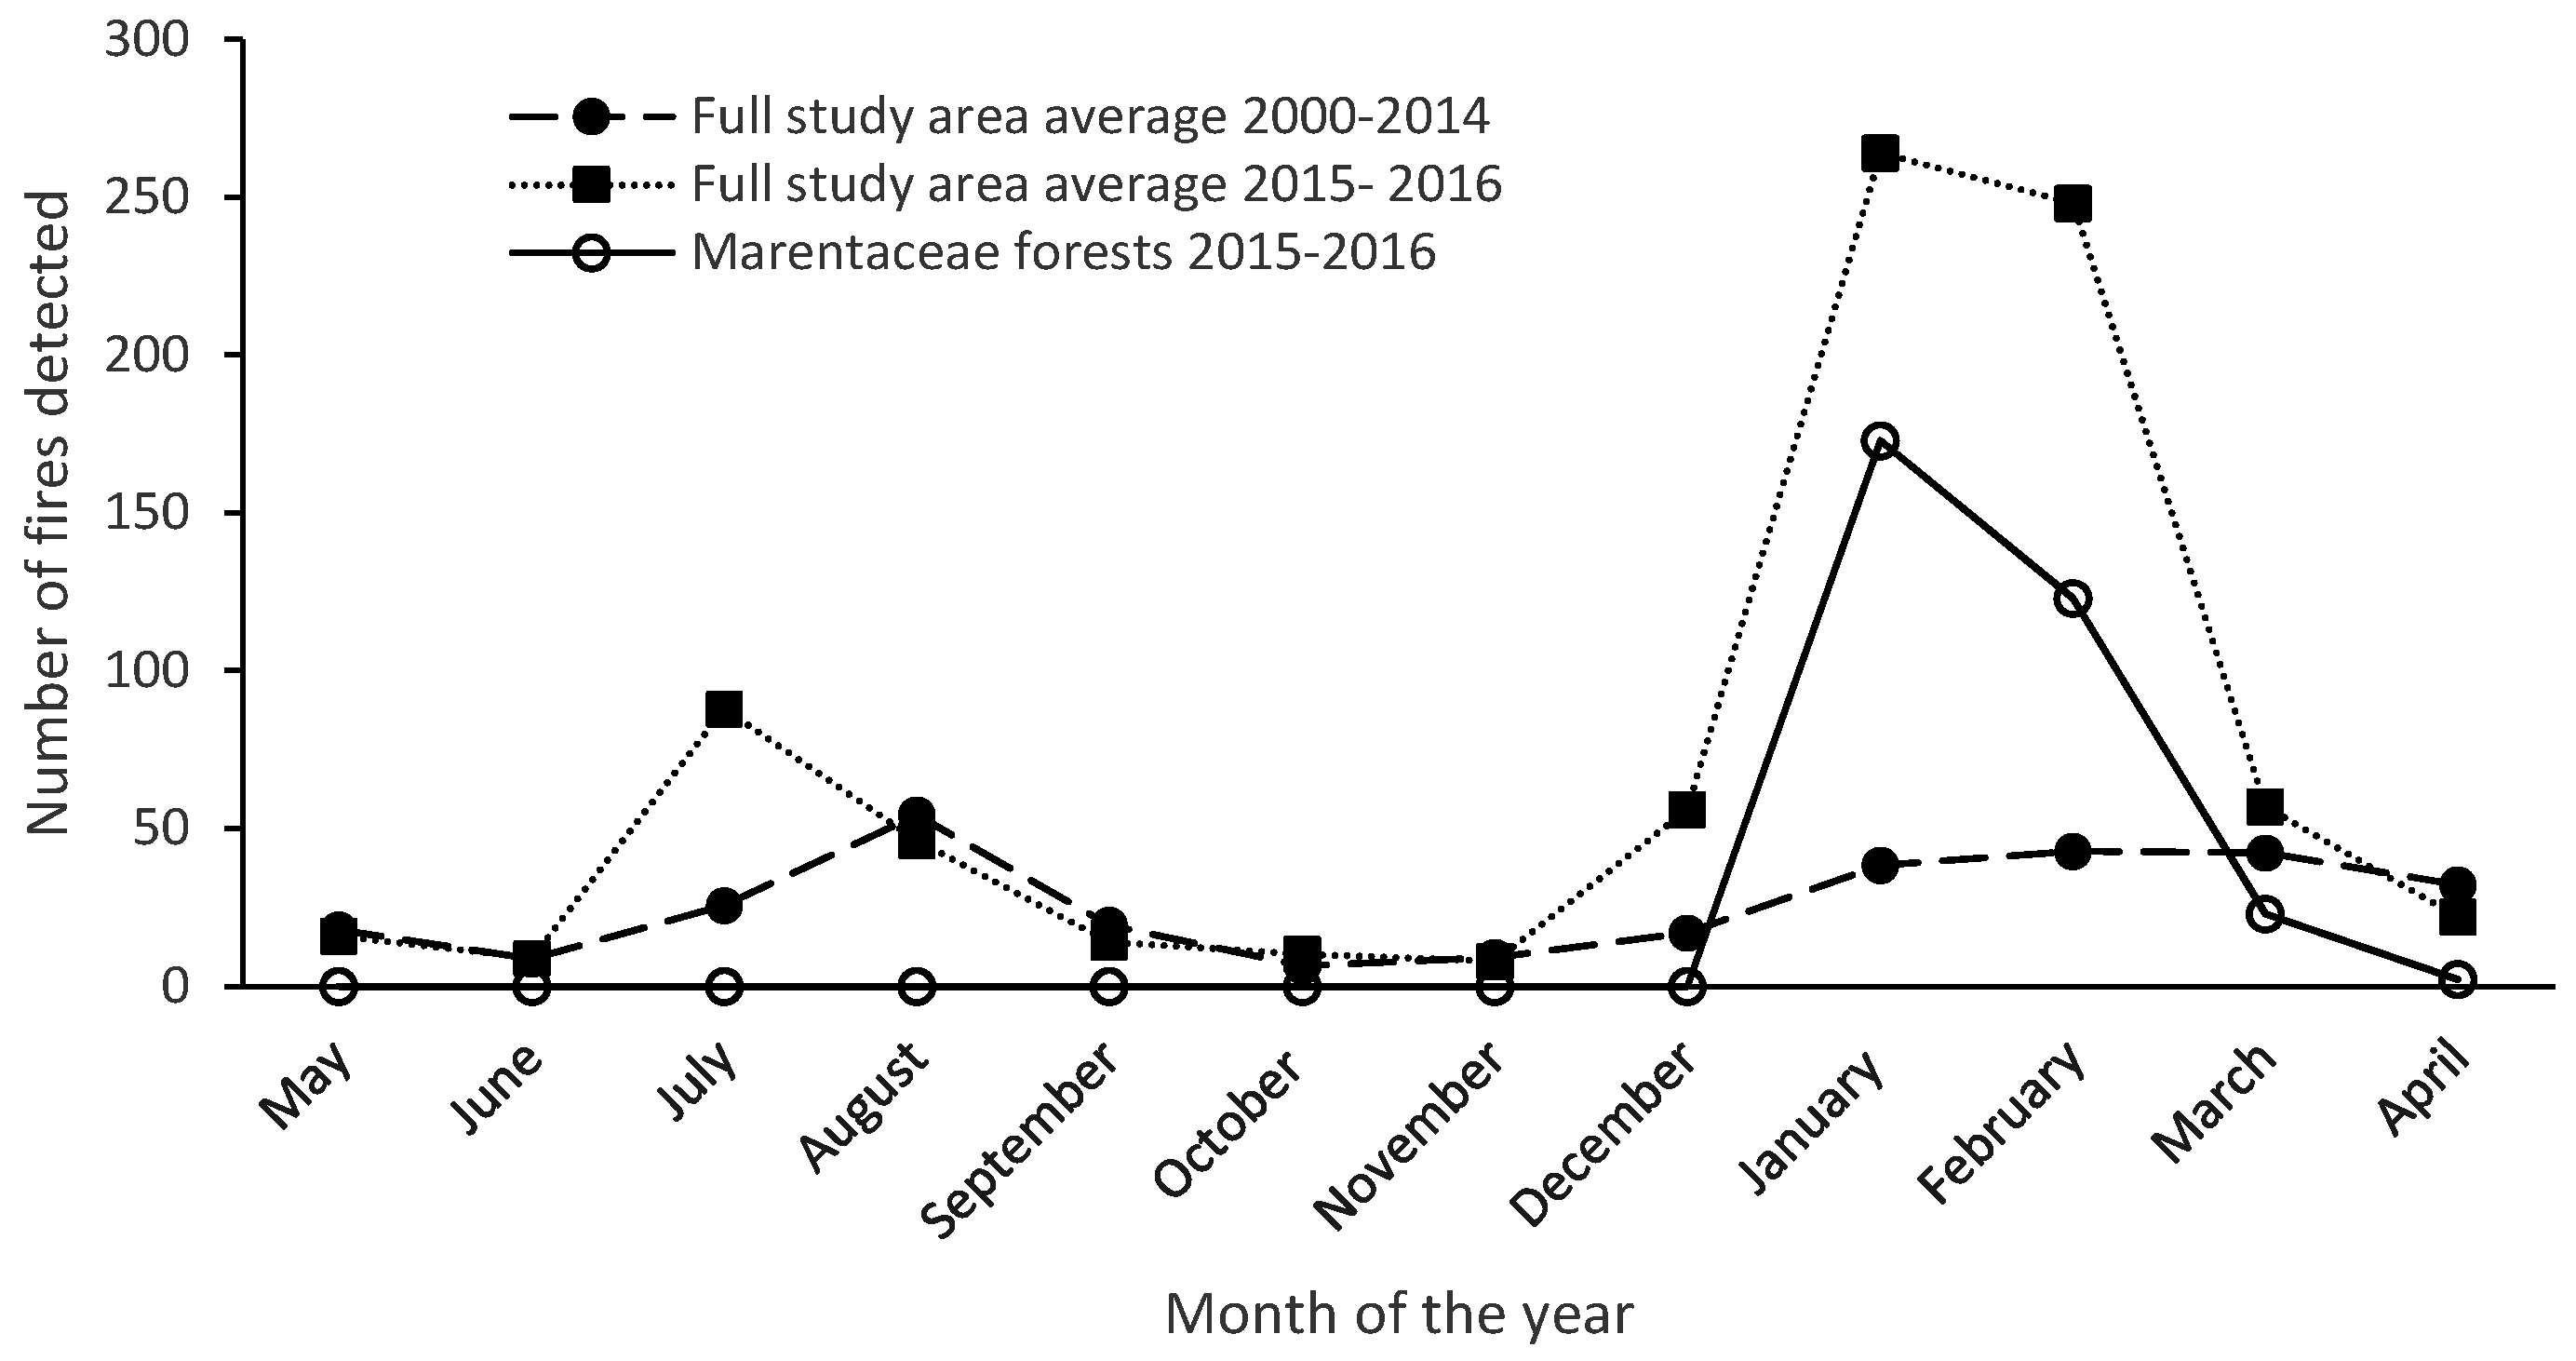
From December 2015 to February 2016, a drought is observed in the Republic of Congo, leading to an unprecedented fire outbreak in the Marantaceae forests in the north of the country. A review of the meteorological data (
Figure 3) clearly shows the arrival of this anomaly, and with hindsight could have been used to predict a potential outbreak of fire in the forest ecosystem.
More than 36,000 ha of forest have burnt in less than three months. The most important fires are observed in January and February 2016. Some active fires were observed at the end of December 2015 and in March–April 2016. The end of the fire outbreaks can be linked to the arrival of rains in mid-March. The magnitude of the anomaly is demonstrated by the exceptional number of active fires that have been detected for the region compared to the average of fires observed during the 2000–2015 period. It is the only time that fires have been detected in these formations since November 2000 when the MODIS sensor became operational on the Terra satellite.
While observations of fire in tropical forests are frequent in Amazonia or Indonesia, few records of fire are found for Central Africa. To our knowledge, it is the first time that type of event is describe and documented in Central Africa. Gillet [
35] reports an outbreak of fire in 1970 in the southern part of the Marantaceae forest within the Ngombé logging concession, supposedly following an El Niño event. This event is reported by the timber company now operating in the concession, but no satellite image or maps are available to corroborate this.
4.2. Potential of Sentinel 1 and Sentinel 2 for Burnt Areas Monitoring
To monitor and map fire events in tropical forests, the sensors installed on the S1 and S2 satellites show some potential. The arrival of the S2 satellite provides a far higher frequency of Earth Observation data than was previously possible at this fine (10–20 m) spatial resolution. Due to its novelty, literature about the use of time series of S2 images is scarce and mainly covers the use of single or pair of images but first experiences confirm a good potential for land cover mapping capabilities [
59,
60]. The frequent observations by S1 over the Congo Basin and its independence from cloud cover also make the mission an indispensable asset. The use of the two sensors (supported by the active fires from MODIS) allows a fuller picture of what has actually occurred.
The two sensors are sensitive to different phenomena, the S2 optical sensor detecting changes in surface reflectance, while the S1 SAR is detecting changes in vegetation structure and moisture. It may therefore be that the S1 SAR is only highlighting areas where the fires were more intense, and the vegetation structure was more affected, which can only be assessed with field data.
With S1 data, some technical constrains have to be respected. In order to remove speckle and noise, monthly composites have to be used. Due to the high rainfall in November and the drought of December to February, the change of soil moisture had an impact on the changes in backscattering, requiring a higher threshold for the detection of burnt areas. Some small errors of commission were observed most probably due to the change in soil moisture. Errors due to the topography are not expected here, as the study area is quite flat.
With S2 optical data, cloud cover limits the data available and unlike other regions the dry season in Africa does not mean an absence of clouds [
25]. However, changes in reflectance can be captured for a few months, depending on the pace of vegetation regrowth.
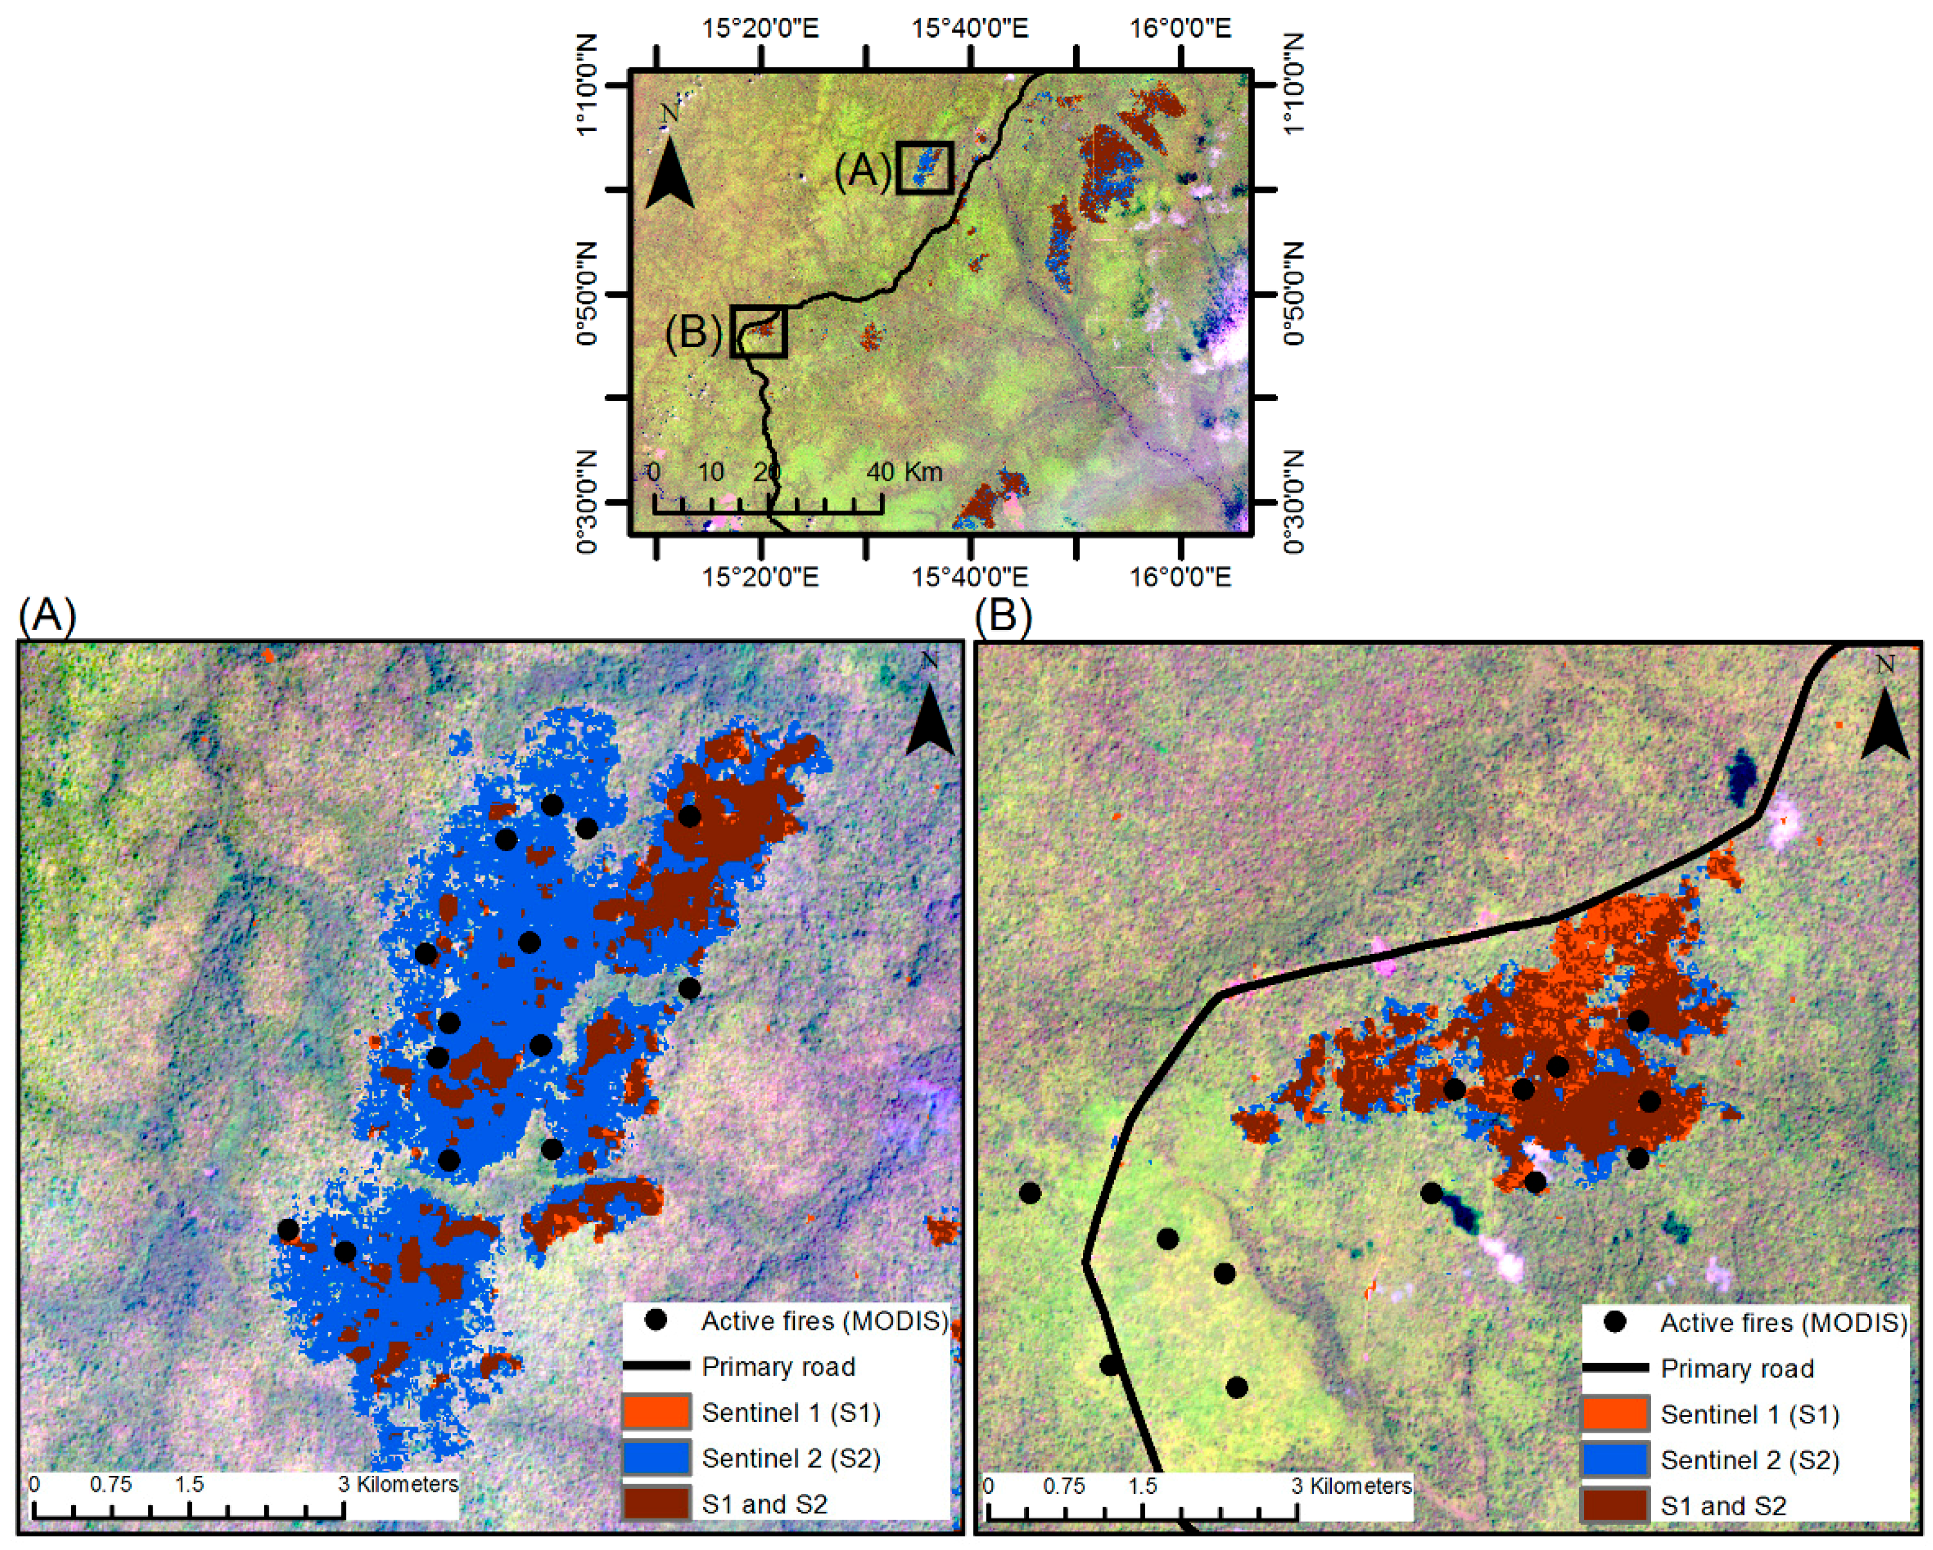
The limitations of the individual systems are reduced by using both S1 and S2.
Figure 10 illustrates the extreme cases for each sensor. In
Figure 10A, S2 detects burnt areas (in blue) while S1 does not, probably because of a less severe fire. In
Figure 10B, however, S1 (in orange) detects burnt areas that were not detected by S2 due to high cloud coverage.
Clearly, the combination of the Sentinel data with that of Landsat would further improve the temporal coverage.
4.3. Spatial Distribution of the Burnt Areas
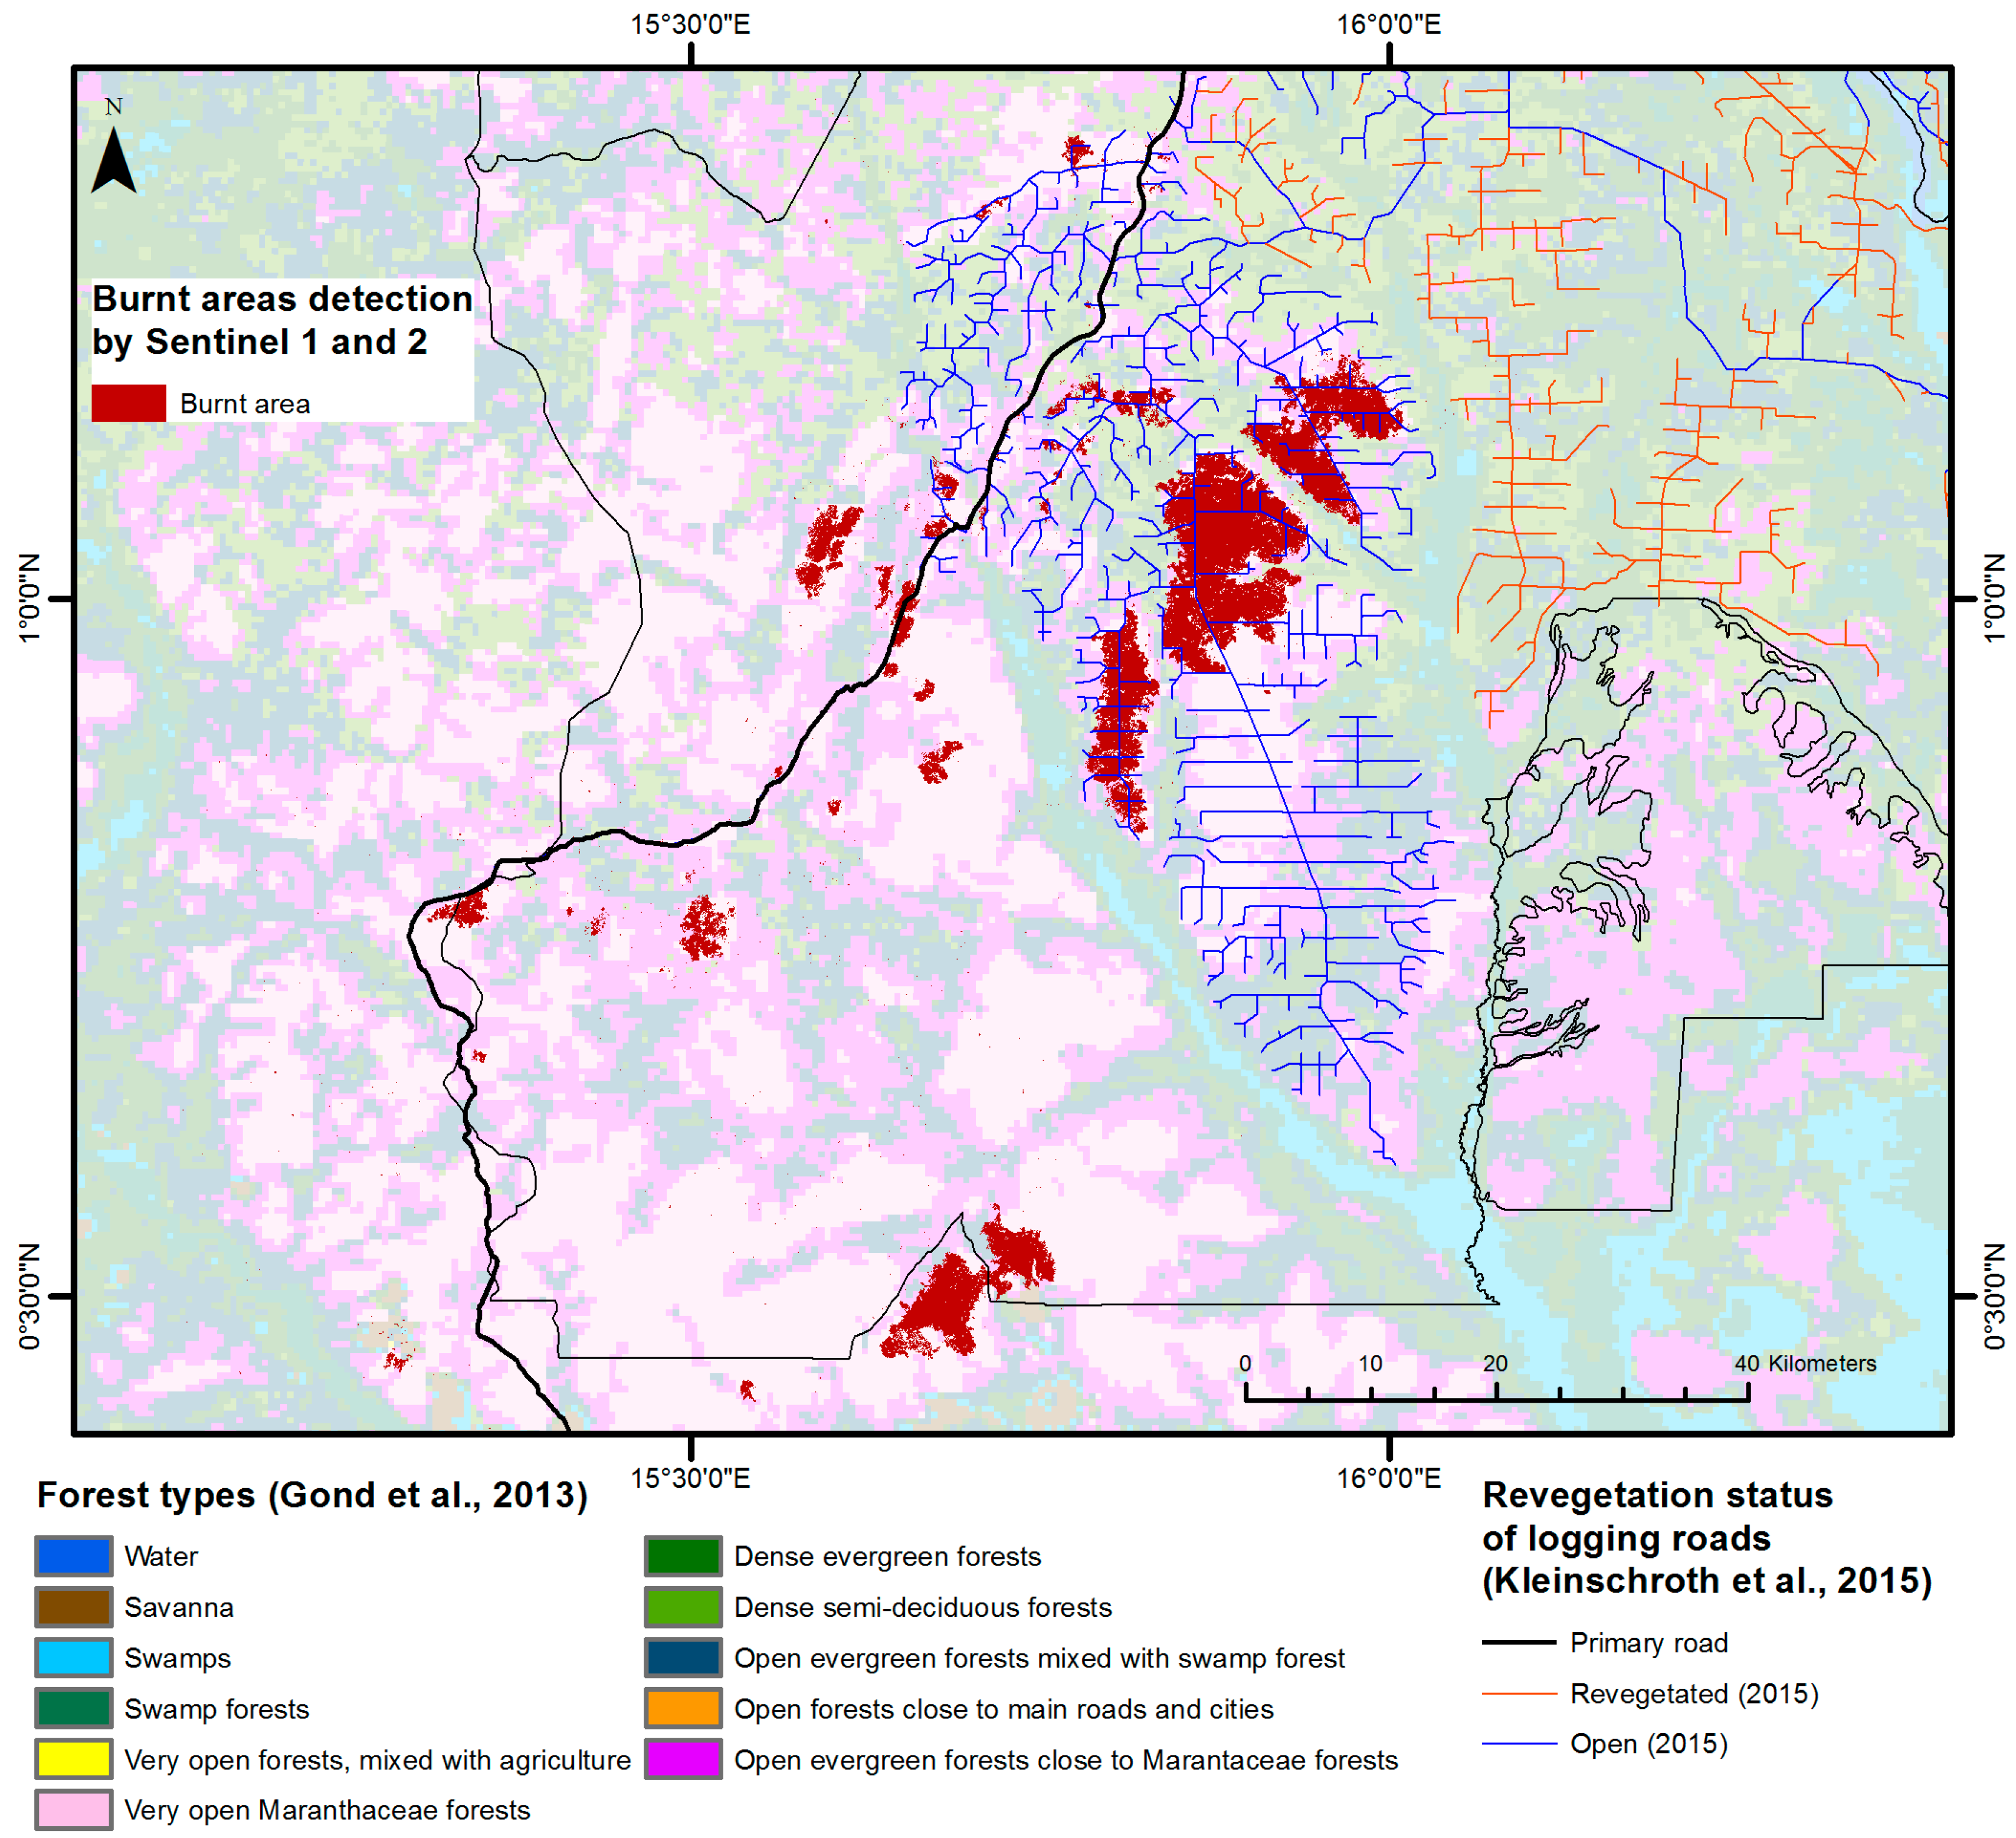
In reviewing the spatial distribution of the fires in the forest domain, it is clear that the fires occurred mainly in open forests, more specifically in the very open Marantaceae forests. From the density of roads, it is deducted that while mainly located inside a logging concession, fires occurred in old logged areas and in areas that were never exploited.
Around 80% of the burnt areas detected with S1 and S2 data occur in the core of the very open Marantaceae forest. Another 13% is observed in the open forests situated at the border of the very open forests formations. According to the analysis, the dense forest was only slightly affected, with less than 2% of this class mapped as burnt. However, this low percentage is only indicative as the vegetation map has a coarser spatial resolution compared to the burnt area maps.
Only a certain proportion of Marantaceae forests were affected by fires. According to Gond et al., [
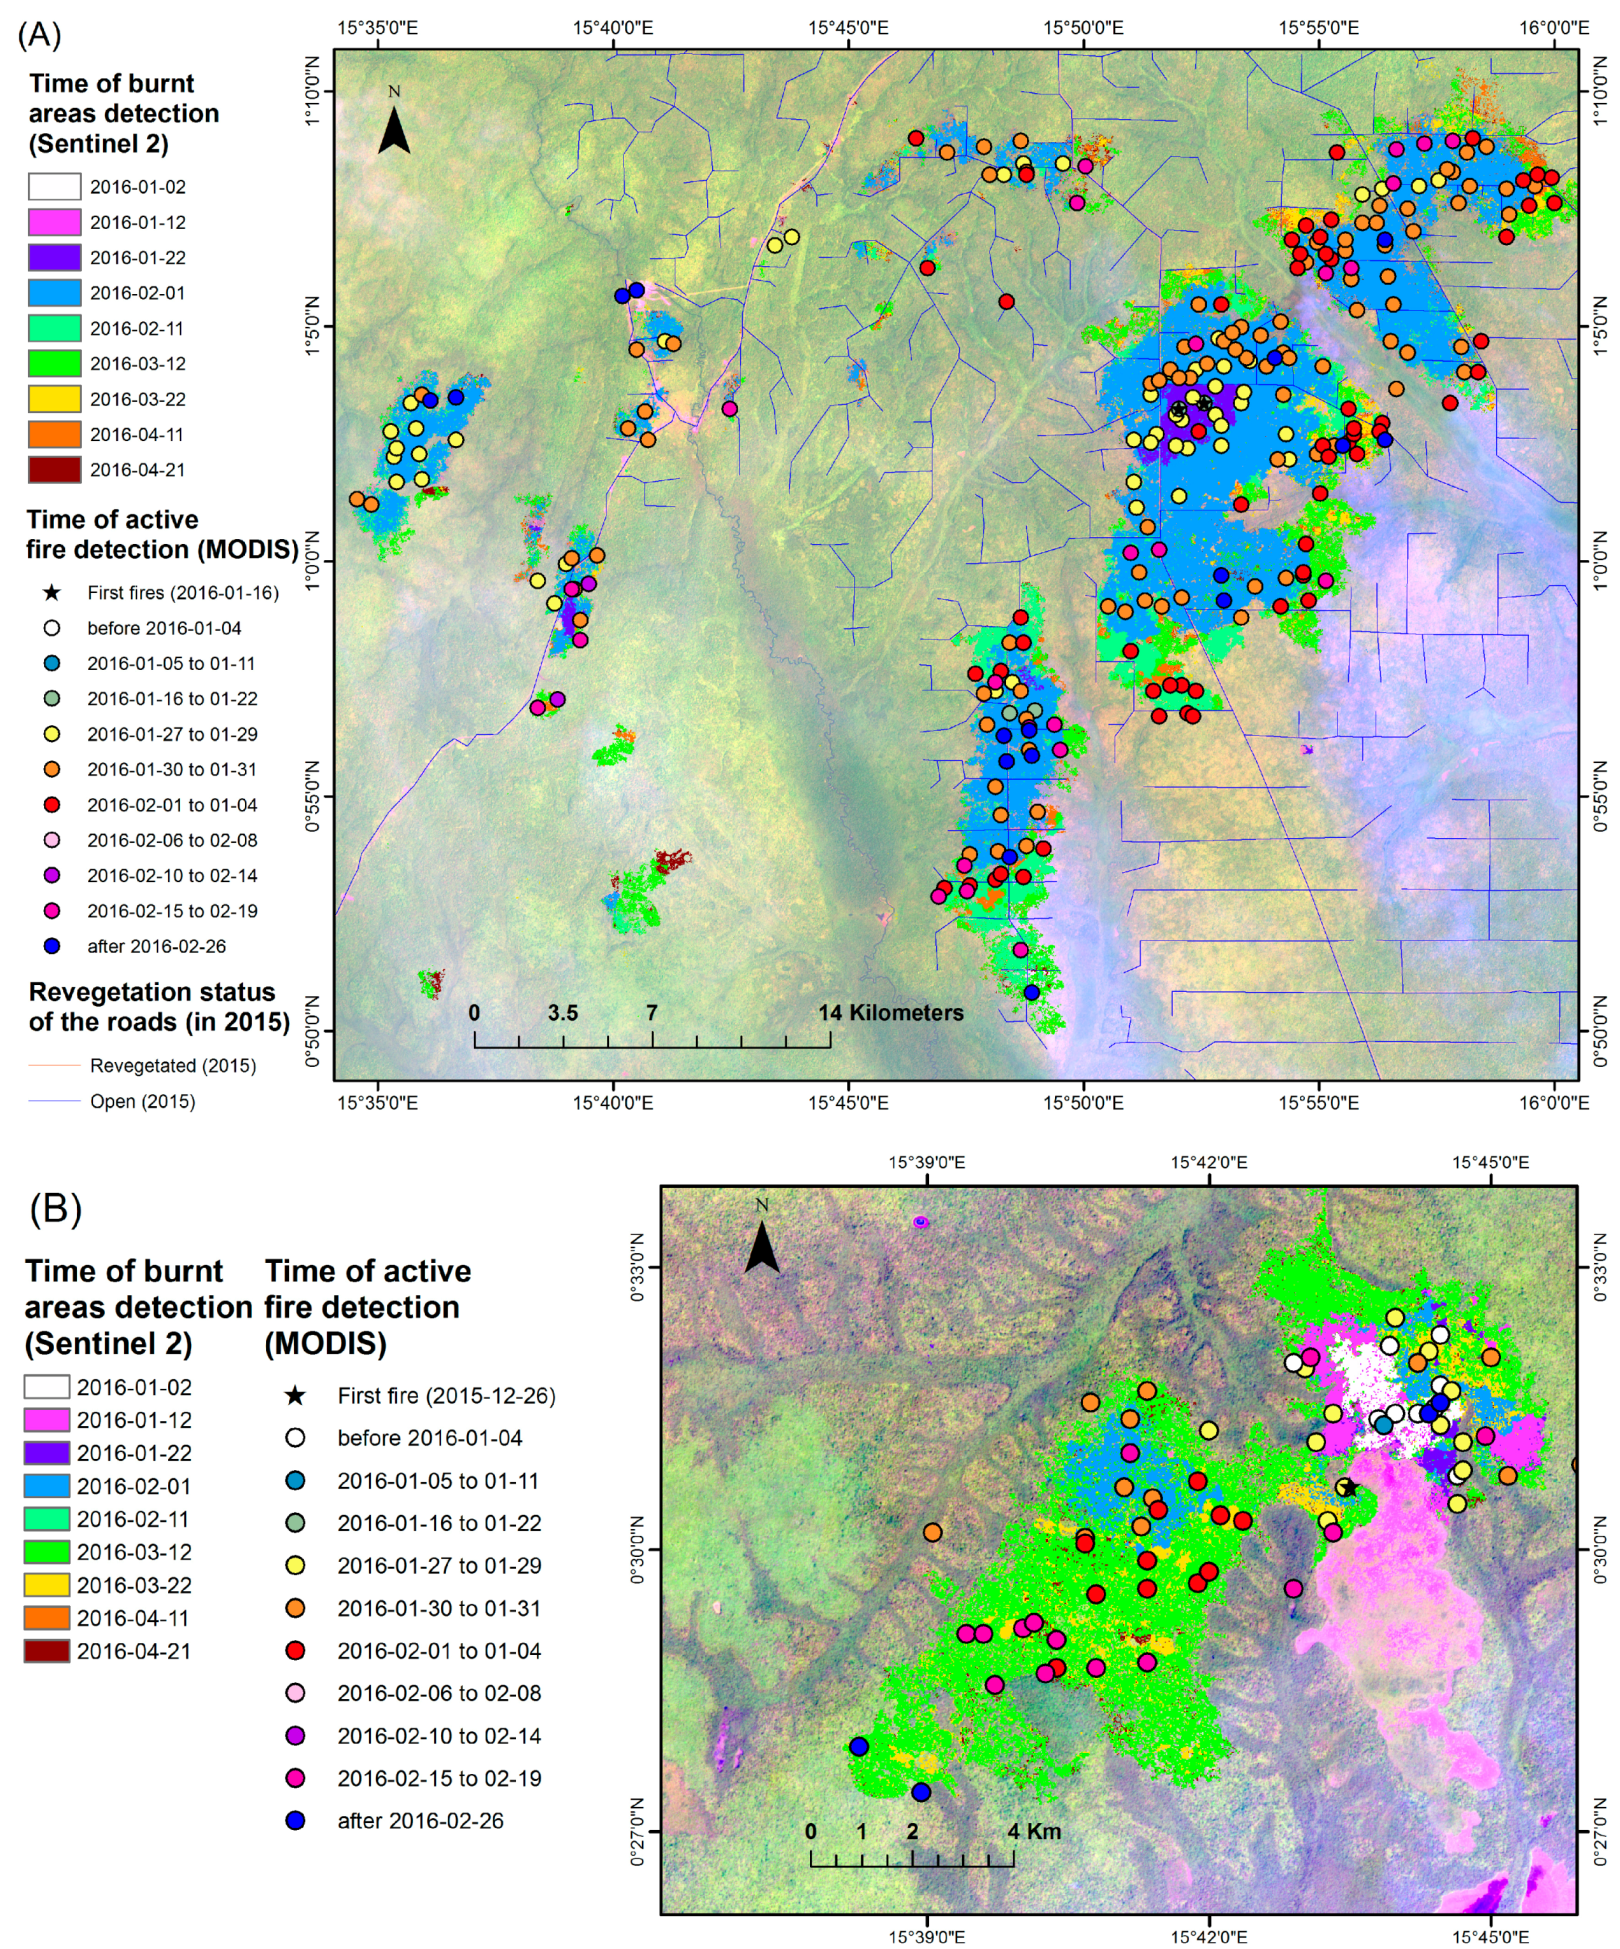
26], Marantaceae formations in the study area occupy more than 300,000 ha. To understand the distribution of the fire, we looked at the logging roads network and the accessibility in general. For the burnt areas observed in historically logged areas in the north (
Figure 8A), the origin of the fires is adjacent to old logging roads. The roads were identified by Kleinschroth et al., [
31] as not yet entirely recolonized by vegetation in 2015. Although these roads have been closed and are no more used for active logging exploitation, they may have remained partly accessible for people on foot. In Amazonian and Indonesian tropical forests, the presence of recent logging roads has been reported as a potential facilitator for fire in forests [
8,
10,
61].
For the burnt areas observed in areas not previously logged, some are located along the main road (visible as a black thick line in
Figure 8A), where there are a number of small to large villages. Some areas are located up to a distance of 8 km from the road. The areas accessed by local communities and indigenous people for hunting and gathering is thought to reach up to 30 km into the forest. Another extent of burnt area is situated in the south of the study area (
Figure 8B), close to savannas.
From the analysis of a the VHR image together with the timing of the fire derived from S2 burnt area maps and MODIS active fire data (see
Figure 9), the hypothesis can be made that fires started close to roads, both in logged and non-logged forests, or close to a savanna, but all fires started in very open forests, then propagated to the border of the ecosystem and into denser canopy cover forests.
From the S2 and MODIS data, it is clear that fire started at the same time in different locations. Wind and dry vegetation may well have facilitated the spread of the fire to such a widespread extent. There is, as yet, no firm explanation for the origin of these fires, however, they are unlikely to be of natural origin (i.e., lightning) [
10] and more likely to be related to the presence of local communities and indigenous people in the forest. Human activities have probably initiated fire in an environment more prone to fire after the drought of the beginning of the year. The fires observed along the main road could be related to shifting cultivation activities by the villagers living there. Poaching activities are known to occur in the area, given that fauna such as gorillas and elephants are present in the open forests. However, to confirm the origin of the fires, a more detailed accessibility study and surveys with local people are needed.
4.4. Long Term Ecological Implications?
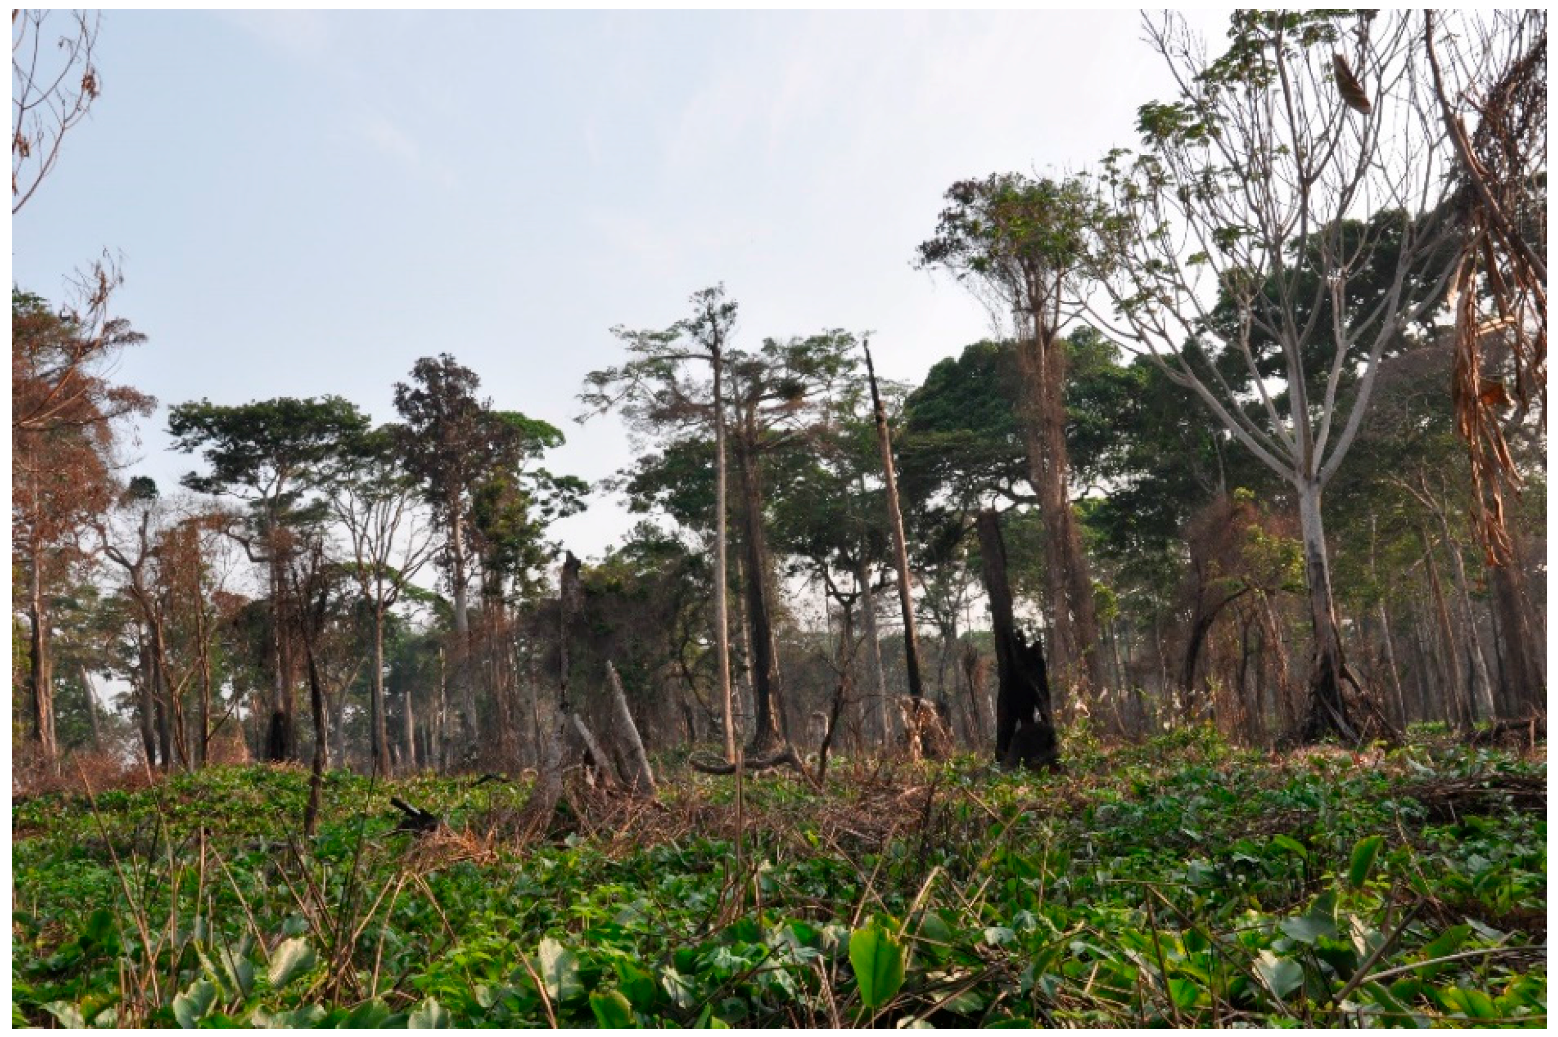
The actual impact of the fires on the tree mortality, tree cover density and longer term effects are difficult to assess at this stage. However, a field visit to one of the affected areas three months after the fires showed that the flames had reached the crowns of the trees, some 20–30 m high. The regrowth of the Marantaceae was already clearly visible as illustrated in
Figure 11. Marantaceae, being pioneer plants, easily invade new open areas (following natural or anthropogenic disturbances). Doing so, they prevent the regeneration of trees and lead to an opening of the forest canopy cover [
35].
The intrusion of fire into the borders of the Marantaceae forests can present a risk in terms of densification of this herbaceous species into the understory of denser forest formations. Cuni-Sanchez et al., [
39] have documented that Marantaceae forests may be maintained by occasional fire events. Specific attention in the coming years should be put in following the vegetation regeneration in the transition zones between Marantaceae forests and other forests types.
Most species in closed canopy evergreen forests have thin bark and are more vulnerable to fires than drier forests [
8,
62]. It is known that fires can lead to tree mortality up to three years after the fire event [
63], so the full impact of this episode cannot yet be determined.
Field survey would be important to complement the satellite study and to understand better what exactly has burnt (trees, Marantaceae herbs), and also to monitor in time the vegetation regeneration. This would be important to determine what would happen in case of a recurring scenario of fires in this ecosystem, a major ecological question—if El Niño events are to become more frequent and access to the forest continues to increase.
According to climatic scenarios, length and intensity of dry seasons might indeed increase in the future in Central Africa [
64]. Concerning accessibility, roads are considered as a proximate driver of fire [
61]. In the study area, a rapid road network expansion has occurred in north of Republic of Congo since 1999 [
65]. In Amazonia, a greater fragmentation of the forest has been shown to decrease the resilience of the forest to typical dry seasons, predisposing the fragmented forest to fires [
66,
67]. The impact of logging on the propensity to fire of such formations needs to be assessed. A review of fires outbreaks and impacts in managed vs. non-managed concessions could help shed some light on such impacts. In theory, well-designed and fully implemented sustainable forest management plans reduce the collateral damage to the forests, especially through improved road-planning, effective road closure and post-harvesting monitoring, and as a result limit their susceptibility to fire.
The crux of the fire problem in tropical rainforests is not so much the introduction of fire into these ecosystems but the frequency with which it returns [
8]. It will therefore be important in the coming years to see if this event reoccurs. A repetition of this event, together with assessing the proportion of trees affected and their associated carbon emissions is also of concern for REDD+ implications.
5. Conclusions
This paper demonstrates the potential for S2 and S1 data to detect and monitor fire outbreaks in forest ecosystems at finer temporal and spatial resolution than was previously possible. Burnt areas totalizing an area of 36,000 ha were detected in the north of the Republic of Congo thanks to the combined used of S1 and S2 time series. At its peak in early 2016, the fire was spreading at a rate of 1600 ha per day. Indications of the forthcoming event were in evidence in late December, both from the high detection of active fires in the region and the low SPI rainfall values.
The fifteen S2 images analyzed from December 2015 to May 2016 represent the first time series of S2 data released over the study area and show a great potential for tropical forest monitoring applications. The burnt area maps derived from each S2 image are adding a precise spatial extent to the point location of the MODIS active fire product and provide a better documentation of the fire propagation in the Marantaceae forests. The two burnt areas maps derived from S1 bi-monthly composites provides a gap filling capacity (in case of cloud cover) and brings confidence to the S2 results, with over 60% concurrence between the two data sets.
The arrival of the S1 and S2 satellites, soon supported by the Sentinel 3 SLSTR sensor with bands optimized for fire monitoring, can provide forest managers and national agencies with a rapid and accurate assessment of fire events. From the methodology proposed here, some points have to be addressed to move from a case study to an operational monitoring tool. The combination of the radar and optical information is robust in terms of burnt area detections but the respective S1 and S2 methodologies should evolve into algorithms that are independent from locally tuned thresholds.
A review of climatic data and vegetation susceptibility to fire could also be employed to highlight anomalies which may lead to fire outbreaks and provide managers with an early warning of the possibility of such events. Of concern to all parties, forest managers, national agencies, etc., is the long-term perspective for these ecosystems which have been subjected to this exceptional fire event. Is this just a one-off event that in fact helps to maintain these open forests, or is this a precursor to more frequent revisits of fire events which may induce a change in the landscape of Central African forests and their future uses?


