1. Introduction
There is a strong demand for evidence-based global policies in the economic, social, environmental and disaster risk reduction spheres. The need for accurate, reliable, and timely estimates of land cover of the world at sufficiently detailed spatial and thematic resolutions is underscored by national and international programs and the global change research community [
1]. In particular, the understanding of the global human settlements and urban expansion are critical for a large number of issues including housing and urban development, poverty reduction, sustainable development, climate change, biodiversity conservation, ecosystem services provision and disaster management [
2].
Several indicators, such as the access to infrastructure, pressure on biodiversity, urban planning and management [
3,
4], exposure and vulnerability to natural hazards, can be derived from the information on human settlements. Data from satellite imagery and new technologies for processing earth observation data facilitate the study of population distribution on a global scale. Earth observation is a unique source of information for deriving globally-consistent and evidence-based indicators for improved accountability and coherence of international frameworks. Free and open earth observation data (e.g., Landsat and Sentinel) offer a great potential for large area mapping of human settlements.
The availability of such data has been a driver for different global urban mapping efforts. Gamba and Herold [
5] and Schneider
et al. [
6] provide a summary of the data, methods and the estimates of global urban area obtained from these past efforts. The most recent global urban maps exploit essentially low and moderate resolution optical imagery including Système Pour l’Observation de la Terre (SPOT)-Vegetation data [
7], Medium Resolution Imaging Spectrometer (MERIS) data [
8] and Moderate Resolution Imaging Spectroradiometer (MODIS) data [
9]. The geometric resolution of these products is limited to 300 m–1 km, resulting in lack of spatial detail, omission of small cities or towns and poor accuracies for precise characterization of urban settlements and for supporting decision makers and urban planners. More recently, the availability of a global coverage of Synthetic Aperture Radar (SAR) data obtained from TanDEM-X mission (TDM) has been exploited in order to generate a worldwide inventory of human settlements—the Global Urban Footprint (GUF) layer that will be provided publically at a spatial resolution of ~3.0 arcsec (
i.e., ~50–75 m) [
10].
An ambitious project for Global Land Cover mapping from 30 m resolution Landsat data was launched in China. Two versions of global land cover maps were produced: the Finer Resolution Observation and Monitoring of Global Land Cover (FROM-GLC) and GlobeLand30. Accuracy assessment of the FROM-GLC product showed that several land cover classes, including impervious areas, were poorly classified—as reported in [
1,
11]. Recognizing the difficulties in making use of fully automated classification techniques for mapping land cover classes, Chen
et al. [
12] developed a pixel-object-based classification (POK-based) approach for generating the GlobeLand30 product with Landsat TM/ETM+ images of 2000 and 2010, as the primary data sources (supplemented by imagery from the Chinese Environmental and Disaster satellite (HJ-1) for the year 2010). The POK-based approach involves knowledge-based interactive verification procedure for the improvement of the quality of the data products. The need for manual editing by domain experts makes it difficult to automate the POK-based approach for continual updating, for developing long-time series of global lands cover datasets and for monitoring of human settlements.
Despite the tremendous progress made in the last decade regarding the purpose of mapping and monitoring human settlements at the global level, there are still numerous challenges to overcome including: (i) the availability of new and finer resolution data with a global consistent coverage; (ii) the technical capacities to handle large volume of satellite data; (iii) high performance computing for processing the data and mosaicking the final product; and (iv) more robust classifiers that minimize human intervention.
The Sentinel-2 mission, launched in June 2015, aims at providing a full and systematic coverage of the land surface at a global level. With a span of 13 spectral bands at a spatial resolution as high as 10 m, Sentinel-2 offers a great potential for addressing the satellite data requirements for fine scale mapping of human settlements. Together with Sentinel-1 SAR data, the prospect of compiling a cloud-free global image database at a fine spatial resolution for mapping human settlements is being gradually achieved.
Recently, a new method for supervised classification of remotely sensed data based on Symbolic Learning [
13,
14,
15] and Association Analysis [
16] was developed by [
17]. This novel approach proved to be capable of solving the issue of global processing of multi-sensor and multi-temporal large scale data for the purpose of mapping the global built-up environment over a 40 year period [
18]. It was successfully applied on Landsat imagery corresponding to the epochs 1975, 1990, 2000 and 2014. Preliminary validation tests confirmed the higher quality of the information on built-up areas delivered by the Landsat-made Global Human Settlement Layer (Landsat-GHSL) compared to other available global information layers. In GHSL, the built-up area class is defined as the union of all the spatial units collected by the specific sensor and containing a building or part of it as stated in [
8]. Human settlements are made by population and physical infrastructures. The building is one essential part of the settlement infrastructure and it is the basic sign of the human presence that can be physically observable by remote sensing technologies. The concept of Human Settlement adopted in this study relies on the classical notion inherited from the settlement geography, defined as “the description and analysis of the distribution of buildings by which people attach themselves to the land” by [
19]. Besides, the GHSL classification schema does not assume any embedded urban/rural dichotomy built-up structures are mapped independently if they belong to the “rural” or “urban” area definitions).
The latest developments presented in [
17] in terms of the robust and computationally efficient SML classifier, combined with the recent release of more than 2000 Sentinel-2 products for a first assessment by the scientific community, represent a unique opportunity to analyze the suitability of Sentinel-2 for fine resolution mapping of human settlements.
In this paper, we investigated the added-value of Sentinel-2 data compared to Landsat in the frame of the GHSL scope. The purpose is to assess the possibility of increased spatial and thematic detail along with improved quality of the geospatial information layer describing human settlements by exploiting the capabilities offered by Sentinel-2. Areas of improvement, including the possibility of combined use of different sensors (i.e., Sentinel-1 and Sentinel-2, Landsat and Sentinel-2), are also explored. The new SML classifier is applied to the different datasets in its simplest form for the purpose of the comparative assessment of Sentinel-2, Sentinel-1 and Landsat outputs.
The paper is structured as follows:
Section 2 describes the methodological context with the principles of the SML classifier and its relevance for mapping human settlements.
Section 3 presents the experimental set-up, including the testing of the SML classifier on Sentinel-2 data and the comparison with Landsat and Sentinel-1 outputs. Considerations on the potential of scaling up the new classification methodology to deal with the spectral, spatial and temporal characteristics of Sentinel-2 data are discussed in
Section 4.
2. Principles of the SML Classifier
The new classification method developed is based on the concept of the empirical multidimensional histogram. In short, associations among class labels and tuples of features are defined. The feature values are derived from the grouping/binning of the multidimensional histogram that describes the data under consideration. Then, a normalized measure scores these tuples according to the number of their occurrences in each class. The analysis of the cumulative distribution of the estimated scores results at the end in their reclassification. The method is designed for working in a complex and information-abundant environment, where it is important to assess the relationships between different data layers in model free and computationally efficient ways. This is particularly relevant for the global processing of multi-sensor and multi-temporal large-scale remote sensing data where the main challenges are related to the large variety of landscapes that introduce spectral heterogeneity within a single land cover class. Traditional parametric classifiers (e.g., maximum likelihood and Mahalanobis distance classifiers) can easily fail in this complex scenario as they rely on high stability both in the input data and in the reflectance characteristics of the target to be detected.
The singularity of the proposed non-parametric approach resides in the fact that the learning is driven by the data, in particular by the frequency of “similar feature sequences” in each class. In the context of this method, “symbolic” refers to the representation of the input data as categorical, as opposed to continuous or quantitative.
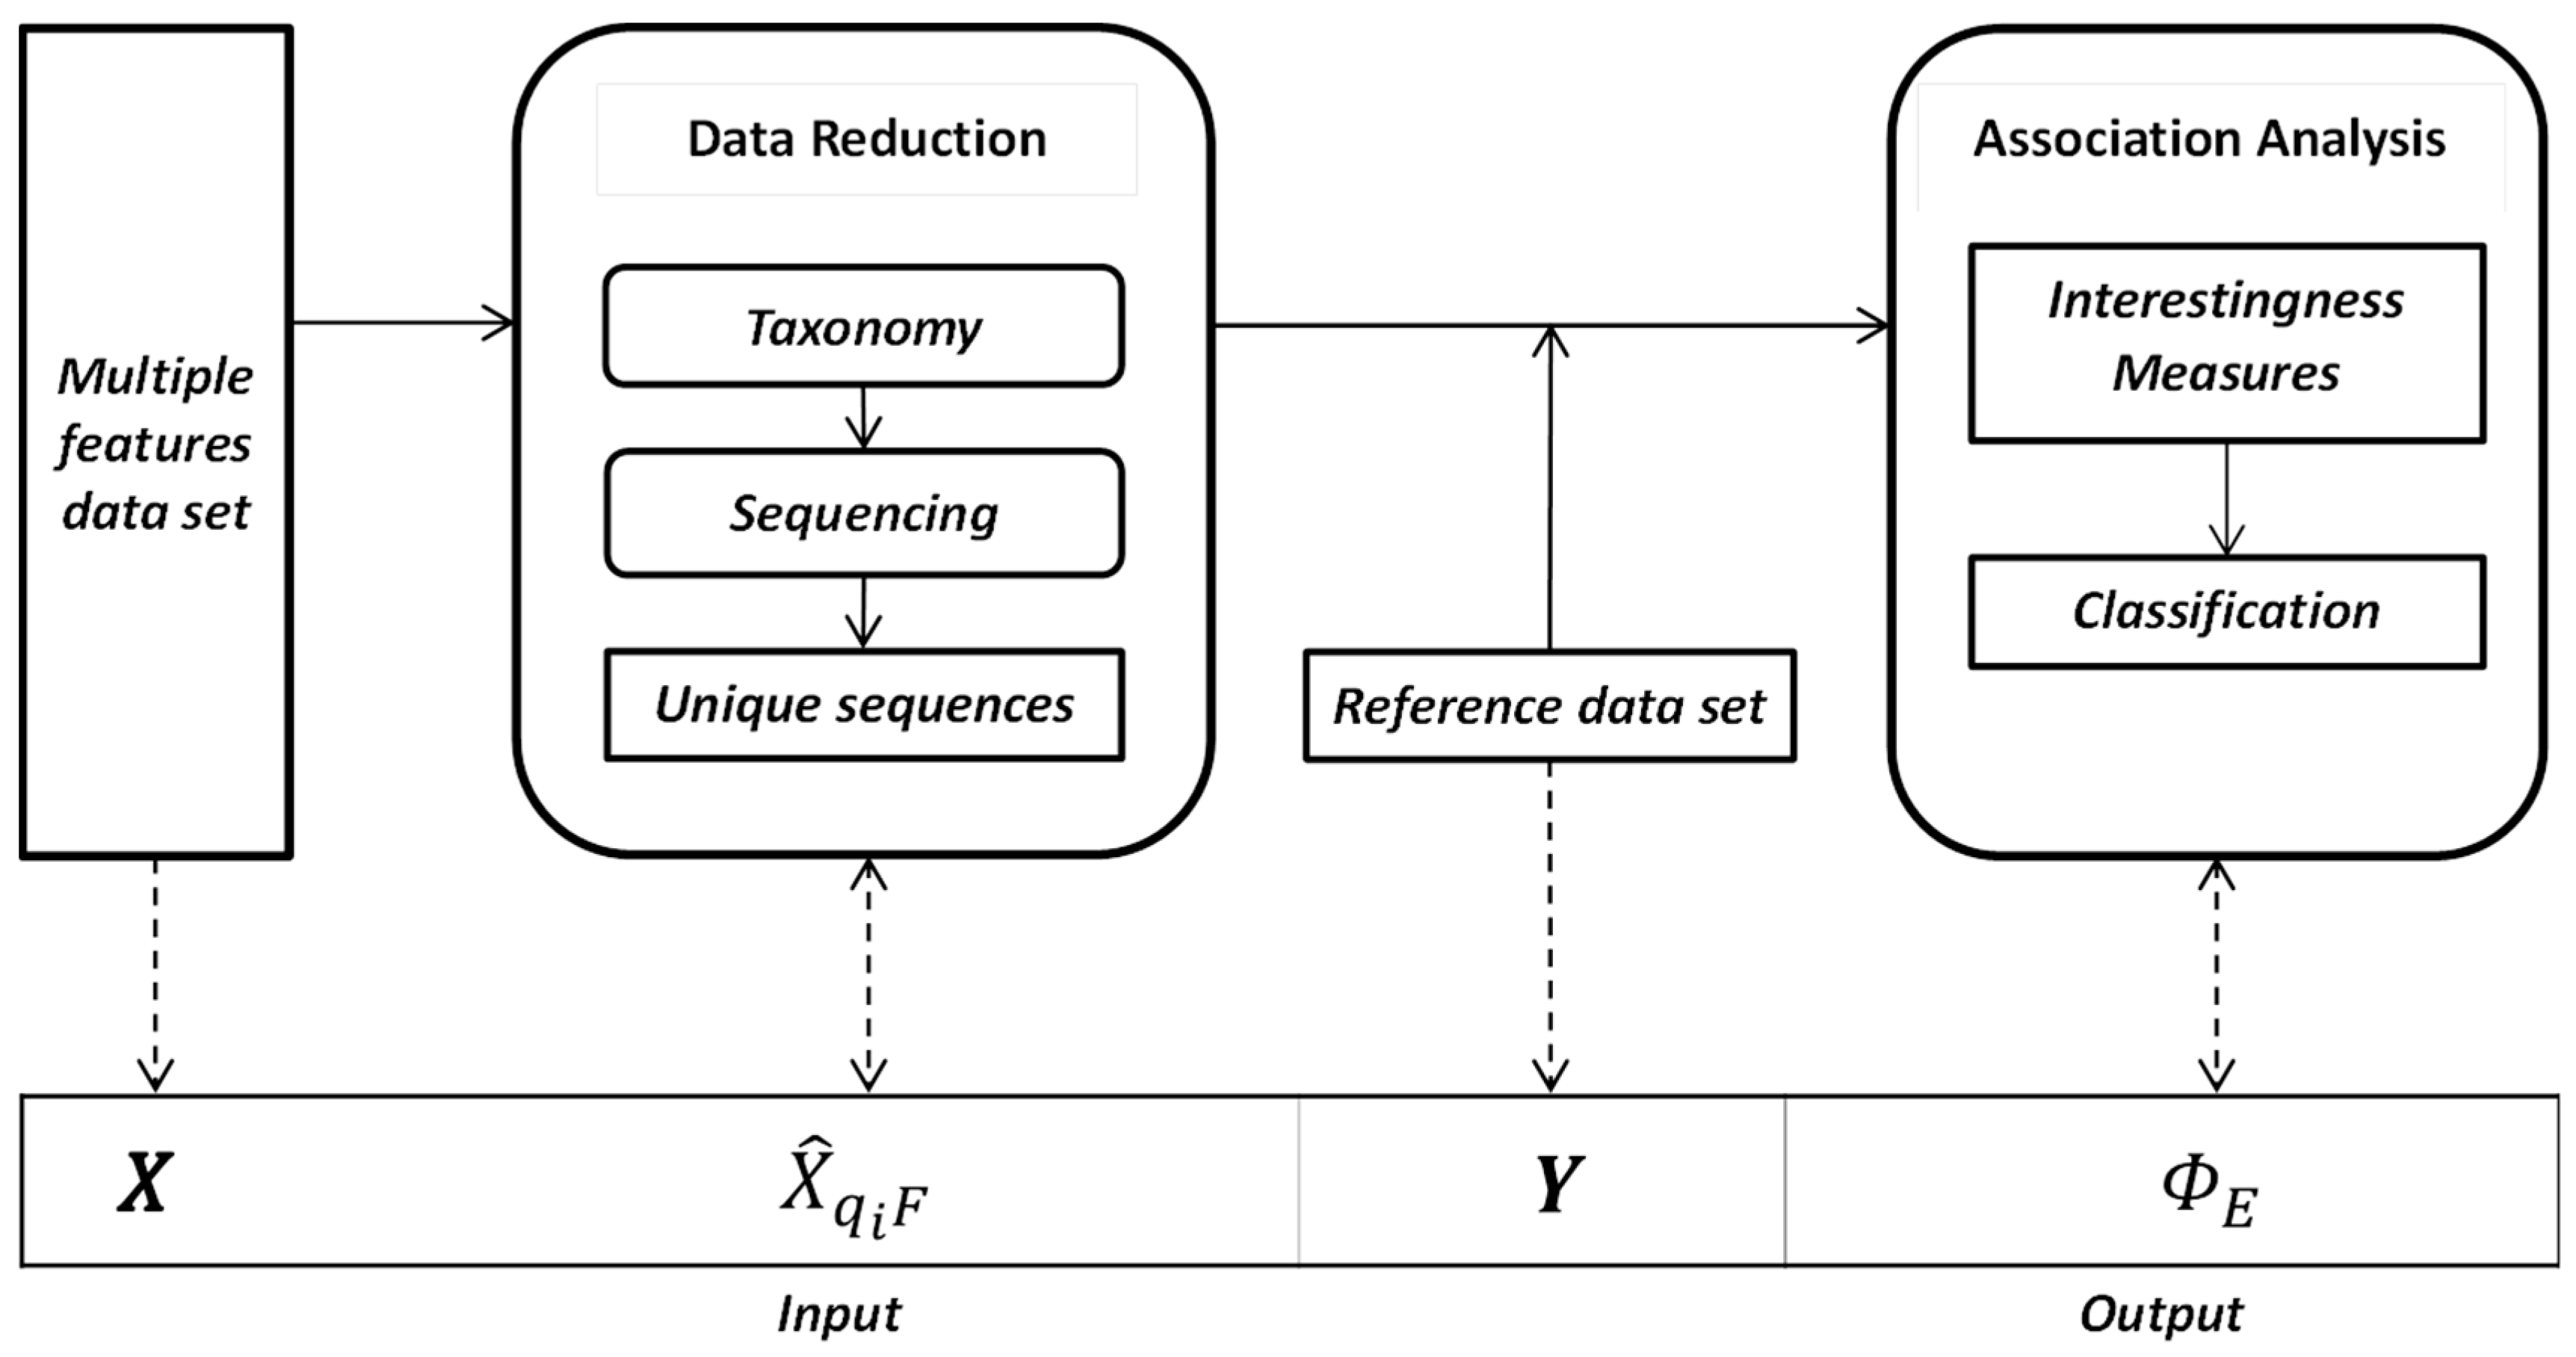
The main steps of the method are data reduction and association analysis. The flowchart diagram with the processing steps implied by the SML method is shown in
Figure 1. For our example, the attributes (features) of the input data set are spectral and textural descriptors of a high resolution satellite image. The pre-processing stage for data reduction consists of three main phases. The first one implies the generation of a taxonomy (
i.e., quantization of numerical values in our case), the second phase constructs the data sequences while during the last phase, the unique sequences are identified and their frequencies of occurrence are calculated. The results of the input data reduction stage, the unique data sequences (
), are used in the following association analysis step. The coarse resolution reference data set originating from available high abstraction semantic layers (
Y) is also needed in the association analysis step where the calculation of the interestingness measure and the classification are performed.
2.1. Data Reduction
The specific clustering approach for data (re)quantization and data sequencing uses two main criteria. The first criterion comes from the requirement of an objective method—as much as possible independent from assumptions about specific statistical distributions. The second criterion is linked to the necessity of adopting a sparse representation of the input data features and discriminant functions. Such coding allows the compression of the feature space, increasing the computational efficiency for global processing of remote sensing data.
Let be a satellite scene with pixels and F features. The latter can be spectral features—as bands—or derived image features as textural and morphological measurements.
Let be a 2-dimensional data matrix with = number of rows and columns, where and . has the cardinality expressing the number of input data instances.
Let be the set of all the unique data instances of with having as cardinality . This magnitude depends on the specific number of symbols used to encode the values and on the number of features.
The average support of
can be estimated as
. The
influences the generalization and computational performances of the SML classifier and thus it must be controlled. Assuming as given the number of features
, the control of
is achieved by controlling the number of symbols used to encode
by quantization. Several quantization or re-discretization approaches including uniform, adaptive and statistical approaches may be found in literature as reviewed by [
20]. In the method presented in this manuscript, a uniform quantization approach was implemented, with the quantized data instances defined as:
with
qi =
max(
)/
si and
i = 1, …,
F.
Accordingly, the respective quantized unique data sequences are denoted by
The quantization parameter
is empirically determined by choosing a value so that
is in the range of 10
2–10
3. These
orders of magnitude were tested as satisfactory for classification exercises incorporating noisy reference sets, with noise characteristics similar to the ones experimented in [
17].
2.2. Association Analysis
Association analysis is used to search for relevant, systematic relationships between image data instances and spatial information encoded in a selected reference set containing class memberships.
Let
be a set of
distinct attributes (in Association Analysis context, the term “attribute” has been established in place of the term “feature”; in our framework these two concepts are used interchangeably. For any two disjoint attribute-value subsets
and
of
, the patterns of the form
are called association rules. The attribute-value sets
and
are named antecedent and consequent of the association rule, respectively. In the associative classification framework started by [
21], the class association rules are the association rules with a class label attribute as the only consequent (
X = {
A\C} and
Y =
, where
C is the attribute set containing the class labels).
The SML method consists in using association analysis to quantify the association between multi-attribute unique data sequences and available high-abstraction semantic reference layers .
The method quantifies the associations using an index inspired by the family of probability-based objective interestingness measures [
22,
23], namely the Evidence-based Normalized Differential Index (ENDI). This measure scores the data sequences in
according to the number of their occurrences in each reference class in
. Finally, using discriminant thresholds determined through the analysis of the cumulative distribution of these scores, the classification results are obtained.
Different variations of the ENDI measure, noted
, exist and several discriminant thresholds can be applied on each of these variations leading to different classification results. Five automatic discriminant thresholds were tested in [
17] (no data values are excluded from the calculations):
with threshold values given by
where
are the values of the cumulative sum over the quantized values of
,
and
, for
l = 0,…, 4. Particularly, for the case of
l = 0, the “>” operator becomes “≥”.
In [
17,
24], an extensive experiment involving a combination of three variations of the ENDI measure and the five threshold values (15 combinations) was proposed to rank the classification outputs in terms of error rates (omission and commission errors). The authors found that a good measure, providing balanced error rates, is the one defined as follows:
with:
where
and
are the frequencies of the joint occurrences among
data instances and the positive and negative reference instances respectively (
and
);
and
represent the empirical probabilities calculated as
;
;
and
denote the total of the positive and negative elements of the reference set, respectively.
The
has values ranging between [−1, +1]. The best threshold according to the tests performed in [
18], is an unsupervised threshold at zero level, which results in a more balanced behavior of commission and omission errors.
An extensive benchmarking exercise to assess both the computational complexity of the SML classifier and its robustness against different types and levels of noise ingested in the reference set was implemented in [
17,
24]. These issues often appear when learning is guided by low resolution or low quality reference sets. Seven supervised classifiers used in the statistical learning and data mining community were considered for comparison: Maximum Likelihood, Logistic regression, Linear Discriminant Analysis, Naive Bayes, Decision Tree, Random Forest and Support Vector Machines. The analysis showed that the SML classifier outperforms other parametric and non-parametric classifiers both in terms of computational efficiency and accuracy, especially if applied in the following operative conditions: (i) ill-defined and spectrally heterogeneous target classes (as built-up areas); (ii) large input data with heterogeneous characteristics (including lack of seasonal standardization and/or radiometric calibration); and (iii) noisy reference set (scale generalization noise, displacement and spatial misalignment error noise, and thematic random noise).
3. Application of the SML Classifier to Sentinel-2
The new classification method briefly described above has been successfully applied to solve the first global processing of Landsat data records and monitoring the evolution of human settlements over the past 40 years [
18]. The prospect of deploying the system to the classification of Sentinel-2 imagery is a pressing technological issue that requires a series of tests to analyze the suitability of this new sensor data for global mapping of human settlements.
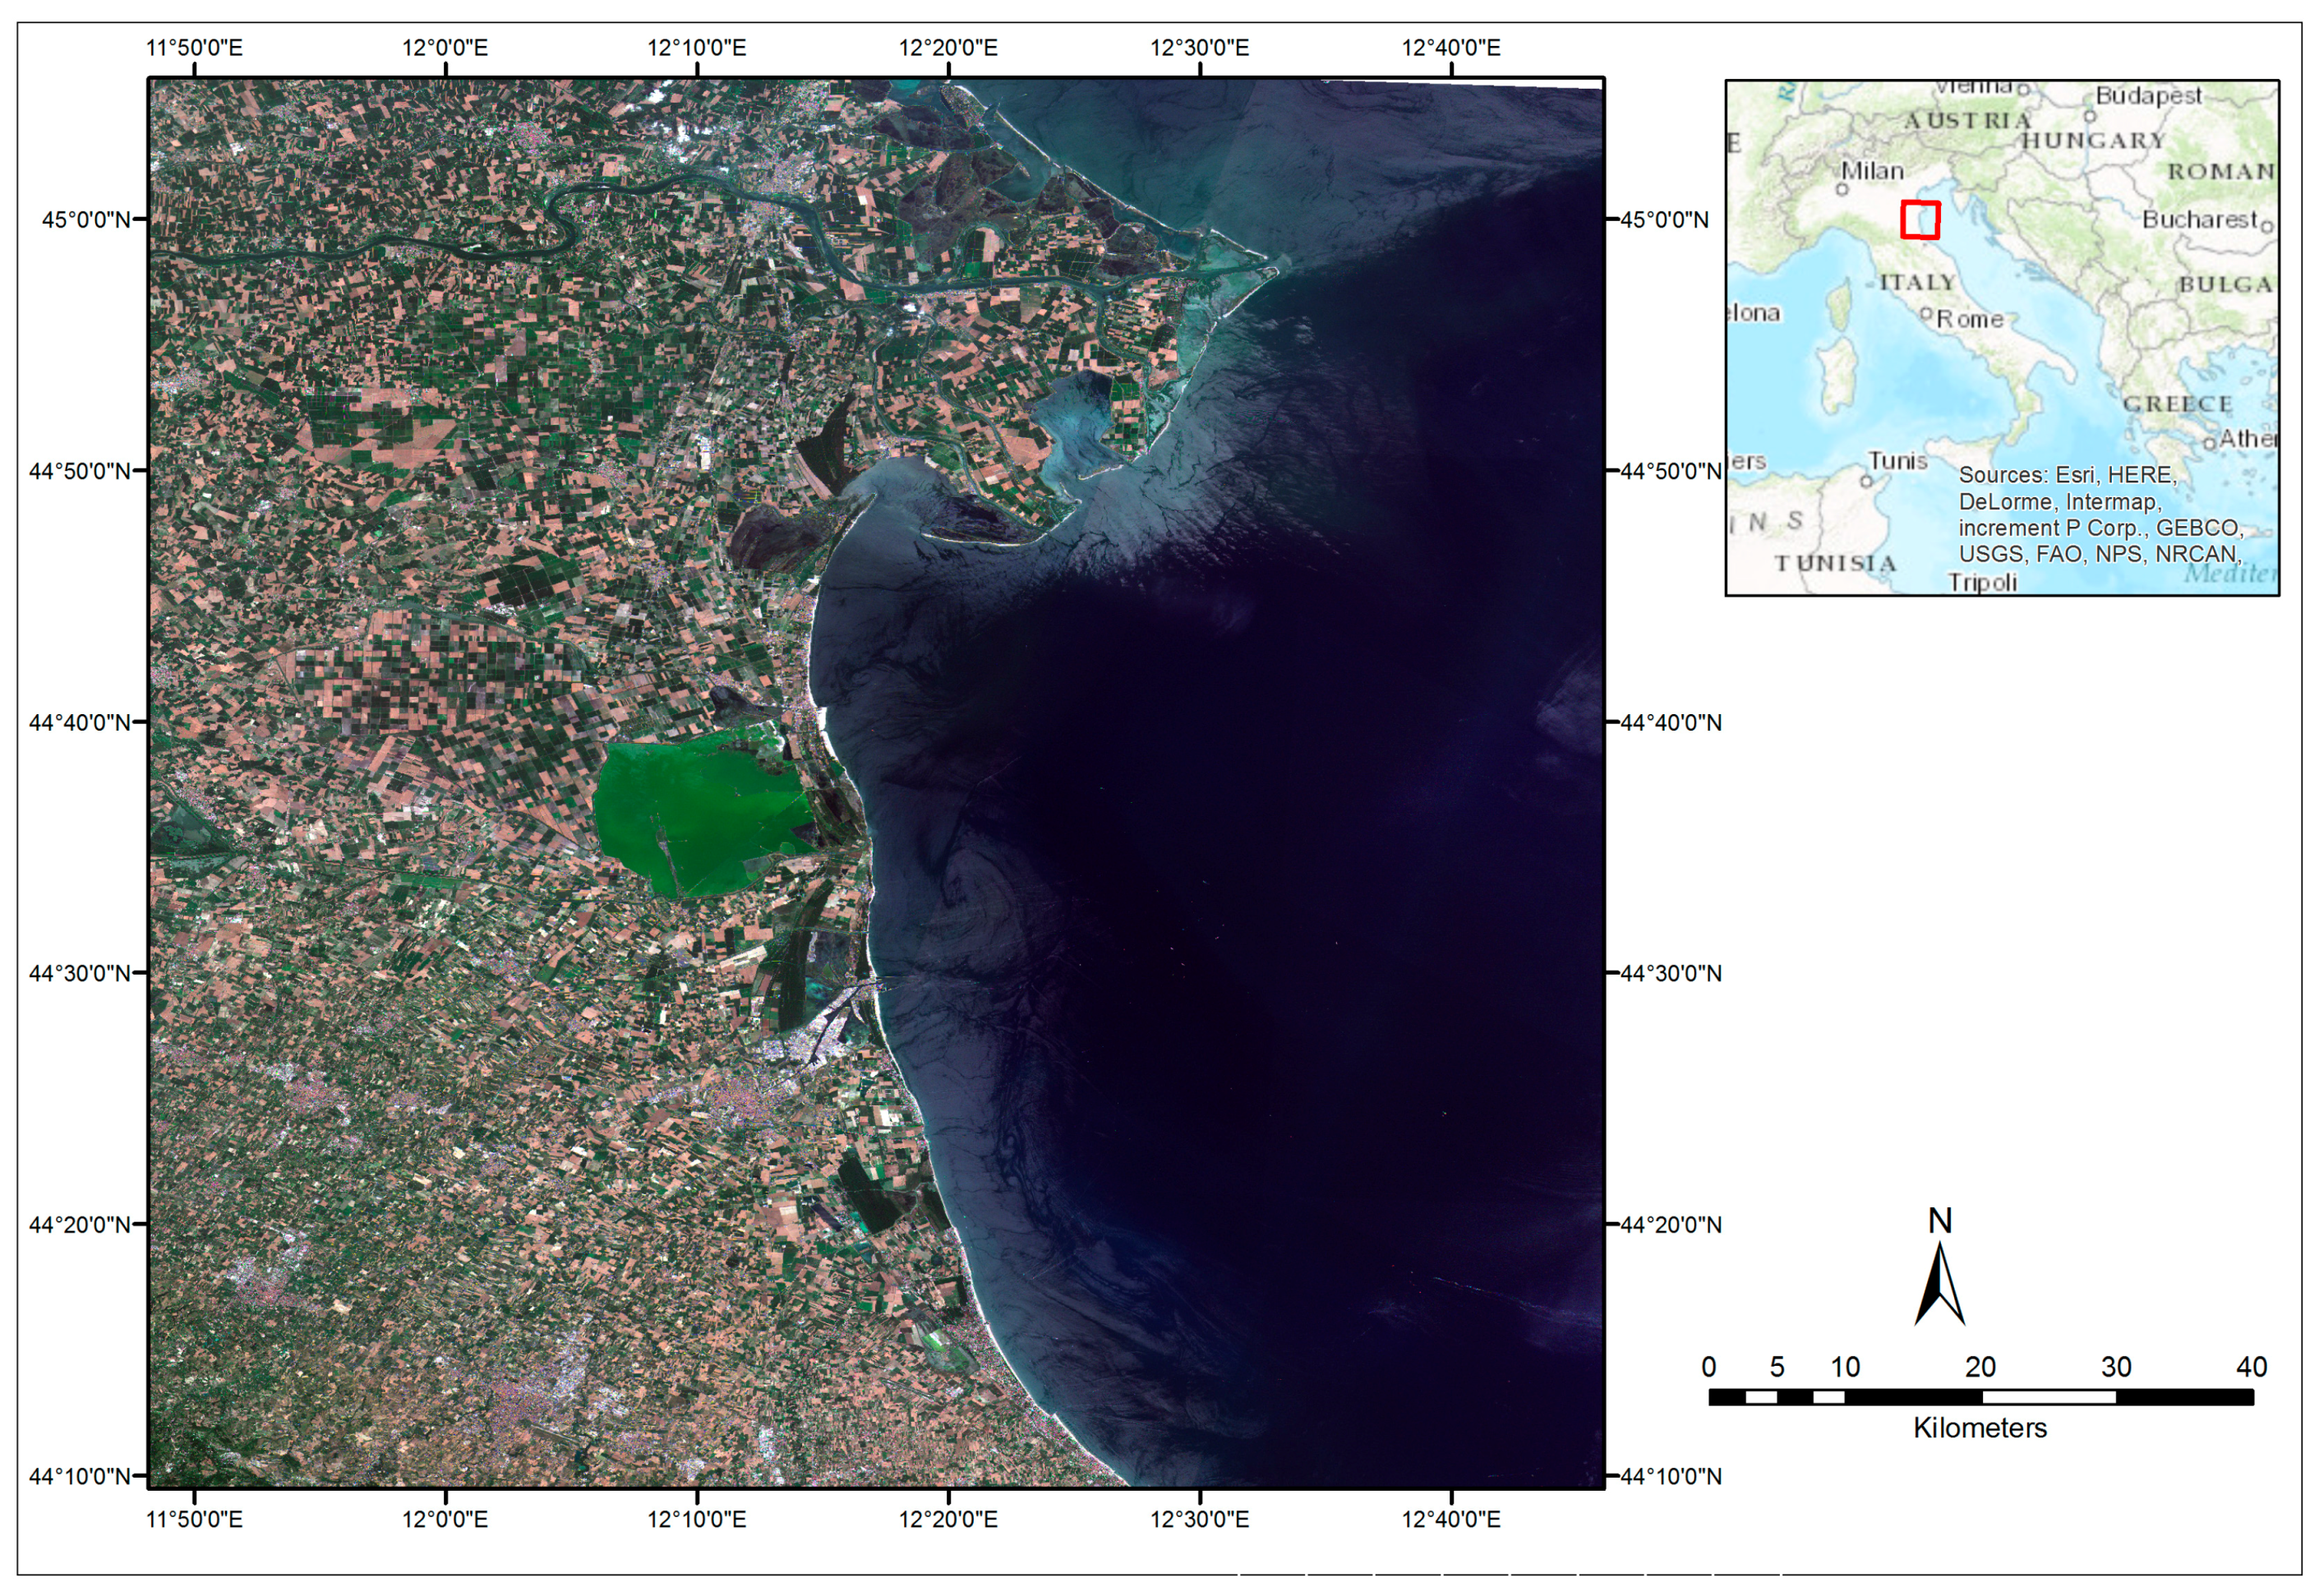
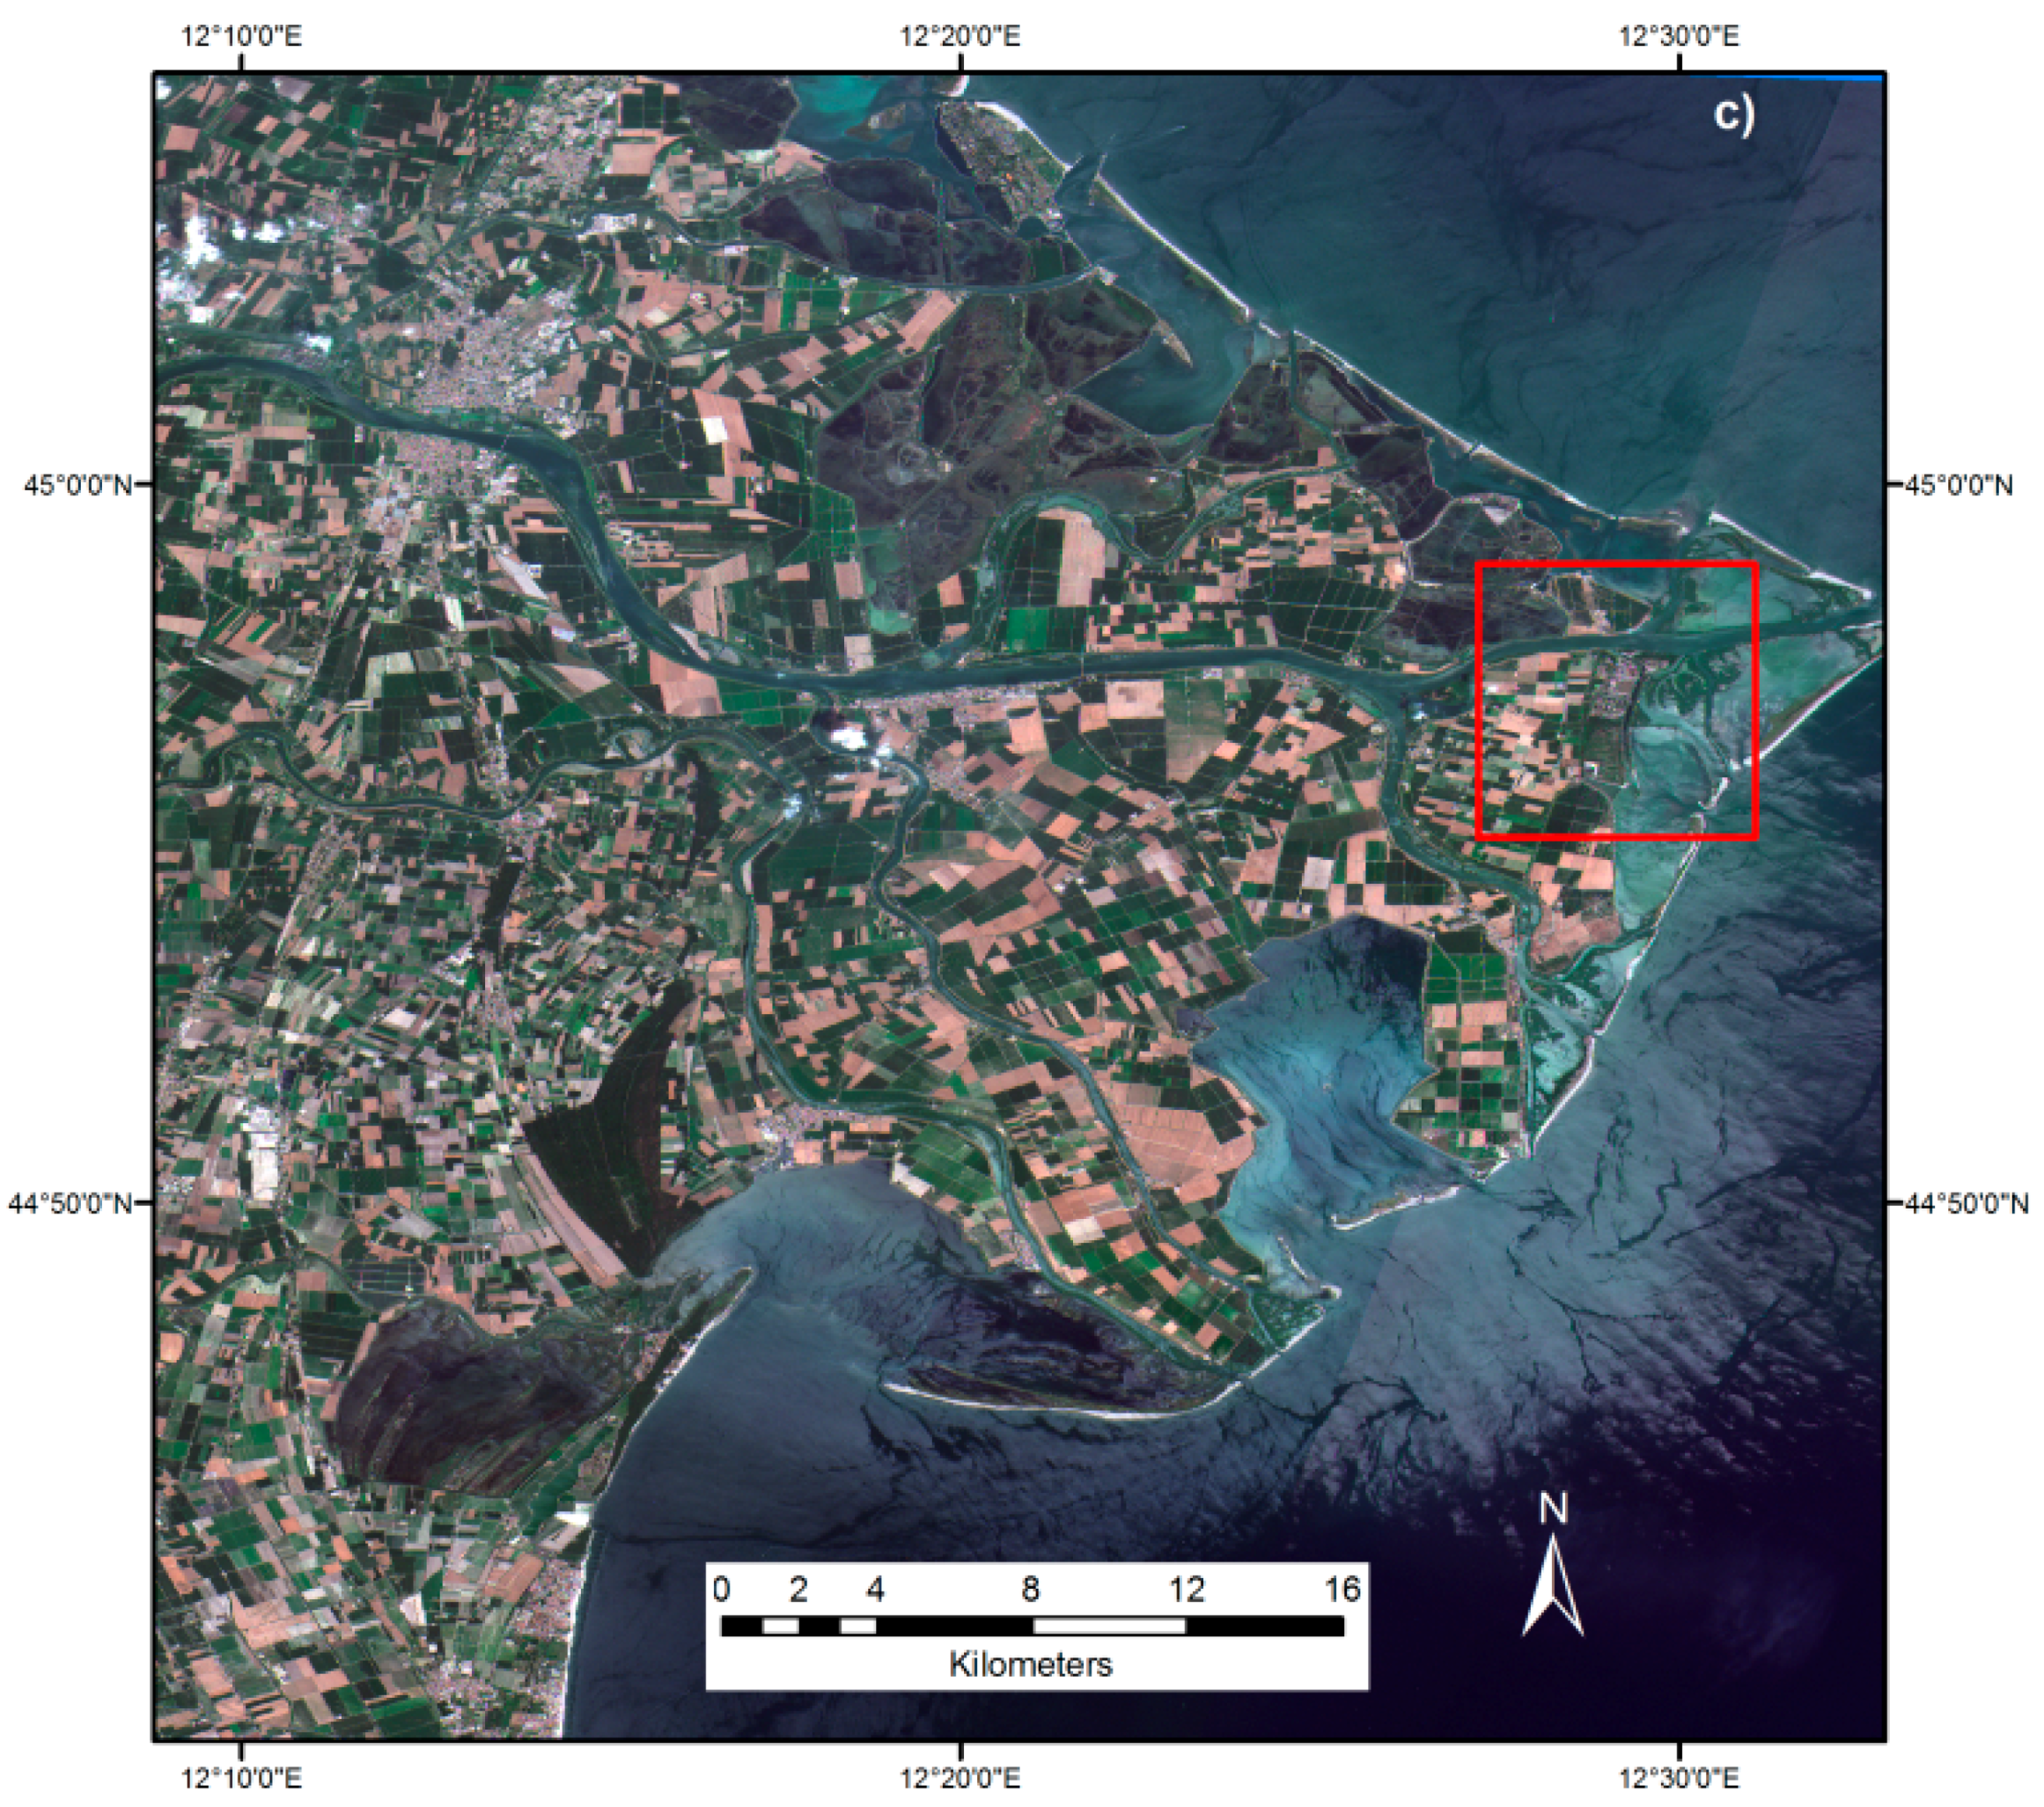
In this section, a preliminary test has been implemented with the purpose of: (i) assessing the applicability of the SML classifier to Sentinel-2 imagery; (ii) evaluating the complementarity of Sentinel-1 and Sentinel-2; and (iii) understanding the added-value of Sentinel-2 with respect to Landsat for the improvement of the global high-resolution human settlement mapping. For this experiment, a Sentinel-2 scene covering the city of Porto Viro in the area of the Po river delta, northeast of Italy was used. The study area combines both highly populated settlements and large agricultural plains with many small scattered built-up areas. The image acquired on 8 July 2015 was provided as part of the first pre-qualified expert user data released by the European Space Agency (ESA). The subset shown in
Figure 2 covers an area of 110 × 110 km
2.
This test was designed to exploit the key feature of Sentinel-2 imagery, which is the availability of four 10 m spatial resolution bands: B2 (490 nm), B3 (560 nm), B4 (665 nm) and B8 (842 nm). The data were taken as delivered without trying to compensate for any problems that may still exist in this very pre-operational dataset (e.g., geometrical precision, coarse atmospheric corrections, and sensor geometry).
3.1. Input Features
The standard set of image features used in the GHSL production workflow [
18] includes radiometric, textural and multi-scale morphological descriptors. In the example reported here, only the first two were used as input to the SML classifier because they represent a good compromise between computational cost and accuracy. Besides, the morphological descriptors are mostly used with finer scale input sensors typically in the range of 0.5–2.5 m and were considered less relevant with the 10-m-resolution Sentinel-2 data. The following features were finally used for the classification of the Sentinel-2 image with the SML approach.
- -
Spectral features: Only the four input spectral bands at 10 m resolution, namely B2, B3, B4 and B8, were tested in this experiment for their potential in discriminating different land cover classes.
- -
Textural features: Several studies have demonstrated the utility of the textural measures for land cover mapping and in particular for built-up area extraction [
25,
26]. “The inclusion of one-band texture may not take full advantage of the available texture information contained in the multispectral image. By contrast, multi-band texture measures, derived from all available spectral bands of a multispectral image [
27], allow identifying the spatial variation of multiple bands, thus avoiding the need to select a single band as required in the traditional one-band texture method” [
25]. Therefore, the textural analysis was made on the four input bands by applying anisotropic rotation-invariant contrast textural measures extracted using the grey-level co-occurrence matrix (GLCM) and the Pantex methodology of Pesaresi
et al. [
28]. The applied operative parameters were a window size of 5 × 5 pixels (50 × 50 m) and a displacement vector distance of 1 pixel with 8 directions.
All eight features were quantized in
levels,
based on the quantization-sequencing approach described in
Section 2 using the quantization parameter
q = 4096 (Equation (1)). The number of resulting unique sequences (
) in the image under test was 38,762.
3.2. Learning Set
The basic information components of the SML automatic image information extraction workflow are clouds, water, and built-up areas [
18]. In the test reported here, only the water/land and the built-up/non-built-up semantics are considered. The reference set used for the example was extracted from Corine Land Cover (CLC) product of year 2006 (Copernicus Land Monitoring Services,
http://land.copernicus.eu/pan-european/corine-land-cover/clc-2006/) used in the gridded version at 100 meter resolution. The positive examples of the target class “water” were extracted from the CLC classes 5.1 and 5.2, corresponding to inland and marine waters, respectively. The positive examples for the “built-up” class were extracted from the CLC classes of continuous urban fabric (code 1.1.1), discontinuous urban fabric (code 1.1.2), and industrial or commercial units (code 1.2.1). The CLC reference set can be considered as affected by thematic and spatiotemporal noise as regarding the target classes in the Sentinel-2 image. A time gap of nine years (2006 for the CLC and 2015 for the Sentinel-2 data) and a scale/generalization gap (a spatial resolution of 100 m for CLC size
versus 10 m for Sentinel-2) can be assumed between the image data and the CLC data. Moreover, semantic differences may exist between the two datasets: for example, code 1.1.2 of CLC corresponding to discontinuous urban fabric includes large non built-up surfaces like vegetated areas and bare soils that are captured by the spatial resolution of Sentinel-2. Similarly, some of the CLC classes may include surface water, even if they are not included in the positive examples of the “water” class (e.g., the wetlands class of CLC).
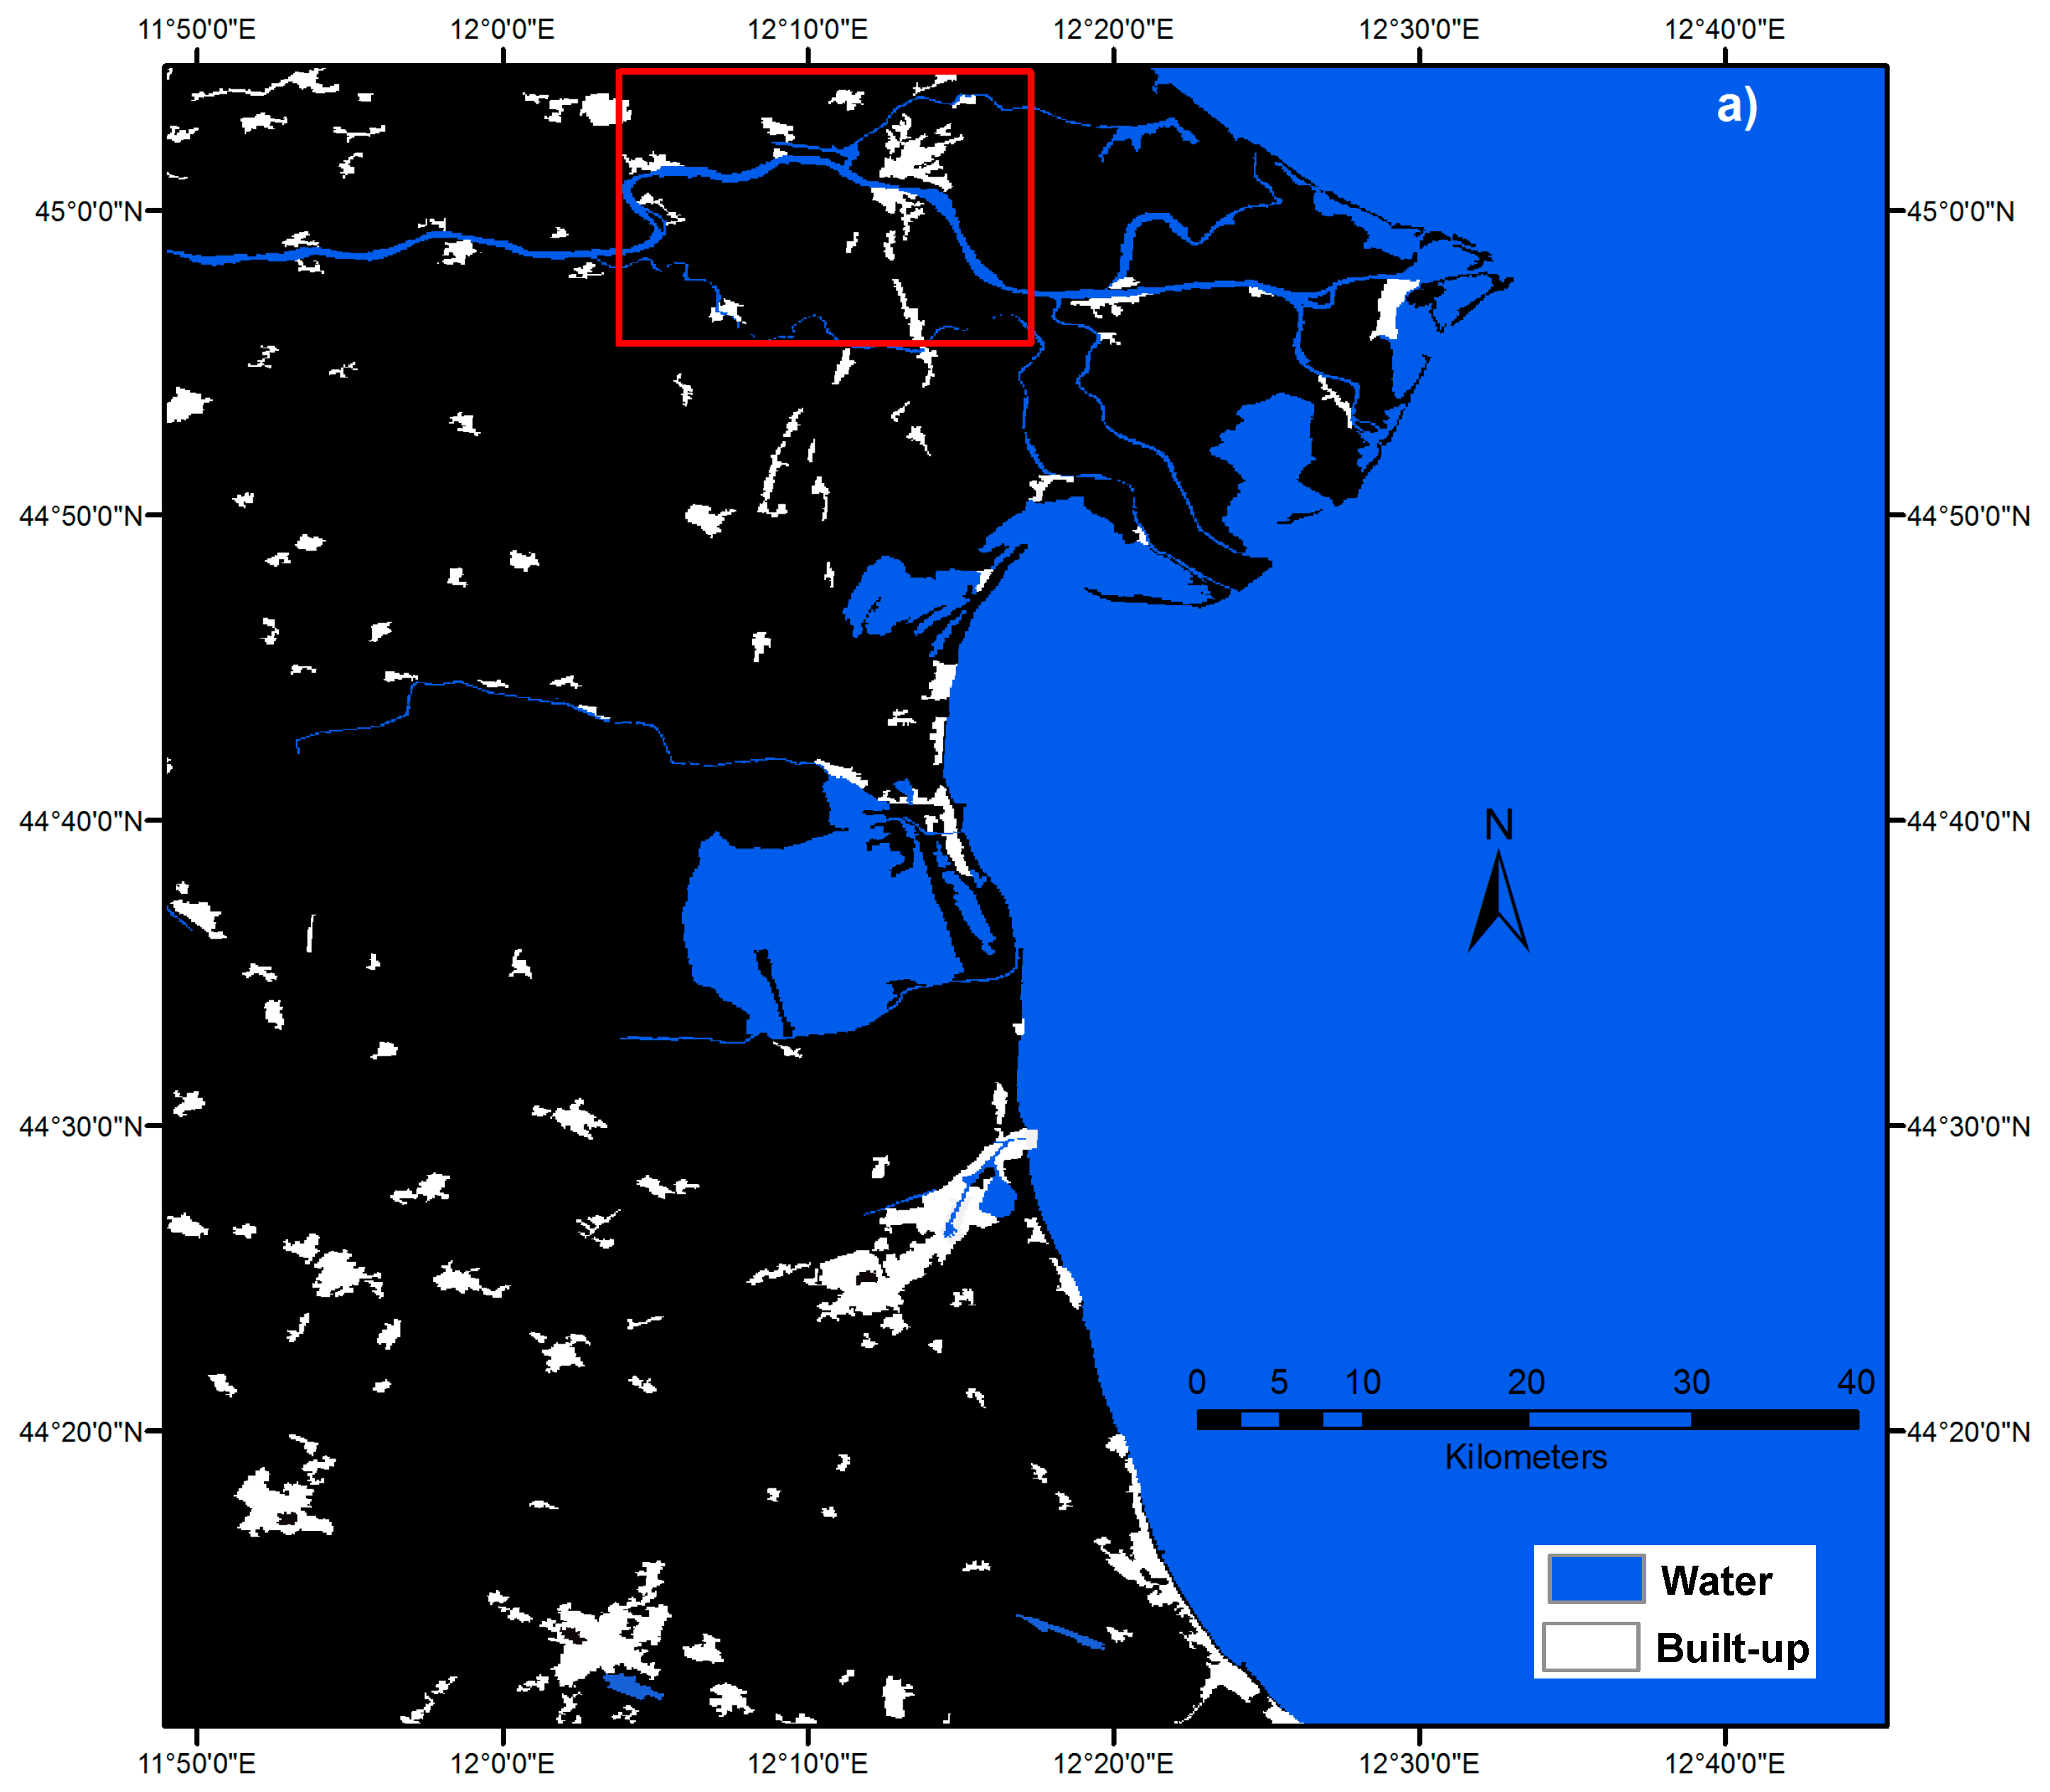
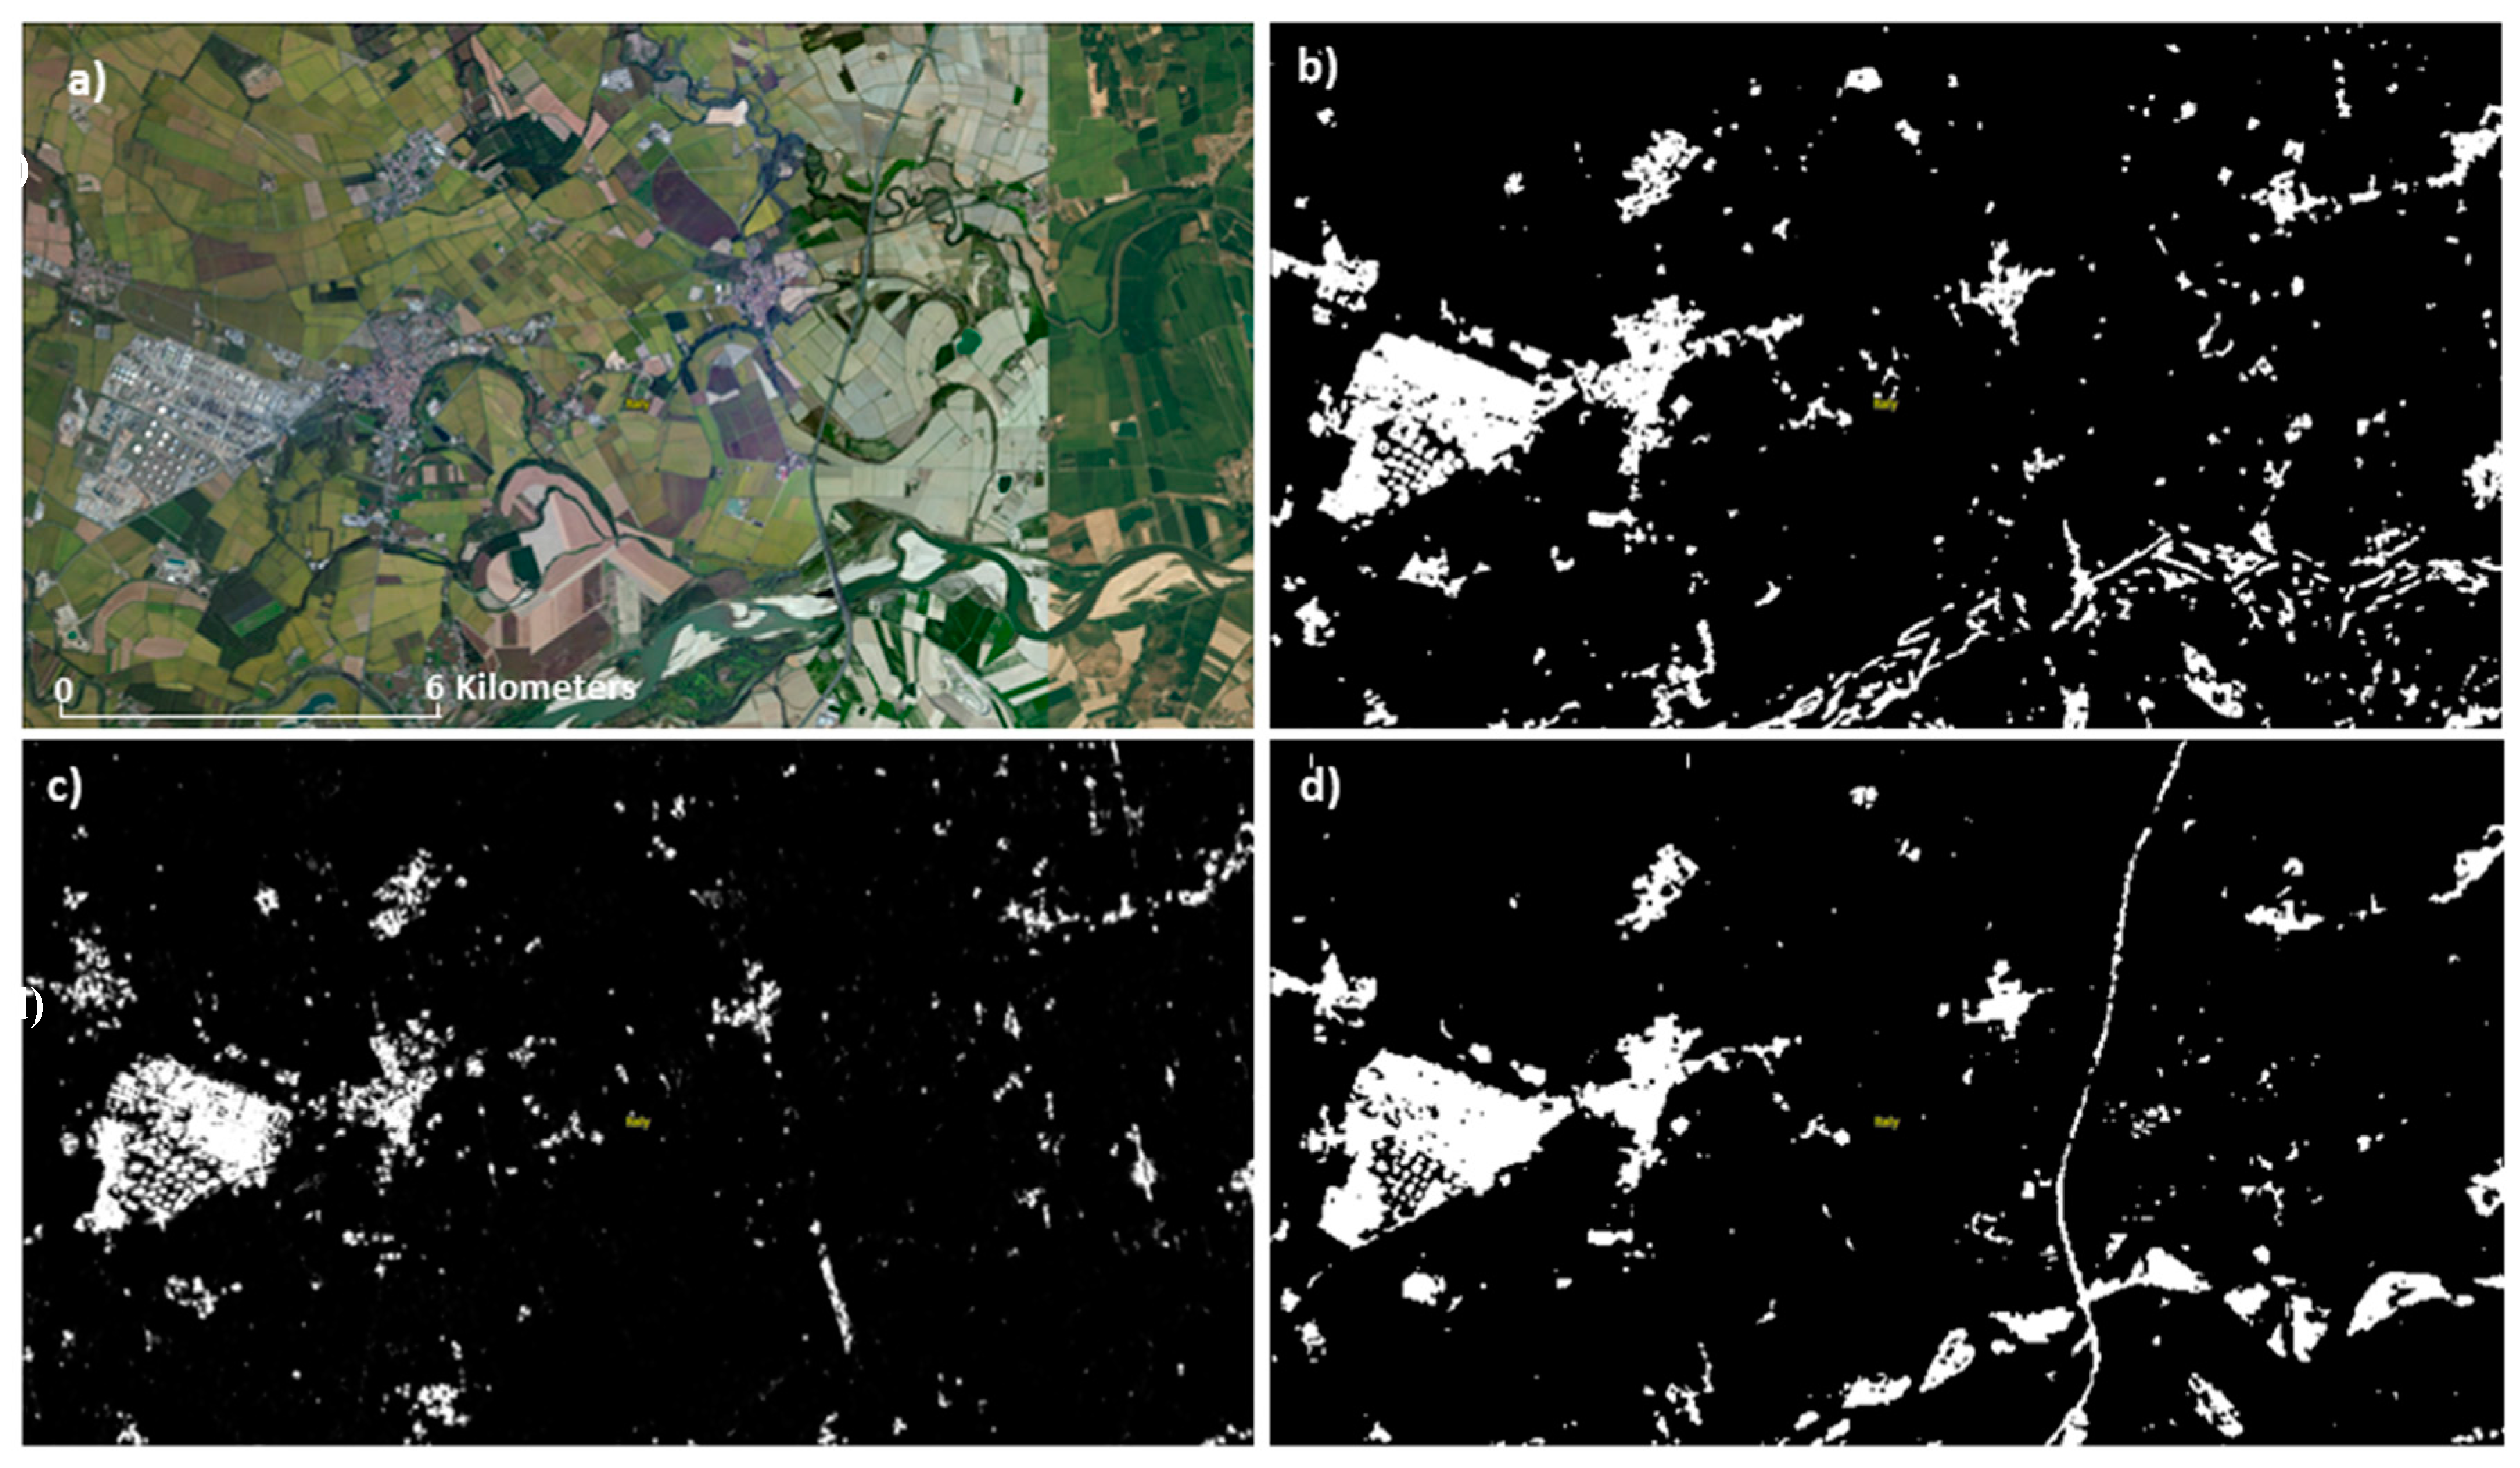
The reference set used for the example is shown in
Figure 3a. The positive examples for the built-up and water target classes, respectively, as extracted from the CLC source, are represented in white and blue.
3.3. Results and Accuracy Assessment
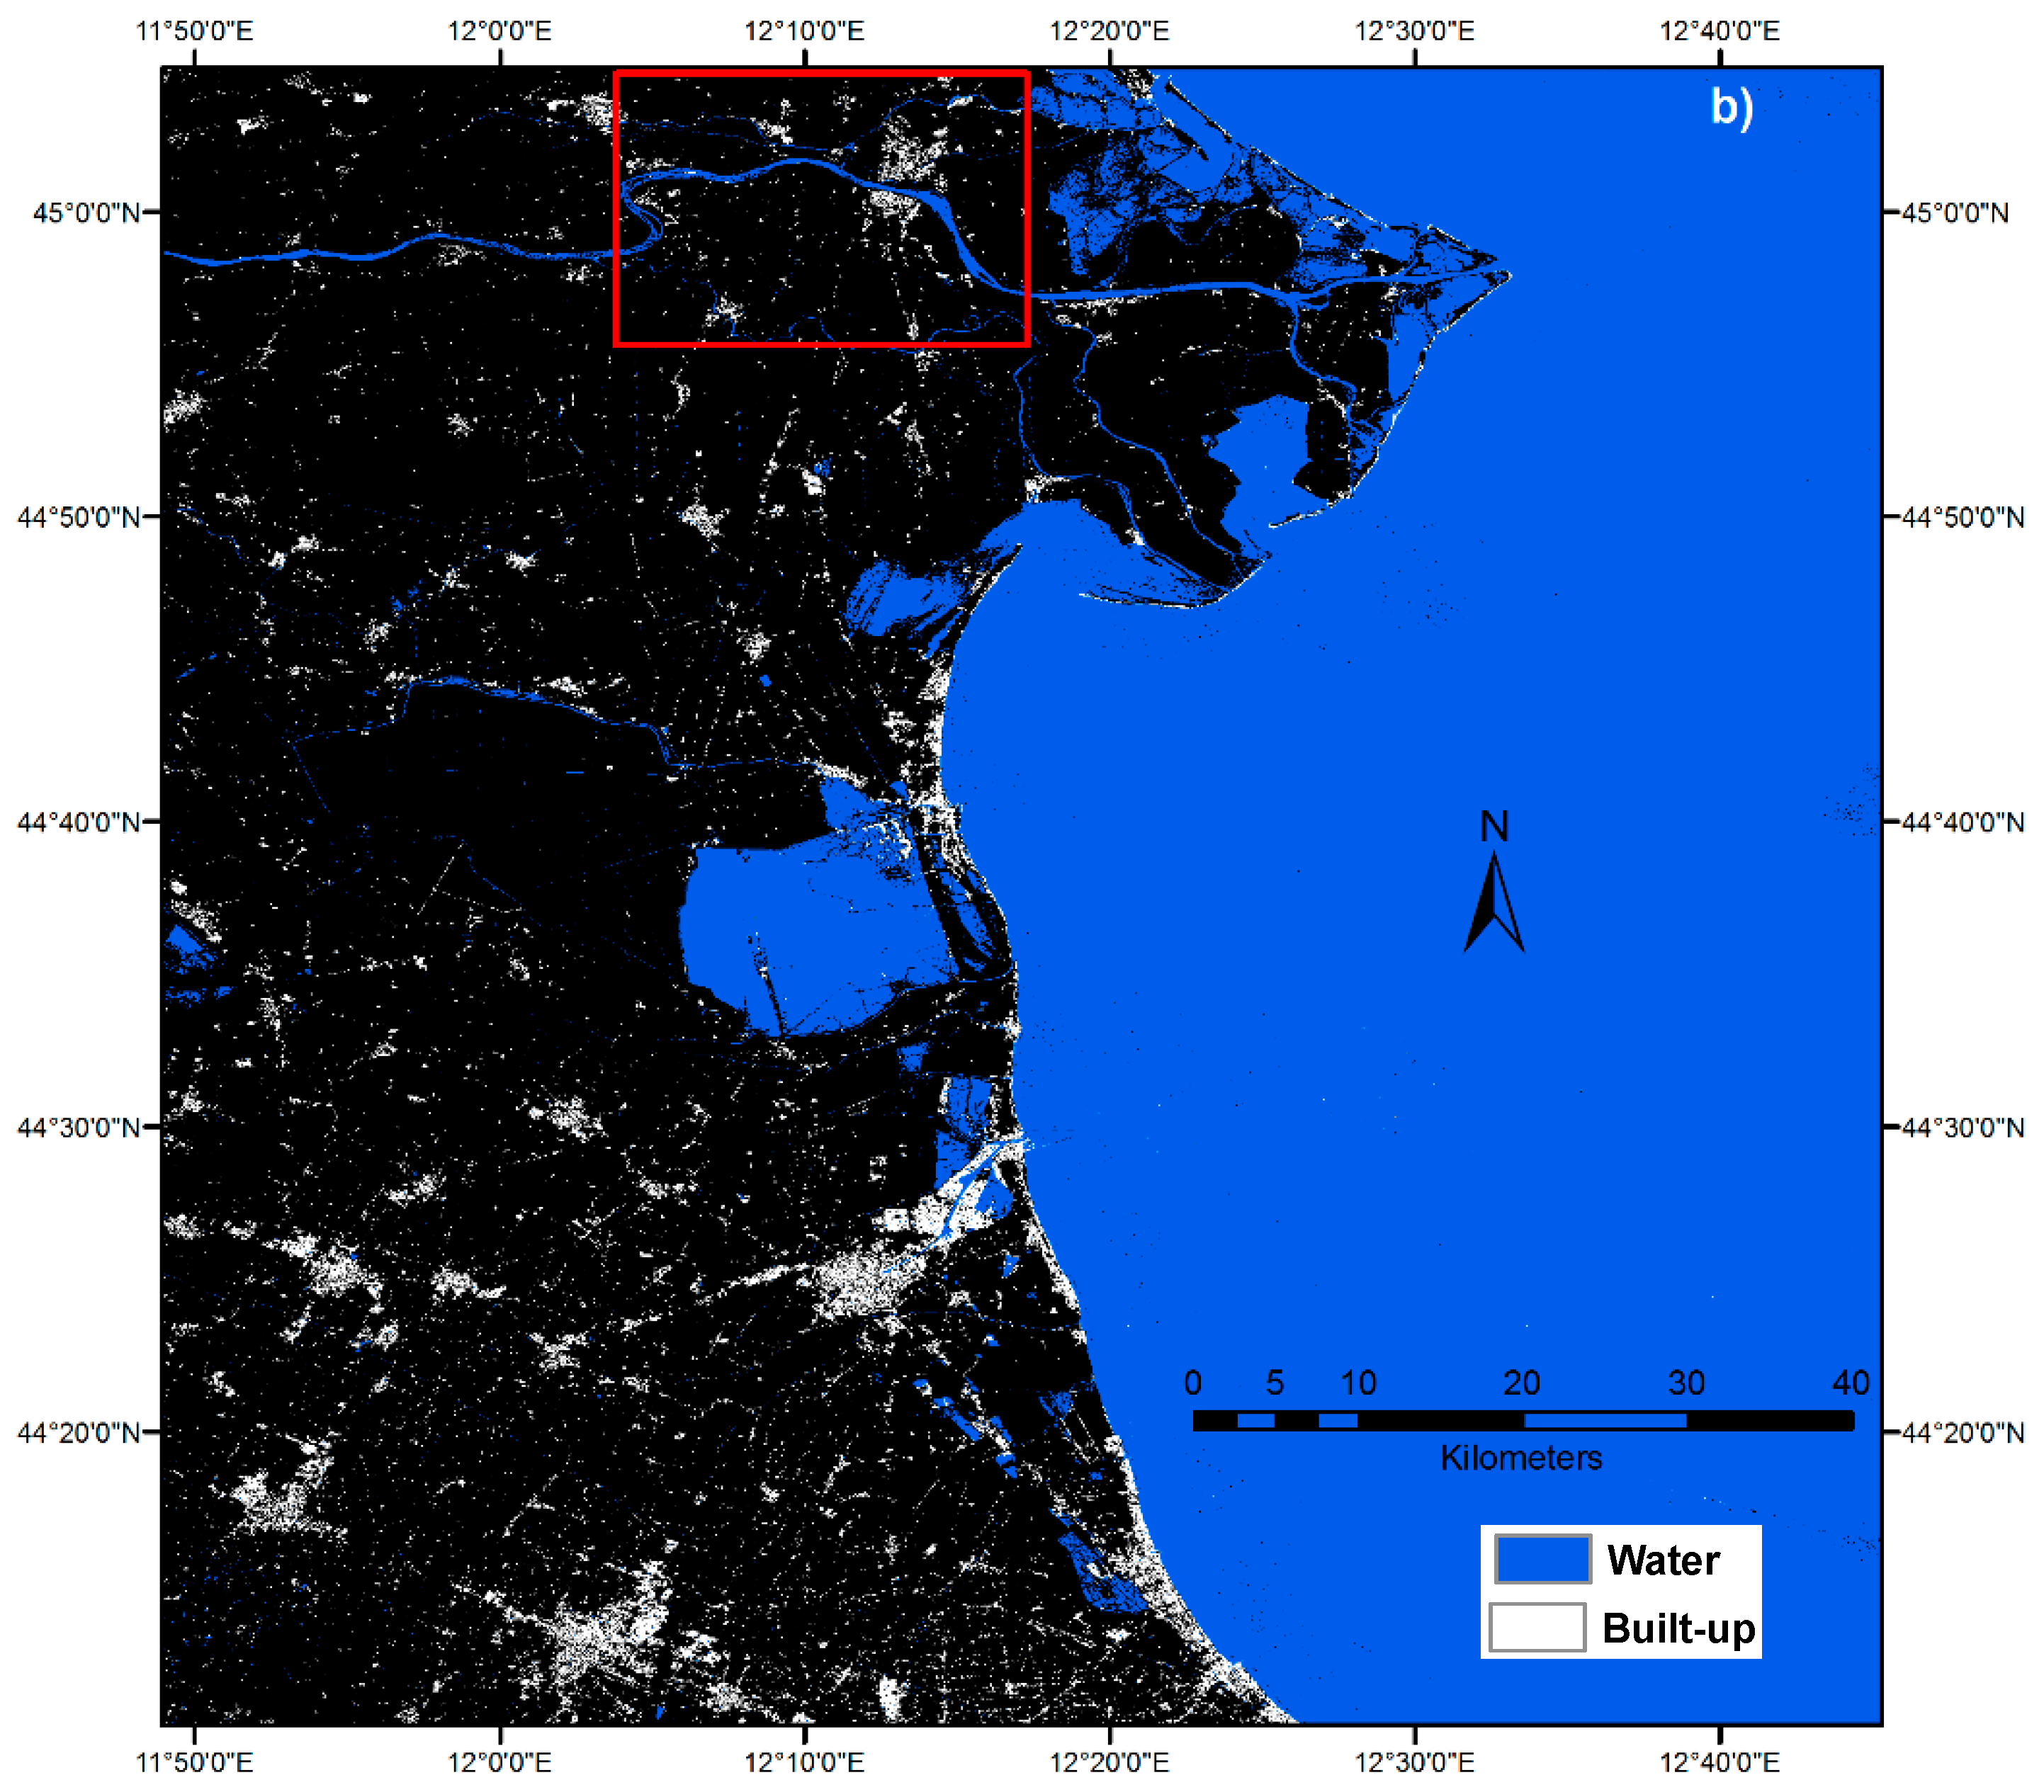
Figure 3b shows the results of the SML classifier applied to Sentinel-2 data. The class corresponding to built-up areas is displayed in white and the water is shown in blue. The visual inspection of the results of the classification shows a noticeable increase of detail with respect to the thematic information of the CLC reference set
Figure 3a. It is worth noting the SML outputs may significantly contradict the information provided in the reference set if the evidences collected from the image data sufficiently support the decision. In both the built-up and the water examples, important information contradicting the reference set was discovered: in the built-up case scattered settlement structures were discovered even if neglected by the reference, while, in the water case, a large water surface (red rectangle) was classified accordingly by the SML association analysis. This area (red rectangle) corresponds to salt marshes according to CLC data but was not included in the reference set for the “water” class. Moreover, thin water channels and small water bodies are classified as well. Analogously to the built-up case, these thin structures are the added-value provided by the higher spatial resolution of the image data with respect to the reference set.
In addition to the refined classification of the built-up areas and water surfaces, the analysis of Sentinel-2 with the SML classifiers reveals some disagreements with the CLC data. A close-up view of the upper right part (
Figure 4) shows that the SML classifier correctly identifies the built-up industrial area (red rectangle) where the CLC dataset shows a much larger area as industrial including non-built-up features. However, misclassification errors were observed along the coastal areas where the sand dunes were detected in the built-up class because of similar spectral characteristics in the Sentinel-2 data.
The accuracy of the SML classification is evaluated for the built-up target class using visual interpretation of 446 random samples equally distributed in the built-up and non-built-up areas from the training set. The accuracy of the water class was not assessed in this test.
Table 1 shows the main results of the accuracy assessment. Following the considerations of [
18], the reporting of quantitative accuracy metrics is based on the error matrix.
The overall accuracy represents the share of all correctly classified sample units of the entire error matrix. The Kappa coefficient, introduced by [
29], presents a discrete multivariate technique commonly used in accuracy assessment to statistically test if classifications are significantly different from the reference data, being a chance corrected renormalized form of accuracy. Nevertheless, this very popular measure has one weakness when dealing with imbalanced datasets, as it proves to be the case of built-up classification where very few positive examples compared to the ones of non-built-up class exist. In such situations, bias and prevalence effects preclude right judgments by Kappa values. Consequently, we also use two quality measures that are skew-insensitive, thus better controlling inflated performance estimates on imbalanced datasets. The first one is the balanced accuracy (BA) from [
30] and it corresponds to the Area Under the Curve from the Receiver-Operating Characteristic (ROC) analysis (Equation (7)). The second one is the Informedness [
31] (Equation (8)), which can be viewed as an unbiased renormalized form of recall (True Positive Rate—TPR). The measure can be directly expressed as the probability that an informed decision is made rather than a random guess (chance), as stated by [
31].
With the usual terms from the binary confusion matrix:
TPR = True positive rate (
TP/P);
TNR = True negative rate (
TN/N);
FPR = False positive rate (
FP/N);
TP = True Positive;
TN = True Negative;
FP = False Positive;
P = Positive instances; and
N = Negative instances. The accuracy measures were all calculated after applying the bias-adjustment for stratified random sampling proposed by Card [
32].
Table 1 summarizes the accuracy measures: the balanced accuracy reaches 81%, the Informedness value, which is more robust to skewed distributions, is also satisfactory and the omission error is low. However the classification resulted in high commission errors. These errors can be mainly observed in coastal areas (rocky shorelines or sand dunes) or artificial open spaces and bare ground. Omission errors are essentially related to scattered and isolated buildings that were difficult to detect on the Sentinel-2 data due to their average size, which is smaller than the typical side dimension ranging from 10 to 20 m [
33].
5. Discussion
The recent availability of Sentinel-2 data is expected to bring land cover mapping and monitoring to an unprecedented level. Among the main advantages of Sentinel-2, which make the satellite highly suitable for mapping and monitoring human settlements at a global level, it is the combination of the wide swath and the frequent revisiting time (currently 10 days with one satellite, and every five days once Sentinel-2B is in orbit) at high spatial resolutions. The Sentinel-2 mission establishes a key European source of data to the Copernicus environmental monitoring program. The sensor will not only enhance the earth observation data archive but it will also deliver new capabilities for mapping built-up areas at a global level.
The experiments presented in this paper demonstrate the added-value of Sentinel-2 for mapping built-up areas at a higher spatial resolution than the Landsat-derived GHSL product. The spectral confusions with other land cover classes observed in the Landsat-derived GHSL product were partially alleviated using Sentinel-2 data, especially for asphalt concrete roads and barren lands in agricultural fields. Despite this improvement, omission errors were observed in the results obtained with Sentinel-2 data (omission rate = 38%). These omissions are strongly inversely correlated to the density of the settlement patterns. Built-up surface associated with rural and scattered low-density settlement patterns are expected to be relatively under-represented. This was also observed in the GHSL product using the Landsat data where the omission rates, assessed with detailed building footprints, were in the order of 50% to 60% [
18]. The capacity to discriminate such spatially scattered settlements is strongly linked to the spatial resolution of the input sensor. With Sentinel-2 data, omission rates tend to decrease, nevertheless single buildings and small settlement patterns surrounded by vegetation may still be difficult to identify, requiring spatial resolutions higher than 5 m.
As shown in this paper, deeper insight into the mapping of human settlements can be gained from the exploitation of the complementarity between Sentinel-1 and Sentinel-2 data. In this paper, Sentinel-1 in Stripmap mode was tested with a spatial resolution of 5 m. This type of imagery is used in exceptional cases only, to support emergency management actions. Additional tests are currently being conducted on Sentinel-1 Interferometric Wide Swath mode, which is the main acquisition mode over land satisfying the requirements for global mapping. These tests would help in the assessment of the added-value of combining Sentinel-1 and Sentinel-2 data for improving the discriminatory ability over that of either sensor alone.
Further experiments are ongoing to consider the possibility of exploiting the Sentinel-2 bands which were not included in the current classifications. The use of the 20 meter bands especially in the Near Infrared and Shortwave Infrared may help in alleviating the problem of confusion between built-up areas and other types of land cover such as artificial open spaces, river gravel and sand dunes. As suggested by [
34], the physical and chemical characteristics of different urban surfaces are represented in all parts of the VIS-NIR-SWIR-TIR with important spectral signatures in the SWIR region. It is therefore necessary to examine the benefit of exploiting both the 10 and 20 meter bands of Sentinel-2 without compromising the ability to detect fine scale human settlements.
6. Conclusions
The application of the SML classifier to Sentinel-2 data is encouraging because of improvements in terms of spatial detail and thematic contents with respect to the Landsat derived product. It also demonstrates the capacity of the SML methodology to handle different sets of input features such as radiometric, textural and morphological descriptors derived from Sentinel-2 data. Among the important characteristics of the SML methodology, there is the possibility to extract other types of land cover other than built-up areas. Due to the symbolic nature of the SML classifier, the methodology can be seamlessly expanded to multi-class classification problems.
New insights into the global mapping of human settlements can be expected by taking advantage of the singularities of the SML classifier and of the rich information content and operational capacities of Sentinel-2 satellites. Several application areas and a wide user community can benefit from the deployment of the SML classifier to the classification of Sentinel-2 imagery as has been demonstrated by the different GHSL applications: population spatial modeling [
35], global exposure mapping [
36], identification of informal human settlements [
37], mapping and monitoring of refugees and internally displaced people [
38,
39], disaster risk reduction [
2] and as a support to damage and needs assessment [
40].
The first results presented in this paper show that opportunities exist to confront the global human settlement challenges thanks to the possibility of mapping built-up areas, their heterogeneities, dynamics and interactions with the environment.


