Article

Remote Sensing of Black Lakes and Using 810 nm Reflectance Peak for Retrieving Water Quality Parameters of Optically Complex Waters

1
Estonian Marine Institute, University of Tartu, Mäealuse 14, 12618 Tallinn, Estonia
2
Evolutionary Biology Centre, Limnology, University of Uppsala, Norbyvägen 18D, 75236 Uppsala, Sweden
3
Laboratoire d’Oceanologie et des Geosciences, Universite de Lille Nord de France, ULCO, 32 Avenue Foch, 62930 Wimereux, France
4
Tartu Observatory, 61602 Tõravere, Tartumaa, Estonia
*
Author to whom correspondence should be addressed.
Remote Sens. 2016, 8(6), 497; https://doi.org/10.3390/rs8060497
Submission received: 11 March 2016 / Revised: 27 May 2016 / Accepted: 7 June 2016 / Published: 14 June 2016
(This article belongs to the Special Issue Water Optics and Water Colour Remote Sensing)

Abstract

:
Many lakes in boreal and arctic regions have high concentrations of CDOM (coloured dissolved organic matter). Remote sensing of such lakes is complicated due to very low water leaving signals. There are extreme (black) lakes where the water reflectance values are negligible in almost entire visible part of spectrum (400–700 nm) due to the absorption by CDOM. In these lakes, the only water-leaving signal detectable by remote sensing sensors occurs as two peaks—near 710 nm and 810 nm. The first peak has been widely used in remote sensing of eutrophic waters for more than two decades. We show on the example of field radiometry data collected in Estonian and Swedish lakes that the height of the 810 nm peak can also be used in retrieving water constituents from remote sensing data. This is important especially in black lakes where the height of the 710 nm peak is still affected by CDOM. We have shown that the 810 nm peak can be used also in remote sensing of a wide variety of lakes. The 810 nm peak is caused by combined effect of slight decrease in absorption by water molecules and backscattering from particulate material in the water. Phytoplankton was the dominant particulate material in most of the studied lakes. Therefore, the height of the 810 peak was in good correlation with all proxies of phytoplankton biomass—chlorophyll-a (R2 = 0.77), total suspended matter (R2 = 0.70), and suspended particulate organic matter (R2 = 0.68). There was no correlation between the peak height and the suspended particulate inorganic matter. Satellite sensors with sufficient spatial and radiometric resolution for mapping lake water quality (Landsat 8 OLI and Sentinel-2 MSI) were launched recently. In order to test whether these satellites can capture the 810 nm peak we simulated the spectral performance of these two satellites from field radiometry data. Actual satellite imagery from a black lake was also used to study whether these sensors can detect the peak despite their band configuration. Sentinel 2 MSI has a nearly perfectly positioned band at 705 nm to characterize the 700–720 nm peak. We found that the MSI 783 nm band can be used to detect the 810 nm peak despite the location of this band is not in perfect to capture the peak.

Graphical Abstract

1. Introduction

Lakes are an important source of drinking water, they provide different services from fisheries to tourism, support biodiversity, and are an important component in the global carbon cycle [1,2,3]. Monitoring the water quality and understanding the physical, chemical, and biological status of inland waters is hard to achieve without using remote sensing [4]. However, there are many obstacles in the way to achieve sufficient accuracy of inland water remote sensing products. Some of them are related to optical complexity of the waters, some to the methodology (e.g., atmospheric correction), and some to the technology (radiometric, spatial, and spectral resolution of sensors) used [4].
Only the visible part of electromagnetic radiation can potentially provide us information about the water constituents in most waterbodies as water itself absorbs light strongly at other wavelengths [5,6,7]. The exceptions here are waters with high concentrations of suspended matter [8,9] or phytoplankton [10,11] where the water reflectance in the near infrared (NIR) part of spectrum can also provide us useful information. However, there may be extreme environments where the water-leaving signal is negligible also in the visible part of the spectrum, automatically preventing the use of most current remote sensing algorithms and methods. For example, in this study we investigated lakes where the CDOM concentrations are so high that the water-leaving signal is practically zero at all visible wavelengths and the above water measured signal consisted predominantly of sun and sky glint. One may assume that the number of such extreme lakes is small as the only reflectance data we were able to find from almost as dark lakes was published only recently [7]. However, the global inventory of lakes [12] shows that majority of lakes on the Earth are between 55N and 75N, meaning boreal and arctic lakes, are the most abundant. Many boreal lakes have high CDOM concentration [7,13,14,15]. Most of the arctic lakes are actually permafrost thaw ponds that should be rich in dissolved organic carbon, DOC, and its coloured component, CDOM, although Sobek et al. [16] have shown that the lake DOC pattern at higher latitudes is quite complicated. Thus, at present there is very fragmented information on the possible abundance of CDOM-rich lakes as most of them are probably in inhabited and hardly accessible regions.
It was shown recently [17,18] that the iron bound to DOC makes lake water absorbance higher and variable iron to carbon ratio makes remote sensing retrieval of CDOM and DOC concentrations complicated. It means that the number of lakes in which remote sensing is challenging due to low water leaving signal, caused by high absorbance, should be relatively high globally. Retrieving the lake CDOM and DOC concentrations is important from both a drinking water perspective [19] and the global carbon cycle studies point of view [2]. The drinking water industry needs this information also in near real time as sudden heavy precipitation may increase the amount of carbon quickly and require modifications in water treatment processes. Consequently, there is a strong need to study optical properties of CDOM-rich lakes and the potential for retrieval of water quality parameters by means of remote sensing in such lakes.
Field radiometers have become remote sensing instruments on their own right rather than being just calibration and validation devices of satellite measurements. For example, routine reflectance measurements carried out from ferries (ferriscope.org) and hand-held devices have been developed for quick monitoring of lake water quality [20]. Many of the black lakes are small. Therefore, in this study, we focused mainly on field radiometry rather than satellite remote sensing.
The main aim of the study was to investigate black lakes with nearly negligible water leaving signal in the visible part of the spectrum and to estimate whether remote sensing retrieval of water constituents in such extreme CDOM-rich lakes is feasible by means of hyperspectral sensors. The next step was applying the results obtained in black lakes on all other lakes for which we had field radiometry data. Satellites with sufficient spatial resolution for small lake studies, like the Landsat 8 and Sentinel-2, became available recently. Therefore, it was reasonable to evaluate are these satellites suitable from their band configuration point of view for remote sensing of CDOM-rich lakes. This evaluation was performed by recalculating hyperspectral field radiometry data into spectral bands of Landsat 8 and Sentinel-2 as well as using actual satellite imagery.

2. Materials and Methods
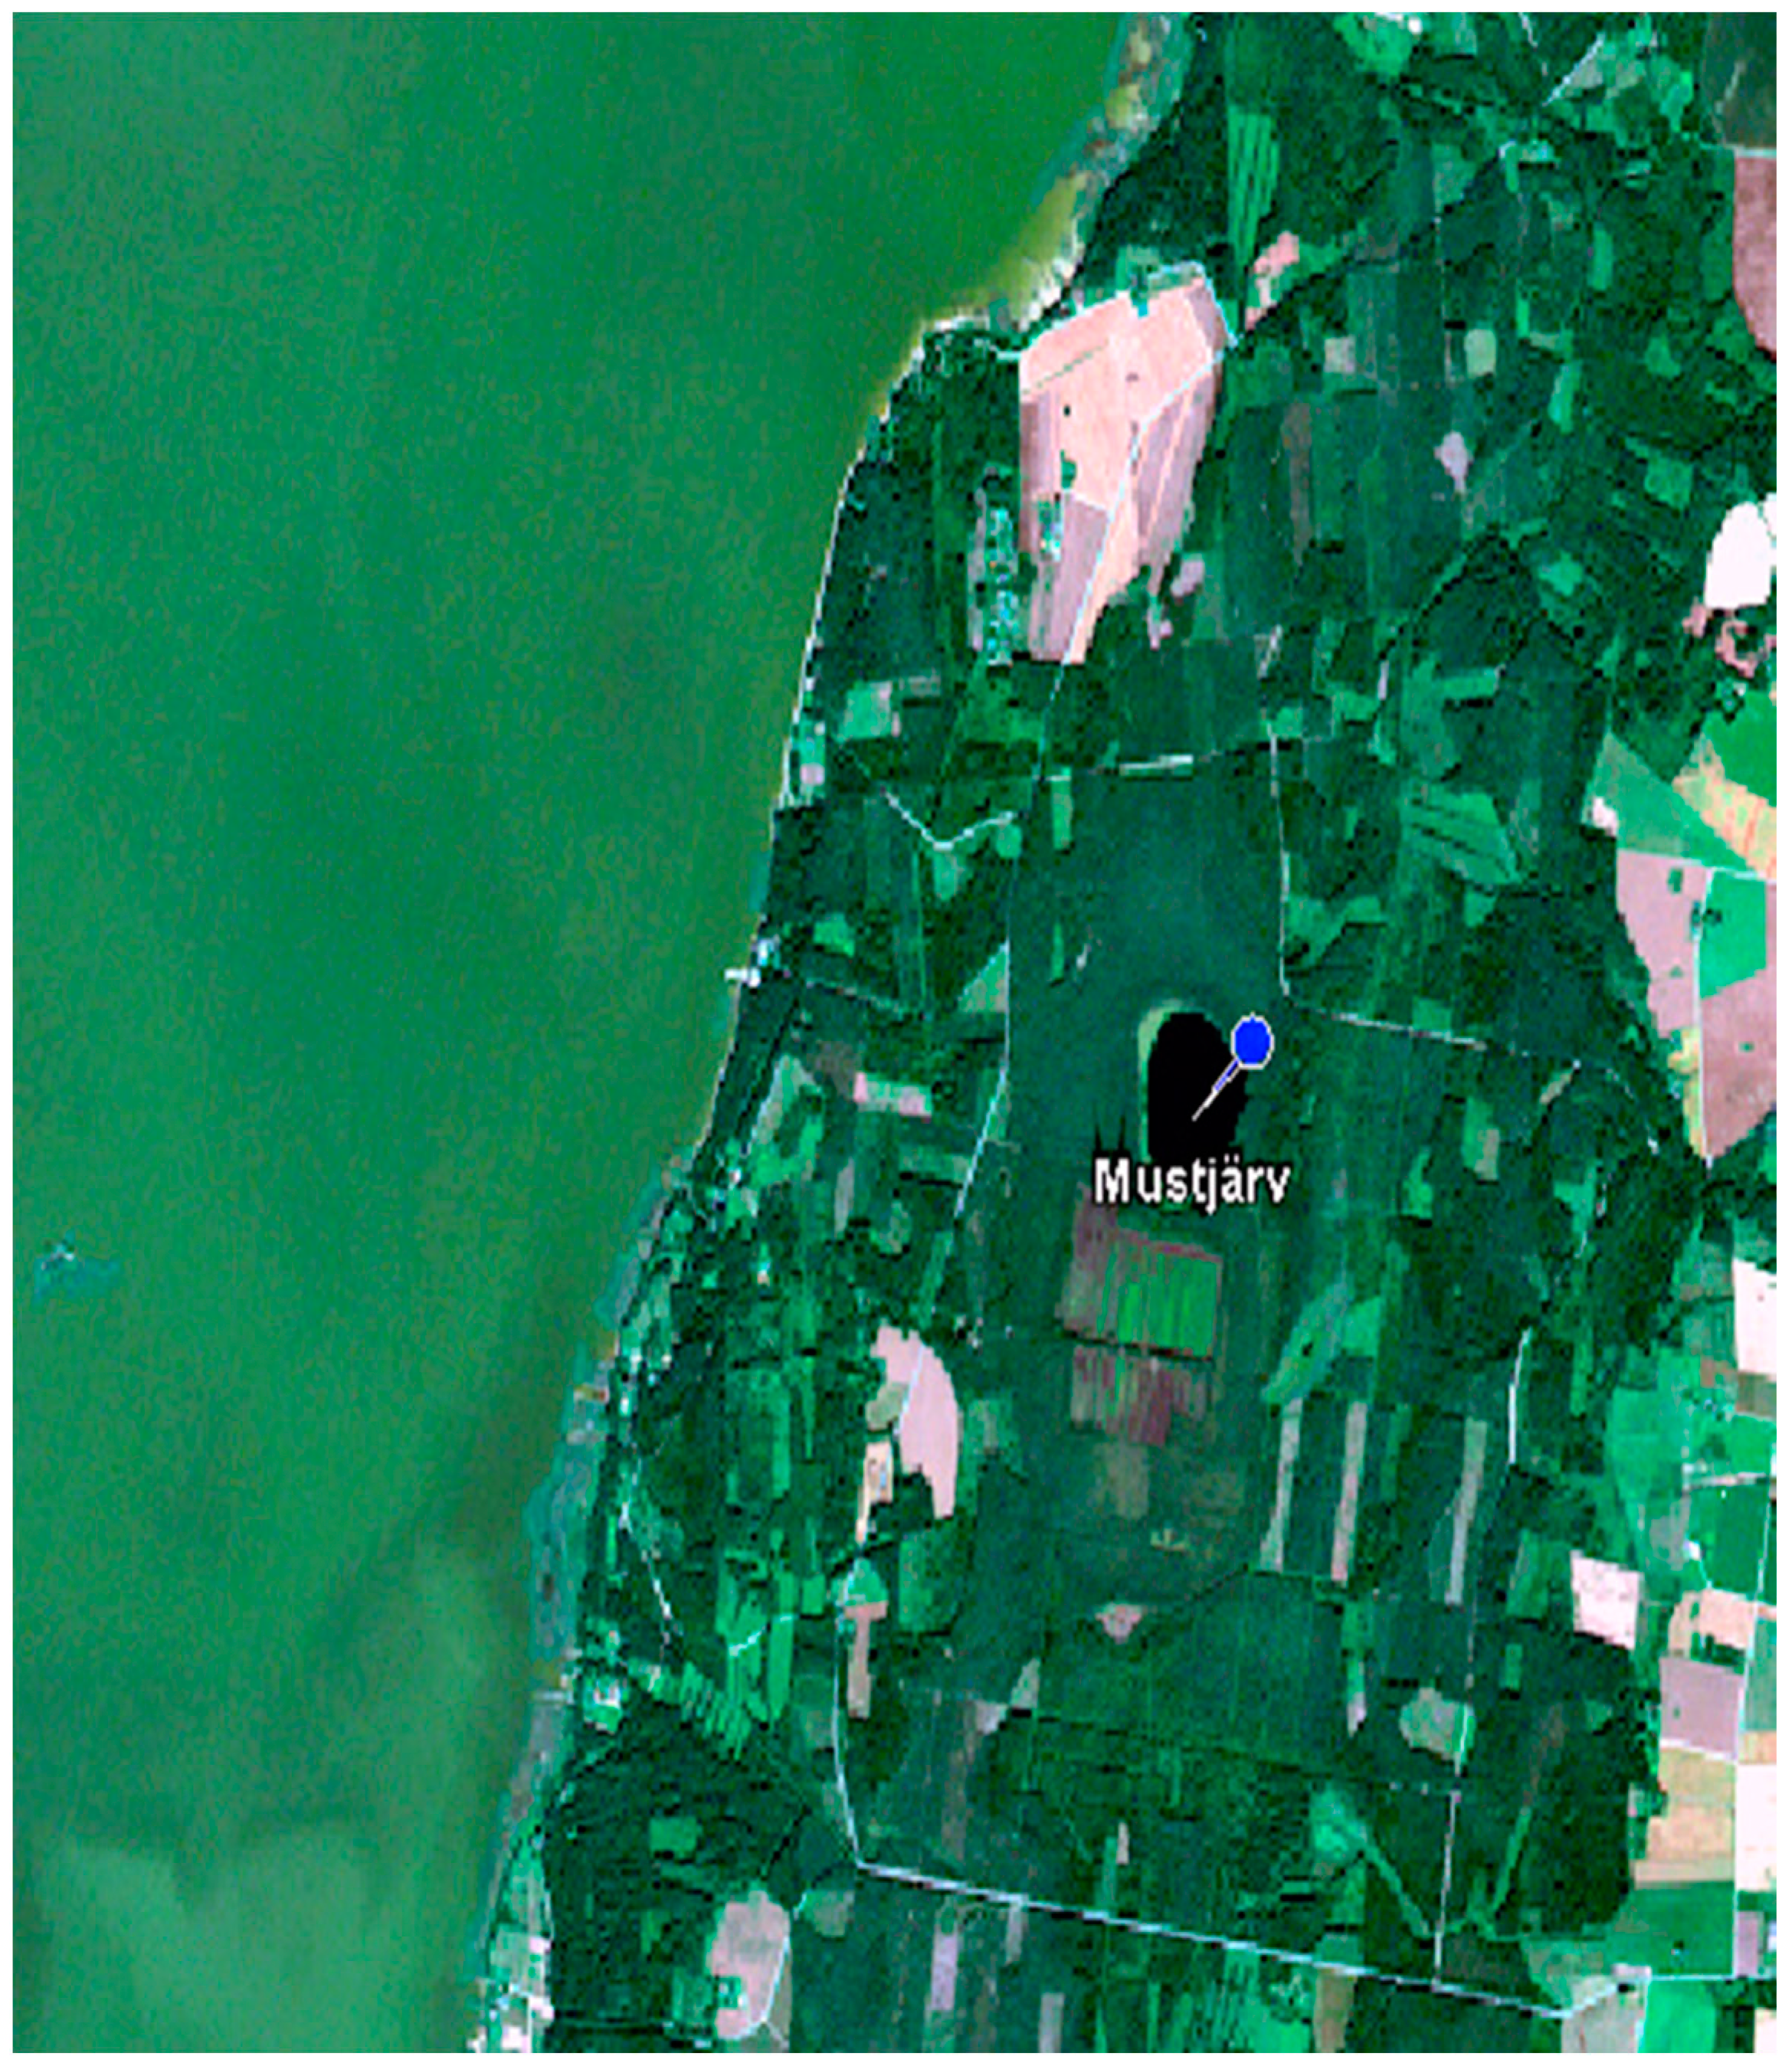
2.1. Study Sites

We chose three nearly black water lakes in South-Eastern Estonia for our study—Nohipalu Mustjärv, Meelva, and Mustjärv (Figure 1). These lakes were chosen based on our previous knowledge about the optical water properties there. The lakes are small—their area varies between 0.2 km2 and 0.8 km2.
In order to test how similar/dissimilar from remote sensing point of view are these extreme lakes from typical boreal lakes we chose other four lakes in Sweden and Estonia. Lake Mälaren is the third largest lake in Sweden (1140 km2). It is a gemorphologically sophisticated lake where different basins are often connected only through narrow straits. Optical properties of these basins vary in a wide range [17,21,22] and can be considered as different water bodies from an optical point of view. We also used data from three Estonian lakes where optical measurements are carried out in semi-regular basis. These lakes are Lake Peipsi, the fourth largest lake in Europe (3555 km2), Lake Võrtsjärv (270.7 km2) and Lake Harku (1.64 km2). All the other lakes, besides Mälaren, are shallow (maximum depth between 2.5 m and 12.9 m, Mälaren 61 m).

2.2. Field Measurements

Field measurements were carried out during three years 2011–2013. The total number of sampling stations was 105. The extreme CDOM-rich lakes Mustjärv and Nohipalu Mustjärv were sampled once, Meelva twice. Data from the other boreal lakes was collected in the frame of different projects. Lake Mälaren in Sweden was sampled once (7 sampling stations) while three Estonian lakes were studied almost on the monthly bases during three ice free seasons. We sampled Lake Võrtsjärv 9 times (19 samples in total), Lake Harku 11 times (one station each time), and Lake Peipsi 11 times (65 samples in total).
Water reflectance measurements were carried out using two Ramses (TriOS) sensors one measuring downwelling irradiance and one measuring upwelling radiance from the nadir. Ramses is sampling with 3.3 nm interval in the wavelength range 350–900 nm. Each reflectance spectrum used in the study is an average of 10 measured spectra.
We knew in advance that significant part of the measured reflectance is actually sun and sky glint, especially in the darkest lakes. Therefore, we carried out reflectance measurements in two different ways. In each sampling station we first measured reflectance as a ratio of upwelling radiance to downwelling irradiance, Lu/Ed, where both Ramses sensors were above the water surface i.e., these were normal reflectance measurements carried out from a boat with zenith and nadir looking sensors. A second set of measurements was carried out putting the 5 cm black plastic tube, surrounding the Ramses radiance sensor head, just under the water surface. This way we can measure water-leaving radiance, Lw, without sun and sky glint. Dividing the subsurface radiance with the downwelling irradiance measured above the water surface we got glint-free reflectance spectra. The methodology was described in more detail in [23].
Optical properties of the water were measured with WetLabs optical package containing a CTD, AC-S absorption and attenuation sensor, ECO-BB3 backscattering sensor and ECO-VSF3 volume scattering sensor. Complementary wavelengths were chosen for the BB3 and VSF3. This allows us to measure backscattering coefficient at six wavelengths as backscattering coefficient can also be calculated from the ECO-VSF3 data.

2.3. Laboratory Analysis

Water samples were collected from the surface layer (0.2 m) directly into 2.5 litre canisters that were then stored in the dark and cold before filtering in the evening of each sampling day (less than 10 h between the collection and filtering). The volume of lake water filtered through Whatman GF/F-filters depended on particle load (0.1–1 litre). Phytoplankton pigments were extracted from the filters with 96% ethanol at 20 °C for 24 h and measured spectrometrically both before and after acidification with dilute hydrochloride acid. Later, optical density values were converted respectively to chlorophyll-a and phaeophytin-a concentrations according to Lorenzen [24] formulas. The concentration of total suspended matter, TSS, was measured gravimetrically after filtration of the same amount of water through pre-weighed and dried (103–105 °C for 1 h) filters. The inorganic fraction of suspended matter, SPIM, was measured after combustion of filters at 550 °C for 30 min. The organic fraction of suspended matter, SPOM, was determined by subtraction of SPIM from TSS [25].
Absorption by colored dissolved organic matter, aCDOM(λ), was measured with a spectrophotometer (Hitachi U-3010 UV/VIS, in the range 350–750 nm with 1 nm resolution) in water filtered through Millipore 0.2 µm filter. The measurements were carried out in a 5 cm cuvette against distilled water and corrected for residual scattering according to Davis-Colley & Vant [26]. The water from the three extreme CDOM lakes was diluted 1:1 with distilled water before the measurements as otherwise most of the light beam was absorbed in the 5 cm cuvette.

2.4. Satellite Data

Suitability of Sentinel-2 and Landsat 8 was tested in two ways. First, we simulated theoretical performance of the satellites in the black lakes by recalculating Ramses field reflectance spectra using spectral response functions of the two satellites. Secondly, we used a Landsat 8 image from 8 July 2013 acquired simultaneously with our field campaign in Lake Peipsi and 1–2 days before sampling on the black lakes and Lake Võrtsjärv. Atmospheric correction was performed with four different methods from which ATCOR23 was selected as the best performing method for most of the lakes [27]. More detail about the field campaign and different atmospheric correction methods tested is provided in [27]. Sentinel-2 imagery was collected in 11 and 14 August 2015 and processed with SNAP Sentinel-2 toolbox and Sen2Cor atmospheric correction module provided together with the Sentinel Toolbox. Detailed description of Sentinel-2 processing and using the MSI imagery in mapping of different lake water quality parameters is given in [28].

2.5. Remote Sensing Algorithms

There are a variety of methods for relating the remote sensing signal to optical water properties like chlorophyll-a, CDOM or suspended matter. For example, single band algorithms, band ratios, more sophisticated colour indices or analytical methods for retrieving three or more water properties simultaneously have been used [29,30,31,32,33]. We chose to use peak height algorithms as the measured reflectance had only two peaks and very low signal at other wavelengths. We tested spectral differences using the reflectance values of the peak and at one of the nearby wavelengths where the reflectance is the lowest. However, the best performing algorithms were three band algorithms where the peak height was calculated against the baseline of two wavelengths where the reflectance is low (Equations (1) and (2)).
It is known that the peak near 700–720 nm is moving towards longer wavelengths with the increasing phytoplankton biomass [34]. Therefore, the first peak height was calculated as the difference between the maximum reflectance in the 700–720 nm wavelength range against the 676–770 nm baseline (Equation (1)). The baseline wavelengths were chosen based on the shape of the reflectance spectra (Figure 2).
P1 = Rmax(700–720) − [R(646) + R(770)]/2
where P1 is the height of the peak near 710 nm, Rmax(700–720) is maximum reflectance value in the 700–720 nm wavelength range, and the R(646) and R(770) are reflectance values at these two wavelengths.
The second peak height was calculated simply as the difference between the reflectance value at 810 nm and the 770–840 nm baseline as the location of the maximum value was always at 810 nm (Equation (2)).
P2 = R(810) − [R(770) + R(840)]/2
where P2 is the height of the peak at 810 nm, R(810), R(770), and R(840) are the reflectance values at these three wavelengths. Most of researchers measure reflectance just above the water surface and do not have measurements of glint free spectra. In order to investigate the effect of glint on the retrieval results we calculated the peak heights from both “normal” (Lu/Ed) and glint-free (Lw/Ed) reflectance spectra.

3. Results

The optical properties of the studied lakes were variable as seen from the Table 1. For example, chlorophyll-a concentration varied between 2.14 mg·m−3 and 203.31 mg·m−3 whereas TSS varied between 0.75 mg·L−1 and 63.33 mg·L−1. All the lakes were relatively CDOM-rich—the aCDOM(400) varied between 3.23 m−1 and 63.05 m−1.
Reflectance spectra of the extreme CDOM lakes are shown in Figure 2 and reflectance spectra of all studied lakes are shown in Figure 3. It is seen in the Figure 2 that in the extreme lakes water reflectance (red spectrum) is negligible in almost the entire visible part of the spectrum and the only usable signal is in the form of two peaks, which have maxima near 710 nm and 810 nm. It is also seen in the Figure 2 that significant part of the remote sensing signal measured above the black lakes (blue spectrum) is light reflected from the water surface. In the 350–600 nm spectral range the whole signal is glint. The only chance to get information about the water constituents in such lakes is to use these two reflectance peaks. We calculated the height of the two (710 nm and 810 nm) peaks in order to try to estimate concentrations of optically active substances chlorophyll-a, TSS (total suspended solids), SPIM (suspended particulate inorganic matter), SPOM (suspended particulate organic matter), and CDOM. Besides the peak heights themselves, we also used differences, sums, and ratios of these two peak heights.
Reflectance spectra of all studied lakes together are presented in Figure 3. Most of the spectra have been collected in lakes with significant cyanobacterial biomass as there is a phycocyanin absorption feature at 620 nm and a peak at 650 nm (Figure 3) typical to only cyanobacteria [11].
The peak near 710 nm, caused by combined effect of absorption by water molecules and very high reflectance of phytoplankton in the infrared part of spectrum, is often used for chlorophyll-a retrieval in many waterbodies [35,36,37]. Not surprisingly, there was also good correlation between the peak height, P1, and chlorophyll-a in the lakes studied by us (Figure 4).
The height of the 810 nm peak is clearly higher in reflectance spectra of black lakes than the height of the 700–720 nm peak (Figure 2). Therefore, we decided to test whether the height of this peak, P2, is in correlation with the concentrations of optically active substances. Figure 5 illustrates the correlation between P2 and chlorophyll-a and Figure 6 the correlation between the P2 and total suspended matter. The correlation was good for both parameters when data from all Estonian and Swedish lakes was used.
It was not surprising that the height of the 710 nm peak was in good correlation with chlorophyll-a concentration—R2 was 0.74 and 0.72 for above water (Figure 4) and glint free reflectance respectively. However, it was surprising that the 810 nm peak height correlated even better with the chlorophyll-a concentration—R2 = 0.77 (Figure 5). This result was obtained for glint-free spectra. R2 was just 0.37 if the peak height was calculated from the above water reflectance spectra. This stresses the importance of removing glint from aquatic reflectance spectra. There have been studies relating the elevated NIR reflectance values to high mineral suspended matter concentration [8,9]. Therefore, the good correlation between the 810 nm peak and TSS was expected to certain extent.
In order to test theoretical performance of Sentinel-2 and Landsat 8 sensors in picking up the two peaks containing information about the water properties in the case of black lakes we took the in situ measured glint-free spectrum of Nohipalu Mustjärv (Figure 2a) and recalculated it using spectral response functions of Sentinel-2 MSI and Landsat 8 OLI sensors. The results are given in Figure 7. It is clearly seen that Landsat 8 band configuration does not allow detection of either of the peaks. Sentinel-2 MSI does not have narrow spectral bands near the 810 nm peak. However, the 783 nm centered band 7 allows to detect the peak to certain extent. Especially, because the bands 6 and 8a are located at wavelengths where the lake reflectance values are low. The 705 nm band 5 of Sentinel-2 is almost perfectly located for detection of elevated biomass in waterbodies as we have also shown in our study focusing on using Sentinel-2 imagery in lake research [28].
The results obtained from actual satellite imagery resemble those obtained from field measurements spectra as can be seen in Figure 8. Both satellite reflectances are slightly elevated (not zero) in the blue to green part of spectrum where the water leaving signal is practically zero as can be seen in Figure 2. This indicates that the satellite signal also contains glint from the water surface which may be significant compared to the water leaving signal as is clearly seen in Figure 2b. Another potential source of the non-negligible reflectance is the adjacency effect as the black lakes are small and water leaving signal very low compared to the potential signal contamination from the adjacent land.

4. Discussion

As was mentioned earlier our main aim was to study the extreme CDOM lakes with field radiometers in order to understand is it possible to retrieve water quality parameters of lakes where the water leaving signal is close to zero in visible part of spectrum. The first question that arises is quite subjective—what is a black or extreme CDOM lake? For example, Duan et al. [38,39] investigated black water blooms in Lake Taihu where the CDOM absorption at 443 nm reached up to 1.68 m−1 (~3.3 m−1 at 400 nm). Such waters seem black compared to turbid, highly backscattering, waters of the rest of the lake. We found so low CDOM values only in a few Lake Peipsi stations (minimum value 3.23 m−1). In the lakes we would call black the aCDOM(400) varied between 41.45 m−1 and 63.05 m−1. Black water lakes have been studied also in the USA. For example, Brezonik et al. [7] studied a few lakes where CDOM absorption at 440 nm reached up to 25.1 m−1 (~49 m−1 at 400 nm). Thus, the terms black, CDOM-rich, extreme CDOM lakes are quit arbitrary and depend on the background CDOM levels nearby rather than absolute absorption values.
The relativeness of water colour is clearly seen also in the Figure 9. The lake Võrtsjärv shown in the left part of the image has nearly twice as high mean CDOM concentration (Table 1) than the black water blooms in Lake Taihu [38,39]. Nevertheless, the Võrtsjärv water looks bright green compared to the Mustjärv in the same scene. There are two reasons for that. First of all the Võrtsjärv water contains relatively high amounts of particulate matter (both organic and inorganic) and is therefore a relatively bright object. On the other hand the visual appearance of all objects in processed satellite imagery depends also on the image stretch and brightness of other object in the scene.
In most lakes the absorption by CDOM is negligible in red and near infrared parts of spectrum. However, in the three black lakes studied by us the absorption of CDOM and water molecules are equal at 700 nm or the CDOM absorption is even higher (Figure 10). Thus, the light backscattered from phytoplankton has to overcome both water and CDOM absorption in order to form detectable signal in reflectance spectra. Absorption by water molecules increases almost exponentially with increasing wavelength after 690 nm [5,6,7]. Therefore, the elevated signal forms a relatively narrow peak near 700 nm in the case of high biomass (or benthic vegetation in shallow water) and the maximum of the peak is moving towards longer wavelength with increasing biomass. In the lakes where CDOM absorption is still strong near 700 nm it first of all causes the decrease in the height of the peak often used to estimate phytoplankton biomass in water, but it also causes slight shift of the maximum in reflectance spectra towards NIR as the CDOM absorption decreases exponentially with increasing wavelength.
The reason why the 810 nm peak occurs in reflectance spectra is a small decrease in water absorption coefficient approximately between 770 nm and 860 nm (see Figure 10) with the lowest absorption coefficient at 810 nm. Presence of the peak is obvious in all the reflectance spectra collected by us in different lakes (Figure 3) not only in the black lakes.
Brezonik et al. [7] presented a few reflectance spectra from CDOM-rich lakes in the USA. These spectra were similar to our black lakes—nearly negligible reflectance in the visible part of spectrum and a peak near 710 nm. Unfortunately, the graphs in their paper did not show reflectance beyond 800 nm. Therefore, we do not have reflectance data from very CDOM-rich lakes in other parts of the world to compare with our black lakes. Reflectance spectra with the second near infrared peak (around 810–850 nm) have been published in several papers [10,23]. However, the reason and magnitude of this peak was not discussed or even mentioned in any of these papers.
Doxaran et al. [8] attributed the high reflectance values in NIR part of spectrum to high concentration of suspended matter and used different band ratios that included NIR band of different satellites (SPOT 790–890 nm, Landsat 750–900 nm, and SeaWiFS 845–885 nm) for retrieving concentrations of suspended matter. There are several publications [8,9,40] showing that the elevated signals in the NIR part of the spectrum is a good predictor of TSM. All these studies were carried out in waters very rich in mineral particles. Therefore, the elevated NIR signal has been attributed to high mineral particle load in the water, not high phytoplankton concentration (chlorophyll-a).
This may seem contradictory to our results, but it is not. The peak near 810 nm is caused by high amount of scattering particles and local dip in absorption coefficient of water molecules. If the scattering material in the water is of mineral origin, like in previous studies [8,9,32], then the peak height is in good correlation with the concentration of mineral particles. In lakes studied by us (and many other lakes) the dominating scattering material in water is phytoplankton. Consequently, the height of the peak at 810 nm has to be in correlation with all parameters describing phytoplankton abundance in the water like chlorophyll-a, TSS, and—its organic component—SPOM. In the lakes studied by us, there was no correlation (R2 = 0.15) between the concentration of mineral particles, SPIM, and the 810 nm peak height. On the other hand, the analysis of the in situ data showed that there was good correlation between chlorophyll-a and SPOM (R2 = 0.74) and TSS and SPOM (R2 = 0.87) indicating that majority of the suspended particles were organic and significant fraction of them were living phytoplankton cells.
Backscattering coefficient values were relatively high in the extreme CDOM-rich lakes. For example, the backscattering coefficient at 595 nm, bb(595), varied between 0.05 and 0.15 m−1 in all studied lakes, whereas it was between 0.08 and 0.15 m−1 in the extreme CDOM lakes. Thus, the reflectance in these lakes was low not because of low backscattering, but because the high CDOM absorption masks the backscattering signal.
The concentration of phytoplankton (chlorophyll-a) was relatively high in the extreme CDOM lakes (Table 1) and caused the appearance of the peaks at 710 nm and 810 nm. One may assume that in these lakes the amount of light available for photosynthesis is very low limiting the growth of phytoplankton, but this was not the case. The explanation here is species composition of phytoplankton. Cyanobacteria are the most dominant group in Estonian lakes and Lake Mälaren in Sweden during summer season. Many species of cyanobacteria can regulate their buoyancy and in calm weather conditions can choose the water depth most optimal for their growth. The extreme CDOM-rich lakes studied by us are relatively small and surrounded by forest. This means that the wind speed and water mixing are usually low and cyanobacteria can stay close to the surface where light is available for primary production. This also has an effect on the water reflectance. We have shown [41] that vertical distribution of phytoplankton biomass has significant impact on the remote sensing signal and the biomass close to the surface has quite different reflectance than the same biomass uniformly mixed in the water column. Therefore, it is not surprising that the biomass located in a thin surface layer (as there is no light at depths of a few decimetres) is producing a strong remote sensing signal and spectral features typical to cyanobacteria (Figure 3).
There are studies [42] showing that the 810 nm peak is suitable for mapping water depth in very shallow (less than 1 m deep) waters. This is reasonable as benthic vegetation has high reflectance in NIR part of spectrum [43,44] and there is a decrease in water absorbance at 810 nm making the bottom signal detectable in this spectral region. All reflectance measurements of this study were carried out in optically deep waters with no bottom contribution. Therefore, we are sure that the height of the 810 nm peaks is only due to water constituents and there is no contribution from benthic vegetation.
Our results show that the 810 nm peak height is relatively sensitive to glint. The glint-free reflectance spectra (measured with the radiance sensor just below the water surface) produced better results that the “normal” reflectance spectra measured above the water surface. The glint removal method developed by us [23] performed well in the case of most measurements except for the most extreme Nohipalu Mustjärv. Most probably, the cause of the failure of the glint removal method was cyanobacterial biomass floating on the water surface producing high values of reflectance in the NIR part of spectrum. The glint removal procedure is not applicable when the NIR signal is higher than the UV signal.
Our results show that both the 710 nm and 810 nm peaks are very useful for retrieving chlorophyll-a and total suspended matter concentrations not only in the CDOM-rich lakes, where there is no measurable signal in the visible part of spectrum, but also in a much wider variety of lakes. The 710 nm peak continues to be the most useful spectral feature for retrieving phytoplankton biomass in productive waters. However, our study shows that the 810 nm peak is more useful in the extreme lakes where the CDOM absorption is still strong at 710 nm.
These two peaks can be used in the interpretation of remote sensing data in the cases where hyperspectral instruments are used (airborne and hand held devices). The only spaceborne instrument sufficient for lake studies spectral (10 nm) and spatial resolution (30 m) was Hyperion on board the EO-1. It was an experimental sensor that did not provide global coverage. The launch of Landsat 8 and Sentinel-2 opened great potential for lake remote sensing from a spatial and radiometric resolution point of view. The spectral resolution of Landsat is not very good from a water quality monitoring perspective. For example, it does not have spectral bands near the 700–720 nm peak, which is most often used to estimate chlorophyll-a concentration in coastal and inland waters [32,34,36,37,45]. Landsat series satellites have been used for mapping lake chlorophyll content [45] for several decades. However, it has been done mainly in eutrophic lakes where biomass is high and the total suspended matter (causing the changes in lake reflectance) is mainly phytoplankton. It is clearly seen comparing the Figure 3 and Figure 7 that the band configuration of Landsat 8 is not optimal for lake water quality monitoring.
Sentinel-2 spatial resolution is finer than that of Landsat 8, but more important for lake studies is its spectral resolution and band configuration. The narrow 705 nm band opens great opportunities in lake chlorophyll-a remote sensing studies as we have demonstrated for black lakes in this study and for a wider variety of lakes in our Sentinel-2 lake remote sensing study [28]. We showed that, although the band 7 of Sentinel-2 OLI sensor is not positioned optimally to capture the 810 nm peak, the 783 nm band is still useful for this purpose. The suitability of this band in lake remote sensing has to be tested in the future.

5. Conclusions

We have shown with field reflectance data that, in black lakes, the water leaving signal may be very close to zero in most of the visible part of the spectrum. The measured visible part of spectrum remote sensing reflectance consists mainly of glint in such lakes.
We showed that the height of the 810 nm peak in reflectance spectra is in correlation with the parameters describing phytoplankton biomass (Chlorophyll-a, TSS, SPOM) in a wide variety of lakes. This is especially useful in black lakes where the 700–720 nm peak, normally used in retrieval of chlorophyll-a, is still affected by CDOM absorption.
Previous studies have shown that the NIR peak is caused by large amount of mineral particles in water. Our results show that the 810 nm peak is caused by combined effect of decreased water absorption between 760 nm and 860 nm and scattering by particles in the water column. If the particles in the water are primarily phytoplankton (like in the lakes studied by us), then the height of the 810 nm peak is in good correlation with chlorophyll-a and other parameters describing phytoplankton biomass (SPOM and TSS). If the scattering material in water is mainly of mineral origin (like in previous coastal and river studies) then the 810 peak is in correlation with SPIM and TSS concentration.
Landsat 8 bands are not suitable for detecting the two peaks occurring in reflectance spectra of many lakes. On the other hand, Sentinel-2 band 5 (705 nm) is almost perfectly located for mapping phytoplankton biomass (chlorophyll-a) and the band 7 (783 nm) also allows detection of the 810 nm peak in water reflectance spectra. This is especially useful in the case of black lakes as CDOM absorption may still affect the peak at 705 nm.

Acknowledgments

Fieldwork and data analysis costs were covered by Estonian Science Foundation Grants 8576 and 8654, KESTA program project VeeObs, Estonian Basic Science Research Grant SF0180009s11, and FP7 project eratH2Observe. Lake Mälaren data collection and analysis costs were covered by the FORMAS project “The Colour of water—interplay with climate, and effects on drinking water supply”.

Author Contributions

Tiit Kutser wrote the manuscript with input from all co-authors and participated in all field campaigns. Birgot Paavel, Martin Ligi, and Tuuli Kauer participated in the Estonian fieldworks, processed and analyzed the field data, and carried out laboratory analysis. Charles Verpoorter participated in the Swedish field campaign, carried out all the laboratory analysis, and processed and analyzed Lake Mälaren data. Kaire Toming was responsible for processing and analyzing Sentinel-2 imagery while Gema Casal was responsible for processing and analyzing Landsat 8 imagery.

Conflicts of Interest

The authors declare no conflict of interest.

References

  1. Dudgeon, D.; Arthington, A.H.; Gessner, M.O.; Kawabata, Z.I.; Knowler, D.J.; Lévêque, C.; Naiman, R.J.; Prieur-Richard, A.H.; Soto, D.; Stiassny, M.L.; et al. Freshwater biodiversity: Importance, threats, status and conservation challenges. Biol. Rev. 2006, 81, 163–182. [Google Scholar] [CrossRef] [PubMed]
  2. Tranvik, L.J.; Downing, J.A.; Cotner, J.B.; Loiselle, S.; Striegl, R.G.; Ballatore, T.J.; Dillon, P.; Finlay, K.; Fortino, K.; Knoll, L.B.; et al. Lakes and impoundments as regulators of carbon cycling and climate. Limnol. Oceanogr. 2009, 54, 2298–2314. [Google Scholar] [CrossRef]
  3. Bastviken, D.; Tranvik, L.J.; Downing, J.A.; Crill, P.M.; M, P.; Enrich-Prast, A. Freshwater methane emissions offset the continental carbon sink. Science 2011, 331, 50. [Google Scholar] [CrossRef] [PubMed]
  4. Palmer, S.J.; Kutser, T.; Hunter, P.D. Remote sensing of inland waters: Challenges, progress and future directions. Remote Sens. Environ. 2015, 157, 1–8. [Google Scholar] [CrossRef]
  5. Pope, R.M.; Fry, E.S. Absorption spectrum (380–700 nm) of pure water. II. Integrating cavity measurements. Appl. Opt. 1997, 36, 8710–8723. [Google Scholar] [CrossRef] [PubMed]
  6. Segelstein, D. The Complex Refractive Index of Water. Master’s Thesis, University of Missouri-Kansas City, Kansas City, MO, USA, 1981. [Google Scholar]
  7. Brezonik, P.L.; Olmanson, L.G.; Finlay, J.C.; Bauer, M.E. Factors affecting the measurement of CDOM by remote sensing of optically complex inland waters. Remote Sens. Environ. 2015, 157, 199–215. [Google Scholar] [CrossRef]
  8. Doxaran, D.; Froidefond, J.M.; Castaing, P. Remote-sensing reflectance of turbid sediment-dominated waters. Reduction of sediment type variations and changing illumination conditions effects by use of reflectance ratios. Appl. Opt. 2003, 42, 2623–2634. [Google Scholar] [CrossRef] [PubMed]
  9. Doxaran, D.; Cherukuru, R.C.N.; Lavender, S.J. Use of reflectance band ratios to estimate suspended and dissolved matter concentrations in estuarine waters. Int. J. Remote Sens. 2004, 26, 1753–1769. [Google Scholar] [CrossRef]
  10. Quibell, G. Estimating chlorophyll concentrations using upwelling radiance from different freshwater algal genera. Int. J. Remote Sens. 1992, 14, 2611–2621. [Google Scholar] [CrossRef]
  11. Kutser, T. Quantitative detection of chlorophyll in cyanobacterial blooms by satellite remote sensing. Limnol. Oceanogr. 2004, 49, 2179–2189. [Google Scholar] [CrossRef]
  12. Verpoorter, C.; Kutser, T.; Seekell, D.; Tranvik, L.J. A global inventory of lakes based on high-resolution satellite imagery. Geophys. Res. Lett. 2014, 41, 6396–6402. [Google Scholar] [CrossRef]
  13. Kutser, T.; Pierson, D.C.; Kallio, K.; Reinart, A.; Sobek, S. Mapping lake CDOM by satellite remote sensing. Remote Sens. Environ. 2005, 94, 535–540. [Google Scholar] [CrossRef]
  14. Kutser, T.; Tranvik, L.J.; Pierson, D.C. Variations in colored dissolved organic matter between boreal lakes studied by satellite remote sensing. J. Appl. Remote Sens. 2009, 3, 033538. [Google Scholar]
  15. Weyhenmeyer, G.A.; Prairie, Y.T.; Tranvik, L.J. Browning of boreal freshwaters coupled to carbon-iron interactions along the aquatic continuum. PLoS ONE 2014, 9, e88104. [Google Scholar] [CrossRef] [PubMed]
  16. Sobek, S.; Tranvik, L.J.; Prairie, Y.T.; Kortelainen, P.; Cole, J.J. Patterns and regulation of dissolved organic carbon: An analysis of 7500 widely distributed lakes. Limnol. Oceanogr. 2007, 52, 1208–1219. [Google Scholar] [CrossRef]
  17. Köhler, S.J.; Kothawala, D.; Futter, M.N.; Liungman, O.; Tranvik, L. In-lake processes offset increased terrestrial inputs of dissolved organic carbon and color to lakes. PLoS ONE 2013, 8, e70598. [Google Scholar] [CrossRef] [PubMed]
  18. Kutser, T.; Alikas, K.; Kothawala, D.N.; Köhler, S.J. Impact of iron associated to organic matter on remote sensing estimates of lake carbon content. Remote Sens. Environ. 2015, 156, 109–116. [Google Scholar] [CrossRef]
  19. Eikebrokk, B.; Vogt, R.D.; Liltved, H. NOM increase in Northern European source waters: Discussion of possible causes and impacts on coagulation/contact filtration processes Water Science and Technology. Water Supply 2004, 4, 47–54. [Google Scholar]
  20. Hommersom, A.; Kratzer, S.; Laanen, M.; Ansko, I.; Ligi, M.; Bresciani, M.; Giardino, C.; Beltrán-Abaunza, J.M.; Moore, G.; Wernand, M.; et al. Intercomparison in the field between the new WISP-3 and other radiometers (TriOS Ramses, ASD FieldSpec, and TACCS). J. Appl. Remote Sens. 2012, 6, 063615. [Google Scholar] [CrossRef] [Green Version]
  21. Kutser, T.; Verpoorter, C.; Paavel, B.; Tranvik, L.J. Estimating lake carbon fractions from remote sensing data. Remote Sens. Environ. 2015, 157, 136–146. [Google Scholar] [CrossRef]
  22. Kutser, T. The possibility of using the Landsat image archive for monitoring long time trends in coloured dissolved organic matter concentration in lake waters. Remote Sens. Environ. 2012, 123, 334–338. [Google Scholar] [CrossRef]
  23. Kutser, T.; Vahtmäe, E.; Paavel, B.; Kauer, T. Removing glint effects from field radiometry data measured in optically complex coastal and inland waters. Remote Sens. Environ. 2013, 133, 85–89. [Google Scholar] [CrossRef]
  24. Lorenzen, C.J. Determination of chlorophyll and phaeopigments; spectrophotometric equations. Limnol. Oceanogr. 1967, 12, 343–346. [Google Scholar] [CrossRef]
  25. ESS Method 340.2: Total Suspended Solids, Mass Balance, Volatile Suspended Solids; Environmental Sciences Section, Inorganic Chemistry Unit, Wisconsin State Lab of Hygiene: Madison, WI, USA, 1993.
  26. Davies-Colley, R.J.; Vant, W.N. Absorption of light by yellow substance in freshwater lakes. Limnol. Oceanogr. 1987, 32, 416–425. [Google Scholar] [CrossRef]
  27. Kutser, T.G.; Pascual, C.; Barbosa, C.; Paavel, B.; Ferreira, R.; Carvalho, L.; Toming, K. Mapping inland water carbon content with Landsat 8 data. Int. J. Remote Sens. 2016, in press. [Google Scholar]
  28. Toming, K.; Kutser, T.; Laas, A.; Sepp, M.; Paavel, B.; Nõges, T. Mapping lake water quality parameters with Sentinel-2 MSI imagery. Remote Sens. 2016. submitted. [Google Scholar]
  29. Kallio, K.; Kutser, T.; Hannonen, T.; Koponen, S.; Pulliainen, J.; Vepsäläinen, J.; Pyhälahti, T. Retrieval of water quality from airborne imaging spectrometry of various lake types in different seasons. Sci. Total Environ. 2001, 268, 59–77. [Google Scholar] [CrossRef]
  30. Arst, H.; Kutser, T. Data processing and interpretation of sea radiance factor measurements. Polar Res. 1994, 13, 3–12. [Google Scholar] [CrossRef]
  31. Lee, Z.P.; Carder, K.L.; Mobley, C.D.; Steward, R.G.; Patch, J.S. Hyperspectral remote sensing for shallow waters. 2. Deriving bottom depths and water properties by optimization. Appl. Opt. 1999, 38, 3831–3843. [Google Scholar] [CrossRef] [PubMed]
  32. Kutser, T. Passive optical remote sensing of cyanobacteria and other intense phytoplankton blooms in coastal and inland waters. Int. J. Remote Sens. 2009, 30, 4401–4425. [Google Scholar] [CrossRef]
  33. Kutser, T.; Herlevi, A.; Kallio, K.; Arst, H. A hyperspectral model for interpretation of passive optical remote sensing data from turbid lakes. Sci. Total Environ. 2001, 268, 47–58. [Google Scholar] [CrossRef]
  34. Gitelson, A.A. The peak near 700 nm on radiance spectra of algae and water: Relationships of its magnitude and position with chlorophyll concentration. Int. J. Remote Sens. 1992, 13, 3367–3373. [Google Scholar] [CrossRef]
  35. Gower, J.F.R.; King, S.; Borstad, G.A.; Brown, L. Detection of intense plankton blooms using the 709 nm band of the MERIS imaging spectrometer. Int. J. Remote Sens. 2005, 26, 2005–2012. [Google Scholar] [CrossRef]
  36. Gitelson, A.A.; Schalles, J.F.; Hladik, C.M. Remote chlorophyll-a retrieval in turbid, productive estuaries: Chesapeak Bay case study. Remote Sens. Environ. 2007, 109, 464–472. [Google Scholar] [CrossRef]
  37. Matthews, M.W.; Bernard, S.; Robertson, L. An algorithm for detecting trophic status (chlorophyll-a), cyanobacterial-dominance, surface scums and floating vegetation in inland and coastal waters. Remote Sens. Environ. 2012, 124, 637–652. [Google Scholar] [CrossRef]
  38. Duan, H.; Ma, R.; Loiselle, S.A.; Shen, Q.; Yin, H.; Zhang, Y. Optical characterization of black water blooms in eutrophic waters. Sci. Total Environ. 2014, 482–483, 174–183. [Google Scholar] [CrossRef] [PubMed]
  39. Duan, H.; Loiselle, S.A.; Li, Z.; Shen, Q.; Du, Y.; Ma, R. A new insight into black blooms: Synergies between optical and chemical factors. Estuar. Coast. Shelf Sci. 2016, 175, 118–125. [Google Scholar] [CrossRef]
  40. Knaeps, E.; Dogliotti, A.I.; Raymaekers, D.; Ruddick, K.; Sterckx, S. In situ evidence of non-zero reflectance in the OLCI 1020 nm band for a turbid estuary. Remote Sens. Environ. 2012, 120, 133–144. [Google Scholar] [CrossRef]
  41. Kutser, T.; Metsamaa, L.; Dekker, A.D. Influence of the vertical distribution of cyanobacteria in the water column on the remote sensing signal. Estuarine Coast. Shelf Sci. 2008, 78, 649–654. [Google Scholar] [CrossRef]
  42. Bachmann, C.M.; Montes, M.J.; Fusina, R.A.; Parrish, C.; Sellars, J.; Weidemann, A.; Goode, W.; Nichols, C.R.; Woodward, P.; McIlhany, K.; et al. Bathymetry retrieval from hyperspectral imagery in the very shallow water limit: A case study from the Virginia Coast Reserve (VCR’07) multi-sensor campaign. Mar. Geodesy 2010, 33, 53–75. [Google Scholar] [CrossRef]
  43. Vahtmäe, E.; Kutser, T.; Martin, G.; Kotta, J. Feasibility of hyperspectral remote sensing for mapping benthic macroalgal cover in turbid coastal waters. Remote Sens. Environ. 2006, 101, 342–351. [Google Scholar] [CrossRef]
  44. Kotta, J.; Remm, K.; Vahtmäe, E.; Kutser, T.; Orav-Kotta, H. In-air spectral signatures of the Baltic Sea macrophytes and their statistical separability. J. Appl. Remote Sens. 2014, 8, 083634. [Google Scholar] [CrossRef]
  45. Dekker, A.G.; Peters, S.W.M. The use of the Thematic Mapper for the analysis of eutrophic lakes: A case study in The Netherlands. Int. J. Remote Sens. 1993, 14, 799–821. [Google Scholar] [CrossRef]
Figure 1. Locations of the study sites (GPS Visualizer).
Remotesensing 08 00497 g001
Figure 2. Reflectance spectra of extreme CDOM-rich lakes Nohipalu Mustjärv (a) and Meelva (b). The reflectance spectra shown with blue line were measured with both Lu and Ed sensor above the water surface. The reflectance spectra shown with red line were measured putting the radiance sensor surrounded with plastic tube a few centimetres below the water surface (reflectance without glint).
Remotesensing 08 00497 g002
Figure 3. Reflectance spectra of all studied Estonian and Swedish lakes.
Remotesensing 08 00497 g003
Figure 4. Correlation between the 700–720 nm peak height (P1, Equation (1)) and chlorophyll-a concentration in all studied Estonian and Swedish lakes.
Remotesensing 08 00497 g004
Figure 5. Correlation between the 810 nm peak height (P2, Equation (2)) and chlorophyll-a concentration in all studied Estonian and Swedish lakes.
Remotesensing 08 00497 g005
Figure 6. Correlation between the 810 nm peak height (P2, Equation (2)) and total suspended matter concentration in all Estonian and Swedish lakes.
Remotesensing 08 00497 g006
Figure 7. A glint-free reflectance spectrum of black-water Nohipalu Mustjärv measured with field radiometer Ramses (blue spectrum) and reflectance spectra calculated from the same spectrum using Sentinel-2 MSI (red) and Landsat 8 OLI (green) spectral response functions.
Remotesensing 08 00497 g007
Figure 8. Reflectance spectra of black-water Nohipalu Mustjärv from two different satellites. The Blue line is ATCOR23 corrected Landsat 8 data and red line is Sen2Cor corrected Sentinel 2 data.
Remotesensing 08 00497 g008
Figure 9. Fragment of a Sentinel-2 image with a small fraction of Lake Võrtsjärv (left half of the image) and an extreme CDOM-rich Lake Mustjärv.
Remotesensing 08 00497 g009
Figure 10. Absorption coefficient of CDOM from lake Nohipalu Mustjärv (red graph) and pure water absorption spectrum (blue line) [5].
Remotesensing 08 00497 g010
Table 1. Minimum, maximum, and mean concentrations of optically active substances measured in lakes under investigation. Concentration of Chl is in mg·m−3, TSS, SPIM, and SPOM in mg·L−1 and aCDOM(400) in m−1. Only maximum values are provided if there is a single measurement from a particular lake.
Nohipalu MustjärvMeelvaMustjärvMälerenHarkuVõrtsjärvPeipsi
Chl, mg·m−3
Min 11.04 7.1336.3115.062.14
Mean 14.56 24.28123.9333.7415.10
Max4.6718.077.3450.82203.3157.8338.98
aCDOM(400), m−1
Min 41.45 3.236.123.763.23
Mean 44.52 5.709.776.206.54
Max63.0549.4847.6010.0413.9911.3315.11
TSS, mg·L−1
Min 9.00 18.8910.673.330.75
Mean 9.00 29.036.1714.227.90
Max129.0026.0043.0563.3321.0023.8
SPIM, mg·L−1
Min 5.50 10.050.670.000.00
Mean 5.75 11.477.583.423.41
Max0.806.0017.0014.0522.408.6717.84
SPOM, mg·L−1
Min 3.00 7.376.333.330.00
Mean 3.25 17.5828.5810.794.84
Max16.803.509.0032.0062.515.5010.67

