
Environmental Concerns of Deforestation in Myanmar 2001–2010


School of Geographical Sciences and Urban Planning, Arizona State University, Tempe, AZ 85287, USA
*
Author to whom correspondence should be addressed.
Remote Sens. 2016, 8(9), 728; https://doi.org/10.3390/rs8090728
Submission received: 11 June 2016
/
Revised: 25 August 2016
/
Accepted: 30 August 2016
/
Published: 2 September 2016
(This article belongs to the Special Issue Mapping, Monitoring and Impact Assessment of Land Cover/Land Use Changes in South and South East Asia)
Abstract
:Deforestation in Myanmar has recently attracted much attention worldwide. This study examined spatio-temporal patterns of deforestation and forest carbon flux in Myanmar from 2001 to 2010 and environmental impacts at the regional scale using land products of the Moderate Resolution Imaging Spectroradiometer (MODIS). The results suggest that the total deforestation area in Myanmar was 21,178.8 km2, with an annual deforestation rate of 0.81%, and that the total forest carbon release was 20.06 million tons, with an annual rate of 0.37%. Mangrove forests had the highest deforestation and carbon release rates, and deciduous forests had both the largest deforestation area and largest amount of carbon release. During the study period, the south and southwestern regions of Myanmar, especially Ayeyarwady and Rakhine, were deforestation hotspots (i.e., the highest deforestation and carbon release rates occurred in these regions). Deforestation caused significant carbon release, reduced evapotranspiration (ET), and increased land surface temperatures (LSTs) in deforested areas in Myanmar during the study period. Constructive policy recommendations are put forward based on these research results.
1. Introduction
Myanmar has one of the widest distributions of forest cover worldwide. For centuries, Myanmar has been well known for its abundant forest resources, which extend from tropical rainforests in the southern Ayeyarwady delta region to alpine forests in the mountainous region of the northern Himalayas [1]. The expansive forest in Myanmar not only makes a significant contribution to global carbon sequestration but also to biodiversity conservation [2].
According to estimates, forests covered about 70% of the territory when Myanmar proclaimed its independence in 1948 [3]. In the past few decades, radical demographic, economic, and social changes in the country have placed considerable pressure on the forest cover and forest resources. As a direct results of these changes, the rate of total forest cover in Myanmar decreased from 56% in 1990 to 52.1% in 2000 [4]. At current deforestation rates, the remaining forests are predicted to have vanished by 2035 [5]. Agricultural expansion and logging are the two major driving forces of deforestation in Myanmar [4,6,7,8].
The rapid deforestation in Myanmar has attracted worldwide attention. A study of changes in forest cover patterns in Myanmar using Landsat satellite imagery reported that Myanmar lost about 12,000 km2 of forest cover nationwide over a 10 year period (1990–2000), with an annual deforestation rate of 0.3% [6]. The Food and Agriculture Organization (FAO) of the United Nations, which periodically performs a Global Forest Resources Assessment (FRA), reported a mean annual forest loss of 5,170 km2 and an annual deforestation rate of 1.4% between 1990 and 2000 in Myanmar in its FRA 2000 report [9]. However, for the same study period, the FRA 2010 report recorded a mean annual deforestation area and deforestation rate in Myanmar of 4350 km2 and 1.17%, respectively [10]. It is noteworthy that studies have reported widespread discrepancies in estimates of deforestation areas and rates, although the same organization conducted the research. Therefore, it is necessary to re-evaluate the findings of studies using different datasets and different methods.
Renner et al. determined the overall forest loss in the Northern Forest Complex in Myanmar during 1990–2000 and created a land cover map for this region [11]. Songer et al. compared spatial and temporal deforestation dynamics of tropical dry forests within and outside protected areas in Myanmar between 1972 and 2005, using Chatthin Wildlife Sanctuary as a case study [7]. They found that the highest deforestation rate occurred between 1992 and 2001. Besides deforestation, forest degradation has become another pressing issue in Myanmar. Using Popa Mountain Park as an example, Htun et al. evaluated the effectiveness of protected areas in Myanmar in preventing forest destruction [12]. Although deforestation was reduced in the protected area compared to that of the unprotected surrounding landscape, the rate of forest degradation was much higher in Popa Mountain Park than in the surrounding unprotected areas [12]. Mon et al. found that elevation and distance to the nearest town seemed to be the two most influential factors affecting both deforestation and forest degradation in production forests in the central Bago Mountain area in Myanmar [13].
All the aforementioned studies have made great contributions to the understanding of deforestation in Myanmar. However, the findings of most of these studies were based on old datasets, and some research involved only regional assessments. No systematic research has investigated deforestation and carbon release for different forest types and for each administrative division in Myanmar after 2000. In addition, little attention has been paid to environmental concerns, such as the effect of deforestation on forest carbon flux, evapotranspiration (ET), and land surface temperature (LST). To fill the gap in the literature, the primary goal of this study was to examine spatio-temporal patterns of deforestation and forest carbon flux in the entire country and in each administrative division of Myanmar between 2001 and 2010 using remotely sensed satellite imagery. An additional goal was to investigate the relationships between deforestation and carbon release, ET, and LST during this period to study the impacts of deforestation at the regional scale.
2. Study Area
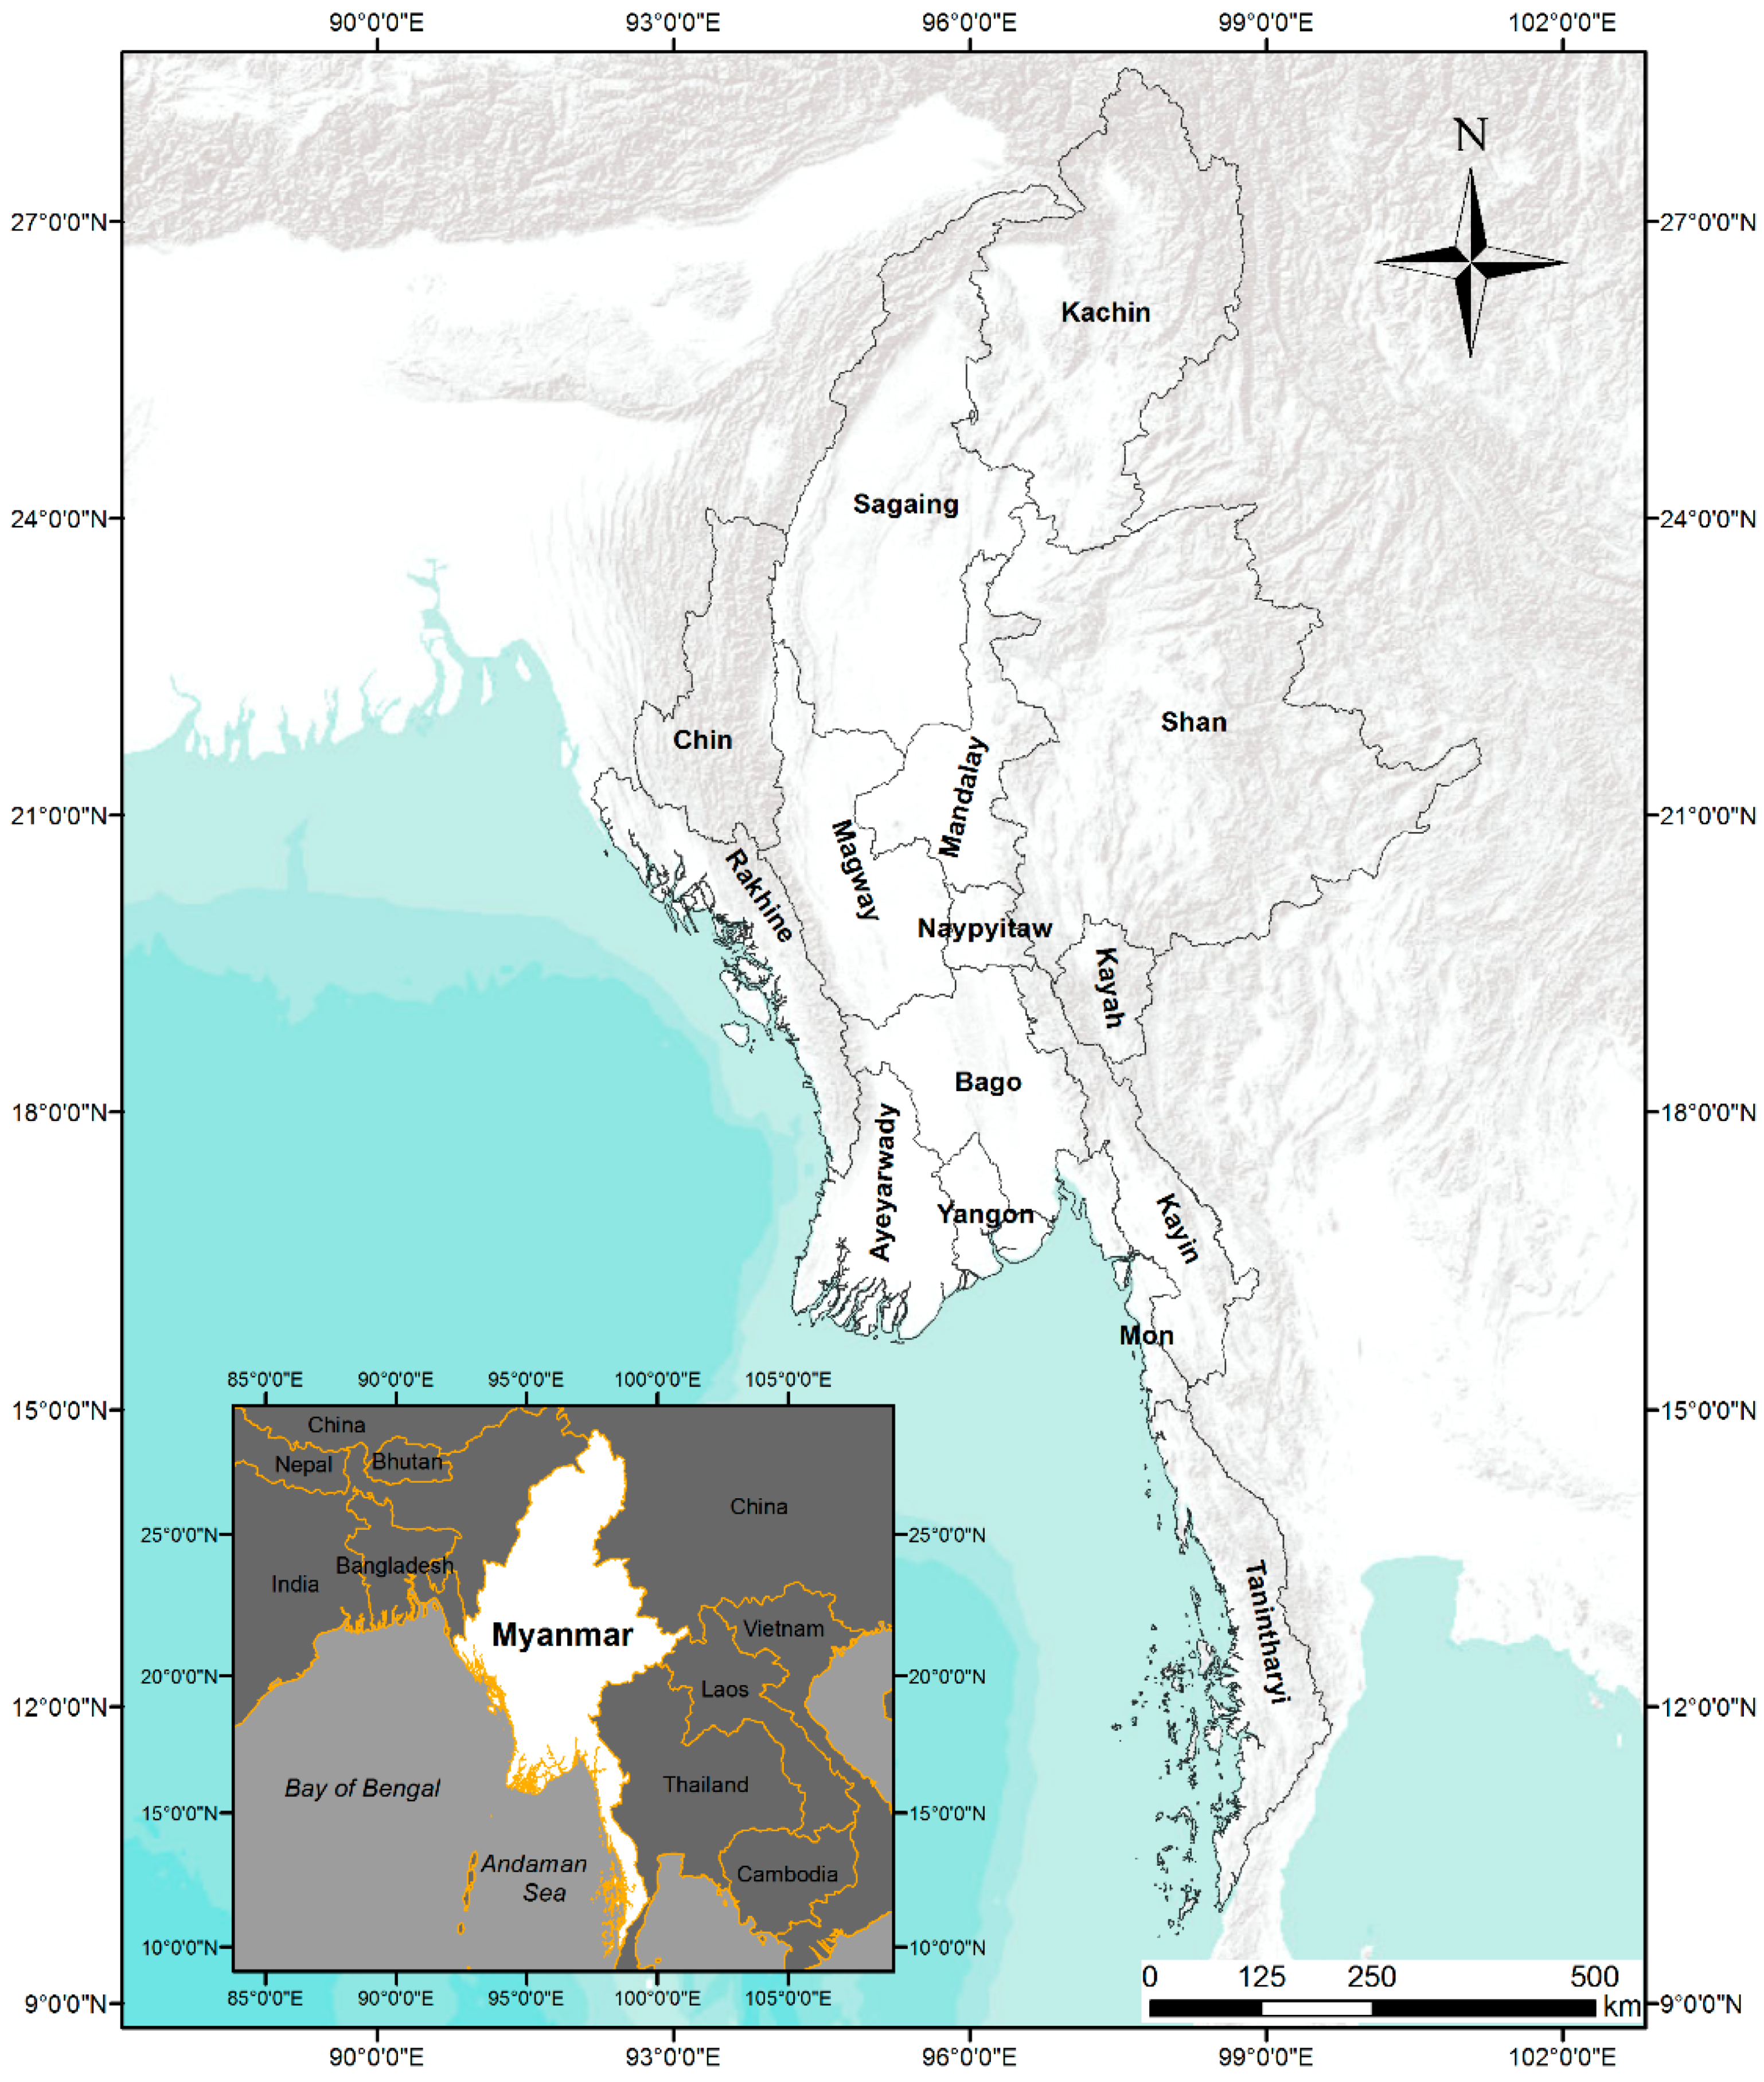
Myanmar has a tropical climate and is the largest of the countries in mainland Southeast Asia, with a size of approximately 676,600 km2 [4]. It is part of the Hindu Kush Himalaya and Greater Mekong region (Figure 1). In 2013, the total population was approximately 53.26 million, of whom 68% were Burmese [14]. A large portion of the country lies between the equator and Tropic of Cancer. It has a typical tropical monsoon climate, with three distinct seasons: a cool season from mid-October to mid-February, a hot season from mid-February to mid-May, and a rainy season from mid-May to mid-October [4]. The annual average temperature is 27.4 °C. The highest average temperature (normally higher than 30 °C) occurs in April in southern coastal and delta regions. The lowest average temperature of about 20 °C is in January in the northern mountainous area. Precipitation varies countrywide. The average annual precipitation in the Dry Zone in central Myanmar is between 500 and 1000 mm. Coastal regions receive the largest amount of rainfall (i.e., over 5000 mm annually). The annual precipitation in delta and mountainous regions is between 2500 and 5000 mm.
3. Data and Methods
3.1. Data Selection
Four sets of Moderate Resolution Imaging Spectroradiometer (MODIS) imagery were used in this research. The Percent Tree Cover (PTC) layer in the MODIS Vegetation Continuous Fields product (MOD44B) was used to study the spatio-temporal pattern of forest cover change. The PTC product has been widely used to estimate and map tree cover at global, continental, and regional scales [15,16,17]. The PTC imagery has a resolution of 250 m, and the pixel value represents the yearly average percentage of tree cover, with a valid range between 0 and 100. According to the United States Geological Survey (USGS) land-use and land-cover classification system for use with remotely sensed data, forest land is defined as land cover that has a tree crown closure percentage of 10% or more [18]. Therefore, in the present study, pixels with a PTC value consistently less than 10% throughout the study period were eliminated.
For the analysis of forest carbon stock and calculation of carbon fluxes, the Annual Net Primary Productivity (ANPP) layer in the MODIS Net Primary Productivity (NPP) product (MOD17A3) was used. The ANPP image has a spatial resolution of 1 km. Pixel values represent ANPP in kilograms of carbon per square meter per year (kg·C·m−2·year−1) after multiplying by a scale factor of 0.0001. ANPP is defined as the total amount of carbon fixation by vegetation per unit area per year, which is the peak production (or standing biomass) of vegetation in a year. Forest carbon stocks are generally not measured directly, and many studies estimate carbon stock based on the assumption that the carbon concentration of tree parts is equal to 50% of the biomass [19,20]. The annual forest carbon stock can therefore be calculated by multiplying ANPP by a scaling coefficient of 0.5. The original MODIS ANPP image pixel values were converted to carbon stock in metric tons using the following equation:
where CS is the total carbon stock in a pixel in metric tons, and PV is the original pixel value.
To determine forest cover changes and forest carbon fluxes in each forest type, this study used the continental Southeast Asia forest cover map for 2000 produced by the Institute for Environment and Sustainability of European Commission [21]. This map was produced by classification of a regional SPOT Vegetation satellite image composite. The map was reclassified to combine similar forest types. The final Myanmar forest cover map consisted of five key forest types made up of evergreen mountain forest (large continuous evergreen forests mainly found in northern and northeastern mountainous regions in Myanmar), lowland evergreen forest (including fragmented or degraded evergreen forests found at lower elevations), deciduous forest, mangrove forest, and wood/scrubland.
MODIS annual ET imagery (MOD16A3) and LST 8-day composite data (MOD11A2) were used to study ET and LST changes in deforested areas. Both products have a 1000 m resolution. An image of the annual mean LST was obtained by averaging data from 46 LST images produced each year. All the LST pixel values were converted to degrees Celsius (°C).
This procedure created 10 year (2001–2010) image stacks for PTC, carbon stock, ET, and LST, and a forest cover map for Myanmar.
3.2. MODIS PTC Data Verification
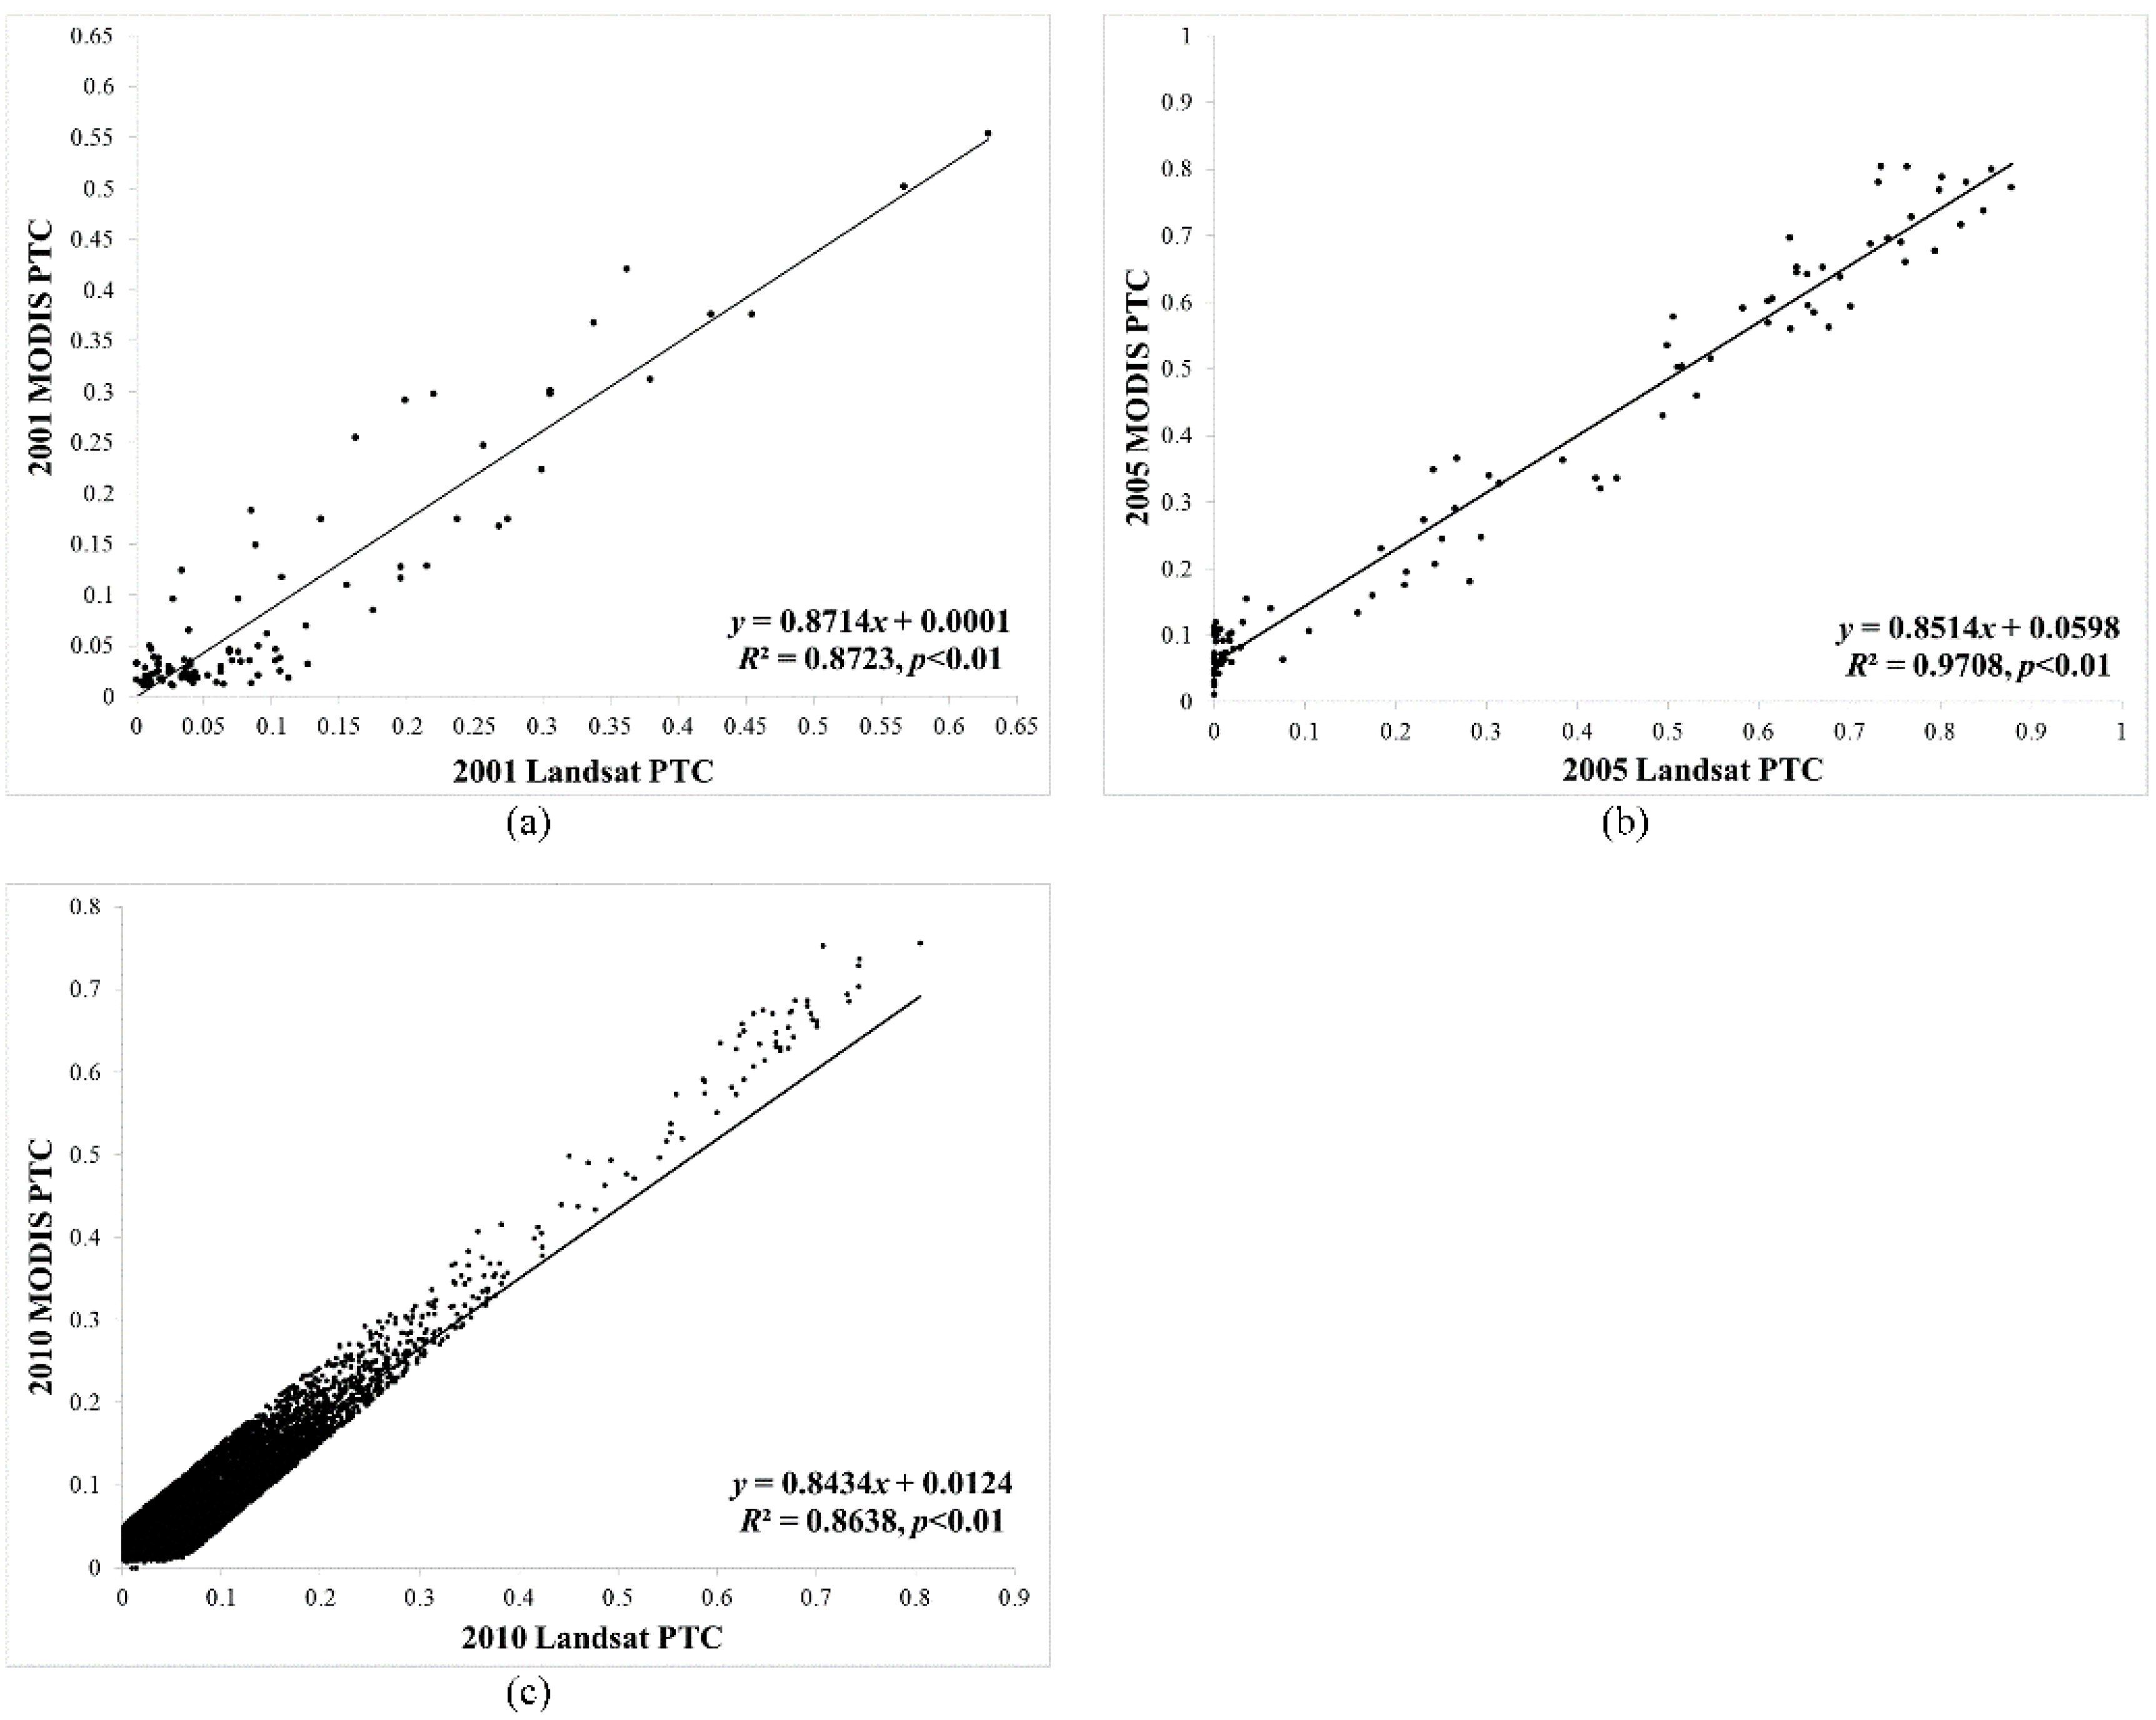
To ensure an accurate assessment of deforestation in Myanmar, the MODIS PTC data were verified using three classified cloud-free Landsat images. One Landsat 7 image collected over Naypyidaw Union Territory in 2001, one Landsat 5 scene covering the northern mountainous region in Kachin state in 2005, and one Landsat 5 scene covering the Ayeyarwady delta region in 2010 were selected and classified into trees and non-trees using a binary scheme. As Landsat images have a 30 m resolution, and PTC images have a 250 m resolution, a 25 × 25 pixels moving window was applied to the classified Landsat images to calculate the percentage of tree cover within the window. A 3 × 3 pixels moving window was applied to the MODIS PTC images to calculate the mean PTC within the window. This procedure generated two sets of PTC raster values with the same resolution. The MODIS PTC values were then analyzed against the Landsat-derived PTC values using ordinary least squares (OLS) regression. The results are shown in Figure 2. The high R2 values indicated that the relationship between these two datasets was exceptionally strong, and all the models were statistically significant at the 0.01 level (p < 0.01). Thus, the MODIS PTC data were valid for the entire study area throughout the study period and could be used to examine deforestation in Myanmar.
3.3 Image Processing and Data Analysis
Pixels of each forest type were extracted from the forest cover map. These were then used to mask 2001 and 2010 PTC and carbon stock images to obtain PTC and forest carbon stock values for every forest type for the entire country and for each administrative division in 2001 and 2010. The total area of each forest type was determined using the sum of all the PTC values multiplied by the PTC image pixel size. The total carbon stock of each forest type was calculated by adding all the carbon stock pixel values. To obtain the mean annual deforestation rate and carbon flux rate, the differences in total forest area and carbon stock between 2001 and 2010 for each forest type in each administrative division were calculated.
A time-series trend analysis of PTC, carbon stock, ET, and LST images was then performed. The 10 year pixel values from each image stack were used as the dependent variable and analyzed against the year sequence (2001–2010) with the use of OLS regression. A simple linear regression model was used, as below:
where y represents the PTC, carbon stock, LST, and ET values for each image stack, a is the slope coefficient, b is the intercept, and ε is the error term. Only pixels that showed statistically significant changes (p ≤ 0.05) in PTC, carbon stock, LST, or ET values were retained. A slope coefficient image and an R2 value image were generated for each image stack.
y = b + a × year + ε
For the image pixels that have statistically significant and synchronized changes in PTC and forest carbon stock, in PTC and ET, and in PTC and LST, the PTC slope coefficient values were analyzed vis-a-vis the carbon stock, ET, and LST slope coefficient values with the use of OLS regression to determine their relationships. The following generic model was formulated:
where aCS, aET, aLST, and aPTC are the slope coefficients from the carbon stock and ET, LST, and PTC trend analyses from Equation (2).
aCS, aET, aLST = β0 + β1 × aPTC + ε
4. Results
4.1. Deforestation and Carbon Flux in Myanmar
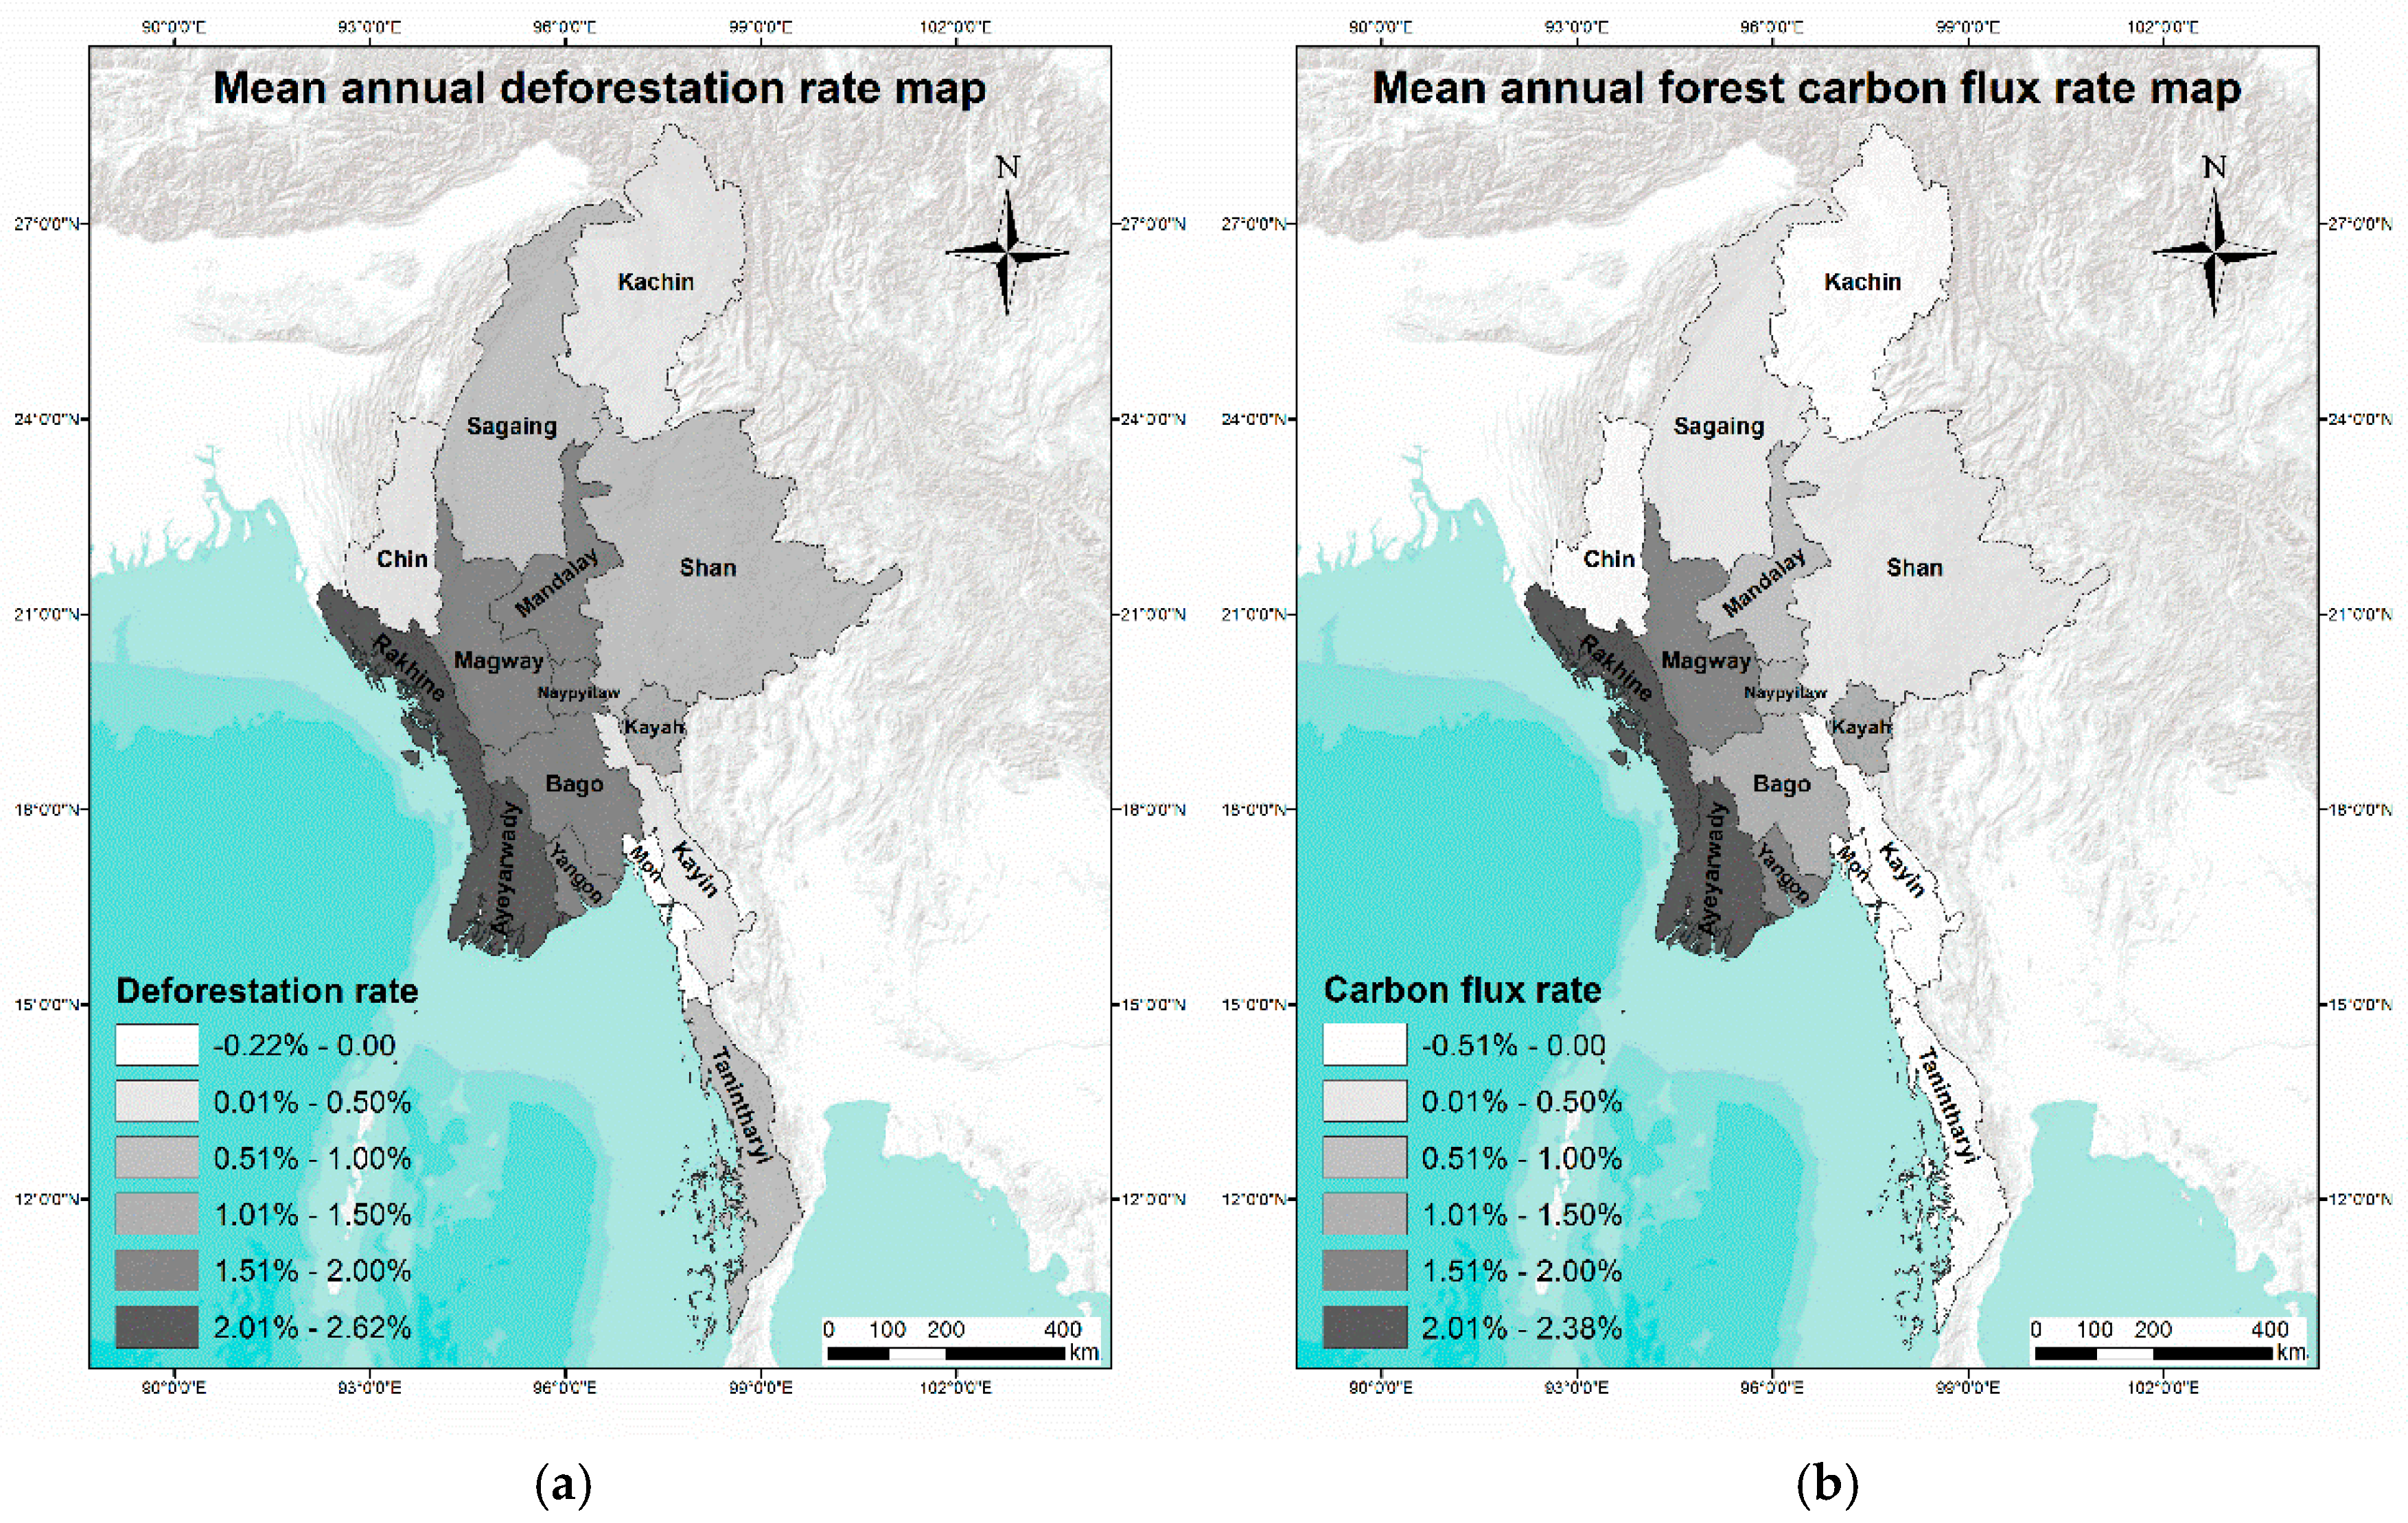
The forested areas in 2001 and 2010 and the mean annual deforestation rates by forest type are summarized in Table 1. The total percentage of forest loss for the entire country between 2001 and 2010 was 7.27%, with a mean annual deforestation rate of 0.81%. Wood/scrubland accounted for the largest cover among all the forest types in Myanmar, but it also had the largest net deforestation area (9923.1 km2). This implies that the wood/scrubland category (which can be considered a degraded forest type) has been further degraded and turned into a non-forest cover type. The highest rate of deforestation (4.68%) occurred in mangrove forests, with over 42% of the total mangrove forest area cleared within 10 years. Deciduous forest had the second-largest net forest loss (6123.75 km2) and the second-highest deforestation rate (2.26%).
Table 2 shows the carbon stock, carbon release, and mean annual carbon release rates by forest type. The total forest carbon release was about 20.06 million tons between 2001 and 2010, with a mean annual rate of 0.37%. Deciduous forest released the largest amount of carbon (about 9.77 million tons). Since 2001, mangrove forest has released more than 25% of its total carbon stock, with an annual rate of 2.79%. No carbon sequestration was found for any forest type during the study period.
Table 3 and Figure 3 summarize the deforestation and forest carbon flux rates for each administrative division in Myanmar. All the states and regions, except Mon, experienced deforestation to some extent between 2001 and 2010. Compared to the national deforestation rate of 0.81%, the top three rates of deforestation were found in Ayeyarwady (2.62%), Rakhine (2.57%), and Yangon (2%). Shan state had the largest net forest loss (5647.7 km2), but its deforestation rate was relatively low (0.93%). It is noteworthy that Rakhine state not only had the second-largest forest loss, but also the second-highest deforestation rate. Although Yangon state had the third highest deforestation rate, the total deforested area was small (141 km2). Mon state had only a small area of afforestation (60.8 km2), which equated to an annual afforestation rate of 0.22%.
Although a small degree of deforestation occurred in Chin, Kachin, and Kayin, carbon sequestration was also observed in these three states. Kachin state made the largest contribution to forest carbon sequestration. Mon state had the highest annual carbon sequestration rate of 0.51%, which was even higher than the national forest carbon release rate (0.37%). Ayeyarwady (2.38%), Rakhine (2.19%), and Yangon (1.58%) had the highest forest carbon release rates. Rakhine was responsible for the largest amount of forest carbon release, and it had the second-highest carbon release rate.
4.2. Spatio-Temporal Changes in PTC, Forest Carbon Stock, ET, and LST in Myanmar
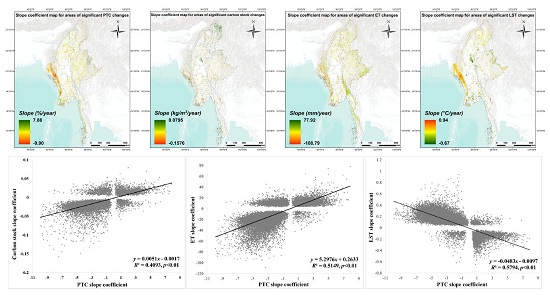
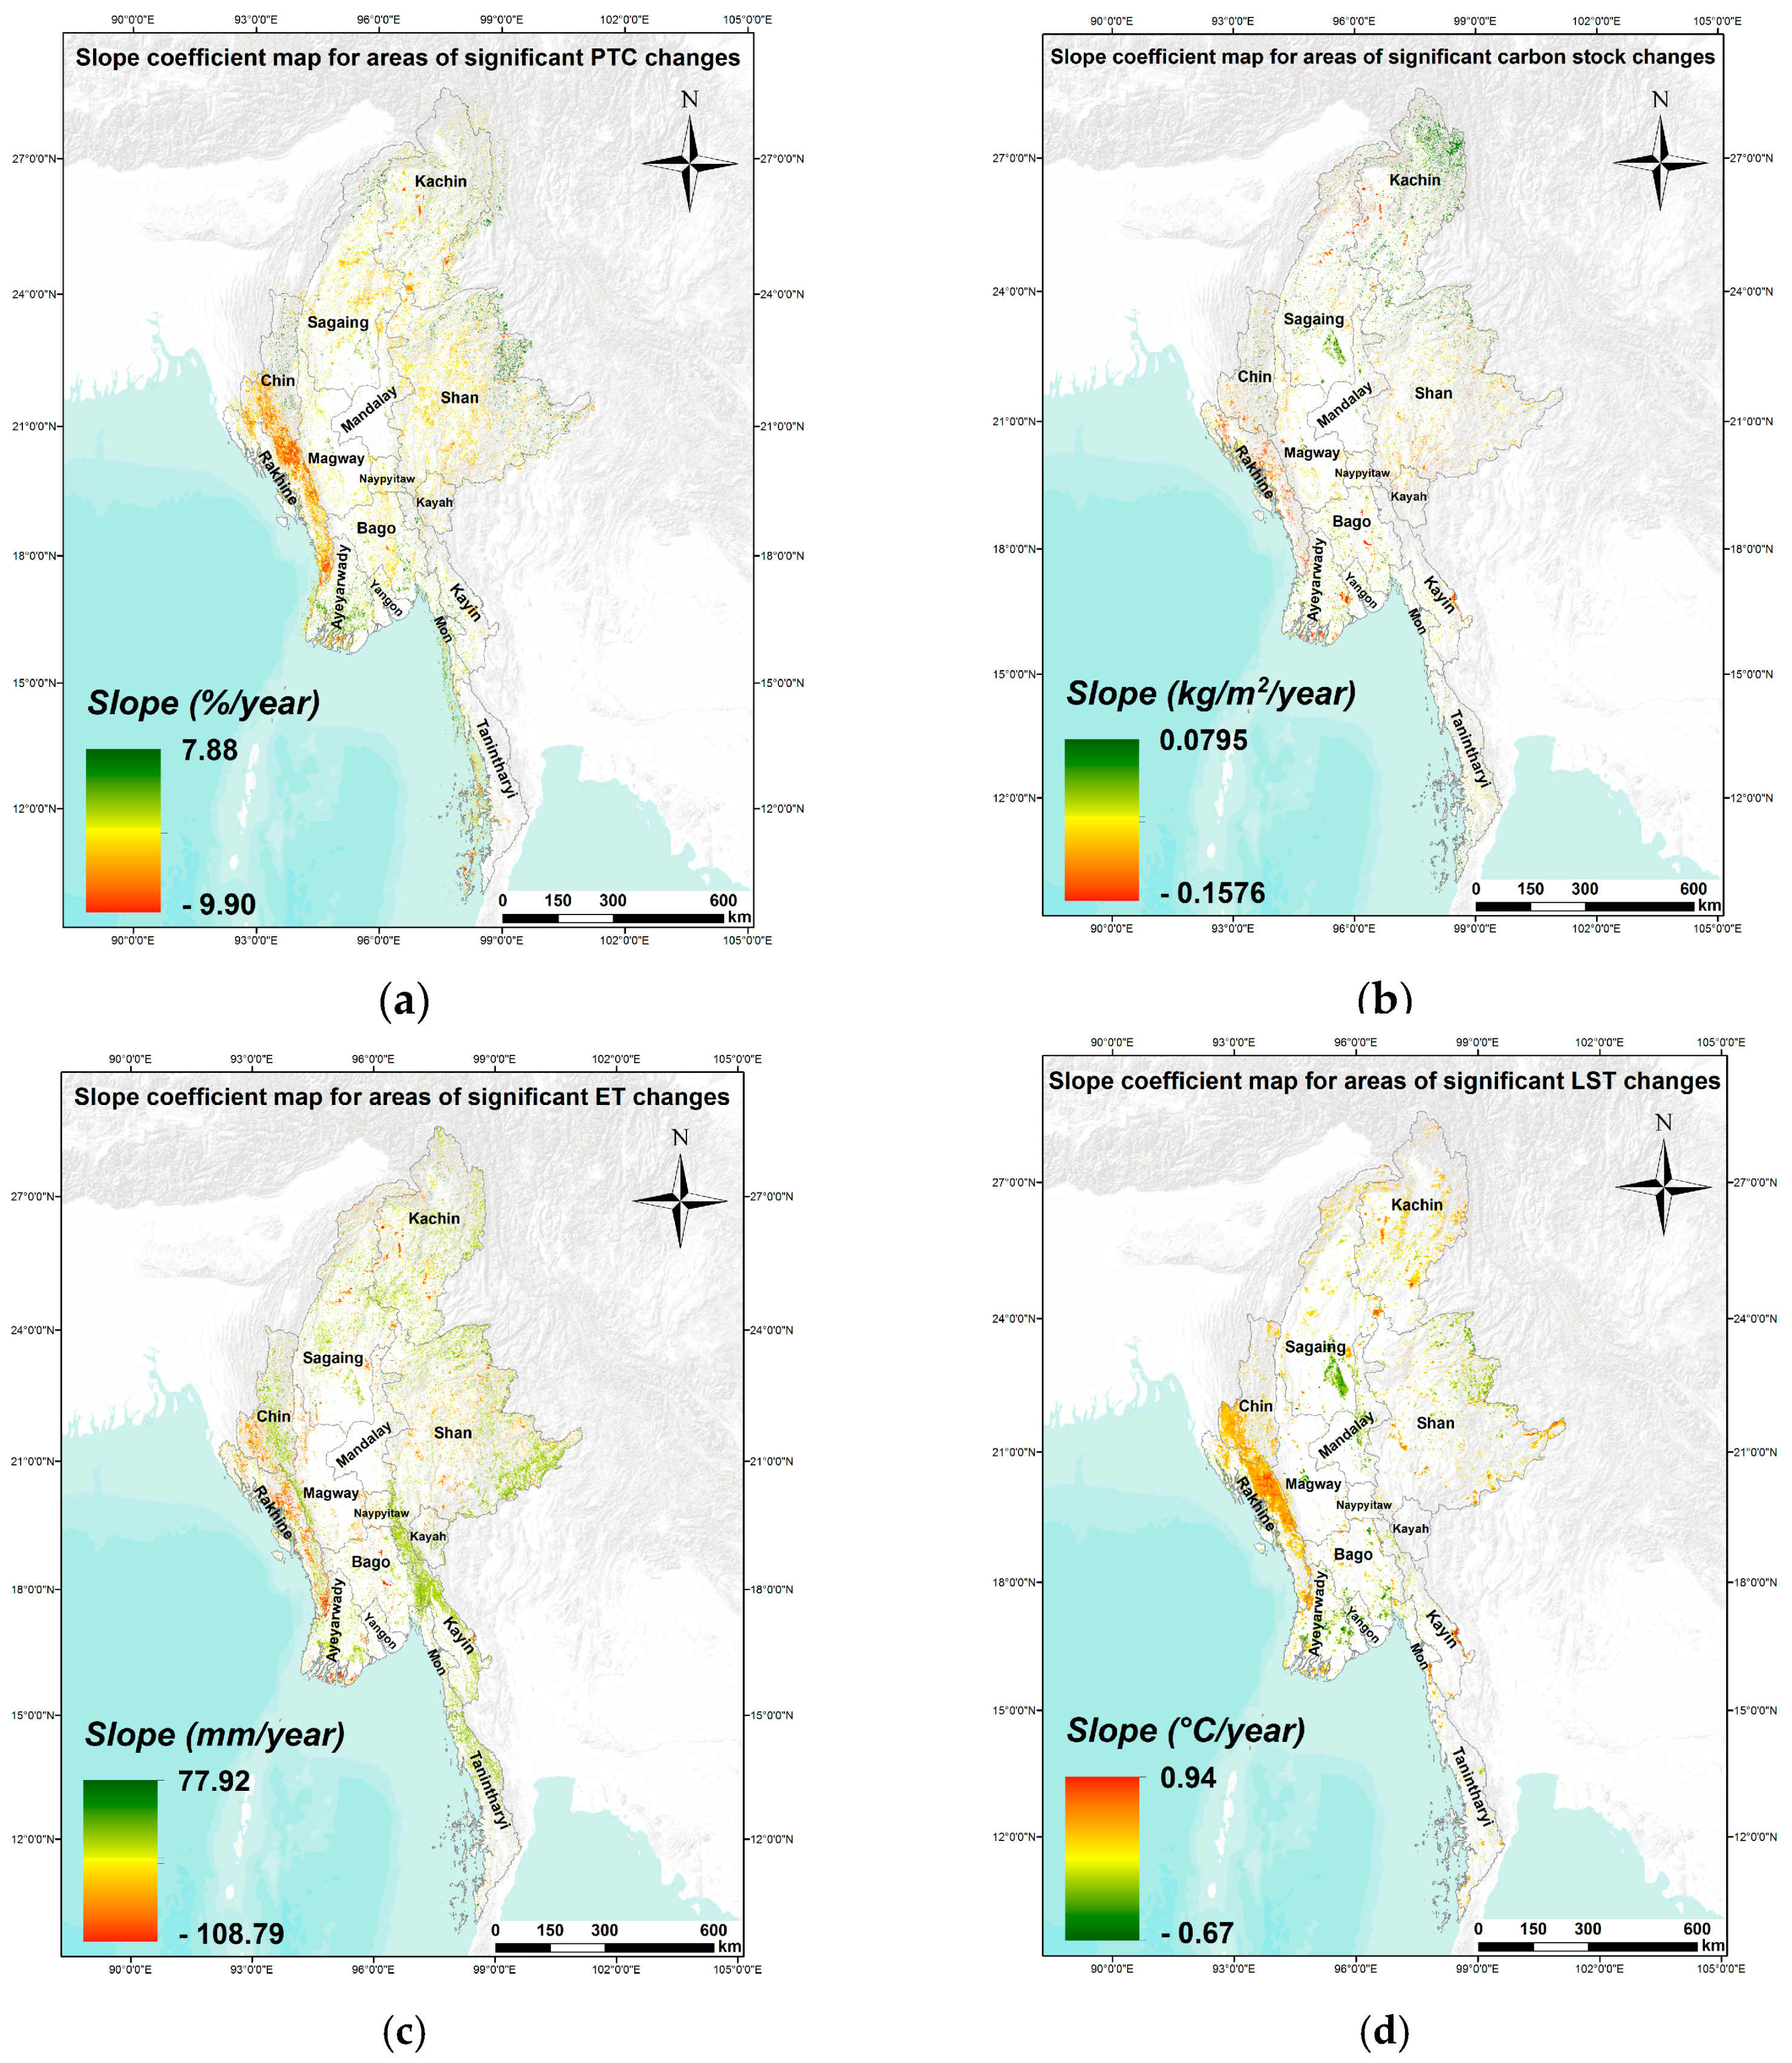
Figure 4 shows the regression results of the time-series trend analysis of PTC, forest carbon stock, ET, and LST values. Figure 4a,e shows maps of the slope coefficients and R2 values for areas of statistically significant changes in PTC between 2001 and 2010. In Figure 4a, the green- and red-colored pixels represent areas of positive and negative slope coefficients, respectively, denoting a significant increase or decrease in PTC over time and space. The highest positive slope value was 7.88. Thus, the largest increase in PTC during the study period was 70.9%. The highest negative slope was −9.9, which represented a decrease in PTC of 89.1%. During the study period, a total area of 71,275 km2 countrywide experienced a significant decrease in PTC, whereas the total area of PTC increase was only 21,467 km2. The largest continuous areas of decreased PTC were in Rakhine state (almost the entire state) and southwestern Chin state, which spreads along the southwest boarder of Myanmar (Figure 4a).
The results of the forest carbon stock trend analysis are shown in Figure 4b,f. The highest positive slope coefficient was 0.0795, which equated to forest carbon sequestration of 0.72 kg/m2. The, highest negative slope value was −0.1576, which represented forest carbon release of 1.42 kg/m2. During the study period, the total area of carbon sequestration was 24,150 km2, and the total area of carbon release was 33,524 km2. Carbon sequestration was found mainly in the north and northeastern Himalayan mountainous region in Kachin state and the Central Myanmar Basin in Sagaing state (Figure 4b). As shown in Figure 4a, the southwest boarder in Rakhine state experienced the greatest carbon release.
Figure 4c,g shows the results of the ET trend analysis. The highest decrease in ET was 108.8 mm/year, which was much greater than the highest ET increase of 77.9 mm/year. Many regions showed significant increases in ET, but Rakhine experienced a significant decrease.
The regression result maps for LST changes are shown in Figure 4d,h. The highest increase in mean annual LST between 2001 and 2010 was 0.94 °C/year, which was found in Rakhine state. The highest decrease in mean annual LST was 0.67 °C/year in Sagaing state. During the study period, Rakhine had the most significant and largest continuous area of increased LST, and Mandalay and Sagaing had the largest significant decrease in LST areas.
4.3. The Relationships between Changes in PTC and Changes in Carbon Stock, ET, and LST
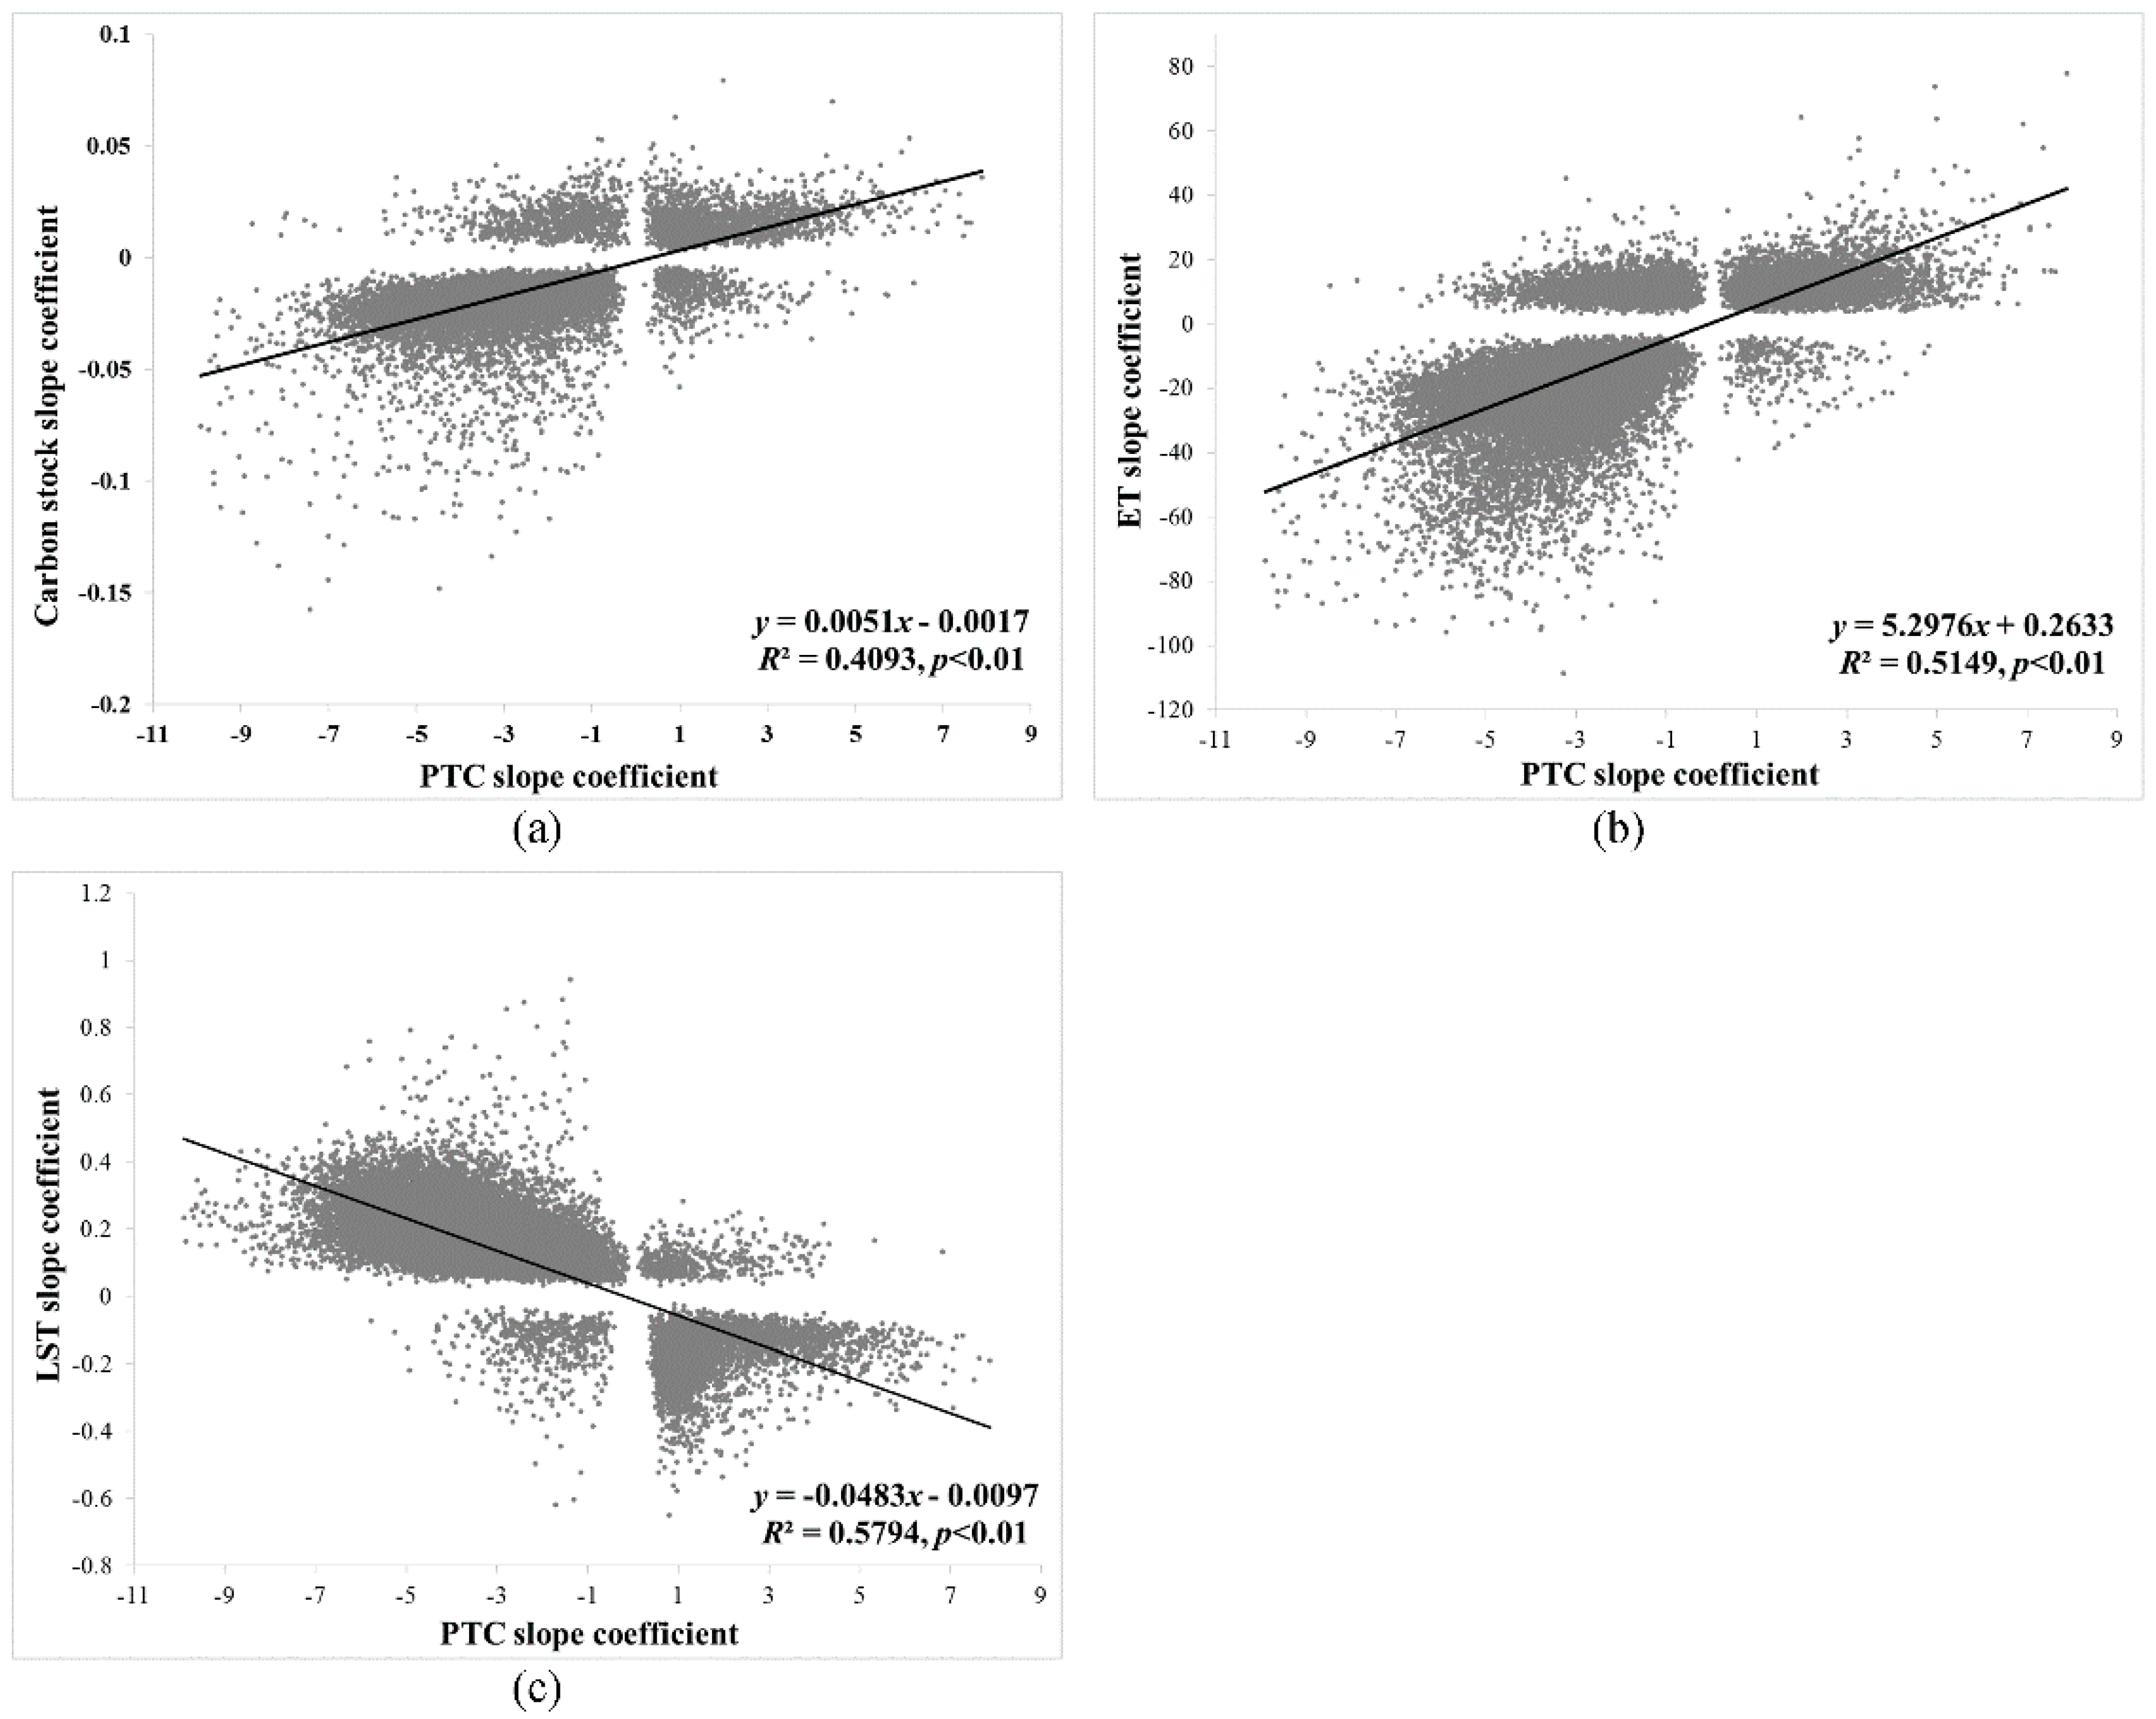
Figure 5 shows the regression analysis results for the relationships between the PTC slope coefficient values and forest carbon stock slopes (Figure 5a) obtained from the time-series trend analysis of the image stacks. Figure 5b,c shows the results for the ET slopes and LST slopes. In Figure 5, the gap around zero for both the x and y values is because of missing data. As this research only considered pixels that had significant changes, slope coefficient values near zero were eliminated. All the regression equations were statistically significant at the 0.01 level (p < 0.01). According to the R2 values, the models explained 40.9%, 51.5%, and 57.9% of the total variation in forest carbon stock change, ET change, and LST change, respectively. Strong positive relationships were found between PTC and forest carbon stock slopes and between PTC and ET slopes, whereas there was a negative relationship between PTC and LST slopes. According to the model slope coefficient values, a 1% decrease in PTC would result in an average carbon release of 0.0051 kg/m2, an average decrease of 5.30 mm/year in ET, an average increase of 0.04 °C in LST, and vice versa. The total PTC decrease between 2001 and 2010 was 7.27%. Thus, countrywide, the estimated average carbon release was 0.037 kg/m2, the estimated average ET decrease was 38.53 mm/year, and the estimated average increase in LST was 0.349 °C.
5. Discussion
5.1. Overview of Changes in Forest Cover
The scale of deforestation in Myanmar has been unprecedented during the study period. According to Myanmar Forest Resource Assessments, the forest cover in the country in 2010 was 317,730 km2, representing 46.96% of the total country area [22]. According to the present study, the total forest cover area in Myanmar was estimated to be 291,354.78 km2 in 2001 and 270,176.03 km2 in 2010, representing 43.06% and 39.93% of the total national territory area, respectively. Thus, the current estimation of forest cover in 2010 is nearly 15% (47,553.97 km2) lower than that of the official assessment. Errors and uncertainties in the MOD44 product used to predict the deforestation area and deforestation rate in this study may be responsible for the different estimates. Although the correlation between the PTC values and classified Landsat PTC values was significantly high, the data validation analysis showed that the PTC values were somewhat underestimated as compared with the classified Landsat PTC values (Figure 2). Therefore, the total forest area in 2001 and 2010 may have been underestimated.
The results pointed to a net forest loss of 21,178.75 km2 countrywide, and a mean deforestation rate of 0.81% annually between 2001 and 2010. This deforestation rate is lower than that reported in the FAO 2010 report (0.93%) [10]. Compared with reports in the 1990s [6,9], this study shows that deforestation has accelerated rapidly in Myanmar since 2001. According to the FAO 2010 report, in the 2000s, the total loss of forest cover for South and Southeast Asia was 67,700 km2, with an annual rate of loss of 0.23% [10]. Thus, Myanmar contributed more than 28% of the entire forest loss in South and Southeast Asia, although its territory only covers 7.5% of the total area. In response to this alarming deforestation rate, the Ministry of Environmental Conservation and Forestry of Myanmar prepared the 4th National Report on Biodiversity in 2009 as part of the United Nations Convention of Biological Diversity, the goal of which was to take appropriate action on forest conservation. The Ministry also adopted the multi-sectoral National Biodiversity Strategy and Action Plan in 2011. In a collaboration with the ASEAN Centre for Biodiversity for conservation of tropical ecosystems, 32 ASEAN heritage parks, including seven in Myanmar (Alaungdaw Kathapa National Park, Hkakaborazi National Park, Natmataung National Park, Lampi Marine National Park, Inlay Lake wetland bird sanctuary, Indawgyi wetland wildlife sanctuary, and Meinmahla Kyun wildlife sanctuary) have been established in ASEAN countries [22].
Among the different types of forests in Myanmar, mangrove ecosystems were the most vulnerable forest resource during the study period. Within 10 years, over 42% of the total mangrove forest area was cleared, with the highest deforestation rate being 4.68%. Mangroves in Myanmar are found mainly in coastal regions in the administrative divisions of Ayeyarwady, Rakhine, and Tanintharyi. Unfortunately, Ayeyarwady and Rakhine also have the highest deforestation and carbon release rates. A previous study reported that Rakhine, the Ayeyarwady delta, and Tanintharyi were mangrove deforestation hotspots between 1975 and 2005, with annual deforestation rates of 1% [23]. The results of the present study revealed that the deforestation rate accelerated in Rakhine and Ayeyarwady between 2001 and 2010, but that deforestation declined in Tanintharyi during the same period (Table 3). Mangrove forests in Myanmar grow mainly in coastal regions where the population is highest, and human activities are prevalent. Thus, deforestation rates are higher in mangrove forests than in other types of forests. Studies demonstrated that the major causes of mangrove deforestation included agricultural expansion [23,24], aquaculture development [23,25], logging [26], and industrial and urban development [23,24]. Mangroves are extremely valuable to the ecosystem, as they can help stabilize shorelines, reduce the devastating impacts of natural disasters such as tsunamis and hurricanes, and serve as breeding and nursing grounds for marine species [23]. They are also sources of food, medicine, fuel, and building materials for local people [23]. Therefore, the protection of mangrove forest resources in Myanmar—especially Ayeyarwady and Rakhine—requires urgent attention.
Evergreen mountain forests are mainly found in the northern and northeastern Himalayan mountainous region, with over 90% of such forests found in Kachin state. From 1991 to 1999, the overall deforestation rate in the Northern Forest Complex of Myanmar was lower than 0.01% (i.e., nearly undetectable) [11]. The present study showed that the deforestation rate of evergreen mountain forest increased rapidly (0.21%) between 2001 and 2010.
Between 1990 and 2000, the administrative divisions of Ayeyarwady (1.2%), Mandalay (0.5%), and Sagaing (0.4%) were reported to have the highest deforestation rates [6]. The results of the current study suggest that deforestation rates have been exacerbated rather than alleviated in these three administrative divisions since 2000, with deforestation rates accelerating to 2.62%, 1.60%, and 0.83%, respectively. Rakhine, Yangon, and Naypyidaw Union Territory also experienced unprecedented levels of forest loss during the study period. Surprisingly, Rakhine not only had the second-highest deforestation rate (2.57%) but also the second-largest deforested area (3914.19 km2), the largest amount of carbon release (6.78 million tons), and the second-highest carbon release rate (2.19%) among all the administrative divisions. This result corresponds to the Myanmar forestry outlook study in 2009, which reported that Rakhine state was a major deforestation area from 2000 to 2005 [4]. The deforestation in Rakhine was mainly due to agricultural growth, excessive fuel-wood exploitation, and illegal mangrove forest logging activities [27]. Rakhine is not a densely populated division, and it was not subject to high population growth during the study period. Thus, the rapid and extensive deforestation in this state needs urgent attention. Yangon had the third-highest deforestation rate and carbon release rate because Yangon was the capital of the country before 2006. Deforestation activities were mainly due to urbanization and urban sprawl. Naypyidaw Union Territory had the fourth-highest deforestation rate (3.17%). Naypyidaw has officially been Myanmar’s new capital city since 2006, but construction activities commenced in 2002. Therefore, deforestation activities were accelerated because of extensive urban development and infrastructure construction in the city.
5.2. Forest Carbon Stock and Carbon Flux
The role of the tropics as a net carbon sink due to the existence of large areas of tropical forests is well known [28]. The results of the present study provide evidence that deforestation has caused significant carbon fluxes from forests in Myanmar (Table 2 and Figure 5a). However, there are large discrepancies between the results of the present study and those of the FRA 2010 Country Reports [29]. The present study found that the total forest carbon stock in 2001 and 2010 was 608.4 and 588.3 million tons, respectively, and that the total net forest carbon release was 20.06 million tons in Myanmar between 2001 and 2010. In contrast, the FAO 2010 Country Reports stated that the total forest carbon stock in 2000 and 2010 was 1512 and 1378 million tons, respectively, and that the total carbon release was 134 million tons [29].
The significant relationship between the change in PTC and change in carbon stocks (Figure 5a) demonstrated a close connection between deforestation and carbon release. Although the model slope coefficient was small, it was highly significant.
5.3. The Impacts of Deforestation on Regional Environments
According to the regression analysis shown in Figure 5b,c, deforestation in Myanmar can significantly reduce ET and increase LST. This result is in agreement with findings presented by Shukla et al. based on an Amazon deforestation study [30]. Sud et al. also found that tropical deforestation dramatically altered temperature, relative humidity, wind, and precipitation levels [31]. In tropical regions, deforested lands were found to increase surface albedo [31,32], reduce surface roughness length [31], and reduce absorption of incoming solar radiation, thereby increasing outgoing longwave radiation, as well as the ratio of convective sensible heat flux to latent heat flux from the land surface [33]. As a result, ET decreased, and the planetary boundary layer warmed up [30,31].
As shown in Figure 5, it is noteworthy that as the PTC increased, forest carbon stock and ET also increased, and LST decreased. In other words, large areas of reforestation can help carbon sequestration, increase surface evaporation and transpiration, and lower surface temperature, thereby playing a significant role in conserving regional environments and restoring regional climates.
5.4. The Implications of the Research Findings on Myanmar Forest Policy
Based on the results, five constructive suggestions are proposed. First, the government should financially and politically encourage the sustainable exploitation of forest resources, as well as reforestation or afforestation activities. Doing so would not only rehabilitate and increase the productivity of formerly forested lands, but also increase the overall forested area. Second, the FRA 2010 Country Reports indicated that the total area of forest reserves in Myanmar in 2000 was 638.44 km2 [29], which equated to only 0.22% of the total forested land. Although the area of forest reserves had increased to 2060.60 km2 by 2010 [29], it remained at less than 1% (0.76%) of the total forested area. Therefore, the government needs to take immediate action to establish larger national forest reserves, formulate stronger law enforcement measures and forest policy, and create a new agency to protect forest reserves—especially mangroves and degraded forests. Third, the government should stimulate and encourage the transition from a resource-dependent economy to an environmentally-friendly one through the development of technology-intensive industries and labor-intensive manufacturing industries. Fourth, instead of commercial logging for both timber export and domestic use, the country should consider well-managed eco-tourism in protected areas and remote forest areas, which have outstanding aesthetic views, especially coastal wetlands, mangrove forests, and wildlife reserves. Finally, detailed research and investigations in the state of Rakhine and Ayeyarwady should be conducted immediately to determine the major causes of rapid and large-scale deforestation activities. Immediate forest-control policies should be formulated and implemented. Moreover, the decreasing trends in forest cover, ET, and carbon stock, and increasing trends of LST—especially with regards to points (pixels) within each state and administrative division—need to be addressed, and thorough field surveys should be conducted. Areas experiencing extensive charcoal production and fuelwood consumption, under the pressure of house building and infrastructure development, shifting cultivation, agriculture expansion, and other local pressure require community forestry and agro-forestry activities where the local communities play a significant role in managing nearby forests and establishing forest plantations.
5.5. Uncertainties, Errors, and Accuracies
All the analyses in this study were based on standard MODIS land products that are being used by researchers from a variety of disciplines worldwide. These products are produced, validated, and distributed by the National Aeronautics and Space Administration. In studies of the overall accuracy of PTC images from the MOD44 product, a standard error of 15.6% was reported from training data and 11.5% from field test data [16]. In the present study, the ANPP image from the MOD17 product was used to predict forest carbon stock and carbon flux. The mean error obtained using this product was within 9% of averaged published errors [34]. The LST image from the MOD11 product was validated within 1 K accuracy using in situ measurements in the LST range of 263–322 K and an atmospheric column water vapor range of 0.4–3.0 cm [35]. The correlation coefficient between flux tower ET measurements and MODIS ET predictions from the MOD16 product was 0.86 [36]. Although errors and uncertainties from instruments and modeling procedure are inevitable, all the MODIS products used in this study met general standards and were of high scientific quality.
6. Conclusions
This study updates the deforestation status in Myanmar for the period of 2001–2010 and advances knowledge on the impacts of deforestation at the regional scale. The results suggested that deforestation accelerated rapidly in Myanmar between 2001 and 2010. Within 10 years, a total of 21,179 km2 of forest was lost nationwide, with a mean annual deforestation rate of 0.81% and a mean annual carbon release rate of 0.37%. Mangrove forest was the most vulnerable forest type and experienced the highest deforestation rate of 4.68% and highest carbon release rate of 2.79%. Deforestation and carbon release hotspots were found mainly along the southwest coast in Rakhine and Ayeyarwady. Deforestation caused significant carbon release, reduced ET, and increased LST in deforested areas in Myanmar during the study period. A 1% decrease of PTC would lead to the release of an average of 0.0051 kg/m2 of carbon, resulting in an average decrease of 5.30 mm/year in ET and 0.048 °C in LST. Although deforestation in Myanmar is less critical than that in other tropical countries, there is no place for complacency. As the findings suggest, deforestation activities have led to adverse environmental changes at the regional scale. Balancing socio-economic development with the preservation of forest resources in Myanmar remains a significant challenge. Deforestation should not be ignored. It is imperative for the government to take immediate measures to formulate new forest policies to protect forest resources.
Author Contributions
All the authors conceived and designed the study; C.W. collected and processed all the data; C.W. and S.W.M. analyzed the data; C.W. wrote the paper; S.W.M. edited and helped finalize the paper.
Conflicts of Interest
The authors declare no conflict of interest.
References
- Bryant, R.L. The Political Ecology of Forestry in Burma, 1824–1994; C. Hurst & Co.: London, UK, 1997. [Google Scholar]
- Myers, N.; Mittermeier, R.A.; Mittermeier, C.G.; Da Fonseca, G.A.B.; Kent, J. Biodiversity hotspots for conservation priorities. Nature 2000, 403, 853–858. [Google Scholar] [CrossRef] [PubMed]
- Seekins, D.M. Historical Dictionary of Burma (Myanmar), Historical Dictionaries of Asia, Oceania, and the Middle East, No. 59; The Scarecrow Press, Inc.: Lanham, MD, USA, 2006. [Google Scholar]
- Htun, K. Asia-Pacific Forestry Sector Outlook Study II: Myanmar Forestry Outlook Study; Working Paper No. ASFSOS II/WP/2009/07; Food and Agriculture Organization of the United Nations, Regional Office for Asia and the Pacific: Bangkok, Thailand, 2009. [Google Scholar]
- Peace Child Charitable Trust. Rescue Mission: Planet Earth: A children’s Edition of Agenda 21 in Association with the United Nations; Kingfisher Books: London, UK, 1994. [Google Scholar]
- Leimgruber, P.; Kelly, D.S.; Steininger, M.K.; Brunner, J.; Müller, T.; Songer, M. Forest cover change patterns in Myanmar (Burma) 1990–2000. Environ. Conserv. 2005, 32, 356–364. [Google Scholar] [CrossRef]
- Songer, M.; Aung, M.; Senior, B.; DeFries, R.; Leimgruber, P. Spatial and temporal deforestation dynamics in protected and unprotected dry forests: a case study from Myanmar (Burma). Biodivers. Conserv. 2009, 18, 1001–1018. [Google Scholar] [CrossRef]
- Webb, E.L.; Jachowski, N.R.A.; Phelps, J.; Friess, D.A.; Than, M.M.; Ziegler, A.D. Deforestation in the Ayeyarwady Delta and the conservation implications of an internationally-engaged Myanmar. Glob. Environ. Chang. 2014, 24, 321–333. [Google Scholar] [CrossRef]
- FAO. Global Forest Resources Assessment 2000 (FRA 2000); Food and Agriculture Organizations of the United Nations: Rome, Italy, 2000. [Google Scholar]
- FAO. Global Forest Resources Assessment 2010 Main Report (FRA 2010); Food and Agriculture Organizations of the United Nations: Rome, Italy, 2010. [Google Scholar]
- Renner, S.C.; Rappole, J.H.; Leimgruber, P.; Kelly, D.S.; Shwe, N.M.; Aung, T.; Aung, M. Land cover in the northern forest complex of Myanmar: New insights for conservation. Oryx 2007, 41, 27–37. [Google Scholar] [CrossRef]
- Htun, N.Z.; Mizoue, N.; Kajisa, T.; Yoshida, S. Deforestation and forest degradation as measures of Popa Mountain Park (Myanmar) effectiveness. Environ. Conserv. 2010, 36, 218–224. [Google Scholar] [CrossRef]
- Mon, M.S.; Mizoue, N.; Htun, N.Z.; Kajisa, T.; Yoshida, S. Factors affecting deforestation and forest degradation in selectively logged production forest: A case study in Myanmar. Forest Ecol. Manag. 2012, 267, 190–198. [Google Scholar] [CrossRef]
- The World Bank. World Development Indicators: Population, Total. Available online: http://data.worldbank.org/indicator/SP.POP.TOTL (accessed on 9 June 2016).
- Hansen, M.C.; DeFries, R.S.; Townshend, J.R.G.; Sohlberg, R.; Dimiceli, C.; Carroll, M. Towards an operational MODIS continuous field of percent tree cover algorithm: Examples using AVHRR and MODIS data. Remote Sens. Environ. 2002, 83, 303–319. [Google Scholar] [CrossRef]
- Hansen, M.C.; DeFries, R.S.; Townshend, J.R.G.; Carroll, M.; Dimiceli, C.; Sohlberg, R.A. Global percent tree cover at a spatial resolution of 500 meters: First results of the MODIS vegetation continuous fields algorithm. Earth Interact. 2003, 7, 1–15. [Google Scholar] [CrossRef]
- Hansen, M.C.; Townshend, J.R.G.; DeFries, R.S.; Carroll, M. Estimation of tree cover using MODIS data at global, continental and regional/local scales. Int. J. Remote Sens. 2005, 26, 4359–4380. [Google Scholar] [CrossRef]
- Anderson, J.R.; Hardy, E.E.; Roach, J.T.; Witmer, R.E. A Land Use and Land Cover Classification System for Use with Remote Sensor Data; U.S. Geol. Survey Prof. Paper 964; US Government Printing Office: Washington, DC, USA, 1976; p. 28.
- Brown, S. Estimating Biomass and Biomass Change of Tropical Forests: A Primer; FAO Forestry Paper 134; Food and Agriculture Organization of the United Nations: Rome, Italy, 1986. [Google Scholar]
- Birdsey, R.A. Carbon Storage and Accumulation in United States Forest Ecosystems; Gen. Tech. Rep. WO-59; Department of Agriculture, Forest Service: Washington, DC, USA, 1992; p. 51.
- Stibig, H.-J.; Beuchle, R. Forest Cover Map of Continental Southeast Asia at 1:4,000,000: Derived from SPOT4-VEGETATION Satellite Images; TREES Publications Series D: Thematic outputs No. 4; Publications Office of the European Union: Luxembourg, 2003. [Google Scholar]
- MOECAF. Facts about Environmental Conservation and Forestry in Myanmar; Ministry of Environmental Conservation and Forestry: Myanmar, 2014.
- Giri, C.; Zhu, Z.; Tieszen, L.L.; Singh, A.; Gillette, S.; Kelmelis, A. Mangrove forest distributions and dynamics (1975–2005) of the tsunami-affected region of Asia. J. Biogeogr. 2008, 35, 519–528. [Google Scholar] [CrossRef]
- Linden, O.; Jernelov, A. The mangrove swamps: An ecosystem in danger. Ambio 1980, 9, 81–88. [Google Scholar]
- Nurkin, B. Degradation of mangrove forest in South Sulawesi, Indonesia. Hydrobiologia 1994, 285, 1115–1138. [Google Scholar] [CrossRef]
- Ong, J.E. Mangroves and aquaculture in Malaysia. Ambio 1982, 11, 252–257. [Google Scholar]
- Oo, N.W. Present state and problems of mangrove management in Myanmar. Trees 2002, 16, 218–223. [Google Scholar] [CrossRef]
- Ciais, P.; Tans, P.P.; White, J.W.C.; Trolier, M.; Francey, R.J.; Berry, J.A.; Randall, D.R.; Sellers, P.J.; Collatz, J.G.; Schimel, D.S. Partitioning of ocean and land uptake of CO2 as inferred by δ13C measurements from the NOAA Climate Monitoring and Diagnostics Laboratory Global Air Sampling Network. J. Geophys. Res. 1995, 100, 5051–5070. [Google Scholar] [CrossRef]
- FAO. Global Forest Resources Assessment 2010 Country Report, Myanmar; Food and Agriculture Organizations of the United Nations: Rome, Italy, 2010. [Google Scholar]
- Shukla, J.; Nobre, C.; Sellers, P. Amazon deforestation and climate change. Science 1990, 247, 1322–1325. [Google Scholar] [CrossRef] [PubMed]
- Sud, Y.C.; Walker, G.K.; Kim, J.H.; Liston, G.E.; Sellers, P.J.; Lau, W.K.M. Biophysical consequences of a tropical deforestation scenario: A GCM simulation study. J. Clim. 1996, 9, 3225–3247. [Google Scholar] [CrossRef]
- Bastable, H.G.; Shuttleworth, W.J.; Dallarosa, R.L.G.; Fisch, G.; Nobre, C.A. Observations of climate, albedo, and surface radiation over cleared and undisturbed Amazonia forest. Int. J. Climatol. 1993, 13, 783–796. [Google Scholar] [CrossRef]
- Wright, I.R.; Gash, J.H.C.; Da Rocha, H.R.; Shuttleworth, W.J.; Nobre, C.A.; Maitelli, G.T.; Zamparoni, C.A.G.P.; Carvalho, P.R.A. Dry season micrometeorology of central Amazonian ranchland. Q. J. R. Meteorol. Soc. 1992, 118, 1083–1099. [Google Scholar] [CrossRef]
- Zhao, M.; Running, S.W.; Nemani, R.R. Sensitivity of moderate resolution imaging spectroradiometer (modis) terrestrial primary production to the accuracy of meteorological reanalyses. J. Geogr. Res. Biogeosci. 2006. [Google Scholar] [CrossRef]
- Wan, Z.; Zhang, Y.; Zhang, Q.; Li, Z.-L. Validation of the land-surface temperature products retrieved from terra moderate resolution imaging spectroradiometer data. Remote Sens. Environ. 2002, 83, 163–180. [Google Scholar] [CrossRef]
- Mu, Q.; Zhao, M.; Running, S.W. Improvements to a MODIS global terrestrial evapotranspiration algorithm. Remote Sens. Environ. 2011, 111, 1781–1800. [Google Scholar] [CrossRef]
Figure 1.
Map of study area.

Figure 2.
The relationship between percent tree cover (PTC) values derived from classified Landsat images and Moderate Resolution Imaging Spectroradiometer (MODIS) PTC values. The Landsat PTC values in (a) were derived from a classified Landsat 7 image that was collected over Naypyidaw Union Territory in 2001; The Landsat PTC values in (b) were calculated from a classified Landsat 5 scene that covers the northern mountainous region in Kachin state in 2005; The Landsat PTC values from (c) were derived from a classified Landsat 5 scene that covers the Ayeyarwady delta region in 2010. All the regression equations are statistically significant at the 0.01 level (p < 0.01).

Figure 3.
Mean annual deforestation rate map (a); and mean annual forest carbon flux rate map (b) for Myanmar between 2001 and 2010. Negative numbers denote afforestation and carbon sequestration, and positive numbers indicate deforestation and carbon release.
Figure 3.
Mean annual deforestation rate map (a); and mean annual forest carbon flux rate map (b) for Myanmar between 2001 and 2010. Negative numbers denote afforestation and carbon sequestration, and positive numbers indicate deforestation and carbon release.

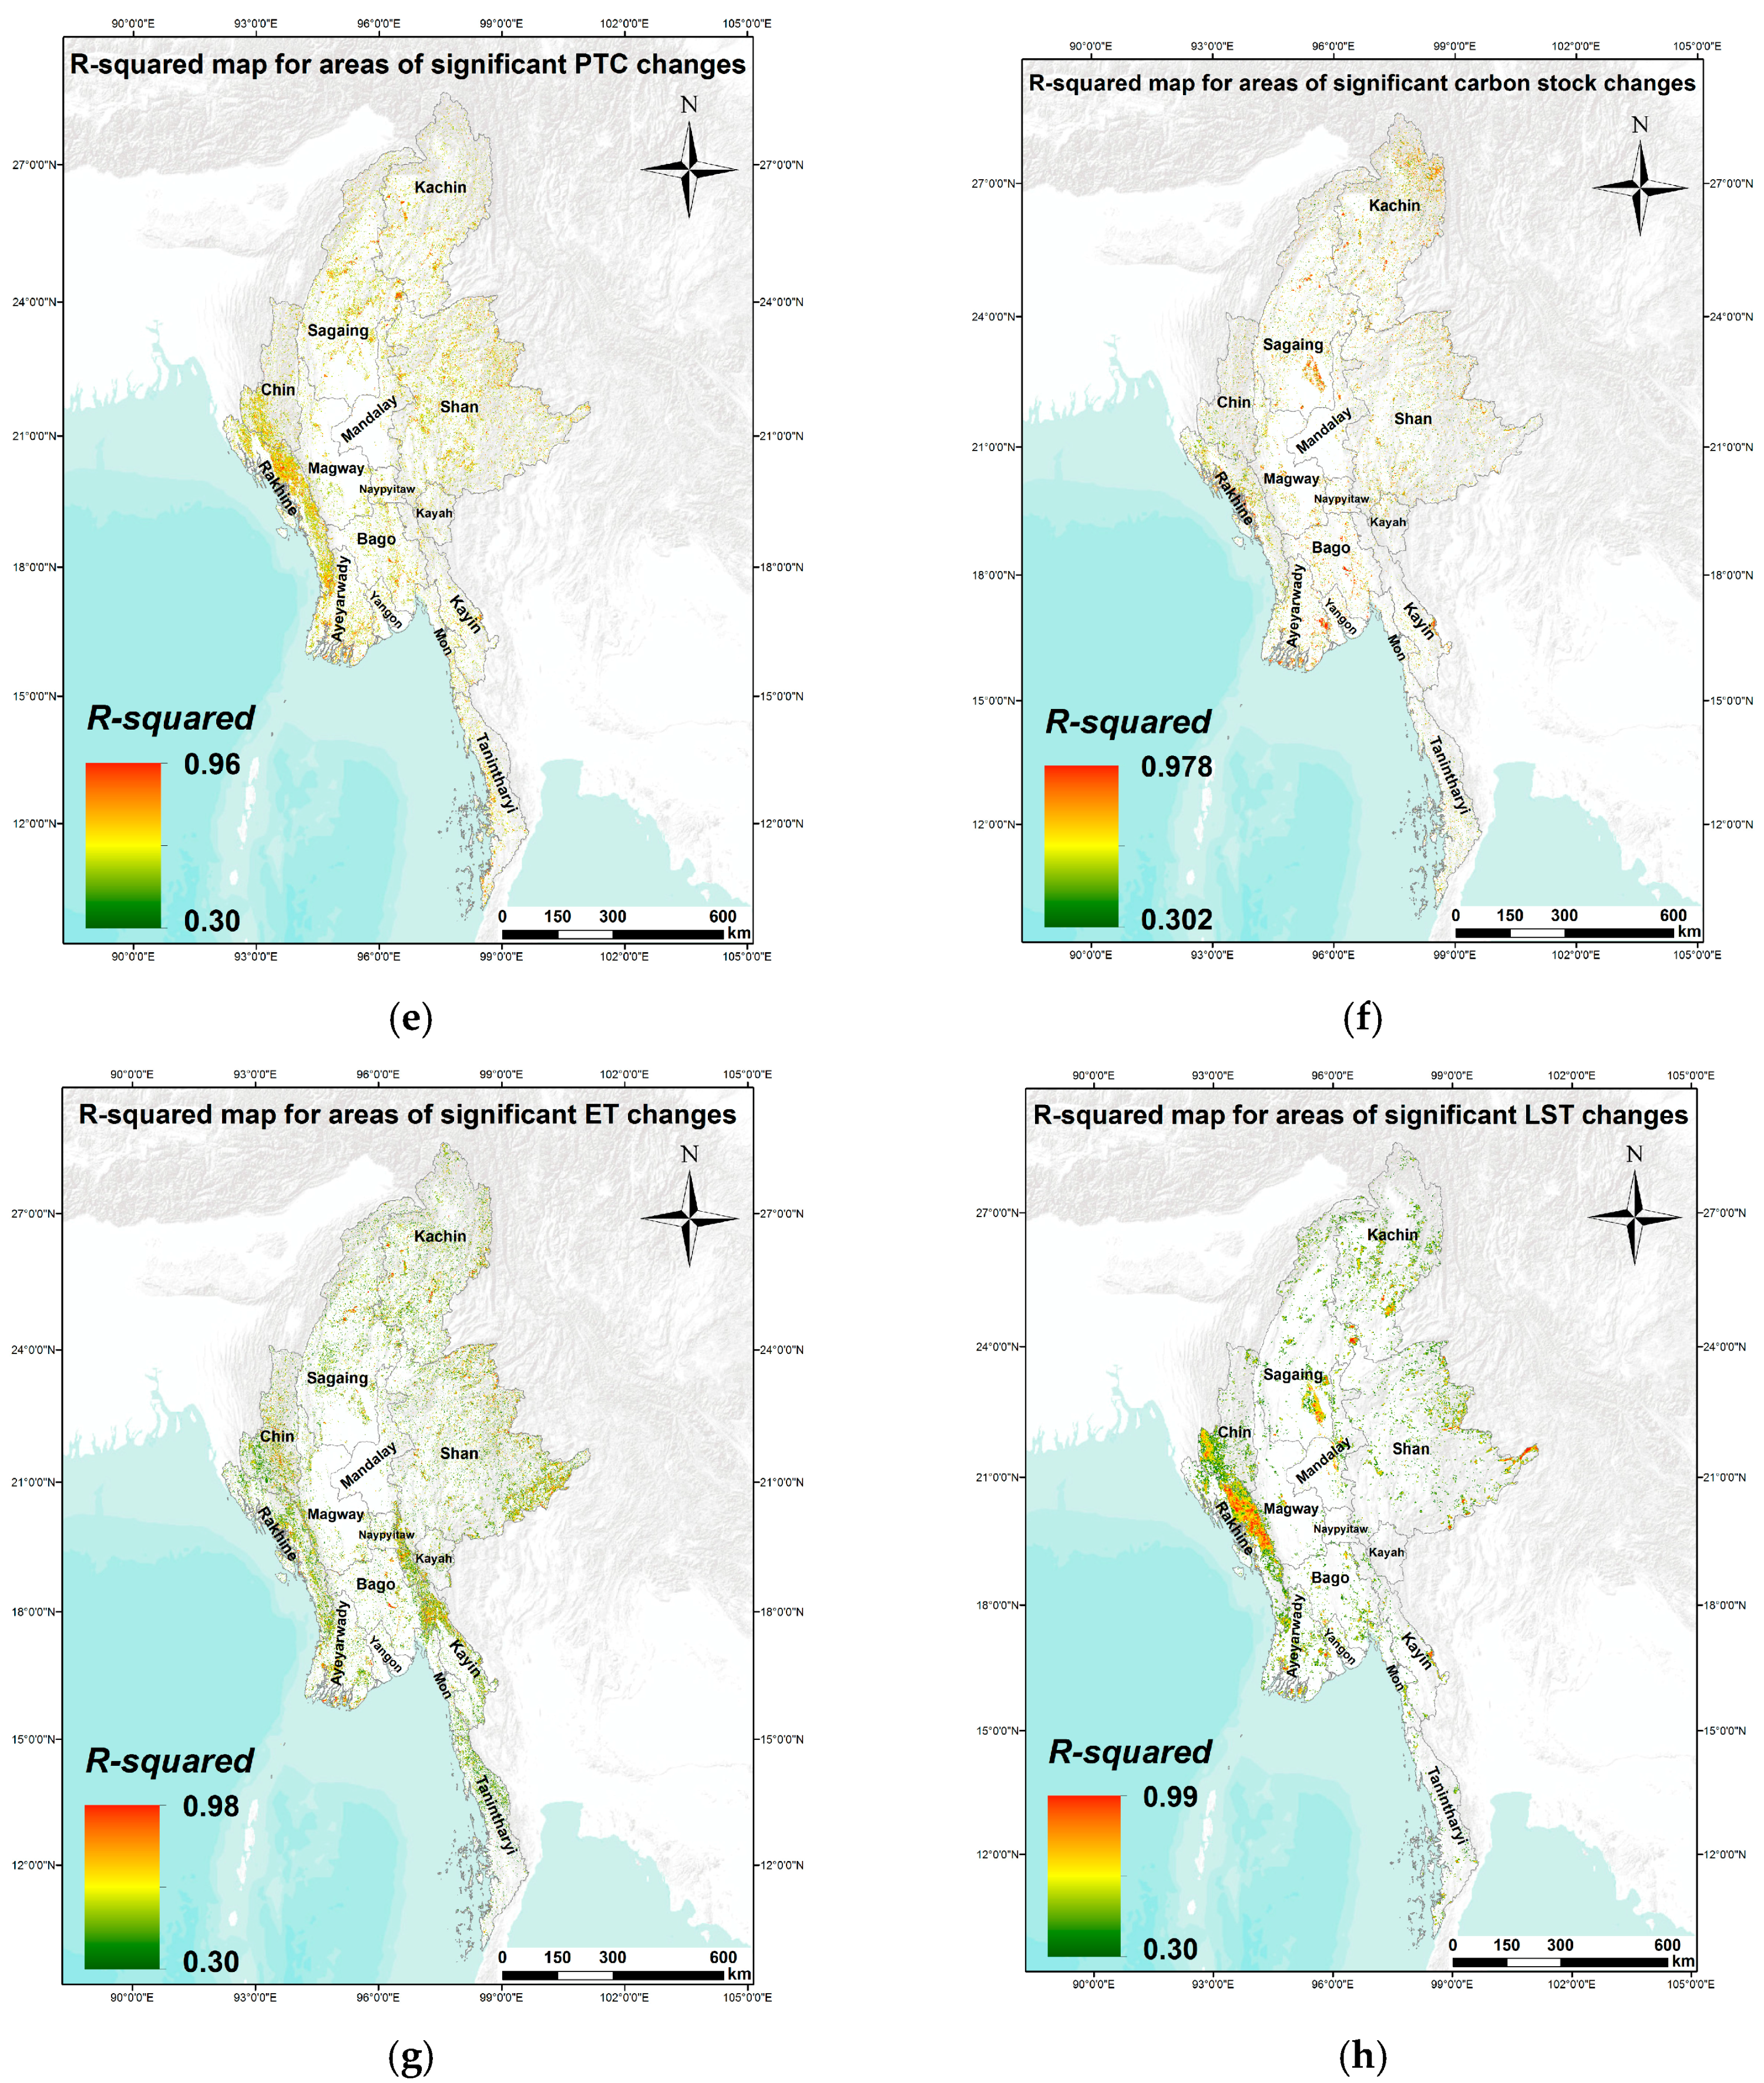
Figure 4.
Time-series trend analysis results for land surface temperature (LST), carbon stock, evapotranspiration (ET), and LST image stacks. (a–d) are slope coefficient maps; (e–h) are R2 value maps for areas of statistically significant changes from 2001 to 2010.
Figure 4.
Time-series trend analysis results for land surface temperature (LST), carbon stock, evapotranspiration (ET), and LST image stacks. (a–d) are slope coefficient maps; (e–h) are R2 value maps for areas of statistically significant changes from 2001 to 2010.


Figure 5.
Ordinary least squares (OLS) regression analysis between PTC slope coefficients and (a) carbon stock; (b) ET; and (c) LST slope coefficients. All the regression equations are statistically significant at the 0.01 level (p < 0.01). The gaps around zero for both x and y values is because of missing data.


| Forest Type | Area in 2001 (km2) | Area in 2010 (km2) | Net Forest Loss (km2) | Total Deforestation Rate (%) | Mean Annual Deforestation Rate (%) |
|---|---|---|---|---|---|
| Evergreen Mountain Forest | 36,093.03 | 35,414.29 | 678.74 | 1.88% | 0.21% |
| Lowland Evergreen Forest | 96,037.42 | 91,879.92 | 4157.5 | 4.33% | 0.48% |
| Deciduous Forest | 30,066.5 | 23,942.75 | 6,123.75 | 20.37% | 2.26% |
| Mangrove Forest | 702.21 | 406.55 | 295.66 | 42.10% | 4.68% |
| Wood and Shrubland | 128,455.62 | 118,532.52 | 9,923.1 | 7.72% | 0.86% |
| Total | 291,354.78 | 270,176.03 | 21,178.75 | 7.27% | 0.81% |
Table 2.
Carbon stock, carbon release, and carbon release rate by forest type for Myanmar 2001–2010.
| Forest Type | Carbon Stock in 2001 (Ton C) | Carbon Stock in 2010 (Ton C) | Net Carbon Release (Ton C) | Mean Annual Carbon Release Rate (%) |
|---|---|---|---|---|
| Evergreen Mountain Forest | 46,892,712.0 | 46,627,672.0 | 265,040.0 | 0.06% |
| Lowland Evergreen Forest | 180,260,192.0 | 178,603,312.0 | 1,656,880.0 | 0.10% |
| Deciduous Forest | 83,088,648.0 | 73,319,720.0 | 9,768,928.0 | 1.31% |
| Mangrove Forest | 1,652,841.4 | 1,238,000.8 | 414,840.6 | 2.79% |
| Wood and Shrubland | 296,473,152.0 | 288,514,816.0 | 7,958,336.0 | 0.30% |
| Total | 608,367,545.4 | 588,303,520.8 | 20,064,024.6 | 0.37% |
| Administrative Division | Net Forest Loss * (km2) | Mean Annual Deforestation Rate *,† (%) | Net Carbon Flux ** (ton C) | Mean Annual Carbon Flux Rate **,† (%) |
|---|---|---|---|---|
| Ayeyarwady | 1033.91 | 1 2.62% | 2,532,392.7 | 1 2.38% |
| Bago | 1445.11 | 6 1.71% | 1,904,679.7 | 7 1.04% |
| Chin | 497.83 | 12 0.28% | −56,710.3 | 11 −0.01% |
| Kachin | 1334.58 | 13 0.21% | −1,743,902.3 | 14 −0.17% |
| Kayah | 364.14 | 8 1.03% | 1,107,977.7 | 6 1.21% |
| Kayin | 90.07 | 14 0.07% | −201,314.3 | 13 −0.08% |
| Magway | 986.40 | 5 1.80% | 2,084,877.7 | 4 1.52% |
| Mandalay | 612.38 | 7 1.60% | 502,216.7 | 8 0.56% |
| Mon | −60.80 | 15 −0.22% | −333,936.3 | 15 −0.51% |
| Naypyidaw Union Territory | 279.63 | 4 1.84% | 435,452.2 | 5 1.35% |
| Rakhine | 3,914.19 | 2 2.57% | 6,782,569.7 | 2 2.19% |
| Sagaing | 3249.79 | 10 0.83% | 2,675,825.7 | 9 0.33% |
| Shan | 5647.70 | 9 0.93% | 4,235,585.7 | 10 0.29% |
| Tanintharyi | 1642.83 | 11 0.73% | −124,330.3 | 12 −0.03% |
| Yangon | 141.00 | 3 2.00% | 262,640.8 | 3 1.58% |
| Total | 21,178.74 | 0.81% | 20,064,024.6 | 0.37% |
* A positive number denotes deforestation, whereas a negative number denotes reforestation or afforestation; ** A positive number indicates carbon release, whereas a negative number indicates carbon sequestration; † The numbers at the top left part of the values indicate rankings.
© 2016 by the authors; licensee MDPI, Basel, Switzerland. This article is an open access article distributed under the terms and conditions of the Creative Commons Attribution (CC-BY) license (http://creativecommons.org/licenses/by/4.0/).
Share and Cite
MDPI and ACS Style
Wang, C.; Myint, S.W. Environmental Concerns of Deforestation in Myanmar 2001–2010. Remote Sens. 2016, 8, 728. https://doi.org/10.3390/rs8090728
AMA Style
Wang C, Myint SW. Environmental Concerns of Deforestation in Myanmar 2001–2010. Remote Sensing. 2016; 8(9):728. https://doi.org/10.3390/rs8090728
Chicago/Turabian StyleWang, Chuyuan, and Soe W. Myint. 2016. "Environmental Concerns of Deforestation in Myanmar 2001–2010" Remote Sensing 8, no. 9: 728. https://doi.org/10.3390/rs8090728
Note that from the first issue of 2016, this journal uses article numbers instead of page numbers. See further details here.