
Multisource Remote Sensing Imagery Fusion Scheme Based on Bidimensional Empirical Mode Decomposition (BEMD) and Its Application to the Extraction of Bamboo Forest


Abstract
:
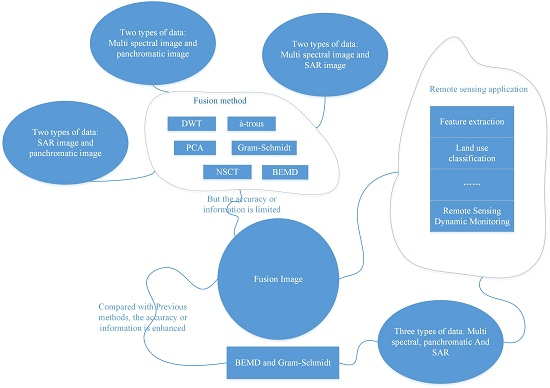
1. Introduction
2. Study Area and Dataset
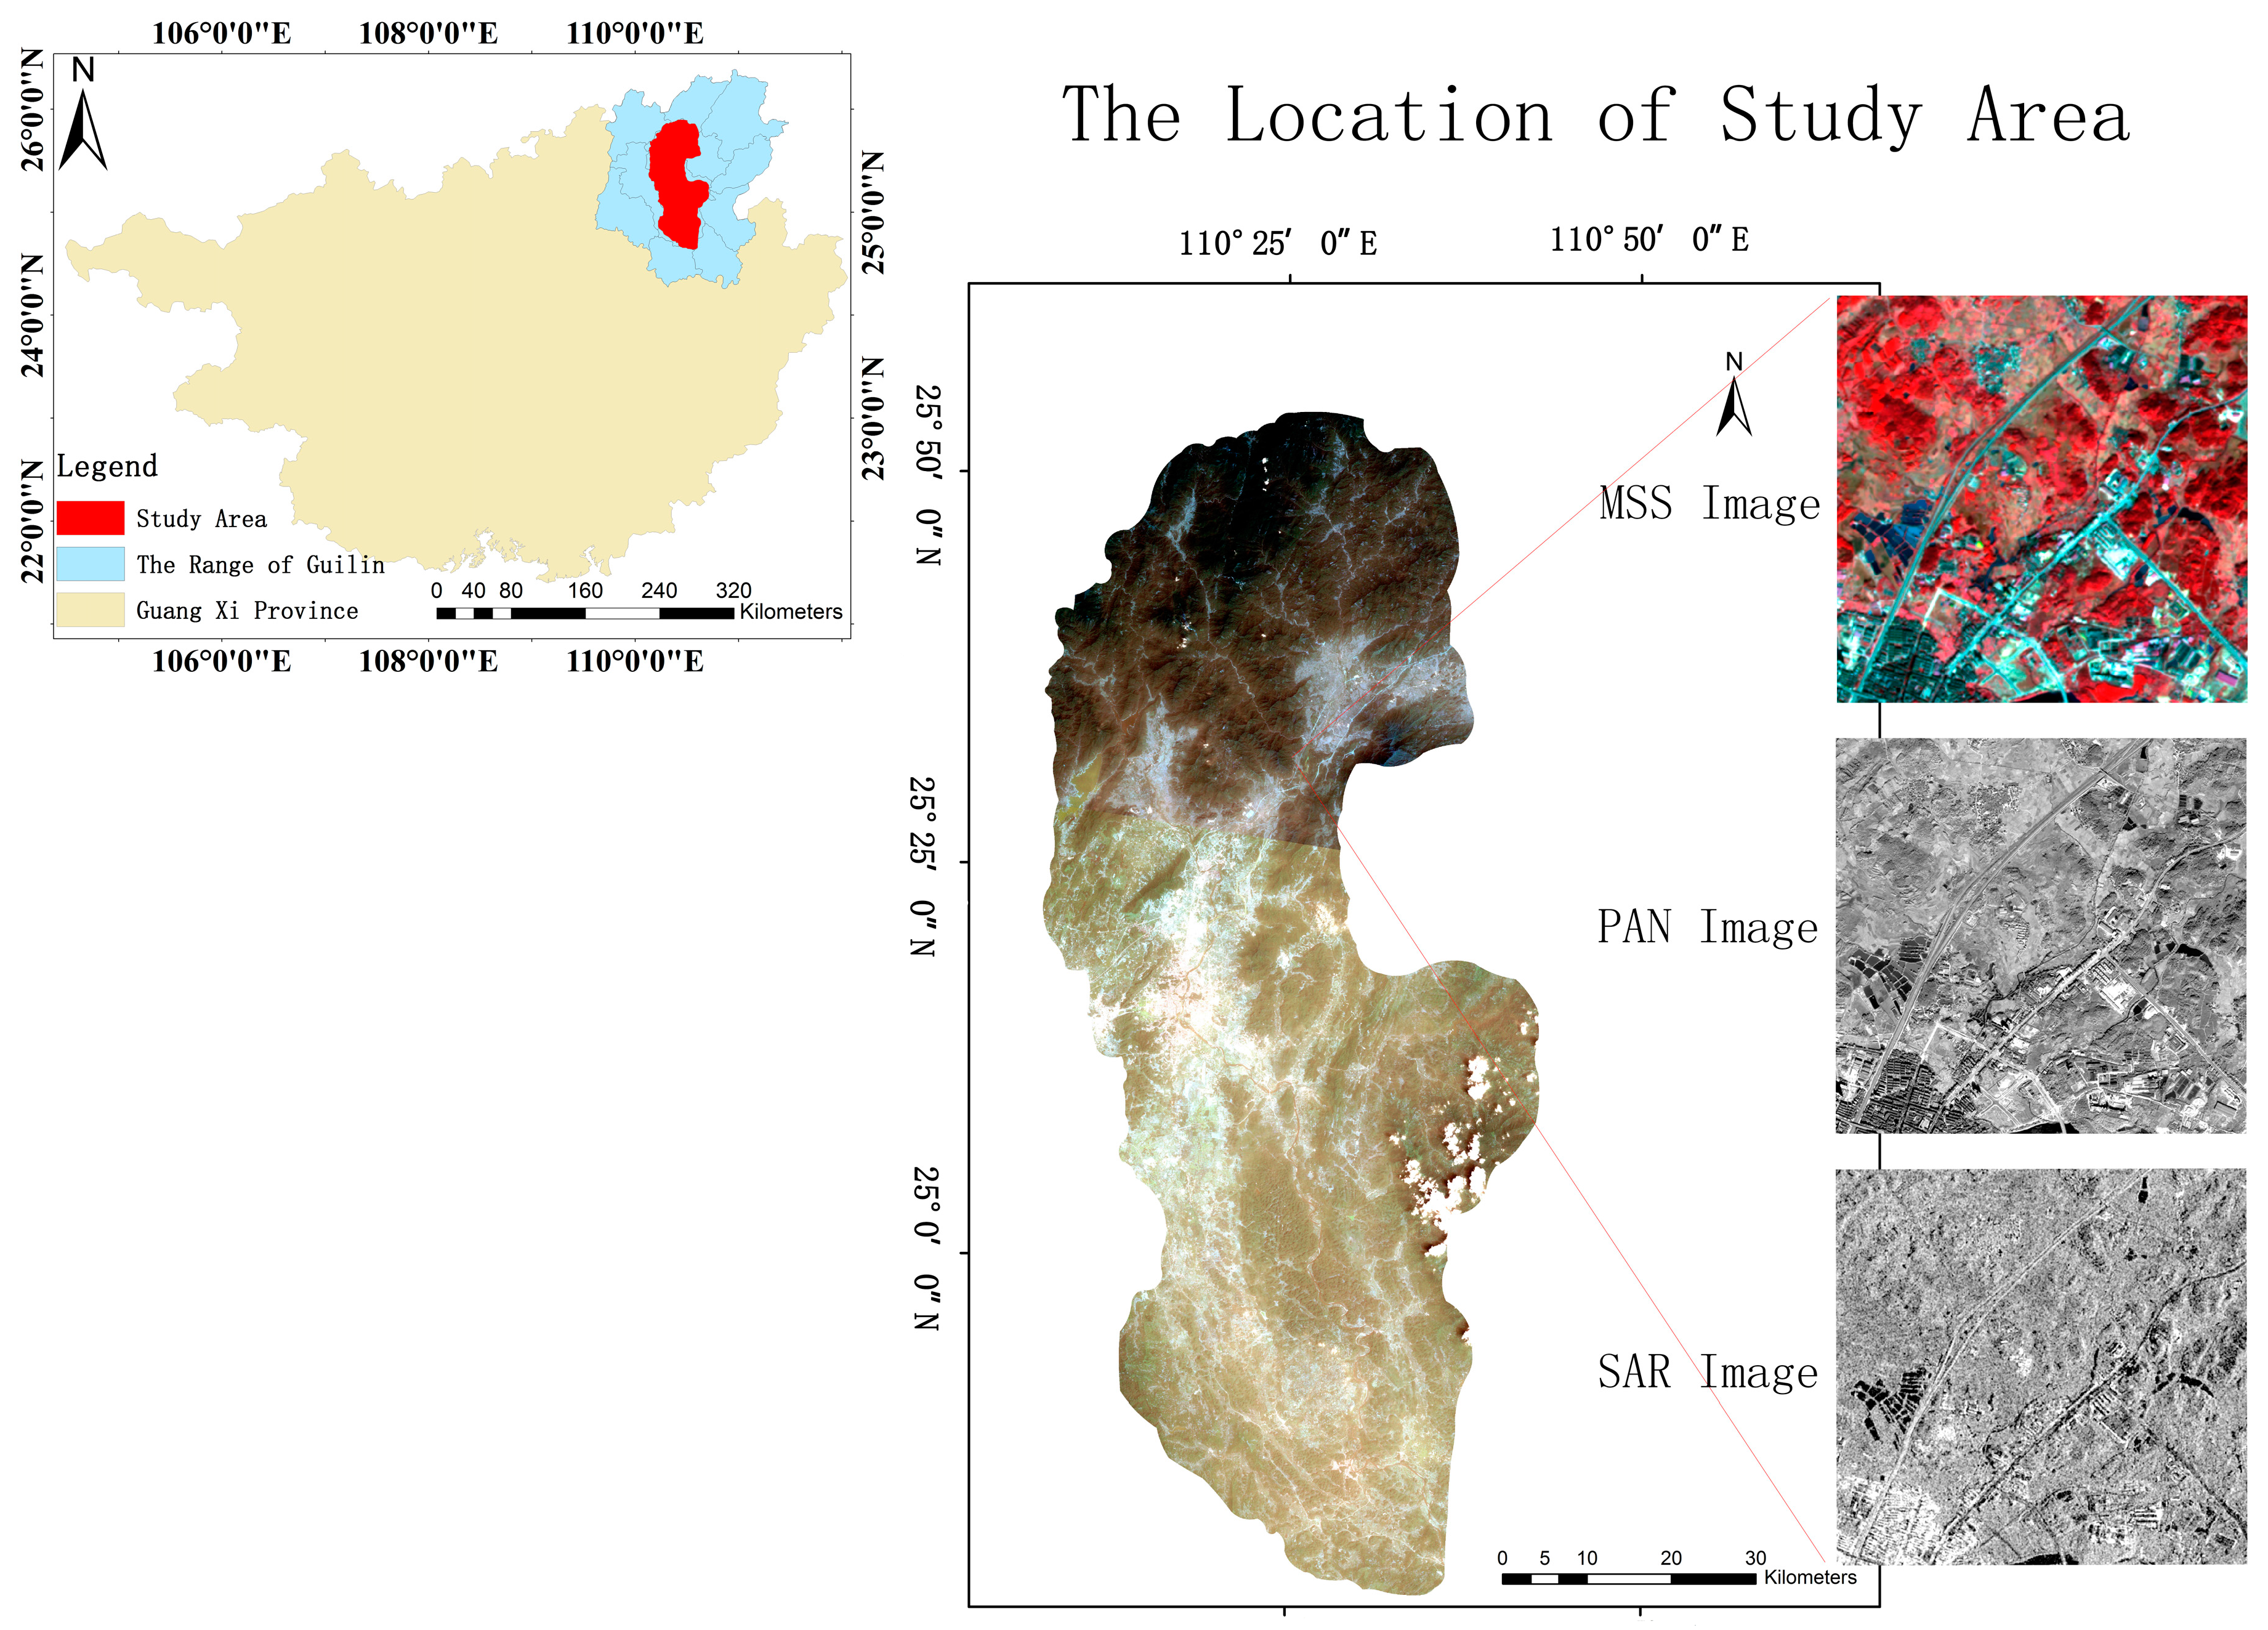
2.1. Study Area
2.2. Dataset
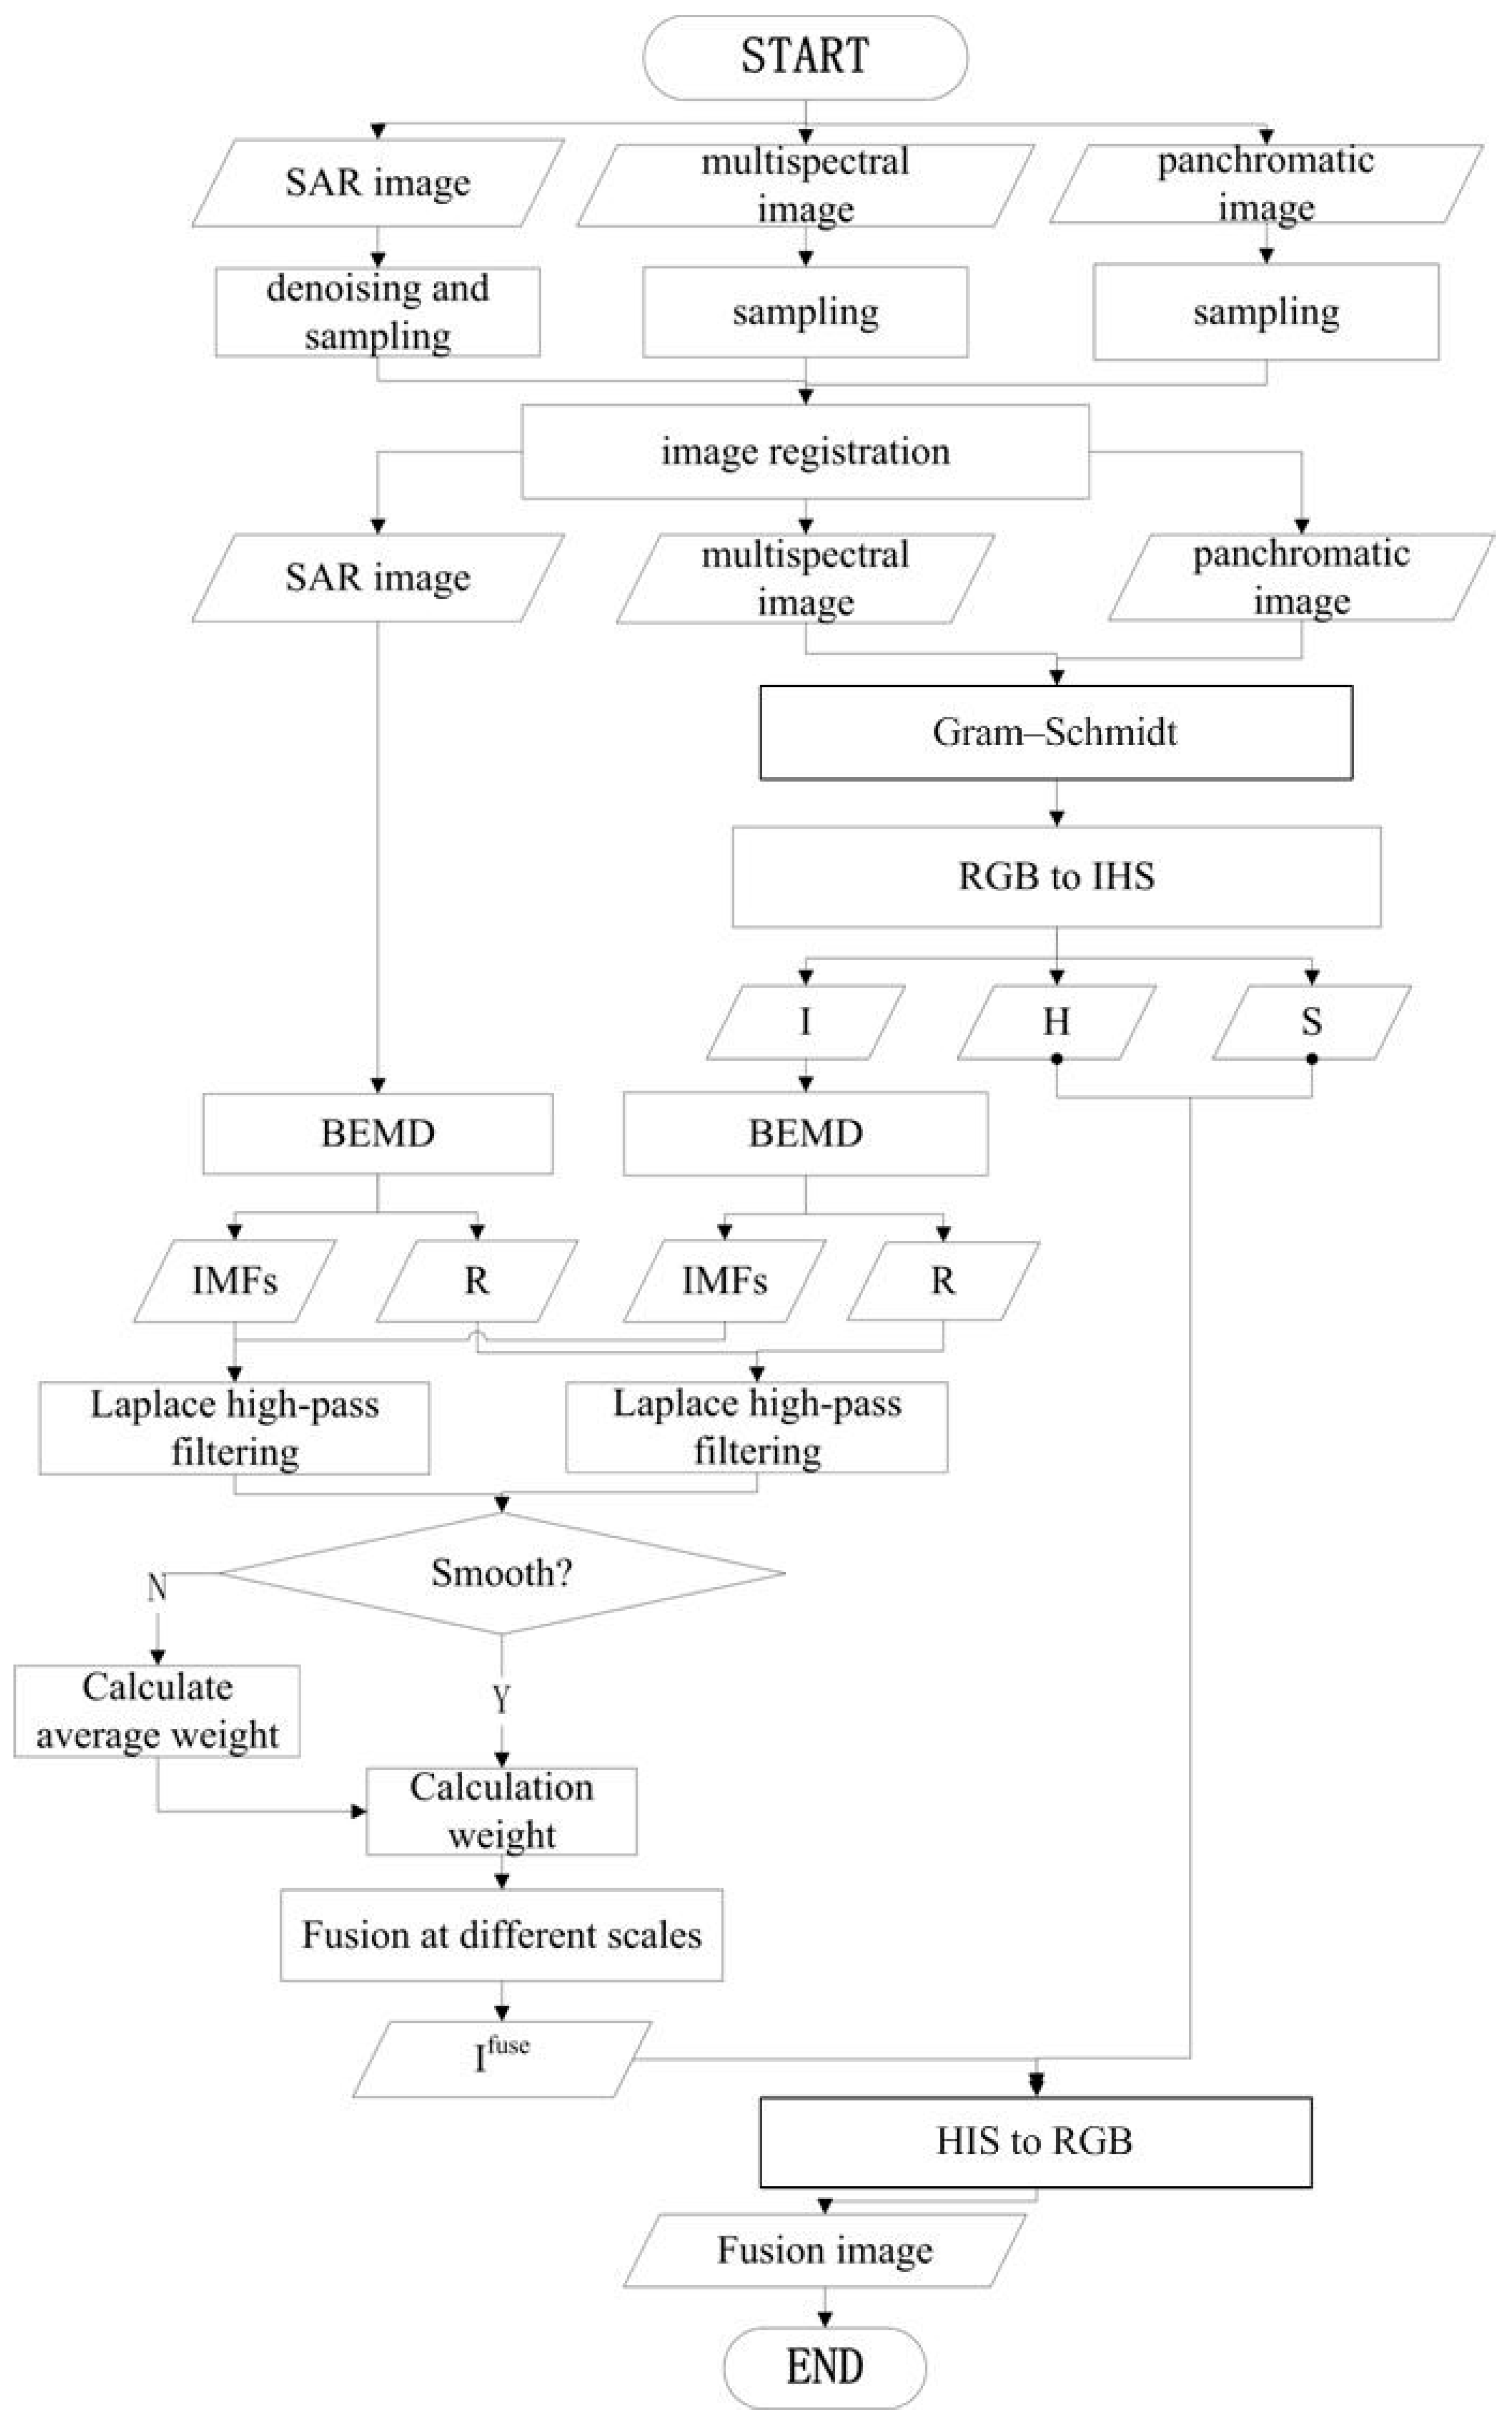
3. Fusion Algorithm of Three Images with Different Feature Information Based on BEMD
3.1. Bidimensional Empirical Mode Decomposition (BEMD)
3.2. Area-Based Adaptive Weighting Scheme
3.3. Fusion Processing Flow and Detail Description
- Search for all local maxima and minima of the image
- Fit all maximum and minimum values. Then, obtain the upper and lower envelopes and calculate the average envelope surface
- Calculate the local trend
- Determine whether the local trend is satisfied by the conditions of the IMF, and realize the selection of the IMF
- Calculate the residual component and determine whether the screening process is complete
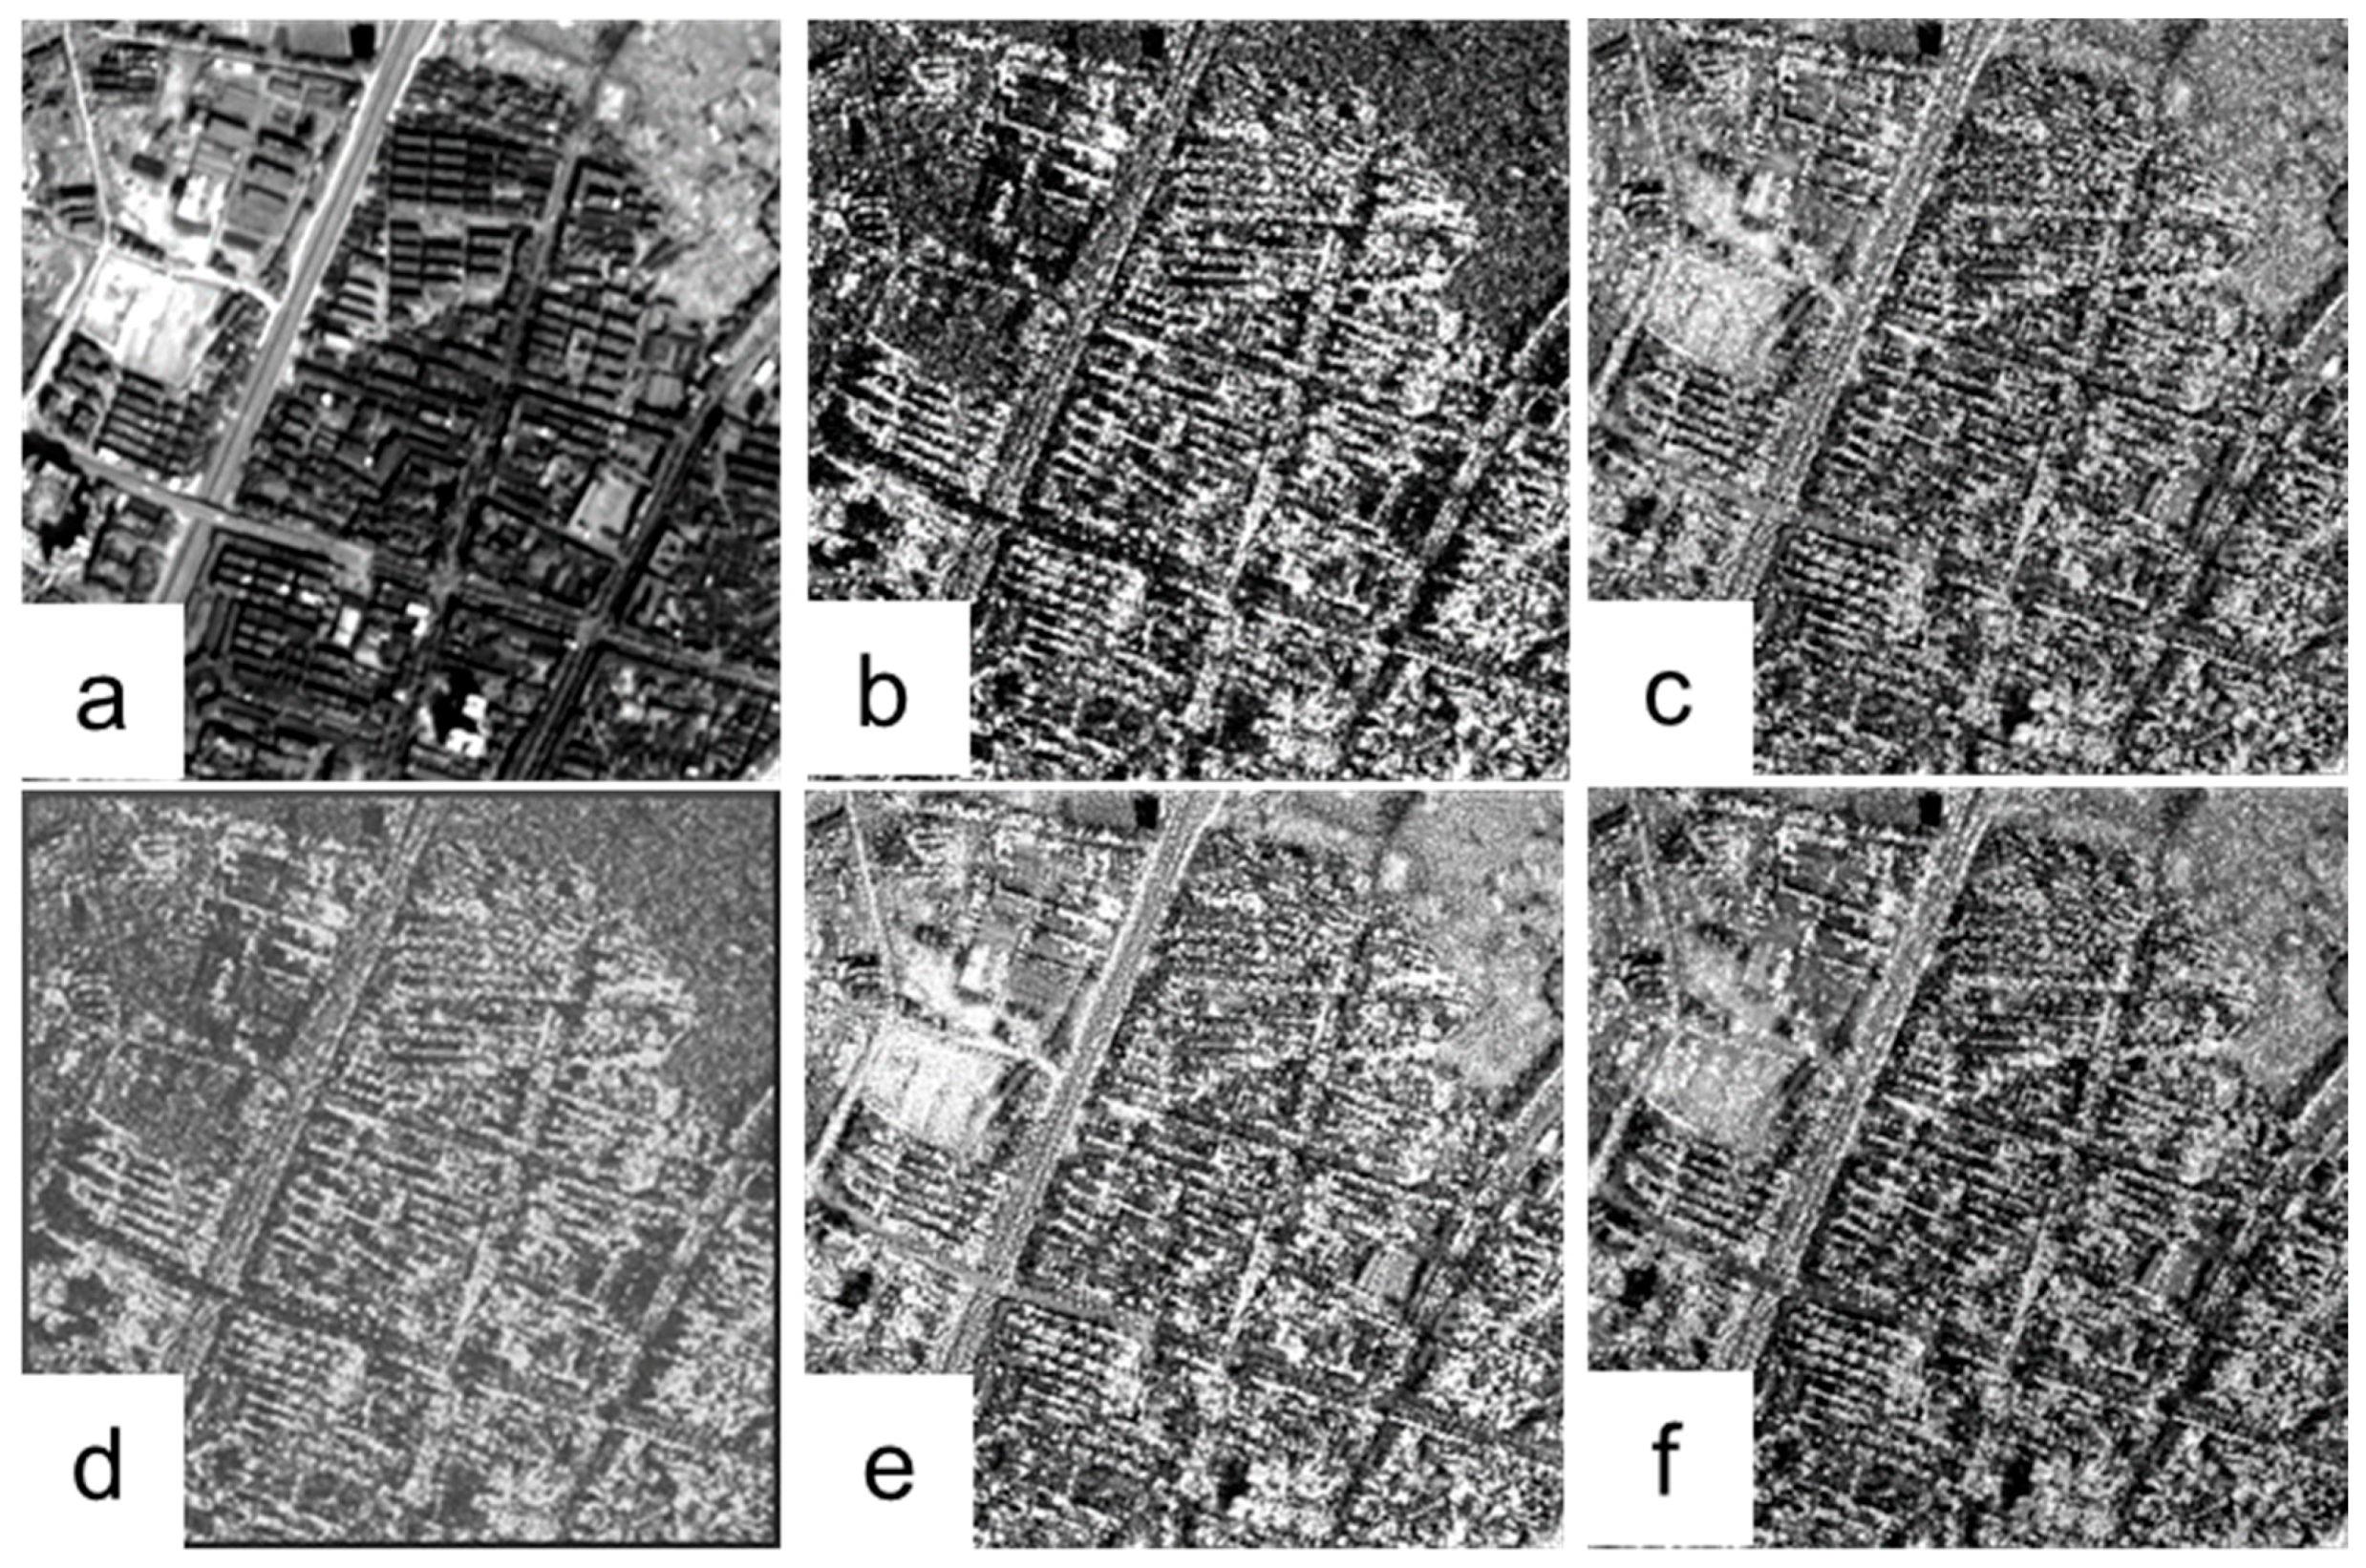
3.4. Criteria for Comparison of Fusion Results
4. Results and Discussion
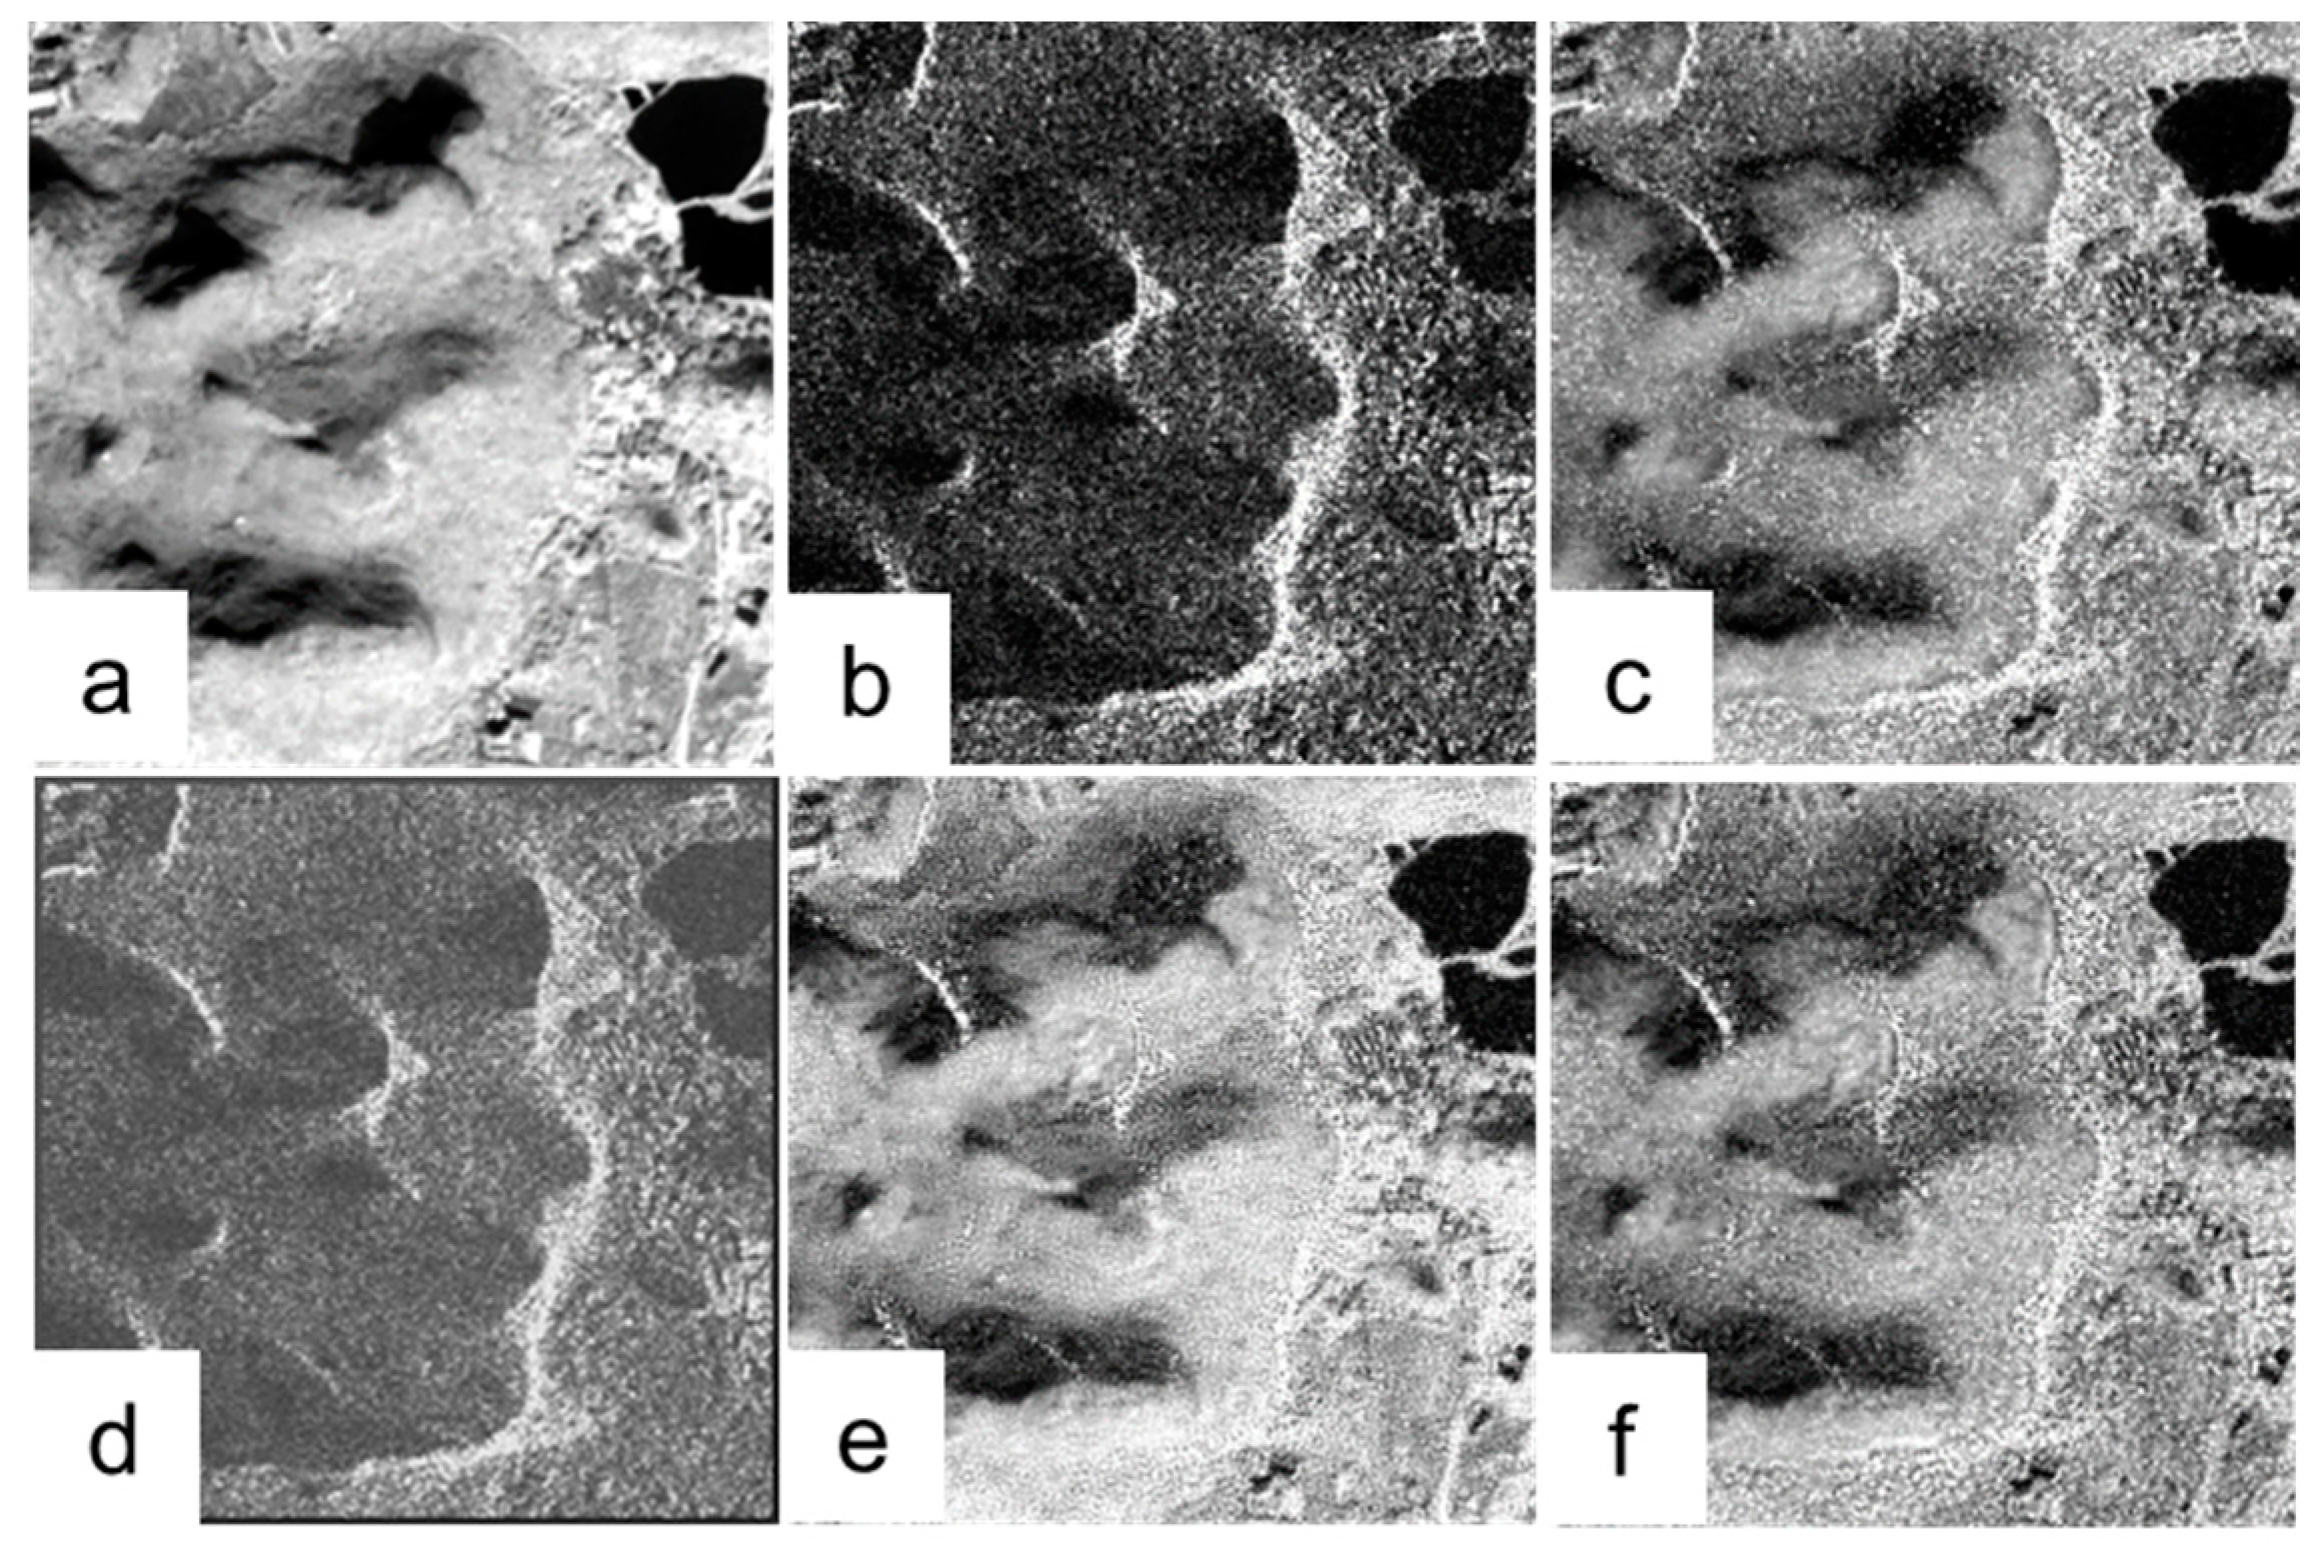
4.1. Comparison of Fusion Results
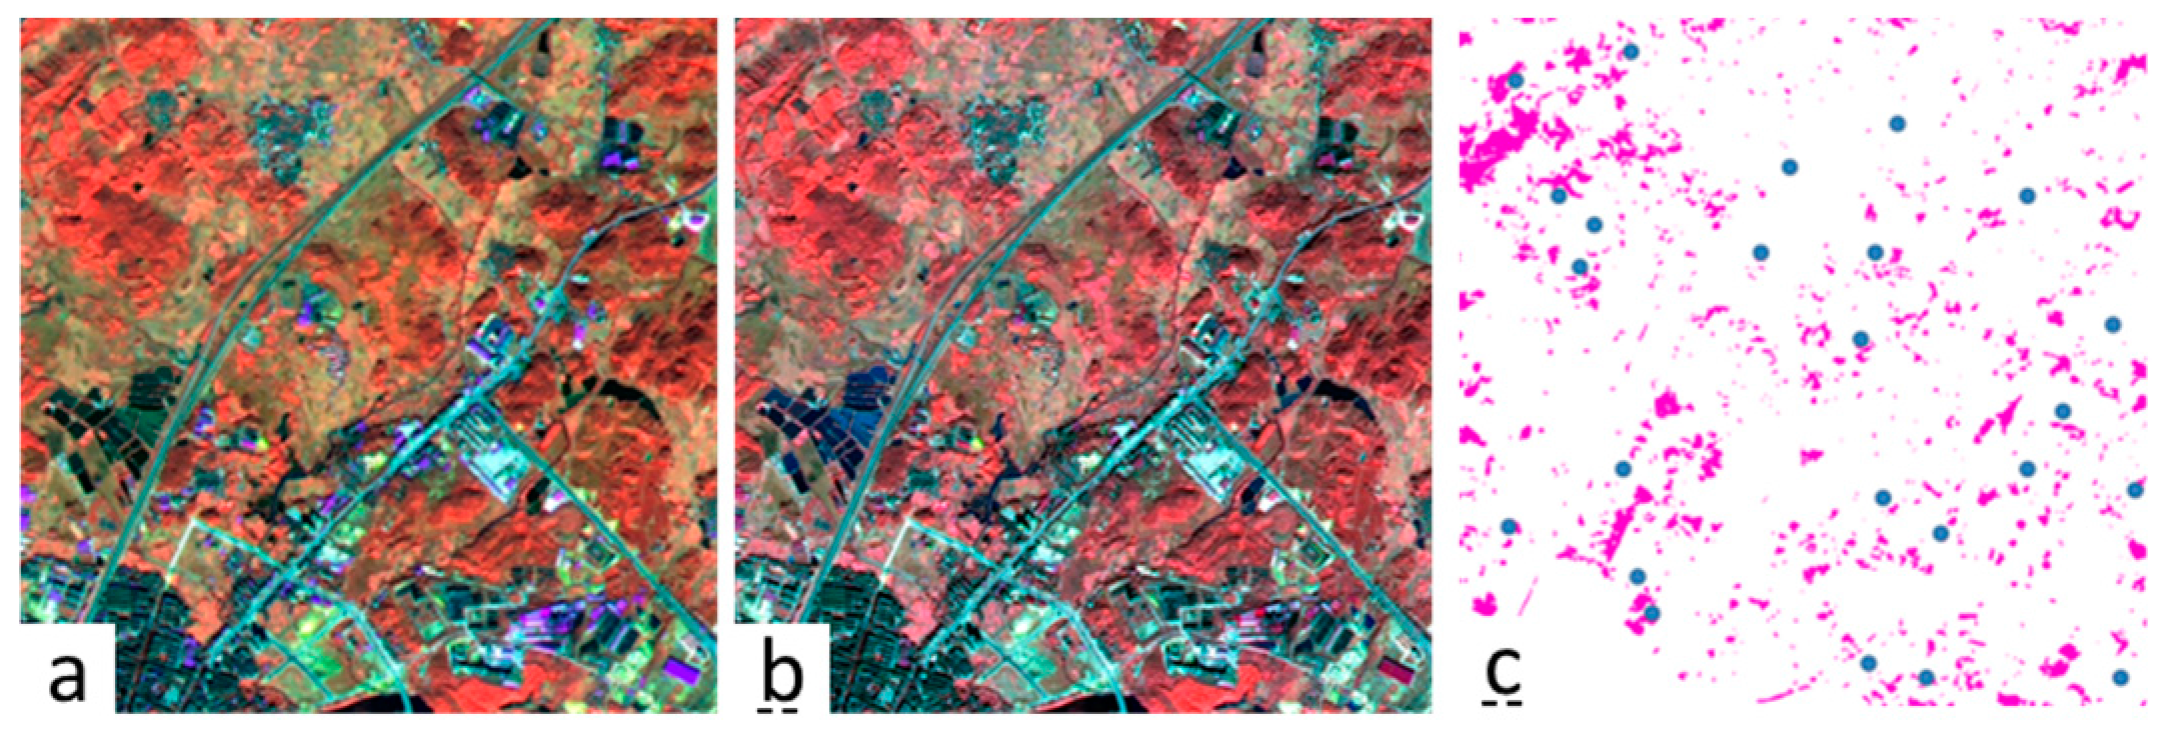
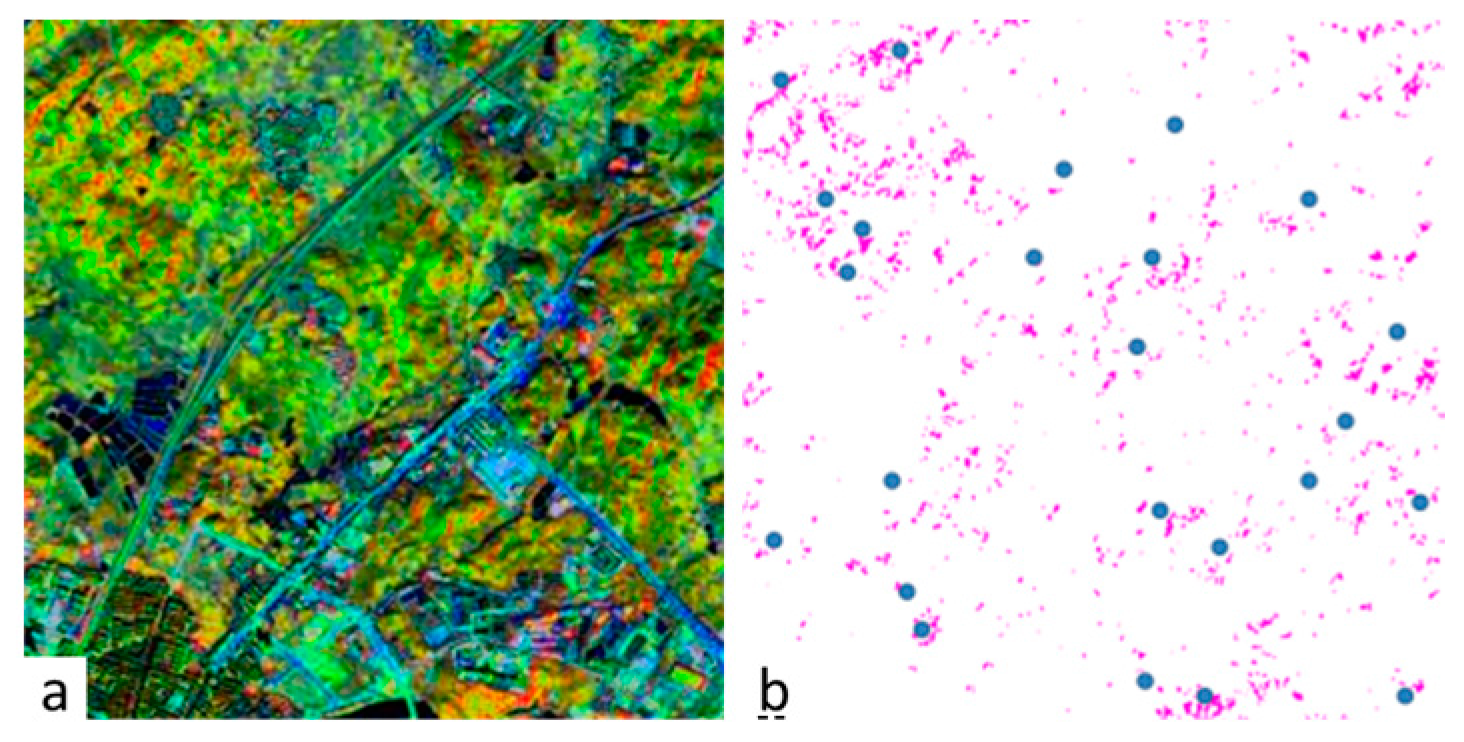
4.2. Application in Classification
4.2.1. Contrastive Analysis 1
4.2.2. Contrastive Analysis 2
4.2.3. Contrastive Analysis 3
4.3. Discussion
5. Conclusions
Acknowledgments
Author Contributions
Conflicts of Interest
Abbreviations
| SAR | Synthetic Aperture Radar |
| BEMD | Bidimensional Empirical Mode Decomposition |
| IHS | Intensity–Hue–Saturation |
| DWT | Discrete Wavelet Transform |
| MSD | Multiscale Decomposition Method |
| IMF | Intrinsic Mode Functions |
| NSCT | Non-Subsampled Contourlet Transform Methods |
| GLCM | Grey-Level Co-occurrence Matrix |
| DLR | German Aerospace Center |
| GS | Gram-Schmidt |
| PCA | Principal Component Analysis |
| IRS LISS-III | Indian Remote Sensing Satellites, Linear Imaging Self-Scanning System III |
| DEM | Digital Elevation Model |
References
- Gungor, O.; Shan, J. An optimal fusion approach for optical and SAR images. In Proceedings of the ISPRS Commission VII Symposium: Remote Sensing: From Pixels to Process, Enschede, The Netherlands, 8–11 May 2006.
- Shimada, M. Ortho-rectification and slope correction of SAR data using DEM and its accuracy evaluation. IEEE J. Sel. Top. Appl. Earth Obs. Remote Sens. 2010, 3, 657–671. [Google Scholar] [CrossRef]
- Pohl, C.; van Genderen, J.L. Review article Multisensor image fusion in remote sensing: Concepts, methods and applications. Int. J. Remote Sens. 1998, 19. [Google Scholar] [CrossRef]
- Pacifici, F.; del Frate, F.; Emery, W.J.; Gamba, P.; Chanussot, J. Urban mapping using coarse SAR and optical data: Outcome of the 2007 GRSS data fusion contest. IEEE Geosci. Remote Sens. Lett. 2008, 5, 331–335. [Google Scholar] [CrossRef]
- Vidal, A.; Moreno, M.R. Change detection of isolated housing using a new hybrid approach based on object classification with optical and TerraSAR-X data. Int. J. Remote Sens. 2011, 32, 9621–9635. [Google Scholar] [CrossRef]
- Longbotham, N.; Chaapel, C.; Bleiler, L.; Padwick, C.; Emery, W.J.; Pacifici, F. Very high resolution multiangle urban classification analysis. IEEE Trans. Geosci. Remote Sens. 2012, 50, 1155–1170. [Google Scholar] [CrossRef]
- Chandrakanth, R.; Saibaba, J.; Varadan, G.; Raj, P.A. Fusion of high resolution satellite SAR and optical images. In Proceedings of the 2011 International Workshop on Multi-Platform/Multi-Sensor Remote Sensing and Mapping (M2RSM 2011), Xiamen, China, 10–12 January 2011.
- Miao, Q.; Shi, C.; Xu, P.; Yang, M.; Shi, Y. A novel algorithm of image fusion using shearlets. Opt. Commun. 2011, 284, 1540–1547. [Google Scholar] [CrossRef]
- Byun, Y.; Choi, J.; Han, Y. An area-based image fusion scheme for the integration of SAR and optical satellite imagery. IEEE J. Sel. Top. Appl. Earth Obs. Remote Sens. 2013, 6, 2212–2220. [Google Scholar] [CrossRef]
- Chai, Y.; Li, H.; Zhang, X. Multifocus image fusion based on features contrast of multiscale products in nonsubsampled contourlet transform domain. Optik 2012, 123, 569–581. [Google Scholar] [CrossRef]
- Huang, N.E.; Shen, Z.; Long, S.R.; Wu, M.C.; Shih, H.H.; Zheng, Q.; Yen, N.-C.; Tung, C.C.; Liu, H.H. The empirical mode decomposition and the Hilbert spectrum for nonlinear and non-stationary time series analysis. Proc. R. Soc. A Math. Phys. Eng. Sci. 1998, 454, 903–995. [Google Scholar] [CrossRef]
- Expansions, W. 1st Reading. Int. J. 2004, 21, 20. [Google Scholar]
- Yang, Z. Signal Period Analysis Based on Hilbert-Huang Transform and Its Application to Texture Analysis. In Proceedings of the Third International Conference on Image and Graphics (ICIG’04), Hong Kong, China, 18–20 December 2004; pp. 430–433.
- Song, R.; Guo, H.; Liu, G.; Perski, Z.; Yue, H.; Han, C.; Fan, J. Improved goldstein SAR interferogram filter based on adaptive-neighborhood technique. IEEE Geosci. Remote Sens. Lett. 2015, 12, 140–144. [Google Scholar] [CrossRef]
- Nunes, J.C.; Bouaoune, Y.; Delechelle, E.; Niang, O.; Bunel, P. Image analysis by bidimensional empirical mode decomposition. Image Vis. Comput. 2003, 21, 1019–1026. [Google Scholar] [CrossRef]
- Xu, Y.; Hu, K.; Han, J. Hyperspectral image fusion using empirical mode decomposition. SPIE 2007. [Google Scholar] [CrossRef]
- Airbus Defence and Space. TerraSAR-X Services Image Product Guide. 2014. Available online: http://www.intelligence-airbusds.com/files/pmedia/public/r459_9_201408_tsxx-itd-ma-0009_tsx-productguide_i2.00.pdf (accessed on 29 December 2016).
- Hong, G.; Zhang, Y. Comparison and improvement of wavelet—Based image fusion. Int. J. Remote Sens. 2008, 29, 673–691. [Google Scholar] [CrossRef]
- Aslantas, V.; Kurban, R. A comparison of criterion functions for fusion of multi-focus noisy images. Opt. Commun. 2009, 282, 3231–3242. [Google Scholar] [CrossRef]
- Liu, G.; Song, R.; Guo, H.; Perski, Z.; Yue, H.; Han, C.; Fan, J. Filtering SAR interferometric phase noise using a split-window model. Remote Sens. Lett. 2016, 7, 800–809. [Google Scholar] [CrossRef]
- Wu, J.; Yan, W.; Bian, H.; Ni, W. A despeckling algorithm combining curvelet and wavelet transforms of high resolution SAR images. In Proceedings of the 2010 International Conference on Computer Design and Applications (ICCDA 2010), Qinhuangdao, China, 25–27 June 2010; Volume 1.
- Damerval, C.; Meignen, S.; Perrier, V. A fast algorithm for bidimensional EMD. IEEE Signal Process. Lett. 2005, 12, 701–704. [Google Scholar] [CrossRef]
- Chibani, Y. Selective synthetic aperture radar and panchromatic image fusion by using the à trous wavelet decomposition. EURASIP J. Appl. Signal Process. 2005, 14, 2207–2214. [Google Scholar] [CrossRef]
- Chen, J.; Wang, J.; Li, P. Research on wavelet basis selection in the image fusion in SAR and visual. Infrared Technol. 2008, 30, 158–162. [Google Scholar]
- Gong, J.-Z.; Liu, Y.-S.; Xia, B.-C.; Chen, J.-F. Effect of wavelet basis and decomposition levels on performance of fusion images from remotely sensed data. Geogr. Geo-Inf. Sci. 2010, 26, 6–10. [Google Scholar]
- Auer, S.; Gisinger, C.; Tao, J. Characterization of facade regularities in high-resolution SAR images. IEEE Trans. Geosci. Remote Sens. 2015, 53, 2727–2737. [Google Scholar] [CrossRef]
- Kumar, V.; Venkataraman, G. High resolution TerraSAR-X image speckle suppression and its fusion with multispectral IRS LISS -III data for himalayan glacier feature extraction. J. Indian Soc. Remote Sens. 2012, 40, 325–334. [Google Scholar] [CrossRef]
- Jiang, H.; Zhang, L.; Wang, Y.; Liao, M. Fusion of high-resolution DEMs derived from COSMO-SkyMed and TerraSAR-X InSAR datasets. J. Geod. 2014, 88, 587–599. [Google Scholar] [CrossRef]
- Zhang, Q.; Cao, Z.; Hu, Z.; Jia, Y.; Wu, X. Joint image registration and fusion for panchromatic and multispectral images. IEEE Geosci. Remote Sens. Lett. 2015, 12, 467–471. [Google Scholar] [CrossRef]


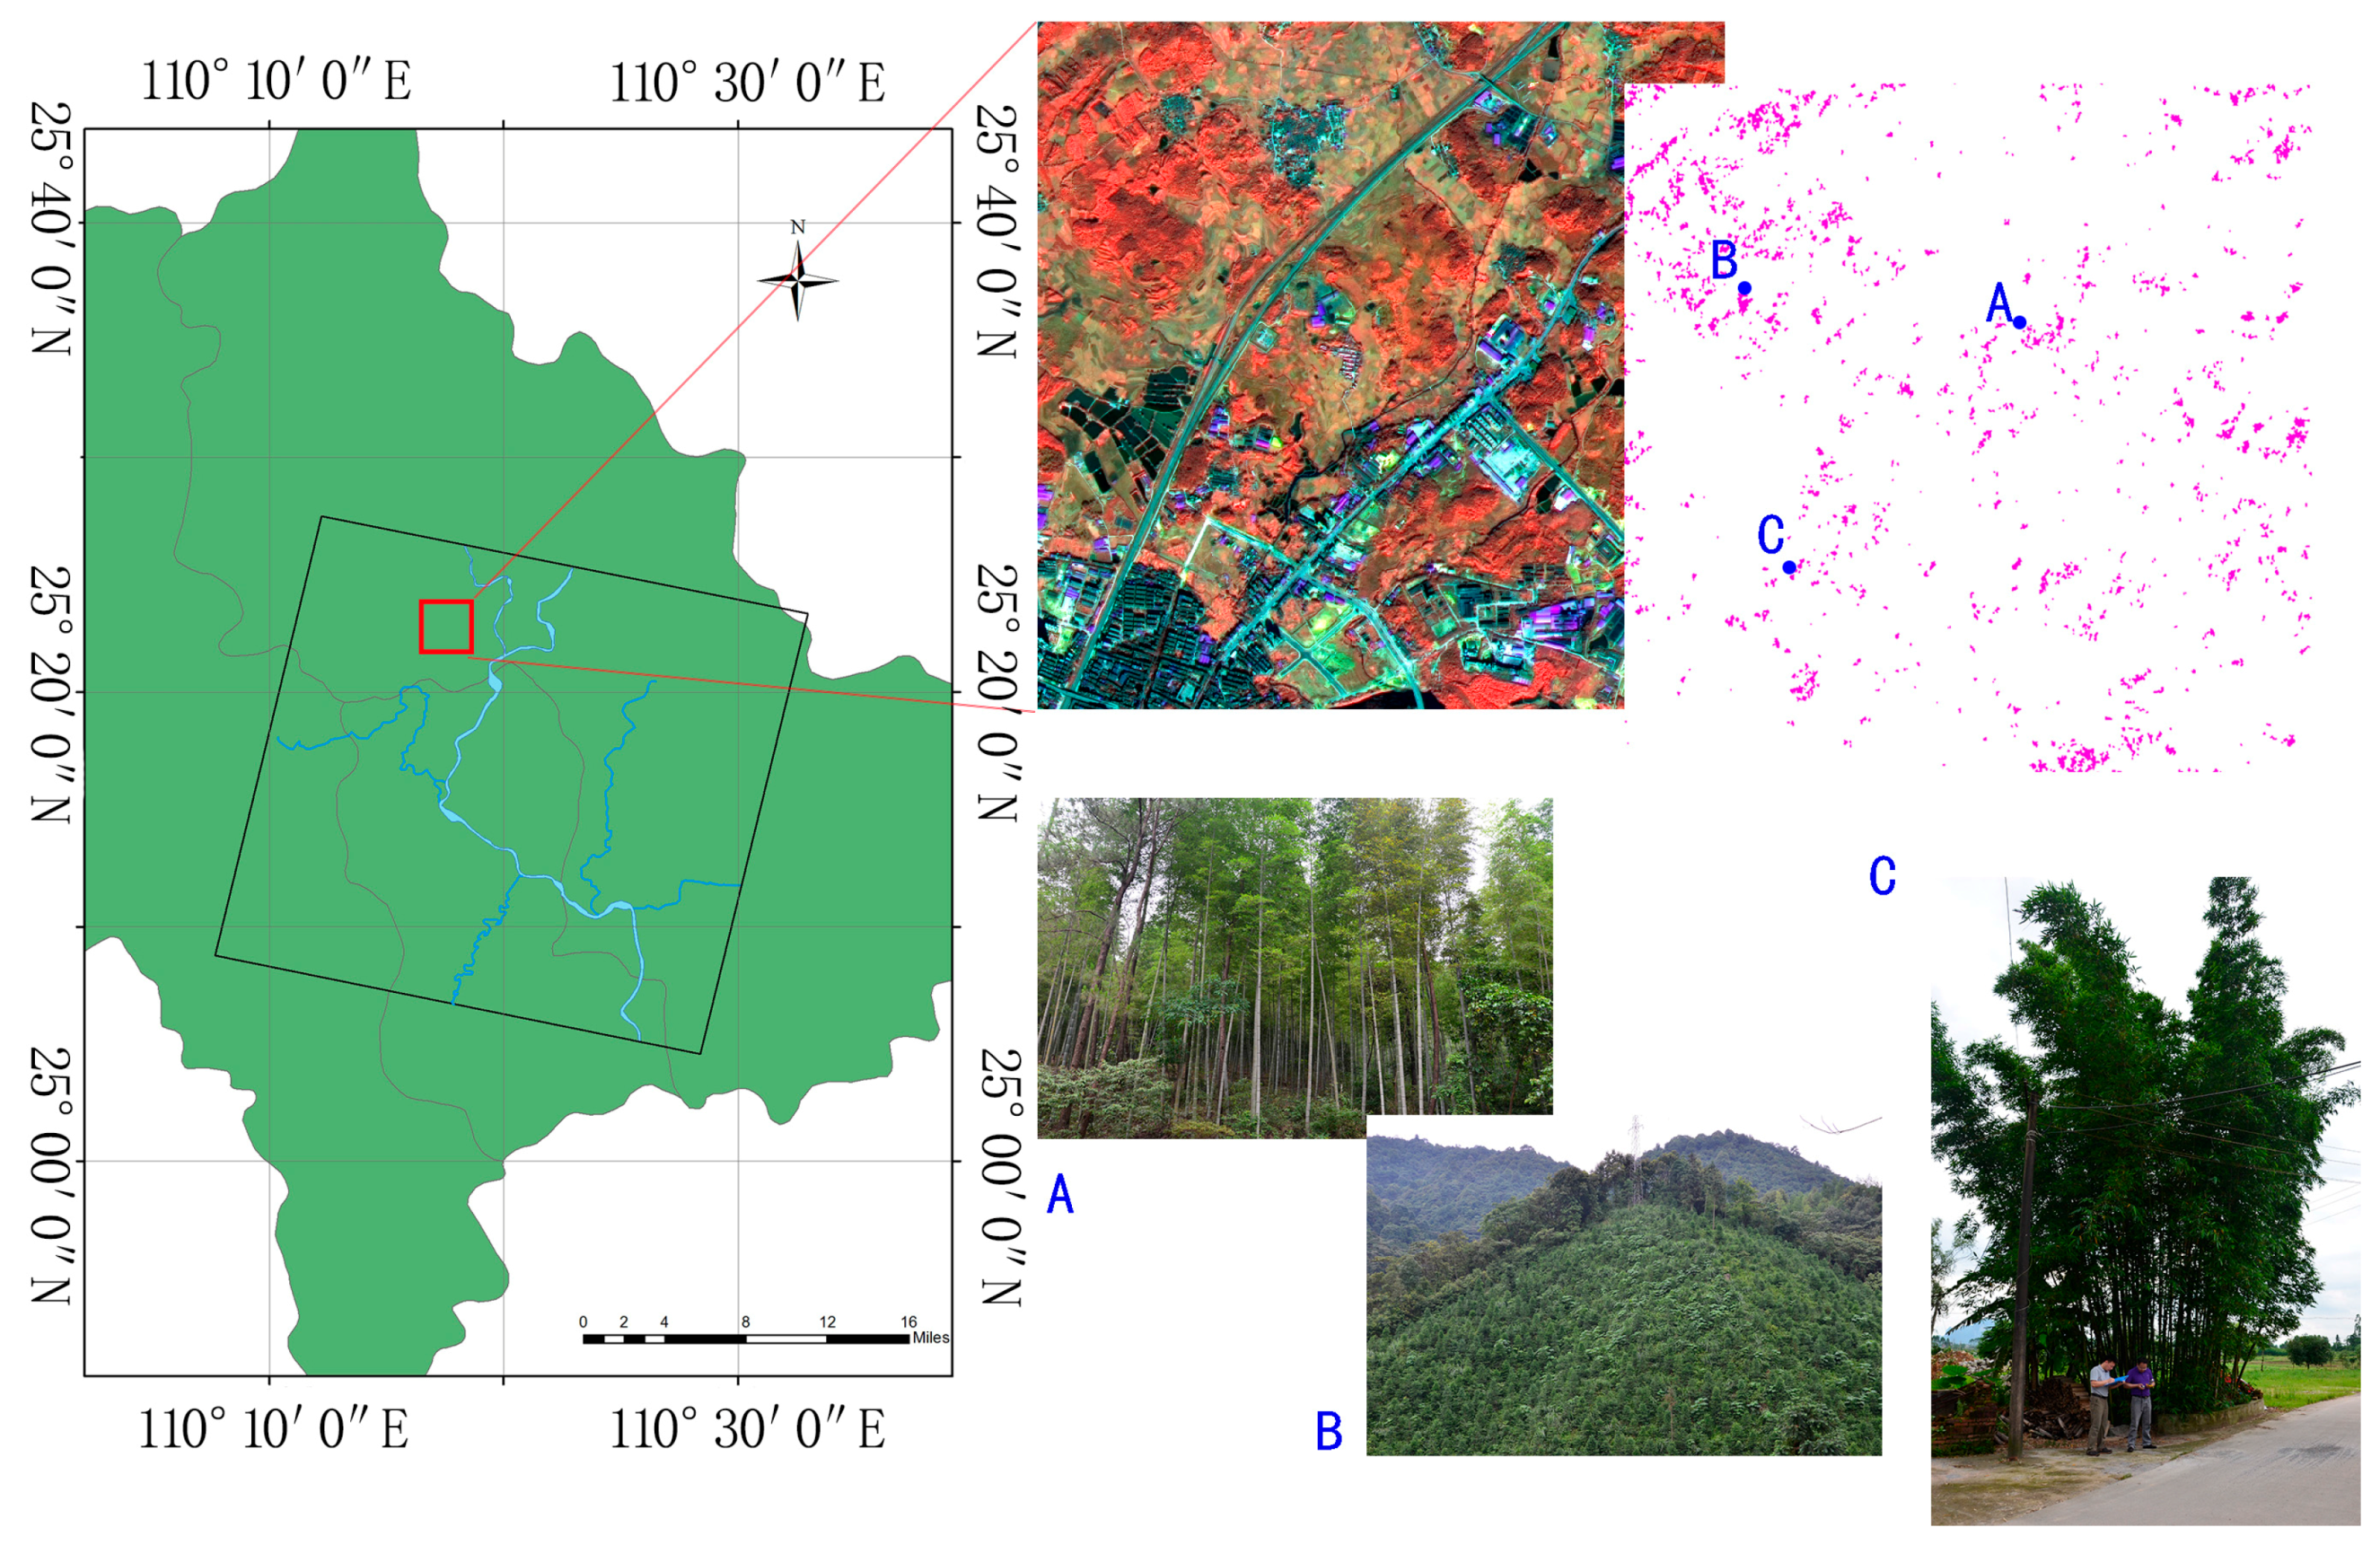
 represent the area of the extraction of bamboo, blue dots
  represent the verification points.
represent the area of the extraction of bamboo, blue dots represent the verification points.
represent the verification points.
represent the area of the extraction of bamboo, blue dots represent the verification points.
 represent the area of the extraction of bamboo, blue dots
  represent verification points.
represent the area of the extraction of bamboo, blue dots represent verification points.
represent verification points.
represent the area of the extraction of bamboo, blue dots represent verification points.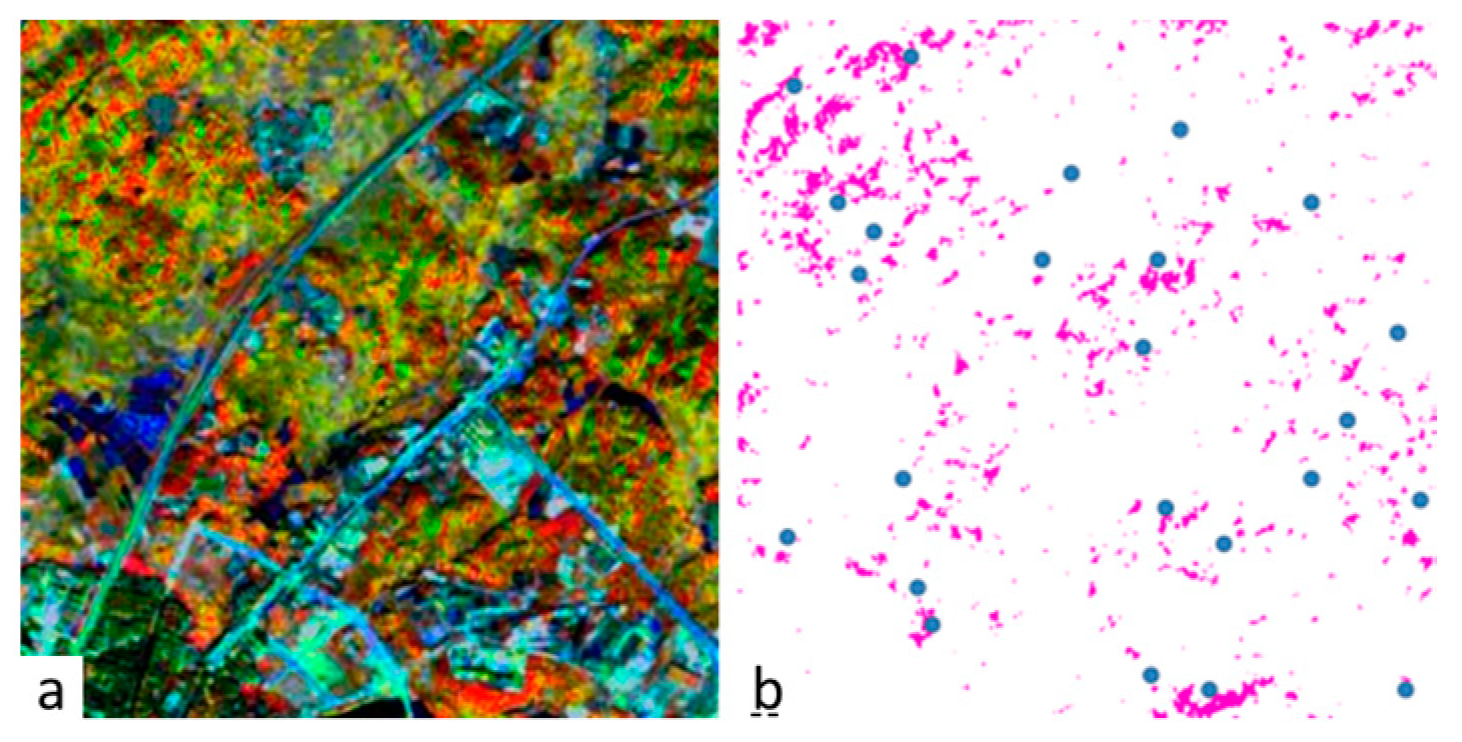


| Fusion Method | Entropy | Average Gradient | Spatial Frequency |
|---|---|---|---|
| Pan | 7.1221 | 12.5688 | 22.3862 |
| SAR | 7.7475 | 41.2584 | 74.3752 |
| DWT | 7.8478 | 37.7990 | 67.4227 |
| à-trous | 7.3581 | 14.5430 | 24.2045 |
| NSCT | 7.8100 | 38.9840 | 68.7256 |
| BEMD | 7.8742 | 40.0143 | 71.4081 |
| Fusion Method | Entropy | Average Gradient | Spatial Frequency |
|---|---|---|---|
| Pan | 6.6389 | 6.9400 | 13.4693 |
| SAR | 7.4053 | 29.6948 | 53.9924 |
| DWT | 7.6846 | 27.0175 | 48.2980 |
| à-trous | 6.9057 | 9.5764 | 16.6302 |
| NSCT | 7.6684 | 26.6561 | 48.4350 |
| BEMD | 7.7824 | 27.1625 | 48.5677 |
| Image | Test Amount | Erroneous Judgement | Leak Detection | Accuracy | Inaccuracy |
|---|---|---|---|---|---|
| Experiment 1 | 12 | 8 | 4 | 50.0% | 40.0% |
| Experiment 2 | 14 | 6 | 4 | 58.3% | 30.0% |
| Experiment 3 | 17 | 4 | 3 | 70.1% | 19.0% |
© 2016 by the authors; licensee MDPI, Basel, Switzerland. This article is an open access article distributed under the terms and conditions of the Creative Commons Attribution (CC-BY) license (http://creativecommons.org/licenses/by/4.0/).
Share and Cite
Liu, G.; Li, L.; Gong, H.; Jin, Q.; Li, X.; Song, R.; Chen, Y.; Chen, Y.; He, C.; Huang, Y.; et al. Multisource Remote Sensing Imagery Fusion Scheme Based on Bidimensional Empirical Mode Decomposition (BEMD) and Its Application to the Extraction of Bamboo Forest. Remote Sens. 2017, 9, 19. https://doi.org/10.3390/rs9010019
Liu G, Li L, Gong H, Jin Q, Li X, Song R, Chen Y, Chen Y, He C, Huang Y, et al. Multisource Remote Sensing Imagery Fusion Scheme Based on Bidimensional Empirical Mode Decomposition (BEMD) and Its Application to the Extraction of Bamboo Forest. Remote Sensing. 2017; 9(1):19. https://doi.org/10.3390/rs9010019
Chicago/Turabian StyleLiu, Guang, Lei Li, Hui Gong, Qingwen Jin, Xinwu Li, Rui Song, Yun Chen, Yu Chen, Chengxin He, Yuqing Huang, and et al. 2017. "Multisource Remote Sensing Imagery Fusion Scheme Based on Bidimensional Empirical Mode Decomposition (BEMD) and Its Application to the Extraction of Bamboo Forest" Remote Sensing 9, no. 1: 19. https://doi.org/10.3390/rs9010019