Article

Vegetation Dynamics in the Upper Guinean Forest Region of West Africa from 2001 to 2015

Geospatial Sciences Center of Excellence, South Dakota State University, Brookings, SD 57007, USA
*
Author to whom correspondence should be addressed.
Remote Sens. 2017, 9(1), 5; https://doi.org/10.3390/rs9010005
Submission received: 27 October 2016 / Revised: 11 December 2016 / Accepted: 21 December 2016 / Published: 24 December 2016

Abstract

:
The Upper Guinea Forest (UGF) region of West Africa is one of the most climatically marginal and human-impacted tropical forest regions in the world. Research on the patterns and drivers of vegetation change is critical for developing strategies to sustain ecosystem services in the region and to understand how climate and land use change will affect other tropical forests around the globe. We compared six spectral indices calculated from the 2001–2015 MODIS optical-infrared reflectance data with manually-interpreted measurements of woody vegetation cover from high resolution imagery. The tasseled cap wetness (TCW) index was found to have the strongest association with woody vegetation cover, whereas greenness indices, such as the enhanced vegetation index (EVI), had relatively weak associations with woody cover. Trends in woody vegetation cover measured with the TCW index were analyzed using Mann–Kendall statistics and were contrasted with trends in vegetation greenness measured with EVI. In the drier West Sudanian Savanna and Guinean Forest-Savanna Mosaic ecoregions, EVI trends were primarily positive, and TCW trends were primarily negative, suggesting that woody vegetation cover was decreasing, while herbaceous vegetation cover is increasing. In the wettest tropical forests in the Western Guinean Lowland Forest ecoregion, declining trends in both TCW and EVI were indicative of widespread forest degradation resulting from human activities. Across all ecoregions, declines in woody cover were less prevalent in protected areas where human activities were restricted. Multiple lines of evidence suggested that human land use and resource extraction, rather than climate trends or short-term climatic anomalies, were the predominant drivers of recent vegetation change in the UGF region of West Africa.

Graphical Abstract

1. Introduction

Information about the regional patterns and drivers of tropical forest dynamics is critical to anticipate the impacts of these changes on ecosystem services, including carbon storage, biodiversity conservation and climate regulation [1]. Satellite remote sensing has been widely used to study variations of tropical forest vegetation phenology in relation to climate, and most of this research has taken place in areas dominated by contiguous and intact tropical forest, such as the Congo Basin [2], the Amazon [3,4] and insular Southeast Asia [5]. However, there is also a need for research on vegetation dynamics in the more climatically marginal and human-impacted tropical forest regions. These drier forests are generally found close to the minimum rainfall threshold that separates closed-canopy forests from open woodlands and savanna and are often located at the frontier of deforestation and degradation resulting from human land use [6,7]. Under projected increases of temperature, drought and human populations that will result from continued global change [8,9,10], more tropical forests are expected to become climatically marginal and affected by land uses, such as agriculture and logging. Therefore, research on the dynamics of drier tropical forests is critical to support regional conservation efforts, as well as to further our understanding of the effects that future global change will have on other areas of intact tropical rainforest.
To address this need, we used satellite remote sensing data to characterize recent vegetation trends in the Upper Guinean Forest (UGF) region of West Africa, which is climatically marginal and heavily impacted by dense human populations. The UGF receives less annual rainfall and has higher rainfall seasonality than pan-tropical rainforests, which are characterized by annual rainfall greater than 1500 mm with little-to-no dry season [11,12]. Since the 1970s, a drying trend has been observed, and these changes have been primarily associated with shifts in a natural low-frequency mode (65–80 years) of sea surface temperature known as the Atlantic Multidecadal Oscillation [13]. Rapid population growth has exacerbated regional development pressures, including timber harvesting and demand for agricultural land [14]. Most research in West Africa has occurred in the drier Sahelian and Sudanian regions and has focused on understanding the trends of increasing greenness that followed severe droughts in the 1970s and 1980s [15]. In particular, there has been a debate as to whether regreening represents an enhancement of herbaceous vegetation production [16,17], woody vegetation recovery from the extensive drought-induced mortality [18,19] or both. Several broader continental and global studies of deforestation rates in humid forests [6,7,20] and woody vegetation loss in dry forests [21] have encompassed the UGF region. However, recent reviews have highlighted the relative lack of knowledge about long-term vegetation dynamics in the wetter and cloudier forested regions of West Africa [14,22,23].
The specific vegetation attributes that are derived from satellite observations depend on spectral response to different plant characteristics. Green healthy leaves have low reflectance in the visible wavelengths (ca. 400–700 nm) due to absorption by chlorophyll and other pigments, low reflectance in the shortwave infrared (SWIR) wavelengths (>1400 nm) due to water absorption and high reflectance in near infrared (NIR) wavelengths (ca. 750–1400 nm) because of the physical structure of healthy leaves [24]. Dead or water-stressed vegetation typically increases the reflectance of visible and SWIR wavelengths, but decreases the reflectance of NIR wavelengths, and these relationships provide the basis for monitoring vegetation change using spectral vegetation indices (VIs). Most of the VIs fall into one of two groups, with one group of vegetation greenness indices aimed at measuring vegetation vigor or “greenness” using the red and NIR wavelengths and the other group of vegetation moisture indices aimed at measuring water content using the SWIR wavelengths.
Greenness indices correlate with a wide range of vegetation properties, including the amount of photosynthetically-active aboveground material, green vegetation fraction, leaf area index and net primary production. The normalized difference vegetation index (NDVI) is one of the most commonly-used greenness indices to monitor vegetation dynamics because the necessary wavelengths are measured by numerous satellite sensors, many of which have collected long-term records [25]. However, trends in NDVI do not necessarily reflect changes in other vegetation characteristics, such as physiognomic structure and water content. Some research has suggested that NDVI can be used to estimate woody vegetation cover in savanna and woodland ecosystems [26,27], and that positive trends in NDVI can be interpreted as woody vegetation encroachment or densification [28,29]. In contrast, Mitchard and Flintrop [30] pointed out that the signals in the NDVI were more related to changes in the grass layer than woody vegetation cover in West Africa. The NDVI is also subject to a number of other limitations, including index saturation in closed canopies and sensitivity to atmospheric aerosols and soil background [31].
Previous research has found that SWIR-based moisture indices are sensitive to the interaction between the water content and the structure of the canopy in boreal [32], temperate [33] and tropical forests [31,34]. Several recent studies have also found that SWIR-based VIs have the potential to detect woody vegetation in tropical forest and savanna ecosystems. For example, Rufin et al. [35] demonstrated that annual time series of tasseled cap wetness (TCW) captured the trends of woody encroachment on pastoral land in the Amazon. Karlson et al. [36] showed that SWIR-based VIs were better at describing vegetation structure and aboveground biomass than red/NIR-based VIs in Sudano-Sahelian woodlands. Kergoat et al. [37] demonstrated that SWIR-based VIs were associated with dry-season vegetation biomass and vegetation cover fraction in the Sahel. Caccamo et al. [38] found that SWIR-based moisture indices were better at detecting vegetation change than red/NIR-based greenness indices because vegetation water content was more dynamic than changes in greenness properties. Therefore, SWIR-based VIs can provide additional information that complements the more widely-used greenness indices, particularly in tropical regions where vegetation is sensitive to moisture stress [39].
The main objective of this study was to characterize trends in woody vegetation cover across ecoregions in the UGF countries of West Africa. This research is novel in that it examines an understudied region where vegetation trends have not previously been documented and because it uses both greenness- and moisture-based indices to explore multiple dimensions of vegetation dynamics. We addressed the following questions: (1) Which greenness- or moisture-based index provides the most reliable indicator of woody vegetation cover across the study area? (2) Is woody vegetation cover exhibiting an overall increase or decrease within the study area? (3) Do the observed patterns of remotely-sensed vegetation change differ by country, ecoregion and protected area status? This paper is organized as follows: the study area and dataset are briefly described, followed by a detailed explanation of the data processing and statistical methods. The trends of different vegetation indices are then compared across various geographic strata. The paper concludes with a discussion of the importance of using multiple vegetation indices to explore change, inferences about drivers of the observed changes and implications for West African forest ecosystems.

2. Materials and Methods
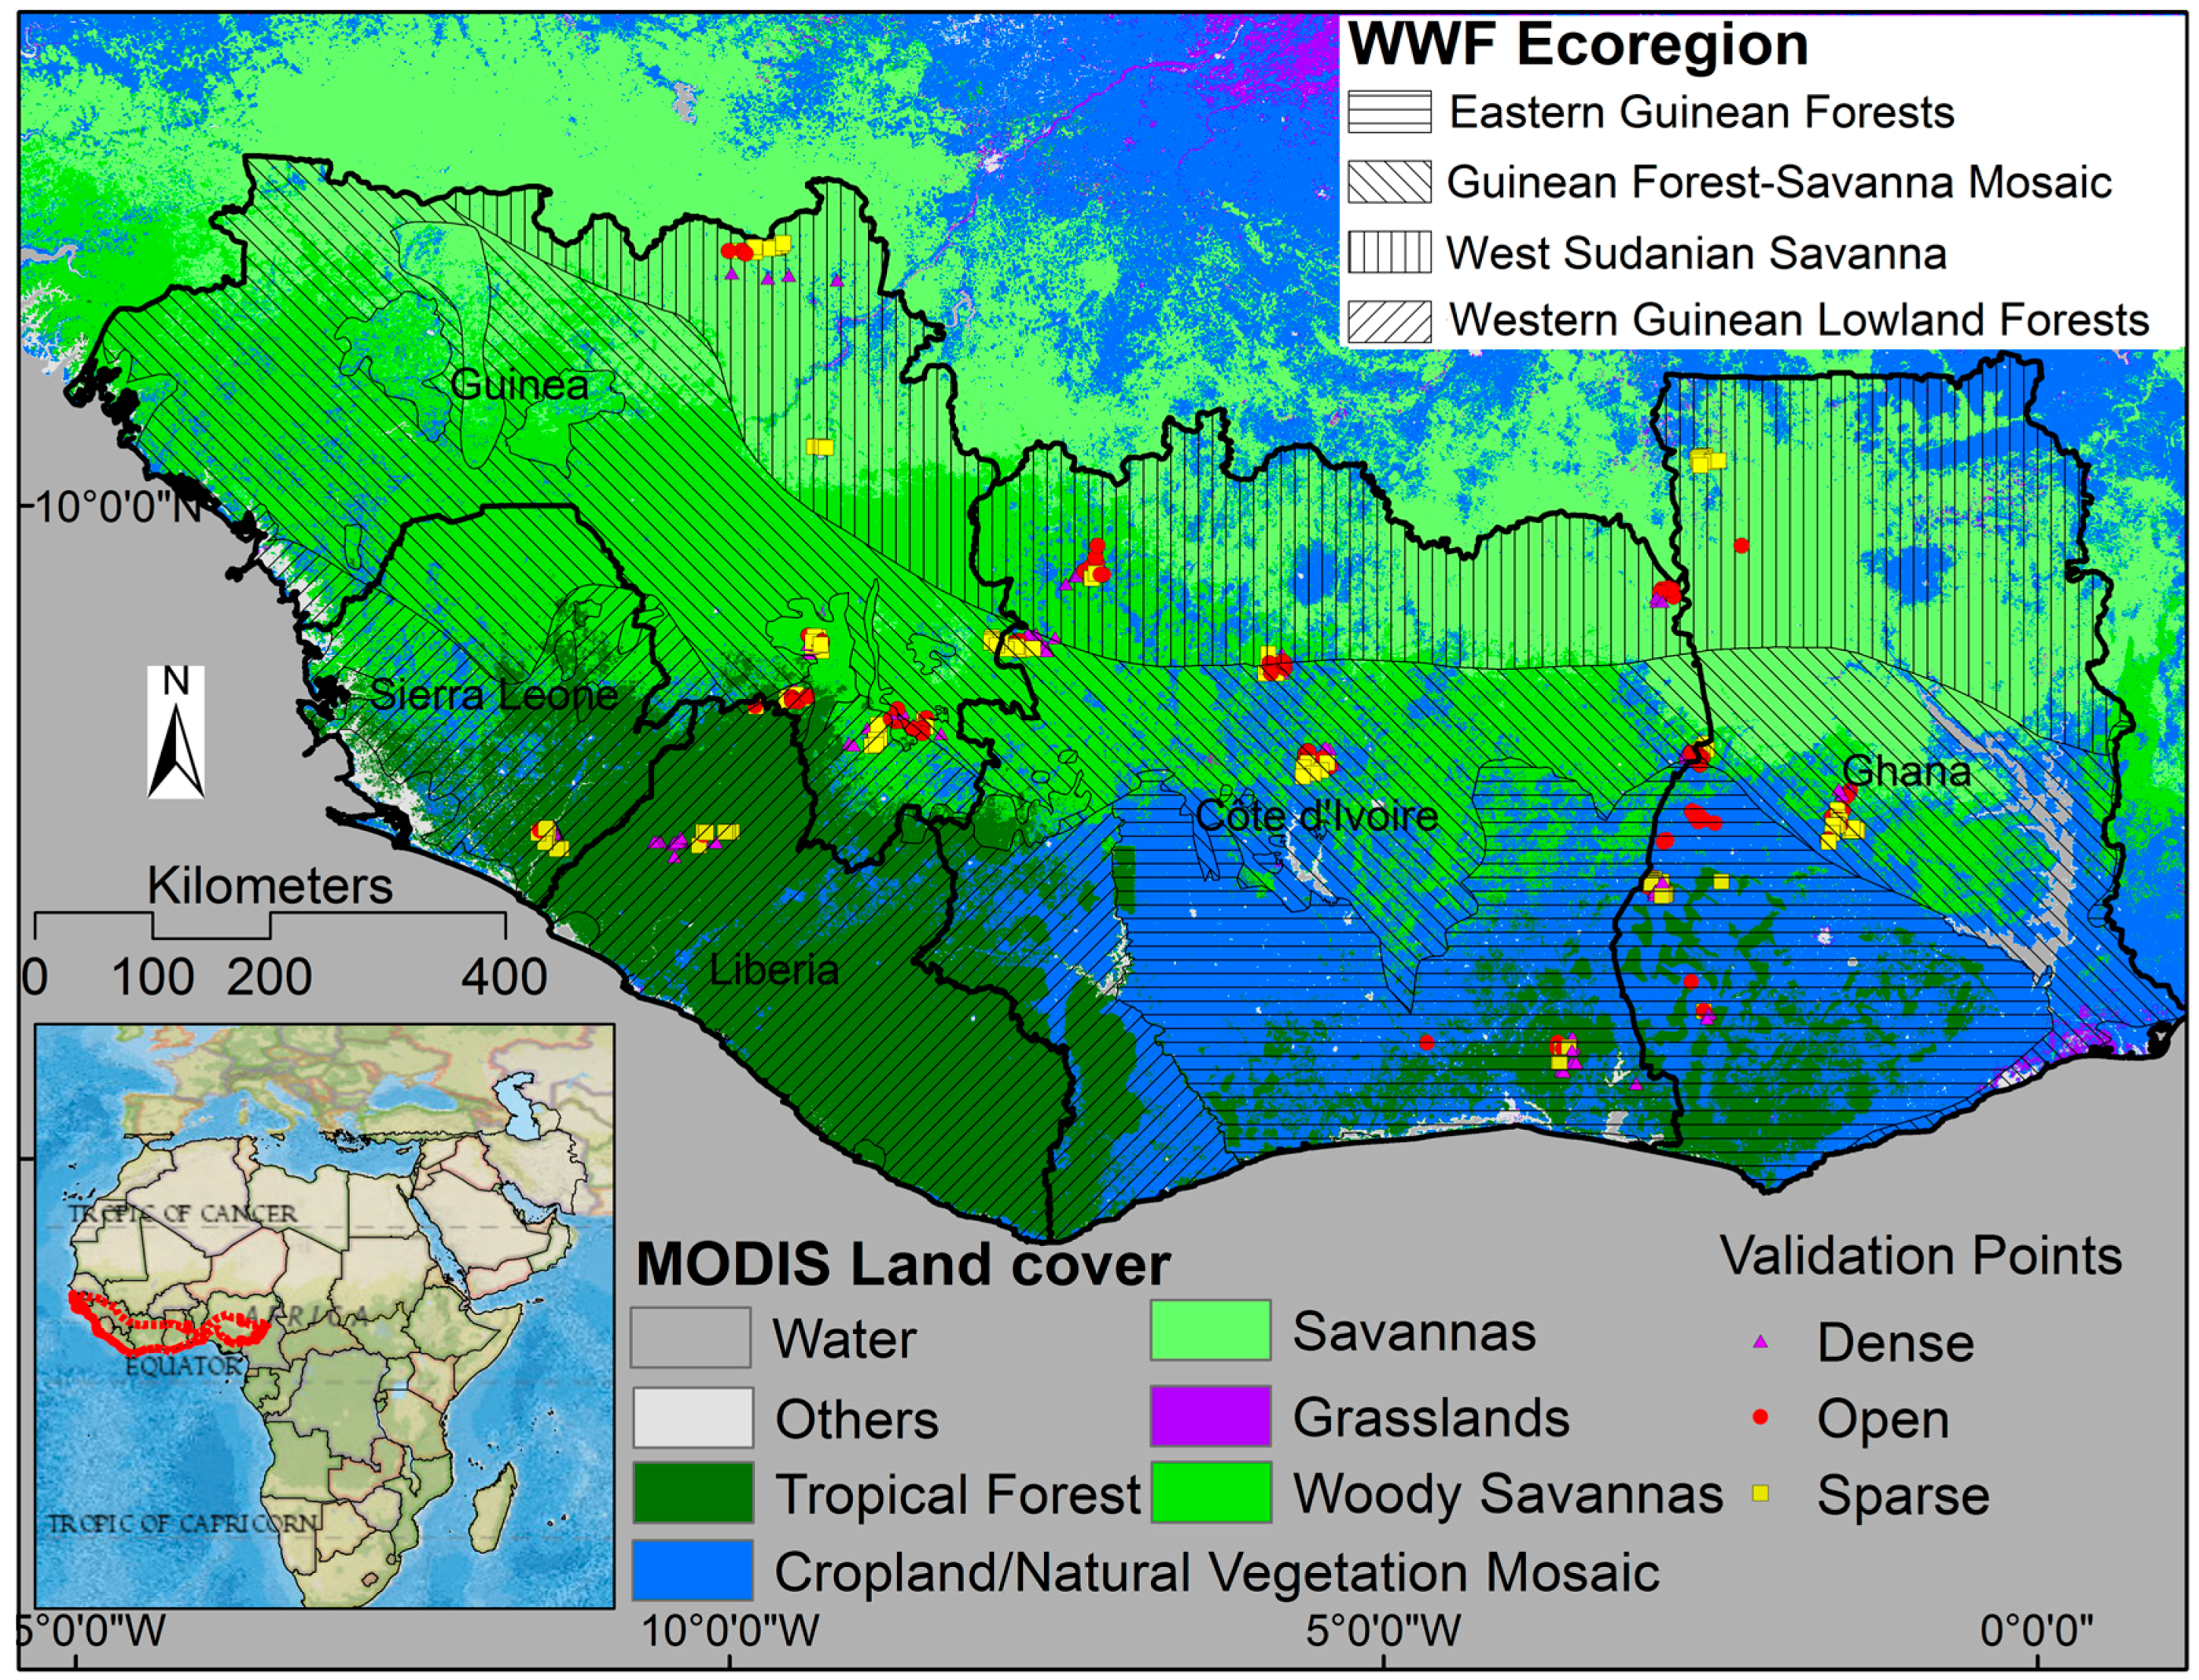
2.1. Study Area

The study area encompassed 985,480 km2 and covered five coastal countries that encompass the UGF region of West Africa: Ghana, Côte d’Ivoire, Liberia, Sierra Leone and Guinea (Figure 1). In this region, annual rainfall varies geographically from more than 2000 mm in the Western Guinean Lowland Forests, to between 1200 and 1500 mm across the Eastern Guinean Forests and Guinean Forest-Savanna Mosaic, to less than 1200 mm in the West Sudanian Savanna. Decreasing rainfall is generally associated with a longer dry season and high inter-annual variability of rainfall [40]. Seasonal rainfall has a unimodal pattern with one dry and one wet season in the Western Guinean Lowland Forests and a bimodal pattern with two short wet seasons in the Eastern Guinean Forests. Rainfall regimes are controlled by the Intertropical Convergence Zone (ITCZ) and the West Africa Monsoon (WAM) and are also influenced by teleconnections with climate modes, such as the El Niño-Southern Oscillation (ENSO) and Atlantic Multidecadal Oscillation (AMO) [40,41]. Natural vegetation is strongly associated with rainfall and varies from dense evergreen rainforests, to drier closed-canopy semi-deciduous forests, to woodlands and savannas with varying levels of tree cover [42]. The population density in this area is one of the highest in the African continent, and most of the rural population relies on subsistence agriculture for their livelihoods. This strong dependency on agricultural production has resulted in the conversion of most of the natural vegetation for agriculture, and the remaining forests are highly fragmented as a result. Only about 15% of the region is covered by closed canopy forests, and these forests are still undergoing considerable degradation and deforestation as a result of land use changes, logging and fire [14].

2.2. Nadir BRDF-Adjusted Reflectance Data

Data acquired via the Moderate Resolution Imaging Spectroradiometer (MODIS) on board Terra and Aqua have been widely used to study forest dynamics in tropical regions because of their superior quality in terms of atmospheric correction, accurate geolocation and near-daily observations [43,44]. For this study, reflectance data for Bands 1–7 from the MODIS nadir bidirectional reflectance distribution function (BRDF)-adjusted reflectance (NBAR) product (MCD43A4 collection 5, 500 m resolution) were used along with the associated quality flags. The MCD43A4 product composites data over a 16-day period, and the composites are updated every 8 days. This product uses BRDF models to account for view angle effects and provide more consistent measurements of surface reflectance. The NBAR product has been used by other standard MODIS products, such as the MODIS land cover type product [45], and has been validated by ground-based measurements [46,47]. The NBAR reflectance data were accompanied by a quality product (MCD43A2) that classified the data quality into 5 levels based on the inversion information used by the BRDF model [48]. For this analysis, we downloaded all available imagery over the study area from six MODIS tiles (Vertical Tile Numbers 7–8 and Horizontal Tile Numbers 16–18) from 24 February 2000–31 March 2015 from the Land Processes Distributed Active Archive Center (LP DAAC, https://lpdaac.usgs.gov/). Observations flagged as 0 (best quality), 1 (good quality) or 2 (magnitude inversion with observations ≥7) were considered good observations and used to calculate the VIs.

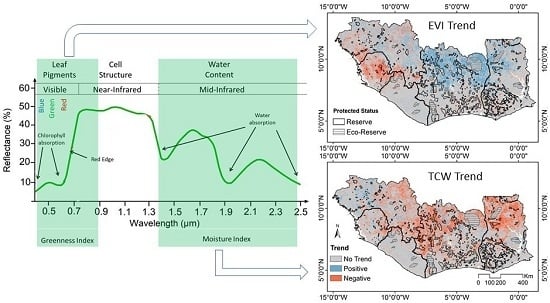
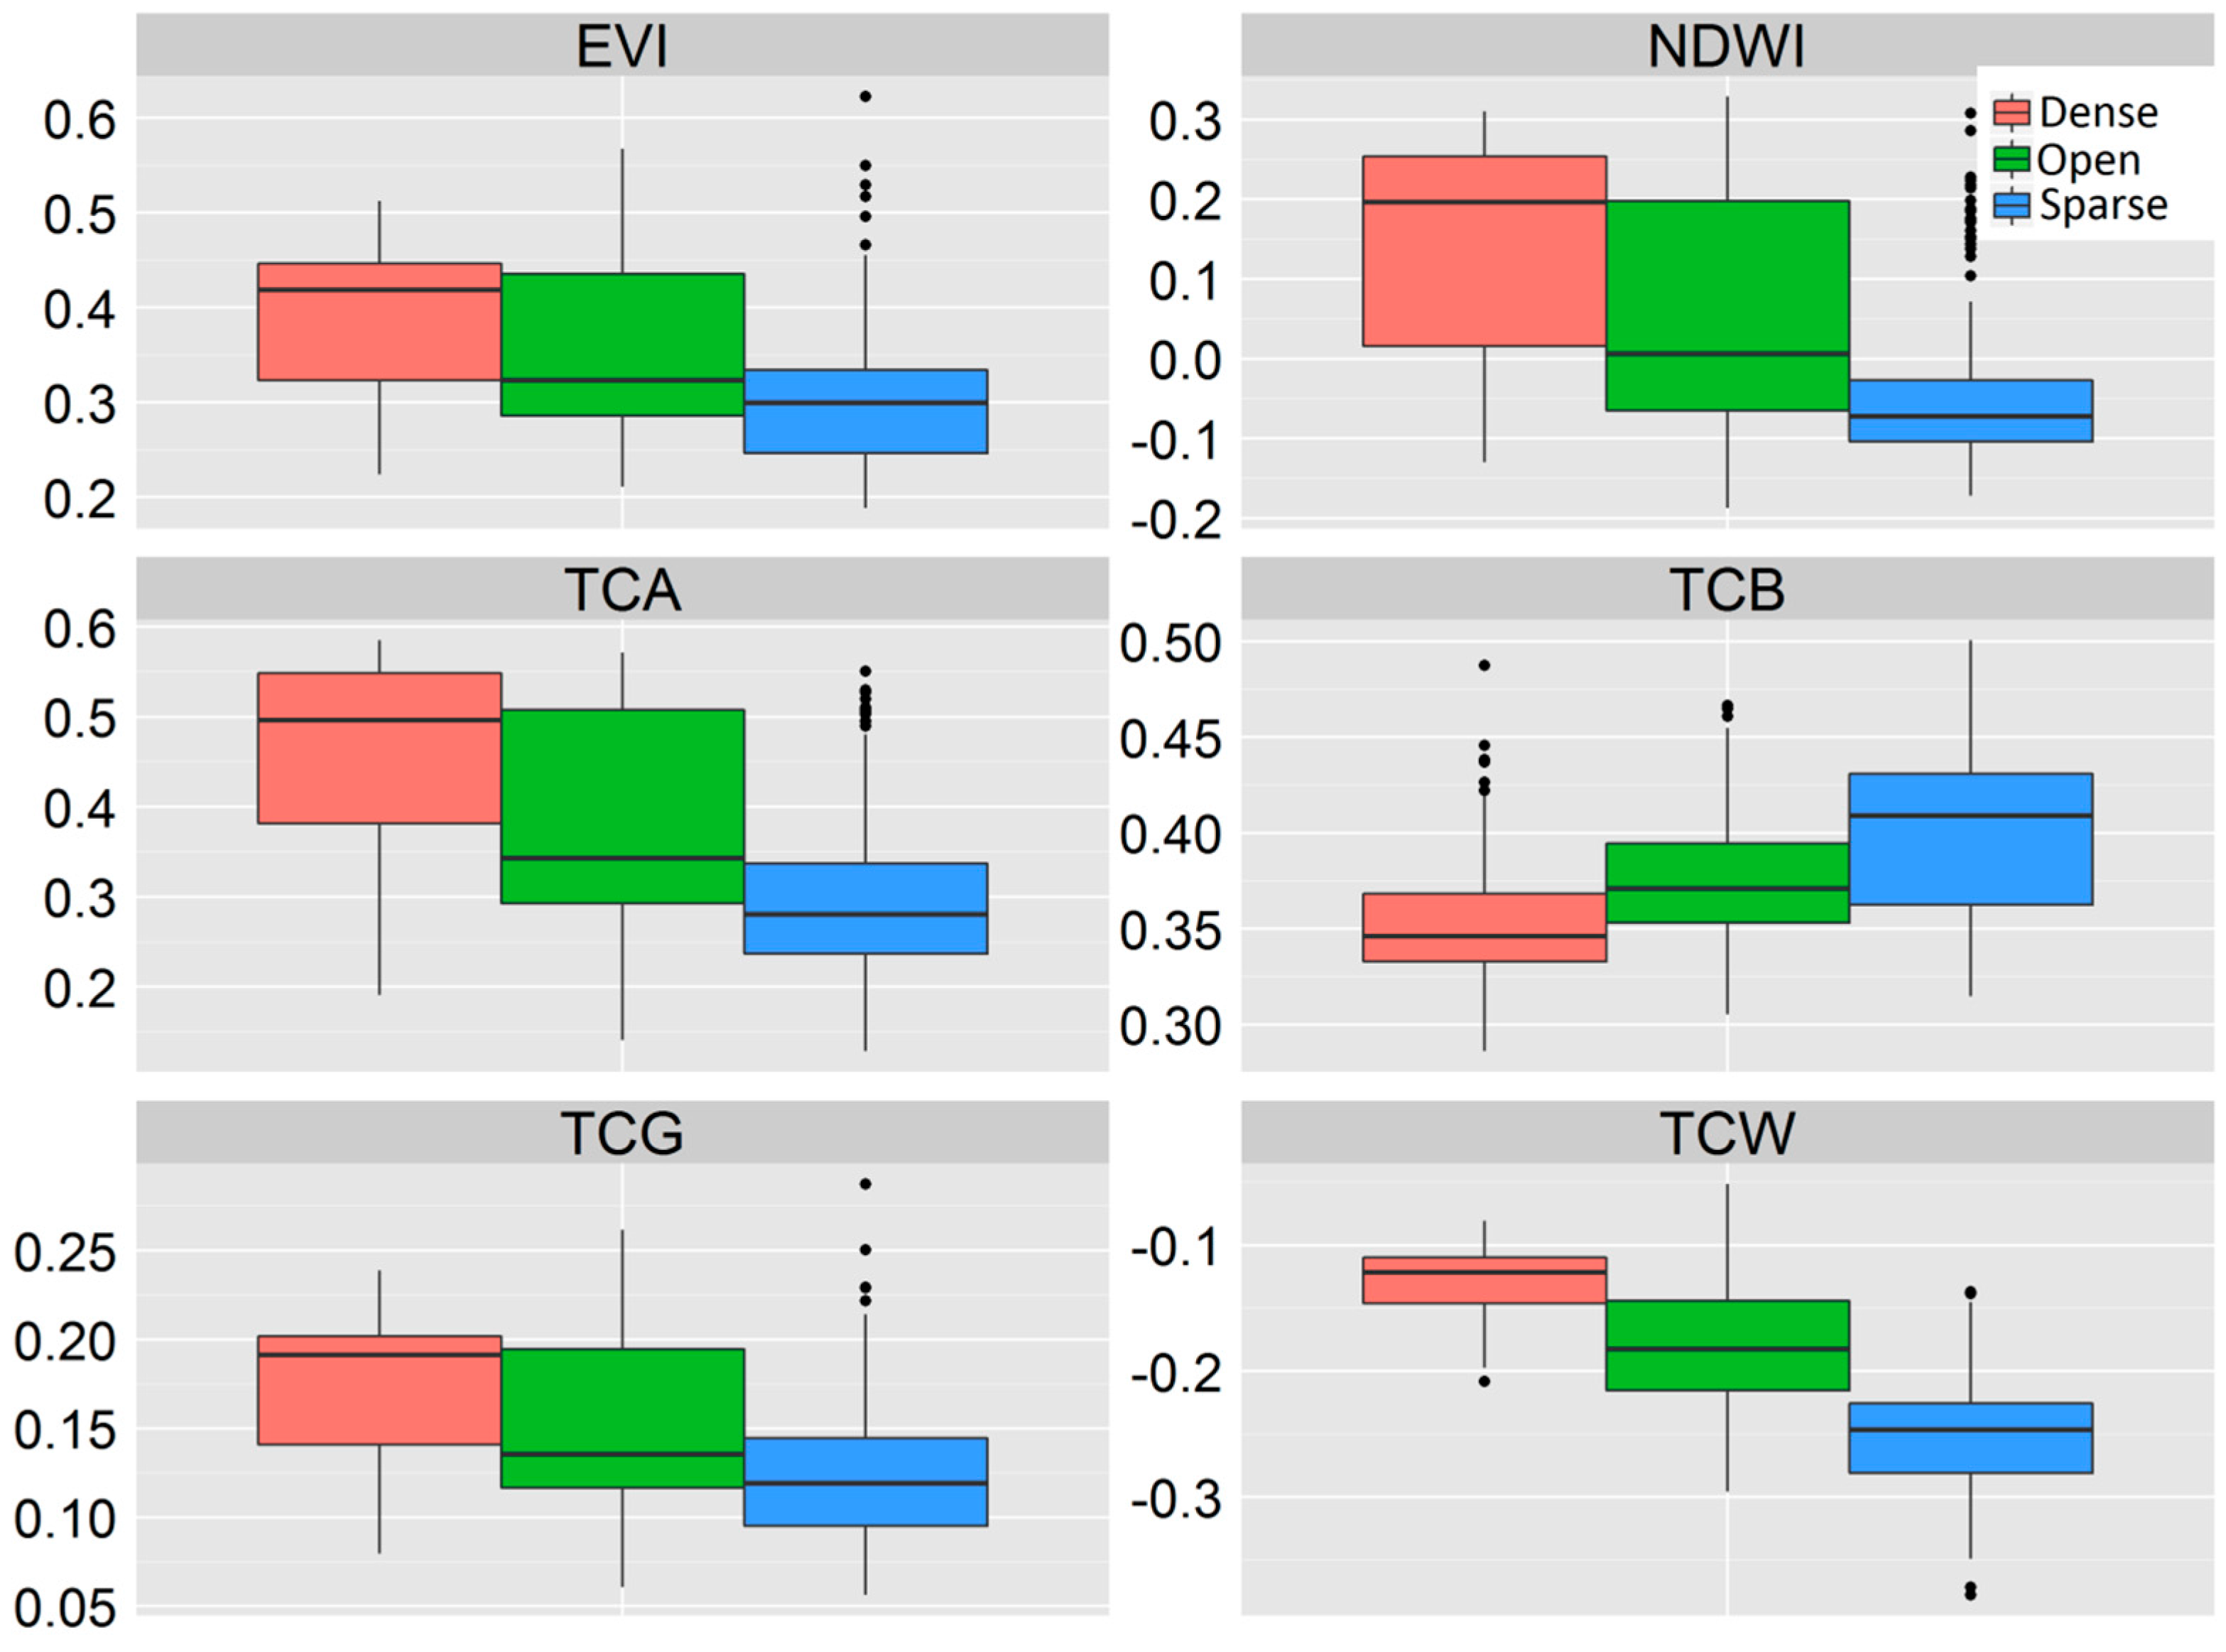
2.3. Vegetation Indices

The enhanced vegetation index (EVI) was developed to minimize soil and atmospheric sensitivity and to reduce saturation effects associated with NDVI and has been shown to be a good indicator of photosynthetic capacity and greenness in tropical forests [2,31,49]. A two-band EVI index was used because it shows similar patterns as the three-band EVI, but is less affected by high-reflectance surfaces, such as clouds [50].
  EVI = 2.5 ×   ρ NIR ρ Red ρ NIR + 2.4 × ρ Red + 1
where ρ NIR is the reflectance in the NIR wavelength (841–876 nm) and ρ Red is the reflectance in the red wavelength (620–670 nm).
The normalized difference water index (NDWI) provides information about canopy-level water content and canopy structure in forest ecosystems and is generally less sensitive to saturation effects than NDVI [31,33,51].
NDWI =   ρ NIR ρ SWIR ρ NIR + ρ SWIR
where ρ SWIR is the reflectance in the SWIR wavelength (1628–1652 nm).
Tasseled cap (TC) indices are well-known linear transformations of band reflectances and have been widely used for forest mapping and change detection. The TC brightness (TCB) is a function of the total reflectance of the image and is often used as a measure of soil exposure. TC greenness (TCG) is a function of the contrast between NIR and visible bands and is comparable to red/NIR-based greenness indices such as NDVI and EVI. TCW is a function of the contrast between NIR and SWIR bands and, in vegetated areas, can serve as an indicator of canopy structure or the amount of dead or dried vegetation [52]. The calculation of TC indices was based on standard TC transformation coefficients for MODIS Bands 1–7 [53].
TC angle (TCA) is defined as the angle formed by TCG and TCB in the vegetation plane, representing the ratio of vegetated to non-vegetated surface. TCA has been used to characterize vegetation density and succession in coniferous forests [32,54] and has shown good correlation with LiDAR-derived canopy structure (canopy cover and height) in temperate forests in British Columbia, Canada [55]. Generally, denser forest stands show higher TCA values.
TCA = arctan ( TCG / TCB )

2.4. Calculation of Annual Dry Season Vegetation Indices

The dry season is the best period to detect vegetation dynamics in the tropics because of low cloud cover and sensitivity of vegetation to water availability. Rainfall seasonality in the study area is strongly influenced by the West Africa Monsoon (WAM). The wet season starts in early May along the Guinea coast as the monsoon begins. The monsoon begins its southern retreat in late August, and the coastal wet season ends in early November. We quantitatively and objectively defined the start and end of the dry season as 15 November and 31 March of the following year using methods developed by Liebmann et al. [41] based on TRMM daily rainfall (3B42 V7) from 1 January 2000–31 March 2015.
We identified the beginning of the hydrological year as the onset of the wet season (1 April). For each hydrological year (hereafter referred to simply as years), we first calculated VIs for each 16-day MODIS composite acquired during the dry season (15 November–31 March). Then, annual dry season VI composites were calculated from the median of 18 dry season composites for each year, resulting in a time series with 15 elements (15 years, 2001–2015) for each pixel. The median value was used because it has been shown to be (1) less sensitive to data anomalies and (2) superior to other statistics at detecting trends in woody vegetation fractions in tropical regions [35].

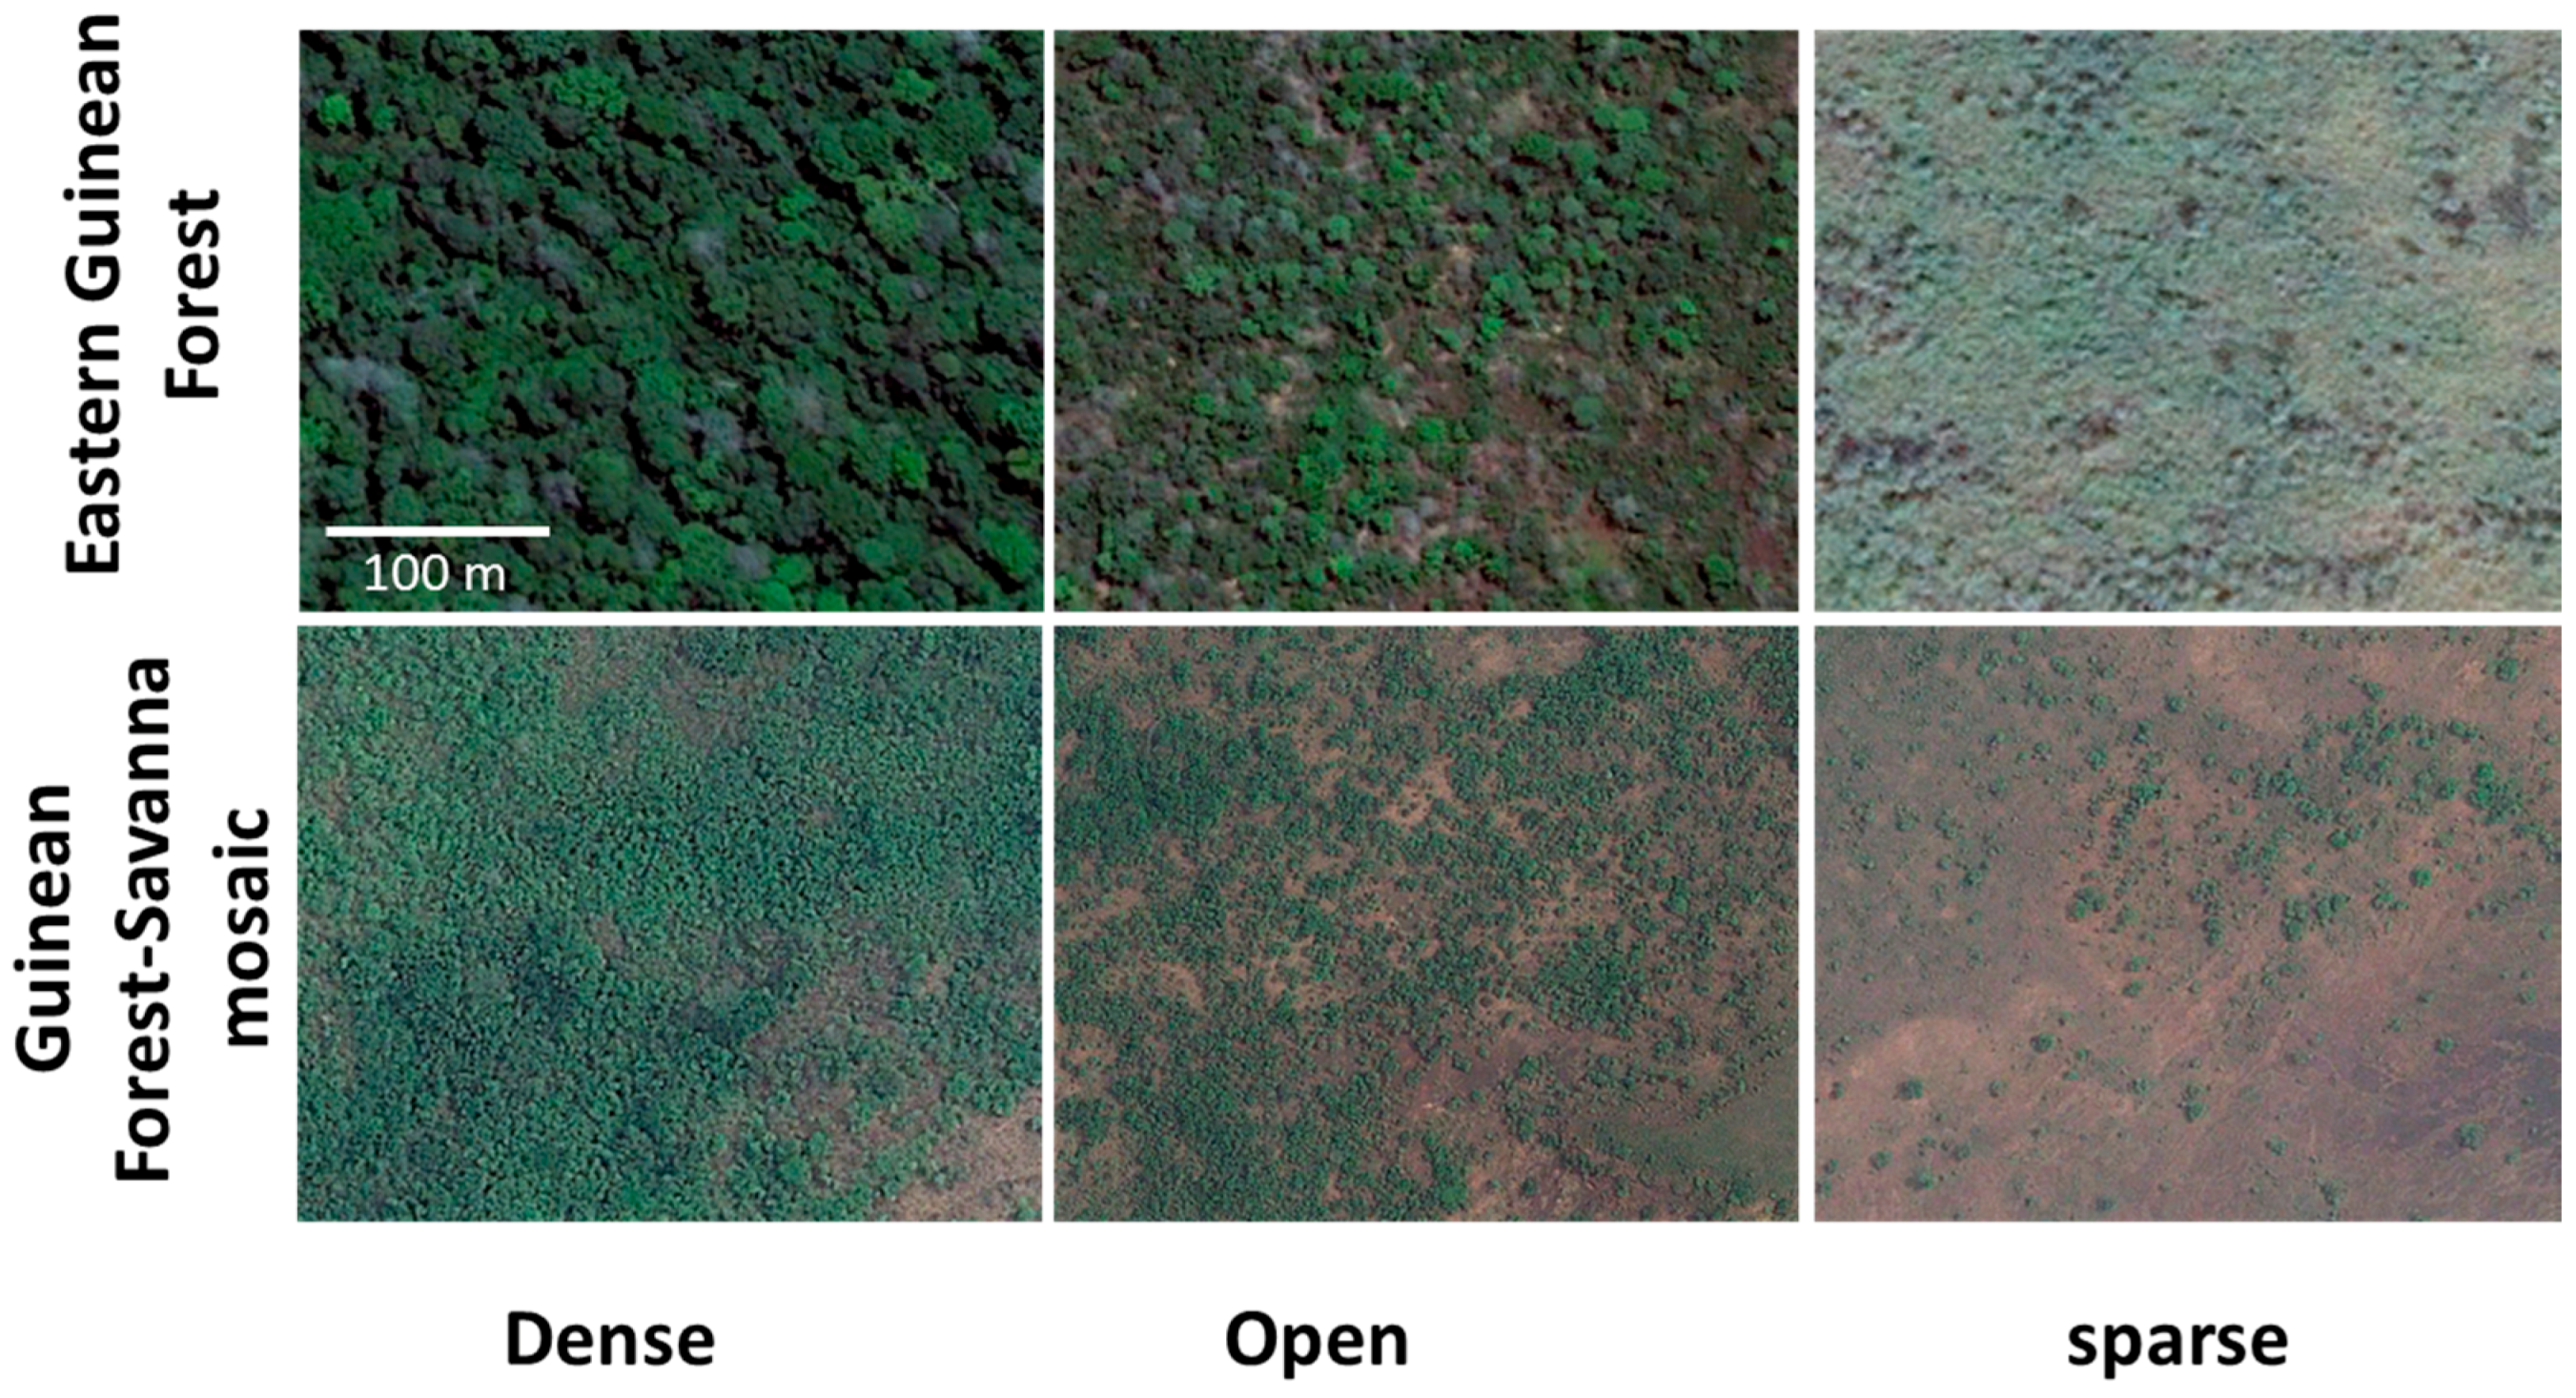
2.5. Ground Validation Points

We selected ground validation points (GVPs) from Google Earth Digital Globe high spatial resolution imagery to test the ability of the selected VIs to distinguish areas with different levels of woody vegetation cover (Figure 2). Woody phanerophytes, including trees and shrubs, can maintain their photosynthetic activity during the dry season and are visually identifiable from high resolution imagery. Using an approach similar to [21], we defined three levels of woody cover: dense cover: >70% canopy cover; open cover: 30%–70% canopy cover; and sparse cover: <30% canopy cover. To minimize the potential spatial mismatch of GVPs footprints and the larger MODIS pixels, GVPs were selected from the center of large areas (>1 MODIS cell) with relatively homogeneous woody cover. A total of 510 GVPs were selected, stratified by major ecoregions of the UGF region (Figure 1 and Table 1). The high-resolution imagery used to identify the GVPs was all from dry seasons between 2012 and 2015. The MODIS annual dry season VIs from corresponding years were extracted as the average of 3 × 3 MODIS pixel windows surrounding each GVP.

2.6. Analysis

2.6.1. The Ability of VIs to Separate Different Classes of Woody Vegetation

We used the area under the curve (AUC) of a receiver operating characteristic plot (ROC) to evaluate the ability of VIs to separate the three woody vegetation classes. The inputs for AUC calculations were classes of validation points and their associated VI indices. Values of AUC can range from ≤0.5 for VIs that have no relationship with the classes to 1.0 for VIs giving perfect separation of the classes. In this analysis, a multi-class AUC value was obtained by averaging the AUC values for all pairwise comparisons [56] and was interpreted as follows: excellent >0.90; good 0.80–0.90; fair 0.70–0.80; poor 0.60–0.70; fail 0.50–0.60 [57]. The multi-class AUC was calculated using the multiclass.roc command in the pROC package [58] in R.

2.6.2. Vegetation Trend Analysis

To focus the analysis on trends driven by human land use rather than climate variability, we removed the effects of precipitation on the observed inter-annual patterns of VI. We corrected the observed time series of VIs using the residual trend analysis procedure proposed by Evans and Geerken [59]. In this method, linear regression is used to model annual VIs as a function of antecedent precipitation. Previous analyses have shown that the forest phenology lags the cumulative precipitation by about one month in moist tropical forests in the Congo Basin [2,60]. We tested the correlation between annual VIs and antecedent 3-month cumulative precipitation [2] before the start of the dry season at different time lags ranging from 0–9 months and found the strongest correlation occurred at a two-month time lag (r = 0.44 for EVI, and r = 0.45 for TCW). Therefore, we developed regression models of dry-season VIs as a function of 3-month cumulative precipitation at a 2-month lag before the start of the dry season for every pixel (Figure S1). The residual VIs were then calculated by subtracting the VIs predicted as a function of precipitation from the observed VIs at each MODIS pixel. Trends in these residuals were interpreted as changes in vegetation that were independent of precipitation.
Trends were computed using a non-parametric Mann–Kendall (MK) test on the residual VIs [61]. The MK test is a rank-based test of a monotonic trend that is not sensitive to skewed data, extreme values or non-linear trends, making it a robust test for the detection of trends in time series data. The statistical power of the MK test depends on the pre-assigned significance level, the magnitude of the trend, sample size and the amount of variation within a time series [61]. Trend analysis was carried out only if: (1) there were at least 6 valid data points in the time series; and (2) there was no large data gap (i.e., the maximum consecutive data gap was smaller than 5 years). Non-vegetated areas (e.g., water and “others” in Figure 1) were masked out from the trend analysis. The results of the MK test for each MODIS pixel included: (1) a statistic, S, with a positive value indicating an increasing trend and negative values indicating a decreasing trend; and (2) a significance test result. An alpha-level of 0.1 was used to carry out two-sided tests of statistical significance because of the short time series and relatively small sample sizes. The trends were classified into positive (S > 0 and p < 0.1), negative (S < 0 and p < 0.1) and no trend (p ≥ 0.1). The MK test was performed by using the Kendall package in R.

2.6.3. Spatial Variability of Vegetation Trends

We partitioned the results of our vegetation change analyses by World Wide Fund (WWF) terrestrial ecoregion, country and protected area to aid in the interpretation of regional trends. WWF terrestrial ecoregions are distinct assemblages of natural communities, with boundaries that approximate the original extent of these communities prior to major land use change [62]. The study area was primarily covered by the West Sudanian Savanna (24.1%), Guinean Forest-Savanna Mosaic (31.7%), Eastern Guinean Forest (18.7%) and Western Guinean Lowland Forest (21.0%) ecoregions (Figure 1). The Guinean Montane Forests and Mangroves ecoregions were excluded from the analysis due to their small area (4.5%). The Eastern Guinean Forests and Western Guinean Lowland Forests comprise the UGF block and encompass some of the wettest parts of West Africa. The Guinean Forest-Savanna Mosaic is influenced by complex interactions between climate, edaphic conditions and anthropogenic activities, such as cultivation and fires. The West Sudanian Savanna is in the zone of disturbance-determined ‘unstable’ savannas defined by Sankaran et al. [63], where disturbances such as fire and herbivory are required for the coexistence of trees and grass.
Protected area (PA) boundaries were obtained from the World Database on Protected Areas (accessed in July 2015). The PAs were reclassified into eco-reserve and reserve based on the Protected Categories System defined by the International Union for Conservation of Nature. Specifically, eco-reserves were PAs of Categories I (a and b) to V, which are designated to protect biodiversity and ecosystem integrity and where human influence is generally prohibited or minimal. Reserves were PAs of Category VI, which are designated for sustainable natural resource management, such as timber harvesting. Eco-reserves and reserves respectively accounted for 3.8% and 7.7% of the total study area.

3. Results

3.1. The Ability of VIs to Separate Different Classes of Woody Vegetation

TCG, TCW, TCA, NDWI and EVI were all positively associated with woody vegetation cover, whereas TCB was negatively associated with woody vegetation cover (Figure 3). The AUC statistics showed that all of the selected VIs provided good discrimination of dense woody cover from sparse woody cover (Table 2, Figure 3). However, only TCW provided good separation of dense woody cover from open woodlands (AUC = 0.86) and of open woodlands from sparse woody cover (AUC = 0.82). The multiclass AUC statistics confirmed that TCW provided the best discrimination of different levels of woody cover (AUC = 0.89), while the EVI always performed the worst (AUC = 0.70) (Table 2). Therefore, we focused on trend analysis of TCW as an indicator of woody vegetation cover. We also contrasted the TCW with EVI, a greenness metric similar to NDVI, to explore how trends in woody cover differ from those exhibited by a more commonly-used vegetation greenness index.

3.2. Trend Analysis on Different VIs

Trends of TCW and EVI exhibited very different geographic patterns, especially in the West Sudanian Savanna and Guinean Forest-Savanna Mosaic ecoregions (Figure 4). Overall, TCW showed a more widespread negative trend (21%) than a positive trend (5%). On the contrary, EVI showed a smaller area of negative trends (8.4%) than positive trends (15.9%). About 37.7% of the study area showed different trend results for TCW versus EVI, and these areas were mostly in the drier parts of the study area (Figure 4). Spatial patterns of significant vegetation trends for the raw and residual VIs were very similar (Figure 4 and Figure S3). Thus, although precipitation was correlated with inter-annual variability in remotely-sensed vegetation metrics, it was not the major driver of longer term vegetation trends in the UGF region.

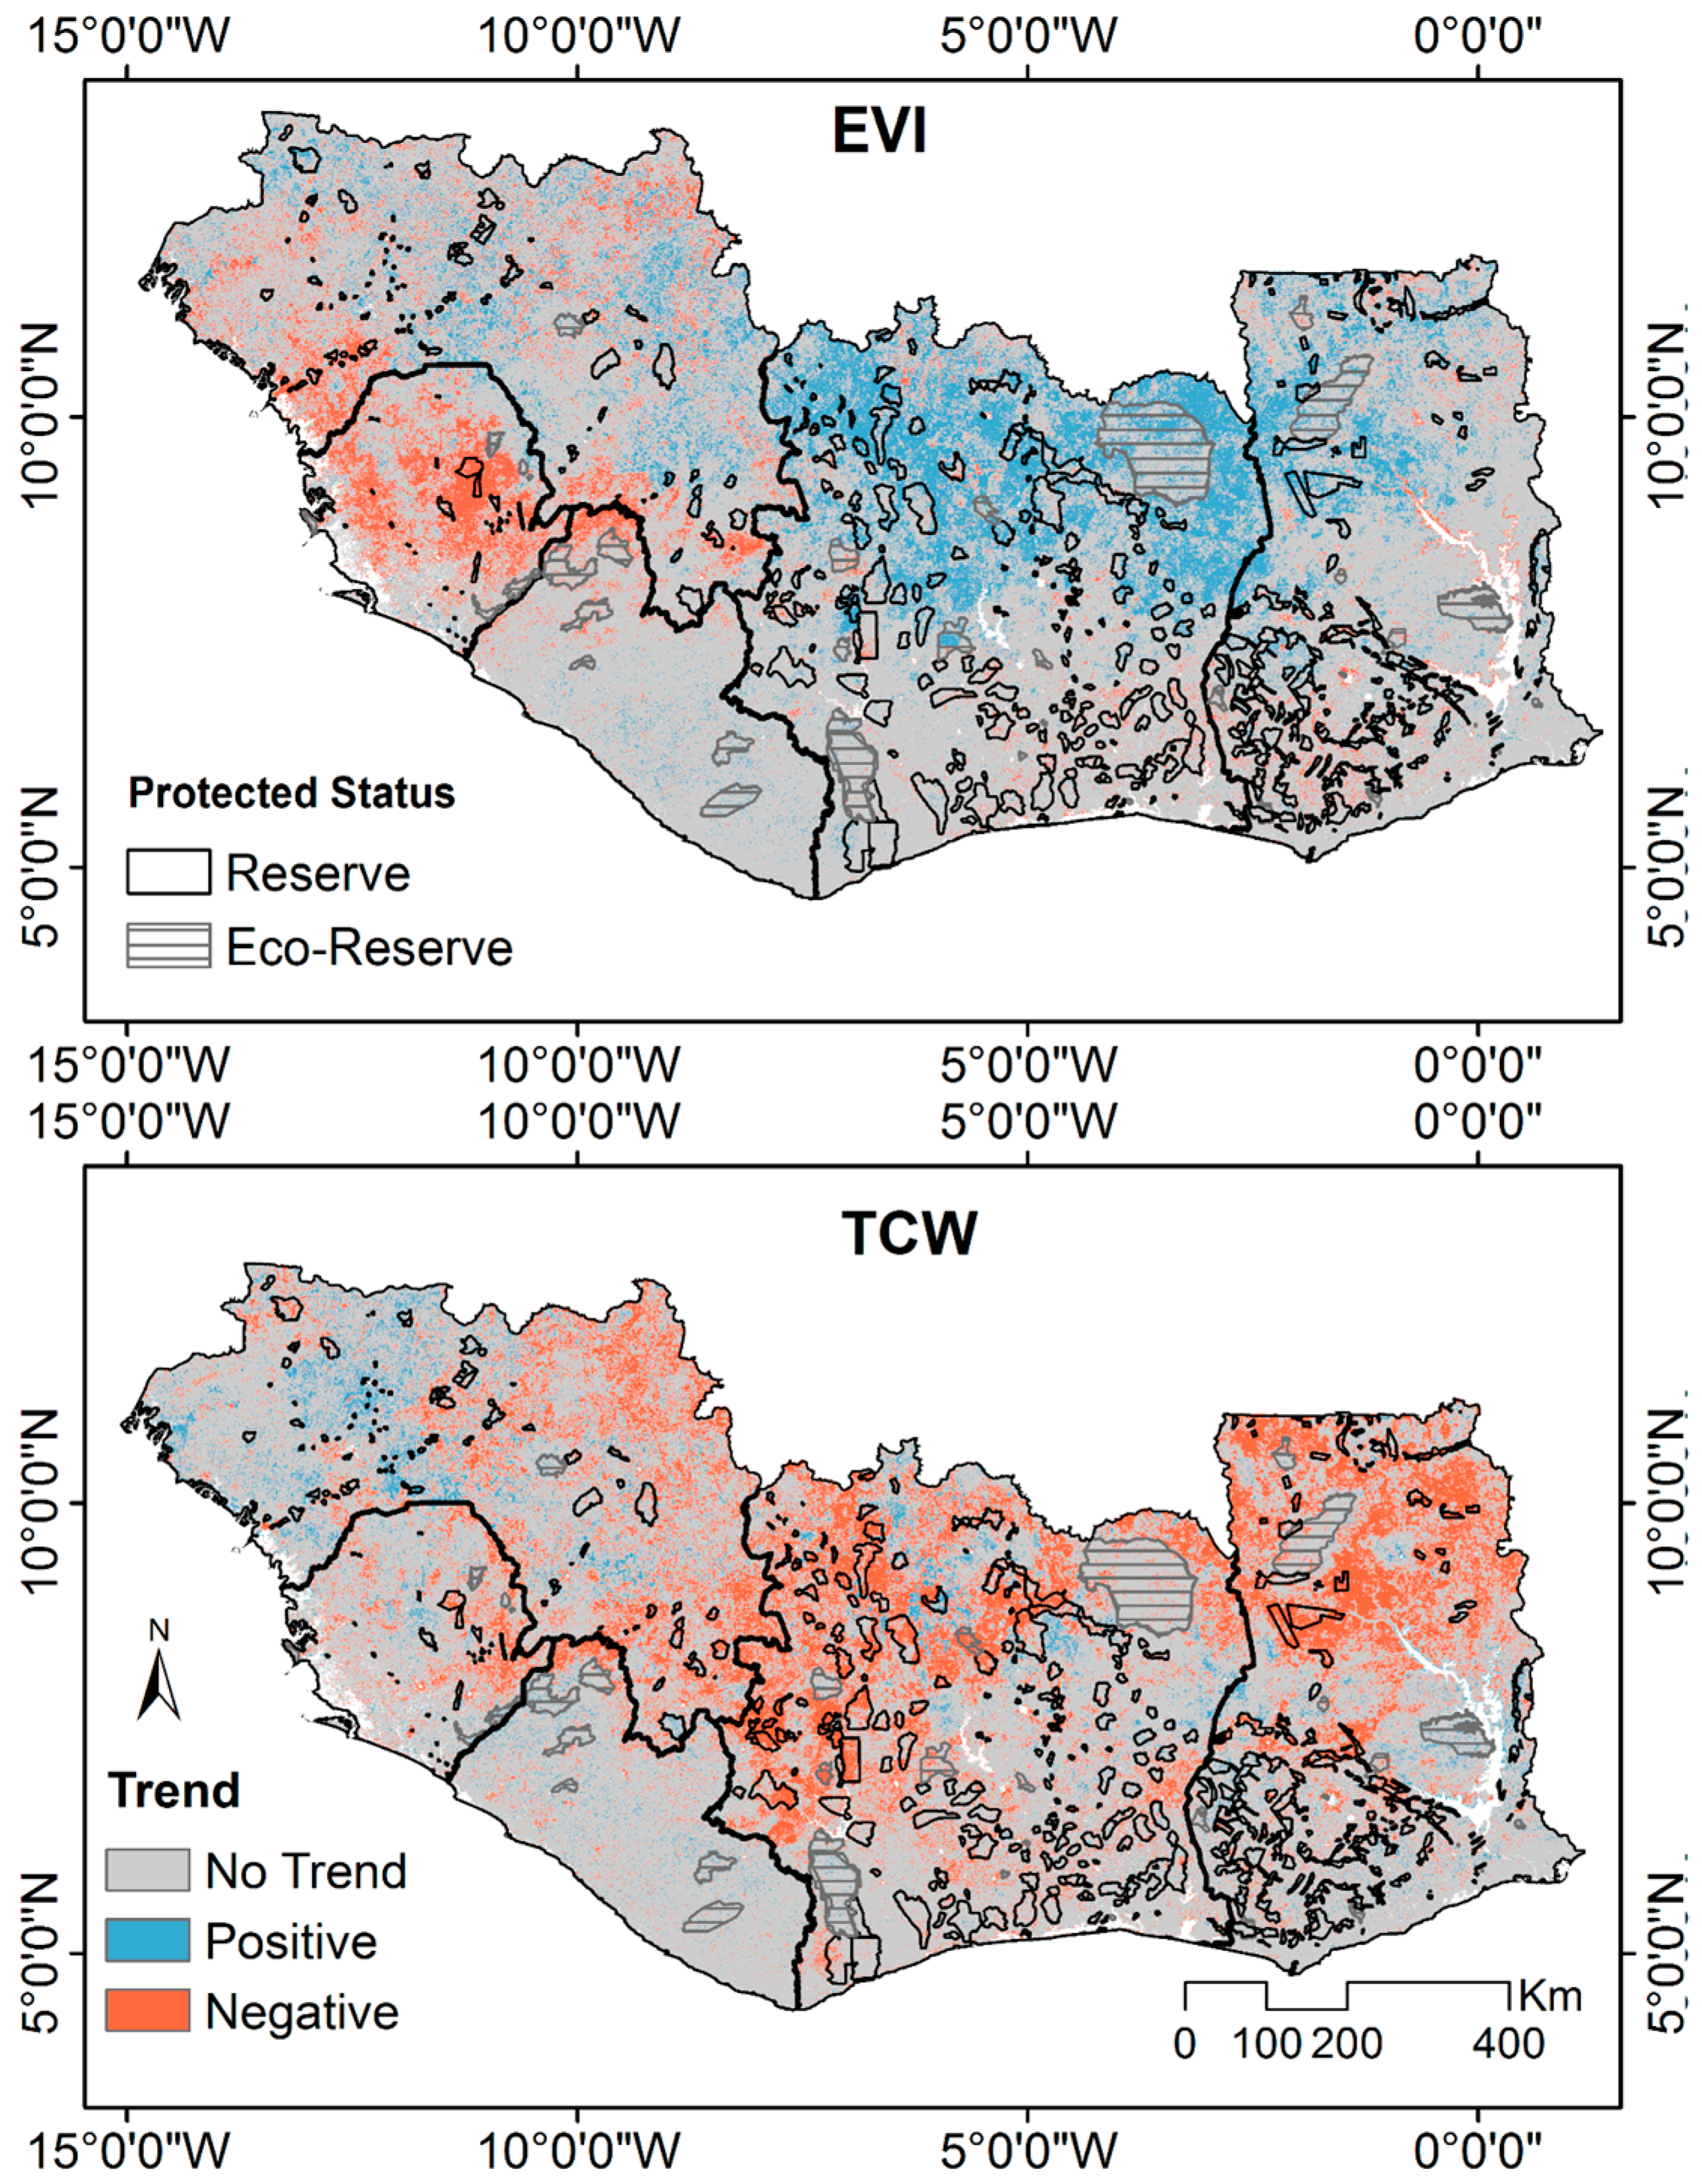
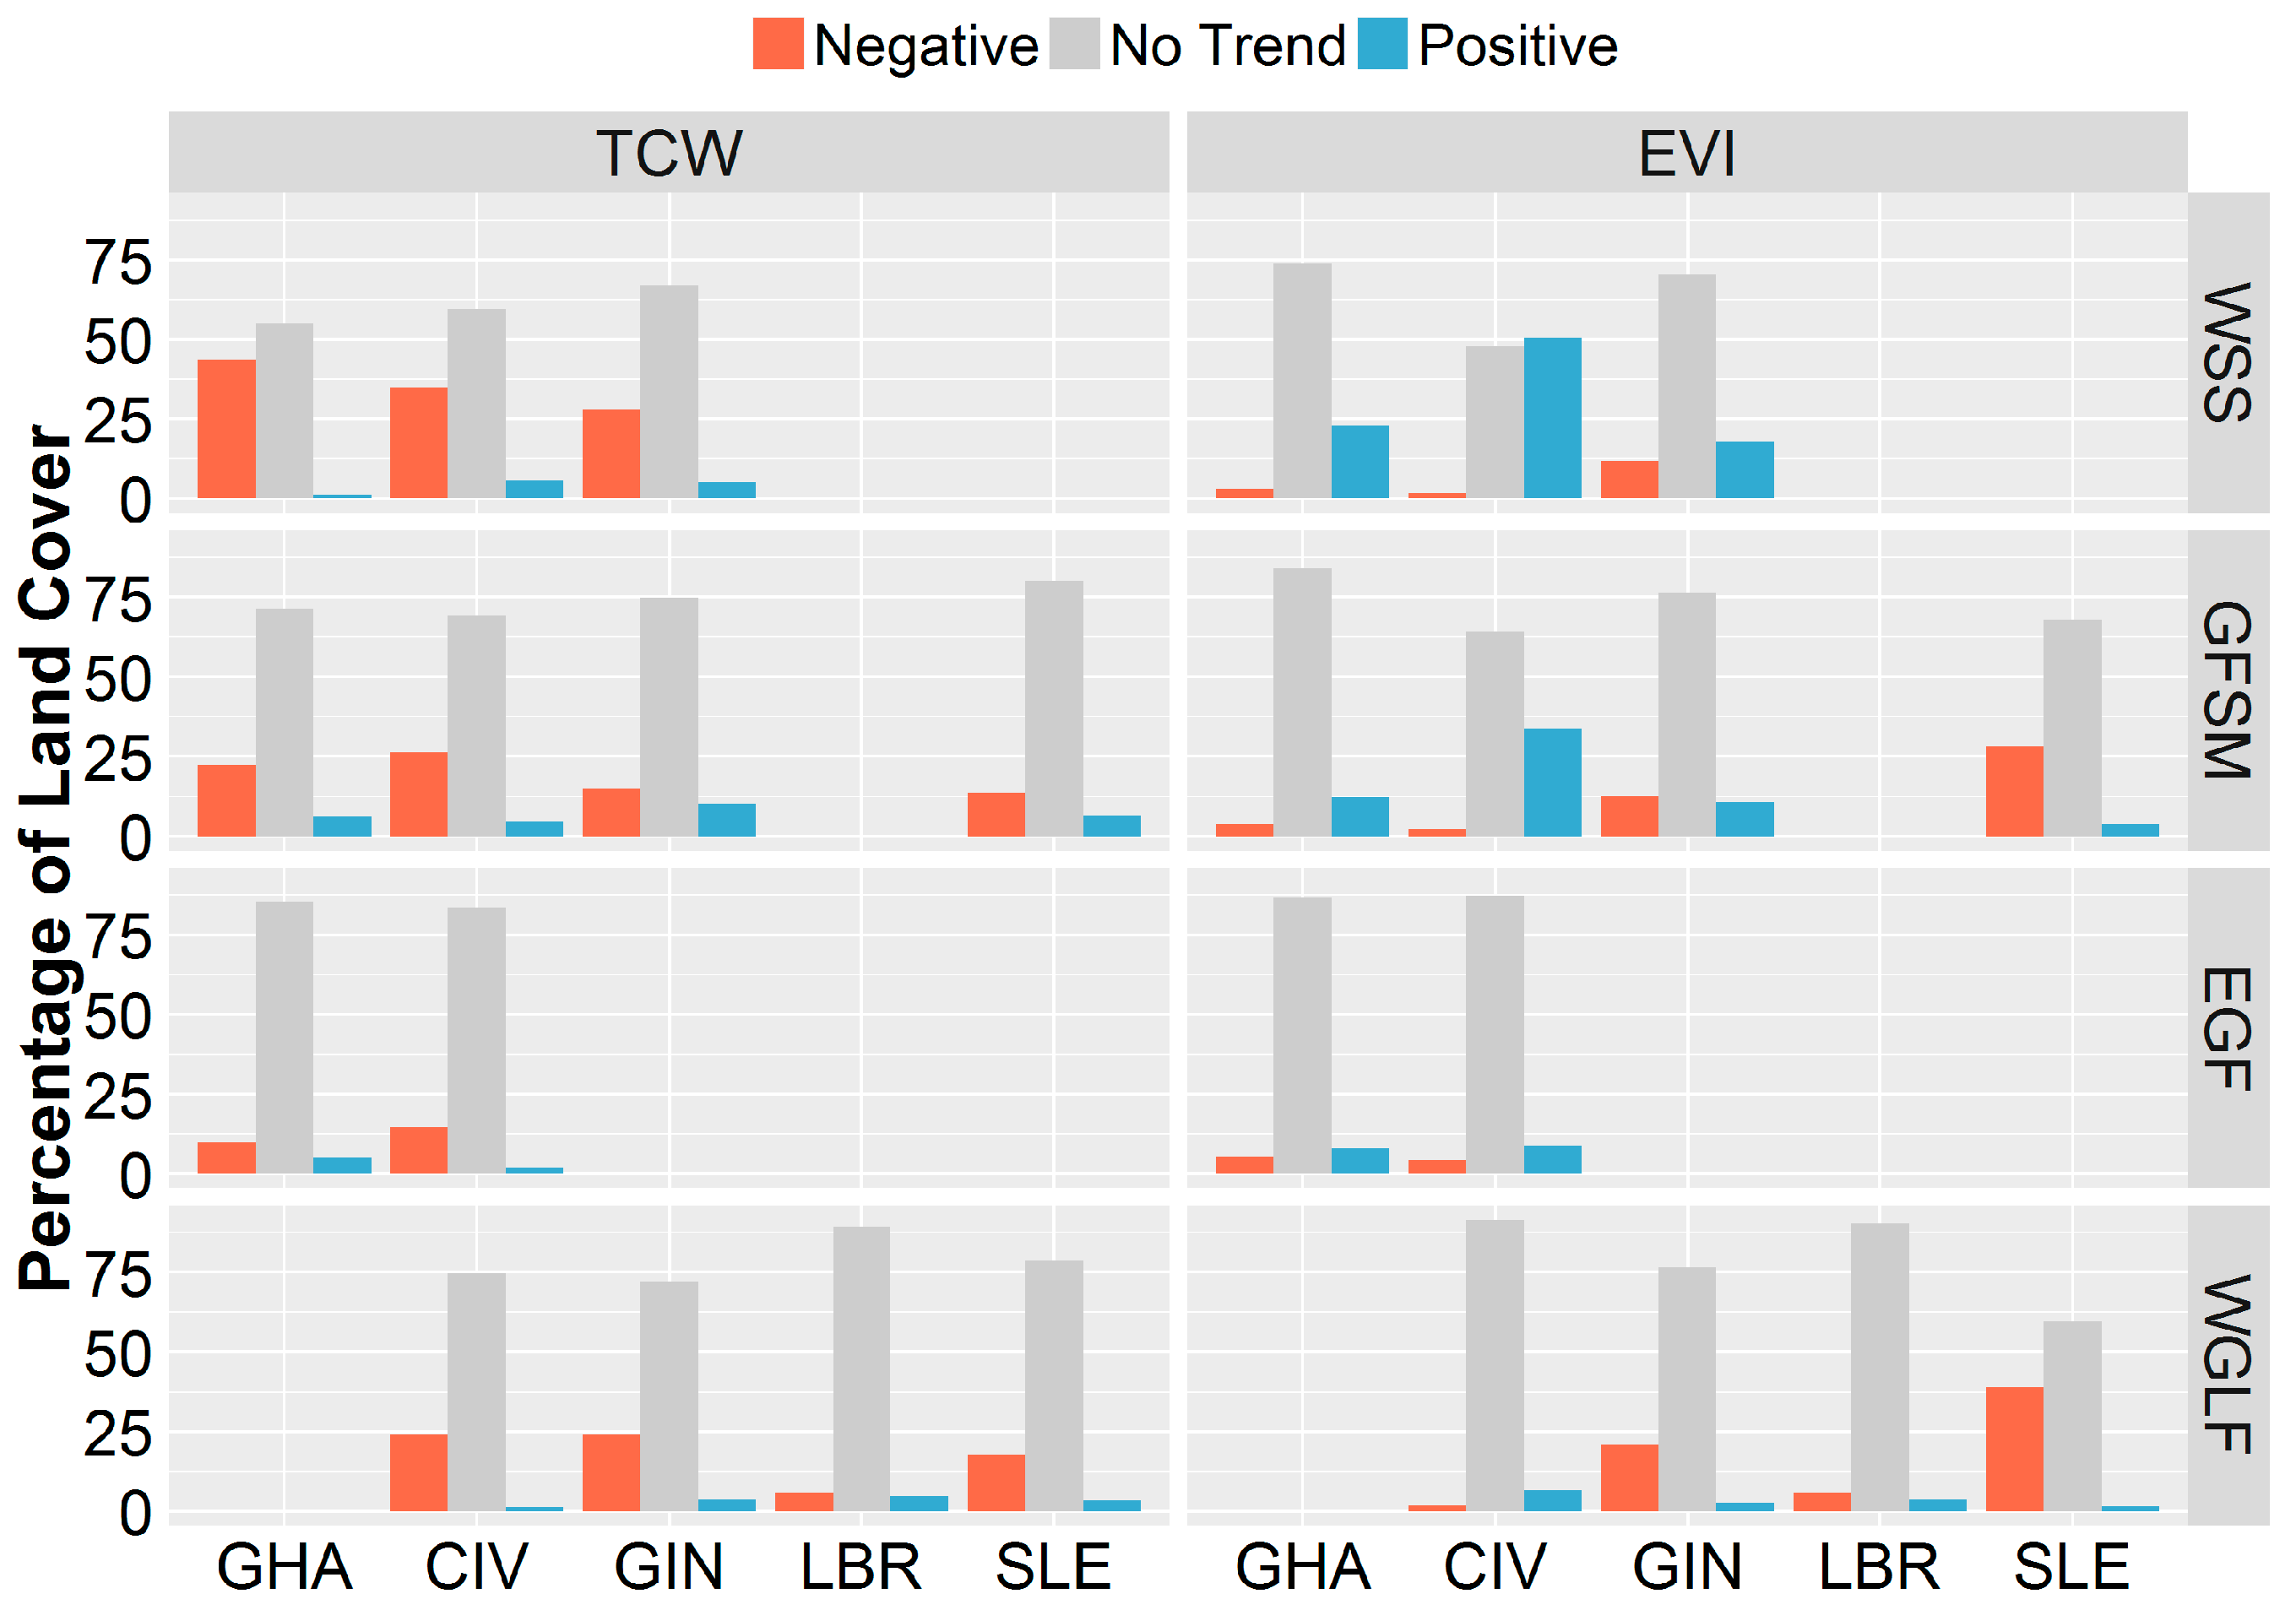
3.3. Spatial Variability of Vegetation Trends

The percentage of area with significant vegetation trends increased from the moister tropical forested ecoregions to the Guinean Forest-Savanna Mosaic and further to the drier West Sudanian Savanna (Figure 5). All of the ecoregions exhibited a larger area of negative than positive TCW trends, and the ratio of negative to positive TCW trends was higher in the West Sudanian Savanna than in the other ecoregions. There was a predominance of positive EVI trends in all ecoregions, except for Western Guinean Lowland Forests where there were more negative than positive EVI trends. There was a smaller percentage of significant negative TCW trends within eco-reserves than outside eco-reserves in all ecoregions except Eastern Guinean Lowland Forests. In contrast, the percentage of significant negative TCW trends within reserves was equal to or greater than in non-protected areas across all ecoregions. Eco-reserves also tended to have lower percentages of both positive and negative EVI trends compared with reserves and non-protected areas in all ecoregions, except Eastern Guinean Lowland Forests. However, these effects were generally weaker than for TCW.
All five countries, with the exception of Liberia, had higher percentages of negative than positive TCW trends (Figure 6). In contrast, the percentages of positive and negative TCW trends in the Western Guinean Lowland Forests in Liberia were nearly equal. In the West Sudanian Savanna and Guinean Forest-Savanna Mosaic ecoregions, Ghana and Côte D’Ivoire had higher ratios of positive to negative EVI trends than the other countries. In contrast, Sierra Leone and the Western Guinean Lowland Forest portion of the country of Guinea were strongly dominated by negative EVI trends.

4. Discussion

In the UGF region of West Africa, the SWIR-based TCW index had the strongest association with woody vegetation cover, whereas greenness indices, such as EVI, had weaker associations with woody vegetation. In tropical forests, drivers of forest degradation, such as selective logging, remove large trees and create canopy gaps, opening growing space for herbaceous understory plants and tree regeneration. The shallow root systems of herbaceous plants and younger trees have less ability to access deep subsurface water and are increasingly susceptible to drought stress over the course of the dry season. As a result, the ability of degraded forests to maintain canopy moisture, photosynthetic activity and evapotranspiration during the dry season are progressively reduced as more trees are lost [34]. This drying of the canopy results in browning of vegetation, which decreases the absorption of leaf pigments, such as chlorophyll a and b in the visible wavelengths [24]. However, given that tropical forests are highly sensitive to water availability and its seasonal changes [39], the patterns of canopy moisture captured by the SWIR-based vegetation indices appear to be more sensitive indicators of variations in forest canopy density than the patterns of chlorophyll abundance measured by greenness indices, which may explain the different geographic patterns of vegetation trends detected by TCW and EVI. This finding is consistent with the results of a study conducted in forest and woodland vegetation types in Sydney Basin Bioregion of Australia [38]. In particular, we found that only the SWIR bands were capable of distinguishing the subtle differences between closed- and open-canopy forests (Figure S4).
Trends in different vegetation indices can exhibit distinctive geographic patterns. Therefore, assessment using multiple indicators provides complementary information about different aspects of vegetation dynamics and facilitates trend interpretation and the attribution of proximal causes [17,64]. For example, a recent study of vegetation trends across Sub-Saharan Africa interpreted positive NDVI trends as evidence that increasing rainfall is driving an expansion of woody vegetation into savanna across much of central and southern Saharan Africa [30]. However, that study excluded West Africa because of concerns that NDVI-based phenology was not a strong indicator of woody vegetation cover in that region. Our analysis of TCW trends indicated that declines in woody coverage were the predominant trends across the UGF region of West Africa, even in the drier Guinean Forest Savanna Mosaic and West Sudanian Savanna ecoregions that were also characterized by widespread trends of increasing greenness as measured by EVI. Such a decline in woody vegetation was also captured between 1990 and 2000 along the West African forest-savanna transition zone [21]. Recent landscape-level studies of land cover and land use change in the forested zone of southwestern Ghana have also documented declining trends in woody vegetation cover, with the largest decreases occurring near the forest-savanna boundary [65,66].
Despite the widespread decline of woody vegetation in many of the drier parts of the study area, remotely-sensed greenness metrics also indicated a prevalence of greening, consistent with re-greening trends found in many other studies of West Africa [15,18,19]. These results suggest that the widespread greening trends in the West Sudanian Savanna and Guinean Forest-Savanna Mosaic ecoregions may be driven by increases of herbaceous cover rather than woody vegetation. This result is contrary to studies in drier parts of the West Sudanian Savanna, such as eastern Mali and Senegal, which have suggested that observed greening trends were primarily due to tree and shrub recovery following the increase of precipitation since the 1990s [18,19]. In contrast, our study area in the wetter savanna and forest regions of West Africa was less affected by the Sahel drought of the 1970s and 1980s and did not experience as much drought-induced mortality. As a result, the patterns of woody vegetation are mainly controlled by disturbances, such as fires, grazing and agriculture [63], rather than moisture availability [67]. Both the tree-growth-fire interaction model of Murphy and Bowman [68] and the analysis of Sankaran et al. [63] indicate that much of our study area falls within the zone of disturbance-determined “unstable” savannas in West Africa. There has been widespread conversion of natural vegetation to croplands across West Africa over the past three decades, and these land use changes were likely a major driver of the observed declines of woody vegetation.
In the wettest part of our study area, the Western Guinean Lowland Forest, negative trends in both EVI and TCW suggested that forest loss and degradation combined resulted in a loss of photosynthetic capacity during the past decade. Because we used the residual trend analysis method, these vegetation trends were independent of antecedent precipitation effects. Several other lines of evidence also support the idea that they were more likely caused by human activity rather than long-term drying or short-term drought as in the Congo and Amazon basins [2,69]. First, forests in the UGF region were found to be more resilient to climate anomalies than other tropical regions because they contain more drought-adapted species [70,71] and may be shifting to greater dominance by these drought-tolerant species [72]. Second, the deforestation rate in this region is known to be among the highest in the African continent due to the high population density [20]. Our analysis also showed that declining TCW and EVI trends in Western Guinean Lowland Forests were less prevalent in Liberia, where rural population densities are lower, than in Guinea and Sierra Leone. Third, the eco-reserves, which were assumed to have the lowest levels of human intervention, had a lower prevalence of negative TCW and EVI trends than other areas with higher levels of human impact. In combination, these observations suggest that the vegetation changes in the West African rainforests have been driven by human land use rather than climate change as has been documented in other tropical forest regions around the globe [2,3].
Fire plays a central role in regulating the UGF region of West Africa, and its interaction with human, climate and vegetation varies along the moisture gradient from savanna to rainforest. For example, frequent fire prevents tree canopy closure and maintains relatively open tree-grass mosaics in the savanna ecoregions study area [63]. In contrast, fire is an important agent of forest degradation and loss in the drier parts of the tropical forest ecoregions [66]. Because humans are the primary sources of ignitions in the region, fire can be a mechanism through which human land use impacts forests. However, the interaction between land use and fire are complex and geographically variable. Fire is widely used for debris clearing and land preparation in the dry forest zones [73], but there is also evidence that expansion of croplands and pasture is fragmenting the landscape and reducing fire activity in the savanna ecoregions [74]. Further research is needed to better understand how fire interacts with climate change, human activities and vegetation in this highly dynamic system.
The designation and management of protected areas (PAs) has been proposed as a key strategy to conserve biodiversity in the tropics [75]. Our findings showed that the effects of protected areas on vegetation dynamics were strongly dependent on the type of PA. In particular, eco-reserves where human influence was generally prohibited or minimal were most effective at reducing the negative trend and increasing the positive trend of woody vegetation. Generally, the eco-reserves have the largest influences on TCW trends, which are more related to woody dominance. Thus, the eco-reserves in the region are buffering the negative influences of forest degradation and loss on biodiversity. On the contrary, the reserves, which are managed mainly for the sustainable production of timber and other natural resources, had relatively minor effects on vegetation trends compared to unprotected areas. Although sustainable logging in these reserves would not necessarily cause widespread degradation, our results suggest that combined pressures from overharvesting, illegal logging, fire encroachment and land use change are having an impact [66,76,77]. The impacts of individual reserves on vegetation trends vary considerably, and the effectiveness of any particular reserve will depend on multiple contextual factors, including the destabilizing effects of armed conflicts, the availability of resources to support effective management and enforcement and disputes with local residents over issues, such as access to natural resources and crop damage and livestock depredation by wildlife.

Uncertainties and Limitations

The ability to observe vegetation trends with optical-infrared remote sensing depends on the number of available clear sky observations and measurement noise. For example, restricting analyses to only the highest quality data (e.g., data quality flagged as zero and one) would decrease the measurement noise, but would result in fewer observations. In contrast, utilizing lower quality observations (e.g., data quality flagged as 0, 1, 2 and 3) would increase the number of available observations, but would introduce more measurement noise into the analysis. For this analysis, we did not find substantial changes in spatial patterns and overall trends of vegetation dynamics using different quality flag criteria. Therefore, we compromised by including data with quality flagged as 0, 1 and 2 to maximize the number of usable observations while eliminating the noisiest data from the analysis.
The measurement noise in tropical regions is largely from clouds and cloud shadows during the rainy season and high aerosol levels from biomass burning during the dry season. Despite significant improvement in cloud detection, many residual clouds may still remain undetected in the MODIS NBAR products in the ITCZ regions. Increasing the accuracy of cloud detection would help to ensure that more bad observations are correctly excluded while all of the good observations are retained. Newer methods for cloud screening and atmospheric correction, such as the multi-angle implementation of atmospheric correction algorithm, have the potential to increase the number of clear sky observations and more effectively screen out cloudy pixels in optical-infrared remote sensing data [3]. Other metrics, such as vegetation optical depth (VOD), which is derived from satellite passive microwave observations and is relatively insensitive to cloud cover and other sources of atmospheric contamination, can provide alternative measurements for monitoring tropical vegetation dynamics, albeit at relatively coarse spatial resolutions [78].
The SWIR-based TCW index was found to strongly correlate with woody cover in the UGF region of West Africa. Although the TCW index has proven to be a useful metric of forest structure in a variety of forest ecosystems (Healey et al., 2005), further testing is needed to determine whether the relationships with woody plant cover that we detected can be extrapolated more broadly across Sub-Saharan Africa and other tropical regions of the globe. Furthermore, because the TC indices require SWIR bands, they have been only developed for SWIR-enabled sensors, such as Landsat and MODIS, and cannot be used with the longer-term AVHRR record. Although the 15 years of MODIS records are still relatively short for trend detection, the next generation of satellite data, for example, NPP (National Polar-orbiting Partnership) VIIRS (Visible Infrared Imaging Radiometer Suite instrument), will build on the heritage of land science data from MODIS and extend the length of the available data record. The Landsat archive, which also offers more than three decades of historical data, is increasingly being used for long-term change detection [79,80,81], although the longer revisit period combined with data gaps continue to present challenges in many of the wettest and cloudiest tropical regions.

5. Conclusions

In the UGF region of West Africa, SWIR-based vegetation moisture indices were strongly (AUC = 0.86) associated with woody vegetation cover, whereas red/NIR-based vegetation greenness indices had weaker (AUC = 0.70) associations with woody vegetation. Using multiple indicators therefore provided complementary information about vegetation dynamics that contributed to trend interpretation and the attribution of proximate causes. In particular, our findings confirmed that greenness trends are not a reliable indicator of changes in woody vegetation cover in the wetter regions of West Africa dominated by forests, cropland mosaics and woody savanna. Instead, the combination of increasing EVI trends and decreasing TCW trends across nearly 40% of our study area indicated that the dominance and vigor of herbaceous vegetation was likely increasing in areas where woody vegetation was declining. In contrast, decreasing trends of both EVI and TCW in the wettest tropical rainforest regions indicated that declines in forest cover were resulting in a loss of photosynthetic capacity. Multiple lines of evidence suggested that human land use, rather than climate trends or anomalies, was the predominant driver of these vegetation changes across the region. Protected areas managed for limited or no human intervention were effective at buffering human impacts on vegetation change, whereas protected areas managed for natural resource extraction were not. In the future, the interaction of these human impacts with increasing temperatures and potentially lower rainfall will likely increase the vulnerability of West African tropical forest and woody savanna to further loss and degradation.

Supplementary Materials

The following are available online at www.mdpi.com/2072-4292/9/1/5/s1: Figure S1. Spatial patterns of correlation coefficient between TCW (upper) and EVI (lower) and three-month antecedent cumulative precipitations at a lag of two months before the start of the dry season. Figure S2. Numbers of observation used to calculate Mann–Kendall trend analysis for each MODIS pixel. Figure S3. Dominant trend for the raw vegetation indices (without controlling for the effects of precipitation). Figure S4. Mean and standard deviations of MODIS spectral reflectance at ground validation points with different levels of woody vegetation cover within the Eastern Guinean forests and Western Guinean lowland forests. NIR and SWIR represent near-infrared and short wavelength infrared, respectively. Band wavelengths are blue (459– 479 nm), green (545–565 nm), red (620–670 nm), NIR1 (841–876 nm), NIR2 (1230–1250 nm), SWIR1 (1628–1652 nm) and SWIR2 (2105–2155 nm).

Acknowledgments

This work was supported by the USDA Forest Service Southern Research Station (14-CA-11330136-015) and by a NASA SERVIR Applied Sciences Team grant (NNX16AN22G). SERVIR is a joint venture between NASA and the U.S. Agency for International Development.

Author Contributions

Zhihua Liu and Michael Wimberly conceived of and designed the experiments. Zhihua Liu processed and analyzed the data. Zhihua Liu, Michael Wimberly and Francis Dwomoh wrote the paper.

Conflicts of Interest

The authors declare no conflict of interest.

References

  1. Bonan, G.B. Forests and climate change: Forcings, feedbacks, and the climate benefits of forests. Science 2008, 320, 1444–1449. [Google Scholar] [CrossRef] [PubMed]
  2. Zhou, L.; Tian, Y.; Myneni, R.B.; Ciais, P.; Saatchi, S.; Liu, Y.Y.; Piao, S.; Chen, H.; Vermote, E.F.; Song, C.; et al. Widespread decline of Congo rainforest greenness in the past decade. Nature 2014, 509, 86–90. [Google Scholar] [CrossRef] [PubMed]
  3. Hilker, T.; Lyapustin, A.I.; Tucker, C.J.; Hall, F.G.; Myneni, R.B.; Wang, Y.; Bi, J.; Mendes de Moura, Y.; Sellers, P.J. Vegetation dynamics and rainfall sensitivity of the amazon. Proc. Natl. Acad. Sci. USA 2014, 111, 16041–16046. [Google Scholar] [CrossRef] [PubMed]
  4. Phillips, O.L.; Aragão, L.E.; Lewis, S.L.; Fisher, J.B.; Lloyd, J.; López-González, G.; Malhi, Y.; Monteagudo, A.; Peacock, J.; Quesada, C.A. Drought sensitivity of the Amazon Rainforest. Science 2009, 323, 1344–1347. [Google Scholar] [CrossRef] [PubMed] [Green Version]
  5. Huete, A.R.; Restrepo-Coupe, N.; Ratana, P.; Didan, K.; Saleska, S.R.; Ichii, K.; Panuthai, S.; Gamo, M. Multiple site tower flux and remote sensing comparisons of tropical forest dynamics in monsoon Asia. Agric. For. Meteorol. 2008, 148, 748–760. [Google Scholar] [CrossRef]
  6. Achard, F.; Beuchle, R.; Mayaux, P.; Stibig, H.-J.; Bodart, C.; Brink, A.; Carboni, S.; Desclee, B.; Donnay, F.; Eva, H.D.; et al. Determination of tropical deforestation rates and related carbon losses from 1990 to 2010. Glob. Chang. Biol. 2014, 20, 2540–2554. [Google Scholar] [CrossRef] [PubMed]
  7. Hansen, M.C.; Potapov, P.V.; Moore, R.; Hancher, M.; Turubanova, S.A.; Tyukavina, A.; Thau, D.; Stehman, S.V.; Goetz, S.J.; Loveland, T.R.; et al. High-resolution global maps of 21st-century forest cover change. Science 2013, 342, 850–853. [Google Scholar] [CrossRef] [PubMed]
  8. Lewis, S.L.; Edwards, D.P.; Galbraith, D. Increasing human dominance of tropical forests. Science 2015, 349, 827–832. [Google Scholar] [CrossRef] [PubMed]
  9. Fu, R. Global warming-accelerated drying in the tropics. Proc. Natl. Acad. Sci. USA 2015, 112, 3593–3594. [Google Scholar] [CrossRef] [PubMed]
  10. Pachauri, R.K.; Allen, M.; Barros, V.; Broome, J.; Cramer, W.; Christ, R.; Church, J.; Clarke, L.; Dahe, Q.; Dasgupta, P.; et al. Climate Change 2014: Synthesis Report. CONTRIBUTION of Working Groups I, II and III to the Fifth Assessment Report of the Intergovernmental Panel on Climate Change; IPCC: Geneva, Switzerland, 2014. [Google Scholar]
  11. Peel, M.C.; Finlayson, B.L.; McMahon, T.A. Updated world map of the köppen-geiger climate classification. Hydrol. Earth Syst. Sci. Discuss. 2007, 4, 439–473. [Google Scholar] [CrossRef]
  12. Malhi, Y.; Aragão, L.E.O.C.; Galbraith, D.; Huntingford, C.; Fisher, R.; Zelazowski, P.; Sitch, S.; McSweeney, C.; Meir, P. Exploring the likelihood and mechanism of a climate-change-induced dieback of the Amazon Rainforest. Proc. Natl. Acad. Sci. USA 2009, 106, 20610–20615. [Google Scholar] [CrossRef] [PubMed]
  13. Hulme, M.; Doherty, R.; Ngara, T.; New, M.; Lister, D. African climate change: 1900–2100. Clim. Res. 2001, 17, 145–168. [Google Scholar] [CrossRef]
  14. Knauer, K.; Gessner, U.; Dech, S.; Kuenzer, C. Remote sensing of vegetation dynamics in West Africa. Int. J. Remote Sens. 2014, 35, 6357–6396. [Google Scholar] [CrossRef]
  15. Herrmann, S.M.; Anyamba, A.; Tucker, C.J. Recent trends in vegetation dynamics in the African Sahel and their relationship to climate. Glob. Environ. Chang. 2005, 15, 394–404. [Google Scholar] [CrossRef]
  16. Dardel, C.; Kergoat, L.; Hiernaux, P.; Mougin, E.; Grippa, M.; Tucker, C.J. Re-greening Sahel: 30 years of remote sensing data and field observations (Mali, Niger). Remote Sens. Environ. 2014, 140, 350–364. [Google Scholar] [CrossRef]
  17. Andela, N.; Liu, Y.; van Dijk, A.; de Jeu, R.; McVicar, T. Global changes in dryland vegetation dynamics (1988–2008) assessed by satellite remote sensing: Comparing a new passive microwave vegetation density record with reflective greenness data. Biogeosciences 2013, 10, 6657–6676. [Google Scholar] [CrossRef] [Green Version]
  18. Brandt, M.; Mbow, C.; Diouf, A.A.; Verger, A.; Samimi, C.; Fensholt, R. Ground and satellite-based evidence of the biophysical mechanisms behind the greening sahel. Global Change Biol. 2015, 21, 1610–1620. [Google Scholar] [CrossRef] [PubMed]
  19. Kaptué, A.T.; Prihodko, L.; Hanan, N.P. On regreening and degradation in sahelian watersheds. Proc. Natl. Acad. Sci. USA 2015, 112, 12133–12138. [Google Scholar] [CrossRef] [PubMed]
  20. Mayaux, P.; Pekel, J.F.; Desclée, B.; Donnay, F.; Lupi, A.; Achard, F.; Clerici, M.; Bodart, C.; Brink, A.; Nasi, R. State and evolution of the African rainforests between 1990 and 2010. Philos. Trans. R. Soc. Biol. Sci. 2013. [Google Scholar] [CrossRef] [PubMed] [Green Version]
  21. Bodart, C.; Brink, A.B.; Donnay, F.; Lupi, A.; Mayaux, P.; Achard, F. Continental estimates of forest cover and forest cover changes in the dry ecosystems of Africa between 1990 and 2000. J. Biogeogr. 2013, 40, 1036–1047. [Google Scholar] [CrossRef] [PubMed]
  22. Mbow, C.; Brandt, M.; Ouedraogo, I.; de Leeuw, J.; Marshall, M. What four decades of earth observation tell us about land degradation in the sahel? Remote Sens. 2015, 7, 4048–4067. [Google Scholar] [CrossRef]
  23. Karlson, M.; Ostwald, M. Remote sensing of vegetation in the Sudano-Sahelian zone: A literature review from 1975 to 2014. J. Arid Environ. 2016, 124, 257–269. [Google Scholar] [CrossRef]
  24. Ollinger, S.V. Sources of variability in canopy reflectance and the convergent properties of plants. New Phytol. 2011, 189, 375–394. [Google Scholar] [CrossRef] [PubMed]
  25. Anyamba, A.; Tucker, C.J. Analysis of sahelian vegetation dynamics using NOAA-AVHRR NDVI data from 1981–2003. J. Arid Environ. 2005, 63, 596–614. [Google Scholar] [CrossRef]
  26. Lu, H.; Raupach, M.R.; McVicar, T.R.; Barrett, D.J. Decomposition of vegetation cover into woody and herbaceous components using AVHRR NDVI time series. Remote Sens. Environ. 2003, 86, 1–18. [Google Scholar] [CrossRef]
  27. Brandt, M.; Hiernaux, P.; Tagesson, T.; Verger, A.; Rasmussen, K.; Diouf, A.A.; Mbow, C.; Mougin, E.; Fensholt, R. Woody plant cover estimation in drylands from earth observation based seasonal metrics. Remote Sens. Environ. 2016, 172, 28–38. [Google Scholar] [CrossRef]
  28. Mitchard, E.T.A.; Saatchi, S.S.; Gerard, F.F.; Lewis, S.L.; Meir, P. Measuring woody encroachment along a forest-savanna boundary in central Africa. Earth Interact. 2009. [Google Scholar] [CrossRef]
  29. Saha, M.; Scanlon, T.; D’Odorico, P. Examining the linkage between shrub encroachment and recent greening in water-limited southern Africa. Ecosphere 2015. [Google Scholar] [CrossRef]
  30. Mitchard, E.T.A.; Flintrop, C.M. Woody encroachment and forest degradation in Sub-Saharan Africa’s woodlands and savannas 1982–2006. Philos. Trans. R. Soc. Biol. Sci. 2013. [Google Scholar] [CrossRef] [PubMed] [Green Version]
  31. Anderson, L.O.; Malhi, Y.; Aragao, L.E.O.C.; Ladle, R.; Arai, E.; Barbier, N.; Phillips, O. Remote sensing detection of droughts in Amazonian Forest Canopies. New Phytol. 2010, 187, 733–750. [Google Scholar] [CrossRef] [PubMed]
  32. Gómez, C.; White, J.C.; Wulder, M.A. Characterizing the state and processes of change in a dynamic forest environment using hierarchical spatio-temporal segmentation. Remote Sens. Environ. 2011, 115, 1665–1679. [Google Scholar] [CrossRef]
  33. Jin, S.; Sader, S.A. Comparison of time series tasseled cap wetness and the normalized difference moisture index in detecting forest disturbances. Remote Sens. Environ. 2005, 94, 364–372. [Google Scholar] [CrossRef]
  34. Koltunov, A.; Ustin, S.L.; Asner, G.P.; Fung, I. Selective logging changes forest phenology in the Brazilian Amazon: Evidence from modis image time series analysis. Remote Sens. Environ. 2009, 113, 2431–2440. [Google Scholar] [CrossRef]
  35. Rufin, P.; Müller, H.; Pflugmacher, D.; Hostert, P. Land use intensity trajectories on amazonian pastures derived from Landsat time series. Int. J. Appl. Earth Obs. Geoinf. 2015, 41, 1–10. [Google Scholar] [CrossRef]
  36. Karlson, M.; Ostwald, M.; Reese, H.; Sanou, J.; Tankoano, B.; Mattsson, E. Mapping tree canopy cover and aboveground biomass in Sudano-Sahelian woodlands using Landsat 8 and random forest. Remote Sens. 2015, 7, 10017–10041. [Google Scholar] [CrossRef]
  37. Kergoat, L.; Hiernaux, P.; Dardel, C.; Pierre, C.; Guichard, F.; Kalilou, A. Dry-season vegetation mass and cover fraction from SWIR1.6 and SWIR2.1 band ratio: Ground-radiometer and MODIS data in the sahel. Int. J. Appl. Earth Obs. Geoinf. 2015, 39, 56–64. [Google Scholar] [CrossRef]
  38. Caccamo, G.; Chisholm, L.A.; Bradstock, R.A.; Puotinen, M.L. Assessing the sensitivity of MODIS to monitor drought in high biomass ecosystems. Remote Sens. Environ. 2011, 115, 2626–2639. [Google Scholar] [CrossRef]
  39. Zelazowski, P.; Malhi, Y.; Huntingford, C.; Sitch, S.; Fisher, J.B. Changes in the potential distribution of humid tropical forests on a warmer planet. Philos. Trans. R. Soc. Lond. A Math. Phys. Eng. Sci. 2011, 369, 137–160. [Google Scholar] [CrossRef] [PubMed]
  40. Le Barbé, L.; Lebel, T.; Tapsoba, D. Rainfall variability in West Africa during the years 1950–90. J. Clim. 2002, 15, 187–202. [Google Scholar] [CrossRef]
  41. Liebmann, B.; Bladé, I.; Kiladis, G.N.; Carvalho, L.M.; Senay, G.B.; Allured, D.; Leroux, S.; Funk, C. Seasonality of african precipitation from 1996 to 2009. J. Clim. 2012, 25, 4304–4322. [Google Scholar] [CrossRef]
  42. Poorter, L.; Bongers, F.; Kouame, F.; Hawthorne, W. Biodiversity of West African Forests: An Ecological Atlas of Woody Plant Species; CABI: Wallingford, UK, 2004. [Google Scholar]
  43. Hilker, T.; Lyapustin, A.I.; Hall, F.G.; Myneni, R.; Knyazikhin, Y.; Wang, Y.; Tucker, C.J.; Sellers, P.J. On the measurability of change in amazon vegetation from MODIS. Remote Sens. Environ. 2015, 166, 233–242. [Google Scholar] [CrossRef]
  44. Huete, A.; Didan, K.; Miura, T.; Rodriguez, E.P.; Gao, X.; Ferreira, L.G. Overview of the radiometric and biophysical performance of the MODIS vegetation indices. Remote Sens. Environ. 2002, 83, 195–213. [Google Scholar] [CrossRef]
  45. Friedl, M.; Muchoney, D.; McIver, D.; Gao, F.; Hodges, J.; Strahler, A. Characterization of North American land cover from NOAA-AVHRR data using the EOS MODS land cover classification algorithm. Geophys. Res. Lett. 2000, 27, 977–980. [Google Scholar] [CrossRef]
  46. Wang, Z.; Schaaf, C.B.; Strahler, A.H.; Chopping, M.J.; Román, M.O.; Shuai, Y.; Woodcock, C.E.; Hollinger, D.Y.; Fitzjarrald, D.R. Evaluation of MODIS albedo product (MCD43A) over grassland, agriculture and forest surface types during dormant and snow-covered periods. Remote Sens. Environ. 2014, 140, 60–77. [Google Scholar] [CrossRef]
  47. Wang, Z.; Schaaf, C.B.; Chopping, M.J.; Strahler, A.H.; Wang, J.; Román, M.O.; Rocha, A.V.; Woodcock, C.E.; Shuai, Y. Evaluation of moderate-resolution imaging spectroradiometer (MODIS) snow albedo product (MCD43A) over tundra. Remote Sens. Environ. 2012, 117, 264–280. [Google Scholar] [CrossRef]
  48. Schaaf, C.B.; Gao, F.; Strahler, A.H.; Lucht, W.; Li, X.; Tsang, T.; Strugnell, N.C.; Zhang, X.; Jin, Y.; Muller, J.-P. First operational BRDF, albedo nadir reflectance products from MODIS. Remote Sens. Environ. 2002, 83, 135–148. [Google Scholar] [CrossRef]
  49. Guan, K.; Pan, M.; Li, H.; Wolf, A.; Wu, J.; Medvigy, D.; Caylor, K.K.; Sheffield, J.; Wood, E.F.; Malhi, Y.; et al. Photosynthetic seasonality of global tropical forests constrained by hydroclimate. Nat. Geosci. 2015, 8, 284–289. [Google Scholar] [CrossRef]
  50. Jiang, Z.; Huete, A.R.; Didan, K.; Miura, T. Development of a two-band enhanced vegetation index without a blue band. Remote Sens. Environ. 2008, 112, 3833–3845. [Google Scholar] [CrossRef]
  51. Gao, B. NDWI—A normalized difference water index for remote sensing of vegetation liquid water from space. Remote Sens. Environ. 1996, 58, 257–266. [Google Scholar] [CrossRef]
  52. Cohen, W.B.; Goward, S.N. Landsat’s role in ecological applications of remote sensing. Bioscience 2004, 54, 535–545. [Google Scholar] [CrossRef]
  53. Lobser, S.; Cohen, W. MODIS tasselled cap: Land cover characteristics expressed through transformed MODIS data. Int. J. Remote Sens. 2007, 28, 5079–5101. [Google Scholar] [CrossRef]
  54. Price, K.; Jakubauskas, M. Spectral retrogression and insect damage in lodgepole pine successional forests. Int. J. Remote Sens. 1998, 19, 1627–1632. [Google Scholar] [CrossRef]
  55. Ahmed, O.S.; Franklin, S.E.; Wulder, M.A. Interpretation of forest disturbance using a time series of Landsat imagery and canopy structure from airborne LiDAR. Can. J. Remote Sens. 2014, 39, 521–542. [Google Scholar] [CrossRef]
  56. Hand, D.J.; Till, R.J. A simple generalisation of the area under the ROC curve for multiple class classification problems. Mach. Learn. 2001, 45, 171–186. [Google Scholar] [CrossRef]
  57. Swets, J.A. Measuring the accuracy of diagnostic systems. Science 1988, 240, 1285–1293. [Google Scholar] [CrossRef] [PubMed]
  58. Robin, X.; Turck, N.; Hainard, A.; Tiberti, N.; Lisacek, F.; Sanchez, J.-C.; Müller, M. pROC: An open-source package for R and S+ to analyze and compare roc curves. BMC Bioinform. 2011. [Google Scholar] [CrossRef] [PubMed]
  59. Evans, J.; Geerken, R. Discrimination between climate and human-induced dryland degradation. J. Arid Environ. 2004, 57, 535–554. [Google Scholar] [CrossRef]
  60. De Wasseige, C.; Bastin, D.; Defourny, P. Seasonal variation of tropical forest LAI based on field measurements in Central African Republic. Agric. For. Meteorol. 2003, 119, 181–194. [Google Scholar] [CrossRef]
  61. Yue, S.; Pilon, P.; Cavadias, G. Power of the mann-kendall and spearman’s rho tests for detecting monotonic trends in hydrological series. J. Hydrol. 2002, 259, 254–271. [Google Scholar] [CrossRef]
  62. Olson, D.M.; Dinerstein, E.; Wikramanayake, E.D.; Burgess, N.D.; Powell, G.V.; Underwood, E.C.; D’amico, J.A.; Itoua, I.; Strand, H.E.; Morrison, J.C. Terrestrial ecoregions of the world: A new map of life on earth a new global map of terrestrial ecoregions provides an innovative tool for conserving biodiversity. Bioscience 2001, 51, 933–938. [Google Scholar] [CrossRef]
  63. Sankaran, M.; Hanan, N.P.; Scholes, R.J.; Ratnam, J.; Augustine, D.J.; Cade, B.S.; Gignoux, J.; Higgins, S.I.; Le Roux, X.; Ludwig, F.; et al. Determinants of woody cover in African Savannas. Nature 2005, 438, 846–849. [Google Scholar] [CrossRef] [PubMed]
  64. De Beurs, K.M.; Henebry, G.M.; Owsley, B.C.; Sokolik, I. Using multiple remote sensing perspectives to identify and attribute land surface dynamics in central Asia 2001–2013. Remote Sens. Environ. 2015, 170, 48–61. [Google Scholar] [CrossRef]
  65. Alo, C.A.; Pontius, R.G. Identifying systematic land-cover transitions using remote sensing and GIS: The fate of forests inside and outside protected areas of southwestern Ghana. Environ. Plan. B 2008, 35, 280–295. [Google Scholar] [CrossRef]
  66. Dwomoh, F.K.; Wimberly, M.C. Fire regimes and forest resilience: Alternative stable states in the West African tropics. Landsc. Ecol. 2016. under review. [Google Scholar]
  67. Nemani, R.R.; Keeling, C.D.; Hashimoto, H.; Jolly, W.M.; Piper, S.C.; Tucker, C.J.; Myneni, R.B.; Running, S.W. Climate-driven increases in global terrestrial net primary production from 1982 to 1999. Science 2003, 300, 1560–1563. [Google Scholar] [CrossRef] [PubMed]
  68. Murphy, B.P.; Bowman, D.M.J.S. What controls the distribution of tropical forest and savanna? Ecol. Lett. 2012, 15, 748–758. [Google Scholar] [CrossRef] [PubMed]
  69. Xu, L.; Samanta, A.; Costa, M.H.; Ganguly, S.; Nemani, R.R.; Myneni, R.B. Widespread decline in greenness of amazonian vegetation due to the 2010 drought. Geophys. Res. Lett. 2011. [Google Scholar] [CrossRef]
  70. Asefi-Najafabady, S.; Saatchi, S. Response of African humid tropical forests to recent rainfall anomalies. Philos. Trans. R. Soc. Biol. Sci. 2013. [Google Scholar] [CrossRef] [PubMed]
  71. Malhi, Y.; Adu-Bredu, S.; Asare, R.A.; Lewis, S.L.; Mayaux, P. African rainforests: Past, present and future. Philos. Trans. R. Soc. Biol. Sci. 2013. [Google Scholar] [CrossRef] [PubMed] [Green Version]
  72. Fauset, S.; Baker, T.R.; Lewis, S.L.; Feldpausch, T.R.; Affum-Baffoe, K.; Foli, E.G.; Hamer, K.C.; Swaine, M.D. Drought-induced shifts in the floristic and functional composition of tropical forests in Ghana. Ecol. Lett. 2012, 15, 1120–1129. [Google Scholar] [CrossRef] [PubMed]
  73. Amissah, L.; Kyereh, B.; Agyeman, V. Wildfires as dominant force driving farming systems in the forest transition zone of Ghana. Ghana J. For. 2011, 27, 52–65. [Google Scholar]
  74. Grégoire, J.-M.; Simonetti, D. Interannual changes of fire activity in the protected areas of the sun network and other parks and reserves of the west and central Africa region derived from MODIS observations. Remote Sens. 2010, 2, 446–463. [Google Scholar] [CrossRef]
  75. Gaston, K.J.; Jackson, S.F.; Cantú-Salazar, L.; Cruz-Piñón, G. The ecological performance of protected areas. Annu. Rev. Ecol. Evolut. Syst. 2008, 39, 93–113. [Google Scholar] [CrossRef]
  76. Hawthorne, W.D.; Sheil, D.; Agyeman, V.K.; Abu Juam, M.; Marshall, C.A.M. Logging scars in Ghanaian high forest: Towards improved models for sustainable production. For. Ecol. Manag. 2012, 271, 27–36. [Google Scholar] [CrossRef]
  77. Arcilla, N.; Holbech, L.H.; O’Donnell, S. Severe declines of understory birds follow illegal logging in Upper Guinea Forests of Ghana, West Africa. Biol. Conserv. 2015, 188, 41–49. [Google Scholar] [CrossRef]
  78. Tian, F.; Brandt, M.; Liu, Y.Y.; Verger, A.; Tagesson, T.; Diouf, A.A.; Rasmussen, K.; Mbow, C.; Wang, Y.; Fensholt, R. Remote sensing of vegetation dynamics in drylands: Evaluating vegetation optical depth (VOD) using AVHRR NDVI and in situ green biomass data over west African sahel. Remote Sens. Environ. 2016, 177, 265–276. [Google Scholar] [CrossRef]
  79. Kennedy, R.E.; Yang, Z.; Cohen, W.B. Detecting trends in forest disturbance and recovery using yearly landsat time series: 1. Landtrendr—Temporal segmentation algorithms. Remote Sens. Environ. 2010, 114, 2897–2910. [Google Scholar] [CrossRef]
  80. Huang, C.; Goward, S.N.; Masek, J.G.; Thomas, N.; Zhu, Z.; Vogelmann, J.E. An automated approach for reconstructing recent forest disturbance history using dense Landsat time series stacks. Remote Sens. Environ. 2010, 114, 183–198. [Google Scholar] [CrossRef]
  81. Zhu, Z.; Woodcock, C.E. Continuous change detection and classification of land cover using all available Landsat data. Remote Sens. Environ. 2014, 144, 152–171. [Google Scholar] [CrossRef]
Figure 1. Study area, overlaid with World Wide Fund (WWF) terrestrial ecoregions and ground validation points. The land cover was based on the 0.5-km MODIS-based Global Land Cover Climatology (2001–2010) using the IGBP classification. The study area mainly consisted of tropical forests, woody savannas, savannas and cropland/natural vegetation mosaics.
Remotesensing 09 00005 g001
Figure 2. Examples of high resolution Google Earth images for each level of woody dominance.
Remotesensing 09 00005 g002
Figure 3. Boxplots of the selected vegetation indices for different classes of woody dominance in the Upper Guinean Forest region of West Africa.
Remotesensing 09 00005 g003
Figure 4. Residual trends for vegetation indices, after controlling for the effect of precipitation.
Remotesensing 09 00005 g004
Figure 5. Summary of trend analysis results for different levels of protection status, stratified by WWF terrestrial ecoregions. Abbreviations are: R: reserve; ER: eco-reserve; NP: non-protected; ALL: ALL = R + ER + NP; WSS: West Sudanian Savanna; GFSM: Guinean Forest-Savanna Mosaic; EGF: Eastern Guinean Forest; WGLF: Western Guinean Lowland Forests.
Remotesensing 09 00005 g005
Figure 6. Summary of trend analysis results within different countries, stratified by WWF ecoregions. Abbreviations are: CIV: Côte d’Ivoire; GHA: Ghana; GIN: Guinea; LBR: Liberia; SLE: Sierra Leone; WSS: West Sudanian Savanna; GFSM: Guinean Forest-Savanna Mosaic; EGF: Eastern Guinean Forest; WGLF: Western Guinean Lowland Forests.
Remotesensing 09 00005 g006
Table 1. Number of ground validation points used to examine the relationships between vegetation indices and different levels of woody dominance.
ClassesForest 1Guinean Forest-Savanna MosaicWest Sudanian SavannaTotal
Dense837414171
Open717526172
Sparse647231167
Total21822171510
1 Forest includes Eastern Guinean forests and Western Guinean Lowland Forests.
Table 2. Area under the receiver operating characteristic curve (AUC) for vegetation indices in relation to classes of woody vegetation cover.
Dense vs. OpenDense vs. SparseOpen vs. SparseMulticlass AUC
EVI0.640.800.670.70
NDWI0.700.880.720.76
TCA0.710.890.710.77
TCB0.700.810.670.73
TCG0.660.820.670.72
TCW0.860.980.820.89

