Next Article in Journal
Estimating Savanna Clumping Index Using Hemispherical Photographs Integrated with High Resolution Remote Sensing Images
Previous Article in Journal
Forward Scatter Radar for Air Surveillance: Characterizing the Target-Receiver Transition from Far-Field to Near-Field Regions
 
 
Correction published on 29 March 2017, see Remote Sens. 2017, 9(4), 321.
Article

NIR-Red Spectra-Based Disaggregation of SMAP Soil Moisture to 250 m Resolution Based on OzNet in Southeastern Australia

1
State Key Laboratory of Information Engineering in Surveying, Mapping and Remote Sensing, Wuhan University, Wuhan 430079, China
2
Collaborative Innovation Center of Geospatial Technology, Wuhan University, Wuhan 430079, China
3
Department of Agronomy, Purdue University, West Lafayette, IN 47907, USA
*
Author to whom correspondence should be addressed.
Remote Sens. 2017, 9(1), 51; https://doi.org/10.3390/rs9010051
Submission received: 27 October 2016 / Revised: 12 December 2016 / Accepted: 1 January 2017 / Published: 8 January 2017

Abstract

:
To meet the demand of regional hydrological and agricultural applications, a new method named near infrared-red (NIR-red) spectra-based disaggregation (NRSD) was proposed to perform a disaggregation of Soil Moisture Active Passive (SMAP) products from 36 km to 250 m resolution. The NRSD combined proposed normalized soil moisture index (NSMI) with SMAP data to obtain 250 m resolution soil moisture mapping. This NRSD method was validated with the data from in situ OzNet network in May and September 2015. Results showed that NRSD performed a decent downscaling (root-mean-square error (RMSE) = 0.04 m3/m3 and 0.12 m3/m3 in May and September, respectively). Based on the validation, it was found that the proposed NSMI was a new alternative indicator for denoting the heterogeneity of soil moisture at sub-kilometer scales. Attributed to the excellent performance of the NSMI, NRSD has a higher overall accuracy, finer spatial representation within SMAP pixels and wider applicable scope on usability tests for land cover, vegetation density and drought condition than the disaggregation based on physical and theoretical scale change (DISPATCH) has at 250 m resolution. This revealed that the NRSD method is expected to provide soil moisture mapping at 250-resolution for large-scale hydrological and agricultural studies.

Graphical Abstract

1. Introduction

As a key variable in hydrology, climatology, meteorology and ecology, surface soil moisture plays an important role in both global [1,2] and regional [3,4,5] applications, including numerical weather forecasting [6], climate change prediction [7], agricultural drought warning [8] and flood hazard monitoring [9]. To meet the demand of these applications, soil moisture must be measured with the required accuracy over the desired range of spatial and temporal scales [10].
Currently, soil moisture can be measured mainly by in situ sites, airborne sensors and satellite observation. In situ soil moisture networks (e.g., Soil Climate Analysis Network) have relatively high accuracy with a sufficient temporal resolution, but a sparse spatial distribution [11]. Airborne measurements mainly consist of radiometer and scatterometer [12], both of which can provide regional soil moisture observations with the desired retrieval accuracy, as well as high spatial and temporal resolution, but are difficult to promote globally [13]. Instead, satellite-based retrieval (e.g., AMSR-E, Aquarius, Soil Moisture and Ocean Salinity (SMOS), SMAP, etc.) has the potential capability to measure soil moisture with global coverage, a moderate repeat cycle and middle to high accuracy on diverse surface conditions, but coarse spatial resolution (a few tens to hundreds of kilometers scale) for regional use [14,15,16,17,18]. SMAP soil moisture is competitive among the main satellite-based soil moisture products. Compared with SAR-based products, radiometer-derived soil moisture has better accuracy because it is less sensitive to surface roughness and scattering by vegetation. Additionally, compared with C- and X-band microwave (e.g., AMSR-E and Wind-Sat), L-band (e.g., SMOS, Aquarius and SMAP) has a stronger penetration through cloud and a deeper sensing depth at ~5 cm from the surface skin. Besides, the penetration through vegetation makes the L-band microwave a better choice for higher accuracy. In addition to developing with the heritages of SMOS and Aquarius, SMAP has the first dedicated subsystem to enable the detection and mitigation of radio frequency interference (RFI) [19] and appears to be more aggressive in its applicable scope of the vegetation water content (VWC) than SMOS [15]. However, all of the above measurement technologies partially fulfill the requirements of desired accuracy, global coverage, fine temporal resolution and moderate to high spatial resolution. Therefore, an expected soil moisture product must be provided to meet the demands of regional soil moisture applications, and one alternative solution is the disaggregation of satellite-based soil moisture retrieval, especially SMAP radiometer products.
Over the past decade, numerous studies have attempted to obtain high-resolution soil moisture by downscaling space-borne radiometer-derived soil moisture [20,21,22]. A common aspect of these studies is the use of fine resolution ancillary data to indicate the variance of soil moisture within coarse spatial scales. Regardless of the radar power failure in July 2015, SMAP provided a robust downscaling method by combining L-band surface brightness temperature with synergetic L-band radar backscatter, performing a disaggregation to a resolution of ~9 km or even ~3 km [10,23]. The SMAP downscaling algorithm was further evaluated by using airborne active-passive microwave synergistic observation based on the SMAP Experiment (SMAPEx) field campaign in southeastern Australia, and the experiment demonstrated that the SMAP downscaling method had the potential to meet the accuracy requirement of the SMAP mission [24,25]. In spite of the relatively lower penetration through clouds compared to microwave, optical sensors can provide higher spatial resolution. Merlin et al. combined moderate resolution thermal infrared data with SMOS soil moisture to disaggregate an ~40 km soil moisture product to ~1 km [26,27,28]. The disaggregation is based on physical and theoretical scale change (named DISPATCH) [29] and was validated during a one-year period over four diverse field campaigns [30]. Kim et al. utilized the soil wetness index (SWI) to build a linear relationship between evaporative fraction and surface soil moisture and this thus was used to disaggregate AMSR-E soil moisture at a 1 km resolution [31]. Carlson et al. related land surface temperature (LST) and the normalized difference vegetation index (NDVI) to surface soil moisture, providing a method that accounts for the heterogeneity of soil moisture at sub-kilometer scales [32,33]. These studies mainly utilized the semi-empirical relationship between surface soil evaporation and surface soil moisture, resulting in the limitations of spatial resolution at thermal infrared scales. Few studies have attempted to use higher resolution optical data (visible and NIR spectrum) to perform a more aggressive downscaling, but most hydro-agricultural applications at sub-kilometer resolution scales need to do so.
The NIR-red triangle feature space was first formalized in the 1970s [34,35]. These studies extracted the soil information using soil line and vegetation cover estimated by the NDVI. The soil line was studied to denote the drought condition of land surface and was widely used in developing drought indices [36,37,38]. Therefore, it may be possible to estimate finer resolution surface soil moisture by using NIR-red triangle feature space, the results of which could be utilized as an indicator to account for the heterogeneity of soil moisture within space-borne L-band radiometer footprints.
Regardless of the latent aggressive applications of SMAP soil moisture, few studies have conducted downscaling methods based on SMAP radiometer-derived products. Therefore, for a wider applicable scope and higher disaggregated spatial resolution, a novel disaggregation methodology (to the authors’ knowledge), named NIR-red spectra-based disaggregation (NRSD), was proposed in this paper to conduct a more aggressive downscaling using the normalized soil moisture index (NSMI) as a variance indicator within SMAP pixels. The NSMI is proposed in this paper to utilize the semi-physical relationship between NIR-red triangle feature space and surface soil moisture [34,35], and the downscaling technology is a formalization of SMAP soil moisture with respect to the NSMI using the first-order Taylor series [29]. MODIS 250 m resolution land surface reflectance and SMAP 36 km resolution soil moisture were used as inputs of the NRSD method, and the corresponding output was SMAP disaggregated soil moisture at a 250 m resolution. The NRSD downscaling method was validated in this paper with in situ soil moisture measurements (OzNet network) [13] and was validated in this paper with in situ soil moisture measurements (SMAPEx network) [39]. Finally, to compare NRSD with thermal infrared-based disaggregation, DISPATCH was chosen as an example for its relatively systematic validation work [30]. By conducting two downscaling methods, NRSD was evaluated and compared in detail to analyze its performance and error.

2. Materials and Methods

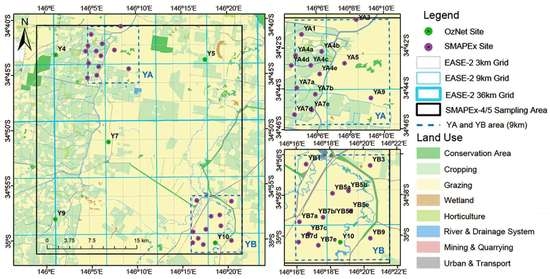
2.1. Study Area and Data Collection

The study was conducted in a 36 × 36 km2 area called Yanco, a semi-arid agricultural land in the Murrumbidgee River catchment, southeastern Australia. The NRSD method was performed both in austral autumn 2015 from 2 May to 21 May, and in the following austral spring from 8 September to 26 September. Figure 1 presents the study area including the location of the in situ soil moisture network. In the background is the land use classification of the Yanco area, from which it can be seen that cropping and grazing are the two dominant land types.
As an input of soil moisture at 36 km resolution, the Version-3 SMAP radiometer-derived soil moisture product was used. This product (released 31 March 2015) can provide L-band passive microwave-sensed soil moisture with ~36 km resolution and relatively high accuracy. SMAP repeats every ~3 days and has a descending node at 6 a.m. local mean solar time. In this study, the descending orbit product was collected as input to the NRSD method because of its better retrieval accuracy than the ascending one. All necessary SMAP data covering Yanco during the validation period are collected (Table 1) and can be downloaded through the NASA Distributed Active Archive Center (DAAC) [41].
As the other input to downscale the 36 km soil moisture product, MODIS datasets were used, which consist of: (1) Version-6 MODIS Terra 250 m surface reflectance product (MOD09GQ). This product contains NIR- and red-band surface reflectance, both of which were used to derive the NSMI. The data quality of each pixel was used to check whether a successful atmospheric correction has been conducted. (2) Version-6 MODIS Terra 1 km land surface temperature (the LST) product (MOD11A1). This product was used to disaggregate SMAP soil moisture using DISPATCH; thus, a comparison was made with the NRSD method. Besides, the data quality of the LST was also used to check the cloud condition of each pixel. Considering the cloud-cover condition, MODIS data were prepared one-day prior to or after the SMAP overpass. Both MODIS datasets above are available at NASA Reverb [42] and the selection of cloud-free images is shown in Table 1.
For the validation of the disaggregated soil moisture, the in situ soil moisture measurements were used. Within the Yanco study area, the OzNet soil moisture network (built by Monash University and the University of Melbourne) provides relatively dense soil moisture monitoring [39], including 24 SDI-12/RS485 soil moisture probes clustered at two 9 × 9 km2 zones, YA and YB (Figure 1). The in situ sites measured at a 0–5 cm depth from the surface top are sampled every 20 minutes and are chosen for validation of the proposed NRSD method. All in situ measurements are provided by the OzNet website [43].

2.2. Assumptions and Applicability Domains of the NRSD Method

For better performance and higher accuracy of the NRSD method, the following considerations should be taken into account:
  • Cloud-free conditions: In contrast with microwave, NIR and red spectra have relatively lower penetration through cloud. A cloud-free condition is recommended in this study, whereas the cloud-cover pixels can also be inputs to the NRSD method with poorer data quality.
  • Precipitation-free conditions from 6:00 a.m. to 10:30 a.m.: The performance of the NRSD method is influenced by the mismatch of SMAP and MODIS overpass times. In this study, 6:00 a.m. SMAP soil moisture and 10:30 a.m. MODIS data were collected; thus, a precipitation-free condition within study area is preferred during the period. It should be noted that although precipitation can influence the performance of NRSD theoretically, it was not considered in this study because ancillary meteorological data were lacking.
  • Relative heterogeneity of soil moisture within SMAP pixels: Low spatial variance of soil moisture results in less effective disaggregation methods because SMAP soil moisture itself can theoretically represent the soil moisture well at 36 km resolution homogeneous scales; thus, disaggregation methods may introduce redundant errors in such a situation.
  • Mismatch of soil moisture sensing depth: The SMAP radiometer has a sensing depth of ~5 cm from the surface due to its strong penetration, whereas the optical sensor measures the surface skin. The NRSD method contains an assumption that soil moisture at the soil skin and at an ~5 cm depth from the top are correlated [27].

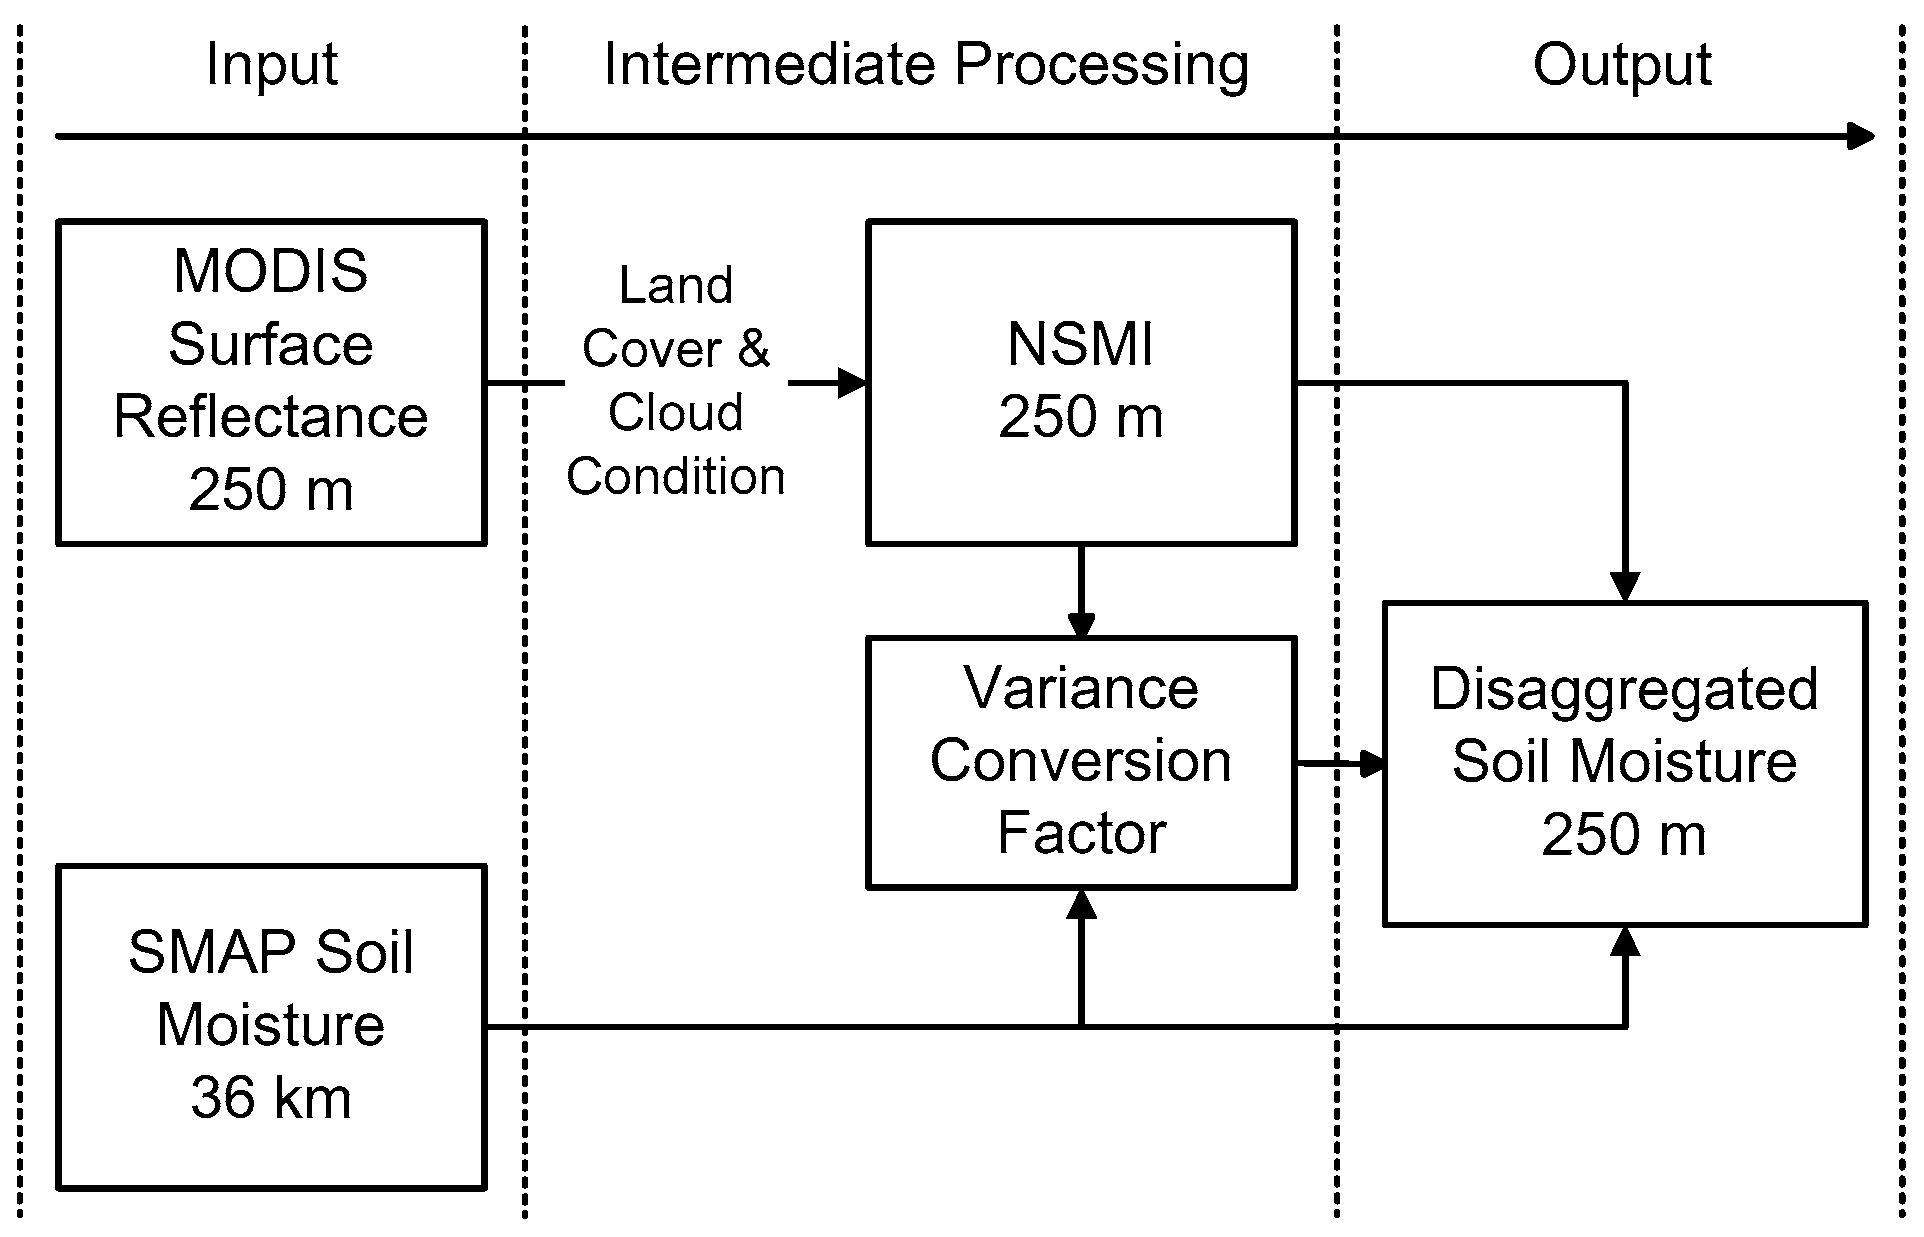
2.3. Flowchart of NRSD

The following steps are used when applying the NRSD method: (1) reprocessing of MODIS data: the MODIS Reprojection Tool (MRT) was used to mosaic and resize data to the specific study area; water bodies and fully cloud-covered areas were also excluded in this step; (2) computation of NSMI: MODIS 250 m resolution surface reflectance products were used in this step to compute NSMI; (3) extraction of the variance conversion factor: this factor is a partial derivative of SMAP soil moisture relating to the NSMI, which can be extracted statistically based on the linear relationship of these two variables; (4) usage of the disaggregation method for each pixel at 250 m resolution. The algorithm’s flow chart is drawn in Figure 2.

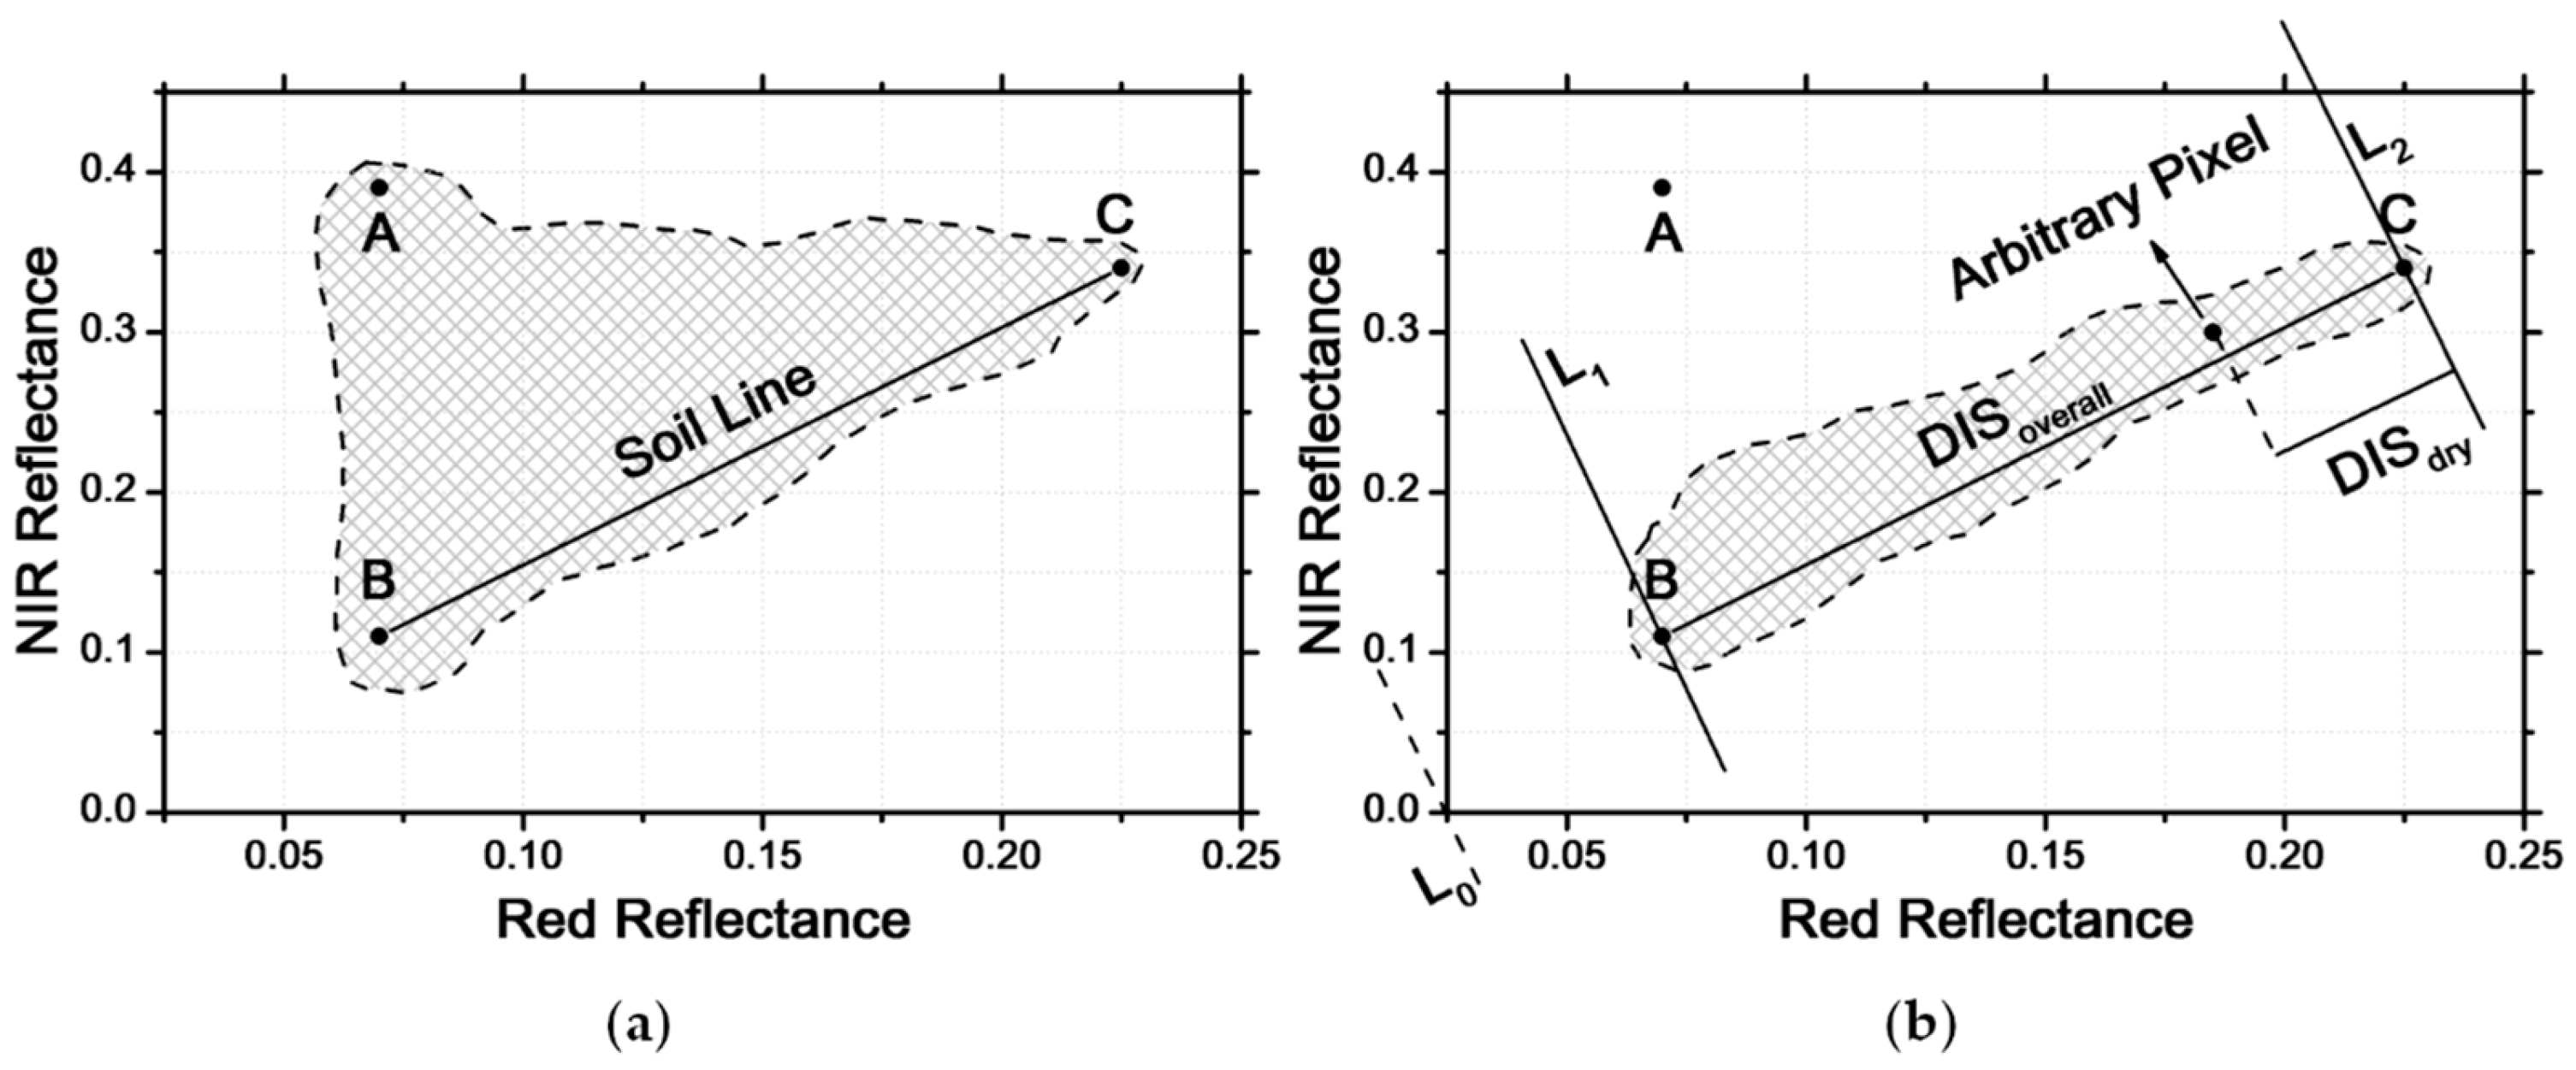
2.4. NSMI: Normalized Soil Moisture Index

To find a parameter that can account for the heterogeneity of soil moisture at the sub-kilometer scale, the normalized soil moisture index is proposed in this study with a basis in the NR-red triangle space. Earlier work on the spectral features of NIR-red triangle space can be found in [34,35], so only the pertinent details are described in this paper.
Consider a simplified scenario where only vegetation and soil exist. The vegetation canopy strongly absorbs the incident red spectrum, but intensively reflects near-infrared energy, whereas soil has high reflectance in the red spectrum and a slightly higher one in near-infrared. Under such a theory, previous studies have developed many mathematical formulae, such as ratio vegetation index (RVI), difference vegetation index (DVI) and NDVI, to distinguish vegetation and soil by using remote sensing. Considering the water contained in the soil, the reflectance of both bands decreases due to water absorption. That is, the more water content the soil has, the more incident energy it absorbs, thus leading to a lower reflectance in the red, especially in the near-infrared spectrum. When plotting the reflectance data into the NIR-red spectral feature space, a shape forming a triangle can be found, as Figure 3a shows.
It can be seen that pixels close to Point A have low red-band reflectance and high NIR-band reflectance, which represent fully or highly vegetation-covered areas. Pixels close to the BC line, termed the soil line, indicate near-bare soil with various water contents, where Point B denotes the wettest bare soil and C the driest bare soil [34,35,36,37,38]. To extract soil moisture information from the vegetation-covered area, a semi-empirical estimation [44] of vegetation abundance was considered in the study:
f v = 1 ( N D V I v N D V I N D V I v N D V I s ) 0.6175
where f v represents the fraction of vegetation within each pixel and N D V I v and N D V I s denote pure vegetation (set to 0.9) and vegetation-free soil (set to 0.15), respectively. The two parameter settings follow the newest DISPATCH version [30] in this study. N D V I can be calculated using NIR- and red-band surface reflectance. Having excluded water bodies within the Yanco area, all other pixels can be simply assumed to consist of two end-members: vegetation and soil. With the heritage of NIR-red triangle space, the study contains an approximation that mixed-surface reflectance is attributed to a linear combination of soil and vegetation [36,37,38] that can be described mathematically as follows:
R s = R f v R v 1 f v
with R being the mixed-pixel reflectance and Rv the vegetation reflectance (set to 0.05 at red and 0.5 at NIR, following the parameter settings of [37]). By plugging Equation (1) into Equation (2), surface soil reflectance ( R s ) can be estimated. When plotting these data in the NIR-red spectral space, most of the unmixed soil pixels can obviously be found to distribute close to the soil line (Figure 3b). Based on this, the N S M I is designed as shown in Figure 3b. L1 and L2 are vertical lines through the wettest bare soil (Point B) and the driest bare soil (Point C), respectively. The distance from the arbitrary point to L2 can be defined as D I S d r y , while D I S o v e r a l l represents the distance from L2 to L1. The N S M I is hence derived from the following operation:
N S M I = D I S d r y D I S o v e r a l l
When the expressions of D I S d r y and D I S o v e r a l l are plugged into the above equation, Equation (3) reads as follows:
N S M I = ( R C , N I R R s , N I R ) M ( R C , r e d R s , r e d ) ( R C , N I R R B , N I R ) M ( R C , r e d R B , r e d )
where R C , r e d and R C , N I R are, respectively, the red and NIR spectral reflectance of Pixel C (the driest bare soil), R B , r e d and R B , N I R are the corresponding reflectance of Pixel B (the wettest bare soil), R s , r e d and R s , N I R are the unmixed soil reflectance of each spectrum and M is the slope of the soil line that represents the study area. The value of M changes according to various soil types; in this paper, it was set to 1.16 based on previous studies [34,35,45,46,47,48,49]. The extraction of Pixels B and C occurs via the following simplified steps: (1) exclude the water bodies and fully cloud-covered pixels in the study area; (2) make sure the remaining pixels are successfully radiometrically corrected; (3) traverse the remaining pixels, compute their distances to L0 (Figure 3b) and extract the reflectance of each pixel with the minimum and maximum distance; and (4) terminate if the ratio of R N I R relating to R r e d is less than the threshold value (set to 2 based on the maximum slope of soil line in NIR-red triangle space); otherwise, repeat Step (3).
The N S M I is a dimensionless quantity and has a normalized interval of (0, 1). N S M I = 0 denotes that the corresponding soil pixel has the lowest soil moisture (the driest soil) in the study area, and vice versa. In this study, the N S M I was derived by MODIS 250 m resolution surface reflectance products and was used in this paper to downscale SMAP 36 km resolution soil moisture.

2.5. Disaggregation Method

The NRSD method downscales the 36 km resolution SMAP-derived soil moisture to the 250 m resolution scale using NSMI as a variance indicator. The study contains an assumption that soil moisture (SM) is corrected with NSMI; hence, the variance of the NSMI field can be converted to the SM field, which is described in the first-order Taylor series as follows:
S M H = S M + S M N S M I ( N S M I N S M I m e a n )
where SMH is the disaggregated soil moisture at 250 m resolution, SM is the SMAP soil moisture, NSMI is the variable derived from the MODIS 250 m resolution surface reflectance, NSMImean is the mean value at 36 km resolution scale and S M N S M I (the variance conversion factor) is the partial derivative computed statistically. For clarity, bold font represents variables derived at SMAP-equal resolution.
The term NSMI − NSMImean accounts for the heterogeneity within the 36 × 36 km2 scale. For a perfectly homogeneous scenario, the difference between N S M I and N S M I m e a n results in zero, leading to an equivalence between S M and S M H , which indicates that SMAP soil moisture can represent the entire homogeneous area. Under practical conditions, however, the heterogeneity of soil moisture at the 36 × 36 km2 scale exists. It can be seen from Equation (5) that the variance conversion factor relates the variance of NSMI to the variance of soil moisture. Assume that SMAP soil moisture denotes the mean value of the entire area. Relatively drier pixels would have a lower NSMI, resulting in a lower SM value than the SMAP-derived soil moisture, and vice versa. In this way, a single 36 km resolution pixel is disaggregated to 144 × 144 pixels at 250 m resolution.

2.6. Validation, Comparison and Evaluation

Given the in situ soil moisture measurements, the accuracy and performance of NRSD were evaluated by means of classical metrics like root mean square error (RMSE), bias, correlation (R) and probability (p). Besides, as a disaggregation method, it is important to further assess its capability to indicate the spatial variance of soil moisture within an SMAP pixel. Thus, b V a r i a n c e is defined here for evaluating this spatial representation:
b V a r i a n c e = ( S T D d S T D i n s i t u ) × 100
where S T D d represents the standard deviation (STD) of disaggregated soil moisture and S T D i n s i t u represents that of the in situ one. The lower the b V a r i a n c e is, the closer the STD of disaggregated soil moisture is to that of the in situ one, which means the better capacity to denote the spatial variance of soil moisture.
Based on the above metrics, the evaluation work mainly focused on three aspects: (1) overall accuracy and performance of the algorithm: NRSD-disaggregated soil moisture was first validated with in situ measurements at SMAP overpass time on each validation day; (2) spatial representation within an SMAP pixel: this test was conducted by building the relationship between the variance (STD) of disaggregated soil moisture and the in situ one, the correlation of which can be seen as an important indicator to denote the spatial representation; (3) applicable scope of the algorithm: it is influenced theoretically by many factors, among which land cover, fractional vegetation and drought condition impacts were separately tested in this study. It should be noted that all of the evaluation work was designed to make comparisons with the DISPATCH method.
Having evaluated the performance of the NRSD method, the reason leading to such performance was further discussed. As can be seen on the right side of Equation (5), there are two factors that can directly introduce error to the disaggregated soil moisture: NSMI and SM. The investigation was thus focused on two aspects: (1) the discussion of the performance of NSMI: as a key variable applied in NRSD, the performance of the NSMI can directly influence that of NRSD. The NSMI was first validated with in situ daily soil moisture and SMAP soil moisture. To test the capacity of indicating drought condition and thereby account for the heterogeneity of soil moisture, the NSMI was also compared with soil evaporation efficiency (SEE), which is the key variable used in DISPATCH to denote the variance of soil moisture. (2) The discussion of the error introduced by SMAP soil moisture: this investigation was carried out by building the relationship between the error of disaggregated soil moisture and the error in SMAP data, aiming to find out the error accumulation.

3. Results

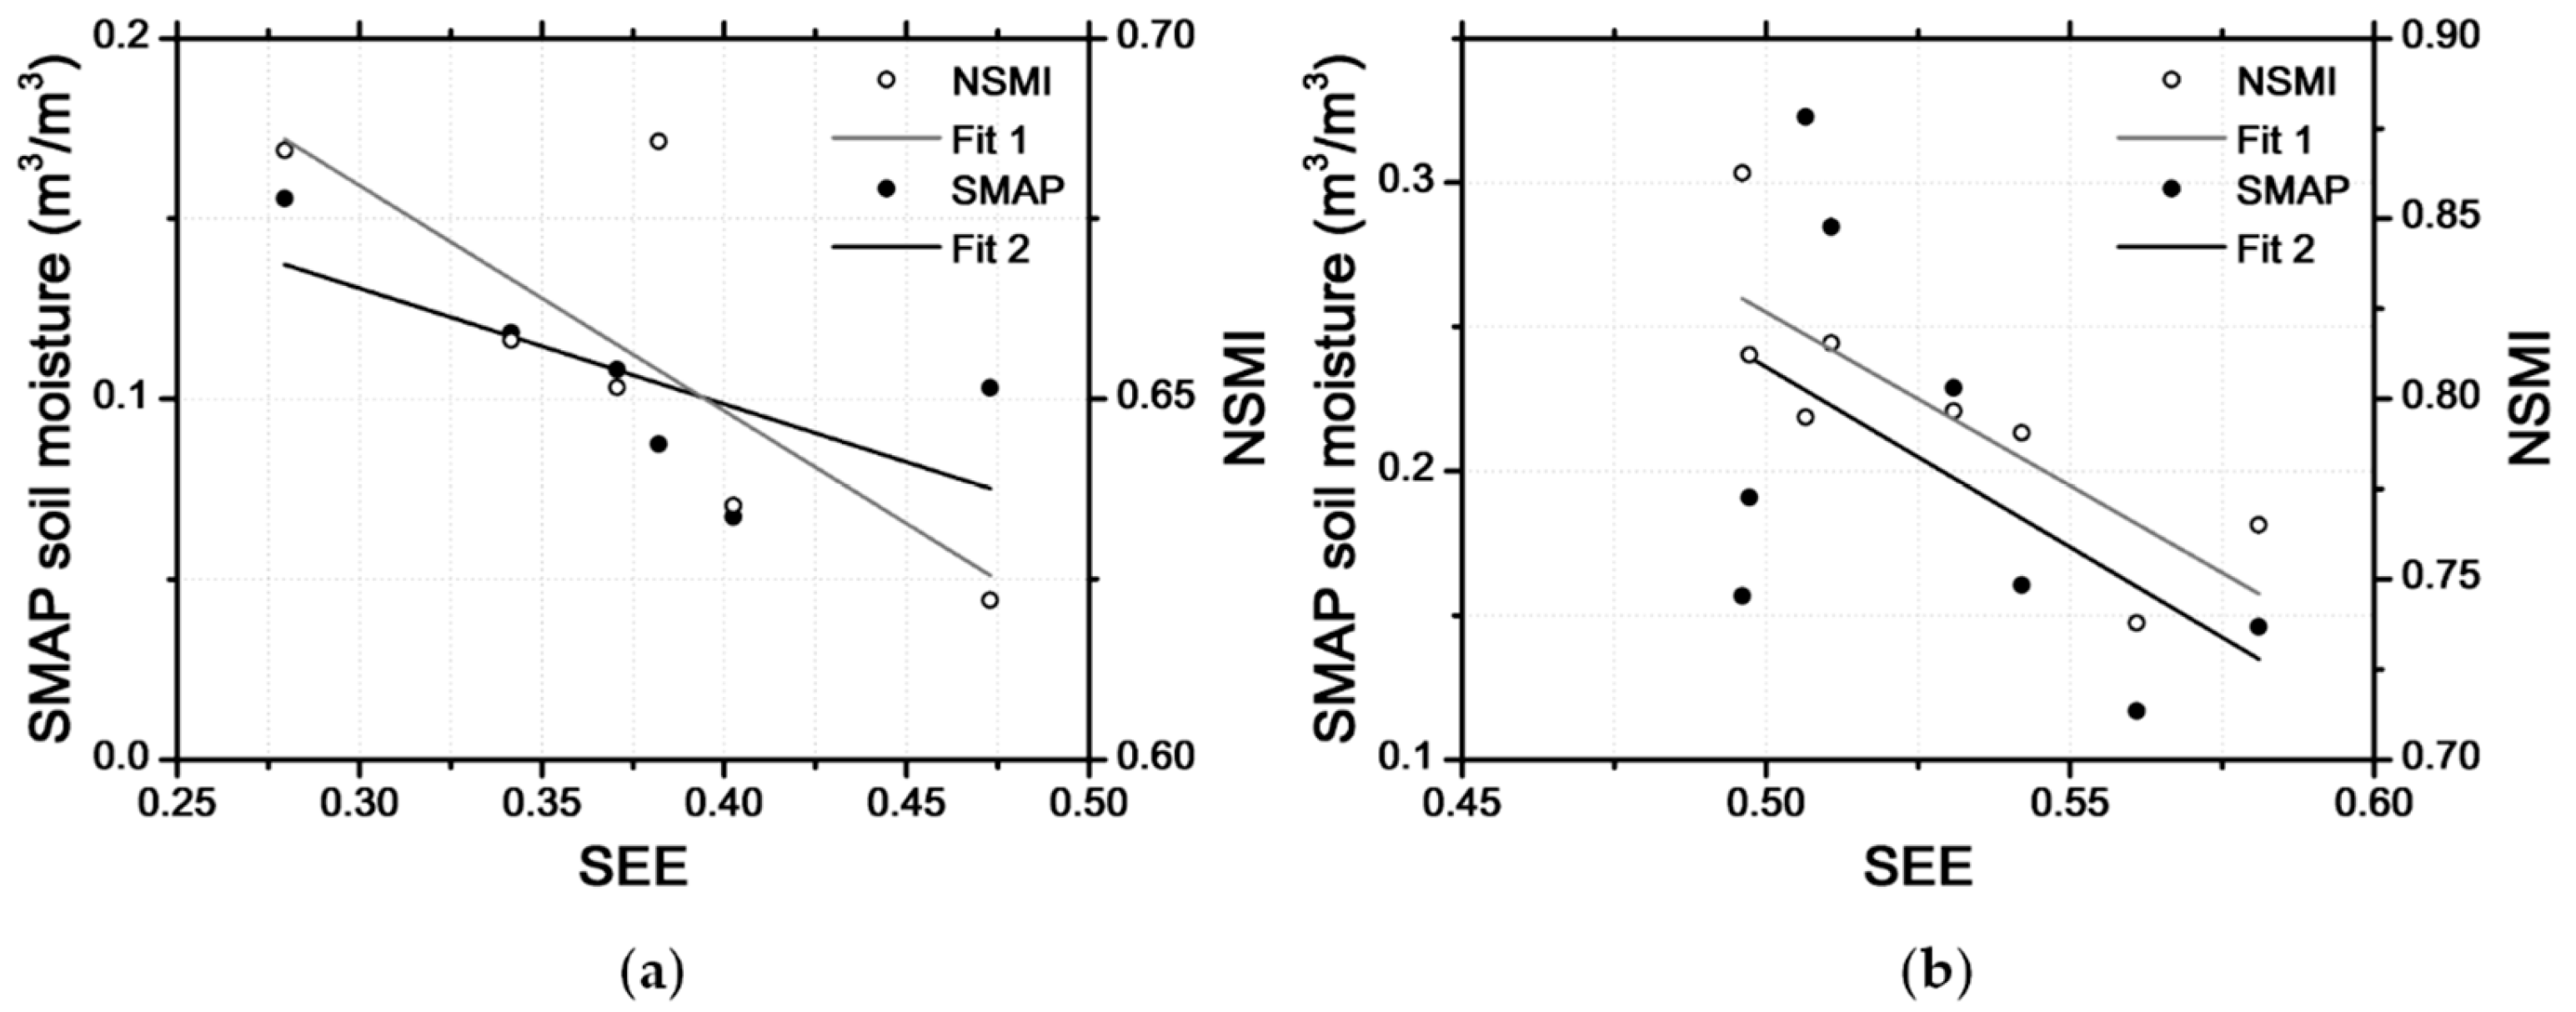
3.1. Extraction of the Variance Conversion Factor

For statistical extraction of the variance conversion factor, all the data covering the validation period (14 days) were collected to build the relationship of SMAP soil moisture relative to the NSMI. In this study, 250 m resolution NSMI data were aggregated to a 36 × 36 km2 scale, which can represent the mean value within the study area, and were compared with 36 km resolution SMAP soil moisture. Figure 4 indicates a significant linear relationship between 14 pairs of SMAP soil moisture and the averaged NSMI (R-value = 0.66 and p-value = 0.01).

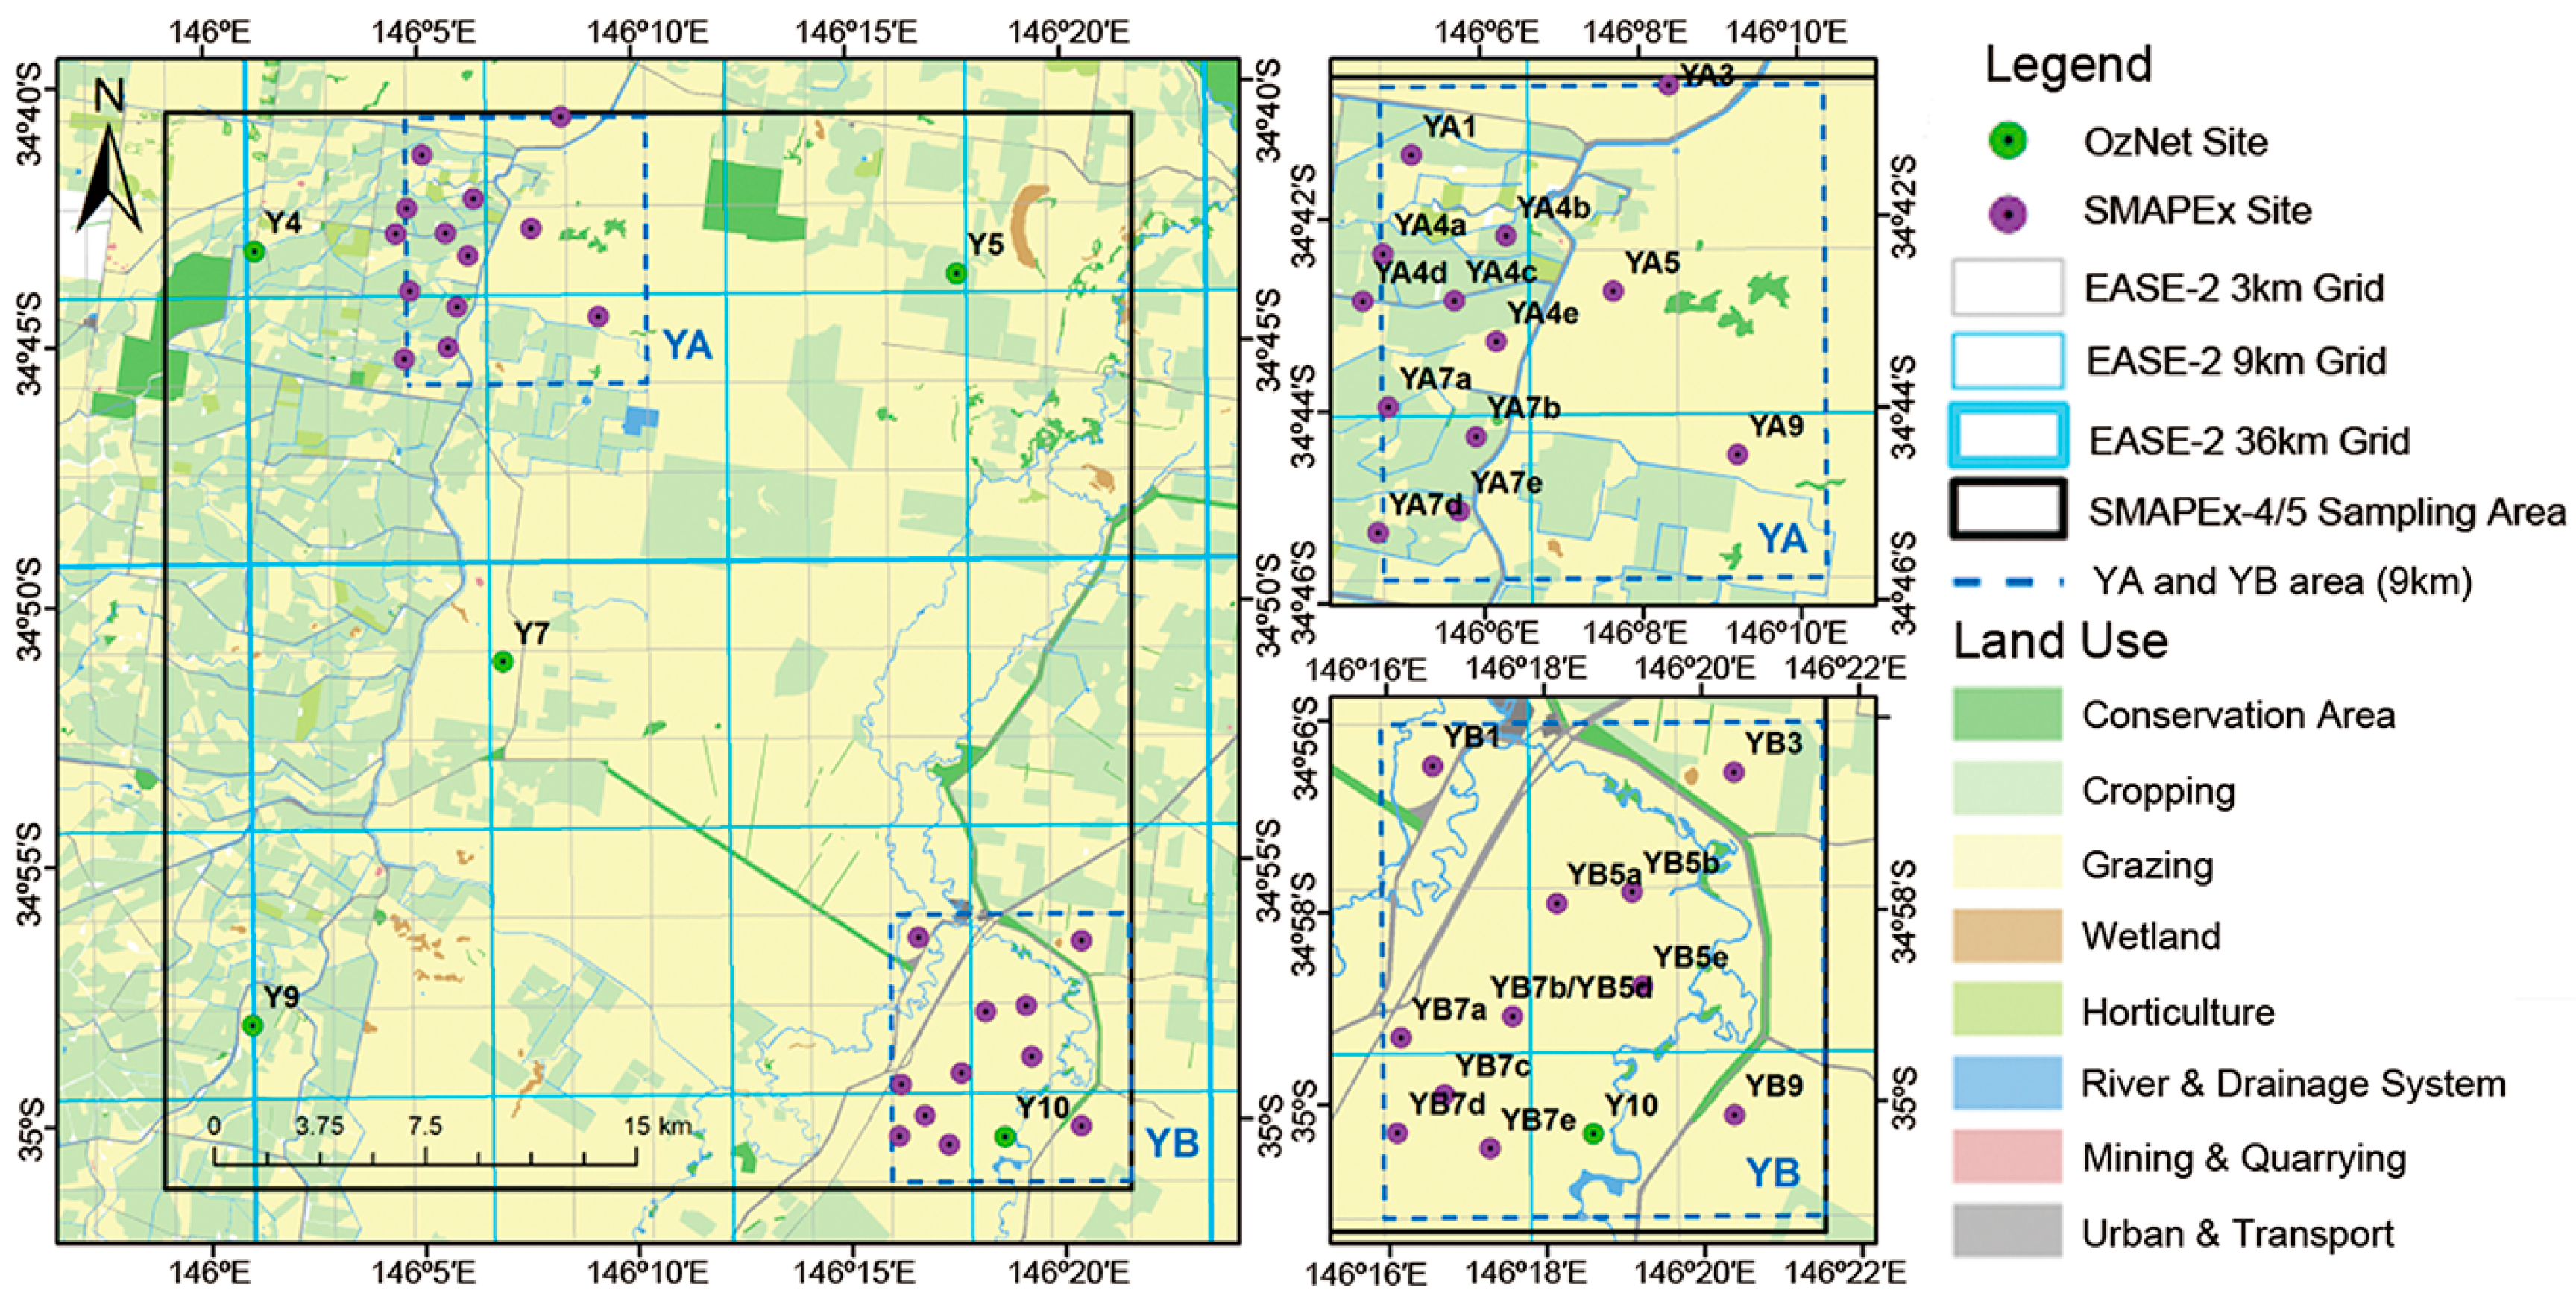
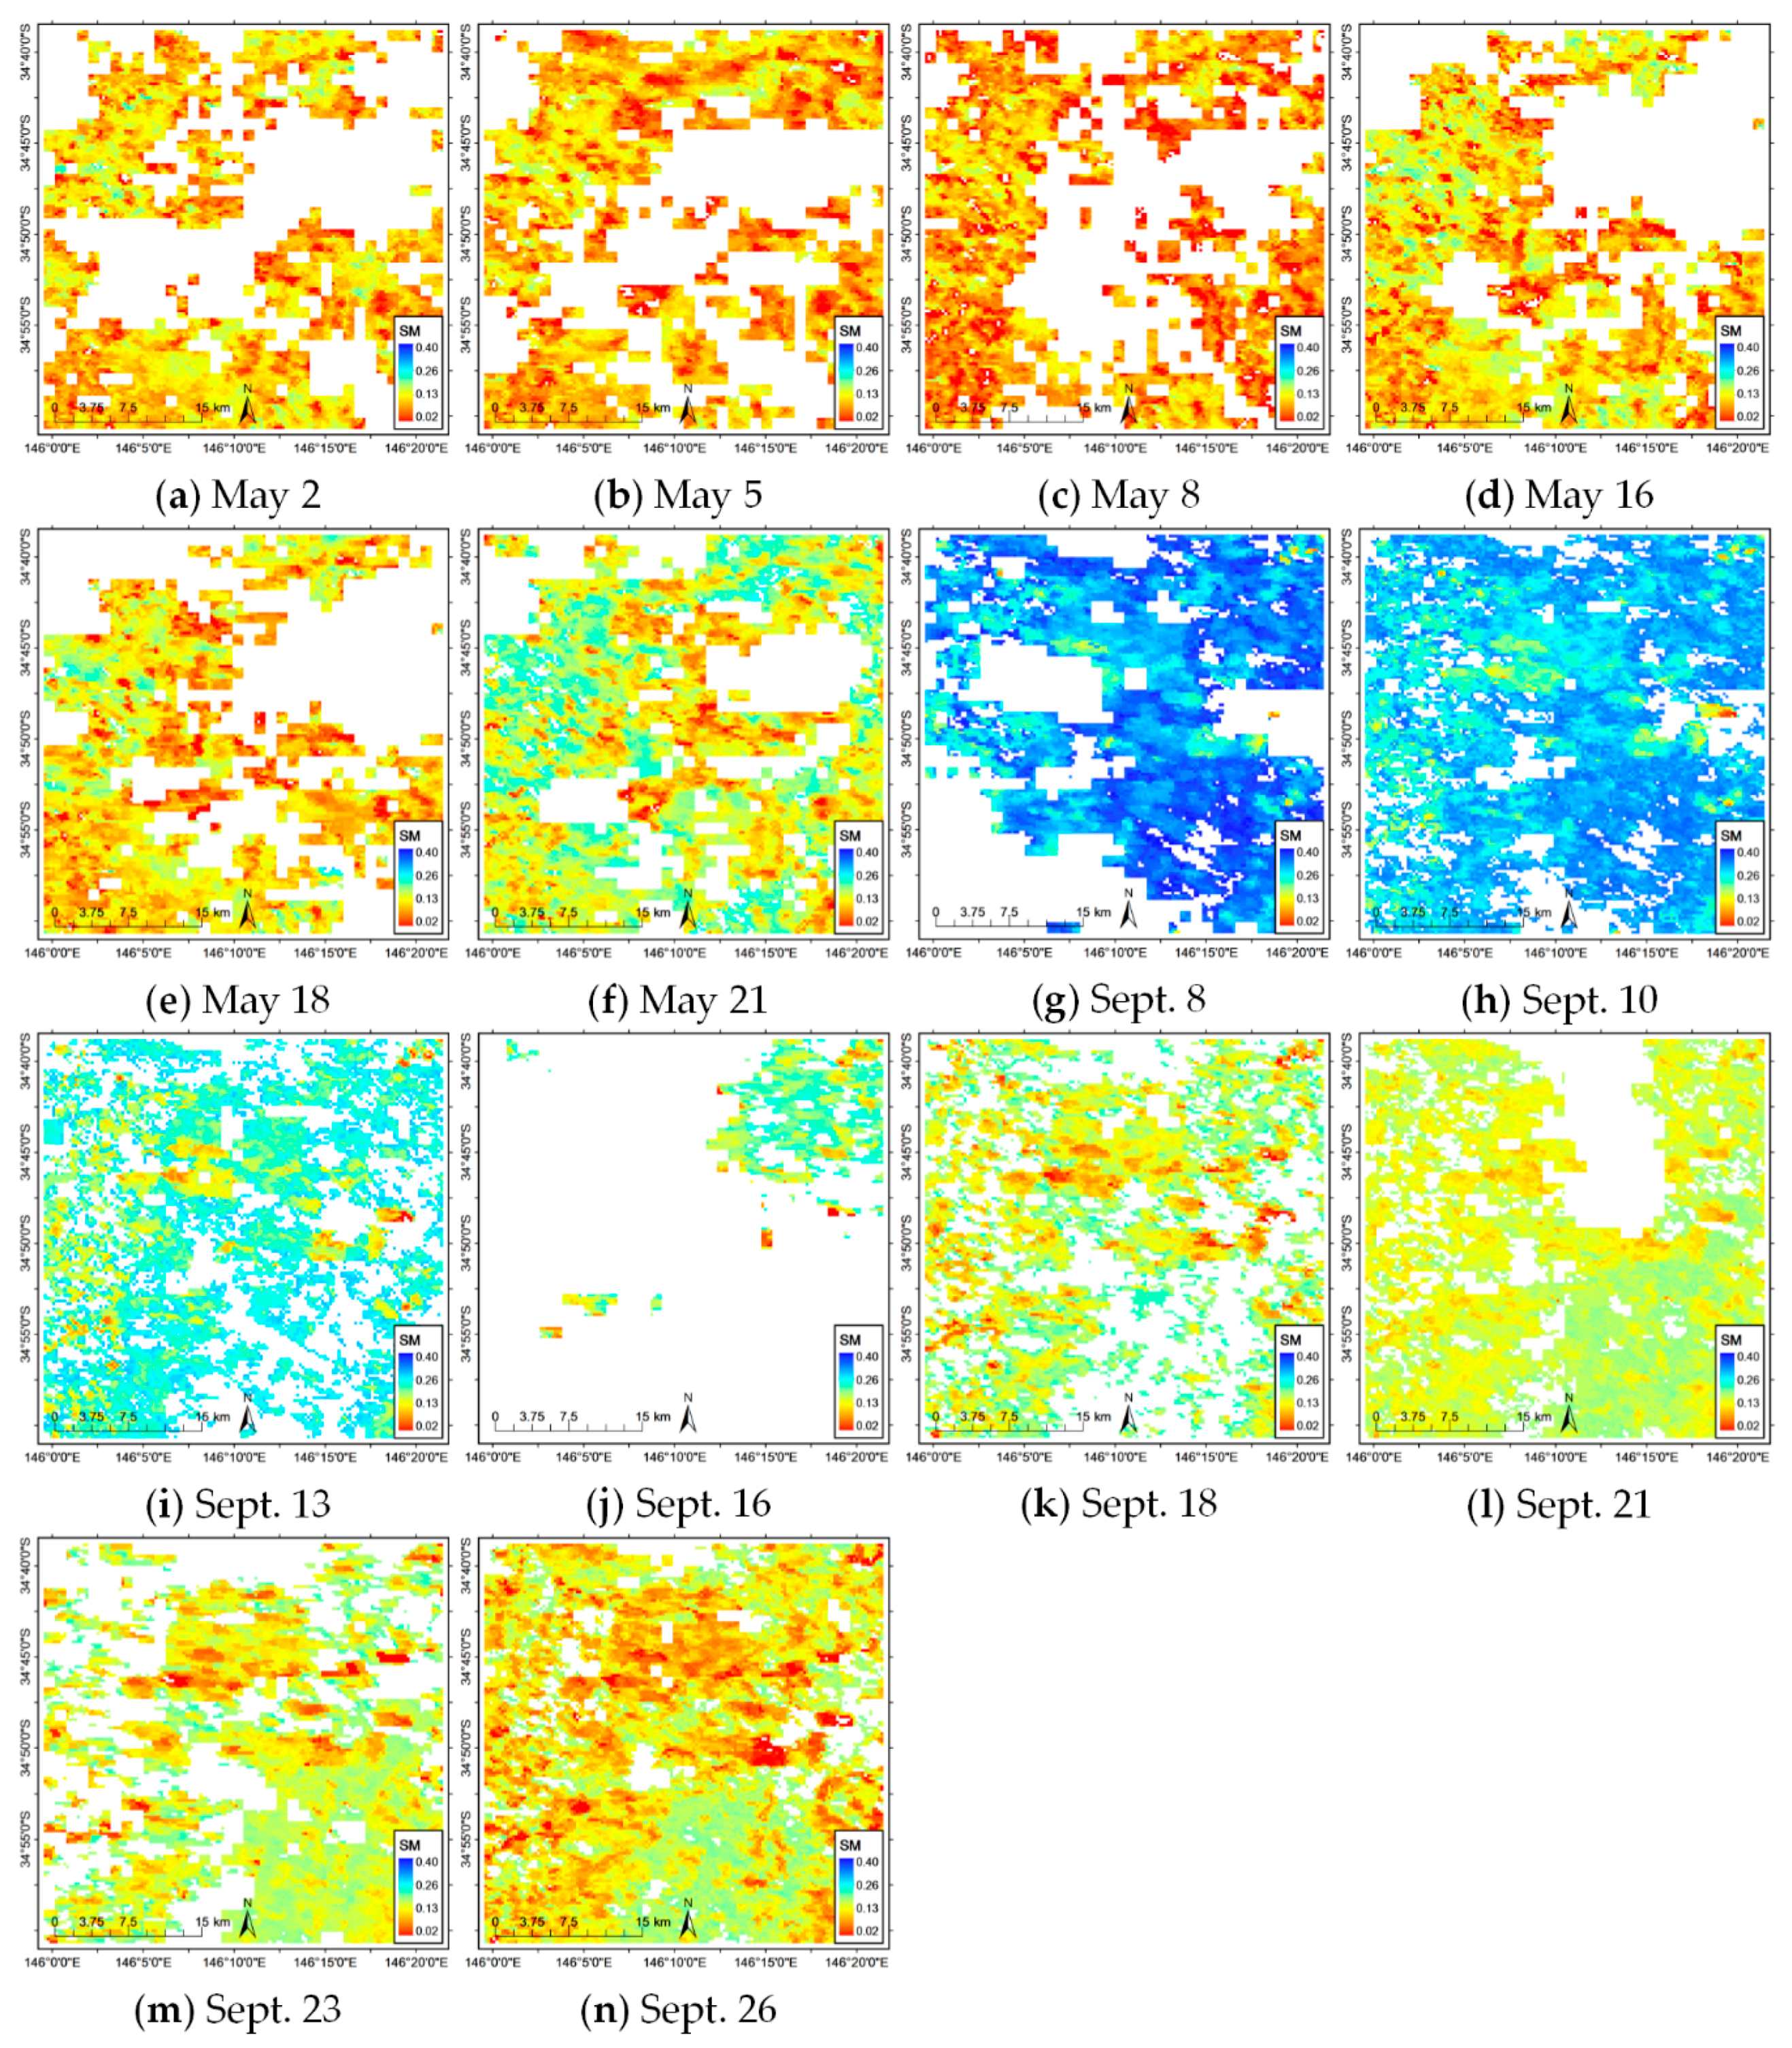
3.2. Disaggregated Soil Moisture

As shown in Figure 5, the NRSD method exports disaggregated SMAP soil moisture at 250 m resolution. Soil moisture can be intuitively seen to be lower in austral autumn than it was in austral spring because the value range of disaggregated soil moisture is strictly limited by the corresponding SMAP soil moisture at 36 km resolution. In the NRSD method, soil moisture at 250 m resolution has an interval of ( S M A P S M N S M I , S M A P + S M N S M I ) , where the SMAP value in September (especially on 8 September and 10 September) is higher, resulting in relatively higher soil moisture within the entire study area, and vice versa.

3.3. Validation and Comparison with DISPATCH

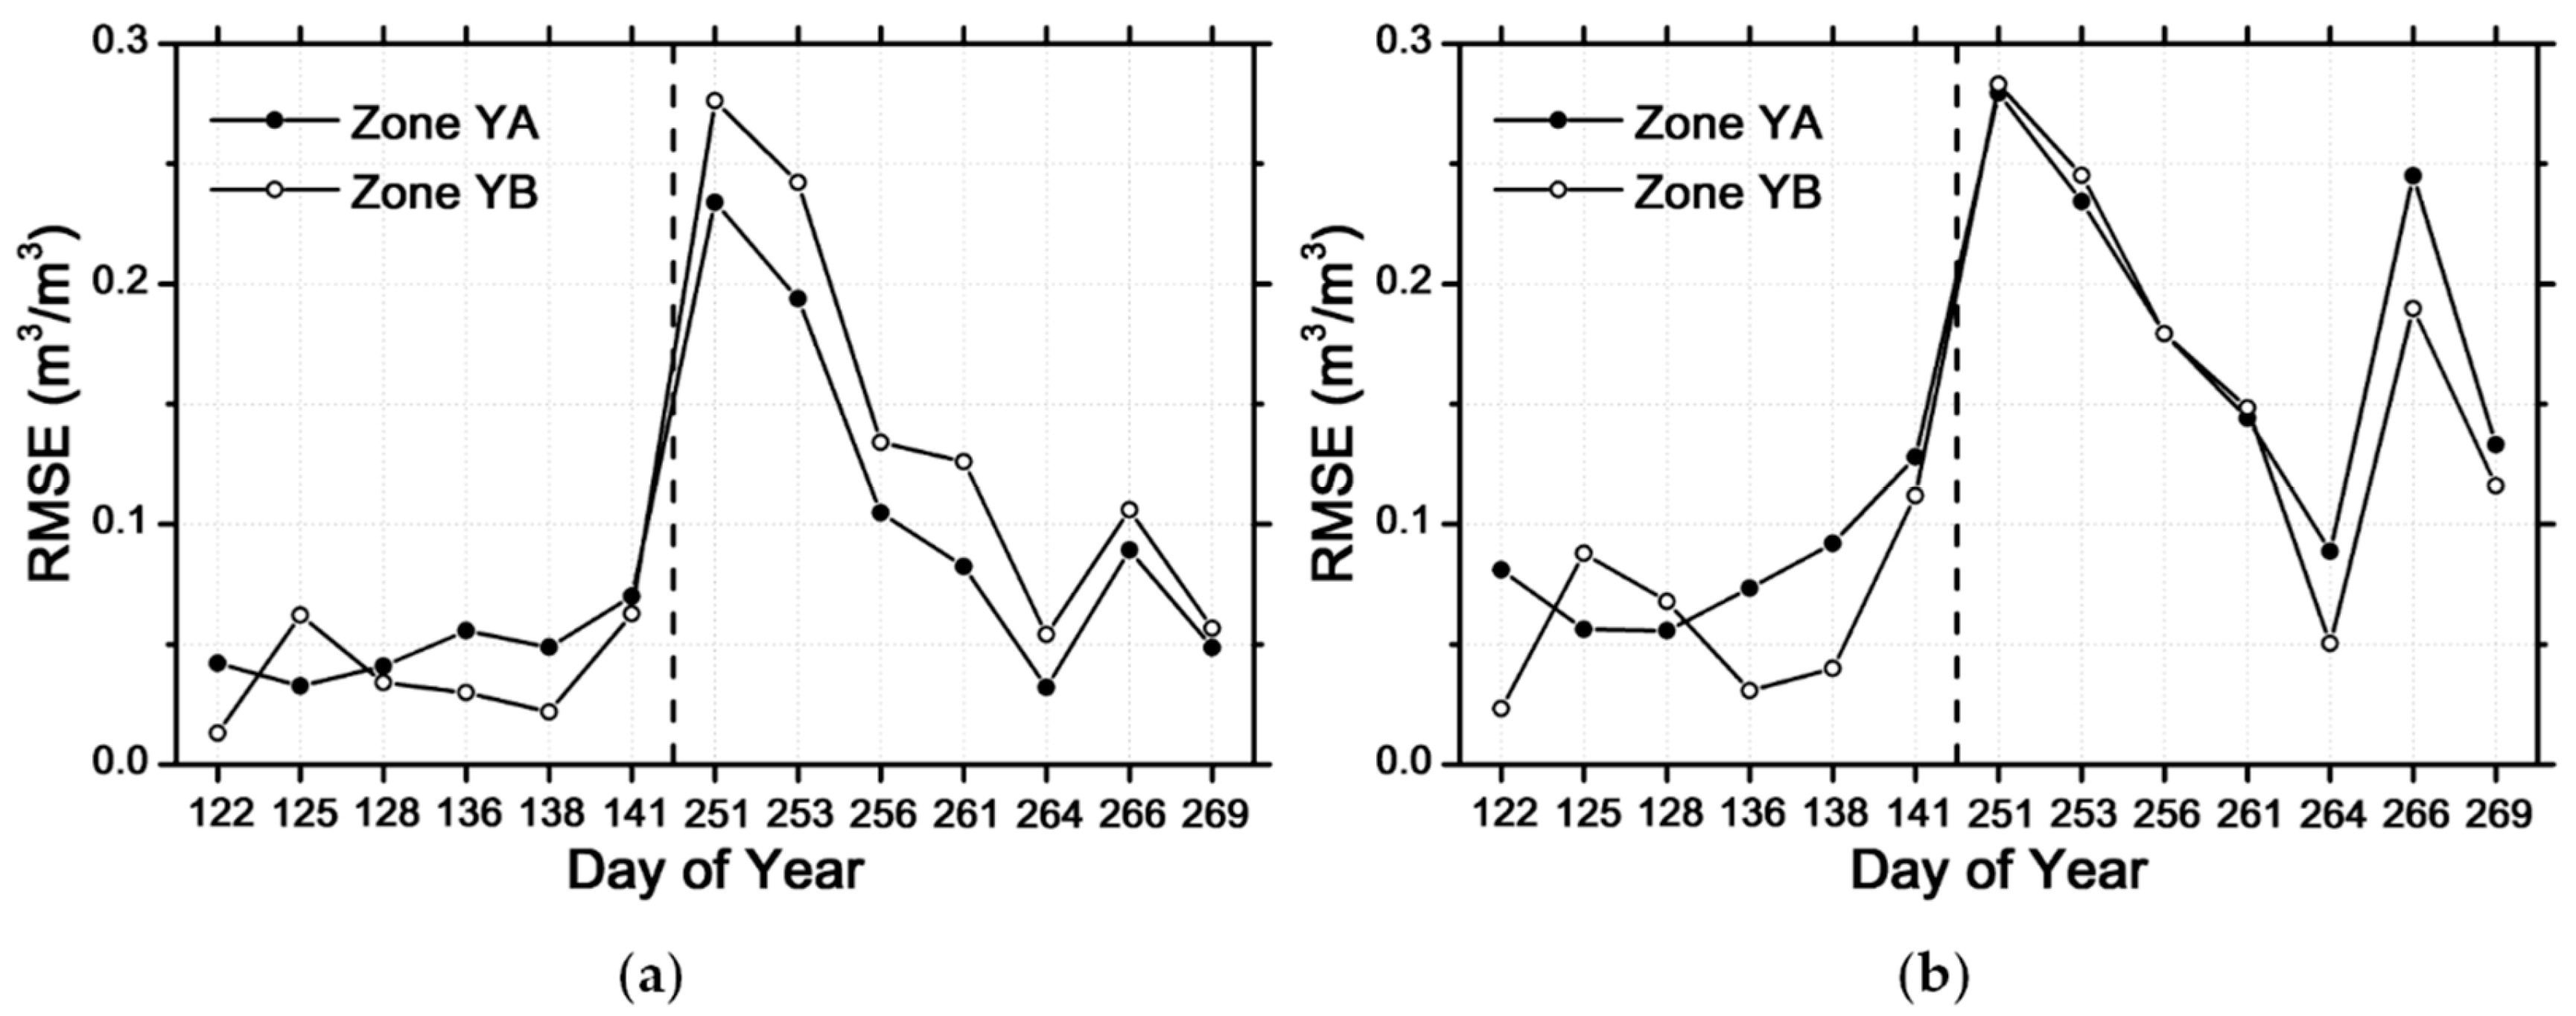
3.3.1. Overall Accuracy and Performance

Overall validation experiments were conducted by comparing NRSD with DISPATCH using in situ soil moisture measured at SMAP overpass time. Figure 6 represents the validation scatter plotted by NRSD disaggregated, DISPATCH disaggregated and SMAP soil moisture with respect to in situ soil moisture. Unlike the NRSD method, DISPATCH exports disaggregated soil moisture at a 1 km resolution, and SMAP soil moisture has a 36 km resolution. To unify spatial scales for validation, DISPATCH and SMAP soil moistures were downscaled at 250 × 250 m2 scales without any high resolution information, which means that the second item on the right side of Equation (5) was set to zero.
The validation results are summarized and listed in Table 2, and there are several points that can be concluded: (1) The error of three soil moisture value at 250 m resolution is lower in autumn than it is in spring. During the validation in May, SMAP soil moisture has a mean RMSE at 0.04 m3/m3, and the corresponding values of NRSD and DISPATCH are 0.04 m3/m3 and 0.07 m3/m3, respectively. During the validation in September, the mean RMSE of SMAP soil moisture increases to 0.14 m3/m3, and in such a case, NRSD and DISPATCH performed with a relatively higher error, with corresponding RMSEs of 0.12 m3/m3 and 0.17 m3/m3, respectively. (2) Comparing with DISPATCH, the RMSE and bias are lower for NRSD-disaggregated soil moisture on each validation day, which results in the lower overall RMSE and bias at 0.04 m3/m3 and 0.02 m3/m3 during May and 0.12 m3/m3 and 0.11 m3/m3 during September, respectively. (3) Most bVariances for NSRD-disaggregated soil moisture are lower, whether in May or September, revealing that the variance of NRSD-disaggregated soil moisture is closer to the real variance measured by in situ sites. (4) However, the R-values between in situ and disaggregated soil moisture run by both two downscaling methods are difficult to compete.
Based on the validation results, it was found that the NRSD performs with a better overall accuracy than the DISPATCH during the entire validation period, and the performance of disaggregation methods is possibly restricted by the accuracy of SMAP data. Besides, the lower bVariances on most validation days reveal that the NRSD may have better spatial representation at the SMAP sub-pixel. However, unlike metrics, such as RMSE and bias, the R- and p-values need to be stabilized to have statistical significance based on larger data volume.

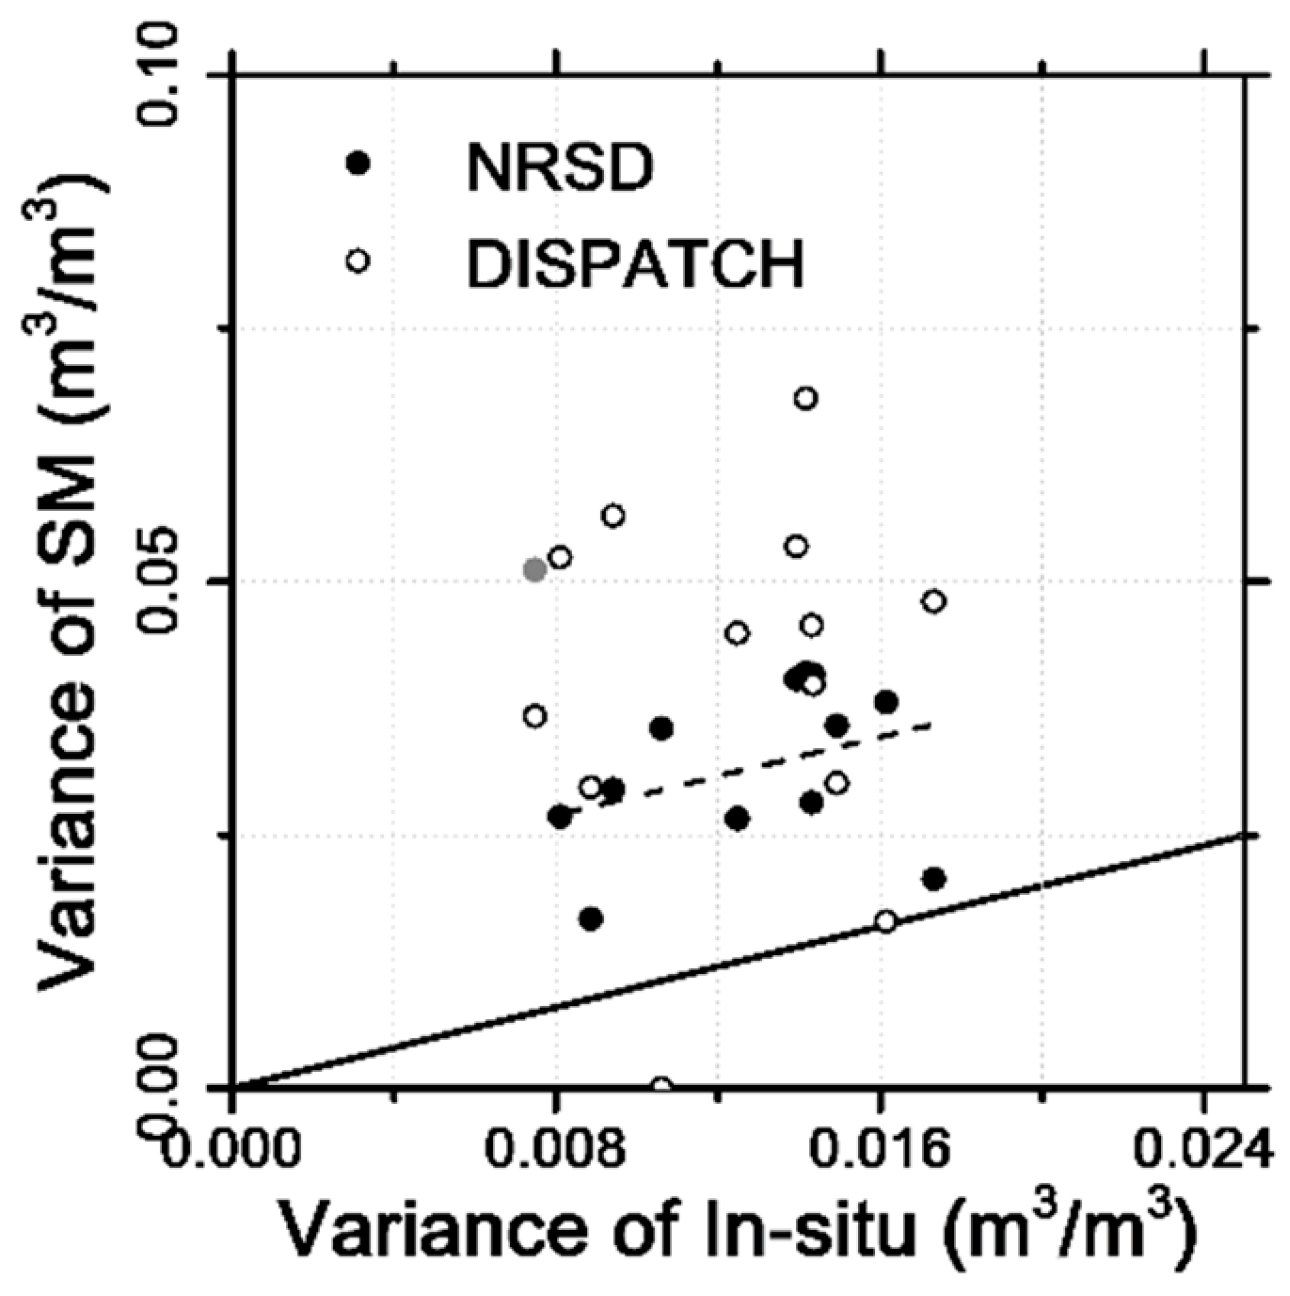
3.3.2. Capacity Test for Spatial Representation

Besides the bVariance shown in Table 2, the capacity of indicating the spatial variance within each SMAP pixel must be further assessed. Figure 7 plots the variance of disaggregated soil moisture versus that of in situ soil moisture each overpass day. The variance in this study is computed as the STDd and STDin-situ within Yanco.
The following can be seen in Figure 7: (1) The in situ variance was amplified by downscaling methods. Almost all of the points in the figure are above the 1:1 line, which means that the true variance was relatively overestimated. Specifically, the overestimation value is 0.02 m3/m3 of NRSD and 0.03 m3/m3 of DISPATCH. (2) The variances of the in situ measurements are small during the entire validation (0.012 m3/m3), and downscaling methods are less effective in such a homogeneous scenario. Nevertheless, compared to DISPATCH, the correlation between the variance of NRSD soil moisture and that of in situ measurements is higher (R-value = 0.35 and DOY 256 was excluded), and the trend is far closer to the 1:1 line (slope = 0.98).

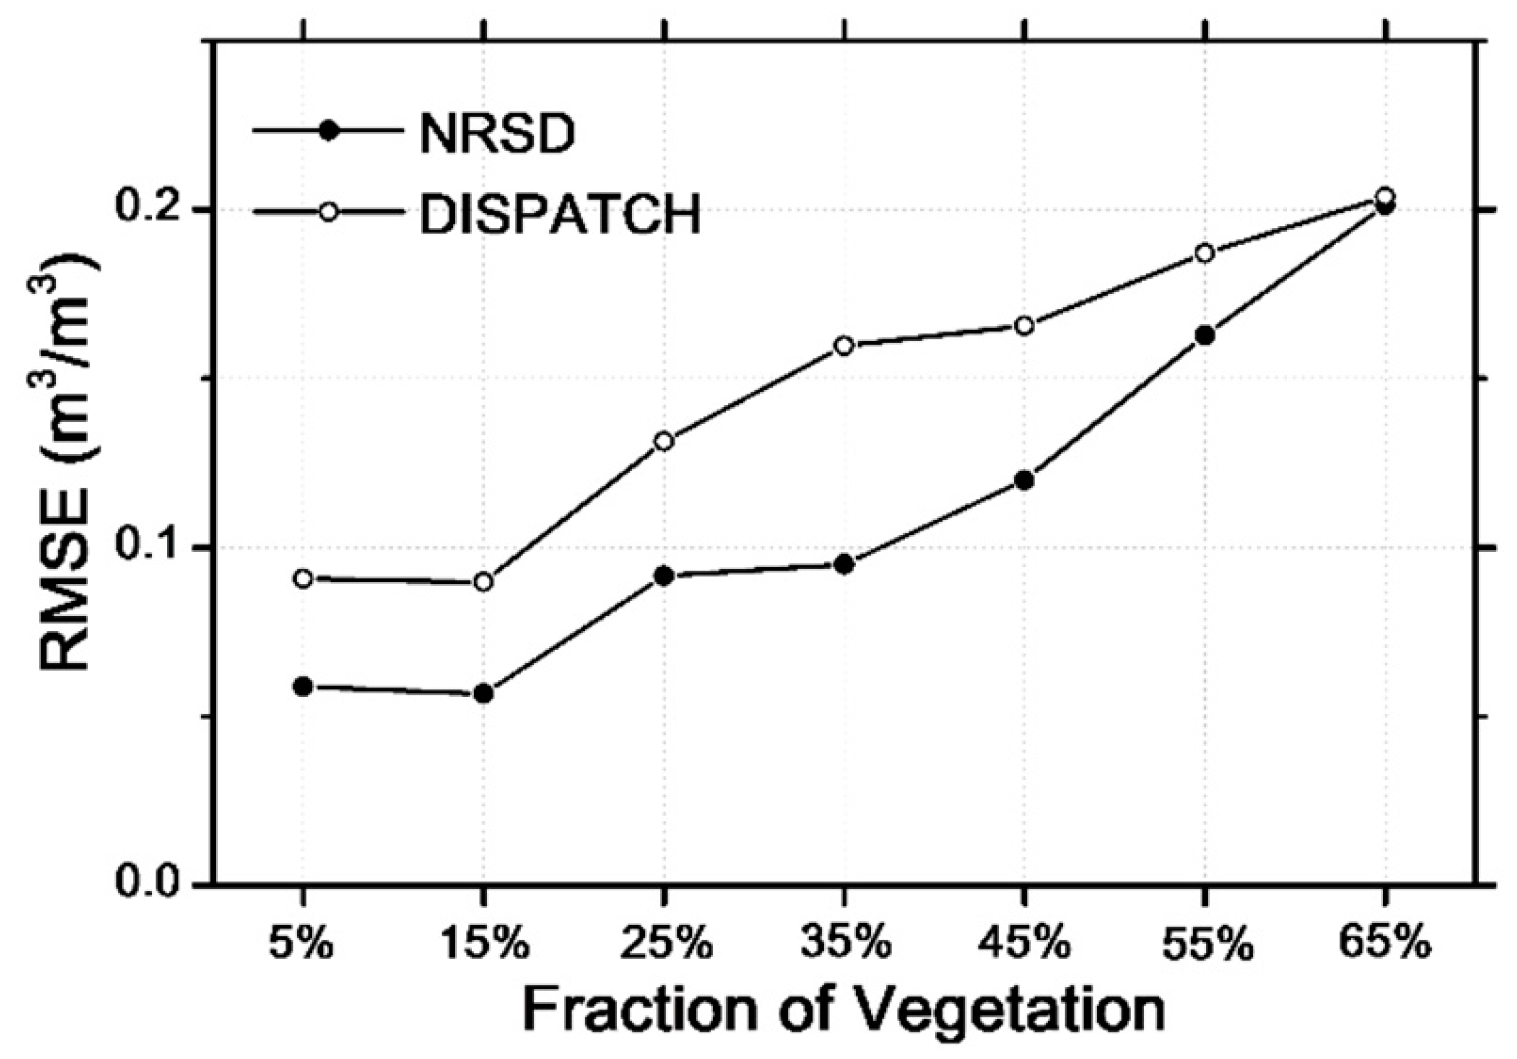
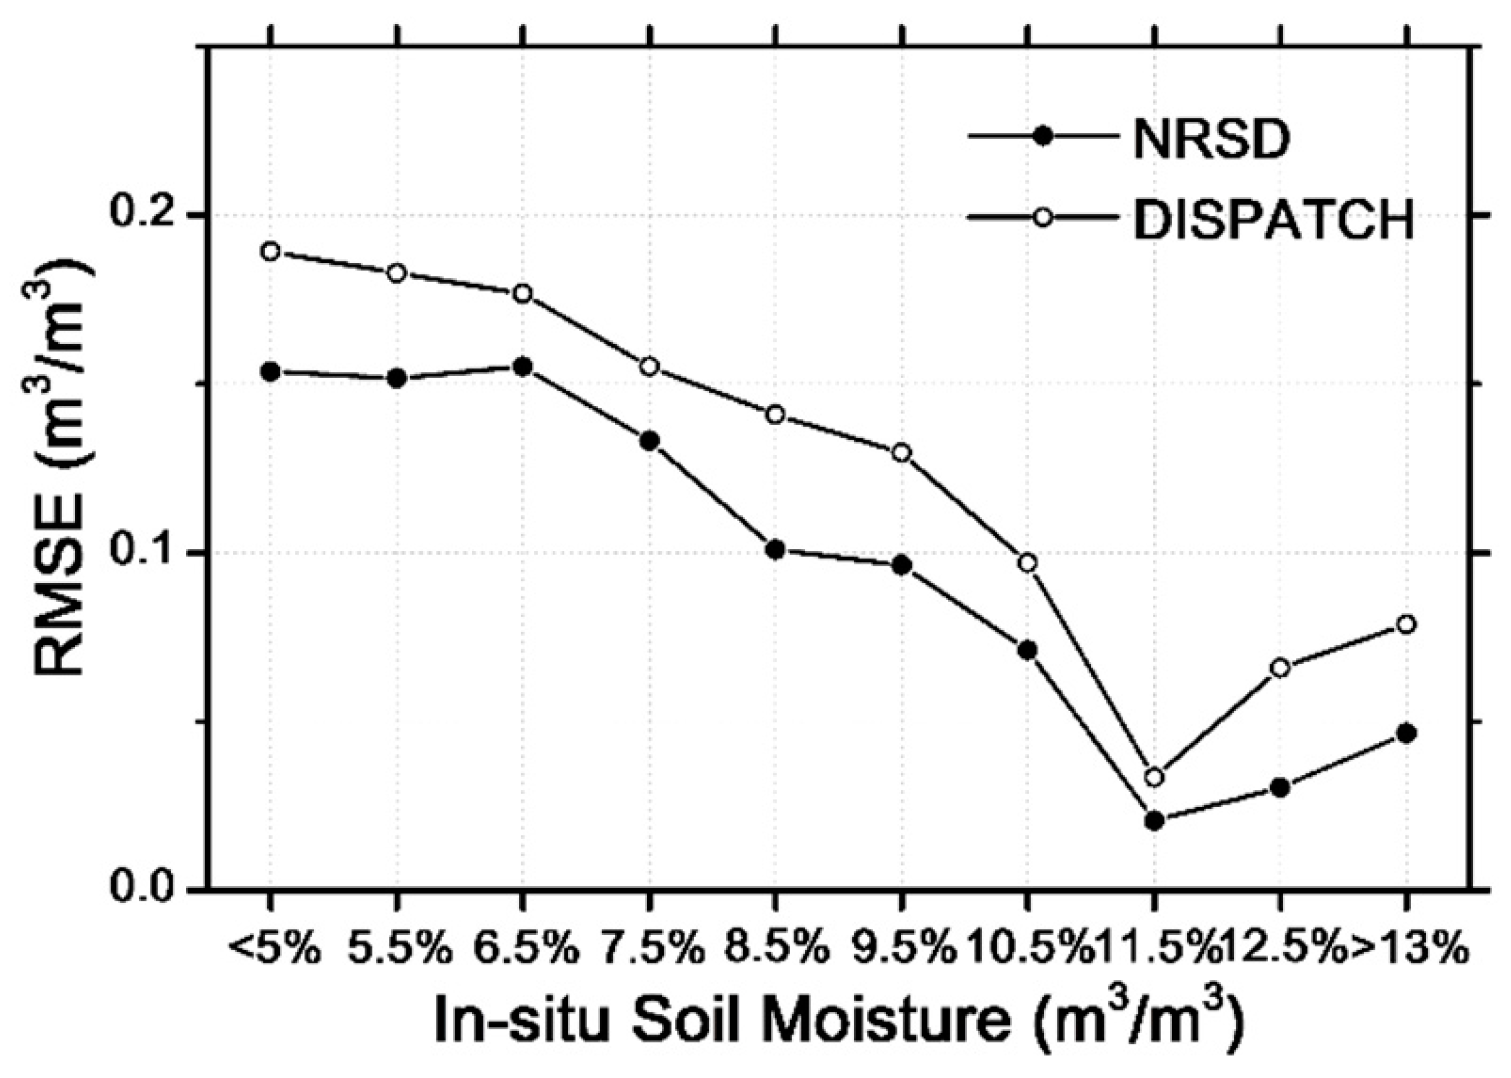
3.3.3. Assessments of the Algorithm Applicable Scope

For further assessments of the algorithm applicable scope, three variable-controlled experiments were conducted mainly focusing on three factors: (1) land cover, (2) vegetation cover and (3) drought condition.
Figure 8 represents the RMSE of each downscaling method as run in the cropping area (Zone YA) and the grazing area (Zone YB). The following can be noted: (1) both downscaling methods have similar errors, regardless of the cropping or grazing condition; (2) for NRSD, disaggregated soil moisture in grazing areas has a slightly higher accuracy each day, except DOY 125 in May (mean value at 29.6% higher), but a lower accuracy in September (mean value at 21.1% lower); (3) for DISPATCH, the result is quite similar to that of NRSD in May (mean value at 34.5% higher than cropping) but is more complex in September (mean value at 7.6% higher than cropping). Errors on DOY 251, 253, 256 and 261 are almost the same, whereas on DOY 264, 266 and 269, DISPATCH disaggregated soil moisture in cropping areas has a relatively lower accuracy, which differs from the conclusion derived by the NRSD method. (4) Regardless of the land-cover condition, the NRSD method performs slightly better than DISPATCH does.
Figure 9 distinguishes the fractional vegetation impacts on the error of both two downscaling methods. As shown in Figure 9, vegetation density (represented here by the fraction of vegetation estimated using the Baret method [44]) has a great influence on the performance of downscaling methods. The errors of both NRSD and DISPATCH increase as the vegetation densities increase. RMSEs are low (mean RMSE at 0.06 m3/m3 of NRSD and 0.09 m3/m3 of DISPATCH) in sparse vegetation landscapes (with a fraction of vegetation less than 20%), but increase rapidly (mean RMSE at 0.10 m3/m3 of NRSD and 0.15 m3/m3 of DISPATCH) at medium vegetation densities (with the fraction of vegetation from 20% to 50%). In vegetation-dominant areas (with a fraction of vegetation over than 50%), soil information is difficult to extract by using NIR and red spectra; hence, the performance of NRSD is relatively poorer (mean RMSE at 0.18 m3/m3 of NRSD and 0.19 m3/m3 of DISPATCH). However, NRSD had a better performance than DISPATCH did in diverse vegetation densities. Specifically, NRSD had an RMSE lower than 0.1 m3/m3 when the fraction of vegetation was less than 40%, whereas for DISPATCH, the upper bound of the corresponding fraction was 20%.
As a semi-arid area, Yanco was dry during the validation period, with in situ measurements ranging from 0.05 m3/m3 to 0.15 m3/m3. Figure 10 represents the RMSEs of NRSD and DISPATCH versus diverse drought conditions. As shown in the figure, when in situ soil moisture increases, the accuracy of both downscaling methods increases and then decreases. The critical value of in situ soil moisture is approximately 0.115 m3/m3. In situ values from 0.09 m3/m3 to 0.13 m3/m3 correspond to the RMSE of NRSD less than 0.1 m3/m3, which can be defined here as “good performance”. For DISPATCH, however, the lower bound of “good performance” is limited to approximately 0.1 m3/m3. Please note that the upper bounds of neither downscaling method are considered in this study due to restricted drought conditions in Yanco.
Based on the above three variable-controlled experiments, the NRSD method was demonstrated to have wider applicable scopes than DISPATCH on land cover, vegetation cover and drought condition, respectively.

4. Discussion

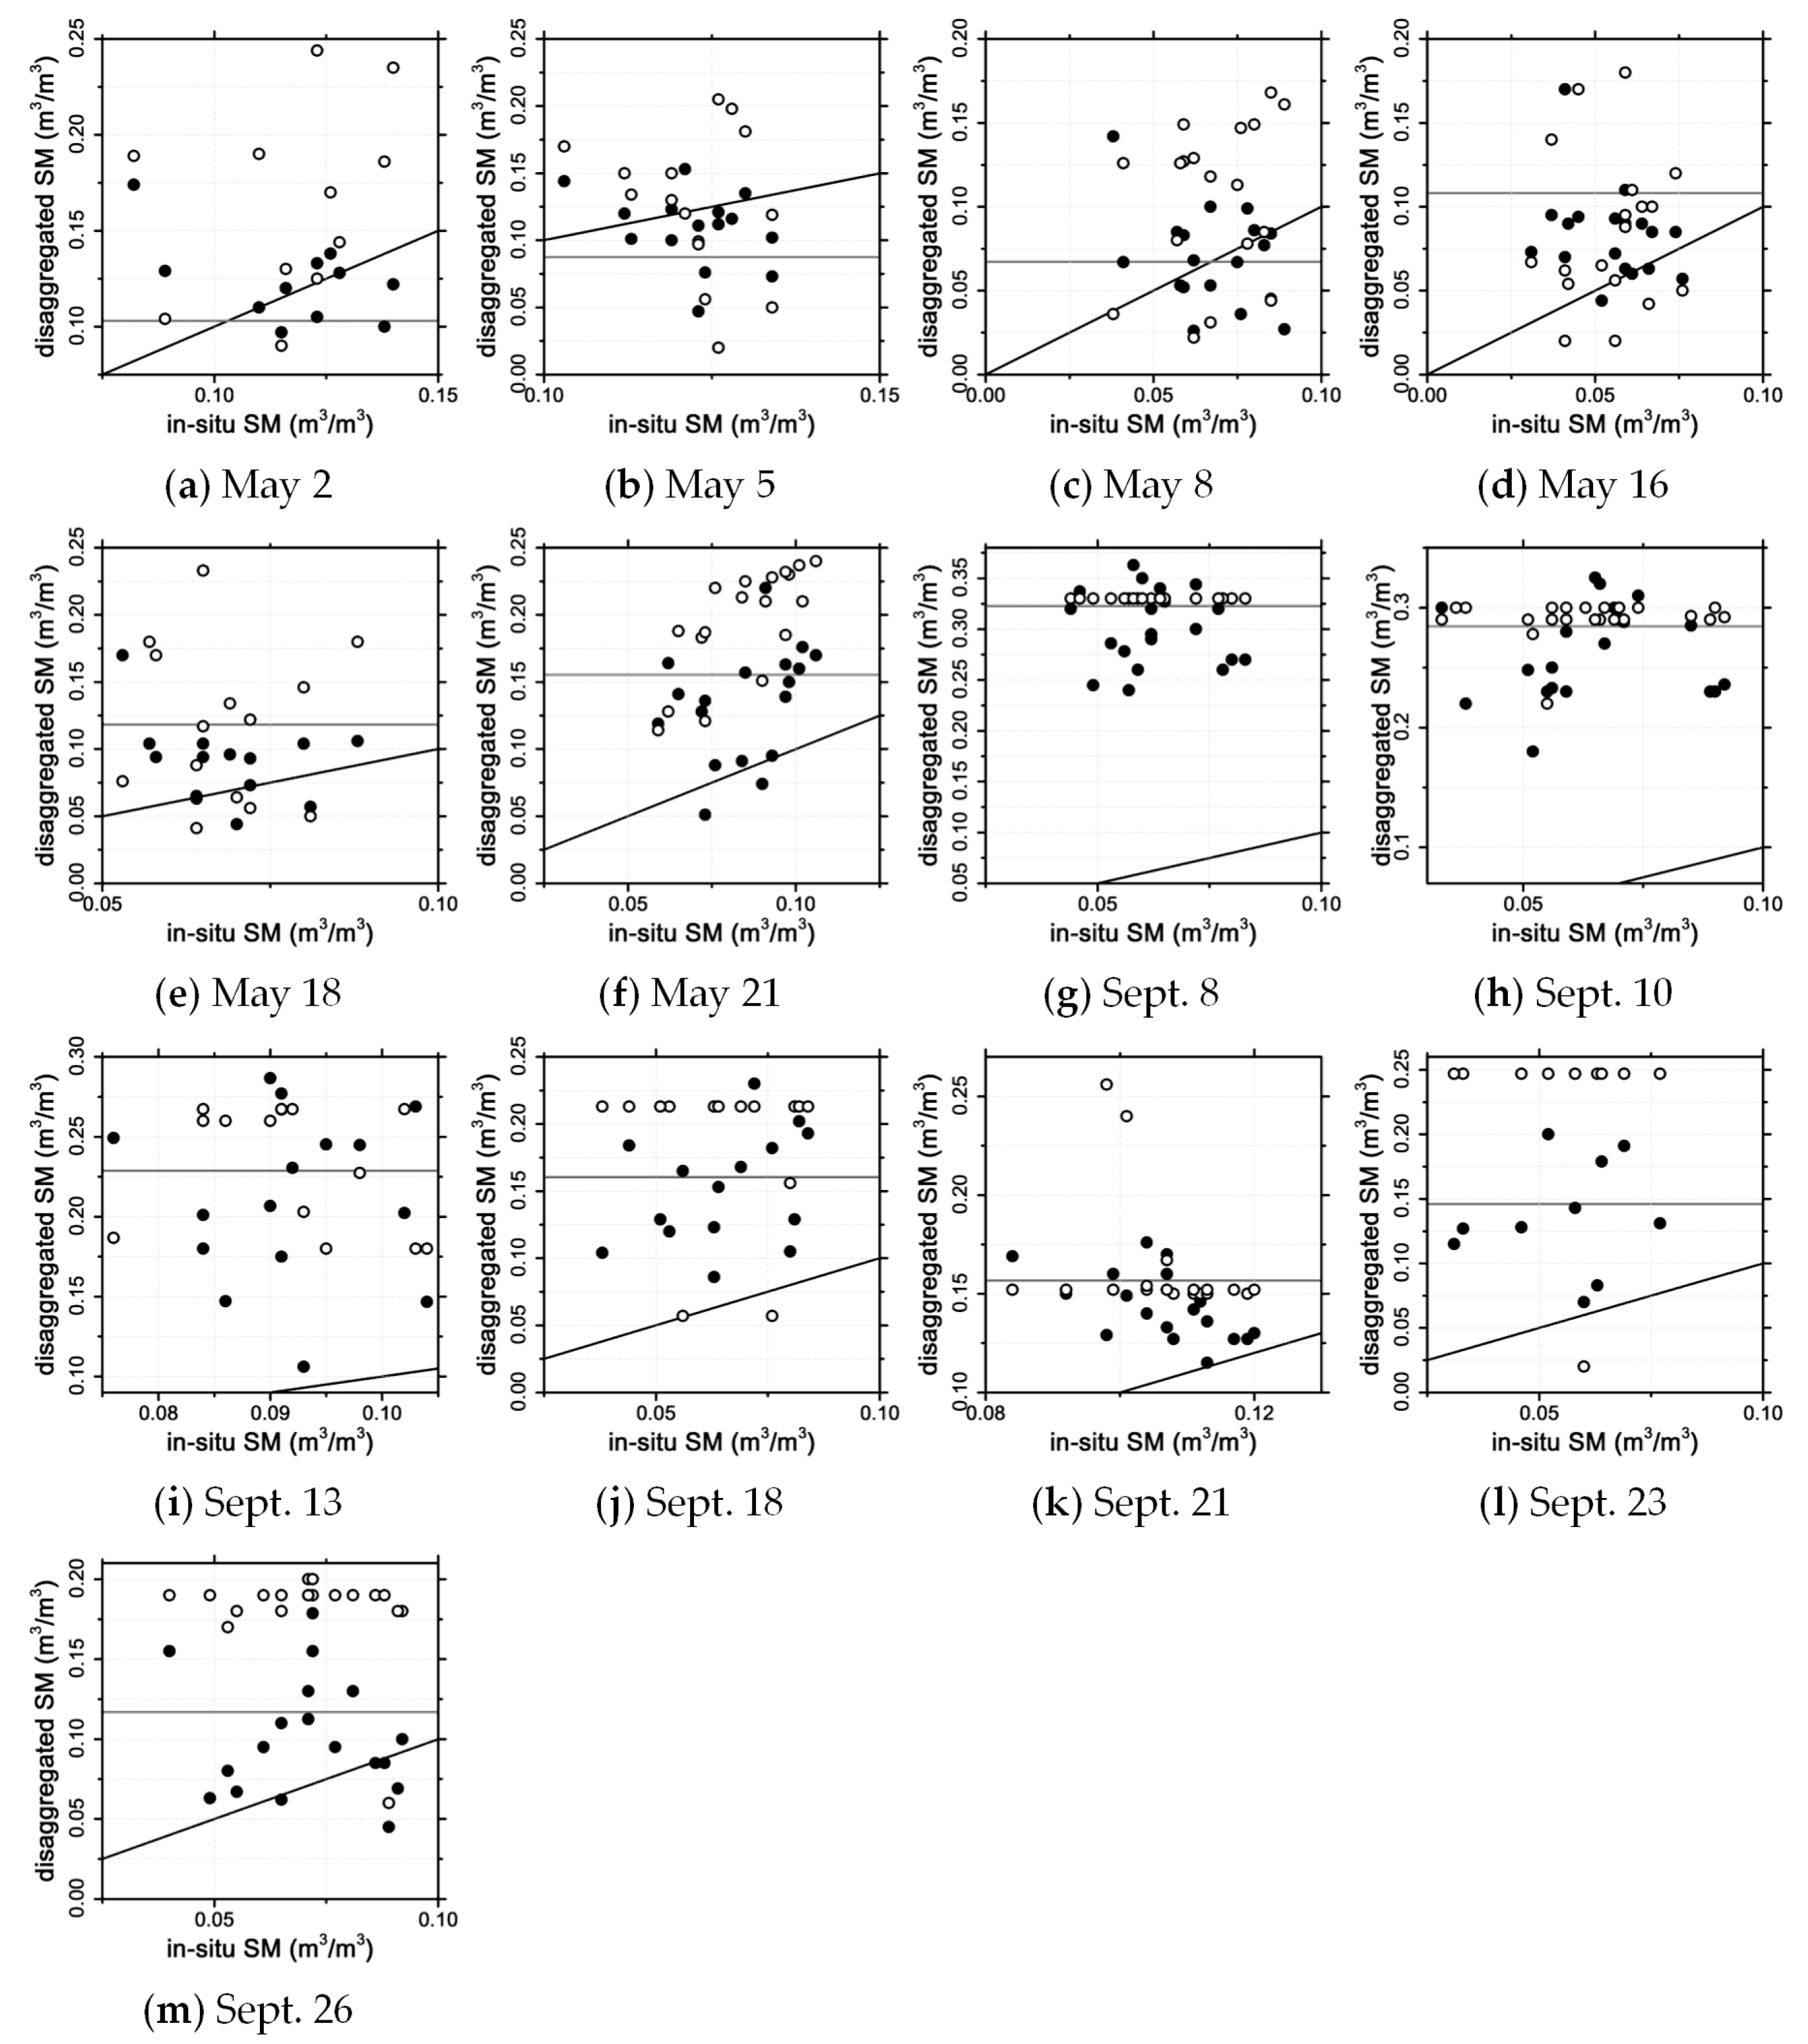
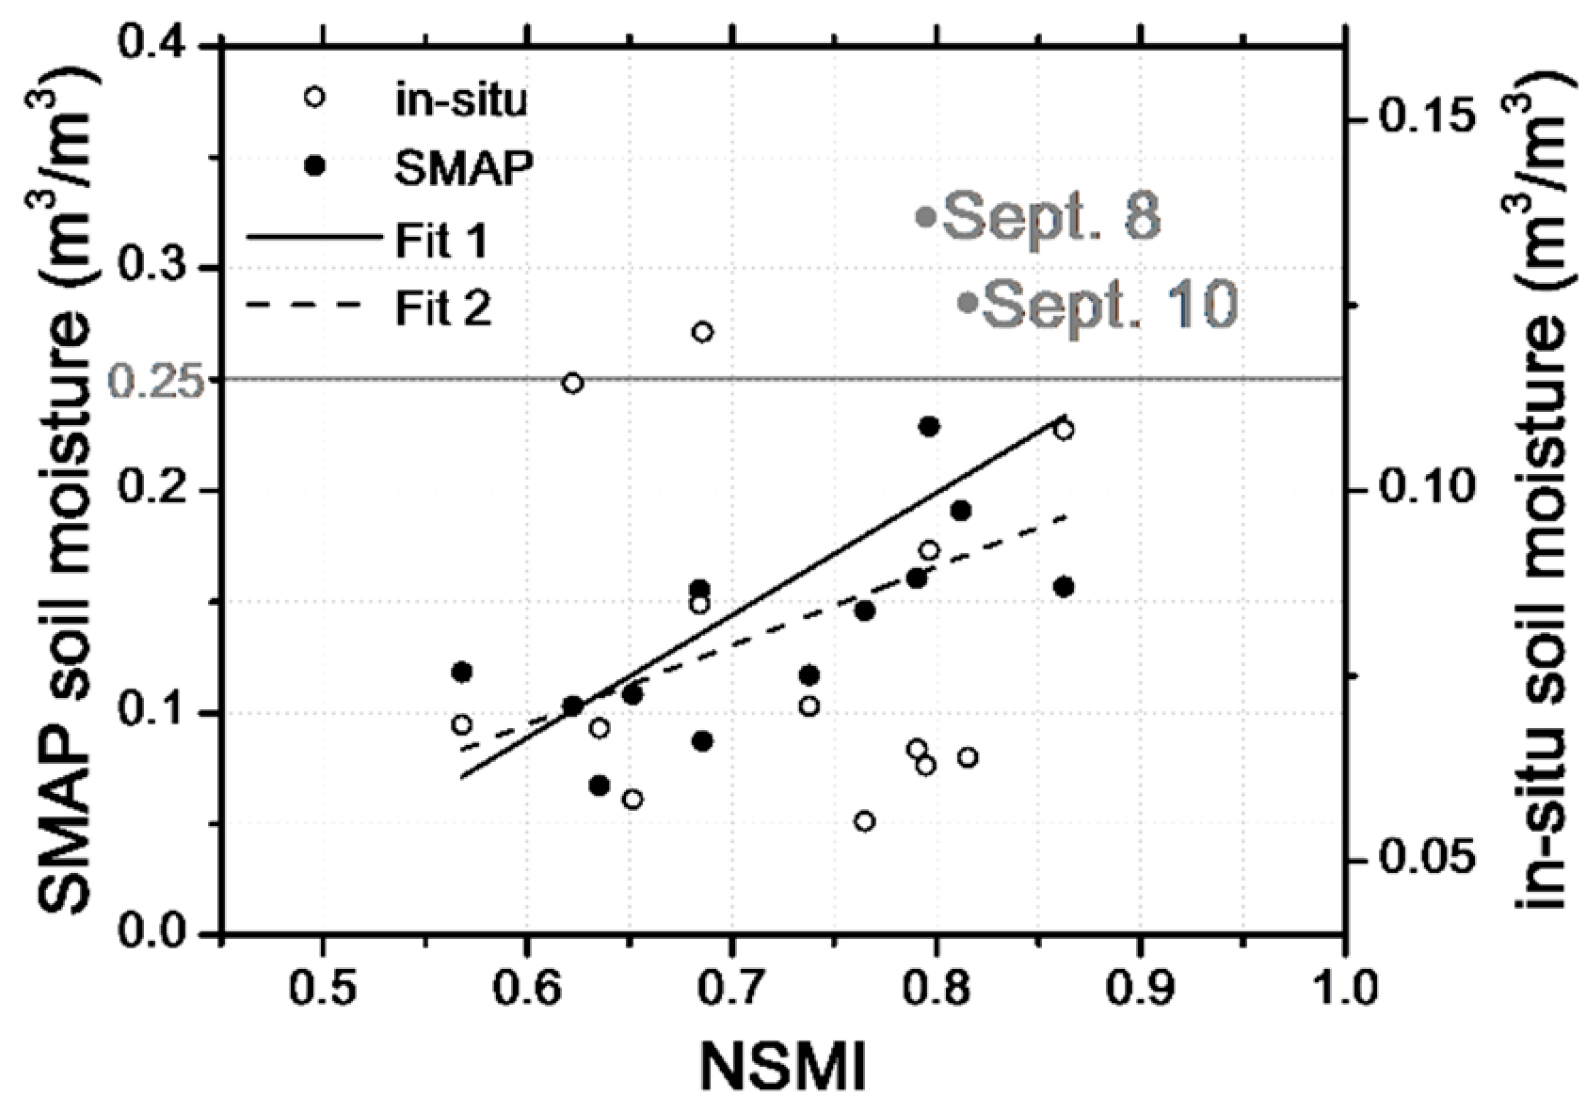
4.1. Performance of NSMI

The performance of the NSMI was discussed using the following aspects: (1) the significance of the linear relationship between SMAP soil moisture and the NSMI aggregated at a 36 km resolution; (2) a daily validation with in situ soil moisture measurements at MODIS overpass time; and (3) an additional assessment of capacity to indicate the variance of soil moisture by comparing the NSMI with SEE.
The significance of linear correlation between SMAP soil moisture and the NSMI is shown in Figure 4, and the statistical extraction of the variance conversion factor was based on such a significant relationship. In detail, the linear correlation becomes less obvious when SMAP soil moisture has greater increases (above 0.25 m3/m3 in this study). As shown in Figure 4, SMAP soil moisture was 0.28 m3/m3 and 0.32 m3/m3 on 10 September and 8 September, respectively, with the corresponding NSMI values both near 0.08. As noted in Section 2, Yanco is a semi-arid area with a relatively dry climate. The SMAP values of these two days were far greater than the corresponding in situ measurements (both 0.06 m3/m3) at 6:00 a.m. Due to missing ancillary data (e.g., precipitation data), this study prudently assumed that such a situation may be attributed to extreme weather conditions and the accidental error of the passive microwave soil moisture retrieval algorithm. Even so, a fine linear relationship is shown in the figure. The study additionally excluded these two pairs of seemingly abnormal data, finding a better linear correlation (R-value = 0.70 and p-value = 0.01).
As seen in Figure 4, it is relatively difficult to extract the correlation between in situ soil moisture and the NSMI by comparing these two values aggregated at 36 km resolution because the NSMI is designed as the normalized dimensionless quantity, the value of which strongly depends on drought conditions (specifically, the minimum and maximum soil moisture) in the study area during satellite observation within one day. However, Figure 4 indicates a plot of aggregated NSMI versus corresponding in situ soil moisture throughout the validation period. Therefore, for a better comprehension of the potential capabilities and drawbacks of the NSMI, a detailed daily experiment of the NSMI at 250 m resolution relating to in situ soil moisture was also considered (Figure 11), and quantitative descriptions of this validation are listed in Table 3.
Day-by-day validation can eliminate the error caused by diverse RB and RC on different days and under different drought conditions, where both parameters are applied to compute the NSMI. As shown in Table 3, among all of the autumnal validations (eight days except DOY 138), six of the day experiments have an R-value above 0.3, with the highest value at 0.7 on DOY 137. Both DOY 135 and DOY 137 have R-values near 0.7 and p-values lower than 0.05. Thus, the NSMI has the potential capacity to indicate drought condition in autumn. For spring drought monitoring, however, the NSMI is a relatively poorer indicator. Among all nine days of the experiments (except DOY 259), only three validation days have a correlation coefficient slightly higher than 0.3. DOY 263, DOY 266 and DOY 268 even have a negative relationship. Such poor performance can be analyzed from the following aspects: (1) plant coverage is high in the spring, and the semi-empirical unmixing method [44] used in this paper was not sufficient to adapt to such a situation; (2) the extraction method of RB and RC applied in the study performed unstably and needs to be improved in further study. Even so, SMAP soil moisture and the NSMI aggregated at 36 km resolution are significantly correlated in this study, and the statistical extraction of the variance conversion factor was used as a key parameter of the NRSD method.
For a comparison with DISPATCH, the NSMI is evaluated here with SEE, which is a key parameter in the DISPATCH downscaling method. Figure 12 represents the linear relationship of SMAP soil moisture related to SEE aggregated at a 36 km resolution, which is computed as DISPATCH describes [29,30,50]. The statistical partial derivative of SM relating to SEE, hereafter called SMp, was used in DISPATCH for downscaling. As Figure 12 shows, SMp failed to form a stable variable during the validation and was thus linearly fitted separately. SMAP soil moisture and SEE can be seen to correlate well during both validation in May (R-value = −0.69 and p-value = 0.13) and September (R-value = −0.54 and p-value = 0.17), but the linear relationship was not significant. In Figure 4, it can be seen that SMAP soil moisture was significantly correlated with the NSMI aggregated at 36 km resolution, so the NSMI can be concluded to be an appropriate indicator for denoting the variance of soil moisture at sub-kilometer scales, and it performed better than SEE did in this study.
The relationship between the NSMI and SEE was also constructed to further confirm its capacity for indicating drought condition. SEE has been found to correlate with soil moisture by validation with in situ soil moisture and physical modeling [51], and Figure 12 shows a fine linear relationship between the NSMI and SEE at 36 × 36 km2 scales. During the validation in May, the NSMI related to SEE had a correlation coefficient of −0.78, with a p-value of 0.06, whereas during the validation in September, the R-value was −0.82, and the corresponding p-value was 0.01. Thus, the NSMI correlated well with SEE during the entire validation and can be used to indicate drought condition.
Based on the validation and evaluation studies regarding the NSMI in this paper, the following conclusions were drawn: (1) similar to SEE, the NSMI has a potential capacity to indicate drought condition; (2) the NSMI is an alternative index for denoting the variance of soil moisture at sub-kilometer scales and performed better than SEE did during the entire validation; (3) compared to autumn, the NSMI performed relatively poorer in spring due to high vegetation cover.

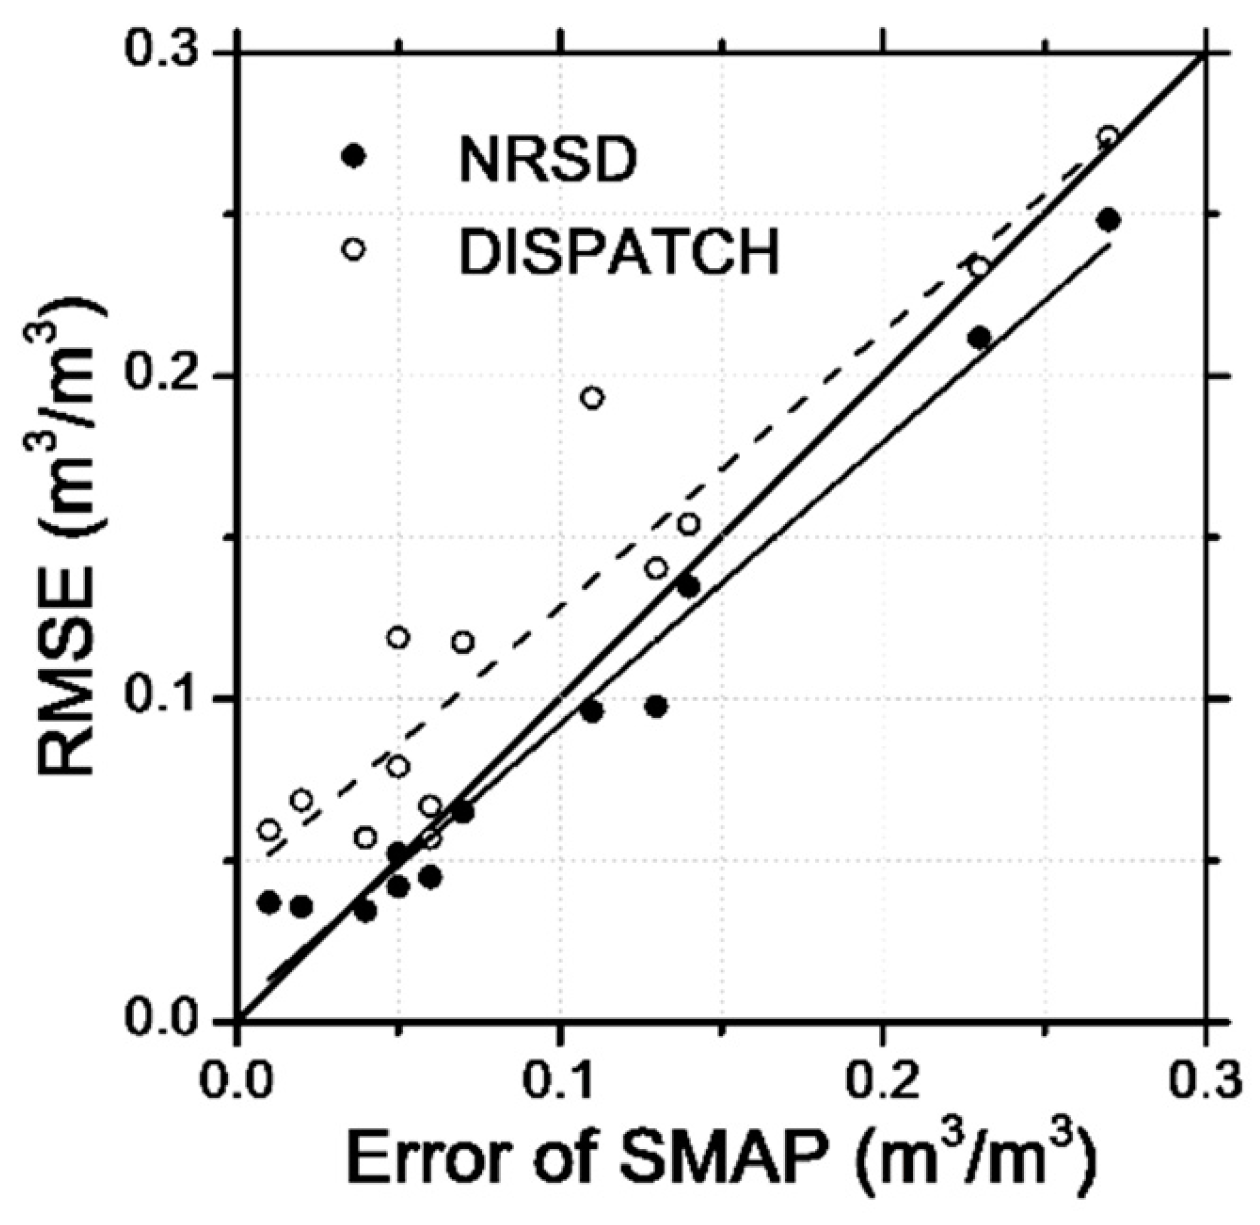
4.2. Error in SMAP Data

For a further analysis of error sources of the NRSD method, a study was conducted to discover the relationship between the NRSD error and the SMAP one. Figure 13 indicates significant linear correlations of either the NRSD or the DISPATCH error relative to the SMAP one. For DISPATCH, the correlation coefficient is 0.93, with a p-value = 0.01, and for NRSD, the correlation is even higher at 0.98, with a p-value = 0.01.
The results indicate that the error of downscaling methods mainly comes from SMAP soil moisture itself. The SMAP value could be easily understood as a key variable in the downscaling Equation (5), and compared to the error introduced by the SMAP value, the error introduced by the second term on the right-hand side of Equation (5) is relatively lower. Thus, an assumption is introduced here that the quality of SMAP soil moisture can directly impact the accuracy of the NRSD method.

5. Conclusions

To meet the requirement for regional hydrological and agricultural applications of soil moisture, an NIR-red spectra-based downscaling method (NRSD) was proposed in this paper, aiming to disaggregate SMAP soil moisture to a 250 m resolution. NRSD used the NSMI as a key variable to indicate the spatial variance of soil moisture within an SMAP pixel at 36 km resolution and yielded a rational result during SMAPEx-4/5. Validated with in situ measurements and the DISPATCH method, NRSD was evaluated to have a higher overall accuracy, better spatial representation and wider applicable scope on land cover, vegetation density and drought condition. Further discussions revealed that the NSMI is an alternative indicator for denoting the heterogeneity of soil moisture at sub-kilometer scales and performed better than SEE applied in DISPATCH. In conclusion, the NRSD method is of great potential to provide large-scale soil moisture mapping at 250 m resolution for hydrological and agricultural applications.
However, some limitations must be taken into considerations when applying the NRSD method. Regardless of its rational spatial representation, the variance of soil moisture within an SMAP pixel was overestimated. Besides, based on the validation, it was found that the poorer performance during the validation in September may be possibly due to the less effective NSMI under the high vegetation-covered situation and the higher error introduced by SMAP data.
Several studies can be suggested to further investigate the above limitations. The reason causing such overestimated variance can be studied by considering more heterogeneous and diverse scenarios with different spatial variances of soil moisture. The performance of NSMI under the high vegetation-covered condition can possibly be improved by considering the land surface temperature as an ancillary input to aid in extracting soil information based on the fine linear relationship between the NSMI and SEE. As another valuable global soil moisture product, the SMOS data are also suggested to be used for comparison with the error disaggregated with SMAP data. Besides, to find a more stable correlation with statistical significance between disaggregated soil moisture and the in situ one, expansion of the validation period to at least one year is suggested.

Acknowledgments

This work was supported by the Nature Science Foundation Innovation Group Project of Hubei Province, China (No. 2016CFA003), grants from the National High Technology Research and Development Program of China (863 Program) (No. 2013AA01A608) and the National Nature Science Foundation of China (NSFC) Program (No. 41301441). Xiang was supported by the China Scholarship Council (CSC) under the State Scholarship Fund to pursue his study at Purdue University (No. 201506270080). Data providers of the OzNet network are gratefully acknowledged.

Author Contributions

N.C., Y.H. conceived of and designed the study. Y.H. downloaded the data, carried out the downscaling method and performed the analysis. Y.H., X.Z. wrote the paper. N.C., Y.H. and X.Z. reviewed and edited the manuscript. All authors read and approved the manuscript.

Conflicts of Interest

The authors declare no conflict of interest.

References

  1. Kerr, Y.H.; Waldteufel, P.; Wigneron, J.P.; Martinuzzi, J.; Font, J.; Berger, M. Soil moisture retrieval from space: The soil moisture and ocean salinity (SMOS) mission. IEEE Trans. Geosci. Remote Sens. 2001, 39, 1729–1735. [Google Scholar] [CrossRef]
  2. Entekhabi, D.; Jackson, T.J.; Njoku, E.G.; Oneill, P.; Entin, J.K. Soil moisture active/passive (SMAP) mission concept. In Proceedings of the Society of Photographic Instrumentation Engineers Conference on Optical Engineering+ Applications, San Diego, CA, USA, 10–14 August 2008.
  3. Jackson, T.J.; Vine, D.M.L.; Hsu, A.Y.; Oldak, A.; Starks, P.J.; Swift, C.T.; Isham, J.; Haken, M. Soil moisture mapping at regional scales using microwave radiometry: The southern great plains hydrology experiment. IEEE Trans. Geosci. Remote Sens. 1999, 37, 2136–2151. [Google Scholar] [CrossRef]
  4. Cho, E.; Choi, M. Regional scale spatio-temporal variability of soil moisture and its relationship with meteorological factors over the Korean Peninsula. J. Hydrol. 2014, 516, 317–329. [Google Scholar] [CrossRef]
  5. Hasan, S.; Montzka, C.; Rüdiger, C.; Ali, M.; Bogena, H.R.; Vereecken, H. Soil moisture retrieval from airborne L-band passive microwave using high resolution multispectral data. ISPRS J. Photogramm. Remote Sens. 2014, 91, 59–71. [Google Scholar] [CrossRef]
  6. Orth, R.; Seneviratne, S.I. Using soil moisture forecasts for sub-seasonal summer temperature predictions in Europe. Clim. Dyn. 2014, 43, 3403–3418. [Google Scholar] [CrossRef]
  7. Huszar, T.; Mika, J.; Loczy, D.; Molnar, K.; Kertesz, A. Climate change and soil moisture: A case study. Phys. Chem. Earth Part A Solid Earth Géod. 1999, 24, 905–912. [Google Scholar] [CrossRef]
  8. Wang, A.; Lettenmaier, D.P.; Sheffield, J. Soil moisture drought in China, 1950–2006. J. Clim. 2011, 24, 3257–3271. [Google Scholar] [CrossRef]
  9. Van Steenbergen, N.; Willems, P. Increasing river flood preparedness by real-time warning based on wetness state conditions. J. Hydrol. 2013, 489, 227–237. [Google Scholar] [CrossRef]
  10. Das, N.; Entekhabi, D.; Njoku, E.G.; Shi, J.; Johnson, J.T.; Colliander, A. Tests of the SMAP combined radar and radiometer algorithm using airborne field campaign observations and simulated data. IEEE Trans. Geosci. Remote Sens. 2014, 52, 2018–2028. [Google Scholar] [CrossRef]
  11. Schaefer, G.L.; Cosh, M.H.; Jackson, T.J. The USDA natural resources conservation service soil climate analysis network (SCAN). J. Atmos. Ocean. Technol. 2007, 24, 2073–2077. [Google Scholar] [CrossRef]
  12. Blumberg, D.G.; Freilikher, V.D.; Lyalko, I.V.; Vulfson, L.D.; Kotlyar, A.L.; Shevchenko, V.N.; Ryabokonenko, A.D. Soil moisture (water-content) assessment by an airborne scatterometer: The Chernobyl disaster area and the Negev Desert. Remote Sens. Environ. 2000, 71, 309–319. [Google Scholar] [CrossRef]
  13. Panciera, R.; Walker, J.P.; Jackson, T.J.; Gray, D.A.; Tanase, M.A.; Ryu, D.; Monerris, A.; Yardley, H.; Rudiger, C.; Wu, X. The soil moisture active passive experiments (SMAPEx): Toward soil moisture retrieval from the SMAP mission. IEEE Trans. Geosci. Remote Sens. 2014, 52, 490–507. [Google Scholar] [CrossRef]
  14. Jackson, T.J.; Bindlish, R.; Cosh, M.H.; Zhao, T.; Starks, P.J.; Bosch, D.D.; Seyfried, M.S.; Moran, M.S.; Goodrich, D.C.; Kerr, Y.H. Validation of soil moisture and ocean salinity (SMOS) soil moisture over watershed networks in the U.S. IEEE Trans. Geosci. Remote Sens. 2012, 50, 1530–1543. [Google Scholar] [CrossRef] [Green Version]
  15. Chan, S.; Bindlish, R.; Oneill, P.E.; Njoku, E.G.; Jackson, T.J.; Colliander, A.; Chen, F.; Burgin, M.; Dunbar, S.; Piepmeier, J. Assessment of the SMAP passive soil moisture product. IEEE Trans. Geosci. Remote Sens. 2016, 54, 4994–5007. [Google Scholar] [CrossRef]
  16. Alyaari, A.; Wigneron, J.P.; Ducharne, A.; Kerr, Y.; De Rosnay, P.; De Jeu, R.A.M.; Govind, A.; Bitar, A.A.; Albergel, C.; Munozsabater, J. Global-scale evaluation of two satellite-based passive microwave soil moisture datasets (SMOS and AMSR-E) with respect to land data assimilation system estimates. Remote Sens. Environ. 2014, 149, 181–195. [Google Scholar] [CrossRef] [Green Version]
  17. Alyaari, A.; Wigneron, J.P.; Ducharne, A.; Kerr, Y.; Wagner, W.; De Lannoy, G.J.M.; Reichle, R.H.; Bitar, A.A.; Dorigo, W.; Richaume, P. Global-scale comparison of passive (SMOS) and active (ASCAT) satellite based microwave soil moisture retrievals with soil moisture simulations (MERRA-land). Remote Sens. Environ. 2014, 152, 614–626. [Google Scholar] [CrossRef] [Green Version]
  18. Kerr, Y.; Alyaari, A.; Rodriguezfernandez, N.J.; Parrens, M.; Molero, B.; Leroux, D.; Bircher, S.; Mahmoodi, A.; Mialon, A.; Richaume, P. Overview of SMOS performance in terms of global soil moisture monitoring after six years in operation. Remote Sens. Environ. 2016, 180, 40–63. [Google Scholar] [CrossRef]
  19. Piepmeier, J.R.; Johnson, J.T.; Mohammed, P.N.; Bradley, D.; Ruf, C.S.; Aksoy, M.; Garcia, R.J.; Hudson, D.; Miles, L.; Wong, M. Radio-frequency interference mitigation for the soil moisture active passive microwave radiometer. IEEE Trans. Geosci. Remote Sens. 2014, 52, 761–775. [Google Scholar] [CrossRef]
  20. Kim, G.; Barros, A.P. Space-time characterization of soil moisture from passive microwave remotely sensed imagery and ancillary data. Remote Sens. Environ. 2002, 81, 393–403. [Google Scholar] [CrossRef]
  21. Kim, G.; Barros, A.P. Downscaling of remotely sensed soil moisture with a modified fractal interpolation method using contraction mapping and ancillary data. Remote Sens. Environ. 2002, 83, 400–413. [Google Scholar] [CrossRef]
  22. Reichle, R.H.; Entekhabi, D.; Mclaughlin, D. Downscaling of radio brightness measurements for soil moisture estimation: A four-dimensional variational data assimilation approach. Water Resour. Res. 2001, 37, 2353–2364. [Google Scholar] [CrossRef]
  23. Das, N.; Entekhabi, D.; Njoku, E.G. An algorithm for merging SMAP radiometer and radar data for high-resolution soil-moisture retrieval. IEEE Trans. Geosci. Remote Sens. 2011, 49, 1504–1512. [Google Scholar] [CrossRef]
  24. Wu, X.; Walker, J.P.; Das, N.; Panciera, R.; Rudiger, C. Evaluation of the SMAP brightness temperature downscaling algorithm using active–passive microwave observations. Remote Sens. Environ. 2014, 155, 210–221. [Google Scholar] [CrossRef]
  25. Wu, X.; Walker, J.P.; Rudiger, C.; Panciera, R. Effect of land-cover type on the SMAP active/passive soil moisture downscaling algorithm performance. IEEE Geosci. Remote Sens. Lett. 2015, 12, 846–850. [Google Scholar]
  26. Merlin, O.; Bitar, A.A.; Walker, J.P.; Kerr, Y.H. A sequential model for disaggregating near-surface soil moisture observations using multi-resolution thermal sensors. Remote Sens. Environ. 2009, 113, 2275–2284. [Google Scholar] [CrossRef] [Green Version]
  27. Merlin, O.; Bitar, A.A.; Walker, J.P.; Kerr, Y.H. An improved algorithm for disaggregating microwave-derived soil moisture based on red, near-infrared and thermal-infrared data. Remote Sens. Environ. 2010, 114, 2305–2316. [Google Scholar] [CrossRef] [Green Version]
  28. Merlin, O.; Escorihuela, M.J.; Mayoral, M.A.; Hagolle, O.; Bitar, A.A.; Kerr, Y.H. Self-calibrated evaporation-based disaggregation of SMOS soil moisture: An evaluation study at 3 km and 100 m resolution in Catalunya, Spain. Remote Sens. Environ. 2013, 130, 25–38. [Google Scholar] [CrossRef] [Green Version]
  29. Merlin, O.; Rudiger, C.; Bitar, A.A.; Richaume, P.; Walker, J.P.; Kerr, Y.H. Disaggregation of SMOS soil moisture in southeastern Australia. IEEE Trans. Geosci. Remote Sens. 2012, 50, 1556–1571. [Google Scholar] [CrossRef] [Green Version]
  30. Molero, B.; Merlin, O.; Malbeteau, Y.; Bitar, A.A.; Cabot, F.; Stefan, V.; Kerr, Y.H.; Bacon, S.; Cosh, M.H.; Bindlish, R. SMOS disaggregated soil moisture product at 1 km resolution: Processor overview and first validation results. Remote Sens. Environ. 2016, 180, 361–376. [Google Scholar] [CrossRef]
  31. Kim, J.; Hogue, T.S. Improving spatial soil moisture representation through integration of AMSR-E and MODIS products. IEEE Trans. Geosci. Remote Sens. 2012, 50, 446–460. [Google Scholar] [CrossRef]
  32. Carlson, T.N.; Gillies, R.R.; Perry, E.M. A method to make use of thermal infrared temperature and NDVI measurements to infer surface soil water content and fractional vegetation cover. Remote Sens. Rev. 1994, 9, 161–173. [Google Scholar] [CrossRef]
  33. Carlson, T.N. An overview of the "triangle method" for estimating surface evapotranspiration and soil moisture from satellite imagery. Sensors 2007, 7, 1612–1629. [Google Scholar]
  34. Richardson, A.J.; Weigand, C. Distinguishing vegetation from soil background information. Photogramm. Eng. Remote Sens. 1977, 43, 1541–1552. [Google Scholar]
  35. Huete, A.R.; Jackson, R.D.; Post, D.F. Spectral response of a plant canopy with different soil backgrounds. Remote Sens. Environ. 1985, 17, 37–53. [Google Scholar] [CrossRef]
  36. Ghulam, A.; Qin, Q.; Zhan, Z. Designing of the perpendicular drought index. Environ. Earth Sci. 2006, 52, 1045–1052. [Google Scholar] [CrossRef]
  37. Abduwasit, G.; Qiming, Q.; Tashpolat, T.; Zhaoliang, L. Modified perpendicular drought index (MPDI): A real-time drought monitoring method. ISPRS J. Photogramm. Remote Sens. 2007, 62, 150–164. [Google Scholar]
  38. Amani, M.; Parsian, S.; Mirmazloumi, S.M.; Aieneh, O. Two new soil moisture indices based on the NIR-red triangle space of Landsat-8 data. Int. J. Appl. Earth Obs. Geoinform. 2016, 50, 176–186. [Google Scholar] [CrossRef]
  39. Smith, A.B.; Walker, J.P.; Western, A.W.; Young, R.; Ellett, K.M.; Pipunic, R.; Grayson, R.; Siriwardena, L.; Chiew, F.H.S.; Richter, H. The Murrumbidgee soil moisture monitoring network data set. Water Resour. Res. 2012, 48. [Google Scholar] [CrossRef]
  40. SMAPEx Project. Available online: www.smapex.monash.edu.au (accessed on 27 October 2016).
  41. NASA Distributed Active Archive Center at NSIDC. Available online: https://nsidc.org/daac/ (accessed on 27 October 2016).
  42. NASA Reverb. Available online: https://reverb.echo.nasa.gov (accessed on 27 October 2016).
  43. OzNet Hydrological Monitoring Network. Available online: www.oznet.org.au (accessed on 27 October 2016).
  44. Baret, F.; Clevers, J.G.P.W.; Steven, M.D. The robustness of canopy gap fraction estimates from red and near-infrared reflectances : A comparison of approaches. Remote Sens. Environ. 1995, 54, 141–151. [Google Scholar] [CrossRef]
  45. Huete, A.R.; Post, D.F.; Jackson, R.D. Soil spectral effects on 4-space vegetation discrimination. Remote Sens. Environ. 1984, 15, 155–165. [Google Scholar] [CrossRef]
  46. Galvao, L.S.; Vitorello, I. Variability of laboratory measured soil lines of soils from southeastern Brazil. Remote Sens. Environ. 1998, 63, 166–181. [Google Scholar] [CrossRef]
  47. Baret, F.; Jacquemoud, S.; Hanocq, J.F. The soil line concept in remote sensing. Remote Sens. Rev. 1993, 7, 65–82. [Google Scholar] [CrossRef]
  48. Yoshioka, H.; Miura, T.; Dematte, J.A.M.; Batchily, K.; Huete, A.R. Soil line influences on two-band vegetation indices and vegetation isolines: A numerical study. Remote Sens. 2010, 2, 545–561. [Google Scholar] [CrossRef]
  49. Amani, M.; Mobasheri, M.R. A parametric method for estimation of leaf area index using Landsat ETM+ data. Gisci. Remote Sens. 2015, 52, 478–497. [Google Scholar] [CrossRef]
  50. Moran, M.S.; Clarke, T.R.; Inoue, Y.; Vidal, A. Estimating crop water deficit using the relation between surface-air temperature and spectral vegetation index. Remote Sens. Environ. 1994, 49, 246–263. [Google Scholar] [CrossRef]
  51. Noilhan, J.; Planton, S. A simple parameterization of land surface processes for meteorological models. Mon. Weather Rev. 1989, 117, 536–549. [Google Scholar] [CrossRef]
Figure 1. Location and land use of study area mapped with Equal-Area Scalable Earth (EASE) Grid-2 projection. Yanco A (YA) and Yanco B (YB) are the two primary 9 × 9 km2 study zones [40].
Remotesensing 09 00051 g001
Figure 2. Algorithm flow of the NIR-red spectra-based disaggregation (NRSD) method.
Remotesensing 09 00051 g002
Figure 3. (a) A typical NIR-red spectral feature space built by the MOD09GQ reflectance data. (b) Construction of the NSMI based on the NIR-red spectral feature space.
Remotesensing 09 00051 g003
Figure 4. Extraction of variance conversion factor. Black dotted data are SMAP soil moisture relative to the NSMI at 36 km resolution, among which SMAP values exceeding 0.25 m3/m3 are emphasized in gray. Hollow circles are in situ soil moisture with respect to the NSMI aggregated at the 36 × 36 km2 scale. It should be noted that the study used SMAP soil moisture and NSMI for extracting the variance conversion factor and used the OzNet in situ soil moisture network for ancillary validation of such a relationship.
Remotesensing 09 00051 g004
Figure 5. (an) Disaggregated soil moisture at 250 m resolution. Missing pixels were set to white due to the fully cloud-covered condition.
Remotesensing 09 00051 g005
Figure 6. (am) Validation of the NRSD method. Black dotted data represent NRSD-derived soil moisture, and hollow circles represent disaggregation based on physical and theoretical scale change (DISPATCH)-derived soil moisture at 1 km resolution. The black line denotes the 1:1 line, and the gray line denotes the SMAP soil moisture at 36 km resolution.
Remotesensing 09 00051 g006
Figure 7. Variance of disaggregated soil moisture versus variance of in situ soil moisture. The bold solid line denotes the 1:1 line, and the dashed line denotes the linear trend of the variance of NRSD soil moisture relating to the in situ trends. DOY 256 (gray point in the figure) was forcibly excluded from fitting for its abnormality because more ancillary meteorological data are required to study that variable.
Remotesensing 09 00051 g007
Figure 8. Error of NRSD and DISPATCH in different land covers. Zone YA represents the cropping area, and Zone YB represents the grazing area: (a) RMSE of NRSD and (b) DISPATCH. Please note the vertical dashed line distinguishes between validation in May and September.
Remotesensing 09 00051 g008
Figure 9. Error analysis by running NRSD and DISPATCH in various densities of vegetation condition. Five percent represents that all disaggregated soil moistures with vegetation fraction from zero to 10% were considered, and the rest can be done in the same manner.
Remotesensing 09 00051 g009
Figure 10. Error analysis in various drought conditions. Five-point-five percent represents that all disaggregated soil moistures with in situ measurements from 5% to 6% were considered, and the rest can be done in the same manner.
Remotesensing 09 00051 g010
Figure 11. (ar) Daily validation of the NSMI at 250 m resolution using in situ soil moisture measurements. The dashed line represents the linear fit line of in situ soil moisture related to the NSMI. Instead of the NRSD validation work, the NSMI was compared with in situ soil moisture at 10:30 a.m., which is synchronous with the MODIS Terra observation. Please note that the experiment on 16 September was excluded because all available in situ sites were within fully cloud-covered areas. Due to the cloud condition, also note that only one single in situ site was available on 18 May (DOY 138).
Remotesensing 09 00051 g011
Figure 12. (a,b) Relationships of SMAP soil moisture and the NSMI related to soil evaporation efficiency (SEE).
Remotesensing 09 00051 g012
Figure 13. Error analysis by distinguishing downscaling error from SMAP error. The bold diagonal line represents the 1:1 line; the other solid line represents the linear fit of the NRSD error with respect to the SMAP error; and the dashed line represents the linear fit of the DISPATCH error with respect to the SMAP error.
Remotesensing 09 00051 g013
Table 1. Data collection.
Overpass Day 1DOY 2Cloud Condition 3MODIS Data Input 4Overpass DayDOYCloud ConditionMODIS Data Input
2 May1218 September250XX
122XX251XX
123252
5 May12410 September252
125XX253XX
126254
8 May12813 September256
16 May13516 September259
136XX18 September261
13721 September263
18 May137264XX
138265
139XX23 September266
21 May140XX26 September268
141XX269XX
142270
1 It is noted that some overpass days (10 May, 11 May, 19 May) were omitted because neither day close to them (within ± 1 day) satisfied the required cloud condition. Also note that SMAP data on 13 May are unavailable and therefore not listed here. 2 DOY represents day of year. 3 For cloud condition, √ represents cloud-free or partially-covered condition, and X represents fully-covered condition. 4 For MODIS data input, √ represents data on this day was collected, and X represents data on this day was excluded.
Table 2. Validation of NRSD-disaggregated soil moisture compared to DISPATCH-disaggregated, SMAP and in situ soil moisture.
Overpass DayNOIS 1NRSDDISPATCHSMAP
RMSEBiasbVarianceRpRMSEBiasbVarianceRpRMSEBias
2 May110.040.010.33–0.60.080.070.053.070.330.330.02–0.01
5 May150.03–0.011.87–0.30.220.060.014.43–0.30.350.04–0.03
8 May180.040.011.39–0.40.150.060.043.130.250.310.01–0.01
16 May180.040.031.41–0.30.220.060.033.240.050.830.060.05
18 May140.040.022.01–0.30.230.080.054.7–0.10.950.050.05
21 May180.060.052.640.330.180.110.112.550.720.010.070.07
8 September210.240.242.49–0.10.620.270.27-010.270.26
10 September220.210.202.190.100.980.230.230.030.110.610.230.22
13 September150.130.124.370.020.950.150.142.92–0.30.300.140.14
16 September0------------
18 September150.090.092.640.340.210.140.123.95–0.10.720.130.13
21 September190.050.040.78–0.50.010.070.062.08–0.30.220.060.05
23 September100.090.082.680.150.670.190.175.39–0.10.760.110.10
26 September180.050.032.09–0.20.550.120.111.52–0.30.280.050.05
MeanMay0.040.021.61--0.070.053.52--0.040.02
September0.120.112.46--0.170.162.65--0.140.14
1 NOIS represents the number of in situ sites used for validation on each overpass day; besides, bVariances, R- and p-value are not calculated here for SMAPbecause SMAP soil moisture is single within Yanco on each overpass day. It should be noted that the validation on 16 September is unavailable due to the cloud condition.
Table 3. Validation results regarding the NSMI. Relevant slope and p-values are reported in bold when R-value > 0.3.
DOYSMAP Soil MoistureNSMI36kmNumber of In Situ SitesR-ValueSlopep-Value
1210.100.6580.110.030.79
1230.100.6090.550.190.12
1240.090.6840.400.130.60
1260.090.69140.010.010.97
1280.070.64170.310.130.21
1350.110.67110.670.090.02
1370.110.63110.700.120.01
1380.120.571---
1420.160.68180.400.060.10
2520.320.79170.310.050.25
2540.280.81160.150.070.59
2560.230.80150.040.030.89
2590.190.810---
2610.160.79170.250.070.35
2630.160.8619−0.1−0.040.75
2650.160.86100.300.110.43
2660.150.7712−0.1−0.030.81
2680.120.7315−0.5−0.140.05
2700.120.75180.310.100.20

