Article

Characterization of Active Layer Thickening Rate over the Northern Qinghai-Tibetan Plateau Permafrost Region Using ALOS Interferometric Synthetic Aperture Radar Data, 2007–2009

1
Division of Geodetic Science, School of Earth Science, Ohio State University, Columbus, OH 43210, USA
2
Roy M. Huffington Department of Earth Sciences, Southern Methodist University, Dallas, TX 75275, USA
3
State Key Laboratory of Geodesy and Earth’s Dynamics, Institute of Geodesy and Geophysics, Chinese Academy of Sciences, Wuhan 430077, China
4
Department of Land Surveying and Geo-Informatics, Hong Kong Polytechnic University, Hong Kong, China
5
Department of Civil Engineering, Marmara University, 34722 Istanbul, Turkey
6
Department of Geomatics, National Cheng Kung University, 70101 Tainan, Taiwan
7
Center for Space and Remote Sensing Research, National Central University, 32001 Taoyuan, Taiwan
*
Author to whom correspondence should be addressed.
Remote Sens. 2017, 9(1), 84; https://doi.org/10.3390/rs9010084
Submission received: 2 April 2016 / Revised: 3 January 2017 / Accepted: 10 January 2017 / Published: 17 January 2017
(This article belongs to the Special Issue Remote Sensing in Tibet and Siberia)

Abstract

:
The Qinghai-Tibetan plateau (QTP), also known as the Third Pole and the World Water Tower, is the largest and highest plateau with distinct and competing surface and subsurface processes. It is covered by a large layer of discontinuous and sporadic alpine permafrost which has degraded 10% during the past few decades. The average active layer thickness (ALT) increase rate is approximately 7.5 cm·yr−1 from 1995 to 2007, based on soil temperature measurements from 10 borehole sites along Qinghai-Tibetan Highway, and approximately 6.3 cm·yr−1, 2006–2010, using soil temperature profiles for 27 monitoring sites along Qinghai-Tibetan railway. In this study, we estimated the ALT and its AL thickening rate in the northern QTP near the railway using ALOS PALSAR L-band small baseline subset interferometric synthetic aperture radar (SBAS-InSAR) data observed land subsidence and the corresponding ALT modeling. The InSAR estimated ALT and AL thickening rate were validated with ground-based observations from the borehole site WD4 within our study region, indicating excellent agreement. We concluded that we have generated high spatial resolution (30 m) and spatially-varying ALT and AL thickening rates, 2007–2009, over approximately an area of 150 km2 of permafrost-covered region in the northern QTP.

Graphical Abstract

1. Introduction

Permafrost is defined as the perennially frozen soil that remains at or below the freezing point of water for at least two years [1]. The permafrost regions occupy approximately 24% (~23 × 106 km2) of the exposed land area in the Northern Hemisphere terrestrial region [2]. Permafrost is usually found in high latitude terrains, i.e., Alaska, Siberia (Russian Arctic region), and the North American continent, while the Qinghai-Tibetan plateau (QTP) region is classified as the high-altitude discontinuous permafrost, where the average altitude exceeds 5000 m and winter temperatures can drop to −40 °C.
Overlying the permafrost is the active layer (AL), which is the top layer of soil or other Earth materials that are subject to seasonal thawing during summer and freezing again during autumn. The AL plays an important role in the surface energy balance, carbon exchange, ecosystem, hydrological cycle, and landscape process in cold regions. The AL thickness (ALT), the thaw depth in permafrost regions due to solar heating of the surface, is extremely sensitive to climate change. It varies due to air temperature, the amplitude of ground surface temperature, the duration of summer, the thickness and thermal properties of alpine vegetation, and the snow cover, etc. [3]. It has been widely accepted that the amount of ice/frozen grounds on Earth is decreasing [4,5]. There is distinct evidence of permafrost thawing worldwide. The permafrost temperature in Northern Alaska has increased by 2–3 °C since the 1980s [6,7]. In the Russian Arctic region, the permafrost temperature increased about 1–2 °C during the last few decades [8]. On the QTP, the temperature of permafrost along the Qinghai-Tibetan highway (QTH) has been monitored from 1996 to 2006 with an average increase of about 0.43 °C during the past decades and the mean rate of permafrost temperature rise was approximately 0.02 °C·yr−1 from 2006 to 2010 along the Qinghai-Tibetan railway (QTR) [9,10,11]. Global warming and the subsequent rise in the geothermal gradient have caused the top of the permafrost layer to undergo secular degradation. The thawing of permafrost in QTP is more severe compared to other high latitude permafrost regions because the rate of warming is two times faster in QTP than elsewhere on Earth [12]. Prior studies have shown that during the past few decades, about 10% of permafrost has degraded over the QTP [13].
Traditional methods for measuring the long-term differences in ALT rely on ground-based field surveys, which are extremely labor-intensive and time-consuming. The measurements include mechanical probing [14], soil temperature monitoring [9,10,11], and frost or thaw tubes [15,16,17]. Based on a one-dimensional heat conduction model with phase change, Oelke and Zhang [18] estimated that the QTP ALT was thickening at a rate of approximately 1.4 cm·yr−1 from 1980 to 2001, with a larger rate, approximately 4 cm·yr−1, occurring in the northern QTP. Although these methods provide a good quality of data and information at a single site, or over a grid region with a scale up to 1 km2, these measurements have limited spatial coverage and temporal resolution. The mass variations of permafrost induced by seasonal thawing and refreezing cause a cycle of surface uplift and subsidence; thus, the surface deformation measurements can serve as another approach to detect the changes of permafrost [19,20,21].
In recent years the synthetic aperture radar interferometry (InSAR) technique has been widely used to monitor vertical surface displacement caused by freezing and thawing process of the AL in permafrost regions, since it is able to sense surface deformation with several mm accuracy over 100 km wide swath, which makes it a promising tool to map the ALT and its changes [5,19,20,21,22,23,24,25]. Liu et al. [19] used InSAR-derived surface displacements to estimate ALT in the North Slope of Alaska. They fitted the InSAR observations during the thaw season by using a model that contains both a secular term and seasonal term with assumptions that the seasonal subsidence is proportional to the square root of the accumulated degree days of thaw (ADDT; °C days) to calculate the seasonal subsidence. Then they introduced a model, which was based on the vertical distribution of pore water within the AL, to convert thaw-season surface subsidence derived from InSAR measurements to ALT. This method was further validated by comparing InSAR-inferred ALT to ground penetrating radar (GPR) measurements of ALT around Barrow, Alaska [21]. Li et al. [25] proposed a new approach to estimate high-resolution ALT based on InSAR measurements and tested the methodology over a study region in the southern QTP. They introduced a sinusoidal model incorporating both long-term and seasonal deformations to calculate the amplitude of seasonal oscillations. Then they estimated ALT by exploiting the time lags between the periodic curves of InSAR observations and meteorologically-recorded temperatures, and the one-dimensional heat transfer model of soils. These studies demonstrated that InSAR can provide ALT estimates over large areas with a high spatial resolution of tens of meters [19,21,25]. In this paper, based on the models by Li et al. and Liu et al., we developed an approach to calculate the ALT and AL thickening rate over the study region along the QTR.

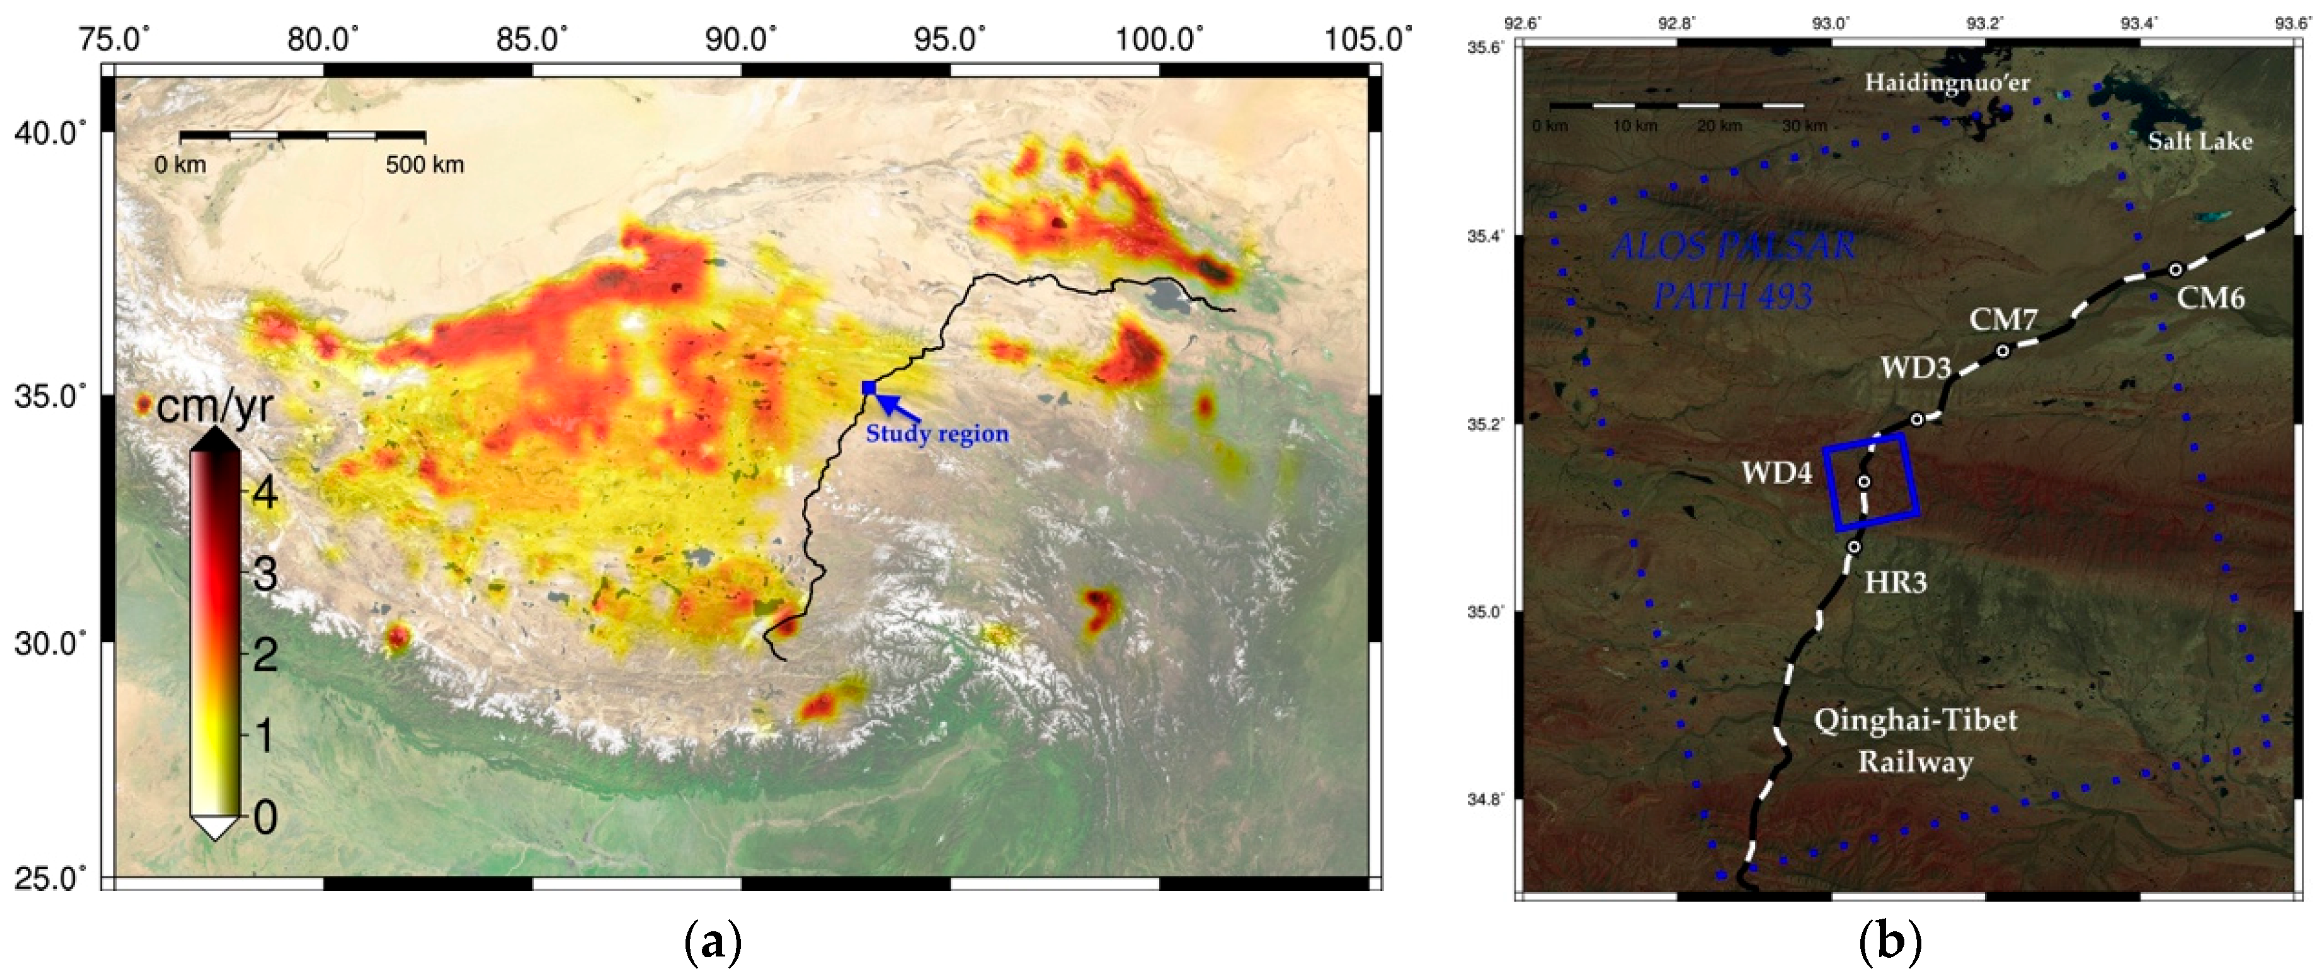
2. Study Region and Data

The QTR (black line in Figure 1a) is a high-elevation railway that connects Xining, Qinghai Province, to Lhasa, Tibet Autonomous Region, in the People’s Republic of China. The length of the railway is 1956 km with more than 25% of the railway (~550 km) laid on the sporadic and discontinuous permafrost, and the railway is exposed to seasonal and possible long-term vertical displacements (uplift or subsidence) which are driven by permafrost thawing and refreezing processes. The surface subsidence occurring during the thawing season is mainly because of the volume decrease in permafrost regions as the ice in the active layer melted and became liquid water. The volume expands when the inverse process of thaw settlement occurs, which means the water froze to ice. The secular surface subsidence is likely due to thawing of ice-rich permafrost directly beneath the active layer. Thawing of ice-rich permafrost near the permafrost table offers a possible explanation for the secular surface subsidence. The QTH, the portion of China National Highway 109 from Xining to Lhasa, parallel to the QTR and built on top of the permafrost, is also potentially at risk, depending on AL thickening rate at present and in the near future.
The overall mean ALT increase rate over the QTP was 1.4 cm·yr−1, 1980–2001 [18] based on a model study (background of Figure 1a). According to ground-based observations, the ALT on the QTP has increased by ~1 m along the QTH since the early 1980s. The AL thickening rate was about 7.5 cm·yr−1, from 1995 to 2007, based on the soil temperature (ST) measurements from 10 borehole sites along the QTH and approximately 6.3 cm·yr−1, from 2006 to 2010, according to ST profiles of 27 monitoring sites along the QTR [9,10,11]. Those borehole sites are approximately 30–80 m away from the centerline of the embankment of the QTR. All of the old sites are relatively shallow, usually approximately 6–8 m in depth, while the borehole depth in the new monitoring network is greater than 15 m [11]. ALT was estimated through linear interpolation of ST profiles and the rate of change in ALT for each site was estimated using linear regression with p < 0.05 [10,11].
Figure 1b shows the study area (blue solid rectangle) using L-band ALOS PALSAR data to measure land subsidence due to thawing permafrost. We noticed that there is a new monitoring site with an observation period from 2006 to 2010, WD4 (longitude: 93.0420°E, latitude: 35.1384°N), within our study area [11], and we know that the time span of ALOS-1 data is from 2006 to 2011. So, in order to validate our methodology and result, we used the observations of this borehole site for validation. The rate of ALT change was 5.0 cm·yr−1 and the mean ALT at this point was 0.92 m, from 2006 to 2010 [11].
We combined 10 Japan Aerospace Exploration Agency’s (JAXA’s) Advanced Land Observing Satellite (ALOS) mission acquired Phased Array type L-band Synthetic Aperture Radar (PALSAR) Fine Beam (FB) mode scenes (Table 1) to cover our study region. All of the PALSAR scenes used in this study are all horizontal-transmit and horizontal-receive (HH) polarized with incidence angles approximately at 38.7°, and acquired during both thawing and refreezing seasons of the permafrost study region over the Tibetan Plateau.

3. Data Processing and Methodology

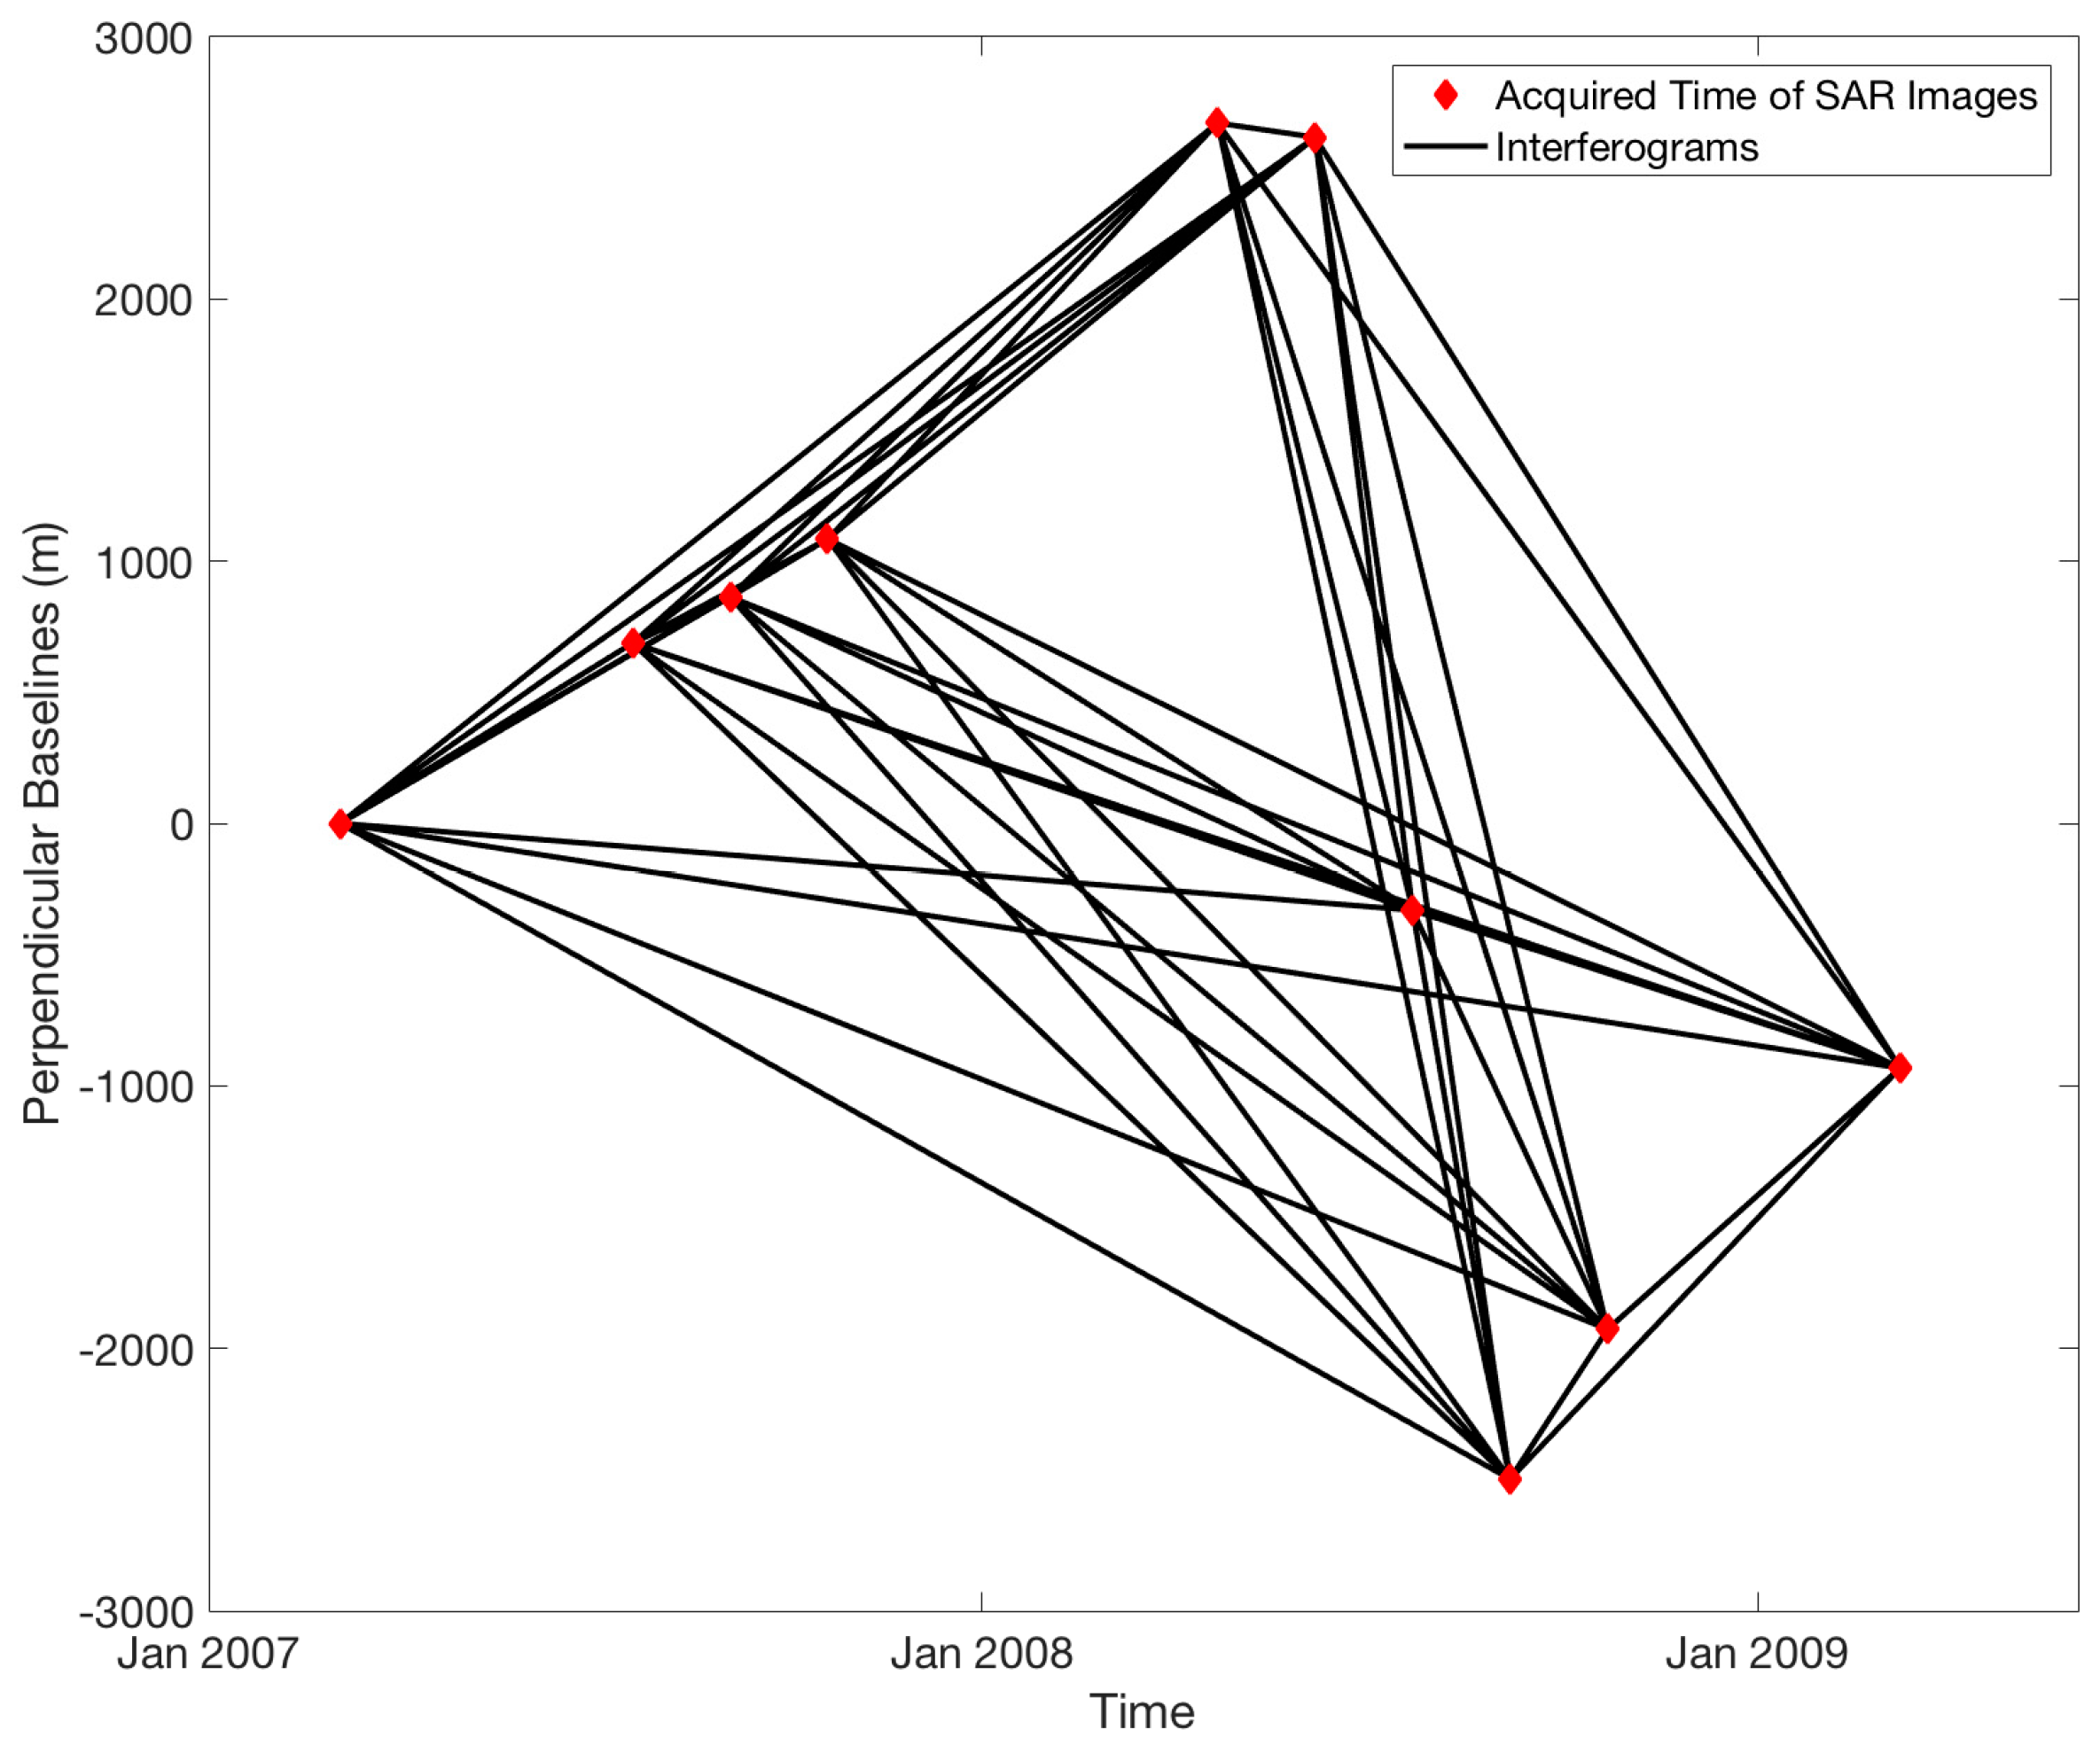
3.1. InSAR Processing

Repeat-pass InSAR is a geodetic imaging technique for measuring ground-surface deformation using two or more SAR scenes separated by a baseline in space and with time intervals spanned by the image acquisitions of the same area at the Earth’s surface. These scenes are collected from an orbiting satellite carrying the SAR instrument. Unlike optical and infrared waves, radar signals can penetrate water clouds and diffuse clouds owing to their longer radar wavelength. SAR sensors, Envisat C-band Advanced SAR (ASAR) has a 5.6 cm wavelength, ALOS-1/-2 L-band PALSAR has 23.6 cm wavelength, and X-band TerraSAR-X has 3 cm wavelength, are able to capture minute land deformations at several mm precision. Comparing with C-/X-band SAR imageries with shorter wavelengths, L-band imageries usually maintain high interferometer coherence, which can improve measurement accuracy [26].
In this study, we utilized the small baseline subset interferometry technique (SBAS-InSAR), which can reduce the errors caused by the spatial and temporal decorrelation and L-band SAR scenes acquired by the JAXA’s ALOS satellite to investigate the surface deformation of the study region. Before performing SBAS InSAR processing, a standard two-pass differential InSAR (DInSAR) method was applied to process the formed interferometric pairs and to generate differential interferograms. The phase difference between two SAR scenes ( ϕ t 1 , t 2 ), called interferograms, can be expressed as the summation of five terms: phase difference from displacement ( ϕ disp ), topographic phase ( ϕ topo ), an atmospheric phase ( ϕ atmo ), a baseline error phase ( ϕ baseline ), and a noise phase ( ϕ noise ). To acquire ϕ disp , the other four components have to be removed, which is called DInSAR processing. The ϕ topo was simulated from digital elevation model (DEM) data and removed from the observed interferometric phase. In this study, we used the Shuttle Radar Topography Mission (SRTM) DEM data with a 30 m (1 arc-second) grid to remove the topographic phase. In each of the interferograms, the ϕ baseline is shown as 1st- or 2nd-order polynomials, and a least squares adjustment is used to remove residual phases. The component of the ϕ topo term is composed of turbulent mixing and vertical stratification contributions [26]. We used a linear regression between elevation and the phase components of vertical stratification to reduce this phase term, since the vertical stratification is expressed as a linearly variant fringe proportional to elevation. Since the turbulent mixing term is a random phase of interferograms in time and space, the temporal and spatial smoothing filters are used to reduce the turbulent mixing, and the last phase term from noise was suppressed by adaptive filtering [27].
After we removed or reduced the other four phase terms, the remaining phase is the interferometric phase caused by ground deformation. However, this interferometric phase from the differential interferogram is a wrapped phase or modulo 2π phase value, so it is necessary to unwrap the phase to reconstruct the actual phase from the wrapped phase. A minimum cost flow (MCF) phase unwrapping technique [28] was used for unwrapping the phase corresponding to the land deformation in this study. Then, the traditional SBAS-InSAR technique and the unwrapped interferometric phase were used to generate the deformation time series corresponding to SAR scenes with the first acquired SAR scene as a reference. The key feature of SBAS-InSAR is that it can effectively reduce the random atmospheric phase from many InSAR pairs [29]. We calculated the residual interferograms by subtracting the modeled low-pass (LP) component from the original interferograms, and applied a spatial and temporal filtering to separate the possible atmospheric artifacts. In the analysis, a total of 10 ascending PALSAR images (path 493), spanning from March 2007 to March 2009, were included and the first SAR scene at 4 March 2007 was used as reference in the SBAS-InSAR processing. The spatial coverage of the PALSAR scenes is shown in Figure 1b. These SAR scenes were used to produce 45 interferograms with temporal baseline smaller than 750 days and spatial baseline smaller than 3000 m. The interferogram network (Figure 2) shows that all of the InSAR pairs are in one subset.

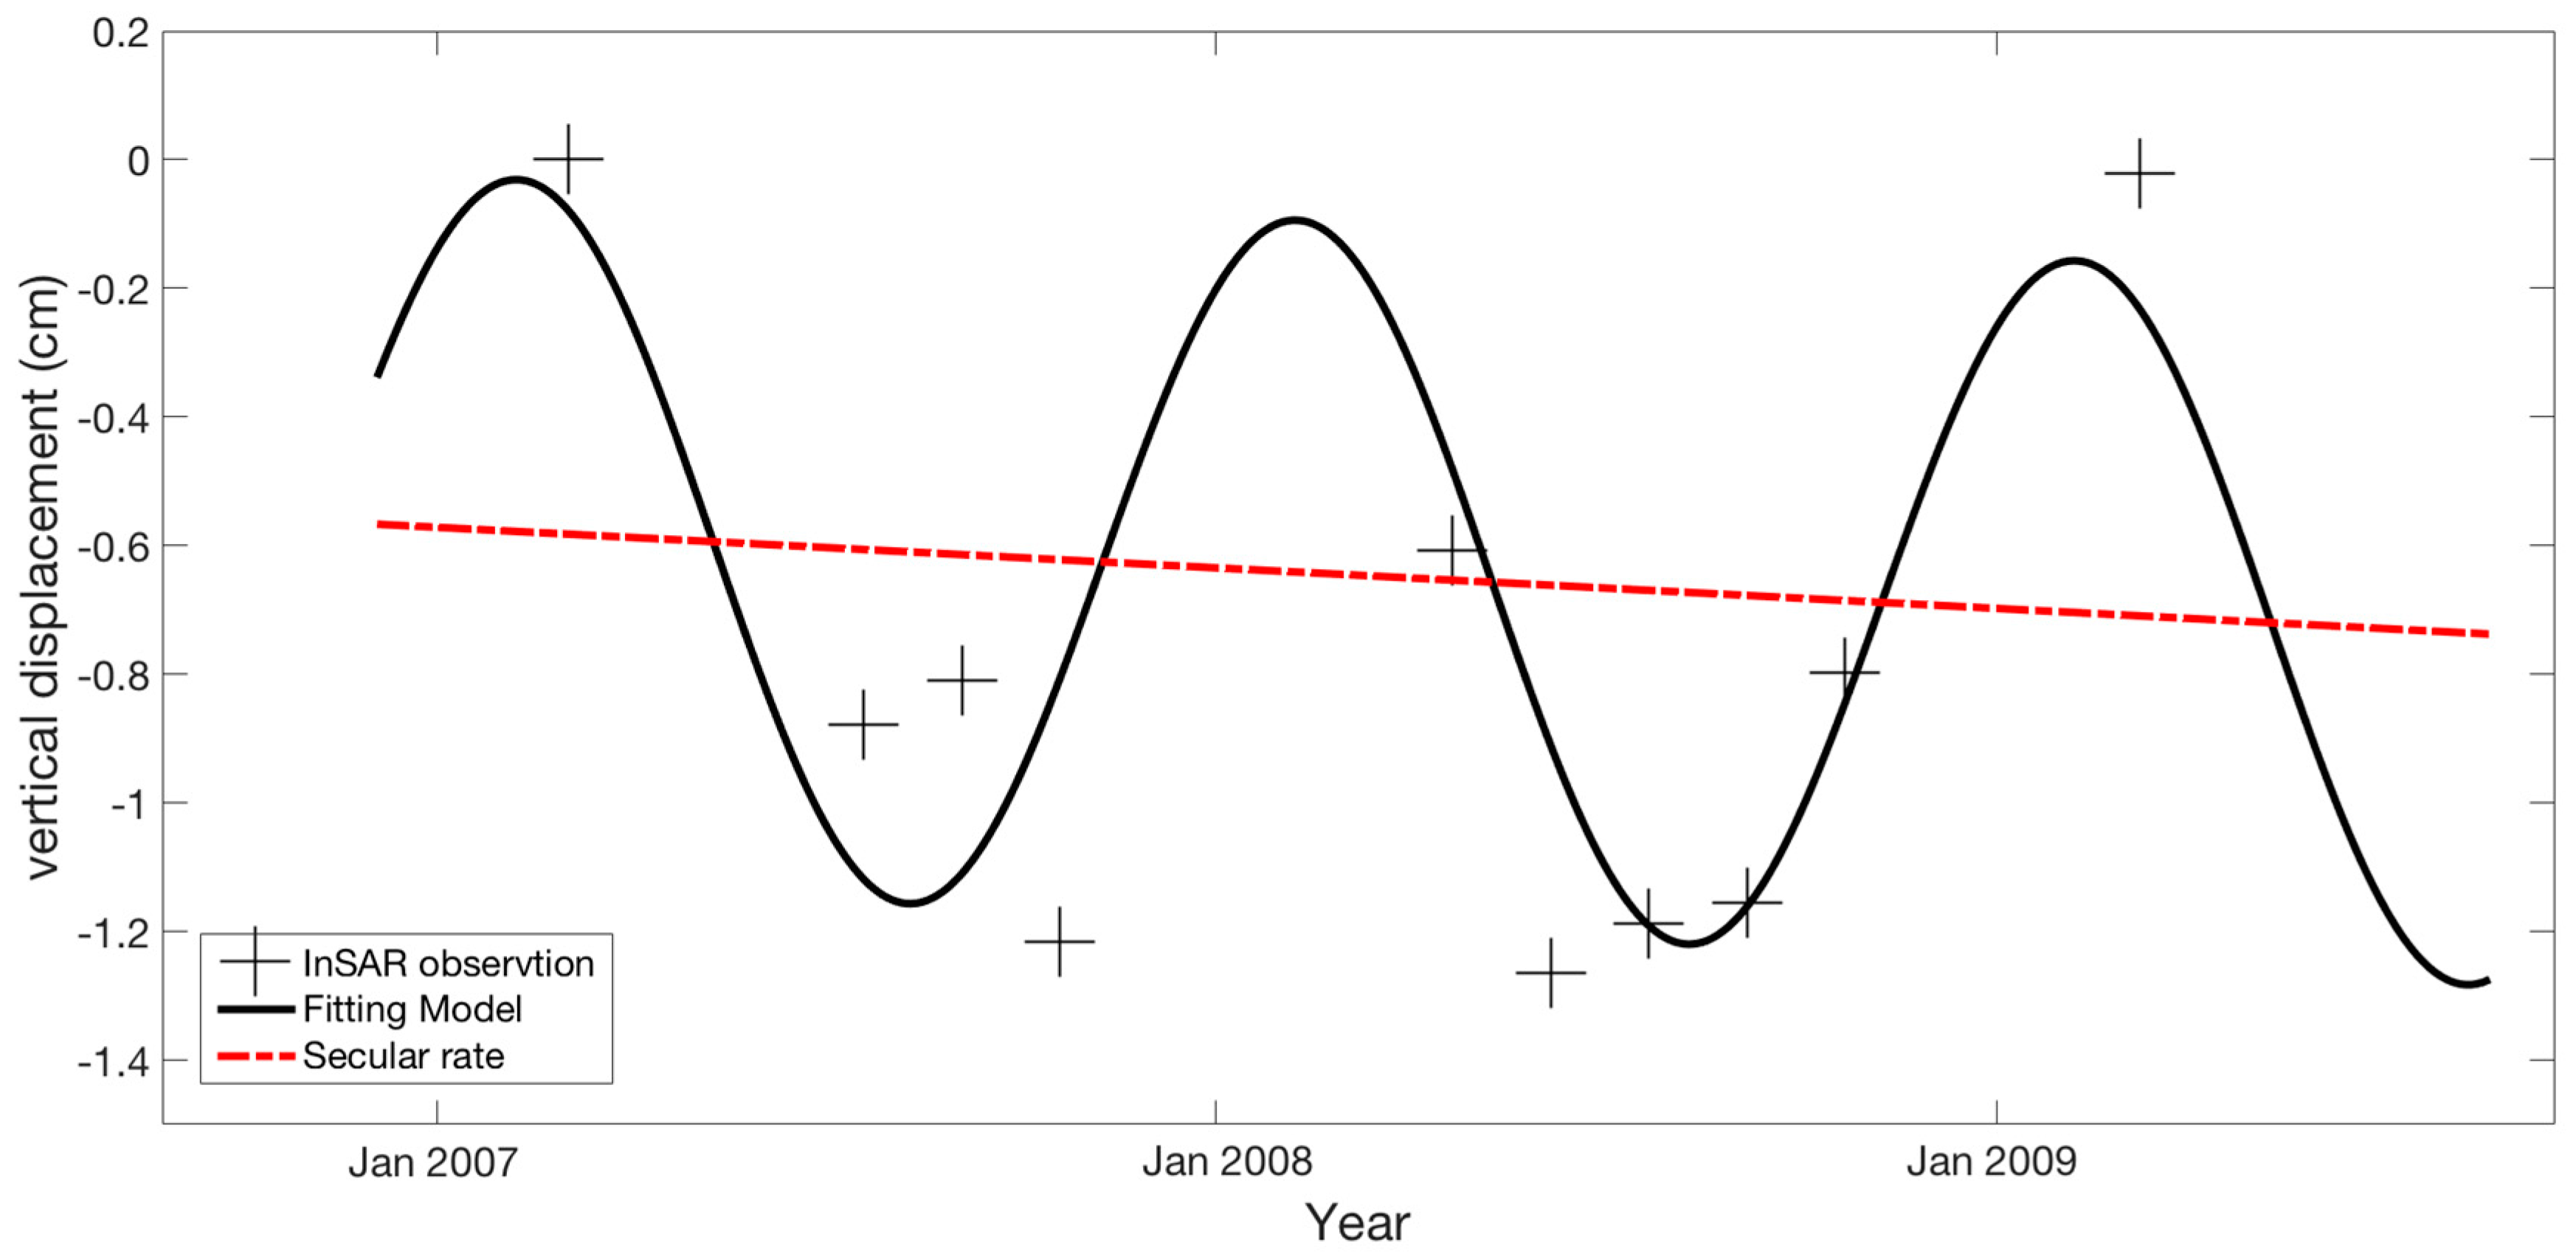
3.2. Models of InSAR Observations and Time Series of Surface Deformation

As the surface deformation in the permafrost area exhibits characteristics of both long-term linear deformation and seasonal undulation [25], the observed vertical displacement from SBAS-InSAR (D) between two observation dates t1 and t2 is modeled as the summation of a secular term and seasonal terms:
D = R × t + a 1 + a 2 × sin ( 2 π T × t ) + a 3 × cos ( 2 π T × t ) + e
where D is the InSAR observed displacement with respect to the reference SAR image (subsidence or uplift, units: centimeters); t is the time interval between two SAR scenes (t1 and t2); and T is the period of the seasonal undulations (assuming to be one year in this study). R is the linear subsidence rate from SBAS-InSAR result (units: centimeters per year). a 1 , a 2 , a 3 are estimated parameters and 2 × a 2 2 + a 3 2 is the peak-to-peak amplitude of seasonal oscillations (units: centimeters). The last term, e , is the residual between the observation and the fitted model. We hypothesized that the observed secular subsidence is due to the thawing of ice-rich permafrost directly beneath the active layer and the AL thickening can cause the secular subsidence. We estimated a 1 , a 2 , and a 3 for each pixel from the set of interferograms by finding the least-squares solution to a linear system of equations:
[ D 1 D N ] [ R 1 × t 1 R N × t N ] = [ 1 s i n ( 2 π T × t 1 ) c o s ( 2 π T × t 1 ) 1 s i n ( 2 π T × t N ) c o s ( 2 π T × t N ) ]
where N is the number of SBAS-InSAR observations.

3.3. Converting Surface Displacement to ALT Changes
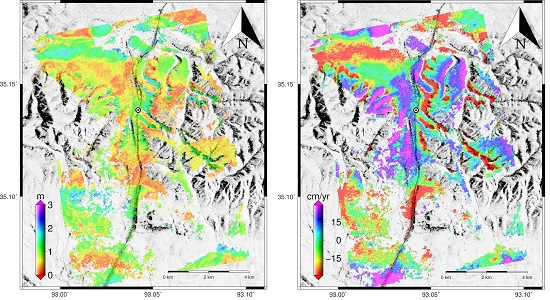
Zhang et al. [2] reported that the permafrost in the QTP is either discontinuous (50%–90% coverage; mainly the northern half of the permafrost region), or sporadic (10%–50% coverage; mainly the southern half of the region). Due to the discontinuous or sporadic distribution of the permafrost, laterally averaged values of removal rates are expected to be correspondingly smaller. In addition, rock beds usually bear about 10%–20% pore spaces filled with ice [2,30]. Assuming that the surface subsidence is caused purely by the volume change of pore ice to water in the AL, then the model that is used to calculate ALT from InSAR observed surface subsidence is [19]:
H = ρ i P × S ( ρ w ρ i ) h
where h = 2 × a 2 2 + a 3 2 is the peak-to-peak amplitude of seasonal oscillations (units: meters), P is the soil porosity, S is the soil moisture fraction of saturation, ρ i and ρ w are the density of ice and water, respectively (units: kilograms per cubic meter), and H is the ALT (units: meters). Here we assumed saturated soil ( S = 1.0 ) in the frozen portion of the AL in our study region, and used P = 15 % , an average of 10% and 20%, for porosity.
We assumed that the linear deformation velocity is possibly the result of thawing of permafrost directly beneath the AL, and then we related the AL thickening rate ( R ALT , units: centimeters per year) and secular surface subsidence rate from SBAS-InSAR (R, units: centimeters per year) as:
R ALT = ρ i P × S ( ρ w ρ i ) R
where the surface displacement rate from SBAS-InSAR is R, the AL thickening rate is RALT, the other parameters are the same as described in Equation (3).

4. Results

We applied the SBAS-InSAR technique, which is described in Section 3, to monitor the secular land surface deformation along the QTR in the northern QTP. The total time series deformation of the study area is presented in Figure 3, where the positive displacement means surface uplift, while negative displacement means ground subsidence. As shown in these figures, the relative vertical surface displacements over the QTP study region of borehole site WD4 are observed by SAR scenes acquired from 2007 to 2009 using the SBAS-InSAR technique, depicting thaw-inferred subsidence, uplift by frost heave, or annual subsidence due to the active layer depth change. We found that the surface deformation in the frozen soil area was characterized by a cycle in each year, which means that subsidence (thaw settlement) and uplift (frost heave) occurred alternately within one year. The land surface subsided significantly from July to October and uplifted from November to March in the next year. The maximal seasonal settlement in summer and uplift in winter were nearly 2 cm, with the reference epoch at 4 March 2007.
Figure 4 shows the peak-to-peak amplitude seasonal surface displacement h = 2 × a 2 2 + a 3 2 , where a 2 and a 3 were estimated using Equation (2), and the surface deformation rate over our study region from SBAS-InSAR results during 2007–2009. The areas in gray are areas with decorrelation problems, which are mainly due to temporal changes in the dielectric characteristics of surface scatters (e.g., related to vegetation growth cycles, snow cover). Figure 4 (left) shows the peak-to-peak amplitude of seasonal oscillations of the study region ranging from 0 to 2 cm. We noticed that the amplitudes of areas along the QTR and QTH were generally large, due to the surface disturbance associated with railway or highway engineering construction. We also observed that the amplitude of seasonal surface displacement of the rifted basins on both sides of the QTR was larger than that of the area with high elevation. As observed in Figure 4 (right), the estimated linear deformation rates of most of the study areas are from −2 to 0 mm·yr−1, which is possibly the result of permafrost thawing beneath the AL caused by temperature rise. Our linear trend result shows strong spatial variability, as we observed inversion surface displacement (uplift) in valleys. Then the ALT and AL thickening rate were estimated using Equations (3) and (4), respectively. The calculated results are represented in Figure 5. Due to the linear relationship between ALT and InSAR observed surface displacement that we used in this study, Figure 4 and Figure 5 show the same spatial pattern.
The uncertainty in observations (D) is due to the residuals between our fitted model and the observed D (Section 3.2) can be expressed as the following equation:
σ D = ( e T × e N r a n k ( A ) ) 1 / 2 ,
where e is the residual between observation and fitted model, N is number of the SBAS-InSAR observations and r a n k ( A ) is the rank of design matrix A. Then we calculated the uncertainty in the peak-to-peak amplitude of seasonal subsidence ( σ a m p ) and uncertainty for estimated ALT ( σ A L T ) by propagating the uncertainties for observations ( σ D ) . Figure 6 shows σ a m p and σ A L T for the entire domain. Large fitting residuals are caused by noise in the deformation measurements, a small number of SBAS-InSAR observations [25]. It can be seen that the ALT ranges from 0 to 2 m with uncertainty of less than 0.3 m and the AL thickening rate varies along the QTR ranging from 0 to 25 cm·yr−1. The difference of the ALT change can cause significant damage to the QTR since many former studies already demonstrated that approximately 85% of the damage that QTH/QTR currently experiences is due to the differential thaw settlement of permafrost in the QTP [9,31,32].
The time series of the SBAS-InSAR observed and modeled subsidence at pixels located nearest to the monitoring site WD4 (less than 30 m) are shown in Figure 7. In this figure, the relative vertical displacements measured from Figure 3 are shown as black cross signs. The displacements are all referenced to the earliest date of SAR acquisition (4 March 2007). Additionally, the solid black line is the fitted displacement model using Equation (2) combining the SBAS-InSAR observations. The red dashed line represents the long-term relative surface subsidence rate for the borehole site WD4. Then the estimated secular surface deformation rate is converted to AL thickening rates using Equation (3) and the peak-to-peak amplitude of seasonal deformation is converted to ALT using Equation (4). The converted AL thickening rate at borehole site WD4 was 4.6 cm·yr−1 and the ALT was 0.81 m, 2007–2009, with an estimated uncertainty <0.18 m.
The root mean square error (RMSE) of the deformation fitting of WD4 is 2.2 mm, and the correlation coefficient around 0.9. These indicate the fitting performs very well and the deformation follows the periodic model. The permafrost region in the QTP can be distinguished as warm permafrost with MAGT (mean annual ground temperature at a depth of zero amplitude, usually at 10–15 m depth below the ground surface on the QTP) above −1 °C and cold permafrost with MAGT below −1 °C [11]. The mean MAGT at a depth of 12 to 15 m over borehole site WD4 is −2.56 °C, which means that this monitoring site is located at a cold permafrost area. Our fitting model shows that the maximum thaw depth can be reached around September, which is close to the conclusion from in situ observations that the maximum thaw depth occurred at the end of September [11]. The absolute difference between RALT, InSAR and RALT, ST is 0.4 cm·yr−1 and the difference between ALTInSAR and ALTST is 0.11 m. The differing periods used for the time average may contribute to small differences between RALT, InSAR (2007–2009) and RALT, ST (2006–2010). At the same time, although we used the estimated results of the closest pixel to the borehole site, the spatial difference between the selected pixel and location of the monitoring site may also cause the variations between these two variables.

5. Discussion

5.1. Causes of SBAS-InSAR Observed Displacement

In this study, we focused on regional ALT estimation and AL thickening rate monitoring using SBAS-InSAR-observed ground-surface displacement, including secular and seasonal deformation (uplift and subsidence). We suggested that the seasonal subsidence is due to thaw settlement in the active layer during the thawing season since the ice in the active layer melts into liquid, water which causes a volume decrease. The frost heave occurs in the freezing season as the melted water transforms back to ice during late autumn resulting in a volume expansion. In general, a similar amount of ground surface subsidence and uplift happens during the thaw-freeze cycle annually in the permafrost area. Along the QTR, the average ALT is approximately 3.1 m with a range of 1.1 to 5.9 m based on observations from 27 borehole sites over five years (2006–2010) [11]. The mean ALT for monitoring site WD4 in our study region is 0.92 m with a range of 0.86 to 1.05 m, from 2006 to 2010, which is close to our estimation 0.81 m from 2007 to 2009 [11].
On the other hand, the observed secular subsidence is probably due to thawing of ice-rich permafrost near the active layer table. When enough heat transfer from the surface through the active layer to the permafrost underneath it, ground ice in the ice-rich permafrost may melt to liquid water, which causes the surface subsidence and the increase of ALT. It has been widely accepted that ALT is increasing due to global warming and the principal control on the increase of ALT is air temperature in summer months [20]. Our results from SBAS-InSAR measurements, and several other studies in permafrost areas along QTR, observed a small increase in ALT [9,10,11,25]. From 2006 to 2010, ALT has increased at a rate of approximate 6.3 cm·yr−1 along QTR [11]. The ALT thickening rate for borehole site WD4 from our SBAS-InSAR result is 4.6 cm·yr−1, while the in situ observation is 5 cm·yr−1 [11], indicating excellent agreement.

5.2. Spatial Variability of ALT/ALT Change

As the ALT is influenced by soil thermal properties and microclimate condition at the local scale, many ground-based and InSAR studies already observed large spatial variations in ALT/ALT change within a small area along the QTR [9,10,11,25]. Our ALT result also shows strong spatial variability. We observed that the ALT of the rifted basins on both sides of the railway was larger than that of the area right near the valleys. The possible reason is an excess heat-positive accumulation in these rifted basins due to the rich soil water content resulting from moist sediments, higher air temperature, and local thermal balance change caused by more anthropogenic activities [25]. Although it is widely hypothesized that ALT is increasing in response to global warming, such a response may be complex and our secular ALT changing result shows that the ALT thickening rates have extensive spatial differences in the study region along the QTR. The spatial variation of the secular trend may be caused by varying feedbacks of permafrost change to climate change that are controlled by local effects [11]. The spatial changes in soil moisture could lead to an increase or decrease of radar penetration depth. In valleys, high soil moisture can cause an apparent ground uplift signal on interferograms that is opposite to our observed subsidence in other areas [20]. Several other factors may also cause this large spatial variation, including the surface roughness, and different soil types in the study region.

5.3. Advantages and Limitations of the InSAR-Based Methodology

Comparing with traditional methods that are based on field surveys of sparse points, this InSAR-based methodology is able to estimate ALT/ALT change over a large area with a high spatial resolution of approximately 30 m. As such, in this study we estimated the ALT and the AL thickening rate (Figure 5) based on SBAS-InSAR observations over a large area of northern QTP with 30 m spatial resolution. This method can be easily extended to cover other large, remote, and unreachable permafrost areas, and even larger regions, e.g., the entire QTP, since this methodology does not depend on a large number of datasets of ground surface temperature or soil moisture measurements, which are generally unavailable over most regions of the QTP, especially remote and depopulated areas. The large-scale ALT and ALT change products with high spatial resolution derived from SBAS-InSAR observations by using the methodology in this study provide more information of the active layer, e.g., spatial and temporal variations of ALT, and improve our understanding of permafrost and the active layer, which will be good for ecosystem and environmental research, design, and planning of engineering construction in the QTP.
A sinusoidal model was adopted by Li et al. [25] to compute the long-term linear deformation velocity and amplitude of seasonal oscillation over a study region of Dangxiong County area in the southern QTP and proved that this function is able to model well the ground surface deformation of the frozen soil. In this study, we also used a similar approach to fit InSAR-observed surface deformations in our study area in the QTP. However, as Li et al. mentioned in their research, and we discussed in Section 5.2, that the InSAR-derived surface deformation is affected by many factors such as precipitation, temperature, water content, heat flow, and other local factors, which may or may not be in accordance with the sinusoidal model [25]. Then we converted the InSAR observations to ALT based on a linear model under the following assumptions: (i) ground surface subsidence is caused purely by the volume change of pore ice to water and melted water did not run away; (ii) saturated soil in the frozen portion of the active layer; and (iii) without considering the differences of the permafrost conditions, we assumed a homogeneous ground of the entire study area. These assumptions may cause bias to the estimated ALT/AL thickening rates.

6. Conclusions

In this study, we applied the SBAS-InSAR technique using the ALOS PALSAR data spanning 2007–2009 to detect ALT and the AL thickening rate over the selected permafrost region along the QTR in the northern QTP. The estimated subsidence rates, resulting from thawing of ice-rich permafrost near the permafrost table in response to increasingly warmer permafrost temperature, were converted to active layer thickening rates over a large area along the railway. We also estimated the peak-to-peak amplitude of seasonal subsidence and converted the result to ALT in our study region. In our result, the peak-to-peak amplitude of seasonal subsidence ranged from 0 to 2 cm with uncertainty of less than 4 mm, and the ALT ranged from 0 to 2 m with uncertainty of less than 0.3 m. At the same time, we showed that the InSAR observations are in excellent agreement with the fitted model with RMSE approximately 2 mm and correlation coefficient approximately 0.9 for borehole site WD4, while there are still small differences between ground-based observations and InSAR estimated results. The improvement and testing of the fidelity of the time series model to regress InSAR observations to estimate ALT and the AL thickening rate will remain a topic of future studies. Other future studies include conducting additional InSAR studies covering the rest of the published borehole sites of the new monitoring network along the railway, as well as extending the InSAR observation data span, and experimenting with alternate models to convert InSAR subsidence to active layer thickening rates.
Contrasting the use of ground-based measurements to characterize ALT and the AL thickening rate over the QTP, InSAR technology has an advantage of monitoring surface deformation over a much larger permafrost in remote and inaccessible regions. Based on excellent validation studies with ground truth data, we concluded that we have characterized the ALT and AL thickening rates with high spatial resolution (30 m) over a large area (>150 km2) over the north QTP near the QTR, spanning 2007–2009.

Acknowledgments

We acknowledge the constructive comments from three anonymous reviewers which have improved the manuscript. This research was partially supported by NASA’s Geodetic Imagery Grant (No. NNX12AQ07G), NSFC grant (No. 41374020), and the Presidential Fellowship from The Ohio State University awarded to Yuanyuan Jia. The work of Chung-Yen Kuo was supported in part by the Institute of Geodesy and Geophysics, Chinese Academy of Sciences. We thank JAXA for providing the ALOS PALSAR data used in this study, under approved scientific project data grants. The Landsat image is from NASA via USGS EROS Data Center. Some figures in this manuscript were created using the Generic Mapping Tools (GMT) [33].

Author Contributions

Yuanyuan Jia established the concept of the presented study, and performed the ALOS PALSAR data processing and the ALT modeling. Jin-Woo Kim, Zhong Lu, Xiaoli Ding and Lei Zhang provided technique support for the SBAS-InSAR processing and time series modeling. Chung-Yen Kuo and Kuo-Hsin Tseng analyzed the time series of InSAR observed vertical deformation. C.K. Shum, Kamil Erkan, Kun Shang and Yuchan Yi was responsible for an overview of local environmental conditions and extraction of data from reports.

Conflicts of Interest

The authors declare no conflict of interest.

References

  1. Woo, M. Permafrost Hydrology; Springer: Berlin/Heidelberg, Germany, 2012. [Google Scholar]
  2. Zhang, T.; Barry, R.G.; Knowles, K.; Heginbottom, J.A.; Brown, J. Statistics and characteristics of permafrost and ground-ice distribution in the Northern Hemisphere. Polar Geogr. 2008, 31, 47–68. [Google Scholar] [CrossRef]
  3. Pang, Q.Q.; Cheng, Q.D.; Li, S.X.; Zhang, W.G. Active layer thickness calculation over the Qinghai-Tibet Plateau. Cold Reg. Sci. Technol. 2009, 57, 23–28. [Google Scholar] [CrossRef]
  4. IPCC (Intergovernmental Panel on Climate Change). Climate Change 2007: The Physical Science Basis, Summary for Policymakers; Cambridge University Press: Cambridge, UK; New York, NY, USA, 2007. [Google Scholar]
  5. Lemke, P.; Ren, J.; Alley, R.; Allison, I.; Carrasco, J.; Flato, G.; Fujii, Y.; Kaser, G.; Mote, P.; Thomas, R.; et al. Observations: Changes in Snow, Ice and Frozen Ground; IPCC WG1 Fourth Assessment Report; Cambridge University Press: Cambridge, UK; New York, NY, USA, 2007; Chapter 4. [Google Scholar]
  6. Osterkamp, T.E. A thermal history of permafrost in Alaska. In Proceedings of the 8th International Conference on Permafrost, Zurich, Switzerland, 21–25 July 2003; Phillips, M., Springman, S.M., Arenson, L.U., Eds.; A.A. Balkema: Lisse, The Netherlands, 2003; pp. 863–867. [Google Scholar]
  7. Osterkamp, T.E. Characteristics of the recent warming of permafrost in Alaska. J. Geophys. Res. 2007, 112, F02S02. [Google Scholar] [CrossRef]
  8. Oberman, N.G.; Mazhitova, G.G. Permafrost dynamics in the northeast of European Russia at the end of the 20th century. Norw. J. Geogr. 2001, 55, 241–244. [Google Scholar]
  9. Wu, Q.; Zhang, T. Recent permafrost warming on the Qinghai-Tibetan Plateau. J. Geophys. Res. 2008, 113, D13108. [Google Scholar] [CrossRef]
  10. Wu, Q.; Zhang, T. Changes in active layer thickness over the Qinghai-Tibetan Plateau from 1995 to 2007. J. Geophys. Res. 2010, 115, D09107. [Google Scholar] [CrossRef]
  11. Wu, Q.; Zhang, T.; Liu, Y. Thermal state of the active layer and permafrost along the Qinghai-Xizang (Tibet) Railway from 2006 to 2010. Cryosphere 2012, 6, 607–612. [Google Scholar] [CrossRef] [Green Version]
  12. Wang, B.L.; French, H.M. Permafrost on the Tibet Plateau, China. Q. Sci. Rev. 1995, 14, 255–274. [Google Scholar] [CrossRef]
  13. Qiu, J. The third pole. Nature 2008, 454, 393–395. [Google Scholar] [CrossRef] [PubMed]
  14. Brown, J.; Hinkel, K.M.; Nelson, F.E. The circumpolar active layer monitoring (CALM) program: Research designs and initial results. Polar Geogr. 2000, 24, 166–258. [Google Scholar] [CrossRef]
  15. Mackay, J. A frost tube for the determination of freezing in the active layer above permafrost. Can. Geotech. J. 1973, 10, 392–396. [Google Scholar] [CrossRef]
  16. Nixon, F.; Taylor, A. Regional active layer monitoring across the sporadic, discontinuous and continuous permafrost zones, Mackenzie Valley, northwestern Canada. In Proceedings of the Seventh International Conference on Permafrost, Yellowknife, NT, Canada, 23–27 June 1998; pp. 815–820.
  17. Rickard, W.; Brown, J. Performance of a frost-tube for determination of soil freezing and thawing depths. Soil Sci. 1972, 113, 149–154. [Google Scholar] [CrossRef]
  18. Oelke, C.; Zhang, T.J. Modeling the active-layer depth over the Tibetan Plateau. Arct. Antarct. Alp. Res. 2007, 39, 714–722. [Google Scholar] [CrossRef]
  19. Liu, L.; Schaefer, K.; Zhang, T.; Estimating, J.W. 1992–2000 average active layer thickness on the Alaskan North Slope from remotely sensed surface subsidence. J. Geophys. Res. 2012, 117, F01005. [Google Scholar] [CrossRef]
  20. Liu, L.; Zhang, T.; Wahr, J. InSAR measurements of surface deformation over permafrost on the North Slope of Alaska. J. Geophys. Res. 2010, 115, F03023. [Google Scholar] [CrossRef]
  21. Schaefer, K.; Liu, L.; Parsekian, A.; Jafarov, E.; Chen, A.; Zhang, T.; Gusmeroli, A.; Panda, S.; Zebker, H.A.; Schaefer, T. Remotely sensed active layer thickness (ReSALT) at Barrow, Alaska using interferometric synthetic aperture radar. Remote Sens. 2015, 7, 3735–3759. [Google Scholar] [CrossRef]
  22. Brügmann, R.; Rosen, P.A.; Fielding, E.J. Synthetic aperture radar interferometry to measure Earth’s surface topography and its deformation. Annu. Rev. Earth Planet. Sci. 2000, 28, 169–209. [Google Scholar] [CrossRef]
  23. Jia, Y.Y.; Shum, C.; Kim, J.W.; Su, X.; Kuo, C. Study of the northern Qinghai-Tibetan plateau permafrost active layer depth rate using satellite geodetic observations. In Proceedings of the 2015 AGU Fall Meeting, San Francisco, CA, USA, 14–18 December 2015.
  24. Kim, J.; Shum, C.; Erkan, K.; Lee, H.; Lu, Z. InSAR imaging of Tibetan plateau discontinuous permafrost. In Proceedings of the IUGG General Assembly 2011, Earth on the Edge: Science for a Sustainable Planet, Melbourne, Australia, 28 June–7 July 2011.
  25. Li, Z.W.; Zhao, R.; Hu, J.; Wen, L.X.; Feng, G.C.; Zhang, Z.Y.; Wang, Q.J. InSAR analysis of surface deformation over permafrost to estimate active layer thickness based on one-dimensional heat transfer model of soils. Nat. Sci. Rep. 2015, 5, 15542. [Google Scholar] [CrossRef] [PubMed]
  26. Hanssen, R.F. Radar Interferometry: Data Interpretation and Error Analysis; Kluwer Academic Publishers: Dordrecht, The Netherlands, 2001. [Google Scholar]
  27. Goldstein, R.M.; Werner, C.L. Radar interferogram filtering for geophysical applications. Geophys. Res. Lett. 1998, 25, 4035–4038. [Google Scholar] [CrossRef]
  28. Costantini, M. A novel phase unwrapping method based on network programming. IEEE Trans. Geosci. Remote Sens. 1998, 36, 813–821. [Google Scholar] [CrossRef]
  29. Berardino, P. A new algorithm for surface deformation monitoring based on small baseline differential SAR interferograms. IEEE Trans. Geosci. Remote Sens. 2002, 40, 11. [Google Scholar] [CrossRef]
  30. Erkan, K.; Shum, C.; Wang, L.; Guo, J.; Jekeli, C.; Lee, H.; Panero, W.; Duan, J.; Huang, Z.; Wang, H. Geodetic constraints on the Qinghai-Tibetan Plateau present-day geophysical processes. Terr. Atmos. Ocean. Sci. 2011, 22, 241–253. [Google Scholar] [CrossRef]
  31. Tong, C.J.; Wu, Q.B. The effect of climate warming on the Qinghai-Tibet Highway, Cold Reg. Sci. Technol. 1996, 24, 101–106. [Google Scholar]
  32. Wu, Q.B.; Liu, Y.Z.; Zhang, J.M.; Tong, C.J. A review of recent frozen soil engineering in permafrost regions along Qinghai-Tibet Highway, China. Permafr. Periglac. 2002, 13, 199–205. [Google Scholar]
  33. Wessel, P.; Smith, W.H.F. New, improved version of the Generic Mapping Tools released. EOS Trans. Am. Geophys. Union 1998, 79, 579. [Google Scholar] [CrossRef]
Figure 1. (a) QTP modeled permafrost AL thickening rate [18]; the black line shows the QTR and the blue square denotes the location of the study area; (b) the zoom-in pseudo-color optical image of the study region, made from Landsat TM false color image (http://earthexplorer.usgs.gov, R: band 4, G: band 3, B: band 2). The blue dashed and solid rectangle represents the spatial coverage of the selected ALOS PALSAR images and the study area, respectively. Figure (b) also shows the locations of the monitoring borehole sites: CM6, CM7, WD3, WD4, and HR3.
Remotesensing 09 00084 g001
Figure 2. The temporal and spatial baselines of the 45 interferograms from 10 PALSAR scenes.
Remotesensing 09 00084 g002
Figure 3. ALOS PALSAR observed relative vertical displacement between the reference SAR imagery acquisition date (4 March 2007) and slave SAR scenes acquisition dates, which represented as (ai), in the study region, 2007–2009. In these figures and the following images, the validation point WD4 is shown as black-white circles.
Remotesensing 09 00084 g003
Figure 4. (Left) The peak-to-peak amplitude of the seasonal surface displacement; and (right) the linear deformation velocity of the study area from the SBAS-InSAR result.
Remotesensing 09 00084 g004
Figure 5. The ALT of the study area (left); and the AL thickening rate estimated from the SBAS-InSAR result (RALT, InSAR cm·yr−1) over study region (right).
Remotesensing 09 00084 g005
Figure 6. Uncertainty of the peak-to-peak amplitude of seasonal subsidence (left); and uncertainty of estimated ALT (right) over our study region.
Remotesensing 09 00084 g006
Figure 7. Time series of observed relative vertical displacements from InSAR (black plus sign) and modeled ground motions (black curved line) at borehole site WD4, 2007–2009. The red dashed line shows the estimated subsidence rate calculated from SBAS-InSAR.
Remotesensing 09 00084 g007
Table 1. The list of ALOS PALSAR scenes.
DateSensorPathBeamBandDirectionIncidence Angle (°)
4 March 2007PALSAR493FineL-bandAscending38.7245
20 July 2007PALSAR493FineL-bandAscending38.7306
4 September 2007PALSAR493FineL-bandAscending38.7270
20 October 2007PALSAR493FineL-bandAscending38.7307
21 April 2008PALSAR493FineL-bandAscending38.7239
6 June 2008PALSAR493FineL-bandAscending38.7278
22 July 2008PALSAR493FineL-bandAscending38.7335
6 September 2008PALSAR493FineL-bandAscending38.7323
22 October 2008PALSAR493FineL-bandAscending38.7374
9 March 2009PALSAR493FineL-bandAscending38.7414

