Article

Monitoring Urban Clusters Expansion in the Middle Reaches of the Yangtze River, China, Using Time-Series Nighttime Light Images

1
School of Geosciences and Info-Physics, Central South University, Changsha 410083, China
2
Key Laboratory of Metallogenic Prediction of Nonferrous Metals and Geological Environment Monitoring, Ministry of Education, Central South University, Changsha 410083, China
3
Changsha Urban Planning Information Service Center, Changsha 410000, China
4
Department of Earth & Environmental Systems, Center for Urban and Environmental Change, Indiana State University, Terre Haute, IN 47809, USA
*
Author to whom correspondence should be addressed.
Remote Sens. 2017, 9(10), 1007; https://doi.org/10.3390/rs9101007
Submission received: 7 August 2017 / Revised: 14 September 2017 / Accepted: 22 September 2017 / Published: 28 September 2017
(This article belongs to the Special Issue Societal and Economic Benefits of Earth Observation Technologies)

Abstract

:
The urban clusters in the Middle Reaches of the Yangtze River (MRYR) in China include the Chang-Zhu-Tan urban agglomeration, the Wuhan metropolitan area, and the Poyang Lake urban agglomeration. While previous studies of urban expansion in China focused mainly on the coastal regions, this study aimed to investigate urban expansion patterns and factors in the MRYR, which are crucial for urban development in Central China. A neighborhood statistics analysis (NSA) method and a local-optimized threshold method were used to detect urban changes during 1992–2011 from the time-series Defense Meteorological Satellite Program’s Operational Linescan System (DMSP/OLS) nighttime light (NTL) images. The evolution of urban expansion intensity and landscape metrics were analyzed at multiple spatial scales, including the whole region, urban agglomeration, and city scales. Finally, the expanded STochastic Impacts by Regression on Population, Affluence, and Technology (STIRPAT) model was built to explore the factors that controlled NTL intensity. The results revealed that urban areas extracted from the NTL data were consistent with those extracted from the Landsat Thematic Mapper data, with an overall accuracy of 81.74% and a Kappa of 0.40. A relatively slow urbanization pace was observed from 1992 to 2002 in the MRYR region, which then accelerated in the period of 2002 to 2007 and then slowed down between 2007 and 2011. Additionally, urban expansion exhibited a radial pattern. The results further indicated that major factors controlling NTL intensity were gross domestic product, followed by total investment in fixed assets, tertiary industry, urban construction area, non-agricultural population, and industrial output in the city clusters. The study provides important insights for further studies on the urbanization processes in the MRYR region.

Graphical Abstract

1. Introduction

Urbanization is a complex process involving rural–urban shift, urban expansion, and land use change [1,2,3,4,5,6]. The urban expansion process leads to a shortage of natural resources, a number of environmental changes and even disasters on multiple scales [7,8,9]. Thus, obtaining timely and accurate information about urban expansion is vital to optimize the layout of urban space and land-use patterns, to evaluate the environmental impacts of urban development, and to guide a sound urbanization process associated with demographic dynamics, socioeconomic development, and human activities [10,11,12,13].
Remote sensing images have been extensively employed in detecting urban dynamics owing to their timely and spatially explicit information on urban expansion [14,15,16,17,18]. Particularly, high and medium spatial resolution remotely sensed images, such as those captured by Landsat Thematic Mapper (TM) and IKONOS, have been exploited in a variety of studies to characterize urbanization patterns and processes [19,20,21]. However, such studies were cost-intensive given their limited geographic coverage and requiring a large amount of time and human resources to extract urban information for a large region. Additionally, auxiliary data sets used for urbanization studies, such as economic and population increases, were usually collected at the administrative unit scale, lacking adequate spatial details. Therefore, acquiring urban expansion information spanning multiple years for large city clusters using high to medium remote sensing data and socioeconomic statistical data is difficult.
The coarse-resolution nighttime light (NTL) time-series images, derived from the Defense Meteorological Satellite Program’s Operational Linescan System (DMSP/OLS), provide a special perspective on the spatiotemporal changes of urban areas [22,23,24,25]. The capacity of DMSP/OLS NTL imagery for monitoring urban extents has garnered wide attention [26,27,28,29,30]. In particular, a few studies have analyzed urbanization dynamics in China by using the DMSP/OLS NTL imagery [30,31,32,33,34,35]. For example, Liu and He used the data set to extract urban expansion from 1992 to 2008 [32]; Ma and Zhou conducted a comparative study on urbanization dynamics using DMSP/OLS NTL imagery for Chinese cities [33]. By using multi-temporal NTL data, Zhang and Su explored the determinants of urban expansion in 30 major Chinese metropolitans [34]. However, most previous studies focused on comparative analysis of urban expansion across the whole nation or in the coastal region of Eastern China [36,37,38,39]. The urbanization process varies across regions due to the large spatial coverage and complicated landscapes of China, especially between Eastern, Central, and Western China. Quantitative analysis of urban expansion remains relatively rare in the central region of China.
The urban clusters along the Middle Reaches of the Yangtze River (MRYR) include the Chang-Zhu-Tan urban agglomeration, the Wuhan metropolitan area, and the Poyang Lake city cluster. Under the “Rise of Central Region” national strategy, the region has been designated as a new growth area for economic development to help promote new urbanization. Rapid urbanization in the city clusters in MRYR will have profound impacts on the natural and ecological environments in China. Thus, characterizing urban expansion is critical to promote a comprehensive understanding of the urbanization processes in the region. Although a number of studies have been conducted in the region, they only focused on certain cities, such as Wuhan, Nanchang, Zhuzhou, etc., or regions, such as Hubei or Changsha-Zhuzhou-Xiangtan, instead of entire urban clusters in the MRYR [40,41,42,43,44,45]. By extracting urban sprawls and monitoring urban development in an accurate and timely manner, urban expansion and its driving forces can be evaluated, which are of significance to improve urban planning and decision making to support of the goal of sustainable urban development.
Previous studies have proposed some methods for extracting urban extents from NTL imagery [46,47,48]. Among these methods, the thresholding method has been widely used due to its simplicity and reasonable accuracy [49,50]. However, the empirical threshold-based approaches could easily overestimate large urban clusters and underestimate small ones due to saturation and blooming effects. Su and Chen proposed a neighborhood statistics analysis (NSA) method to generate topographic maps and extract built-up areas from NTL images based on the spatial variations between neighboring built-up and non-built-up pixels [51]. The NSA method demonstrated valid extraction abilities for urban patches in selected developing cities [52]. However, some fragments with high NTL values in suburban districts would also be assigned to urban extent, especially in small cities. To address the problem of urban extraction for small- to medium-sized cities in the MRYR region, we combined the NSA method and the local-optimized threshold method to perform urban boundary extraction and sprawl analysis using time-series NTL data. The combined method will be described in Section 3.
The objectives of this study were: (1) to extract urban sprawls and provide a quantitative analysis of the spatiotemporal patterns of urban growth for the city clusters in MRYR; and (2) to explore the driving factors of urban expansion in the region by using an extended STIRPAT model.

2. Study Area and Data
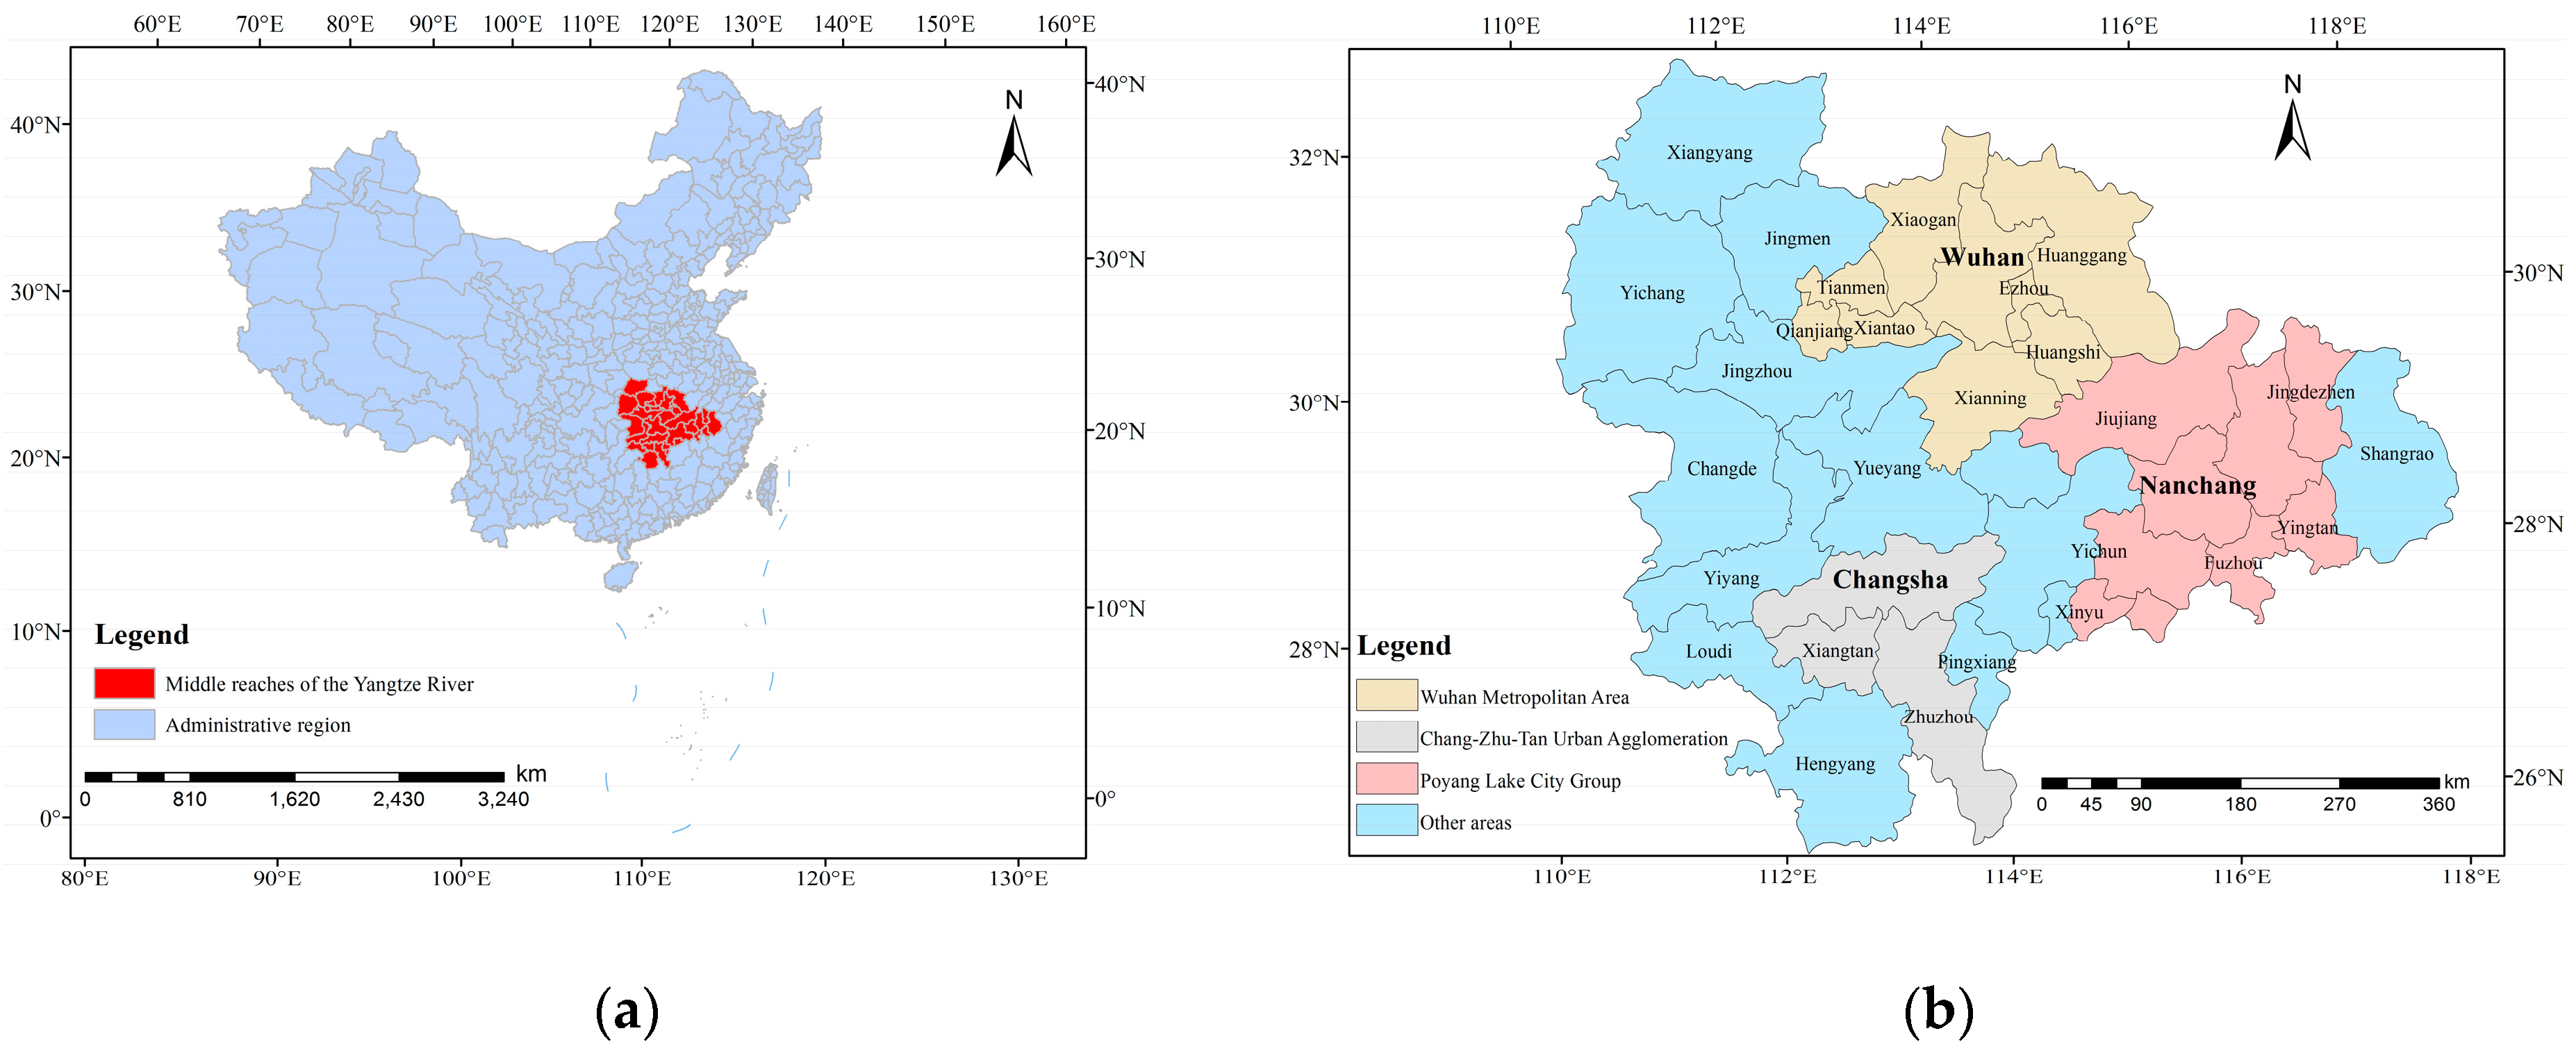
2.1. Study Area

The city clusters in the MRYR are large urban agglomerations located in Central China. On 5 April 2015, the MRYR city clusters development plan was unveiled as the first cross-regional urban agglomeration planning by the State Council of China. The whole region consists of three medium-scale urban agglomerations: the Wuhan metropolitan area in Hubei Province, the Chang-Zhu-Tan urban agglomeration in Hunan Province, and the Poyang Lake city group in Jiangxi Province (Figure 1). The region covers three provincial cities and 27 prefectural-level cities, which connects the relatively developed Eastern China with the developing Western China, and is considered a pillar of the Yangtze River Economic Belt. The total urban land area is about 317,000 square kilometers with total population of 121 million and GDP of 6 trillion Yuan.

2.2. DMSP/OLS Nighttime Light Data and Preprocessing

The version 4 DMSP/OLS stable NTL data were obtained from the National Geophysical Data Center (NGDC, http://www.ngdc.noaa.gov/dmsp/download.html). There were six sensors collecting NTL data from 1992 to 2013: F10 (1992–1994), F12 (1994–1999), F14 (1997–2003), F15 (2000–2007), F16 (2004–2009), and F18 (2010–2013). Considering the availability of the corresponding socioeconomic data for the time period, we used the NTL data in 1992–2011 (Table 1).
The digital number (DN) of the NTL images ranges from 0 to 63, which excludes the NTL signal generated by sunlight, moonlight, clouds, and ephemeral events, such as flares and fires. Due to differences in satellite orbits and sensor degradation, measurements of NTL brightness could differ significantly even when the observation target has not changed. To minimize noise and discrepancies, the original DMSP/OLS NTL data needed inter-calibration, intra-annual composition, and inter-annual correction.
The inter-calibration of night stable light data was performed by using a second order regression model provided by Liu et al. [32]. We developed the second-order regression to empirically inter-calibrate the annual nighttime light products to match the composite of F16 in 2007 and obtained the coefficients in the regression model for the annual composites.
After inter-calibration, the corrected NTL data from 1992, 1997, 2002, 2007, 2011 were used. For the years that had two images, the one showing higher inter-calibration correlation was selected. Finally, the NTL images were re-projected to the Lambert Azimuthal Equal Area projection and resampled to 1 km, which were further used to extract the cumulative NTL for each city according to the administrative boundaries.

2.3. Auxiliary Data Sets

Socioeconomic indicators for the 30 cities were obtained from the China Statistics Yearbook 1992–2011 [53], which include urban area, urban population, Gross Domestic Product (GDP), total fixed asset, gross industrial output, and tertiary industry values. However, the “urban area” reported in the Statistical Yearbook is defined as the urban constructed areas covered by well-established infrastructures, i.e., urban built-ups. The urban area by this definition is smaller than the actual urban area [32,33]. Therefore, Landsat TM imagery was used to assess the NTL-derived urban area, because the spatial resolution of Landsat TM data (30 m) is much finer than that of NTL data (1 km).
Considering the accessibility of cloud free Landsat TM images and the heterogeneity of urban development in the study area, we selected the images from 2009 to extract reference urban areas for five cities (Yueyang, Xiangtan, Zhuzhuo, Jingdezheng, and Xiangyang) and from 1995 and 2009 for three provincial cities (Changsha, Wuhan, and Nanchang).

3. Methodology

The methodology in this study included three steps: extracting urban extents from 1992 to 2011, analyzing the spatiotemporal patterns of urban expansion based on urban expansion intensity, direction, and landscape metrics, and exploring the driving factors of urbanization.

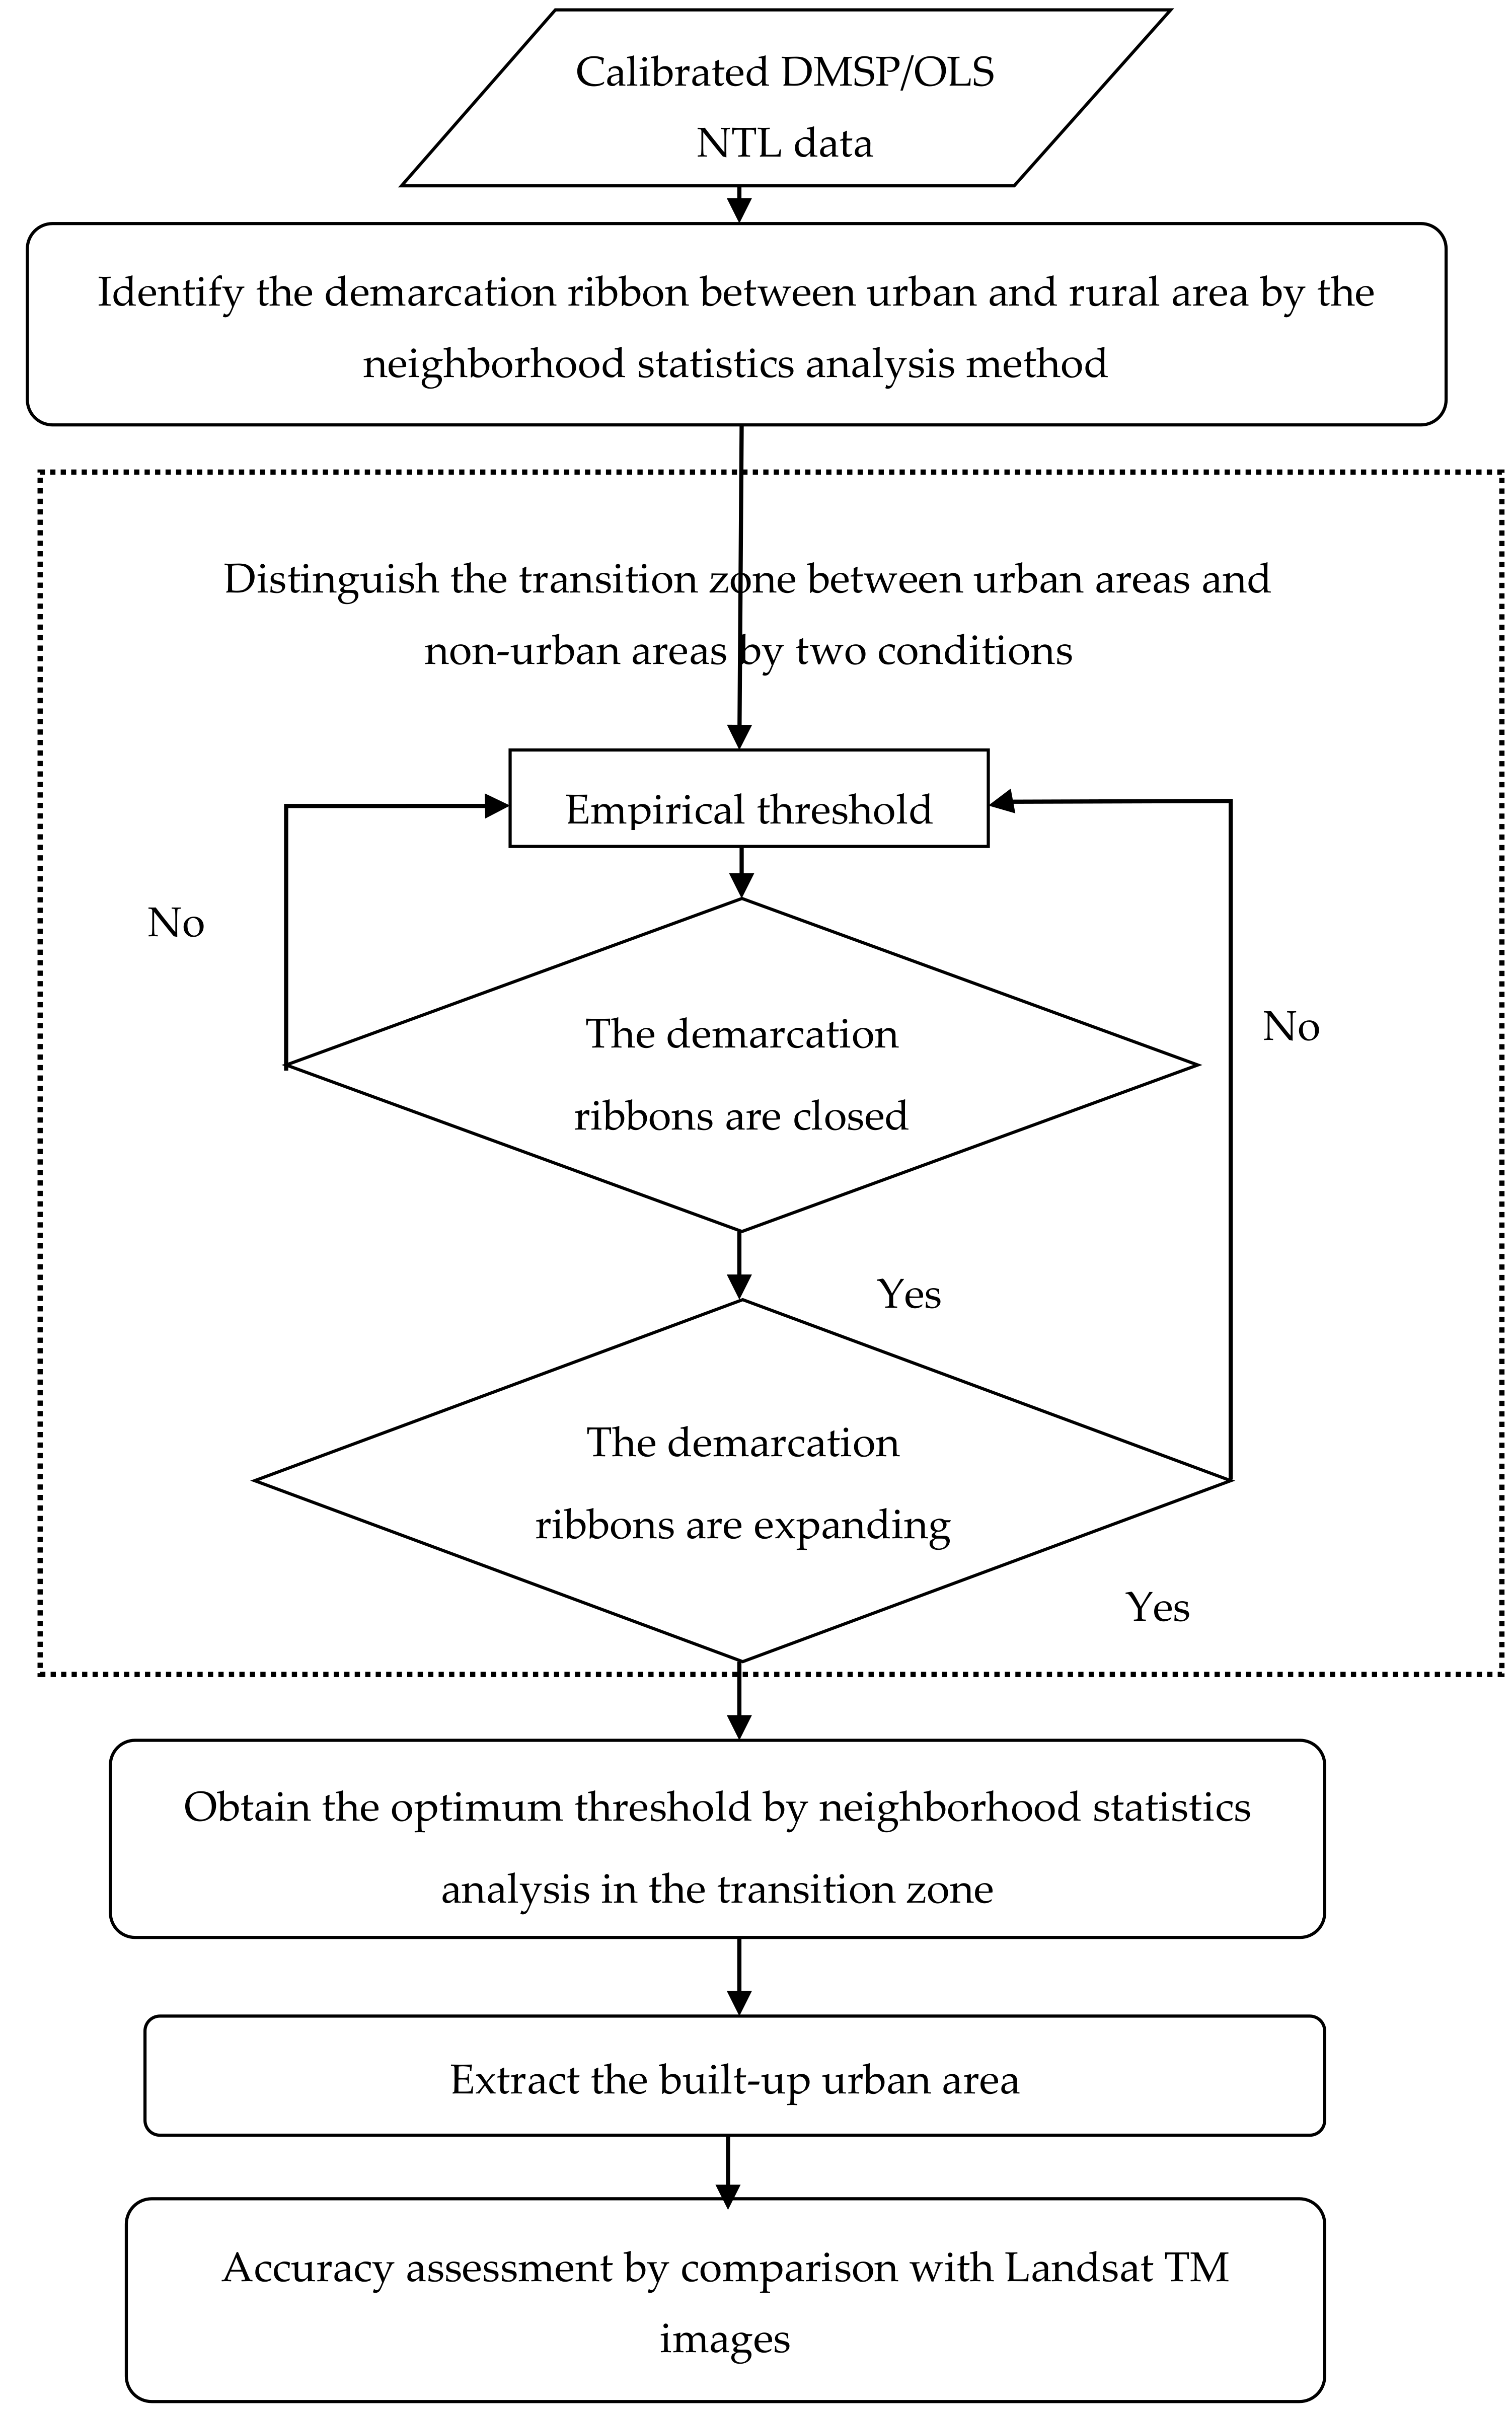
3.1. Extraction of Urban Extents

The neighborhood statistics analysis (NSA) and the local-optimized threshold method were used to extract urban extents. The combined method includes four steps: (1) identifying the demarcation ribbons between urban and rural areas through analysis of neighborhood statistics; (2) distinguishing the transition zone between urban and non-urban areas; (3) determining the local-optimized threshold in the transition zone for every city; and (4) extracting urban areas and conducting an accuracy assessment (Figure 2).
The first two steps were adopted from the NSA method proposed by Su and Chen [51]. To exclude false urban fragments, we added two conditions to pinpoint the transition zones in the second step. One condition concerns whether or not the demarcation ribbons were closed and the other assessed whether or not the demarcation pixels in the transition zones had expanded outward since the previous year. When the two conditions were satisfied, the demarcation pixels would be assigned as transition zones. The third step was obtaining the local-optimized threshold value in transition zones for every city. By considering the temporal variation of the threshold, we obtained the thresholds for each city in 1992, 1997, 2002, 2007, and 2011. Meanwhile, urban areas were extracted by the local-optimized threshold.
In order to assess the accuracy of the extracted urban areas, they were validated by comparison with urban extent delineation from Landsat TM images. Multiple Landsat TM data from 1995 and 2009 were selected to evaluate the dynamics of urban expansion in the MRYR extracted using NTL data. We obtained the raster result layers from the two source images. To match the two results, we converted the two-raster layers to the same resolution to enable the subtraction of urban pixels in ArcGIS. According to the intersection, we quantitatively obtained the similarities and differences between the two result layers and assessed the accuracy of the urban area extraction results from the NTL image.

3.2. Spatiotemporal Analysis of Urban Expansion

3.2.1. Urban Expansion Intensity

The urban expansion intensity index (UEII) was calculated to estimate the spatial distribution of urban sprawl in different times. The index is defined as:
U E I I = ( U D N t + i U D N t ) × 100 / i / S D N
where UEII represents the expansion intensity for the urban built-up area of a spatial unit during the time span t and t + i years. UDNt+i and UDNt represent the number of pixels within the urban built-up area at times t + i and t, respectively, and SDN stands for the total number of pixels in the spatial unit. By considering distinct urban development levels within each city cluster, we calculated UEII at three spatial scales: whole region, urban agglomeration, and city scales. The UEIIs were divided into four periods: (1) 1992–1997, (2) 1997–2002, (3) 2002–2007, and (4) 2007–2011.

3.2.2. Expansion Direction

Identifying urban growth directions improves the understanding of the spatiotemporal characteristics of urban development. This study adopted the gravity center of the urban area over the selected years to indicate the direction of urban expansion. The coordinates of the gravity center of urban land are calculated as:
{ X = ( i = 1 n D N i × x i ) / ( i = 1 n D N i ) Y = ( i = 1 n D N i × y i ) / ( i = 1 n D N i )
where X and Y represent the longitude and latitude of the center of gravity, respectively, xi and yi denote the longitude and latitude of the ith grid, respectively, and DNi is the gray value of the ith grid. Accordingly, we identified three types of urban expansion, which corresponded to the movement of urban centers on three spatial scales.

3.2.3. Landscape Metrics

Urban compactness is one of the major indicators of sustainable urban development that has been widely used to measure urban forms [54,55]. Meanwhile, fractal dimension can measure the degree of irregularity of urban land uses [56]. Thus, two landscape metrics, compactness ratio and fractal dimension, were employed to quantify the form of the evolution of urban expansion. Compactness ratio is calculated as:
C = 2 π A / P
where C denotes the compactness of the urban built-up area for a city, A represents the urban land area, and P is the perimeter of urban built-up area. C ranges from 0 to 1, with a greater C value indicating a more compact city. The internal space of a city is highly compacted if C equals 1, while it is loosely organized when C approaches to 0.
Fractal dimension is calculated as:
S t = 2 ln ( P t / 4 ) / ln A t
where St is the fractal dimension for a city at year t, Pt represents the peripheral perimeter of the urban area within a city at year t, and At stands for the urban area of the corresponding city. Empirically, the value of St is between 0 and 2, with a larger St indicating a more complex and irregular urban area shape.

3.3. Relationship between NTL Intensity and Urbanization Variables

Time-series NTL intensity can potentially reflect the characteristics of the urbanization process [57,58]. Diverse statistical models have been proposed to explore the relationship between DMSP/OLS NTL brightness and urbanization indicators, such as population, economic activity, and land-use change [33,59]. However, the contribution of various urbanization factors to the variations in NTL brightness has received less attention. Thus, we attempted to investigate the relationship between potential driving factors of urbanization and nighttime light brightness in three capital cities, Wuhan, Changsha, and Nanchang, by using a modified STIRPAT model.
The STochastic Impacts by Regression on Population, Affluence and Technology (STIRPAT) model, which originated in ecology, is used to quantify the stochastic impacts of population, affluence, and technology [60,61]:
I = a P b A c T d e
where I indicates the influence of environment; P, A, and T denote the factors of population, wealth, and technology, respectively; a is the coefficient term; b, c, and d are the indices of population, wealth, and technological factors, respectively, and e represents the stochastic error.
The STRIPAT model has been widely used in studies of water resources, land resources, energy consumption, and environmental stress [62]. Considering the nonlinear relationship between the NTL brightness and urbanization dynamics, the quantitative relational model between urban land expansion and its driving factors could be built by the STRIPAT model. The model can be converted into the following logarithm model:
ln I = ln a + b ln P + c ln A + d ln T + ln e
As the time-series NTL brightness characterizes the spatiotemporal trend of urban expansion, we expanded the STIRPAT model to build the quantitative relationship between NTL brightness and multiple urbanization variables as follows:
ln L = ln K + a 1 ln P + a 2 ln D + a 3 ln I + a 4 ln E + a 5 ln U + a 6 lnS + ε
where L is the NTL brightness represented by the summation of NTL DN in the lit urban area, K is a constant, D is gross domestic product (GDP), P represents the non-agricultural population as urban population size, U denotes urban constructed area as the index of well-established infrastructures, I is industrial output which measures the degree of urban industrialization, E is the total investment in fixed assets as a policy factor, and S is tertiary industry as the service factor. ε is stochastic parameters; a1, a2, a3, a4, a5, and a6 are the elastic coefficients. A 1% increase of P, D, I, E, U, and S would cause the growth of L by a1%, a2%, a3%, a4%, a5%, and a6%, respectively.
As potential driving factors of urban expansion, the urban development variables could potentially be related to the temporal changes of NTL. Six urban development variables were chosen to carry out partial correlation analysis with NTL brightness. For this analysis, three capital cities were selected: Wuhan, Changsha, and Nanchang. The selected driving factors were normalized after the logarithm and principle components were generated. Then, a linear relationship between the principle components and NTL was established by the least square method.
The principal components were calculated as:
F 1 = w 1 Z D + w 2 Z P + w 3 Z I + w 4 Z E + w 5 Z U + w 6 Z S
where F1 represents principal components; ZD, ZP, ZI, ZE, ZU, and ZS are normalized variables corresponding to D, P, I, E, U, and S after the logarithm respectively; and wi represents the corresponding elastic coefficients.

4. Results

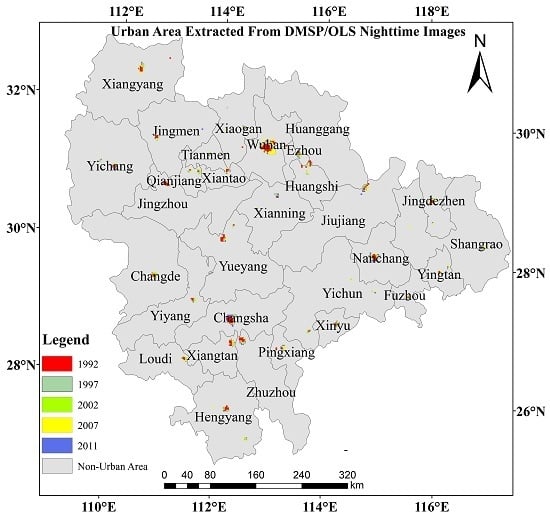
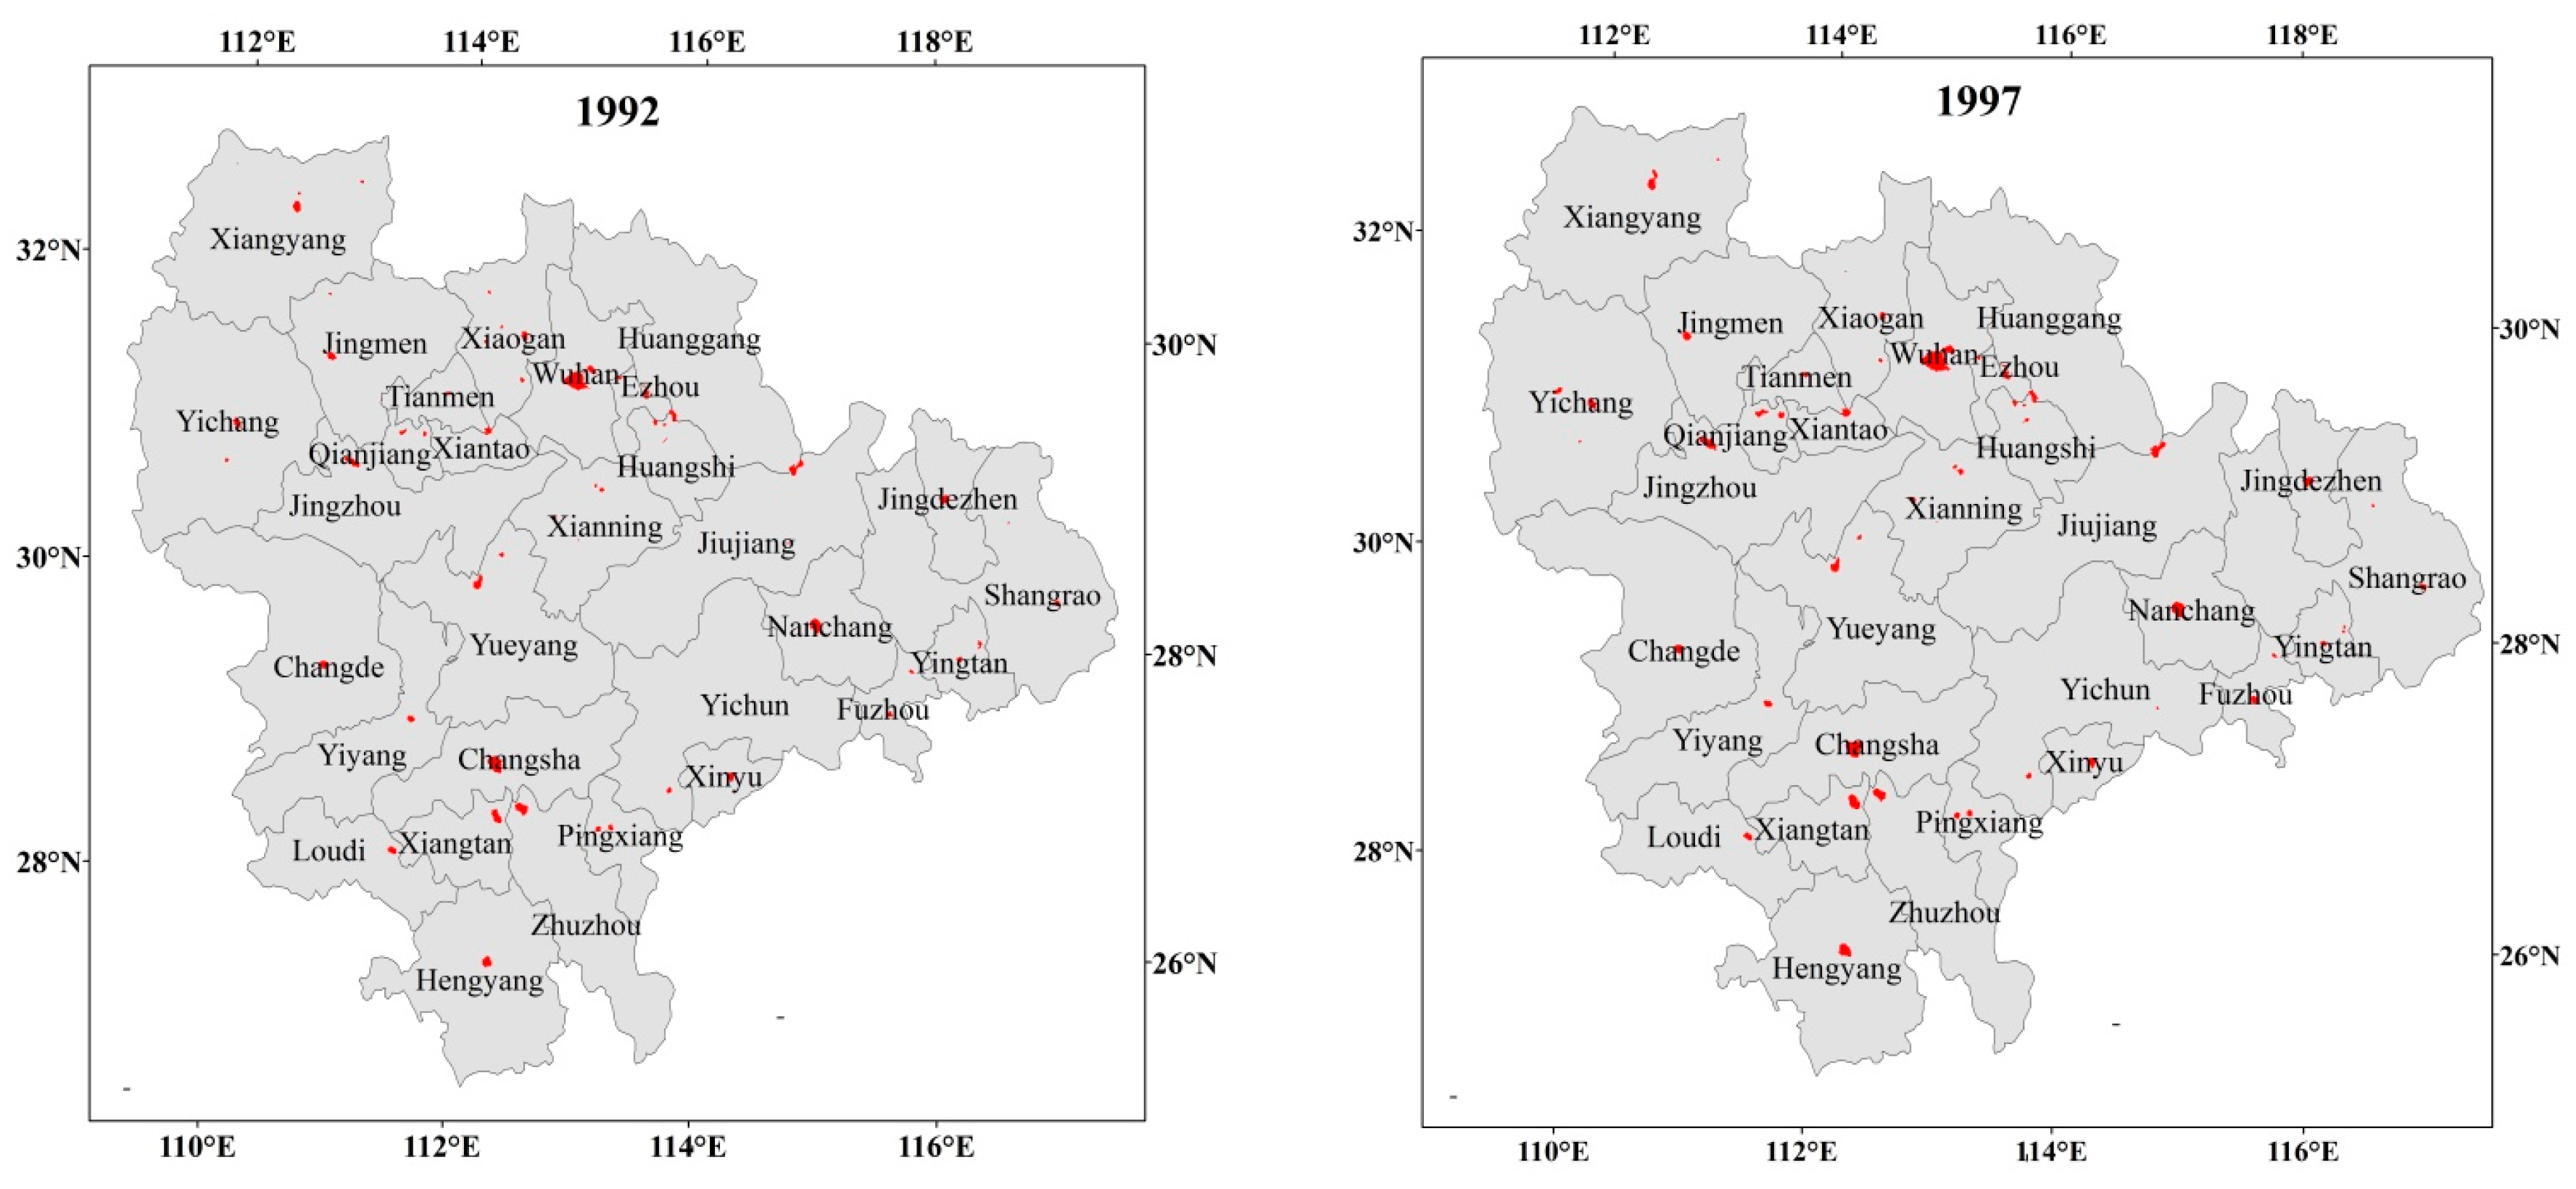
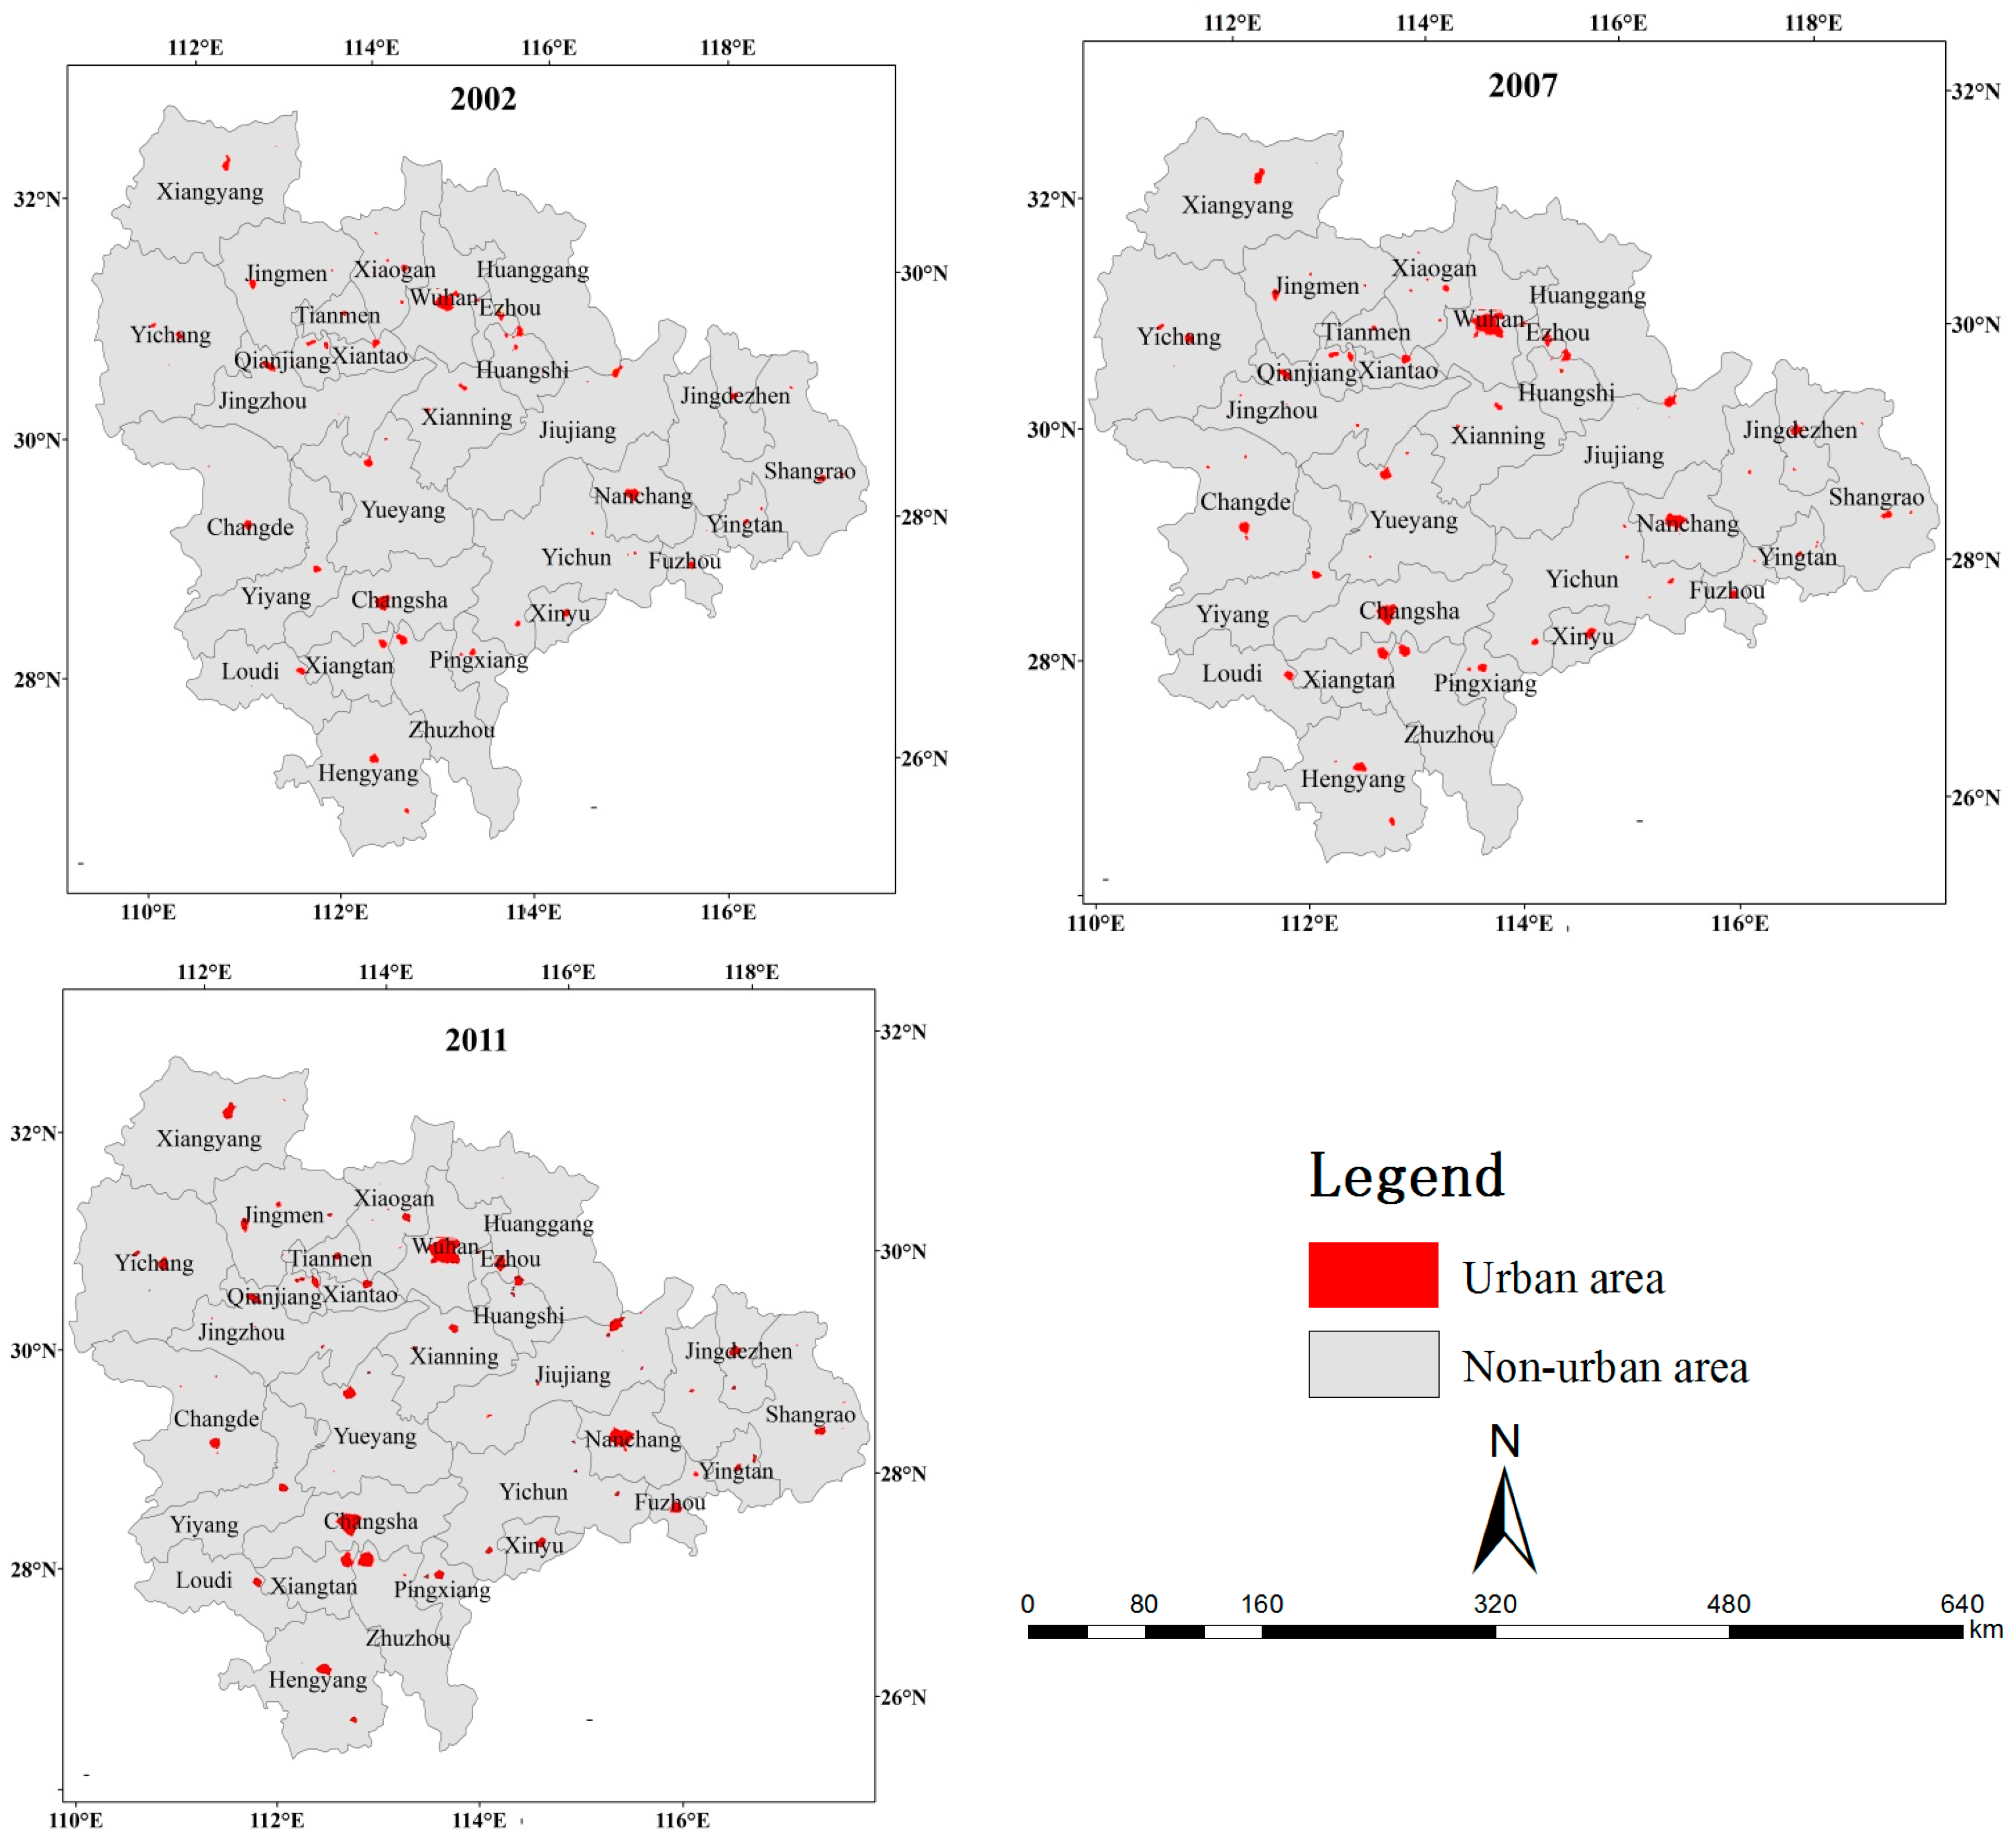
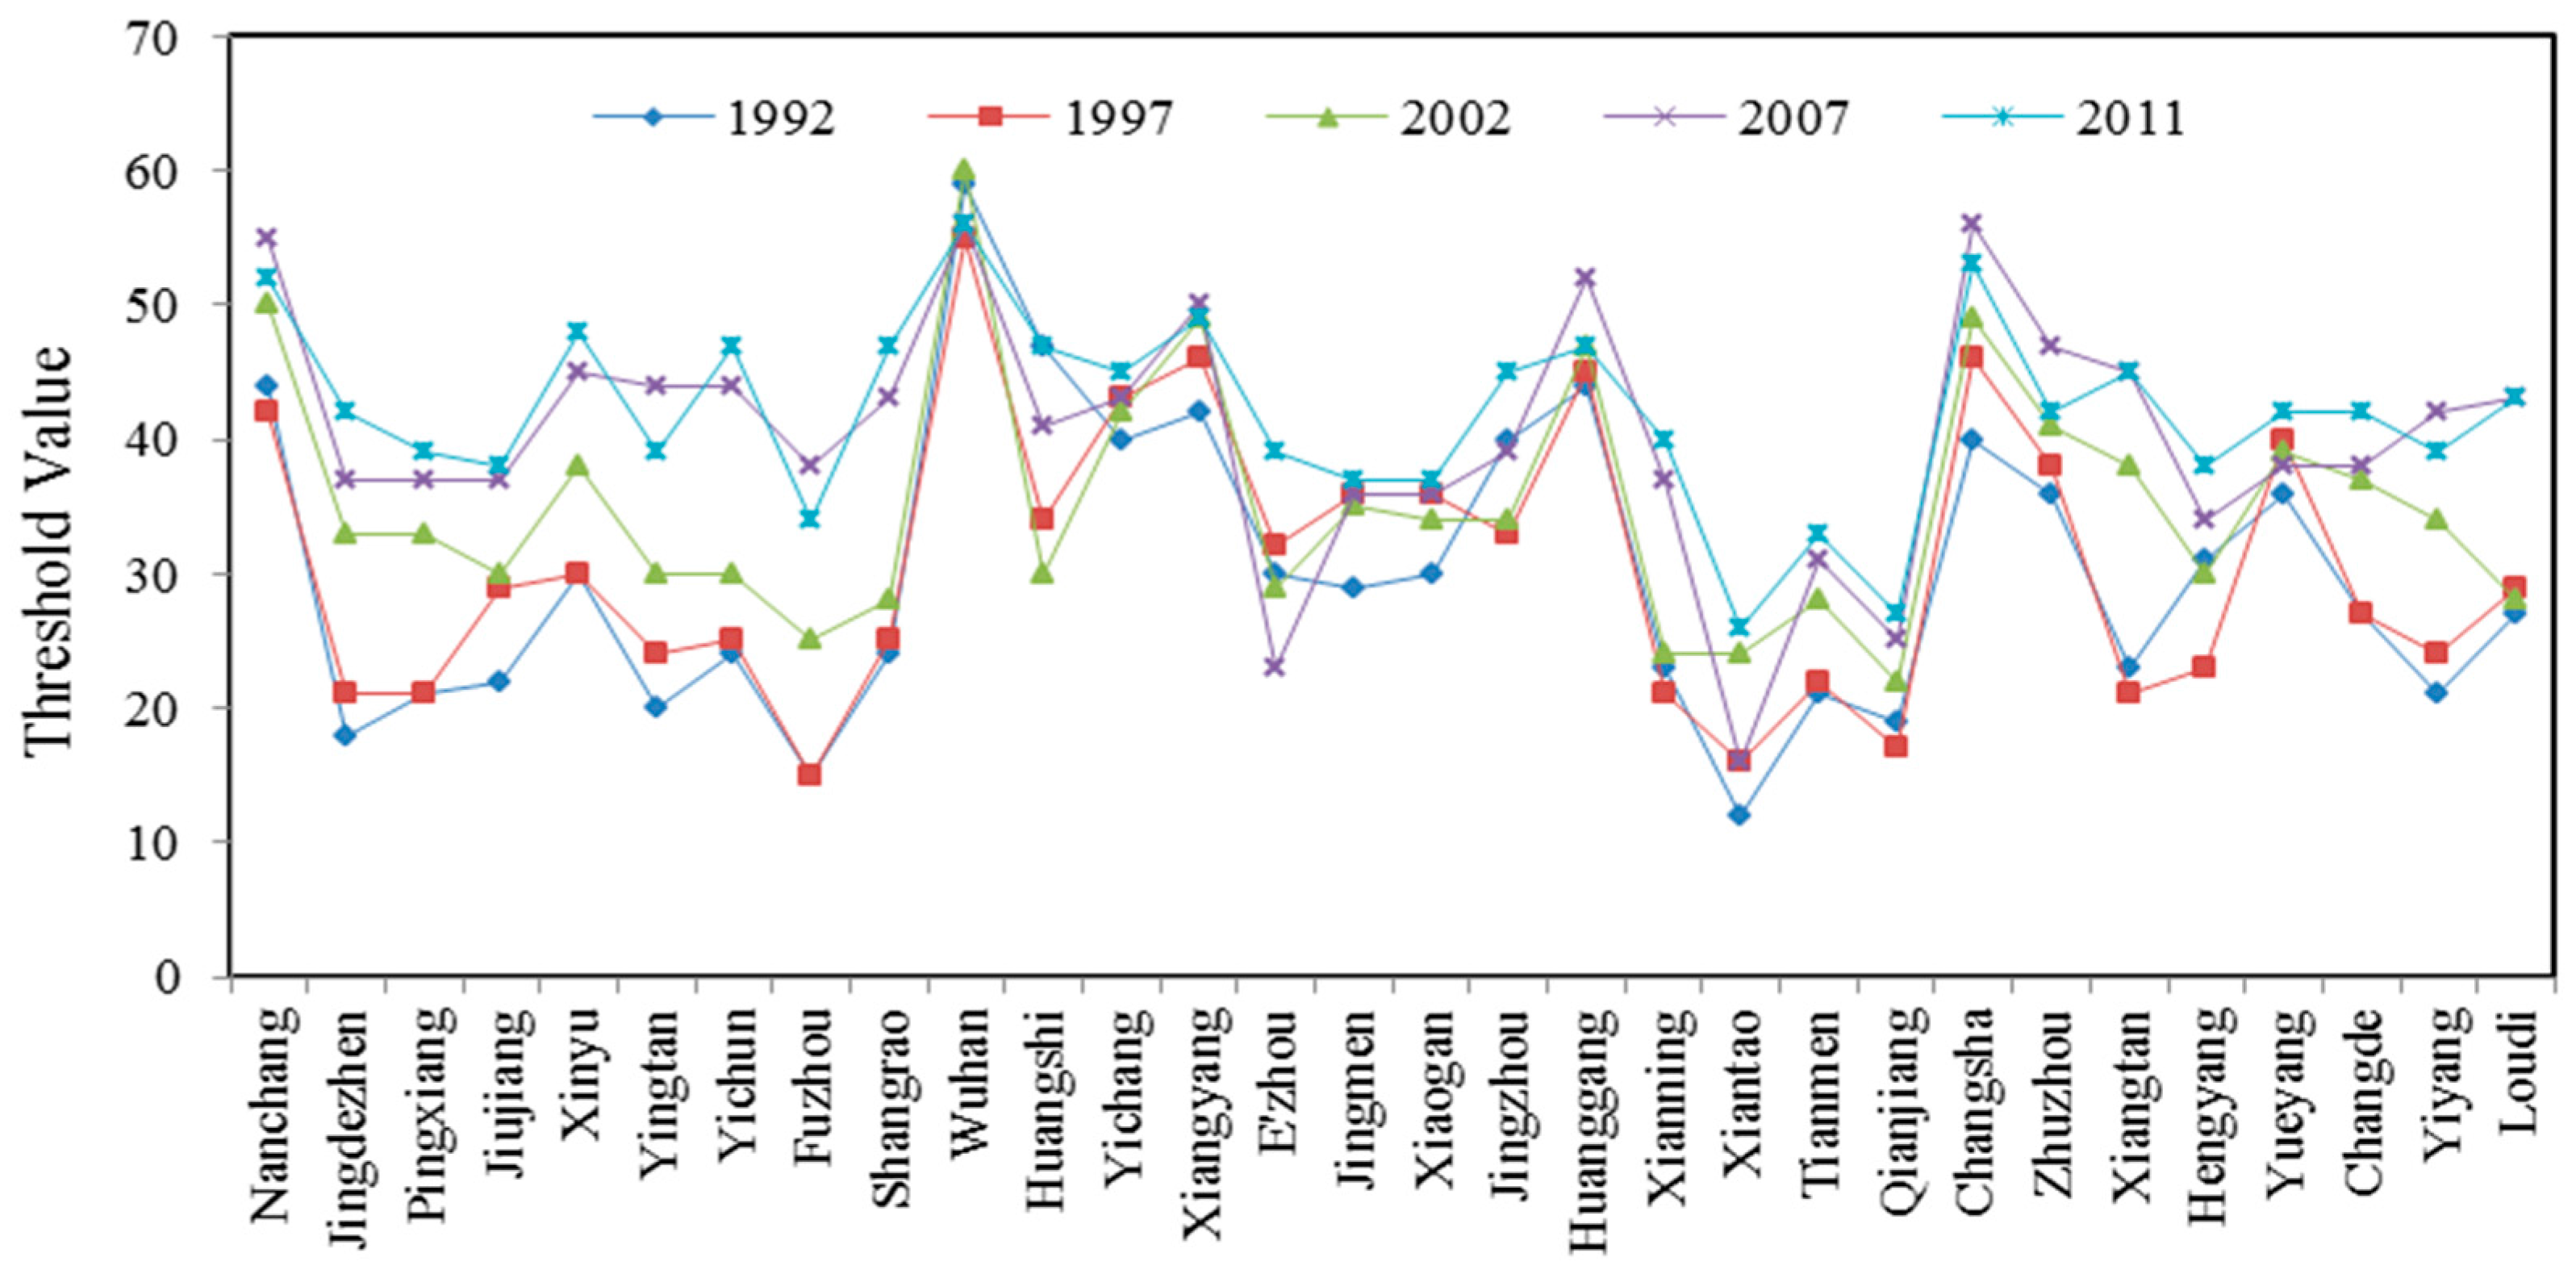
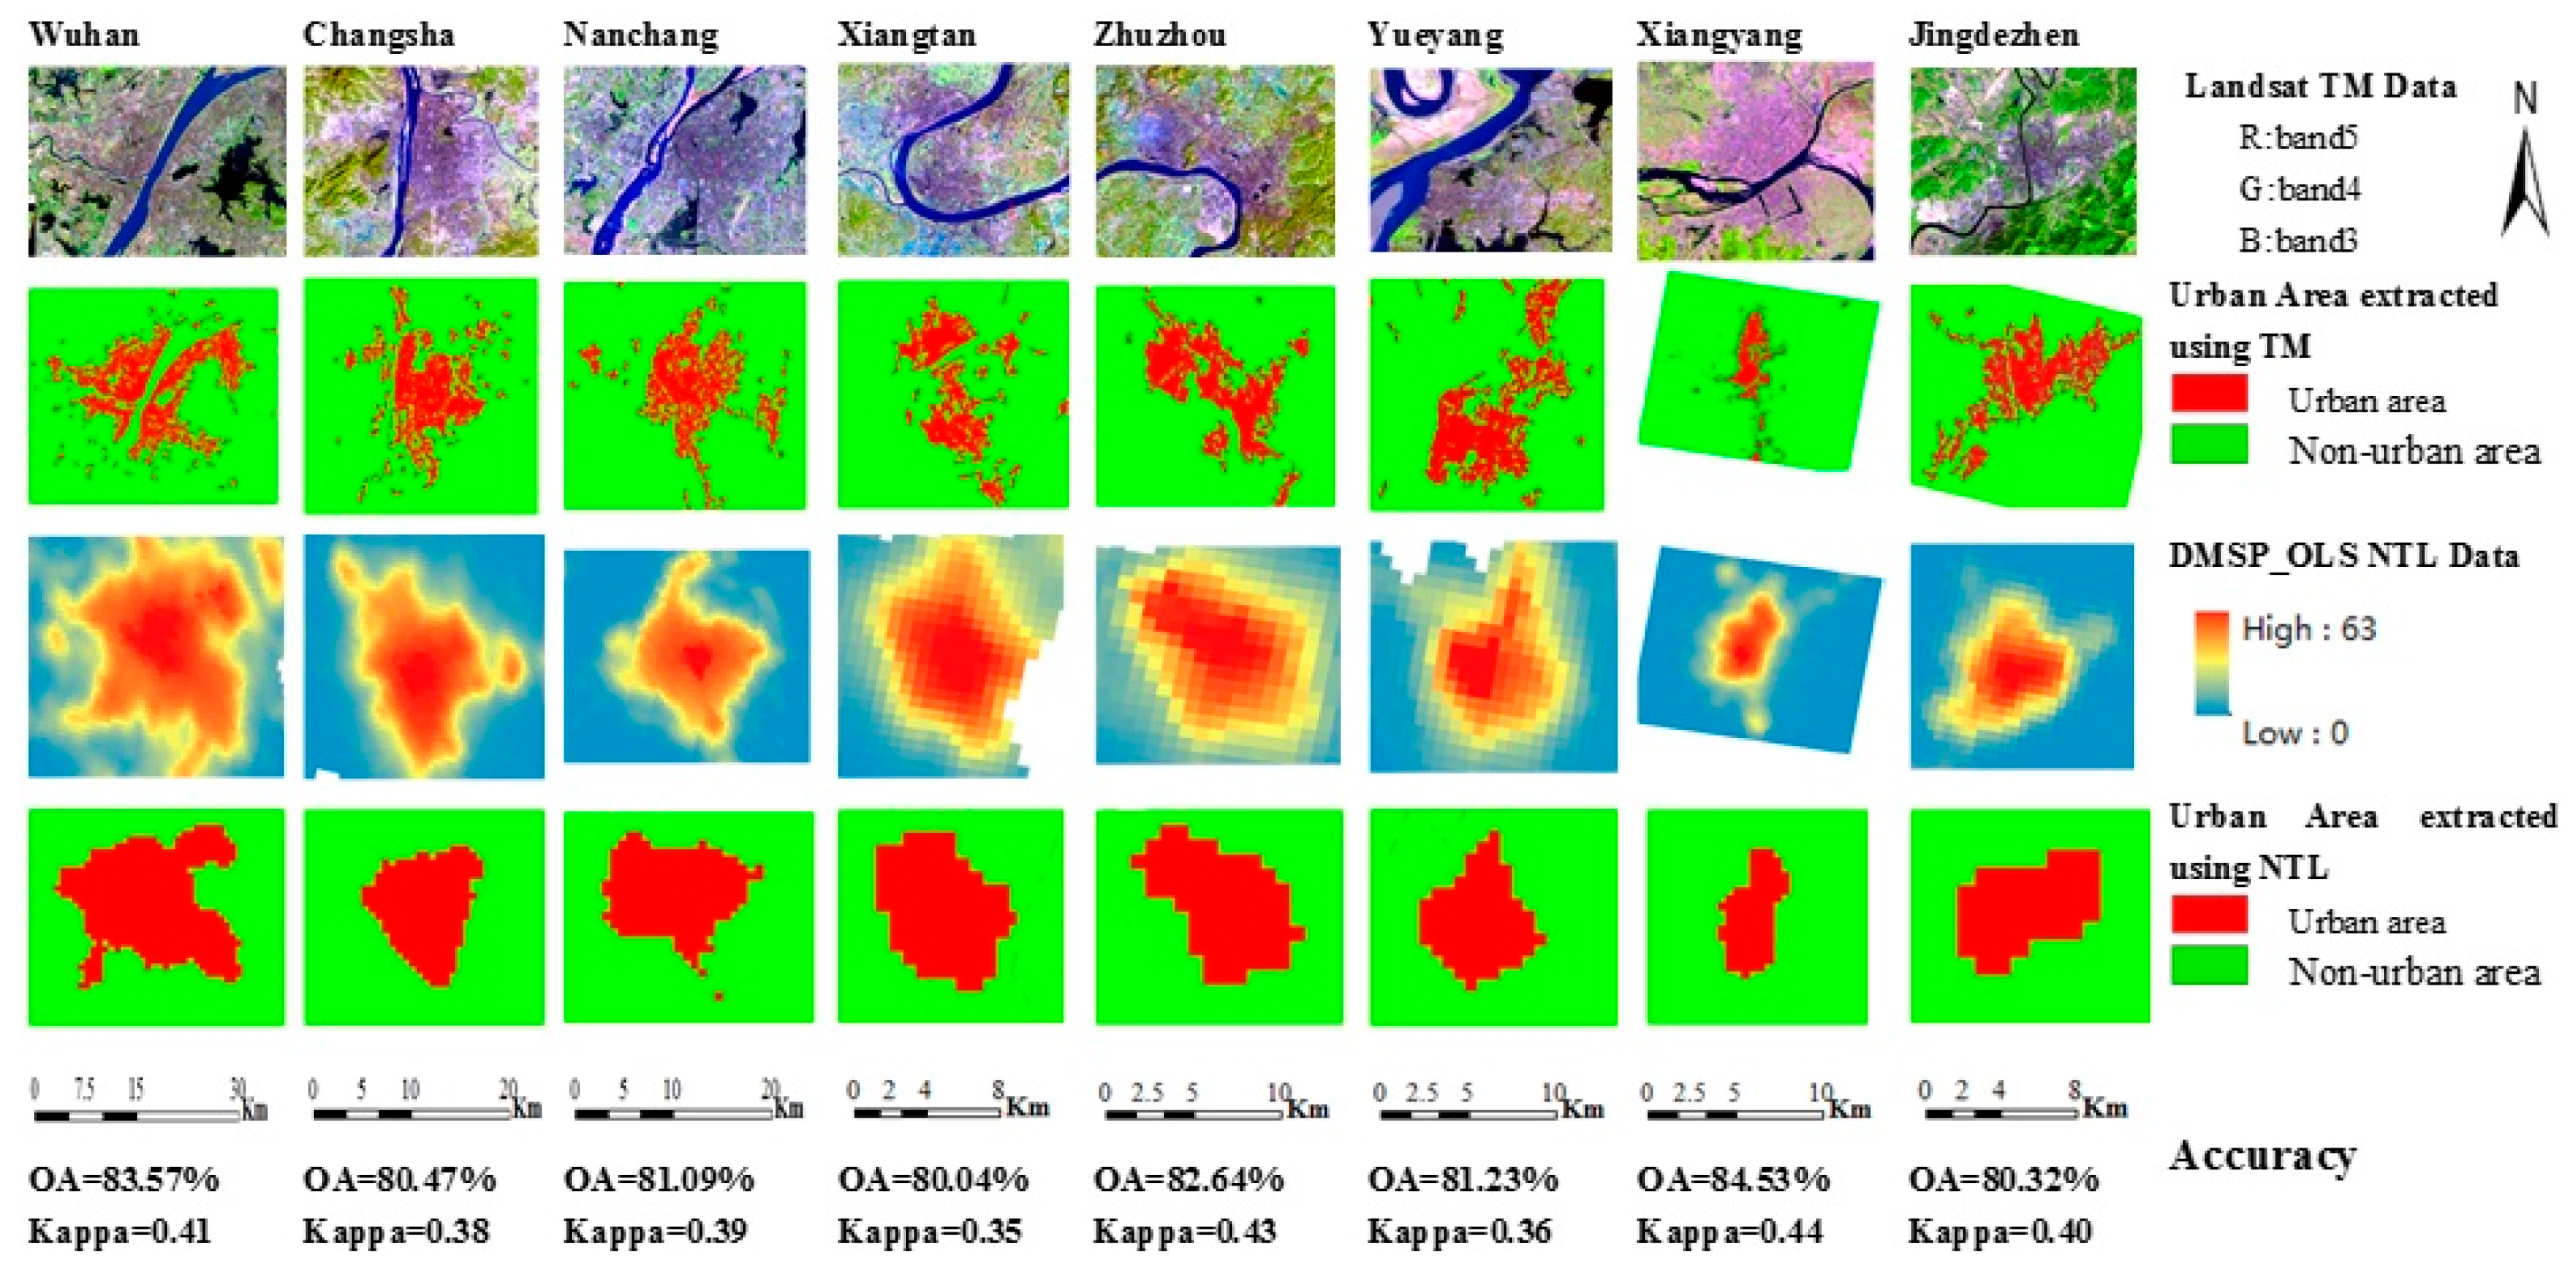
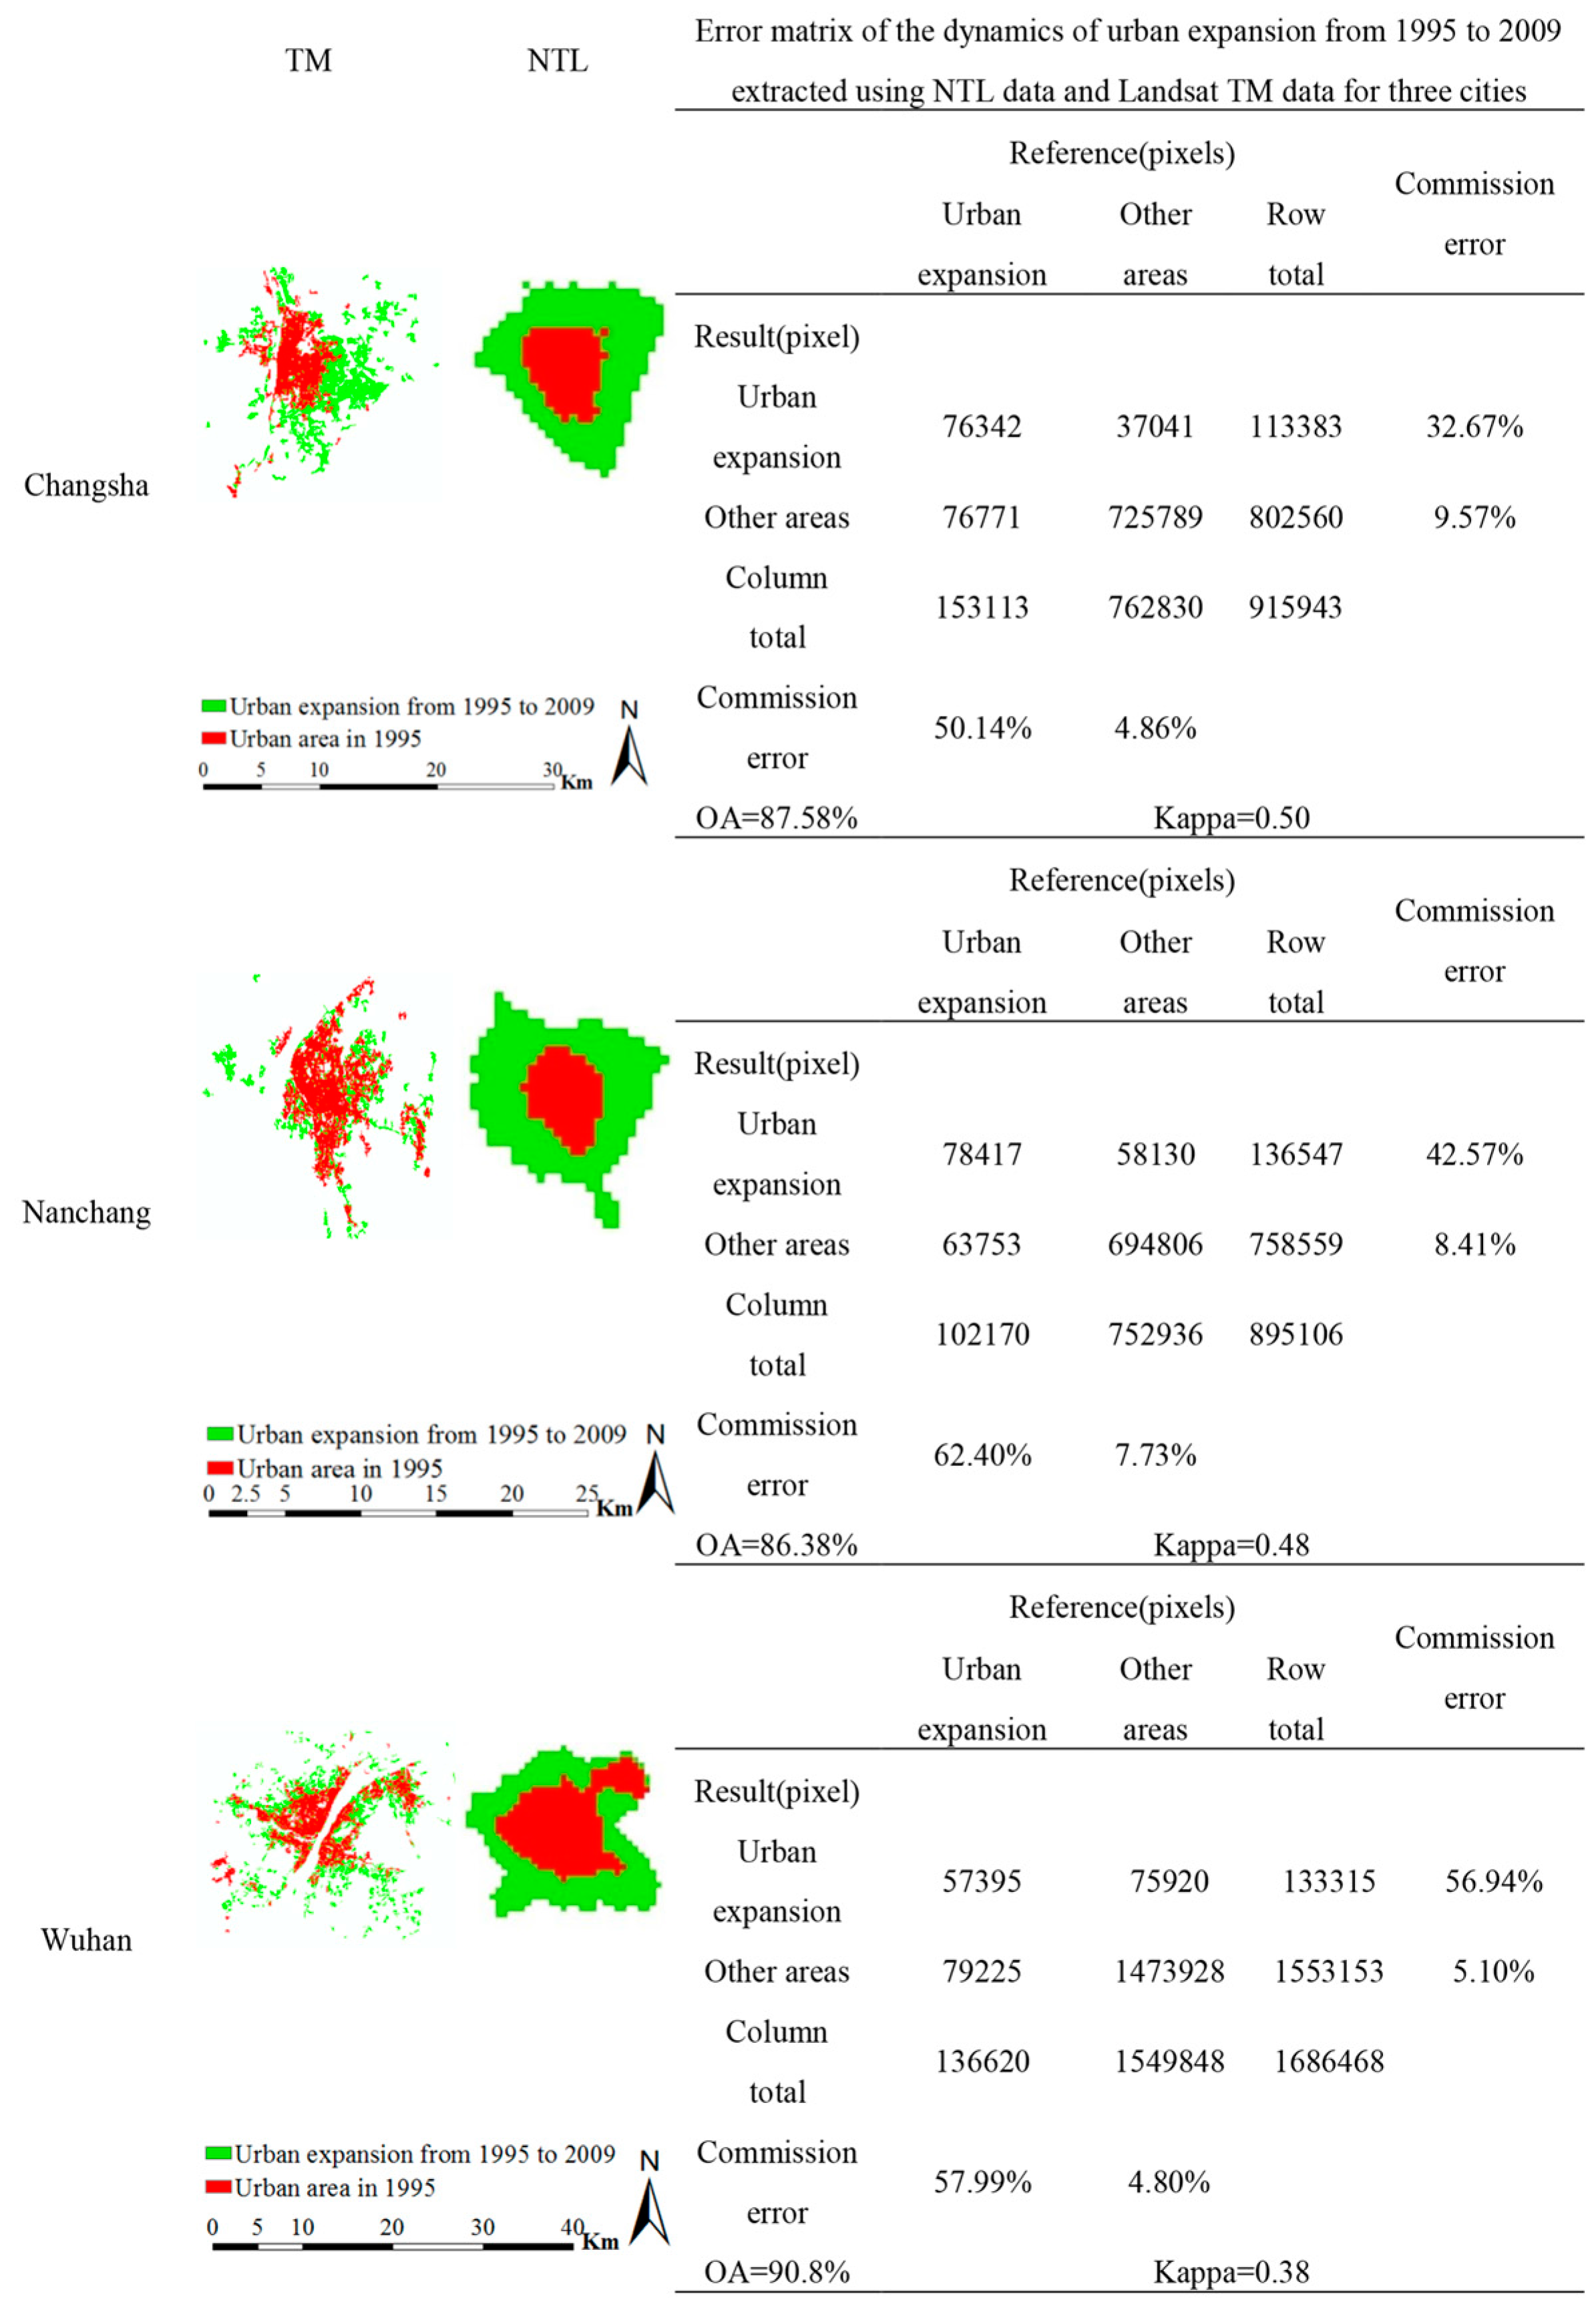
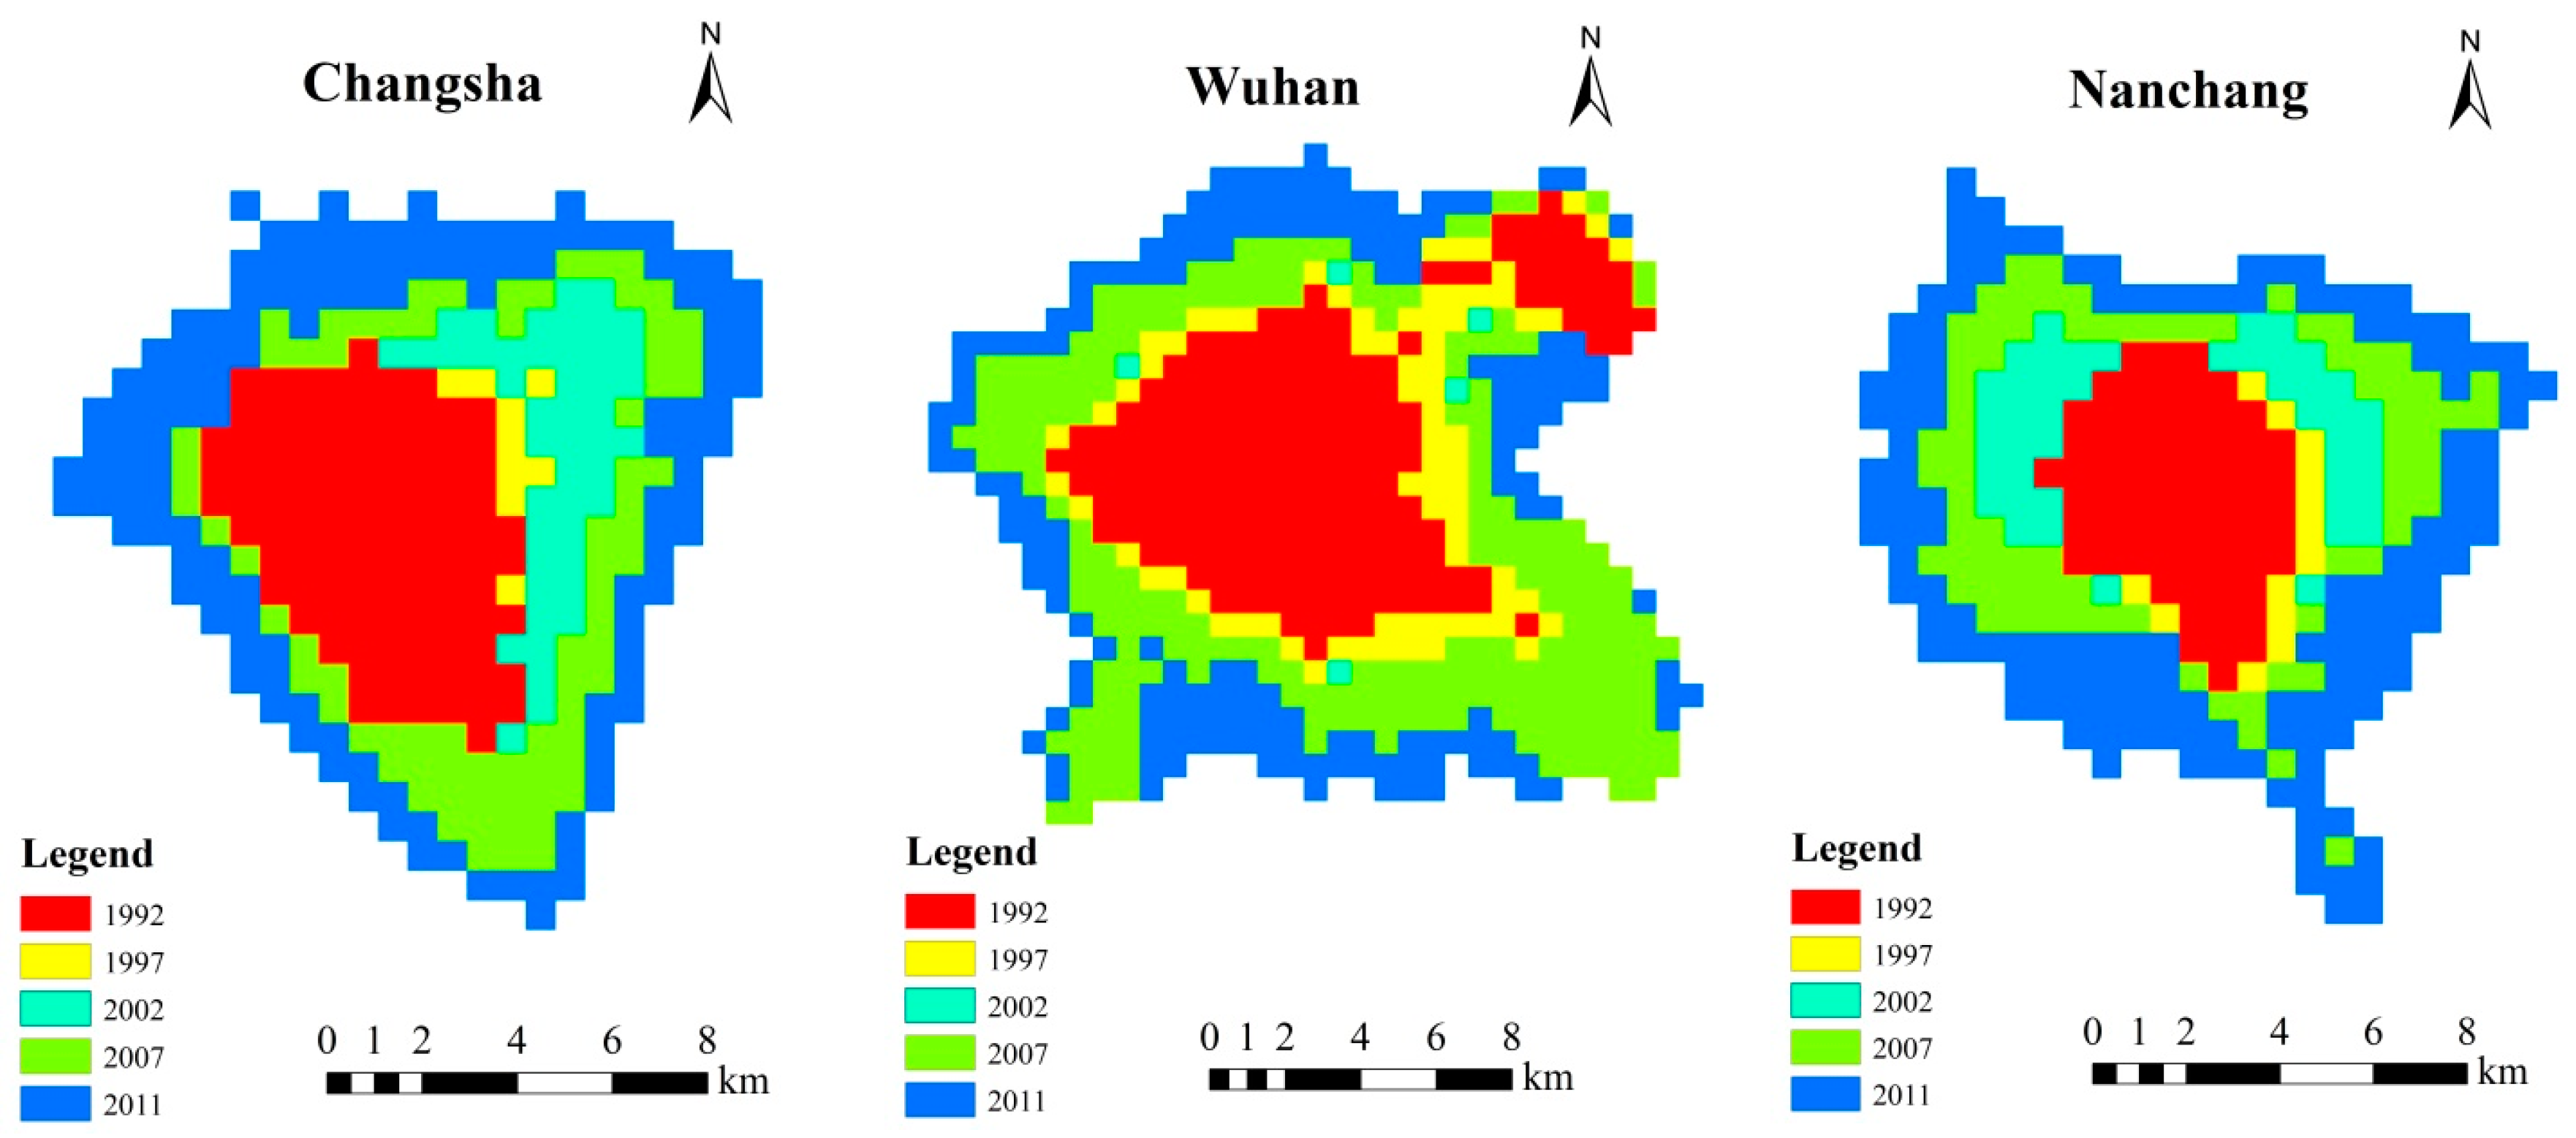
4.1. Urban Spatial Sprawl and Accuracy Assessment

Figure 3 shows the urban extents of 30 cities in MRYR in 1992, 1997, 2002, 2007, and 2011. Visually, every city experienced urban sprawl, but with different spatial and temporal characteristics. The response of NTL to the increase in urban area also varied across cities over time.
Figure 4 shows the optimal threshold for each city in different years. The difference among the optimal threshold can reflect the diversity in urbanization level within the city cluster. From Figure 4, the threshold representing the lightness of urban lit areas in every city continually increased from 1992 to 2011. Figure 3 further shows that the trend of urban sprawl was consistent with the increase in NTL luminous intensity. Due to the rapid development of urbanization in China in the period of 2002–2011, the value of the optimal threshold increased rapidly in all cities. This was especially true in Wuhan, Changsha, and Nanchang, where higher threshold values appeared to show the urban expansion in the provincial capital cities grew faster than prefecture cities during the same period.
Figure 5 shows the NTL-extracted urban areas in 2009. It reveals that urban areas extracted from NTL data were reasonably consistent with those from Landsat TM data, with an overall accuracy (OA) of 81.74% and a Kappa of 0.40 (Figure 5). Additionally, NTL-derived urban expansion in the three capital cities from 1995 to 2009 were more accurate, with an average OA of 88.25% and an average Kappa of 0.45 (Figure 6).

4.2. Spatiotemporal Variations in Urban Expansion

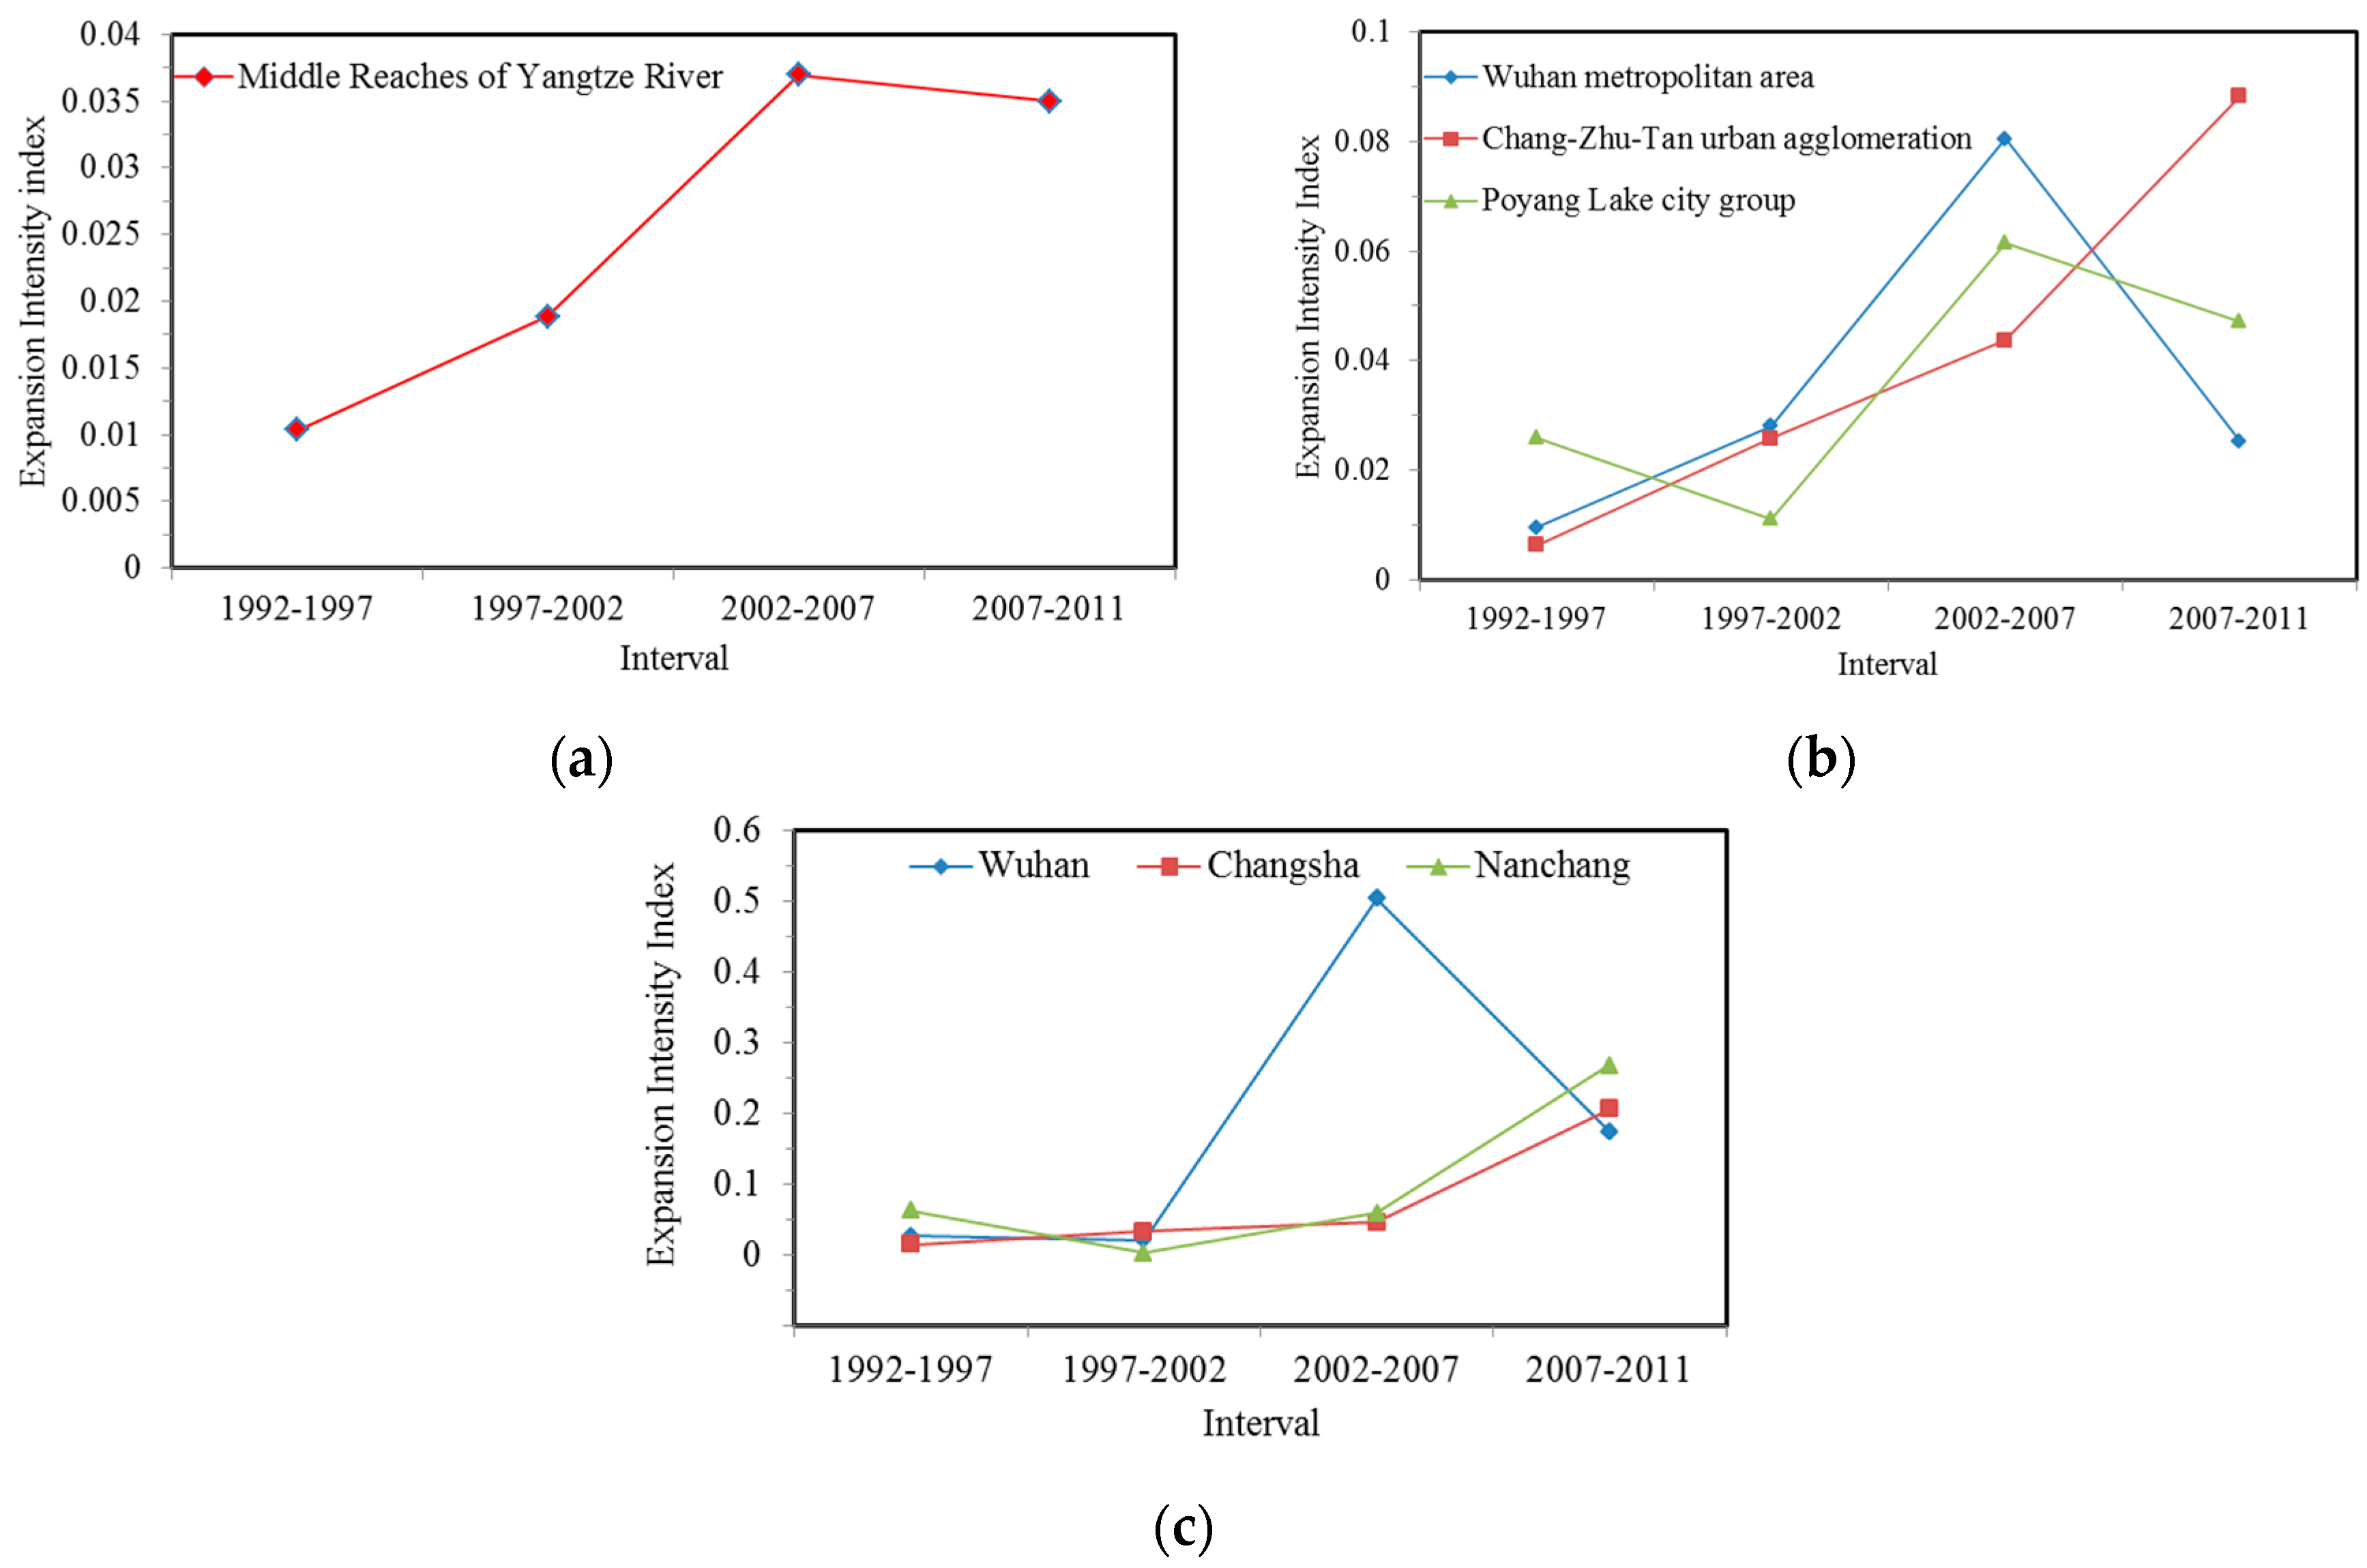
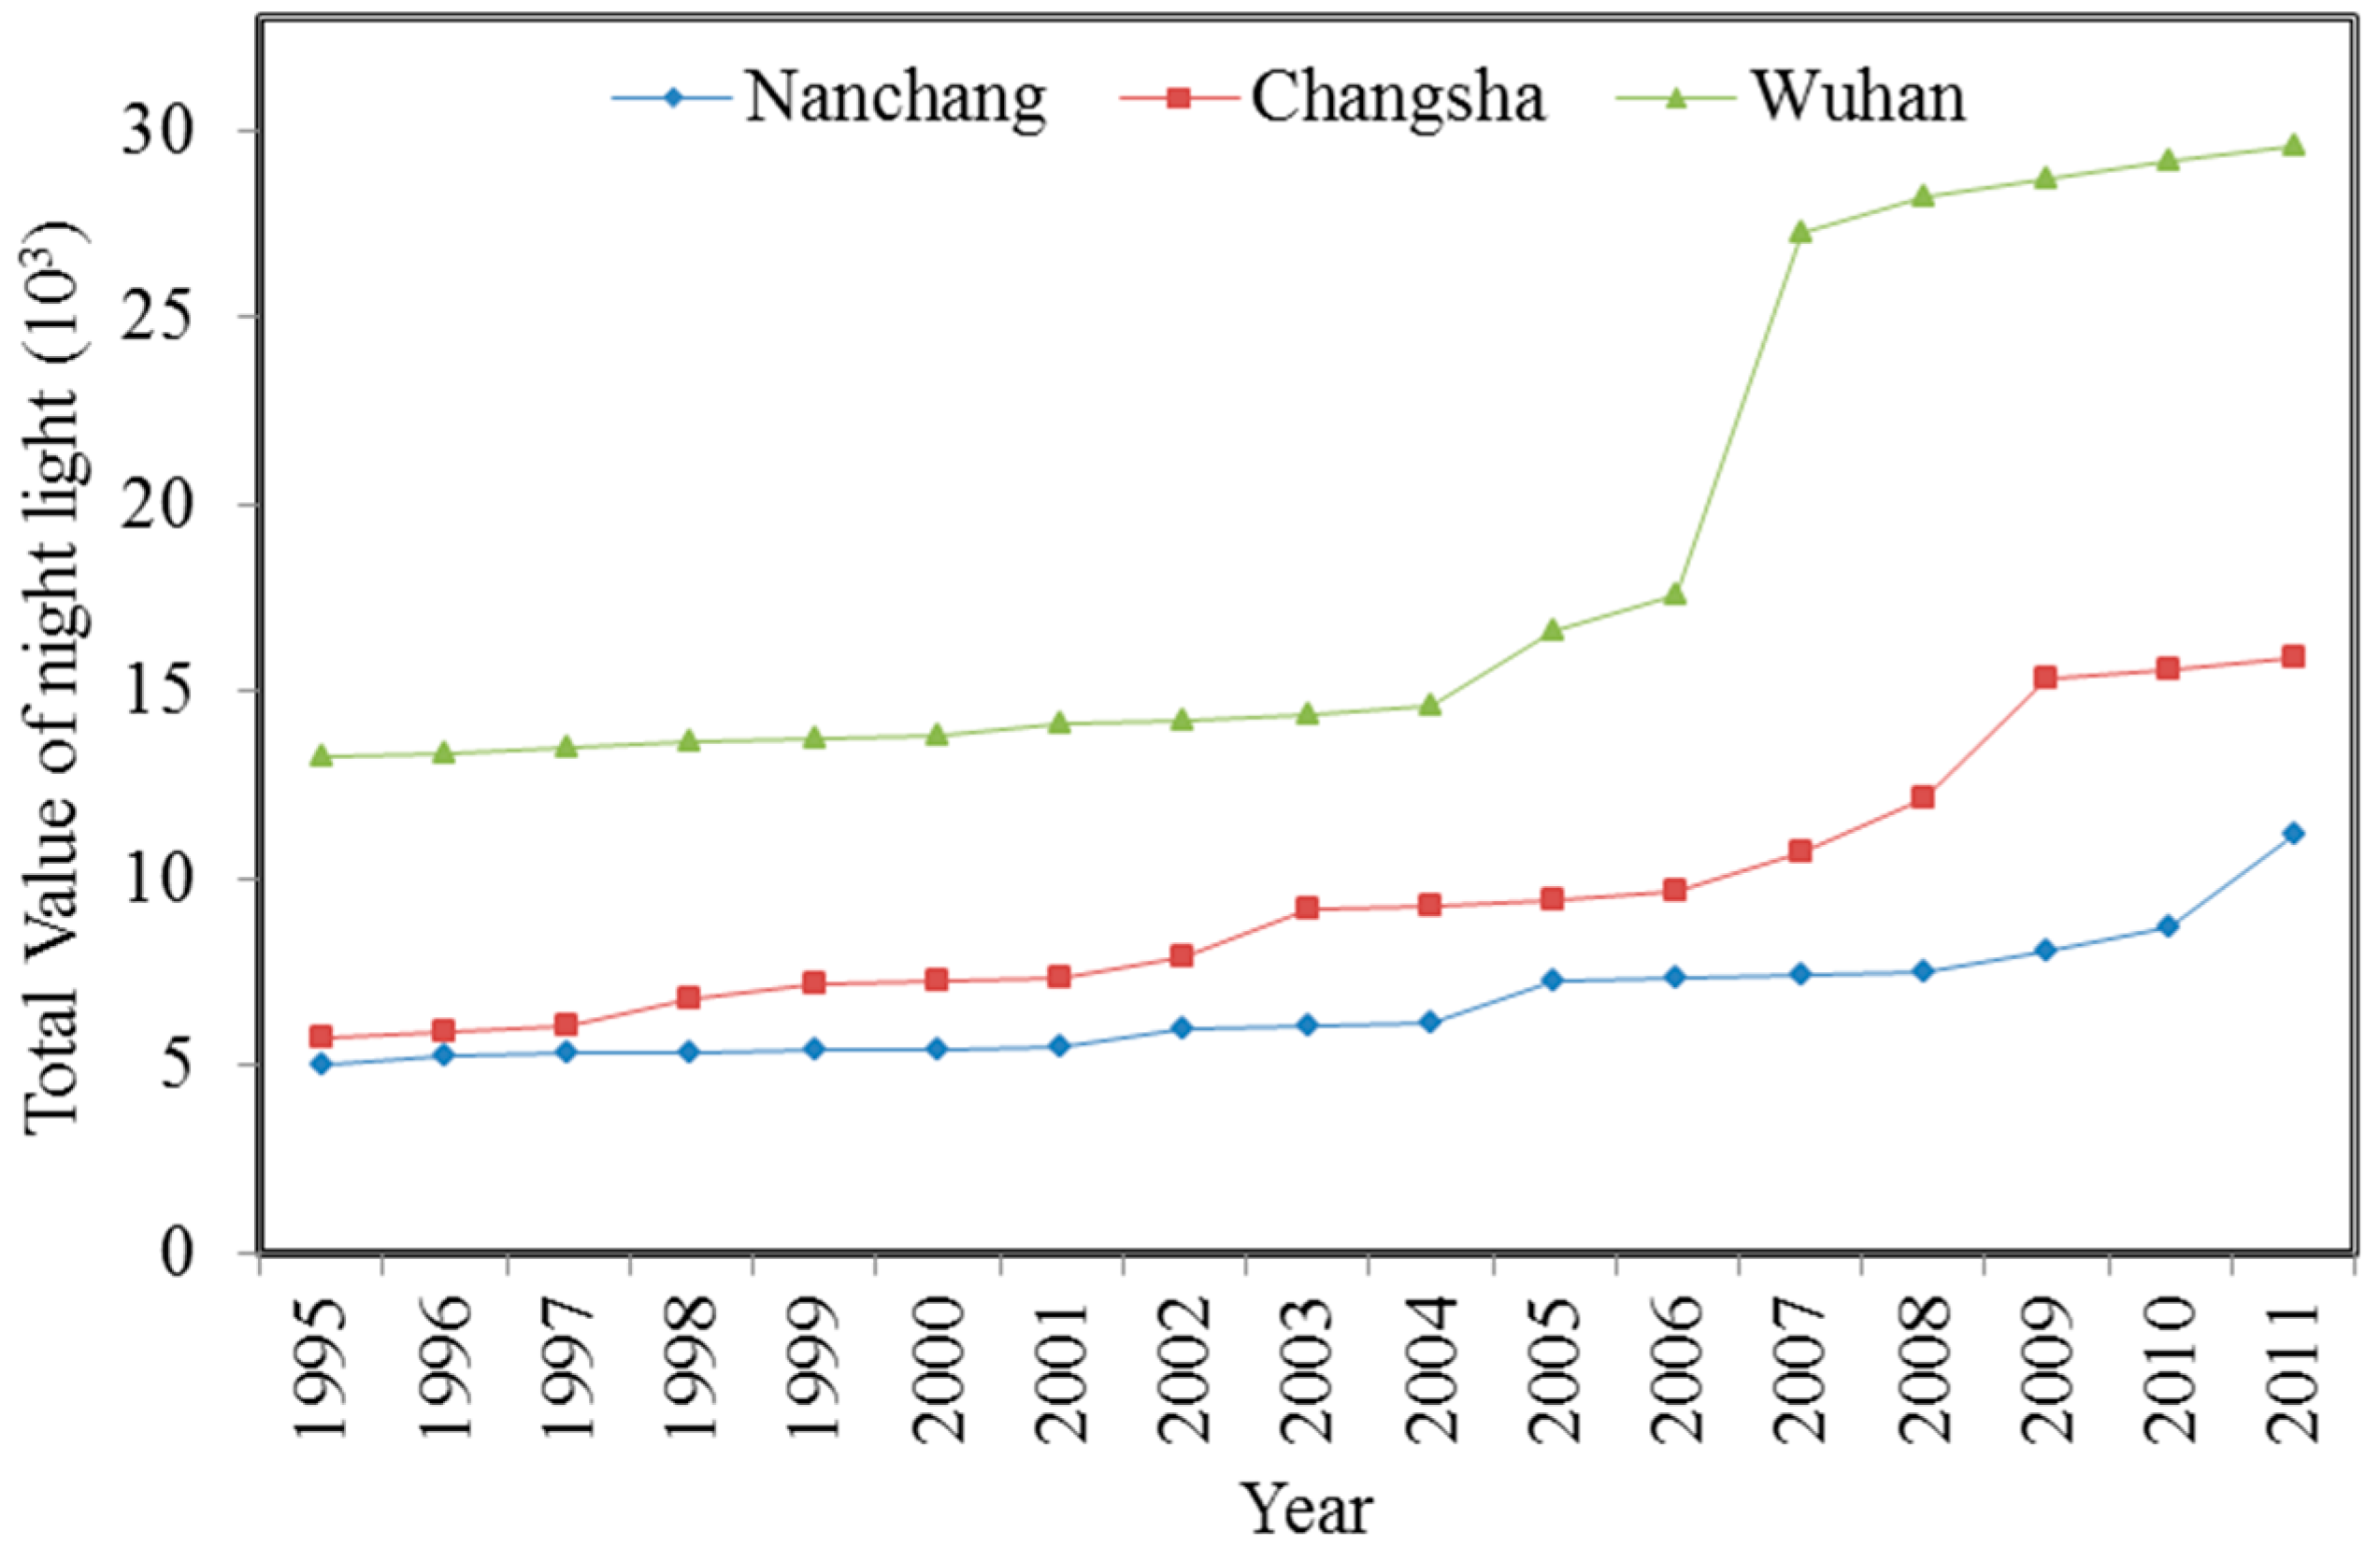
4.2.1. Dynamic of Urban Expansion Intensity

Table 2 and Figure 7a show that urban expansion in the entire city cluster was relatively weak during the period 1992–2002. However, urbanization increased after 2002, with the UI value increasing rapidly from 2002 to 2007 and decreasing gradually between 2007 and 2011. UI values varied among the three urban agglomerations or provincial cities (Figure 7b), indicating distinct development stages at different spatial units within the city cluster. The urban expansion intensity change for the Wuhan Metropolitan area was more similar to that of the entire cluster than other urban agglomerations. This reveals that change in urban area in the Wuhan Metropolitan area had the largest influence on the evolution of the urban spatial pattern for the whole city cluster. Meanwhile, UI curves of the provincial cities reflect their relatively higher influence on their corresponding urban agglomeration (Figure 7b,c).
Urban expansion intensity exhibited significant differences among different urban scales during different periods (Figure 7b,c). The major increase in UI value occurred in 2002–2007 for the Wuhan metropolitan area and Poyang lake city group. However, the UI value of the Chang-Zhu-Tan urban agglomeration continued to rise during the two decades and a major increase occurred in 2007–2011. Meanwhile, the three provincial cities exhibited different patterns of urban expansion.

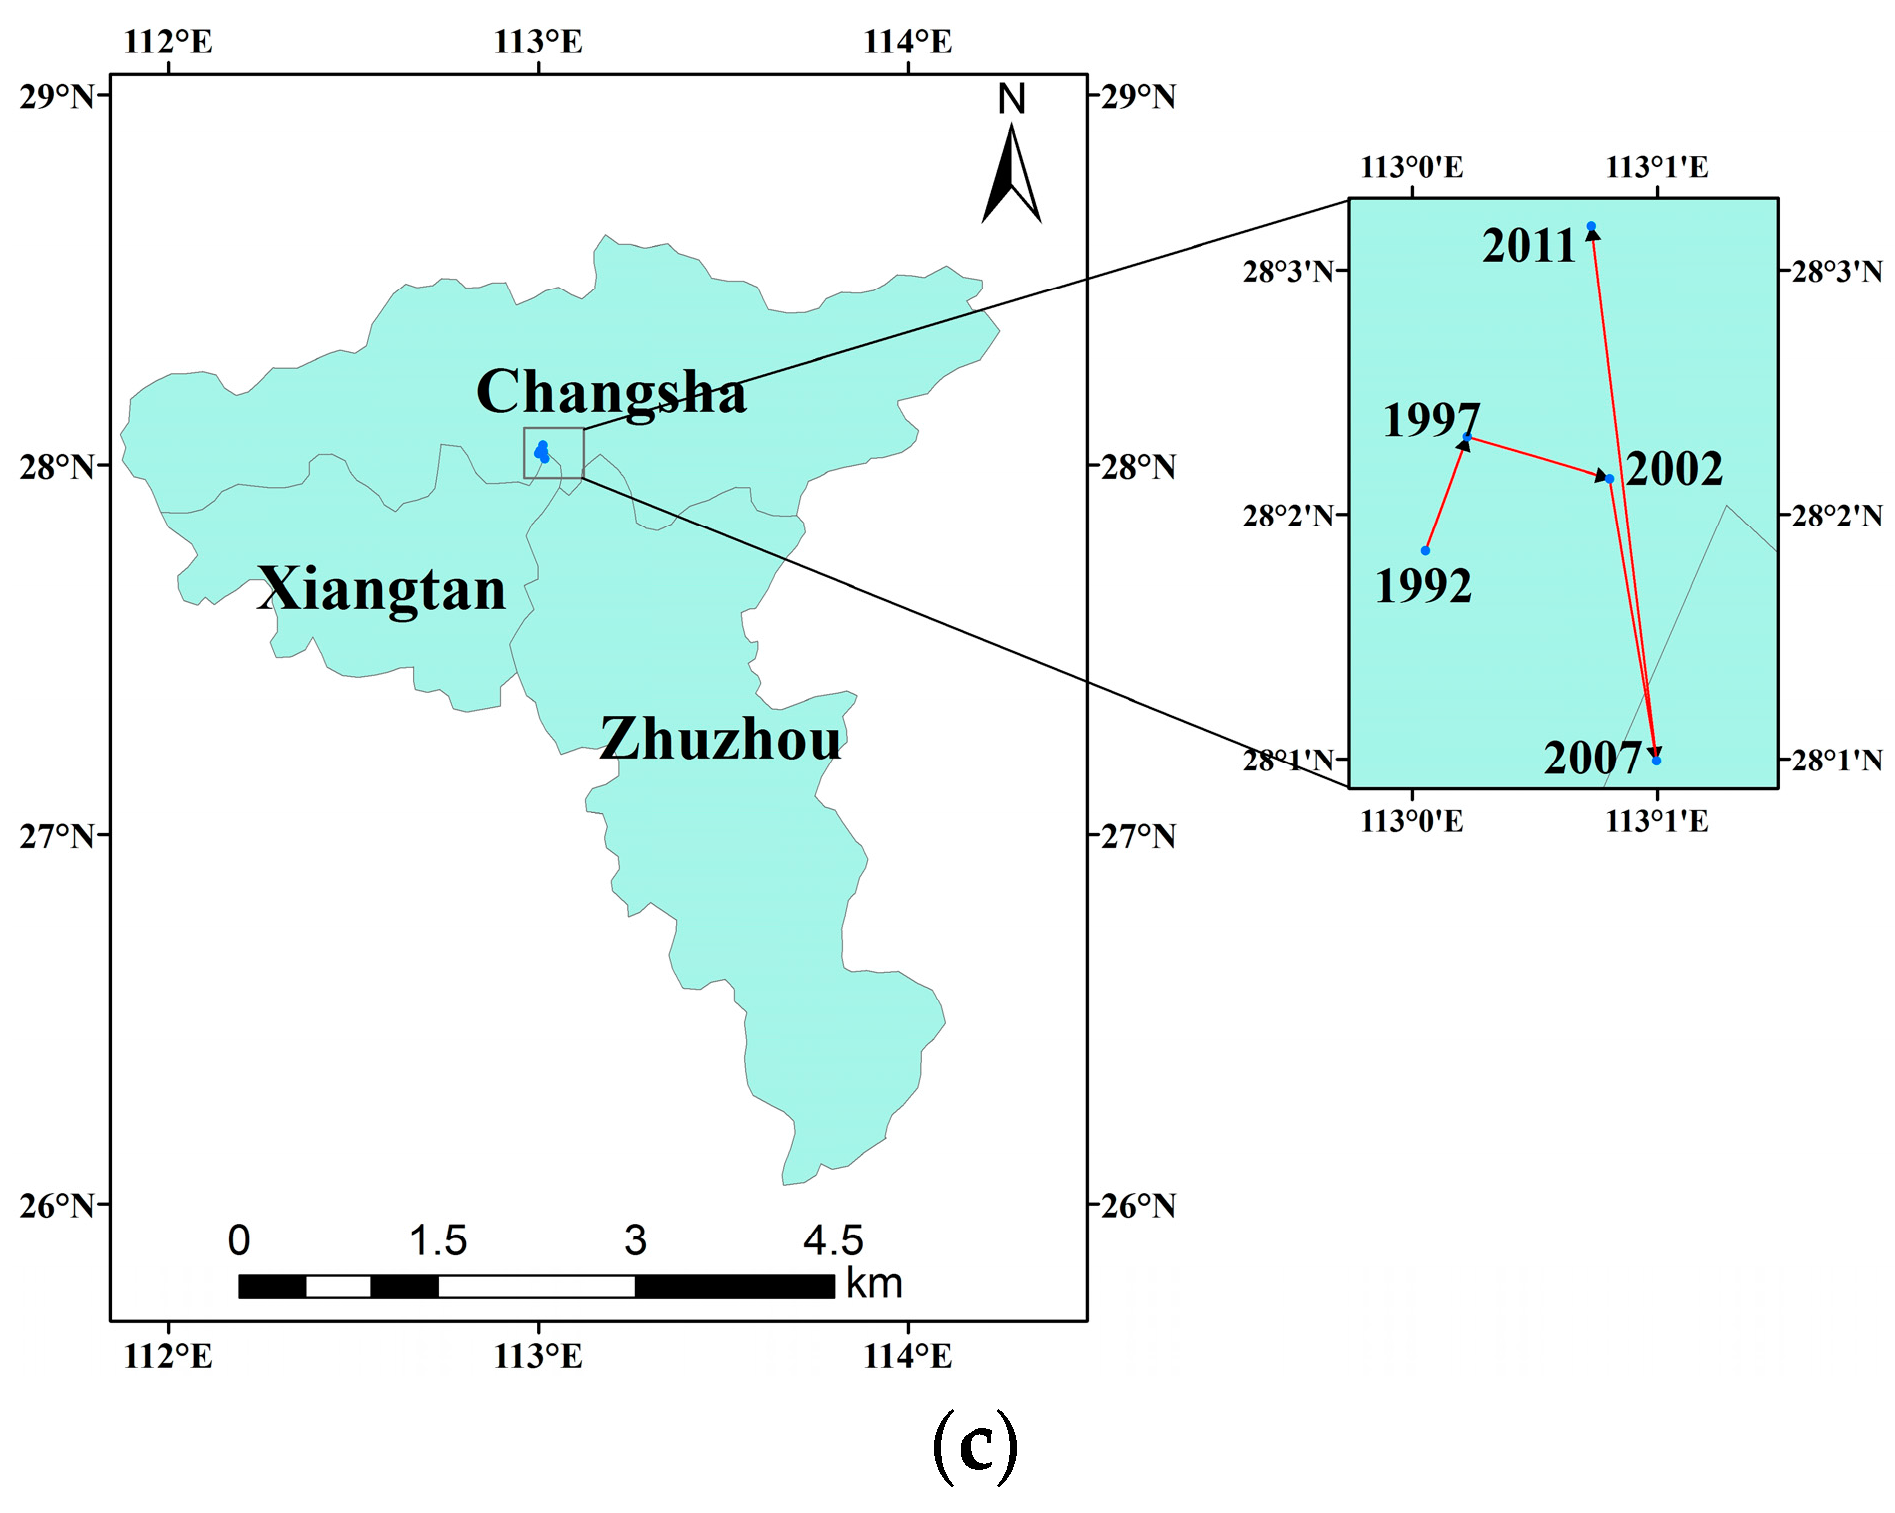
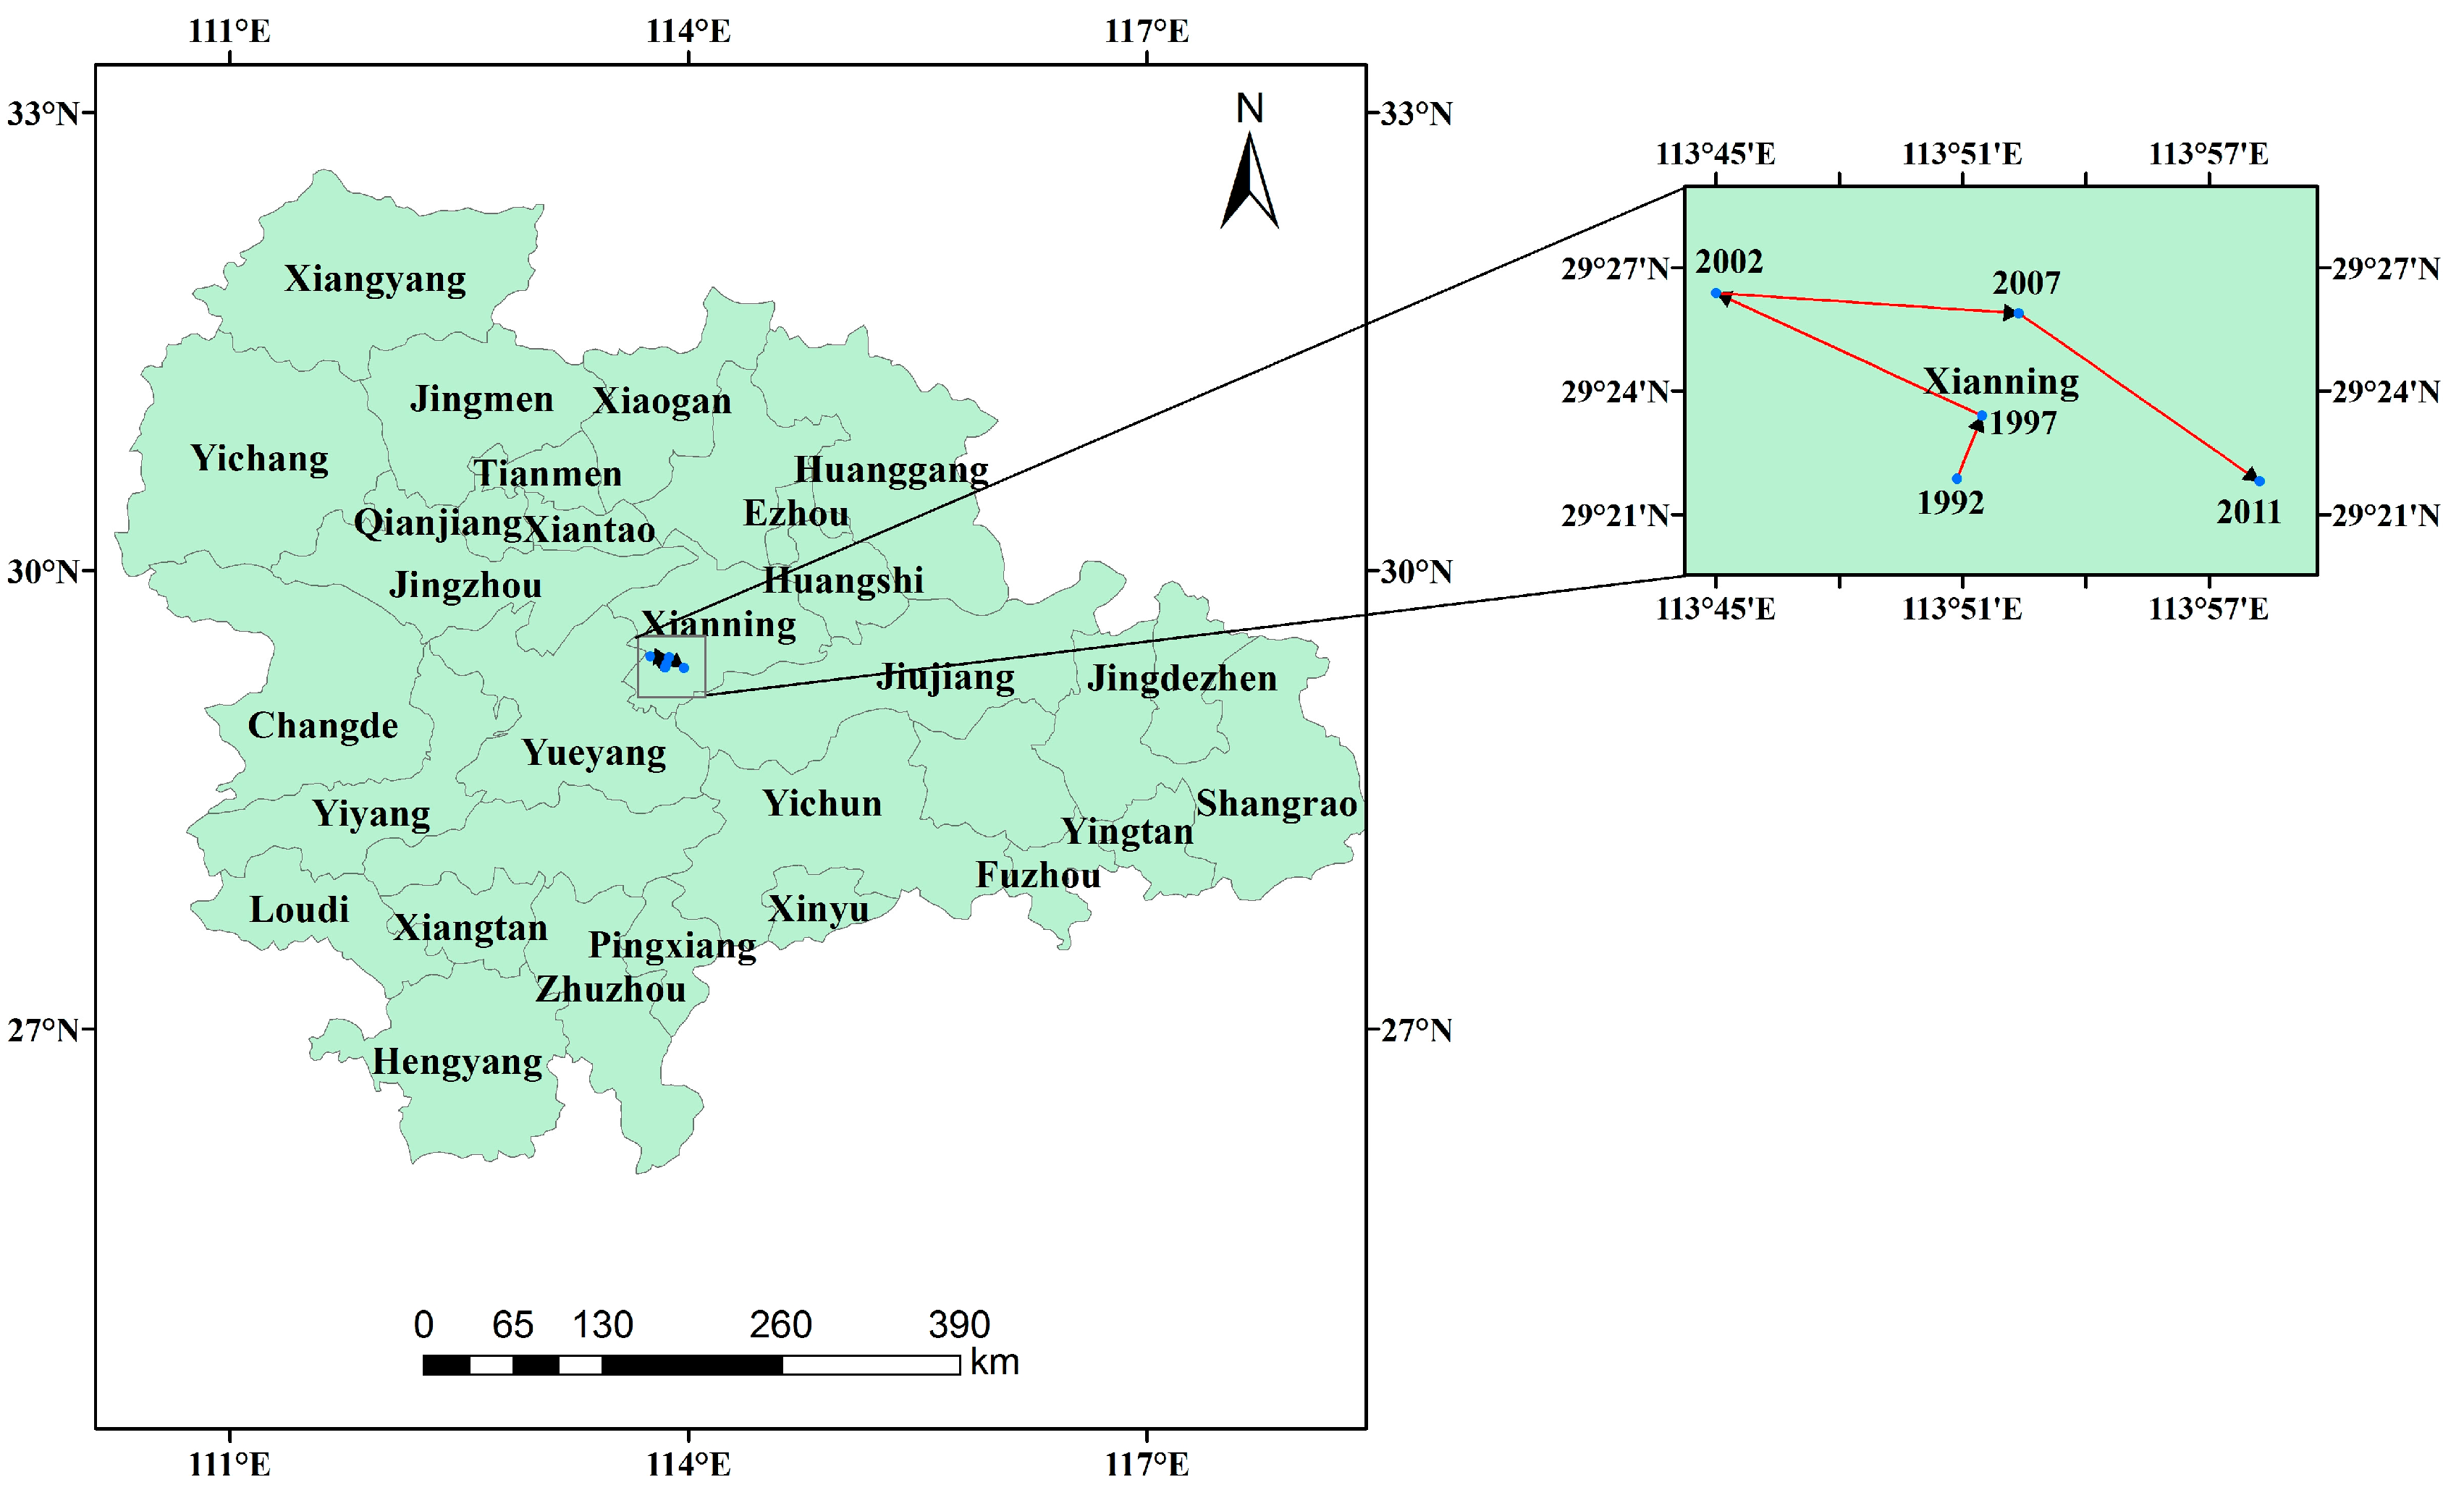
4.2.2. Urban Expansion Direction

Figure 8 shows the shift in the centroid of urban areas of the entire city cluster along the MRYR, which was located in the city of Xianning from 1992 to 2011. Although the centroid tended to shift firstly from south to north in 1992–2001 and moved toward the east in 2007, it experienced an inverse change from north to south for the period of 2007–2011. This implies that the gravity center has been steady. Figure 9 shows the gravity centre movement of urban areas in the three urban agglomerations. The gravity centroid for each agglomeration shifted within its corresponding capital city from 1992 to 2011. Figure 10 shows the urban expansion pattern for the core cities, indicating a radial expansion pattern for each city.

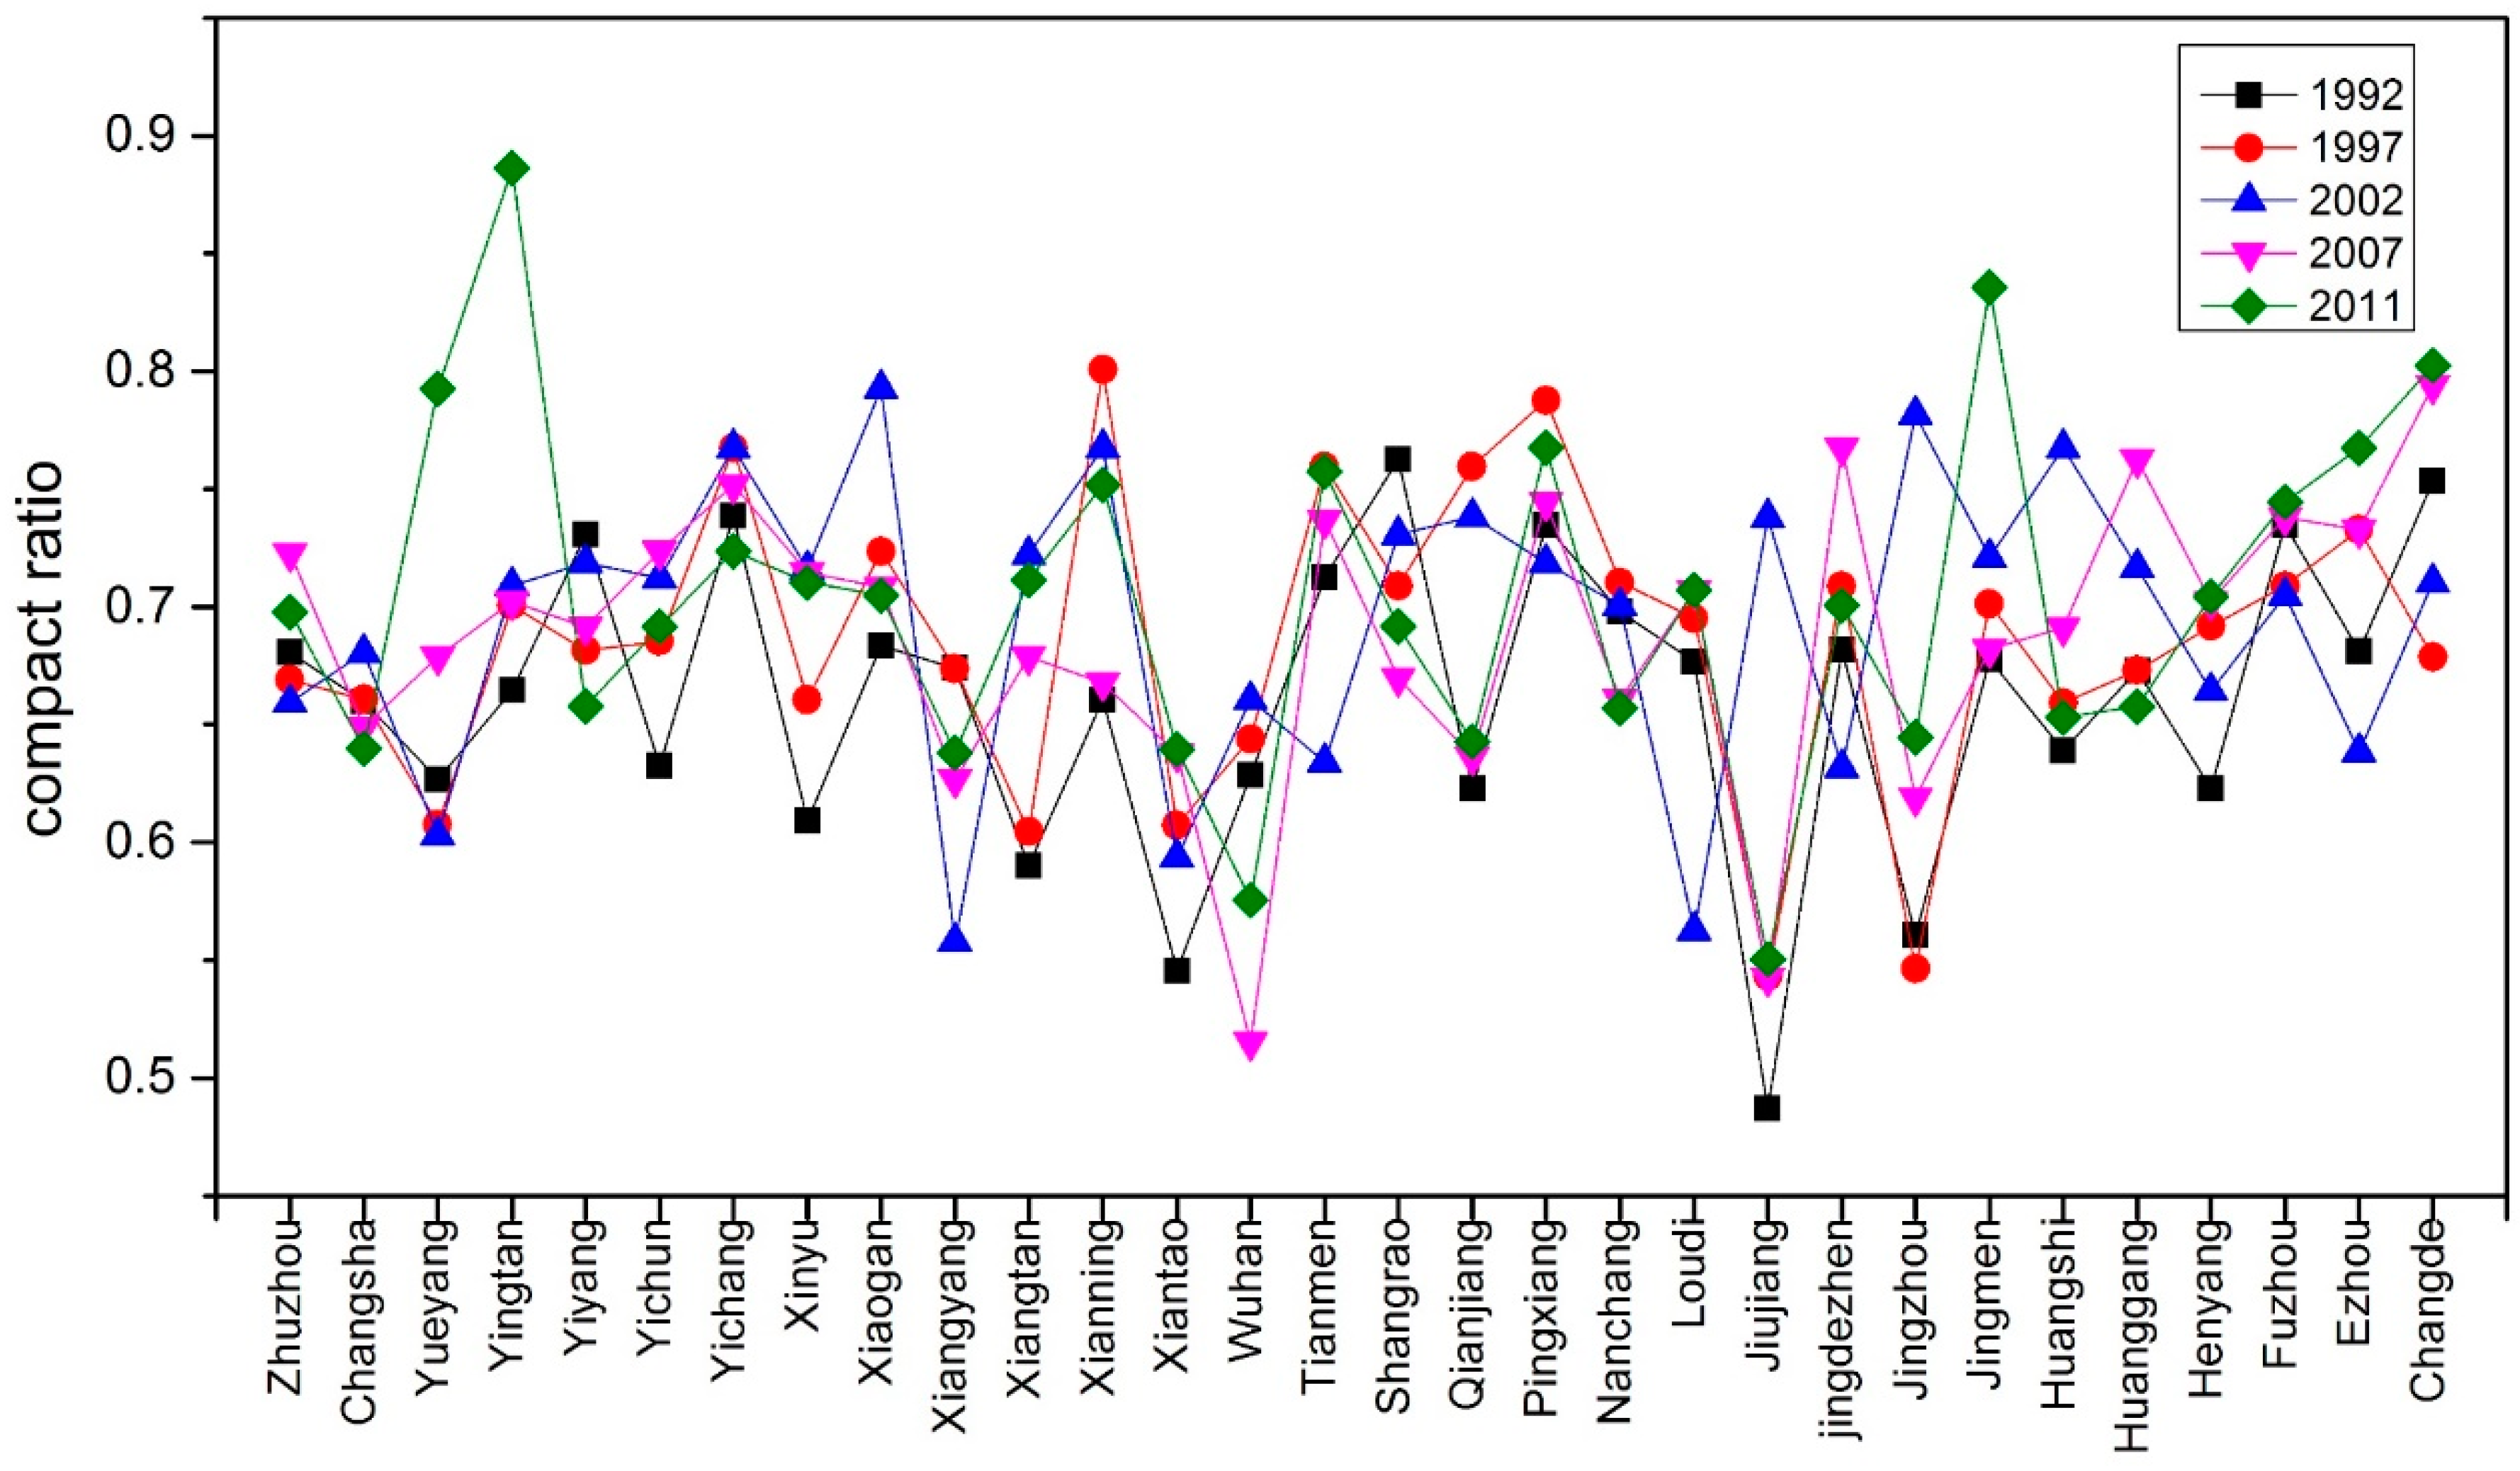
4.2.3. Urban Expansion Form

Figure 11 shows the urban compactness of each city in 1992, 1997, 2002, 2007, and 2011. The compactness for most cities ranged from 0.6 to 0.8, indicating that the urban extent in these cities was relatively compact during 1992–2011. Significant changes in urban compactness were observed in certain cities with rapid urban expansion. For example, in Wuhan, the compactness decreased from 0.66 to 0.51 from 2002 to 2007 when urban expansion intensity was greater than in other time periods. However, the compactness ratio increased in 2007–2011 with the urban expansion intensity decreasing gradually. Table 3 shows that the fractal dimension for all cities ranged from 1 to 1.4, indicating that the entire city cluster had a regular urban boundary. The small change in fractal dimension for the urban boundary of every city in 1992–2011 also reveals that urban development remained smooth and steady during the study period.

4.3. Relationship between Nighttime Light Brightness and Urbanization

In the study, the total value of NTL intensity in a city was defined as the total of DN values within the corresponding NTL-extracted urban area. Figure 12 shows the time-series NTL brightness from 1995 to 2011 for Wuhan, Changsha, and Nanchang. As indicated in Figure 12, the three cities exhibited positive but distinct trends of NTL growth from 1995 to 2011, which further reveals different urban expansion paths, both across cities and between time stages.
The partial correlation coefficients for all variables for the three capital cities are shown in Table 4. The correlations between NTL brightness and the driving factors were larger than 0.75, which also implies high correlations between independent variables.
For Changsha, we calculated the principal components as:
F 1 = 0.185 Z D + 0.183 Z P + 0.138 Z I + 0.184 Z E + 0.181 Z U + 0.180 Z S
where ZD, ZP, ZE, ZI, ZU, and ZS are the normalized variables corresponding to D, E, P, I, U, and S after the logarithm, respectively. We built the linear relationship between the principle components and ZL, representing the normalized variable corresponding to L after the logarithm, by the least square method. The linear relationship between ZL and F1 for Changsha is as follows:
Z L = 0.989 F 1
Further, we calculated the quantitative relationship between ZL and ZD, ZE, ZP, ZI, ZU, and ZS for Changsha as:
Z L = 0.1830 Z D + 0.1810 Z P + 0.1365 Z I + 0.1820 Z E + 0.1790 Z U + 0.1780 Z S
According to the calculation results, the value of constant K is 1 in the expanded STIRPAT model. Therefore, the corresponding quantitative relationship, based on the expanded STIRPAT model for Changsha, was built as:
L = D 0.1830 P 0.1810 I 0.1365 E 0.1820 U 0.1790 S 0.1780
Similarly, we built the STIRPAT model between the evolution of light brightness and urbanization dynamics respectively for Wuhan in Equation (13) and Nanchang in Equation (14).
L = D 0.1784 P 0.1678 I 0.1515 E 0.1803 U 0.1707 S 0.1784
L = D 0.1687 P 0.1707 I 0.1678 E 0.1677 U 0.1599 S 0.1687
When GDP, total fixed asset investment, tertiary industry, non-agricultural population, urban constructed area, and industrial output increased by 1%, the average growth of NTL brightness for the three cities was 0.1767%, 0.1767%, 0.1750%, 0.1732%, 0.1699%, and 0.1519%, respectively. The model results reveal the contribution order of the six urbanization factors on the NTL brightness. GDP and total fixed asset investment had the largest significant influence on the NTL brightness. Meanwhile, with the rapid development of high-tech industry, the tertiary industry has notably become an important factor controlling the NTL intensity in the study area.

5. Discussion

NTL information provides an accurate, economic, and direct way to monitor the development of urban areas [25,26,27,28]. Urban extent can be directly related to spatially luminous area derived from DMSP/OLS images. Time-series nighttime images can be used to measure urban sprawl in a more objective and consistent fashion, compared to the conventional census data. In this study, we combined the neighborhood statistics analysis and the local-optimized threshold method to detect urban expansion in the Middle Reaches of the Yangtze River during 1992–2011 (Figure 3). This combined method not only identified the urban extents from both the large urban areas and small urban patches, but also effectively prevented some fragments in suburban districts from being included in the extracted urban area for small- to medium-sized cities.
In order to assess NTL-derived urban area by this method, we compared the maps with the extracted urban areas from finer-resolution Landsat TM data. Landsat TM data have been widely used to extract the urban area in previous studies, and because of its higher resolution than NTL images (30 m vs. 1 km), it has been used for assessing NTL-derived urban extents [32,50]. Compared with the extracted urban areas from the Landsat TM data, urban sprawls extracted using corrected NTL data well-represented the spatial patterns in the study area. The average OA of urban expansion in the three capital cities from 1995 to 2009 was 88.25% (Figure 6). Compared to related research with an average OA of 86.27% for cities [32], our results are promising at the city level.
However, we also recognized the urban area extracted from either the TM data or NTL data may have errors. The possibility and uncertainty of using Landsat data to evaluate NTL-derived urban extents has been discussed in many studies [32,50]. The major sources of uncertainty can be categorized as follows: (1) difference between impervious surfaces and NTL-based urban definitions; and (2) limitations of DMSP OLS NTL data including coarse spatial resolution, saturation and blooming effects, and lacking an onboard calibration system. In addition, although Landsat TM data has proved feasible and acceptable for extracting urban areas, the available images contain uncertainties because of weather effects. Meanwhile, the data pre-processing process with geometric correction and resolution conversion inevitably will cause a loss of image fidelity.
From the spatiotemporal analysis of urban expansion viewpoint, we chose urban expansion intensity, direction, and form to show various spatial characteristics of urban extents at different spatial scales and different periods. Our results revealed the spatiotemporal heterogeneity of urban expansion in some cases. The results offer preliminary trend-analysis of the urbanization processes at the overall urban cluster level and the urban agglomeration level, as well as at the city level, which is vital for determining the drivers of local urban size changes. Further, the expanded STRIPAT model results indicated how long-term DMSP/OLS NTL brightness is affected by urban development factors driving the urbanization process. The main factors were gross domestic product, followed by total investment in fixed assets, tertiary industry, urban constructed area, non-agricultural population, and industrial output, although the statistical data may have some errors. The study could provide important insights for decision-making analysis in the future urbanization processes in the MRYR region.

6. Conclusions

In this study, we mapped the expansion of urban clusters in the MRYR by using time-series NTL images. Urban dynamics were investigated by combining neighborhood statistics analysis (NSA) with the local-optimized threshold method, with an overall accuracy of 81.7%. The results revealed that urban areas expanded significantly in the region during the period of 1992 to 2011, and that all cities exhibited dramatic growth in the past twenty years. However, the spatiotemporal heterogeneity of urban expansion existed at different spatial scales and in different time periods. The expansion of urban land was relatively slow in 1992–2002, but increased in 2002–2007, and then slowed down after 2007. Urban expansion direction and form also showed various spatial characteristics of urban extents at different spatial scales and across temporal stages. Overall, the city clusters in the MRYR region displayed a compact and radial urban expansion model.
Rapid economic development and urbanization were the primary reasons for urban expansion in the city clusters. This study built an expanded STIRPAT model for the three capital cities to investigate the relationship between the NTL brightness and six selected urbanization variables. The results revealed that long-term NTL brightness was affected by urbanization factors. Especially, we found that tertiary industry could be a salient factor in urban expansion in the main cities in the future.

Acknowledgments

This study was funded by the National Key R&D Program of China (2017YFC0601503), China Scholarship Council (201308430100), the National Natural Science Foundation of China (41472302 and 41730105) and Project of Innovation-driven Plan in CSU (2015CX008). The authors would like to thank the editors and anonymous referees for their valuable comments and suggestions, which helped improve the manuscript.

Author Contributions

Y.Z. and Q.W. conceived and designed the study. Y.Z., H.P., G.L. and K.Y. collected and processed the data, performed the analysis, and wrote the paper. Y.X. contributed to data analysis and writing. Q.W. edited the draft, and approved the submitted manuscript.

Conflicts of Interest

The authors declare no conflict of interest.

References

  1. Imhoff, M.L.; Bounoua, L.; DeFries, R.; Lawrence, W.T.; Stutzer, D.; Tucker, C.J.; Ricketts, T. The consequences of urban land transformation on net primary productivity in the United States. Remote Sens. Environ. 2004, 89, 434–443. [Google Scholar] [CrossRef]
  2. Cohen, B. Urbanization in developing countries: Current trends, future projections, and key challenges for sustainability. Technol. Soc. 2006, 28, 63–80. [Google Scholar] [CrossRef]
  3. Montgomery, M. The urban transformation of the developing world. Science 2008, 319, 761–764. [Google Scholar] [CrossRef] [PubMed]
  4. Triantakonstantis, D.; Mountrakis, G. Urban Growth Prediction: A Review of Computational Models and Human Perceptions. J. Geogr. Inf. Syst. 2012, 4, 555–587. [Google Scholar] [CrossRef]
  5. Li, Y. Urban-rural Linkages and Spatial-temporal Land Use Change in Beijing-Tianjin-Hebei Metropolitan Region: A New Perspective. Sustain. Dev. 2011, 4, 61–72. [Google Scholar] [CrossRef]
  6. Xie, Y.; Fang, C.; Lin, G.; Gong, H.; Qiao, B. Tempo-Spatial Patterns of Land Use Changes and Urban Development in Globalizing China: A Study of Beijing. Sensors 2007, 7, 2881–2906. [Google Scholar] [CrossRef] [PubMed]
  7. Milesi, C.; Elvidge, C.D.; Nemani, R.R.; Running, S.W. Assessing the impact of urban land development on net primary productivity in the southeastern United States. Remote Sens. Environ. 2003, 86, 401–410. [Google Scholar] [CrossRef]
  8. Alberti, M. The effects of urban patterns on ecosystem function. Int. Reg. Sci. Rev. 2005, 28, 168–192. [Google Scholar] [CrossRef]
  9. Xie, Y.; Weng, Q. World energy consumption pattern as revealed by DMSP-OLS nighttime light imagery. Gisci. Remote Sens. 2015, 53, 265–282. [Google Scholar] [CrossRef]
  10. Zhou, Y.; Zhang, L. China’s urban economic regions in the open context. Acta Geogr. Sin. 2003, 58, 271–284. (In Chinese) [Google Scholar]
  11. Ghosh, T.; Anderson, S.; Powell, P.L.; Sutton, P.C.; Eividge, C.D. Estimation of Mexico’s Informal Economy and Remittances Using Nighttime Imagery. Remote Sens. 2009, 1, 418–444. [Google Scholar] [CrossRef]
  12. Liu, J.; Zhang, Z.; Xu, X.; Kuang, W.; Zhou, W.; Zhang, S.; Li, R.; Yan, C.; Yu, D.; Wu, S. Spatial patterns and driving forces of land use change in China during the early 21st century. J. Geogr. Sci. 2010, 20, 483–494. [Google Scholar] [CrossRef]
  13. Yi, K.; Zeng, Y.; Wu, B. Mapping and evaluation the process, pattern and potential of urban growth in China. Appl. Geogr. 2016, 71, 44–55. [Google Scholar] [CrossRef]
  14. Weng, Q. A remote sensing? GIS evaluation of urban expansion and its impact on surface temperature in the Zhujiang Delta, China. Int. J. Remote Sens. 2001, 22, 1999–2014. [Google Scholar]
  15. Ji, W.; Ma, J.; Twibell, R.W.; Underhill, K. Characterizing urban sprawl using multi-stage remote sensing images and landscape metrics. Comput. Environ. Urban. Syst. 2006, 30, 861–879. [Google Scholar] [CrossRef]
  16. Jat, M.K.; Garg, P.K.; Khare, D. Monitoring and modeling of urban sprawl using remote sensing and GIS techniques. Int. J. Appl. Earth Obs. Geoinf. 2008, 10, 26–43. [Google Scholar] [CrossRef]
  17. Weng, Q. Remote sensing of impervious surfaces in the urban areas: Requirements, methods, and trends. Remote Sens. Environ. 2012, 117, 34–49. [Google Scholar] [CrossRef]
  18. Liu, J.; Zhang, Q.; Hu, Y. Regional differences of China’s urban expansion from late 20th to early 21st century based on remote sensing information. Chin. Geogr. Sci. 2012, 22, 1–14. [Google Scholar] [CrossRef]
  19. Taubenböck, H.; Wegmann, M.; Roth, A.; Mehl, H.; Dech, S. Urbanization in India—Spatiotemporal analysis using remote sensing data. Comput. Environ. Urban. Syst. 2009, 33, 179–188. [Google Scholar] [CrossRef]
  20. Hansen, C.M.; Loveland, R.T. A review of large area monitoring of land cover change using Landsat data. Remote Sens. Environ. 2012, 122, 66–74. [Google Scholar] [CrossRef]
  21. Hu, X.; Weng, Q. Impervious surface area extraction from IKONOS imagery using an object-based fuzzy method. Geocarto Int. 2011, 26, 3–20. [Google Scholar] [CrossRef]
  22. Elvidge, C.D.; Imhoff, M.L.; Baugh, K.E.; Hobson, V.R.; Nelson, I.; Safran, J.; Dietz, J.B.; Tuttle, B.T. Night-time lights of the world: 1994–1995. ISPRS J. Photogramm. Remote Sens. 2001, 56, 81–99. [Google Scholar] [CrossRef]
  23. Sutton, P.C. A scale-adjusted measure of “urban sprawl” using nighttime satellite imagery. Remote Sens. Environ. 2003, 86, 353–369. [Google Scholar] [CrossRef]
  24. Amaral, S.; Camara, G.; Miguel, A.; Monteiro, V.; Quintanilha, J.A.; Elvidge, C.D. Estimating population and energy consumption in Brazilian Amazonia using DMSP night-time satellite data. Comput. Environ. Urban. Syst. 2005, 29, 179–195. [Google Scholar] [CrossRef]
  25. Keola, S.; Andersson, M.; Hall, O. Monitoring economic development from space: Using nighttime light and land cover data to measure economic growth. World Dev. 2015, 66, 322–334. [Google Scholar] [CrossRef]
  26. Henderson, M.; Yeh, E.T.; Gong, P.; Elvidge, C.; Baugh, K. Validation of urban boundaries derived from global night-time satellite imagery. Int. J. Remote Sens. 2003, 24, 595–609. [Google Scholar] [CrossRef]
  27. He, C.; Shi, P.; Li, J.; Chen, J.; Pan, Y.; Li, J.; Zhuo, L.; Ichinose, T. Restoring urbanization process in China in the 1990s by using non-radiance-calibrated DMSP/OLS nighttime light imagery and statistical data. Chin. Sci. Bull. 2006, 51, 1614–1620. [Google Scholar] [CrossRef]
  28. Zhou, Y.; Smith, S.J.; Zhao, K.; Imhoff, M.; Thomson, A.; Bond-Lamberty, B.; Asrar, G.R.; Zhang, X.; He, C.; Elvidge, C.D. A global map of urban extent from nightlights. Environ. Res. Lett. 2015, 10, 054011. [Google Scholar] [CrossRef]
  29. Jing, W.; Yang, Y.; Yue, X.; Zhao, X. Mapping urban areas with integration of DMSP/OLS nighttime light and MODIS data using machine learning techniques. Remote Sens. 2015, 7, 12419–12439. [Google Scholar] [CrossRef]
  30. Liu, L.; Tang, L. Measuring urban sprawl in China by night time light images. IOP Conf. Ser. Earth Environ. Sci. 2017, 52, 012111. [Google Scholar] [CrossRef]
  31. Zhang, Q.; Seto, K.C. Mapping urbanization dynamics at regional and global scales using multi-temporal DMSP/OLS nighttime light data. Remote Sens. Environ. 2011, 115, 2320–2329. [Google Scholar] [CrossRef]
  32. Liu, Z.; He, C.; Zhang, Q.; Huang, Q.; Yang, Y. Extracting the dynamics of urban expansion in China using DMSP-OLS nighttime light data from 1992 to 2008. Landsc. Urban Plan. 2012, 106, 62–72. [Google Scholar] [CrossRef]
  33. Ma, T.; Zhou, C.H.; Pei, T.; Haynie, S.; Fan, J.F. Quantitative estimation of urbanization dynamics using time series of DMSP/OLS nighttime light data: A comparative case study from China’s cities. Remote Sens. Environ. 2012, 124, 99–107. [Google Scholar] [CrossRef]
  34. Zhang, Q.W.; Su, S.L. Determinants of urban expansion and their relative importance: A comparative analysis of 30 major metropolitans in China. Habitat Int. 2016, 58, 89–107. [Google Scholar] [CrossRef]
  35. Xie, Y.; Weng, Q. Detecting urban-scale dynamics of electricity consumption at Chinese cities using time-series DMSP-OLS (Defense Meteorological Satellite Program-Operational Linescan System) nighttime light imageries. Energy 2016, 100, 177–189. [Google Scholar] [CrossRef]
  36. Fan, J.; Ma, T.; Zhou, C.; Zhou, Y.; Xu, T. Comparative estimation of urban development in China’s cities using socioeconomic and DMSP/OLS night light data. Remote Sens. 2014, 6, 7840–7856. [Google Scholar] [CrossRef]
  37. Gao, B.; Huang, Q.; He, C.; Sun, Z.; Zhang, D. How does sprawl differ across cities in China? A multi-scale investigation using nighttime light and census data. Landsc. Urban Plan. 2016, 148, 89–98. [Google Scholar] [CrossRef]
  38. Shao, Z.; Liu, C. The integrated use of DMSP-OLS nighttime light and MODIS data for monitoring large-scale impervious surface dynamics: A case study in the Yangtze River Delta. Remote Sens. 2014, 6, 9359–9378. [Google Scholar] [CrossRef]
  39. Xu, X.; Min, X. Quantifying spatiotemporal patterns of urban expansion in China using remote sensing data. Cities 2013, 35, 104–113. [Google Scholar] [CrossRef]
  40. Ling, S.G.; Jiao, W.L.; Long, T.F.; Liu, H.C.; Yi, Y.Q.; Wu, M.M.; Wang, W.; He, G.J. Analysis of spatial and temporal characteristics of urban expansion about Wuhan city in the year of 2000–2014. Resour. Environ. Yangtze Basin 2016, 25, 1034–1042. (In Chinese) [Google Scholar]
  41. Xin, X.; Liu, B.; Di, K.C.; Zhu, Z.; Zhao, Z.Y.; Liu, J.; Yue, Z.Y.; Guo, Z. Monitoring urban expansion using time series of night-time light data: A case study in Wuhan, China. Int. J. Remote Sens. 2017, 6, 1–19. [Google Scholar] [CrossRef]
  42. Peng, S.X.; Lin, J.; Bao, G.S.; Chen, B.S. A study of Changsha-Zhuzhou-Xiangtan urban extension based on remote sensing. Remote Sens. Land Resour. 2005, 17, 74–77. (In Chinese) [Google Scholar]
  43. Zuo, L.J.; Zhang, Z.X.; Tan, W.B.; Wang, C.Y. Analysis on the Urban Land Use Sprawl and Its Driving Forces by Using Remote Sensing and GIS: The Case of Nanchang City, China. Geo-Inform. Sci. 2007, 9, 116–122. (In Chinese) [Google Scholar]
  44. Zheng, W.; Run, J.; Zhuo, R.; Wang, X. Evolution process of urban spatial pattern in Hubei Province based on DMSP/OLS nighttime light data. Chin. Geogr. Sci. 2016, 26, 366–376. [Google Scholar] [CrossRef]
  45. Zeng, Y.N.; He, L.L.; Jin, W.P.; Wu, K.J.; Xu, Y.Y.; Yu, F.F. Quantitative Analysis of the Urban Expansion Models in Changsha-Zhuzhou-Xiangtan Metroplan Areas. Sci. Geogr. Sin. 2012, 32, 544–549. (In Chinese) [Google Scholar]
  46. Cao, X.; Chen, J.; Imura, H.; Higashi, O. A SVM-based method to extract urban areas from DMSP-OLS and SPOT VGT data. Remote Sens. Environ. 2009, 113, 2205–2209. [Google Scholar] [CrossRef]
  47. Zhang, X.; Li, P.; Cai, C. Regional urban extent extraction using multi-sensor data and one-class classification. Remote Sens. 2015, 7, 7671–7694. [Google Scholar] [CrossRef]
  48. Dou, Y.; Liu, Z.; He, C.; Yue, H. Urban Land Extraction Using VIIRS Nighttime Light Data: An Evaluation of Three Popular Methods. Remote Sens. 2017, 9, 175. [Google Scholar] [CrossRef]
  49. Zhou, Y.; Smith, S.J.; Elvidge, C.D.; Zhao, K.; Thomson, A.; Imhoff, M. A cluster-based method to map urban area from DMSP/OLS nightlights. Remote Sens. Environ. 2014, 147, 173–185. [Google Scholar] [CrossRef]
  50. Xie, Y.; Weng, Q. Updating urban extents with nighttime light imagery by using an object-based thresholding method. Remote Sens. Environ. 2016, 187, 1–13. [Google Scholar] [CrossRef]
  51. Su, Y.; Chen, X.; Wang, C.; Zhang, H.; Liao, J.; Ye, Y.; Wang, C. A new method for extracting built-up urban areas using DMSP-OLS nighttime stable lights: A case study in the Pearl River Delta, southern China. Gisci. Remote Sens. 2015, 52, 218–238. [Google Scholar] [CrossRef]
  52. Su, Y.; Chen, X.; Li, Y.; Liao, J.; Ye, Y.; Zhang, H.; Huang, N.; Kuang, Y. China’s 19-year city-level carbon emissions of energy consumptions, driving forces and regionalized mitigation guidelines. Renew. Sustain. Energy Rev. 2014, 35, 231–243. [Google Scholar] [CrossRef]
  53. National Bureau of Statistics of China. China Statistical Yearbook; China Statistics Press: Beijing, China, 1992–2011. [Google Scholar]
  54. Fang, C.; Weifeng, Q.; Song, J. Researches on Comprehensive Measurement of Compactness of Urban Agglomerations in China. Acta Geogr. Sin. 2008, 63, 1011–1021. [Google Scholar]
  55. Triantakonstantis, D.; Stathakis, D. Examining urban sprawl in Europe using spatial metrics. Geocarto Int. 2015, 30, 1092–1112. [Google Scholar] [CrossRef]
  56. Batty, M.; Longley, P.A. The morphology of urban land use. Environ. Plan. B 1988, 15, 461–488. [Google Scholar] [CrossRef]
  57. Gao, B.; Huang, Q.; He, C.; Ma, Q. Dynamics of urbanization levels in China from 1992 to 2012: Perspective from DMSP/OLS nighttime light data. Remote Sens. 2015, 7, 1721–1735. [Google Scholar] [CrossRef]
  58. Xu, T.; Ma, T.; Zhou, C.; Zhou, Y. Characterizing spatio-temporal dynamics of urbanization in China using time series of DMSP/OLS night light data. Remote Sens. 2014, 6, 7708–7731. [Google Scholar] [CrossRef]
  59. Triantakonstantis, D.; Stathakis, D. Cokriging areal interpolation for estimating economic activity using night-time light satellite data. In Computational Science and Its Applications—Iccsa 2014; Murgante, B., Misra, S., Rocha, A., Torre, C., Rocha, J.G., Falcao, M.I., Taniar, D., Apduhan, B.O., Gervasi, O., Eds.; Springer: Berlin, Germany, 2014; Volume 8582, pp. 243–252. [Google Scholar]
  60. York, R.; Rosa, E.A.; Dietz, T. STIRPAT, IPAT and ImPACT: Analytic tools for unpacking the driving forces of environmental impacts. Ecol. Econ. 2003, 46, 351–365. [Google Scholar] [CrossRef]
  61. York, R.; Rosa, E.A.; Dietz, T. A rift in modernity? Assessing the anthropogenic sources of global climate change with the STIRPAT model. Int. J. Sociol. Soc. Policy 2003, 23, 31–51. [Google Scholar] [CrossRef]
  62. Huang, R.; Wang, Z. Influencing factors of carbon emissions from energy consumptions in Chongqing based on STIRPAT model. Acta Sci. Circum. 2013, 33, 602–608. [Google Scholar]
Figure 1. Location of the study area: (a) location of the study area in China; (b) the composition of the study area.
Remotesensing 09 01007 g001
Figure 2. The flowchart of extracting the built-up urban extents.
Remotesensing 09 01007 g002
Figure 3. Extracted urban areas along the Middle Reaches of the Yangtze River (MRYR) in 1992, 1997, 2002, 2007, and 2011.
Remotesensing 09 01007 g003aRemotesensing 09 01007 g003b
Figure 4. Optimal threshold value used to extract urban extents for 30 cities in MRYR in different years.
Remotesensing 09 01007 g004
Figure 5. Accuracy assessment of extracted urban areas from nighttime light (NTL) data through comparison with the classified maps of Landsat TM images in 2009.
Remotesensing 09 01007 g005
Figure 6. Accuracy assessment of urban expansion in provincial capital cities from 1995 to 2009.
Remotesensing 09 01007 g006
Figure 7. Changes in urban expansion intensity over different time periods: (a) the overall city cluster, (b) the urban agglomeration, and (c) the provincial cities.
Remotesensing 09 01007 g007
Figure 8. The trajectory of the gravity center of the urban area in the city cluster from 1992 to 2011.
Remotesensing 09 01007 g008
Figure 9. The trajectory of the gravity center of urban extents in three urban agglomerations: (a) Wuhan metropolitan area, (b) Poyang lake city group, and (c) Chang-Zhu-Tan urban agglomeration.
Remotesensing 09 01007 g009aRemotesensing 09 01007 g009b
Figure 10. Urban expansion in three provincial capital cities in the MRYR from 1992 to 2011.
Remotesensing 09 01007 g010
Figure 11. Compactness ratio of each city at different times.
Remotesensing 09 01007 g011
Figure 12. Temporal variation of NTL brightness for three provincial capital cities from 1995 to 2011.
Remotesensing 09 01007 g012
Table 1. Set of annual composites from several satellites for the years 1992–2011.
YearSatellite
F10F12F14F15F16F18
1992F101992
1993F101993
1994F101994F121994
1995F121995
1996F121996
1997F121997F141997
1998F121998F141998
1999F121999F141999
2000F142000F152000
2001F142001F152001
2002F142002F152002
2003F142003F152003
2004F152004F162004
2005F152005F162005
2006F152006F162006
2007F152007F162007
2008F162008
2009F162009
2010F182010
2011F182011
Table 2. Number of urban pixels on different spatial scales.
UnitsTotal PixelsNumber of Urban Pixels
19921997200220072011
Wuhan11,404194205214428502
Changsha8495104112131157274
Nanchang7408658889111210
Wuhan metropolitan area58,202353381463697771
Chang-Zhu-Tan urban agglomeration27,880202211247308431
Poyang Lake city group50,044223288316470588
All cities308,67910841244153521052645
Table 3. Fractal dimension of the urban boundary of each city in 1992, 1997, 2002, 2007, and 2011.
CityFractal Dimension
19921997200220072011
Zhuzhou1.1291.1391.1411.0911.101
Changsha1.1281.1251.1101.1251.117
Yueyang1.3331.1961.1911.1251.139
Yingtan1.2621.2041.1611.1581.181
Yiyang1.1361.1631.1161.1311.131
Yichun1.2351.2621.2621.1281.226
Yichang1.1131.2151.1861.0831.241
Xinyu1.2651.1961.1231.1121.109
Xiaogan1.1801.2261.1391.1361.133
Xiangyang1.1521.1521.2201.1511.140
Xiangtan1.2211.2051.1061.1251.101
Xianling1.3651.0881.1161.1781.083
Xiantao1.4431.2651.2381.1831.179
Wuhan1.1351.2171.1961.1791.139
Tianmen1.1791.1401.2711.1441.131
Shangrao1.1111.3221.1361.1681.135
Qianjiang1.3061.1401.1201.1971.177
Pingxiang1.1561.0851.2351.0891.116
Nanchang1.1161.0991.0941.1251.112
Loudi1.1771.1491.1271.1181.118
Jiujiang1.3451.2531.2341.2371.216
Jingdezheng1.1561.1251.1001.2621.204
Jingzhuo1.2481.2531.1681.1761.153
Jingmen1.2361.1901.1291.1351.170
Huangshi1.2391.2111.1161.1321.254
Wugang1.2831.2831.1041.1111.168
Hengyang1.1911.1241.2031.1071.102
Fuzhou1.1561.3221.1331.1001.089
Ezhou1.2501.2141.3231.2141.262
Changde1.1001.1531.1091.0531.046
Table 4. Correlation between urbanization factors and NTL in three capital cities.
CitesLDPIEUS
WuhanL0.8640.8520.7870.7850.8320.836
D0.8230.8460.8750.8010.796
P0.8840.9510.8730.826
I0.860.8410.714
E0.8180.872
U0.853
S
ChangshaL0.7840.8390.8040.790.8530.863
D0.8530.8410.7840.8240.826
P0.8620.8510.8730.847
I0.8540.8390.884
E0.7480.785
U0.868
S
NanchangL0.8160.7730.7650.8040.8410.886
D0.8590.8130.8820.7970.872
P0.8240.8910.8730.877
I0.8730.8050.827
E0.8230.864
U0.836
S
Note: L is the NTL brightness represented by the summation of NTL DN in the lit urban area; D is GDP; P represents the non-agricultural population; I is the industrial output standing; E stands for total investment in fixed assets; U denotes urban constructed area; and S is tertiary industry.

