Angular Resolution Enhancement Provided by Nonuniformly-Spaced Linear Hydrophone Arrays in Ocean Acoustic Waveguide Remote Sensing

Department of Electrical and Computer Engineering, Northeastern University, 360 Huntington Ave, Boston, MA 02115, USA
*
Author to whom correspondence should be addressed.
Remote Sens. 2017, 9(10), 1036; https://doi.org/10.3390/rs9101036
Submission received: 18 August 2017
/
Revised: 2 October 2017
/
Accepted: 3 October 2017
/
Published: 11 October 2017
(This article belongs to the Special Issue Advances in Undersea Remote Sensing)
Abstract
:Uniformly-spaced apertures or subapertures of large, densely-sampled, discrete linear receiver arrays are often used in remote sensing to increase the signal-to-noise ratio (SNR) by coherent beamforming that reduces noise coming from directions outside the signal beam. To avoid spatial aliasing or the presence of grating lobes in real spatial directions, the uniformly-spaced array inter-element spacing d sets a limit on the maximum frequency of signals suitable for beamforming with the array, where c is the medium’s wave propagation speed. Here, we show that a nonuniformly-spaced array, for instance, formed by combining multiple uniformly-spaced subapertures of a nested linear array, can significantly enhance the array angular resolution while simultaneously avoiding dominant grating lobes in real angular space, even for signals with frequencies beyond the maximum that the array is designed for. The array gain, beam width, and maximum grating lobe height are quantified for the Office of Naval Research Five Octave Research Array (ONR-FORA) for various combinations of its uniformly-spaced subapertures, leading to nonuniformly-spaced subarrays. Illustrative examples show angular resolution enhancement provided by the nonuniformly-spaced ONR-FORA subarrays over that of its uniformly-spaced individual subaperture counterparts in both active and passive ocean acoustic waveguide remote sensing, drawn from measurements in the Gulf of Maine 2006 Experiment.
1. Introduction
Large aperture densely-sampled arrays of sensors are employed in remote sensing and communication applications [1,2,3,4,5,6,7,8,9,10,11,12,13,14,15,16] to enhance signal-to-noise ratio (SNR) via coherent beamforming [17,18,19,20,21,22], which reduces noise coming from directions outside the signal beam. Coherent beamforming also provides an estimate of signal bearing, required for direct spatial localization of a signal [11,12,23,24,25]. Most practical arrays [1,2,3,9,10,11,12,13,14,15,16,26] are designed to have apertures or subapertures with uniform inter-element spacing d kept below half a wavelength , (), following the Nyquist criteria for spatial sampling [27]. This is to avoid spatial aliasing of the signal that occurs when there are grating lobes present in real spatial directions. Grating lobes reduce the effectiveness of the beamformer by including noise coming from directions where the grating lobes occur, lowering the SNR enhancement and leading to ambiguity in signal bearing estimation. The Nyquist spatial sampling criteria defines the maximum signal frequency suitable for beamforming with the uniformly-spaced array below which grating lobes are kept off real angular space.
Following the criteria for spatial sampling, nested arrays [26,28,29,30,31] have been developed and are widely used in ocean acoustic remote sensing and communication applications [1,2,3,15,16] to beamform signals with center frequencies spanning several octaves without spatial aliasing. A nested array contains several uniformly-spaced subapertures where the inter-element spacing of the longer subapertures are integer multiples, usually even factors, of those for the shorter subapertures. Nested arrays are designed so that hydrophone elements can be shared across multiple subapertures leading to significant reduction in the total number of hydrophones required in the full array design. Co-prime arrays [32,33], on the other hand, combine subapertures with uniform inter-element spacings that are non-integral multiples of each other. Like nested arrays, co-prime arrays are also widely exploited to enhance beamwidth in active and passive radar sensing, as well as in grating lobe suppression [34,35].
Various other approaches for suppressing the grating lobes of an array in real spatial directions have been investigated. They include irregular, nonuniform array designs that remove the periodic pattern in array structure and hence in the output of the beamformer for both transmit and receive linear or planar arrays [22,36,37,38,39,40,41,42]. Another approach for suppressing grating lobes uses nonsinusoidal transmit signals that also remove the periodic pattern in the beamformer output [43]. Grating lobe suppression can also be accomplished via adaptive beamforming that applies a weighting factor either to the echoes received on each sensor element [44,45] or to the transmit aperture [46,47]. Previous work in optimizing array design or performance in ocean acoustic remote sensing applications are based on numerical simulation for a given signal with deterministic frequency or bandwidth [36,37,38,39,40,41,42].
Here, we show with both theory and measurements that a nonuniformly-spaced large-aperture densely-sampled discrete linear receiver array composed of multiple-nested uniformly-spaced subapertures can significantly improve the array angular resolution, while simultaneously avoiding dominant grating lobes in real angular space, for signals with varying bandwidths and center frequencies. We provide an analysis of the Office of Naval Research Five Octave Research Array (ONR-FORA) [26]. The ONR-FORA is a primary receiver array for long range ocean acoustics research of the US academic community, widely employed in field experiments for ocean acoustic propagation, scattering, remote sensing and communications studies [1,2,3,4,5,6,11,12,13,15,16]. The ONR-FORA is a linear oil-filled array consisting of four nested subapertures, each uniformly spaced, designed for beamforming signals without spatial aliasing over frequencies spanning from below 250 Hz up to 2000 Hz. The nested configuration of the ONR-FORA follows standard array design typically employed in wide-area ocean acoustic array construction, making the analysis and results presented here for the ONR-FORA applicable to other such nonuniformly-spaced arrays with nested subapertures (examples of other ocean acoustic arrays with nested apertures are provided in [9,10,48,49]). Previously, all data acquired by the ONR-FORA and other coherent ocean acoustic arrays were beamformed using conventional uniformly-spaced single or individual subapertures [1,2,7,8,11,12,13,24,48,49,50].
The array gain, beam width and maximum grating lobe height are calculated for various combinations of the ONR-FORA uniformly-spaced subapertures, which lead to nonuniformly-spaced subarrays. These results are compared to those of the uniformly-spaced single subaperture counterparts. The ONR-FORA has been employed as the primary receiver implementing the ocean acoustic waveguide remote sensing (OAWRS) technology [1,2,3,4,5,6,12,13,14], providing real-time or near real-time instantaneous wide-area sensing of the ocean environment in field experiments. Here, we provide illustrative examples showing enhancements in both passive and active OAWRS achieved via beamforming with the nonuniformly-spaced subarrays of the ONR-FORA over that of its uniformly-spaced individual subaperture counterparts using data acquired during the Gulf of Maine 2006 Experiment (GOME06) [1,2,4,5,6,7,8,11,12,13,24,50,51].
In instantaneous continental-shelf scale OAWRS images of shoaling Atlantic herring fish populations [2,13] from GOME06, we show the nonuniformly-spaced subarrays improve the cross-range resolution significantly, enabling fish population centers to be better resolved. In contrast, several of these population centers were previously blurred together when beamformed with the array’s uniformly-spaced single subaperture. In passive OAWRS (POAWRS) of marine mammal vocalizations and ship-radiated underwater sound, the nonuniformly-spaced subarrays improve angular resolution, bearing estimation, and provide SNR enhancement for whale call and ship-radiated sound in the beamformed spectrograms when compared to that obtained with the uniformly-spaced subapertures [1,4,5,6].
2. Methods and Materials
2.1. Theory: Linear Discrete Array Beamformer
Here, we provide analytic expressions for the beam pattern valid for both the uniformly-spaced and nonuniformly-spaced linear discrete hydrophone array, and use these expressions to define the array gain , beam width , and maximum grating lobe height . In the next section, these parameters will be quantified for the nonuniformly-spaced subarrays and compared with those for the conventional uniformly-spaced individual subapertures of the ONR-FORA.
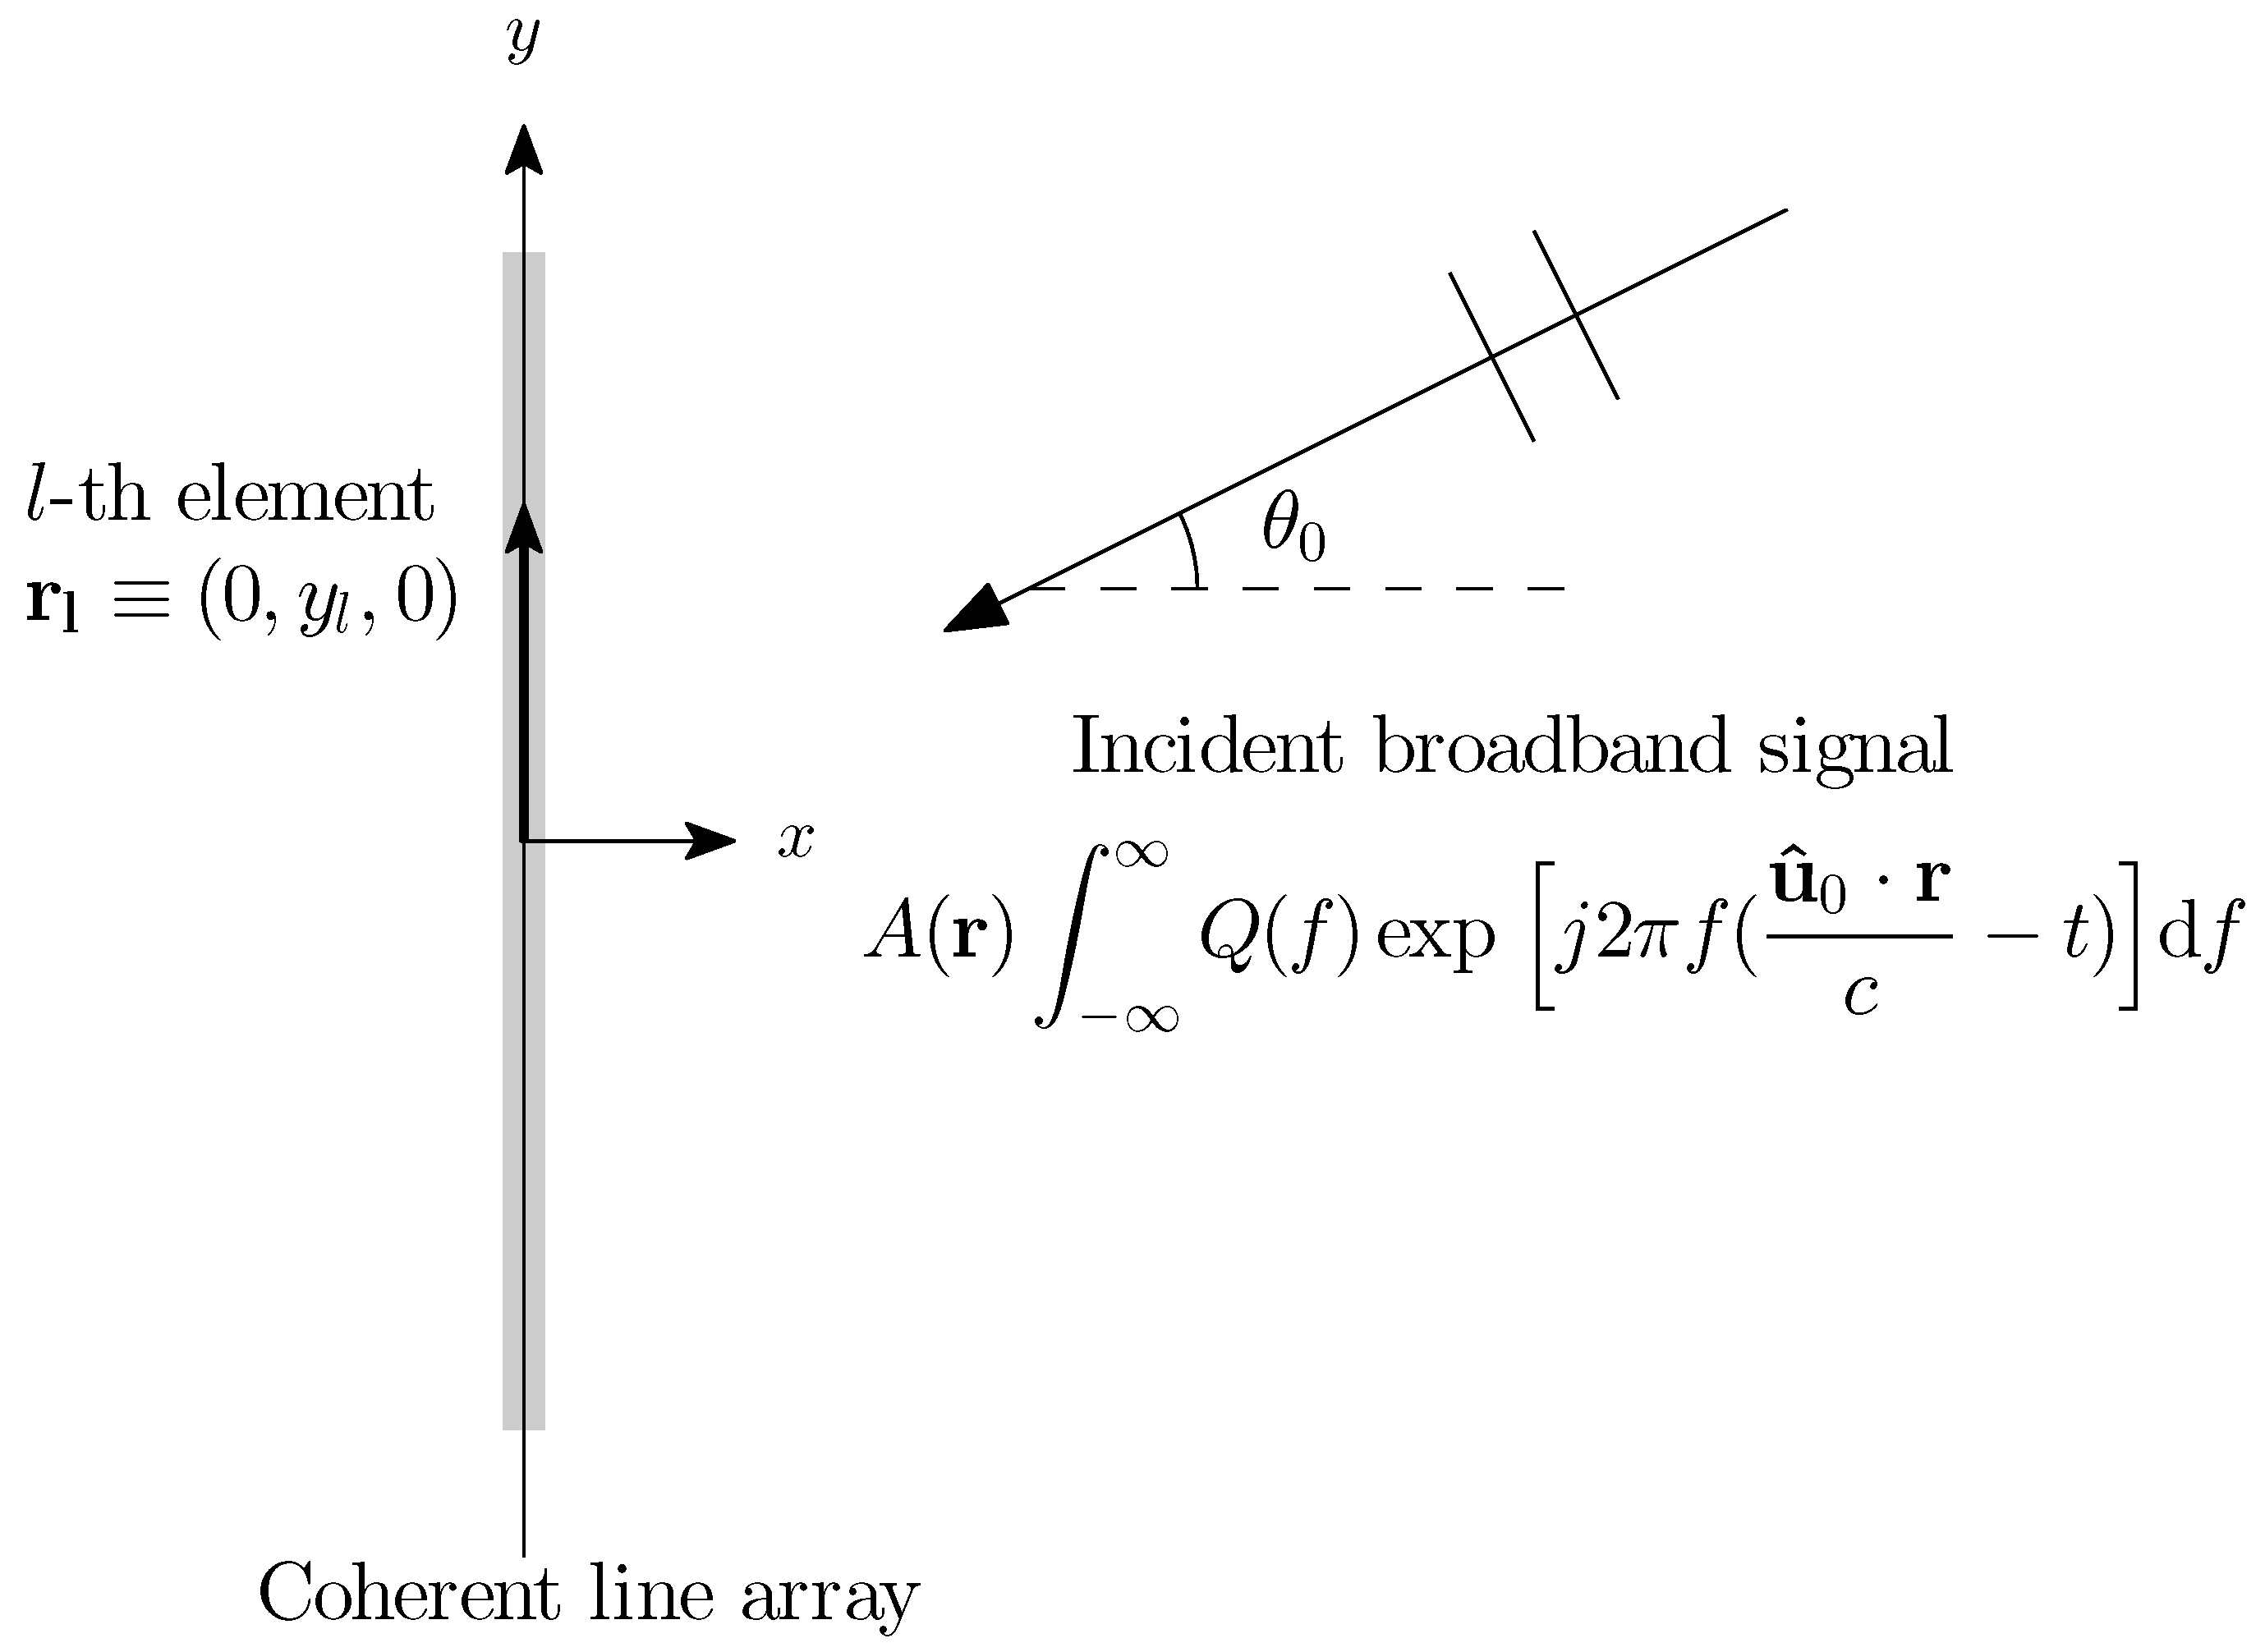
Let denote the pressure field of an incident broadband signal at spatial location and time t in the direction of the unit vector , where A is the complex amplitude, c is the medium sound speed, and is the signal’s normalized power spectral density (). A nonuniformly-spaced linear array with N elements is aligned horizontally along the y-axis in the ocean waveguide with elements located at , where (Figure 1). Here, we assume the object that, either generated or scattered, the signal is located in the far field of the receiver array. The pressure field received on the l-th array element can be considered to be a plane wave given by
where is the azimuth of the unit vector measured from the array broadside (x-axis).
Let be the spatial taper function applied across the array elements. The total pressure field at scan angle after beamforming is
where is the discrete linear array beam pattern given by
For a uniformly-spaced array with N elements and total length of L, applying a rectangular window spatial taper function for between , leads to a beam pattern given by
where is the inter-element spacing. For a general nonuniformly-spaced array with N elements nested into M subapertures (see Figure 2 as an example, which is a schematic of subapertures of the ONR-FORA), its beam pattern can be derived using Equation (4) by linearly combining the beam patterns of each of the M uniformly-spaced subapertures and is given by
where is the floor operator, and are the total length and inter-element spacing of the k-th subaperture, respectively. A Hamming window is often employed instead of a rectangular window as a spatial taper function to minimize side lobes. The resulting beam pattern can be obtained by convolving the Fourier transform of the taper function with the beam pattern from rectangular windowing,
The instantaneous beamformed intensity is
and the time-averaged beamformed intensity is calculated from the integral of the instantaneous beamformed intensity over time t between . For sufficiently large integration time , incident plane waves at different frequencies are approximately orthogonal to each other, such that . The time-averaged beamformed intensity simplifies to
For a narrow-band signal, the beamformer output and time-averaged beamformed intensity can be obtained directly from the beam pattern by multiplying with the complex amplitude A and time dependence . For a broadband signal, these expressions cannot be simplified further unless the normalized power spectral density is specified. In practice, beamforming is often numerically implemented in the frequency domain by operation on each frequency component following Equation (3), where the components are obtained via discrete Fourier transform of the broadband signal.
The broadside beam width is estimated as the angle between the half-power (−3 dB) points of the main lobe in the time-averaged beamformed intensity when the array is steered to the broadside direction. The array gain [19] is calculated as the ratio of the time-averaged beamformed intensity in the direction of the signal to that averaged over all directions,
The grating lobe height is calculated as the maximum value of the time-averaged beamformed intensity excluding the main lobe. The maximum possible grating lobe height , which occurs when the array is steered in the end-fire direction, is quantified here.
2.2. Experimental Acoustic Data Collection with a Coherent Discrete Hydrophone Array
The Gulf of Maine 2006 Experiment [1,2,7,8,11,12,13,24,50] was conducted from 19 September to 6 October 2006, coinciding with the annual herring spawning period on the northern flank of Georges Bank [51,52,53]. During the experiment, acoustic recordings were acquired using the nonuniformly-spaced 160 hydrophone-element ONR-FORA towed horizontally behind a research vessel along designated tracks north of Georges Bank [2,12,13,50]. Tukey-windowed linear frequency modulated (LFM) pulses of 1 s duration and 50 Hz bandwidth centered at 415, 735, 950 and 1125 Hz were transmitted by a vertical source array deployed on another research vessel for bistatic measurement of echo returns. The Atlantic herring areal population densities were monitored over instantaneous wide areas using active OAWRS imaging [1,2,8,12,13] and calibrated with coincident conventional ultrasonic fisheries echo sounding measurements [2,8,13] with fish species identification and physiological parameters extracted from trawl samples collected over the course of the experiment [52,54]. In addition to echo returns of the transmitted source signal, vocalizations from more than eight distinct marine mammal species including fin, humpback, sei, minke, orca, pilot, sperm, and other unidentified baleen and toothed whale species were also passively recorded by the coherent hydrophone array [1,4,5,12]. The ecosystem-wide spatial distributions of vocal marine mammals from multiple cetacean species were simultaneously mapped by the POAWRS technique [1,4,5,6]. Detailed information about the Gulf of Maine 2006 Experiment is provided in Refs. [1,2,7,11,12,13,24,50,55], including hydrophone array layout, measurement geometry, temporal and spatial span of acoustic data collection, and oceanographic properties of the environment. Detailed aperture nesting schematic for the ONR-FORA is provided in Ref. [26] (see Figure 1 and 2 of Ref. [26]).
Both OAWRS and POAWRS techniques employ beamforming extensively for high-resolution signal bearing estimation. Previously, data acquired by the ONR-FORA was beamformed using conventional uniformly-spaced single subapertures [1,2,7,8,11,12,13,24,50] in both passive and active OAWRS. Here, we demonstrate that the beamformer output can be significantly enhanced by combining the conventional uniformly-spaced subapertures to form nonuniformly-spaced subarrays.
The ONR-FORA contains 160 hydrophone elements nested into four uniformly-spaced subapertures that are the ultra-low-frequency (ULF), low-frequency (LF), middle-frequency (MF), and high-frequency (HF), each of which contains N = 64 hydrophones with inter-element spacing of 3 m, 1.5 m, 0.75 m, and 0.375 m, respectively, designed to analyze and conventionally beamform acoustic signals with fundamental frequency content below 250 Hz, 500 Hz, 1000 Hz, and 2000 Hz, respectively [1,2,12,13]. A schematic of three of the four subapertures of the ONR-FORA is provided in Figure 2, and they are the LF, MF and HF subapertures. These three subapertures are the primary subapertures used in both active and passive OAWRS. By combining multiple conventional uniformly-spaced subapertures, we obtain new nonuniformly-spaced subarrays (see Table 1).
The pressure-time series measured by hydrophone elements from the newly defined subarrays are beamformed to two-dimensional beam-time series, from which scattering strength images [2,3,13] of the ocean environment are derived following the approaches in active OAWRS imaging [2,3,8,13,14]. The beam-time series data is matched filtered with the source transmitted 50 Hz bandwidth LFM waveforms and is then bistatically charted onto geographic space. The beam-time data are linearly converted to beam-range data by multiplying the two-way travel time from the source and receiver locations to the the scattered field location with half the mean measured water-column sound speed c. The log-transformed scattered intensity images are next corrected for (i) source level; (ii) two-way transmission losses from the source and receiver locations to the scattered intensity locations; and (iii) the range- and azimuth-dependent resolution footprint of the imaging system. The range resolution is determined by the match filter pulse compression, while the cross-range resolution is determined by the array beam width at the output of the beamformer. The two-dimensional beam-time series are also utilized to generate beamformed spectrograms used extensively in POAWRS [1,4,5,6] for detecting oceanic sound sources. The results generated using the nonuniformly-spaced subarrays are compared to those obtained from the conventional uniformly-spaced single subapertures of the ONR-FORA.
3. Illustrative Examples
Here, we compare the beamformer output of the nonuniformly-spaced subarrays with those of the conventional uniformly-spaced single subapertures of the FORA via theory and application to acoustic data from GOME06.
3.1. Theoretical Results
Here, we show via numerical simulation that the angular resolution of the ONR-FORA can be significantly enhanced by beamforming with the new nonuniformly-spaced subarrays, which provide narrower main lobes while simultaneously avoiding spatial aliasing from dominant grating lobes, when compared to the conventional uniformly-spaced subapertures (see Figure 3 and Figure 4 and Table 1).
We consider incident signals that are LFM pulses of 1 s duration and 50 Hz bandwidth centered at either 950 Hz or 1125 Hz with normalized power spectral densities uniform over the signal bandwidth. Linear frequency modulated pulses were extensively employed in GOME06 for imaging Atlantic herring areal population densities [2,13] via OAWRS. The array gain , broadside beam width , and maximum grating lobe height for the three conventional subapertures and two newly defined subarrays are calculated for these signals and listed in Table 1. The results shown here incorporate a spatial hamming window taper function in the beamforming. The time-averaged beamformed intensity is calculated by substituting Equation (6) into Equation (8). The continuous frequency integrals are implemented as discrete summation with frequency increment Hz. The array gain , broadside beam width and maximum grating lobe height are calculated from the time-averaged beamformed intensity . The azimuth of the incident signal is set to be 0 for calculating the broadside beam width and the array gain, and set to be for calculating the maximum grating lobe height.
To first order, the angular resolution of a subaperture or subarray is dependent on its length. As can be noted from Equation (4), since the first zero value of the beam pattern occurs at , which is inversely proportional to the array length . For the LFM signal centered at 950 Hz, even though the long LF subaperture provides the best angular resolution ( deg), it leads to significant grating lobes ( dB) because of spatial aliasing, since the signal frequency lies above the LF subaperture’s maximum design frequency of 500 Hz. This aliasing is especially problematic for active imaging applications since the grating lobes can lead to false returns charted onto real angular space. The MF subaperture is suitable for beamforming the 950 Hz centered LFM signal without dominant grating lobes in real angular space ( dB), but provides poorer angular resolution, with beam width ( deg) roughly double that of the LF subaperture. The newly defined nonuniformly-spaced subarray combining both the LF and MF subapertures outperforms the single MF subaperture, since it provides fine angular resolution ( deg) that is close to that of the LF subaperture while simultaneously avoiding dominant grating lobes in real angular space ( dB). Similarly, for the LFM signal with 1125 Hz center frequency and 50 Hz bandwidth, the newly defined subarray combining LF, MF and HF subapertures outperforms all three individual subapertures, since it provides fine enough angular resolution and avoids dominant grating lobes in real angular space (see Table 1).
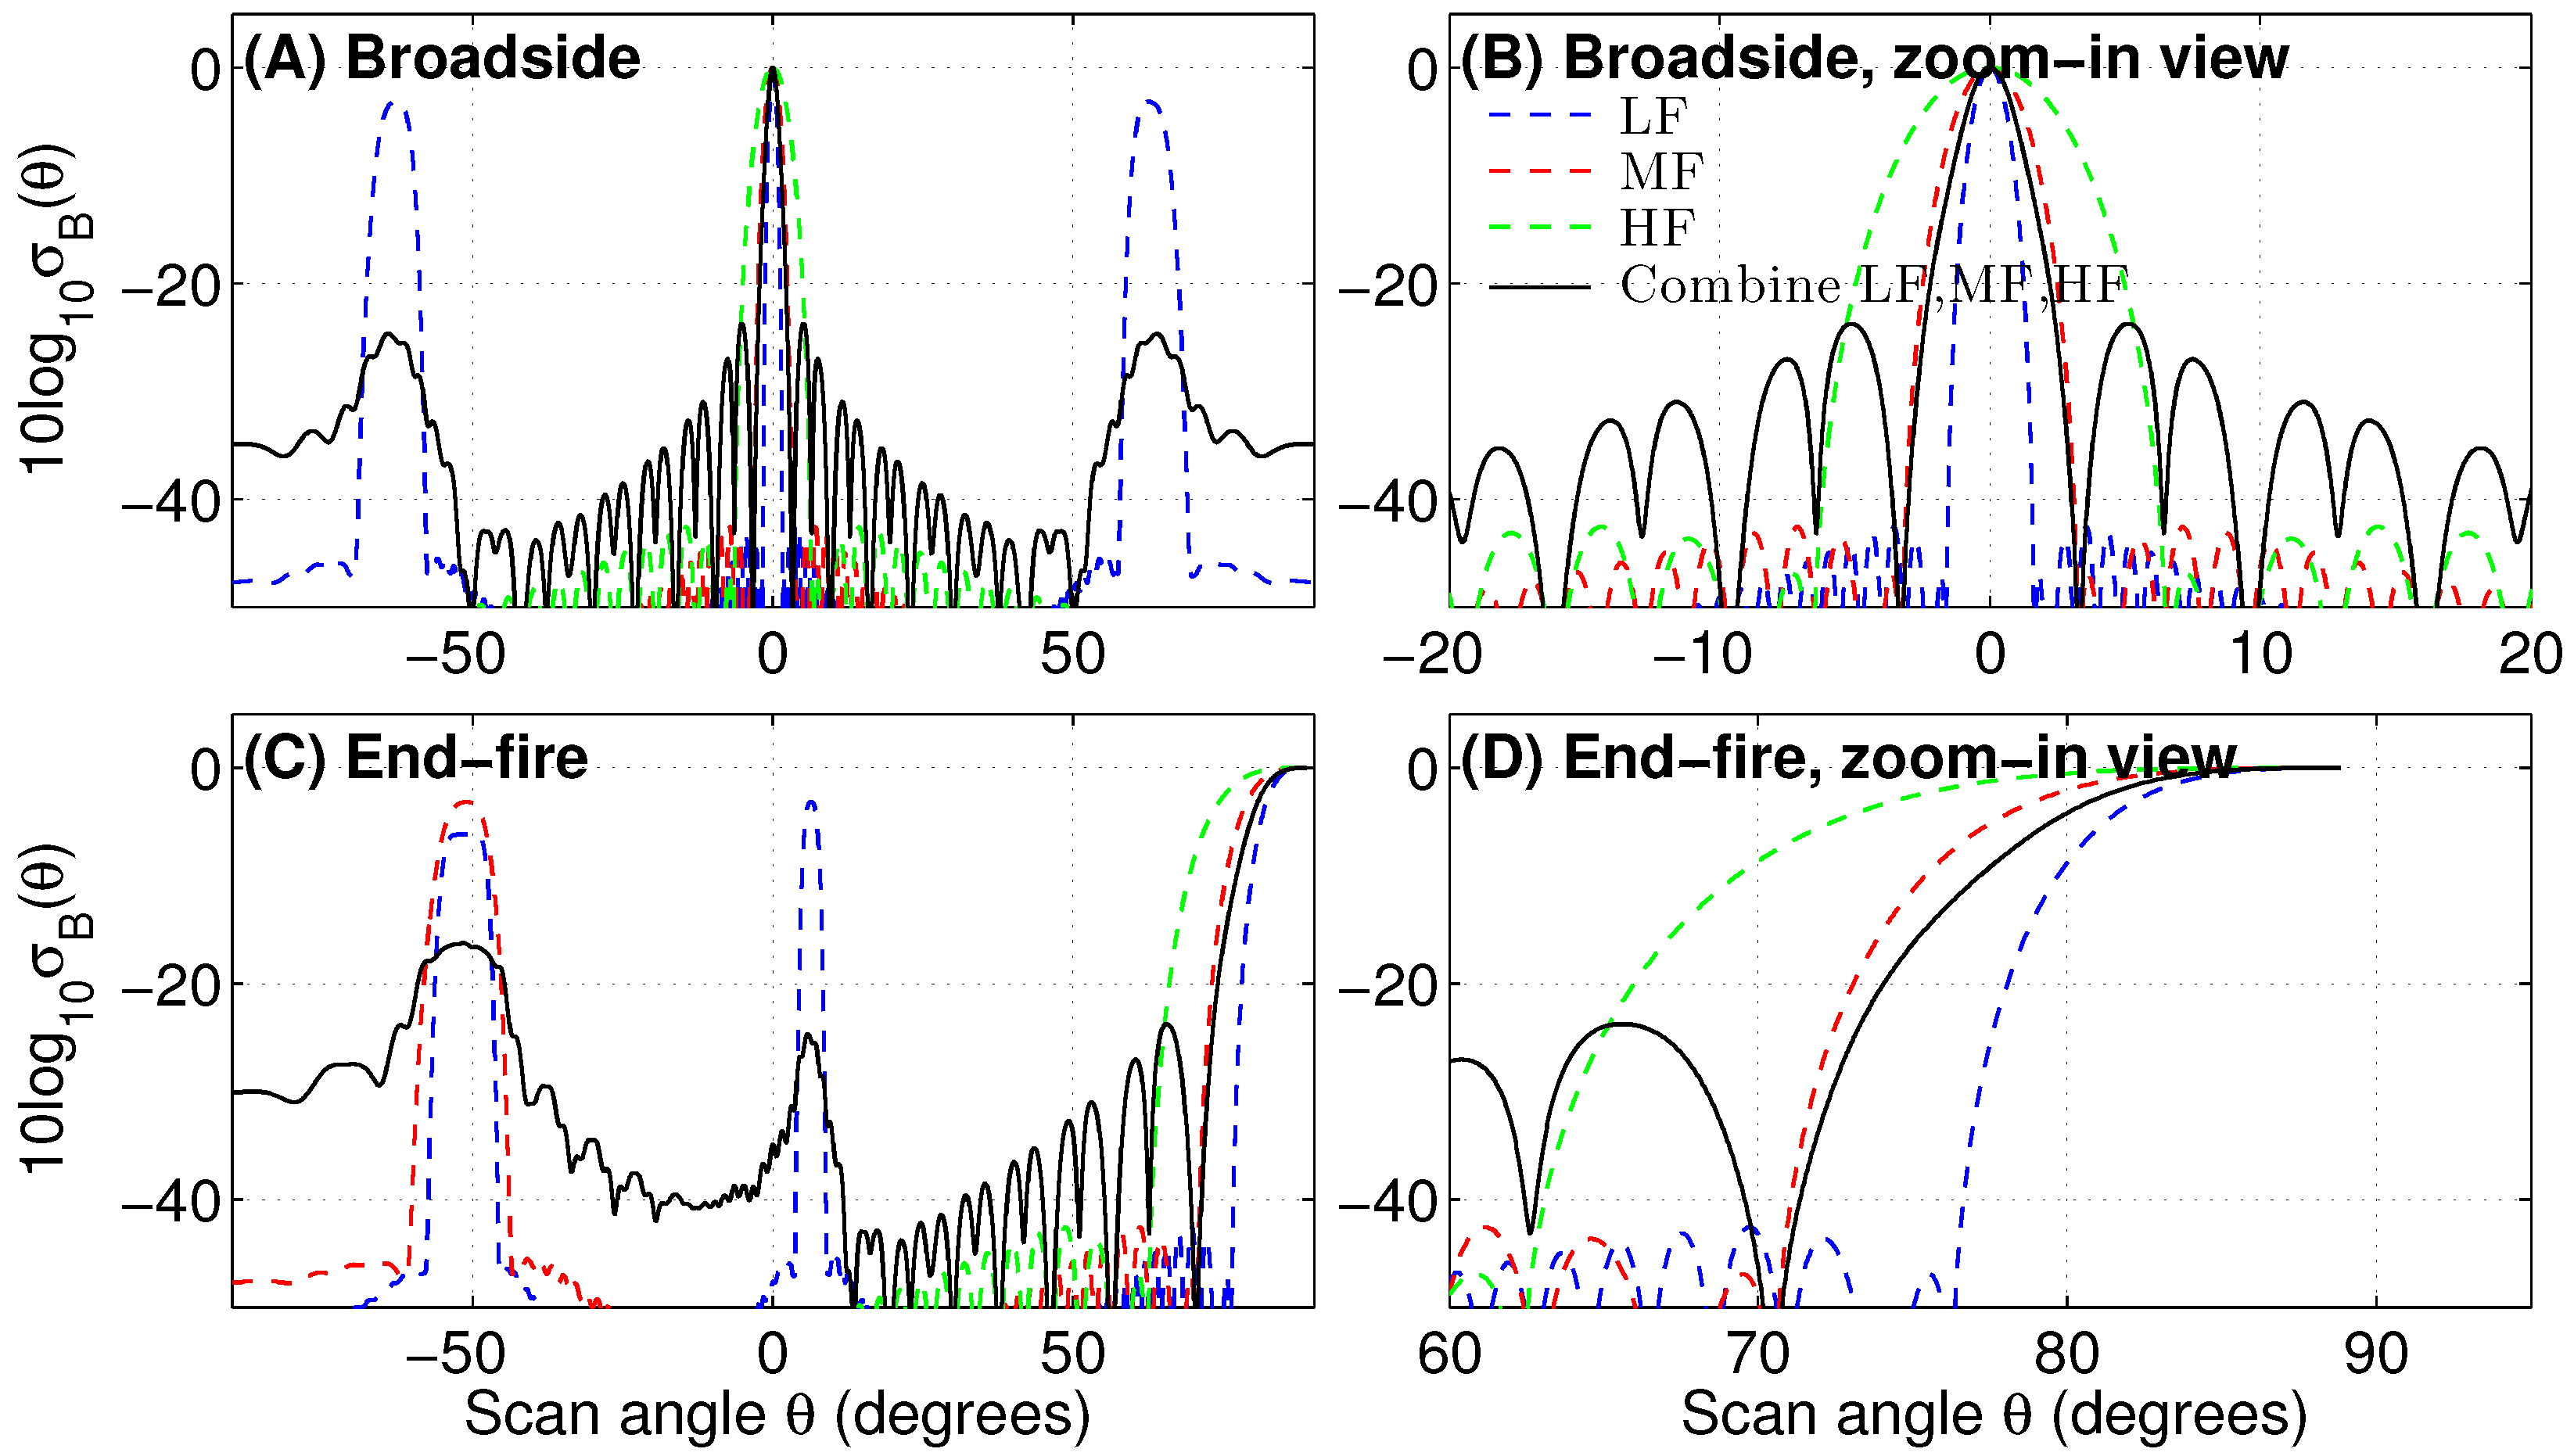
We next compare the beam pattern of the nonuniformly-spaced subarray with those of the conventional uniformly-spaced subapertures for both a narrowband tonal at 1125 Hz and the broadband 50 Hz bandwidth LFM signal centered at 1125 Hz. The beam patterns of (1) the individual conventional uniformly-spaced subapertures LF, MF and HF, and (2) the newly defined nonuniformly-spaced subarray combining LF, MF, and HF subapertures, calculated via Equation (6) for the narrowband tonal at Hz are plotted in Figure 3. The corresponding time-averaged beamformed intensities for the broadband LFM pulse of 50 Hz bandwidth centered at 1125 Hz are calculated and plotted in Figure 4. The normalized power spectral density is assumed to be uniform within the frequency band of the broadband signal. The azimuth of the incident signal is set to be either broadside or end-fire , respectively. The individual LF and MF subapertures lead to spatial aliasing with presence of grating lobes in real angular space for both the narrowband tonal and broadband LFM signals. The nonuniformly-spaced subarray, on the other hand, eliminates the grating lobes and provides an angular resolution that is roughly a factor of three times smaller than that of the conventional HF subaperture (Table 1).
In summary, the nonuniformly-spaced multiple-nested subarray takes advantage of the fine angular resolution provided by the longer subaperture, while minimizing dominant grating lobes in real angular space through the densely-spaced shorter subapertures.
3.2. OAWRS Scattering Strength Images of Shoaling Fish Populations
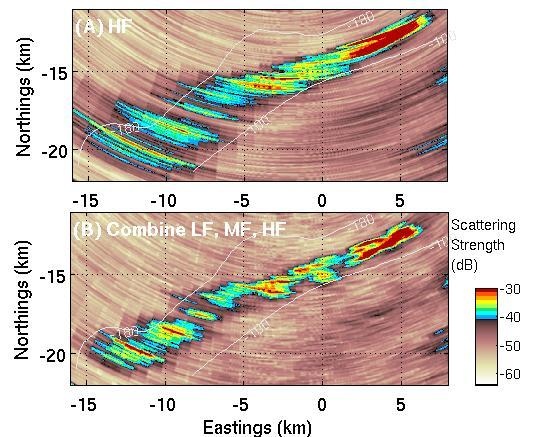
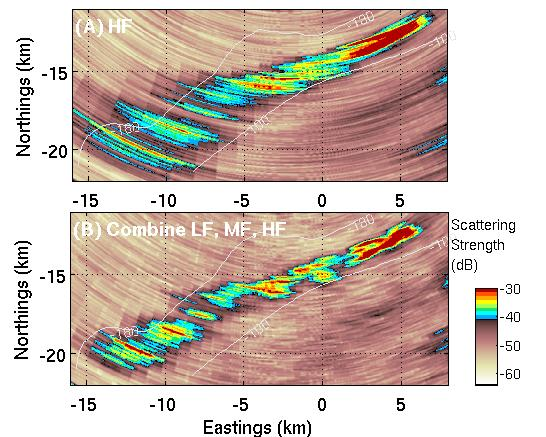
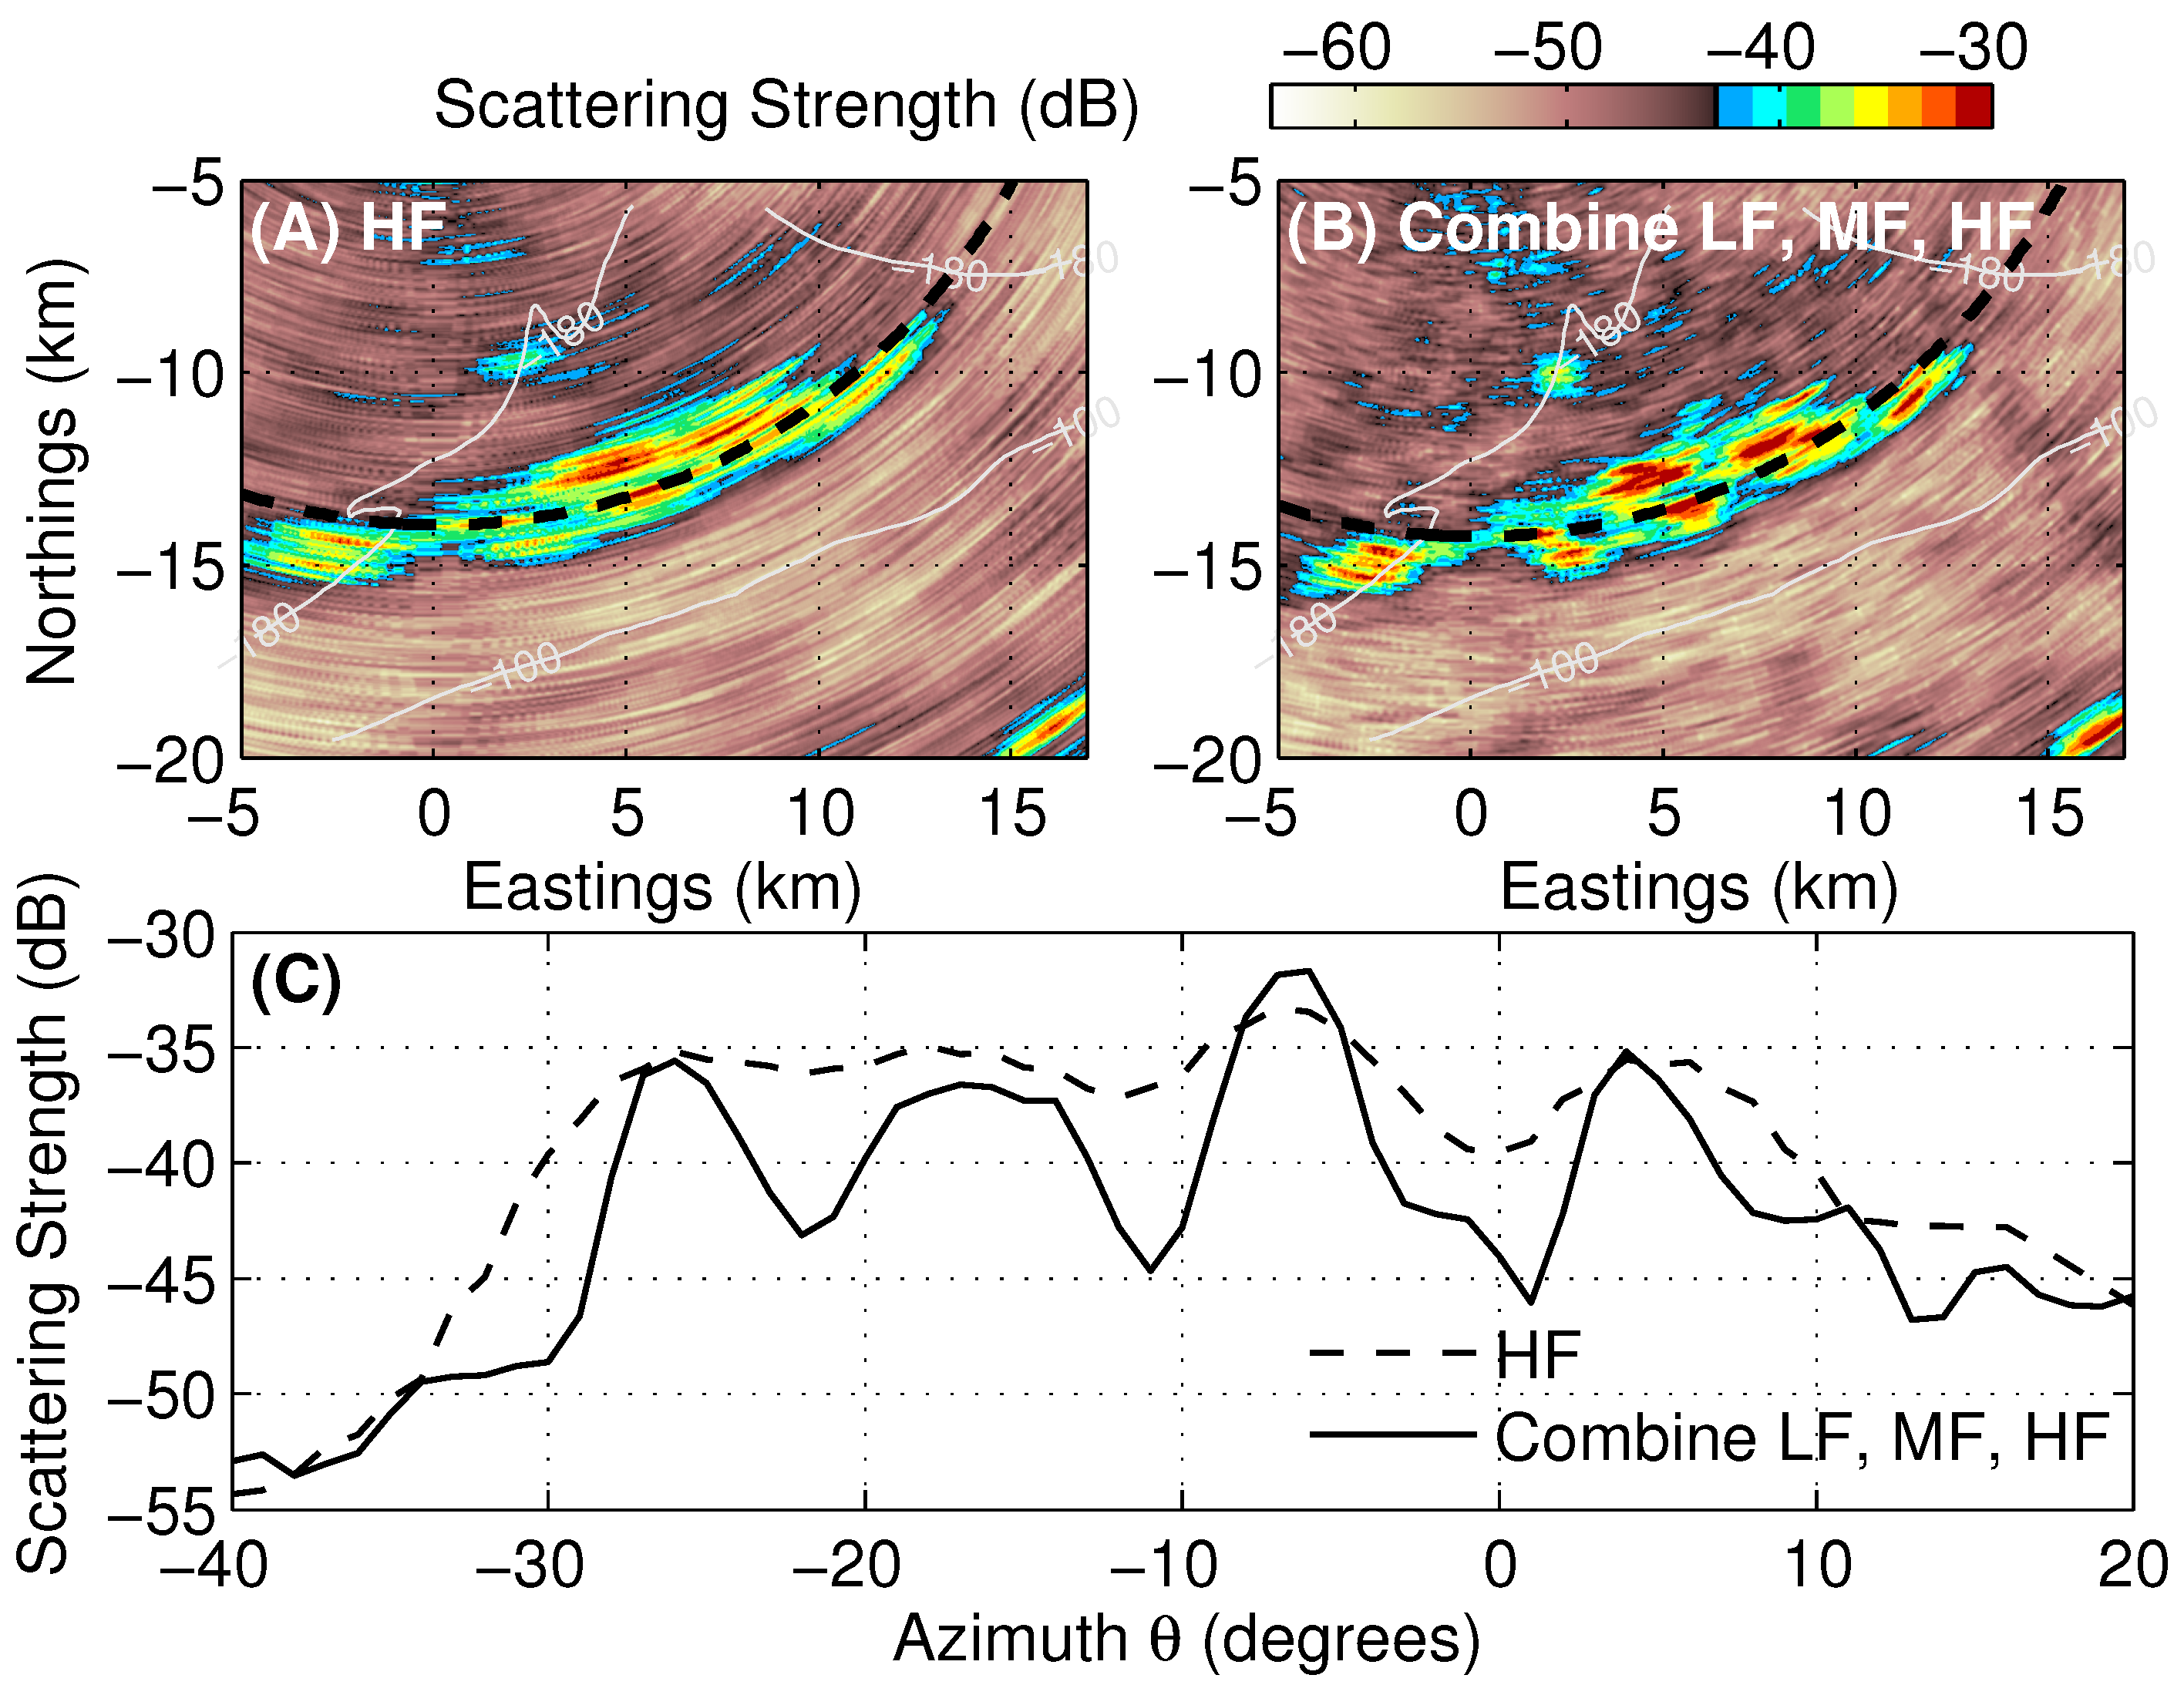
The cross-range or angular resolution of instantaneous wide-area OAWRS scattering strength images of the ocean environment [2,3,13] can be significantly enhanced via beamforming with the nonuniformly-spaced subarrays of the ONR-FORA over that of its individual uniformly-spaced counterparts. Examples of OAWRS scattering strength images containing scattered returns from fish populations formed from LFM signal transmissions centered at 1125 Hz and 50 Hz bandwidth are shown in Figure 5 and Figure 6. The OAWRS scattering strength images were generated following the OAWRS approach outlined in Refs. [2,3]. Here, the acoustic pressure-time series measured by hydrophones across the receiver array were processed using time-domain delay-and-sum beamforming [18] with the nonuniformly-spaced subarrays. The results of which are compared to those obtained with the conventional uniformly-spaced HF subaperture. In OAWRS images of shoaling Atlantic herring populations from GOME06, we find that fish population centers that were previously merged together when data were beamformed with the conventional HF subaperture can be spatially resolved after beamforming with the newly defined subarray that combines the conventional LF, MF, and HF subapertures (see Figure 5 and Figure 6). The OAWRS image in Figure 5A is blurred because of the large beam width ( degree at broadside) of the conventional HF subaperture (see Table 1). In contrast, the OAWRS image is significantly enhanced by beamforming with the newly defined subarray, as shown in Figure 5B because of the narrower beam width ( degree at broadside). OAWRS scattering strength images containing scattered returns from widely-distributed shoaling fish populations along the northern flank of Georges Bank are shown in Figure 6, illustrating the angular resolution enhancement from array broadside to array end-fire achieved with the nonuniformly-spaced subarray.
The scattering strength values along the black dashed contours in Figure 5A,B are plotted as a function of relative bearing measured from array broadside in Figure 5C. The four fish population centers are well resolved with the nonuniformly-spaced subarray while they are merged together with the conventional uniformly-spaced HF subaperture. The Atlantic herring areal population densities over instantaneous wide areas were obtained from OAWRS scattering strength images, like the ones shown here, by correcting for the mean target strength of an individual fish in Refs. [2,8,13]. These references also provide ground-truth measurements of fish presence and locations in OAWRS imagery via coincident conventional fish-finding sonar echosounding and trawl sampling.
3.3. POAWRS Beamformed Spectrogram of Marine Mammal Vocalizations and Ship Tonals
The finer angular resolution and higher array gain provided by the nonuniformly-spaced subarray can enhance bearing estimation and improve signal detection in beamformed spectrograms used extensively in POAWRS [1,4,5,6]. These enhancements are illustrated in POAWRS of ship tonal and marine mammal vocalization signals measured in GOME06.
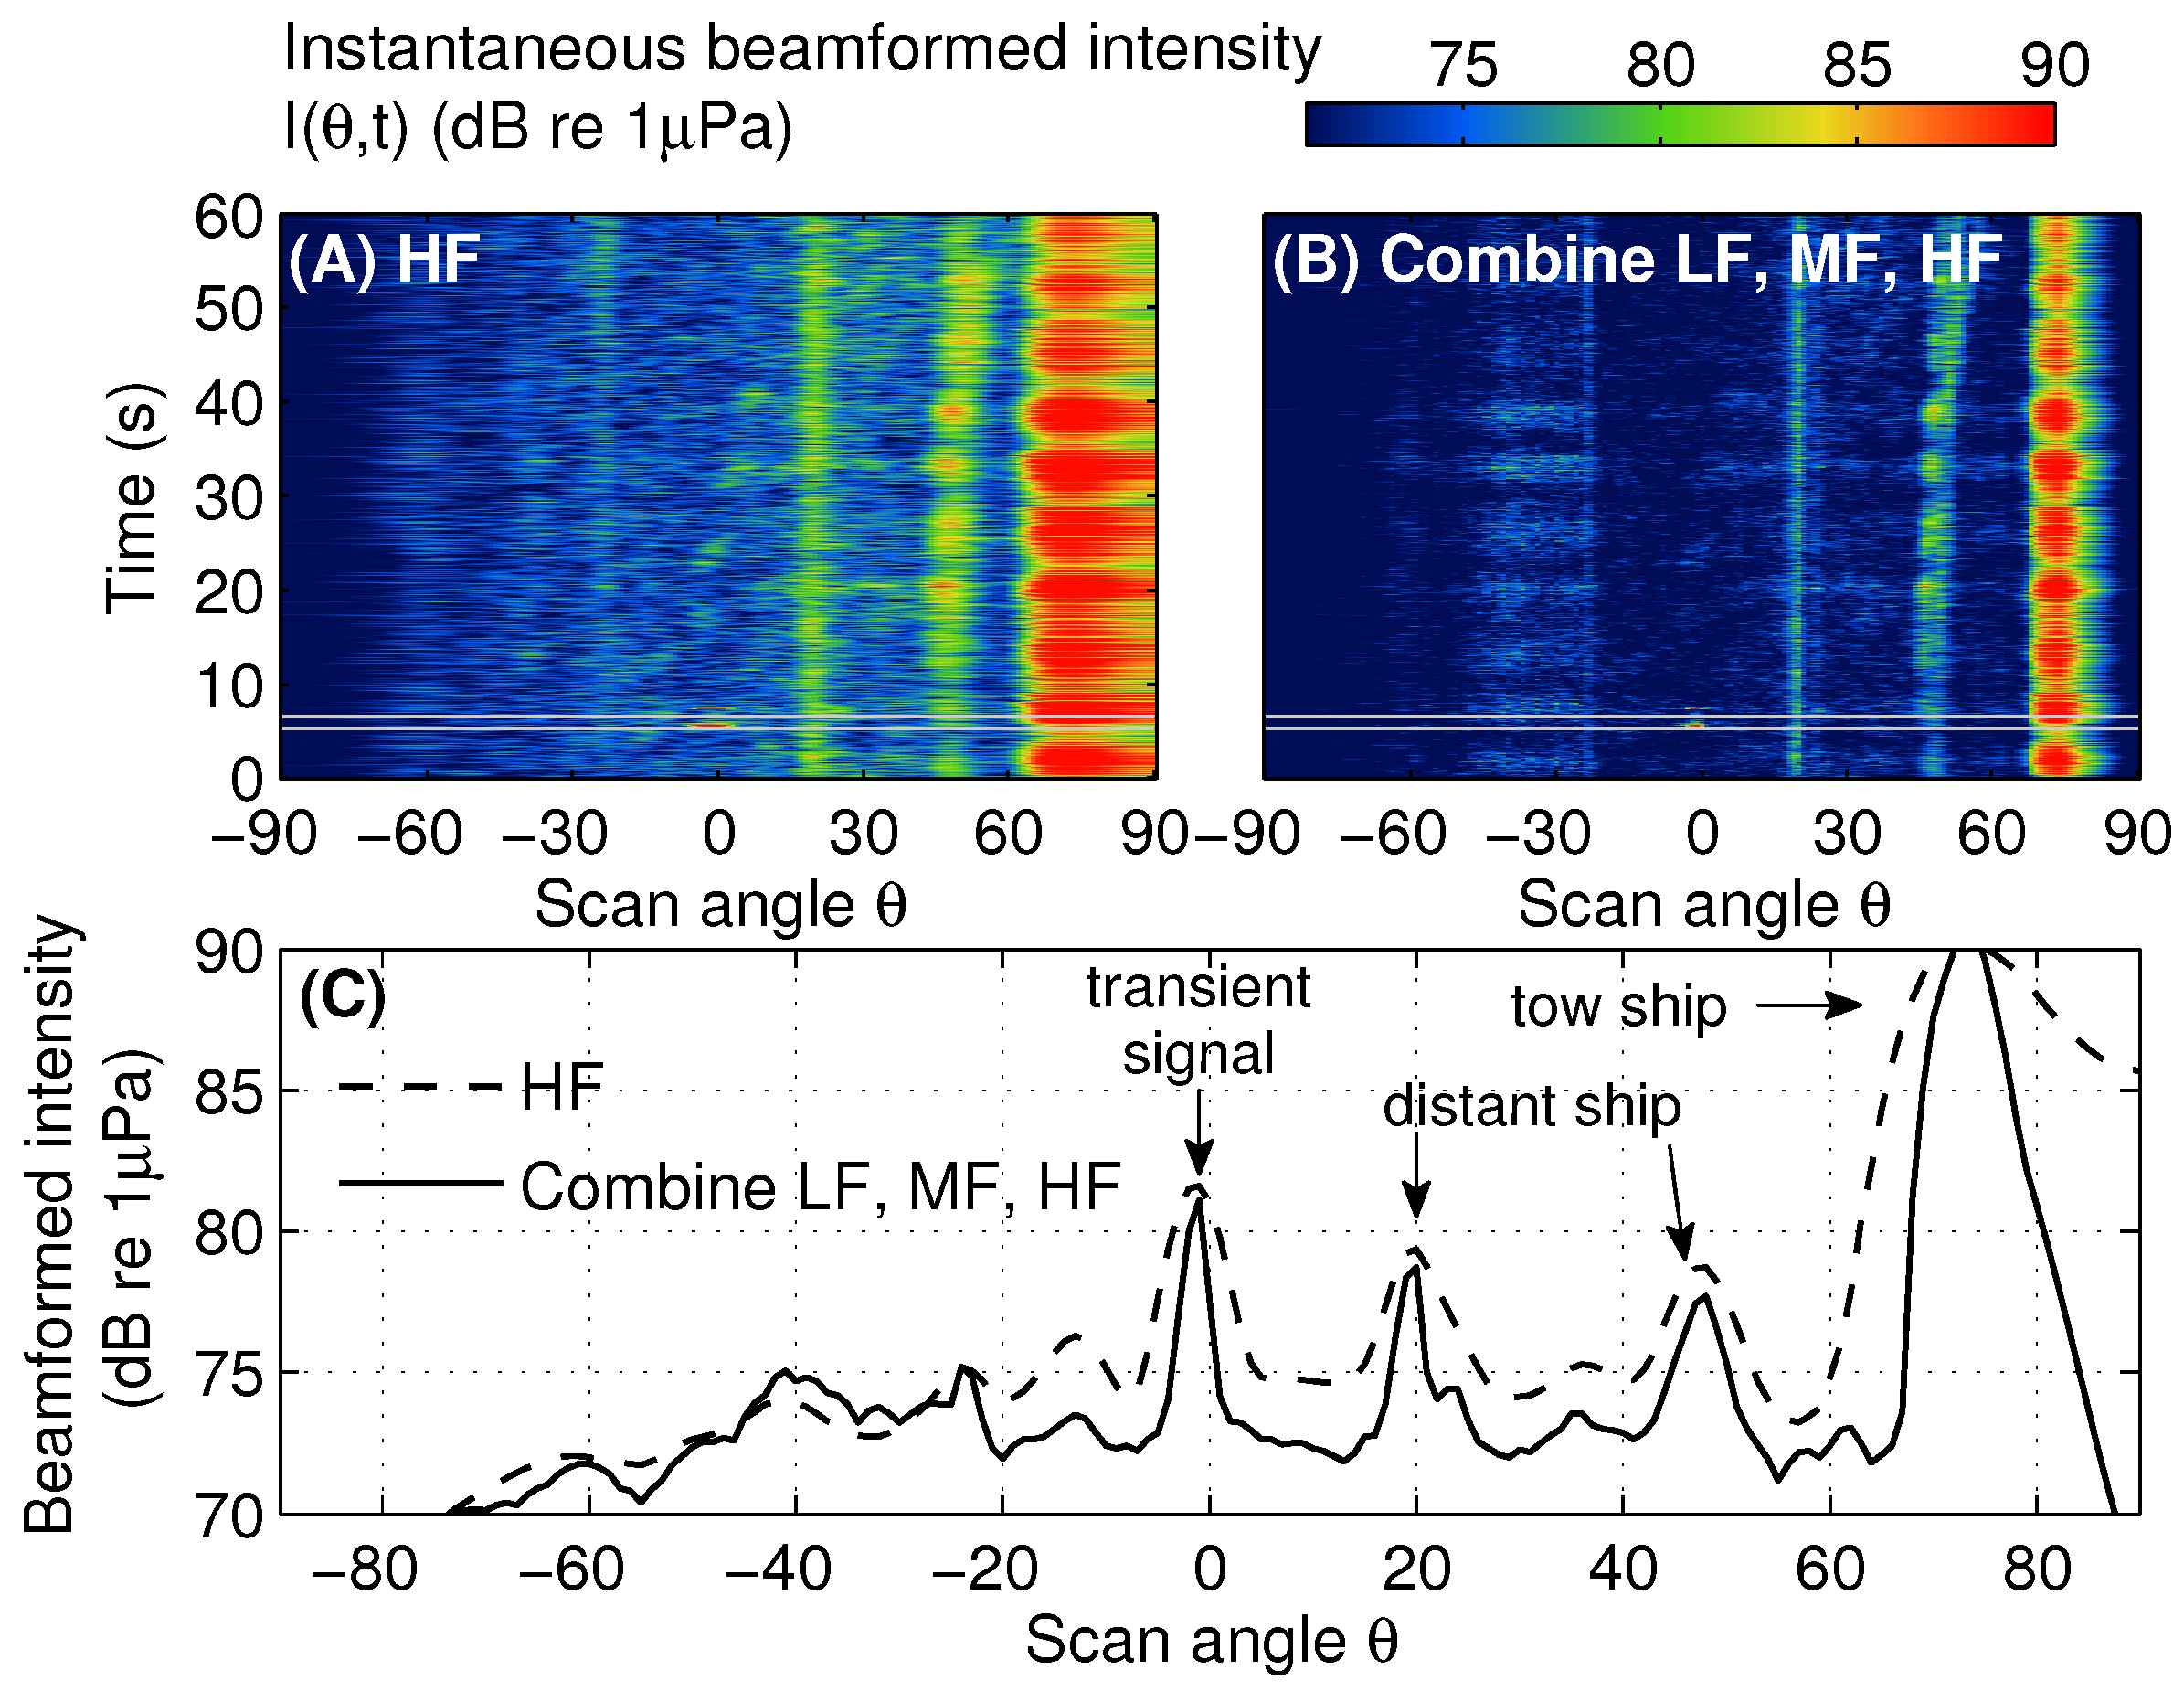
The finer angular resolution provided by the nonuniformly-spaced subarray which combines the LF, MF and HF subapertures leads to better localization of ship radiated sound and other signals in azimuthal angular space (see Figure 7). Here, the acoustic pressure-time series measured by sensors across the receiver array was bandpass filtered between 1.2 kHz to 1.5 kHz and converted to two-dimensional beam-time series by frequency-domain beamforming via Equation (2) with scan angle varying from to . The azimuthal bearing of each ship radiated signal was estimated as the beam that contains maximum energy in beam-time. As shown in Figure 7, the ambient noise floor is reduced by approximately 4 dB because of an approximate factor of 2 narrower beam width provided by the nonuniformly-spaced subarray.
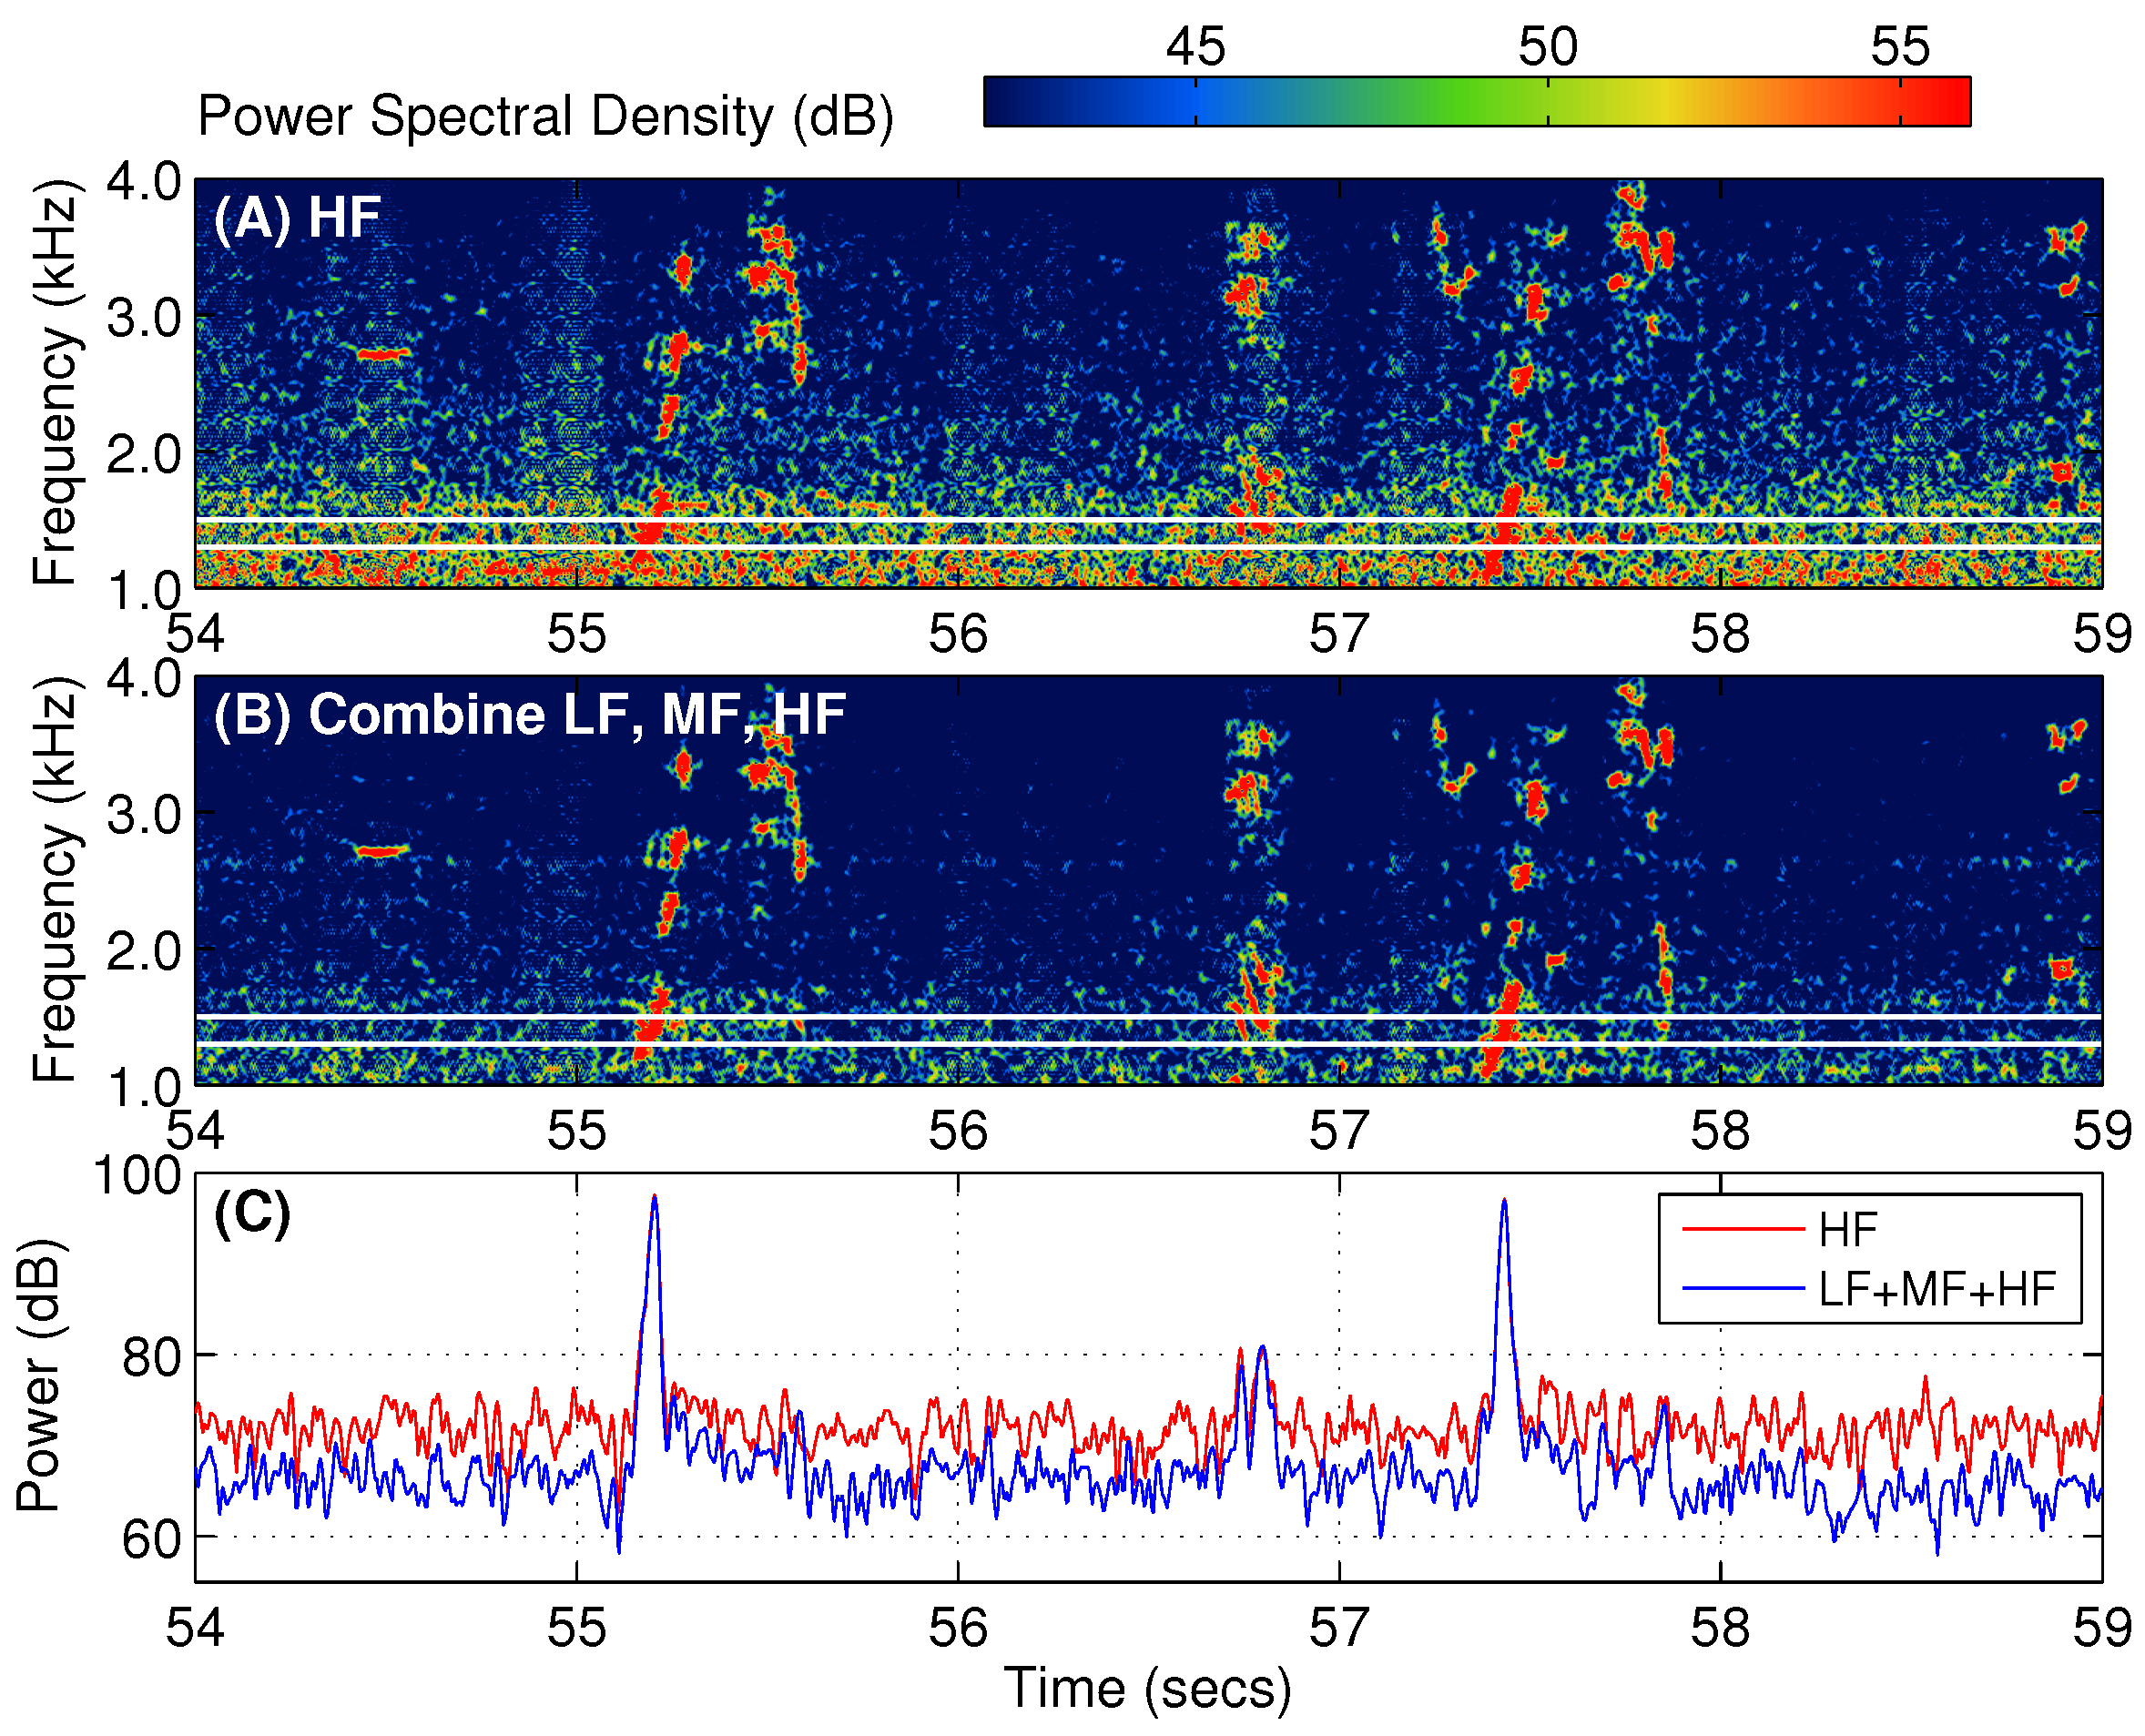
Examples of beamformed spectrograms in a bearing containing pilot whale vocalizations are shown in Figure 8. The beamformed spectrograms are generated by temporal Fourier transform of the beamformed pressure-time series using the conventional HF subaperture, and the newly defined nonuniformly-spaced subarray combining LF, MF and HF subapertures. Power spectral density (PSD) within areas bounded by the white solid lines in Figure 8A,B are integrated along the frequency axis and shown in Figure 8C as a function of time. The values of the peak intensities in Figure 8C, which correspond to the pilot whale vocalizations located in time around 55.2 s and 57.4 s, are consistent for both the HF subaperture and the nonuniformly-spaced subarray. Because of the higher array gain it provides, the nonuniformly-spaced subarray suppresses the ambient noise level by an additional 4 dB when compared to the conventional uniformly-spaced HF subaperture. These results are consistent with the values shown in Figure 7 and Table 1, and illustrate the effectiveness of the nonuniformly-spaced subarray for enhancing SNR in POAWRS.
4. Discussion
The potential enhancements provided by the nonuniformly-spaced subarrays over that of the conventional uniformly-spaced individual subapertures of the ONR-FORA are dependent on the signal center frequency, bandwidth, as well as the choice of subapertures used in forming the nonuniformly-spaced subarrays in both active and passive OAWRS. In general, for a given nonuniformly-spaced subarray, increasing the center frequency or extending the signal bandwidth leads to higher array gain and finer beam width or angular resolution, but can also lead to larger grating lobes in real angular space when the signal frequency lies beyond the maximum design frequency associated with the subaperture that has the smallest inter-element spacing. In practical ocean sensing applications, these factors need to be balanced and optimized accordingly. As shown in Table 1, the subarray composed of the linear superposition of the LF, MF, and HF subapertures provides an angular resolution ( degree) at 1125 Hz that can be improved (up to degree) by increasing signal center frequency up to 2 kHz without the presence of significant grating lobes in real angular space. In contrast, the subarray composed of the linear superposition of the LF and MF subapertures has a beam width limited to 1.44 degrees since the center frequency has to be lower than 1 kHz in order to avoid significant grating lobes in real space. Since the ULF subaperture introduces strong grating lobes for signals with frequencies larger than 500 Hz, it was excluded in all calculations presented here.
5. Conclusions
Nonuniformly-spaced discrete linear receiver subarrays formed by combining multiple uniformly-spaced subapertures of the ONR-FORA have been shown to significantly improve the angular resolution and SNR in both active and passive OAWRS, while simultaneously avoiding dominant grating lobes in real angular space. The array gain, beam width and maximum grating lobe height are calculated by application of beamforming theory for various nonuniformly-spaced ONR-FORA subarrays. Illustrative examples are provided showing beam width reduction, which leads to SNR and angular resolution enhancements in active and passive OAWRS, based on acoustic data acquired with the ONR-FORA in GOME06. These examples include OAWRS scattering strength images of shoaling Atlantic herring populations and beamformed spectrograms containing ship radiated sound and marine mammal vocalization signals. The nonuniformly-spaced subarray beamforming approach demonstrated here can be employed for real-time ocean sensing because of the simplicity in implementation and low computational cost. This approach can also incorporate other statistical beamforming methods [56] for further enhancement of the angular resolution.
Acknowledgments
This research is supported by the Office of Naval Research (Ocean Acoustics Program), the National Science Foundation, the National Oceanographic Partnership Program, the U.S. Presidential Early Career Award for Scientists and Engineers, the Alfred P. Sloan Foundation, the Census of Marine Life, and Northeastern University.
Author Contributions
Methods derivation and data analysis conducted by Delin Wang; Delin Wang and Purnima Ratilal wrote the paper; research was directed by Purnima Ratilal.
Conflicts of Interest
The authors declare no conflict of interest.
Abbreviations
The following abbreviations are used in this manuscript:
| SNR | signal-to-noise ratio |
| ONR-FORA | Office of Naval Research Five Octave Research Array |
| OAWRS | ocean acoustic waveguide remote sensing |
| POAWRS | passive ocean acoustic waveguide remote sensing |
| GOME06 | Gulf of Maine 2006 Experiment |
| LFM | linear frequency modulated |
| PSD | power spectral density |
| ULF | ultra low frequency |
| LF | low frequency |
| MF | mid frequency |
| HF | high frequency |
References
- Wang, D.; Garcia, H.; Huang, W.; Tran, D.D.; Jain, A.D.; Yi, D.H.; Gong, Z.; Jech, J.M.; Godø, O.R.; Makris, N.C.; et al. Vast assembly of vocal marine mammals from diverse species on fish spawning ground. Nature 2016, 531, 366–370. [Google Scholar] [CrossRef] [PubMed]
- Makris, N.C.; Ratilal, P.; Jagannathan, S.; Gong, Z.; Andrews, M.; Bertsatos, I.; Godø, O.R.; Nero, R.W.; Jech, J.M. Critical population density triggers rapid formation of vast oceanic fish shoals. Science 2009, 323, 1734–1737. [Google Scholar] [CrossRef] [PubMed]
- Makris, N.C.; Ratilal, P.; Symonds, D.T.; Jagannathan, S.; Lee, S.; Nero, R.W. Fish population and behavior revealed by instantaneous continental shelf-scale imaging. Science 2006, 311, 660–663. [Google Scholar] [CrossRef] [PubMed]
- Wang, D.; Huang, W.; Garcia, H.; Ratilal, P. Vocalization source level distributions and pulse compression gains of diverse baleen whale species in the Gulf of Maine. Remote Sens. 2016, 8, 881. [Google Scholar] [CrossRef]
- Huang, W.; Wang, D.; Ratilal, P. Diel and Spatial Dependence of Humpback Song and Non-Song Vocalizations in Fish Spawning Ground. Remote Sens. 2016, 8, 712. [Google Scholar] [CrossRef]
- Huang, W.; Wang, D.; Garcia, H.; Godø, O.R.; Ratilal, P. Continental Shelf-Scale Passive Acoustic Detection and Characterization of Diesel-Electric Ships Using a Coherent Hydrophone Array. Remote Sens. 2017, 9, 772. [Google Scholar] [CrossRef]
- Jagannathan, S.; Küsel, E.T.; Ratilal, P.; Makris, N.C. Scattering from extended targets in range-dependent fluctuating ocean-waveguides with clutter from theory and experiments. J. Acoust. Soc. Am. 2012, 132, 680–693. [Google Scholar] [CrossRef] [PubMed]
- Jagannathan, S.; Bertsatos, I.; Symonds, D.; Chen, T.; Nia, H.T.; Jain, A.D.; Andrews, M.; Gong, Z.; Nero, R.; Ngor, L.; et al. Ocean acoustic waveguide remote sensing (OAWRS) of marine ecosystems. Mar. Ecol. Prog. Ser. 2009, 395, 137–160. [Google Scholar] [CrossRef]
- Makris, N.C.; Berkson, J.M. Long-range backscatter from the Mid-Atlantic Ridge. J. Acoust. Soc. Am. 1994, 95, 1865–1881. [Google Scholar] [CrossRef]
- Makris, N.C.; Avelino, L.Z.; Menis, R. Deterministic reverberation from ocean ridges. J. Acoust. Soc. Am. 1995, 97, 3547–3574. [Google Scholar] [CrossRef]
- Gong, Z.; Ratilal, P.; Makris, N.C. Simultaneous localization of multiple broadband non-impulsive acoustic sources in an ocean waveguide using the array invariant. J. Acoust. Soc. Am. 2015, 138, 2649–2667. [Google Scholar] [CrossRef] [PubMed]
- Gong, Z.; Jain, A.D.; Tran, D.; Yi, D.H.; Wu, F.; Zorn, A.; Ratilal, P.; Makris, N.C. Ecosystem scale acoustic sensing reveals humpback whale behavior synchronous with herring spawning processes and re-evaluation finds no effect of sonar on humpback song occurrence in the Gulf of Maine in Fall 2006. PLoS ONE 2014, 9, e104733. [Google Scholar] [CrossRef] [PubMed]
- Gong, Z.; Andrews, M.; Jagannathan, S.; Patel, R.; Jech, J.M.; Makris, N.C.; Ratilal, P. Low-frequency target strength and abundance of shoaling Atlantic herring (Clupea harengus) in the Gulf of Maine during the Ocean Acoustic Waveguide Remote Sensing 2006 Experiment. J. Acoust. Soc. Am. 2010, 127, 104–123. [Google Scholar] [CrossRef] [PubMed]
- Ratilal, P.; Lai, Y.; Symonds, D.T.; Ruhlmann, L.A.; Preston, J.R.; Scheer, E.K.; Garr, M.T.; Holland, C.W.; Goff, J.A.; Makris, N.C. Long range acoustic imaging of the continental shelf environment: The Acoustic Clutter Reconnaissance Experiment 2001. J. Acoust. Soc. Am. 2005, 117, 1977–1998. [Google Scholar] [CrossRef] [PubMed]
- Song, H.; Cho, S.; Kang, T.; Hodgkiss, W.; Preston, J. Long-range acoustic communication in deep water using a towed array. J. Acoust. Soc. Am. 2011, 129, EL71–EL75. [Google Scholar] [CrossRef] [PubMed]
- Preston, J.R.; Ellis, D.D.; Gauss, R.C. Geoacoustic parameter extraction using reverberation data from the 2000 Boundary Characterization Experiment on the Malta Plateau. IEEE J. Ocean. Eng. 2005, 30, 709–732. [Google Scholar] [CrossRef]
- Kay, S.M. Fundamentals of Statistical Signal Processing Vol. II: Detection Theory; Prentice Hall PTR: Upper Saddle River, NJ, USA, 1998. [Google Scholar]
- Johnson, D.H.; Dudgeon, D.E. Array Signal Processing: Concepts and Techniques; Prentice Hall PTR: Englewood Cliffs, NJ, USA, 1993. [Google Scholar]
- Urick, R. Principles of Underwater Sound; McGraw Hill: New York, NY, USA, 1983. [Google Scholar]
- Tolstoy, I.; Clay, C. Ocean Acoustics: Theory and Experiment in Underwater Sound; American Institute of Physics: New York, NY, USA, 1987. [Google Scholar]
- Kuperman, W.A.; Collins, M.D.; Perkins, J.S.; Davis, N. Optimal time-domain beamforming with simulated annealing including application of apriori information. J. Acoust. Soc. Am. 1990, 88, 1802–1810. [Google Scholar] [CrossRef]
- Collins, M.D.; Berkson, J.M.; Kuperman, W.A.; Makris, N.C.; Perkins, J.S. Applications of optimal time-domain beamforming. J. Acoust. Soc. Am. 1993, 93, 1851–1865. [Google Scholar] [CrossRef]
- Aidala, V.; Hammel, S. Utilization of modified polar coordinates for bearings-only tracking. IEEE Trans. Autom. Control 1983, 28, 283–294. [Google Scholar] [CrossRef]
- Gong, Z.; Tran, D.D.; Ratilal, P. Comparing passive source localization and tracking approaches with a towed horizontal receiver array in an ocean waveguide. J. Acoust. Soc. Am. 2013, 134, 3705–3720. [Google Scholar] [CrossRef] [PubMed]
- Lee, S.; Makris, N.C. The array invariant. J. Acoust. Soc. Am. 2006, 119, 336–351. [Google Scholar] [CrossRef] [PubMed]
- Becker, K.; Preston, J. The ONR five octave research array (FORA) at Penn State. In Proceedings of the IEEE OCEANS 2003, San Diego, CA, USA, 22–26 September 2003; Volume 5, pp. 2607–2610. [Google Scholar]
- Van Trees, H. Detection, Estimation, and Modulation Theory, Part IV Optimum Array Processing; Detection, Estimation, and Modulation Theory; Wiley-Interscience: New York, NY, USA, 2002. [Google Scholar]
- Etter, R.J.; Cutbirth, J.M.; Ceccio, S.L.; Dowling, D.R.; Perlin, M. High reynolds number experimentation in the US navy’s William B Morgan Large Cavitation Channel. Meas. Sci. Technol. 2005, 16, 1701–1709. [Google Scholar] [CrossRef]
- Maguer, A.; Dymond, R.; Mazzi, M.; Biagini, S.; Fioravanti, S.; Guerrini, P. SLITA: A new slim towed array for AUV applications. J. Acoust. Soc. Am. 2008, 123, 141–146. [Google Scholar] [CrossRef]
- Pal, P.; Vaidyanathan, P. Nested arrays: A novel approach to array processing with enhanced degrees of freedom. IEEE Trans. Signal Process. 2010, 58, 4167–4181. [Google Scholar] [CrossRef]
- Pal, P.; Vaidyanathan, P. Nested arrays in two dimensions, part I: Geometrical considerations. IEEE Trans. Signal Process. 2012, 60, 4694–4705. [Google Scholar] [CrossRef]
- Vaidyanathan, P.P.; Pal, P. Sparse sensing with co-prime samplers and arrays. IEEE Trans. Signal Process. 2011, 59, 573–586. [Google Scholar] [CrossRef]
- Martino, G.D.; Iodice, A. Passive beamforming with coprime arrays. IET Radar Sonar Navig. 2017, 11, 964–971. [Google Scholar] [CrossRef]
- Adhikari, K.; Buck, J.R.; Wage, K.E. Beamforming with extended co-prime sensor arrays. In Proceedings of the 2013 IEEE International Conference on Acoustics, Speech and Signal Processing (ICASSP), Vancouver, BC, Canada, 26–31 May 2013; pp. 4183–4186. [Google Scholar]
- Adhikari, K.; Buck, J.R.; Wage, K.E. Extending coprime sensor arrays to achieve the peak side lobe height of a full uniform linear array. EURASIP J. Adv. Signal Process. 2014, 148. [Google Scholar] [CrossRef]
- Cen, L.; Ser, W.; Yu, Z.L.; Rahardja, S. An improved genetic algorithm for aperiodic array synthesis. In Proceedings of the 2008 IEEE International Conference on Acoustics, Speech and Signal Processing (ICASSP 2008), Las Vegas, NV, USA, 31 March–4 April 2008; pp. 2465–2468. [Google Scholar]
- Barott, W.C.; Steffes, P.G. Grating lobe reduction in aperiodic linear arrays of physically large antennas. IEEE Antennas Wirel. Propag. Lett. 2009, 8, 406–408. [Google Scholar] [CrossRef]
- Spence, T.G.; Werner, D.H. Design of broadband planar arrays based on the optimization of aperiodic tilings. IEEE Trans. Antennas Propag. 2008, 56, 76–86. [Google Scholar] [CrossRef]
- Trucco, A.; Martelli, S.; Crocco, M. Low-cost acoustic cameras for underwater wideband passive imaging. IEEE J. Ocean. Eng. 2015, 40, 929–937. [Google Scholar] [CrossRef]
- Trucco, A.; Martelli, S.; Crocco, M. Passive underwater imaging through optimized planar arrays of hydrophones. In Proceedings of the 2014 Oceans-St. John’s, St. John’s, NL, Canada, 14–19 September 2014; pp. 1–5. [Google Scholar]
- Trucco, A.; Murino, V. Stochastic optimization of linear sparse arrays. IEEE J. Ocean. Eng. 1999, 24, 291–299. [Google Scholar] [CrossRef]
- McGehee, D.; Jaffe, J.S. Beamforming with dense random arrays: The development of a spatially shaded polyvinylidene fluoride acoustic transducer. J. Acoust. Soc. Am. 1994, 95, 318–323. [Google Scholar] [CrossRef]
- Yang, H.; Chen, H.; Xu, L. Beamforming with nonsinusoidal signal for grating lobes suppression in underwater acoustic imaging. In Proceedings of the OCEANS 2015-Genova, Genoa, Italy, 18–21 May 2015; pp. 1–5. [Google Scholar]
- Camacho, J.; Parrilla, M.; Fritsch, C. Phase coherence imaging. IEEE Trans. Ultrason. Ferroelectr. Freq. Control 2009, 56. [Google Scholar] [CrossRef] [PubMed]
- Camacho, J.; Parrilla, M.; Fritsch, C. Grating-lobes reduction by application of phase coherence factors. In Proceedings of the 2009 IEEE International Ultrasonics Symposium (IUS), Rome, Italy, 20–23 September 2009; pp. 341–344. [Google Scholar]
- Torbatian, Z.; Adamson, R.; Bance, M.; Brown, J. Transmit beamforming techniques for suppressing grating lobes in large pitch ultrasonic phased arrays. Proc. SPIE 2011, 7968, 79680R. [Google Scholar]
- Torbatian, Z.; Adamson, R.; Bance, M.; Brown, J.A. A split-aperture transmit beamforming technique with phase coherence grating lobe suppression. IEEE Trans. Ultrason. Ferroelectr. Freq. Control 2010, 57, 2588–2595. [Google Scholar] [CrossRef] [PubMed]
- Preston, J.R.; Ellis, D.D. Extracting bottom information from towed-array reverberation data: Part I: Measurement methodology. J. Mar. Syst. 2009, 78, S359–S371. [Google Scholar] [CrossRef]
- McEachern, J.F.; McConnell, J.A.; Jamieson, J.; Trivett, D. ARAP—Deep Ocean Vector Sensor Research Array. In Proceedings of the OCEANS 2006, Boston, MA, USA, 18–21 September 2006; pp. 1–5. [Google Scholar]
- Tran, D.; Andrews, M.; Ratilal, P. Probability distribution for energy of saturated broadband ocean acoustic transmission: Results from Gulf of Maine 2006 experiment. J. Acoust. Soc. Am. 2012, 132, 3659–3672. [Google Scholar] [CrossRef] [PubMed]
- Center, N. Atlantic herring stock assessment for 2012. In Proceedings of the 54th Northeast Regional Stock Assessment Workshop (54th SAW), Woods Hole, MA, USA, 5–9 June 2012. [Google Scholar]
- Jech, J.M.; Stroman, F. Aggregative patterns of pre-spawning Atlantic herring on Georges Bank from 1999–2010. Aquat. Living Resour. 2012, 25, 1–14. [Google Scholar] [CrossRef]
- Overholtz, W.J.; Jacobson, L.D.; Melvin, G.D.; Cieri, M.; Power, M.; Libby, D.; Clark, K. Stock Assessment of the Gulf of Maine–Georges Bank Atlantic Herring Complex, 2003. In Northeast Fisheries Science Center References Document 04-06; Northeast Fisheries Science Center: Woods Hole, MA, USA, 2004; 290p. [Google Scholar]
- Jech, J.M.; Price, V.; Chavez-Rosales, S.; Michaels, W. Atlantic herring (Clupea harengus) demographics in the Gulf of Maine from 1998 to 2012. J. Northwest Atl. Fish. Sci. 2015, 47, 57–74. [Google Scholar] [CrossRef]
- Andrews, M.; Gong, Z.; Ratilal, P. High resolution population density imaging of random scatterers with the matched filtered scattered field variance. J. Acoust. Soc. Am. 2009, 126, 1057–1068. [Google Scholar] [CrossRef] [PubMed]
- Jain, A.D.; Makris, N.C. Maximum Likelihood Deconvolution of Beamformed Images with Signal-Dependent Speckle Fluctuations from Gaussian Random Fields: With Application to Ocean Acoustic Waveguide Remote Sensing (OAWRS). Remote Sens. 2016, 8, 694. [Google Scholar] [CrossRef]
Figure 1.
A sketch of the array geometry and incident plane wave field. The nonuniformly-spaced linear array is aligned horizontally along the y-axis in the ocean waveguide with elements located at . The incident broadband signal is propagated in the direction of the unit vector , whose azimuth is measured from array broadside.

Figure 2.
Schematic of three of the four subapertures of the Office of Naval Research Five Octave Research Array (ONR-FORA), including the low-frequency (LF), mid-frequency (MF) and high-frequency (HF) subapertures. The ultra-low-frequency (ULF) subaperture of the ONR-FORA is not shown here.
Figure 2.
Schematic of three of the four subapertures of the Office of Naval Research Five Octave Research Array (ONR-FORA), including the low-frequency (LF), mid-frequency (MF) and high-frequency (HF) subapertures. The ultra-low-frequency (ULF) subaperture of the ONR-FORA is not shown here.
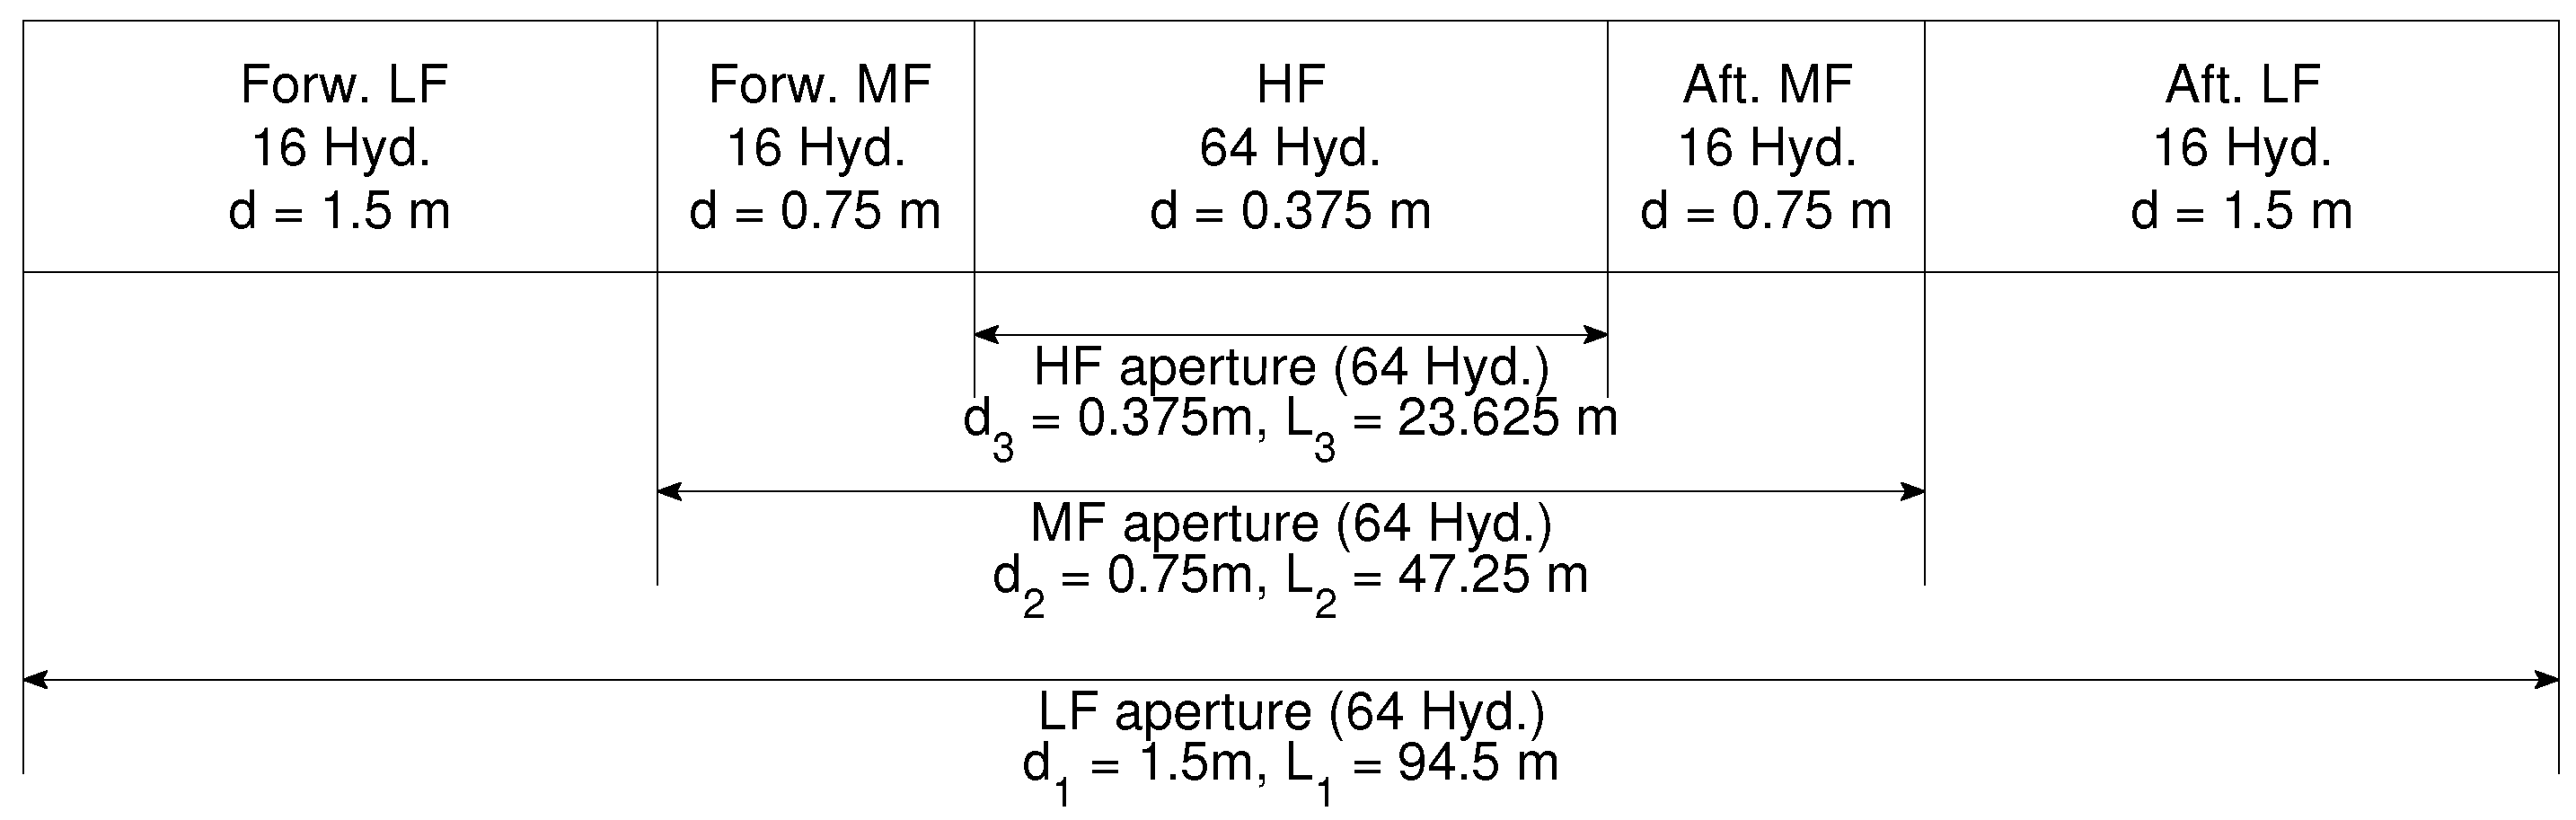
Figure 3.
A comparison of the beam patterns of the conventional uniformly-spaced individual subapertures LF, MF, and HF (dashed lines) and the newly defined nonuniformly-spaced subarray combining the three subapertures (solid line) at frequency Hz. The incident signal is assumed to be in the direction of (A,B) array broadside () and (C,D) array end-fire (), respectively. The subplots (B,D) are zoom-in views of the subplots (A,C) around the main lobes.
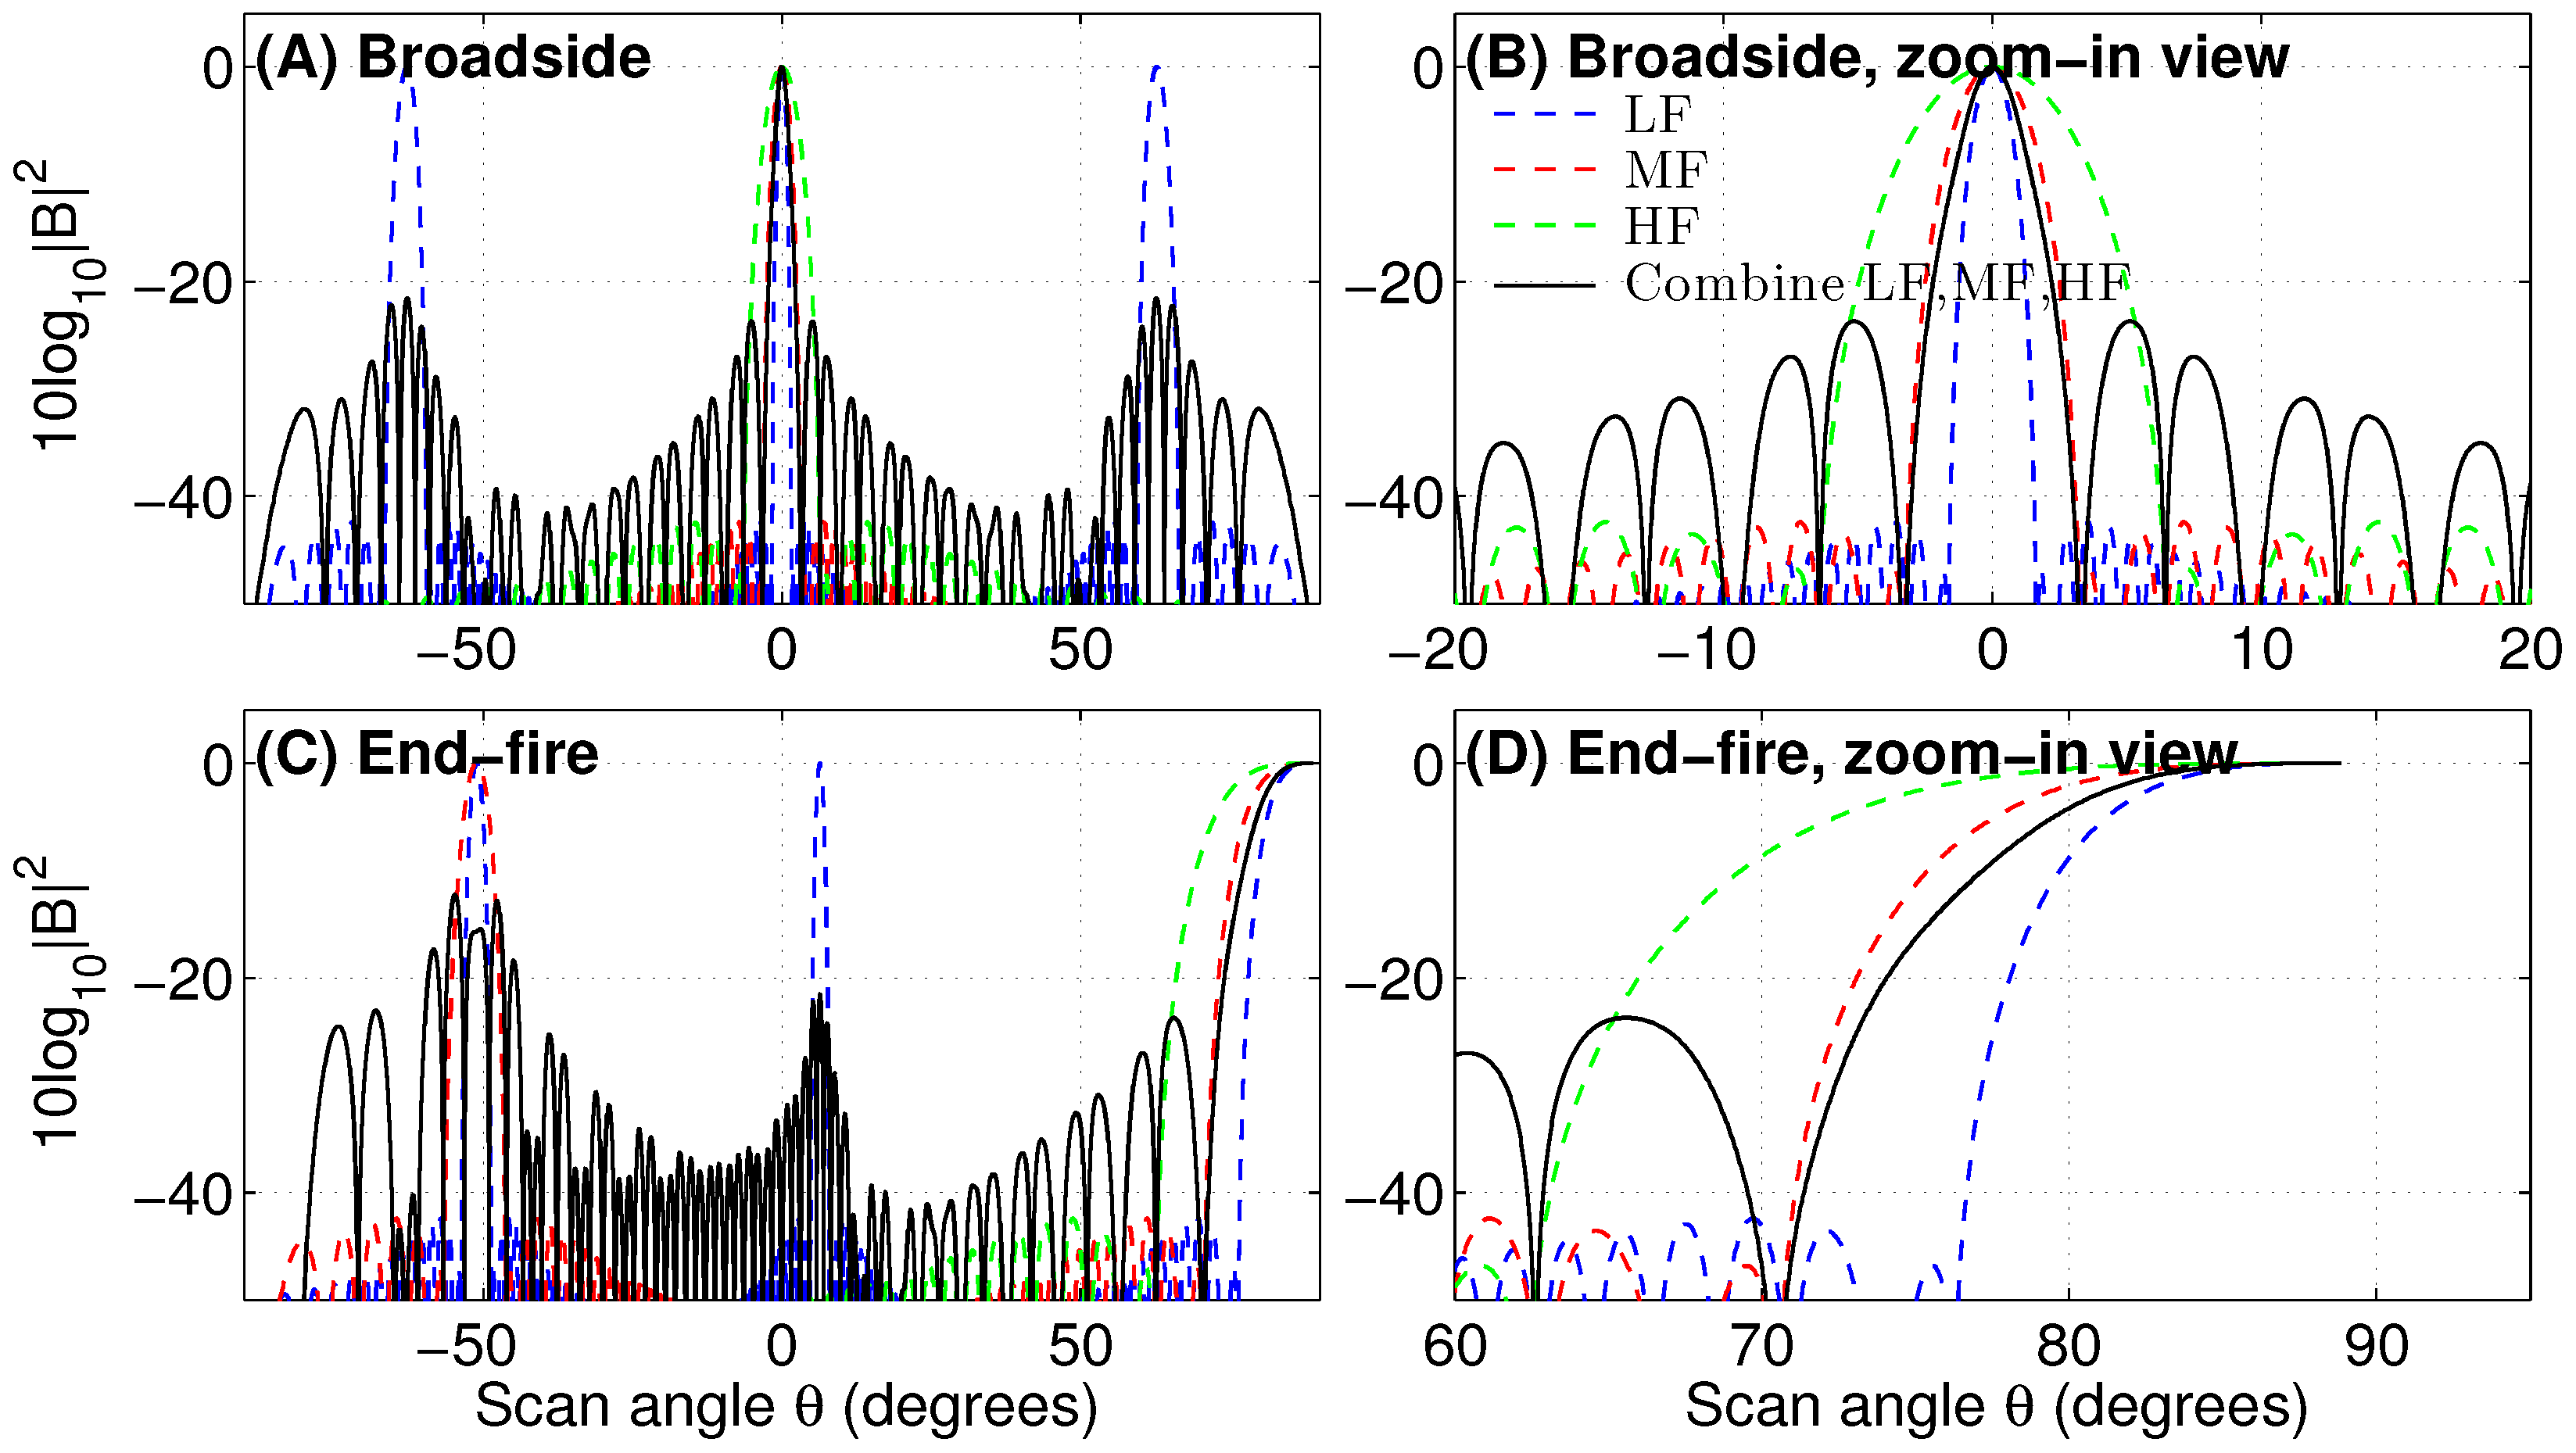
Figure 4.
The time-averaged beamformed intensity calculated via Equation (8) corresponding to Figure 3 for a broadband linear frequency modulated (LFM) pulse signal of 50 Hz bandwidth centered at 1125 Hz with a uniform normalized power spectral density. The continuous frequency integrals are implemented as discrete frequency component summation with a frequency increment Hz. The incident signal is assumed to be in the direction of (A,B) array broadside () and (C,D) array end-fire (), respectively. The beam width of the nonuniformly-spaced subarray is approximately three times smaller than that of the conventional HF subaperture at broadside, and approximately 1.7 times smaller at end-fire.

Figure 5.
Comparison of instantaneous wide-area Ocean Acoustic Waveguide Remote Sensing (OAWRS) scattering strength images of a spawning Atlantic herring shoal measured on 3 October 2006 on the northern flank of Georges Bank. These images are formed from an LFM pulse transmission of 1 s duration and 50 Hz bandwidth centered at 1125 Hz (compare with Figure 1J in Ref. [2] based on an LFM pulse transmission centered at 950 Hz). The OAWRS images are generated following the approach outlined in Ref. [2,3] but is beamformed in the time domain using (A) the conventional uniformly-spaced HF subaperture and (B) the newly defined nonuniformly-spaced subarray combining LF, MF, and HF subapertures. The scattering strength values along the black dotted contours in (A,B) are shown in (C) as a function of relative bearing measured from array broadside. The fish population centers are well resolved when the acoustic data are beamformed with the nonuniformly-spaced subarray while they are merged together with the conventional HF subaperture.

Figure 6.
The same as Figure 5 showing a comparison of instantaneous wide-area OAWRS scattering strength images of a spawning Atlantic herring shoal measured on 29 September 2006 on the northern flank of Georges Bank. These images are formed from an LFM pulse transmission of 1 s duration and 50 Hz bandwidth centered at 1125 Hz (compare with Figure 4C in Ref. [2] based on an LFM pulse transmission centered at 950 Hz). Acoustic data are beamformed in time domain using (A) the conventional uniformly-spaced HF subaperture and (B) the newly defined nonuniformly-spaced subarray combining LF, MF, and HF subapertures.
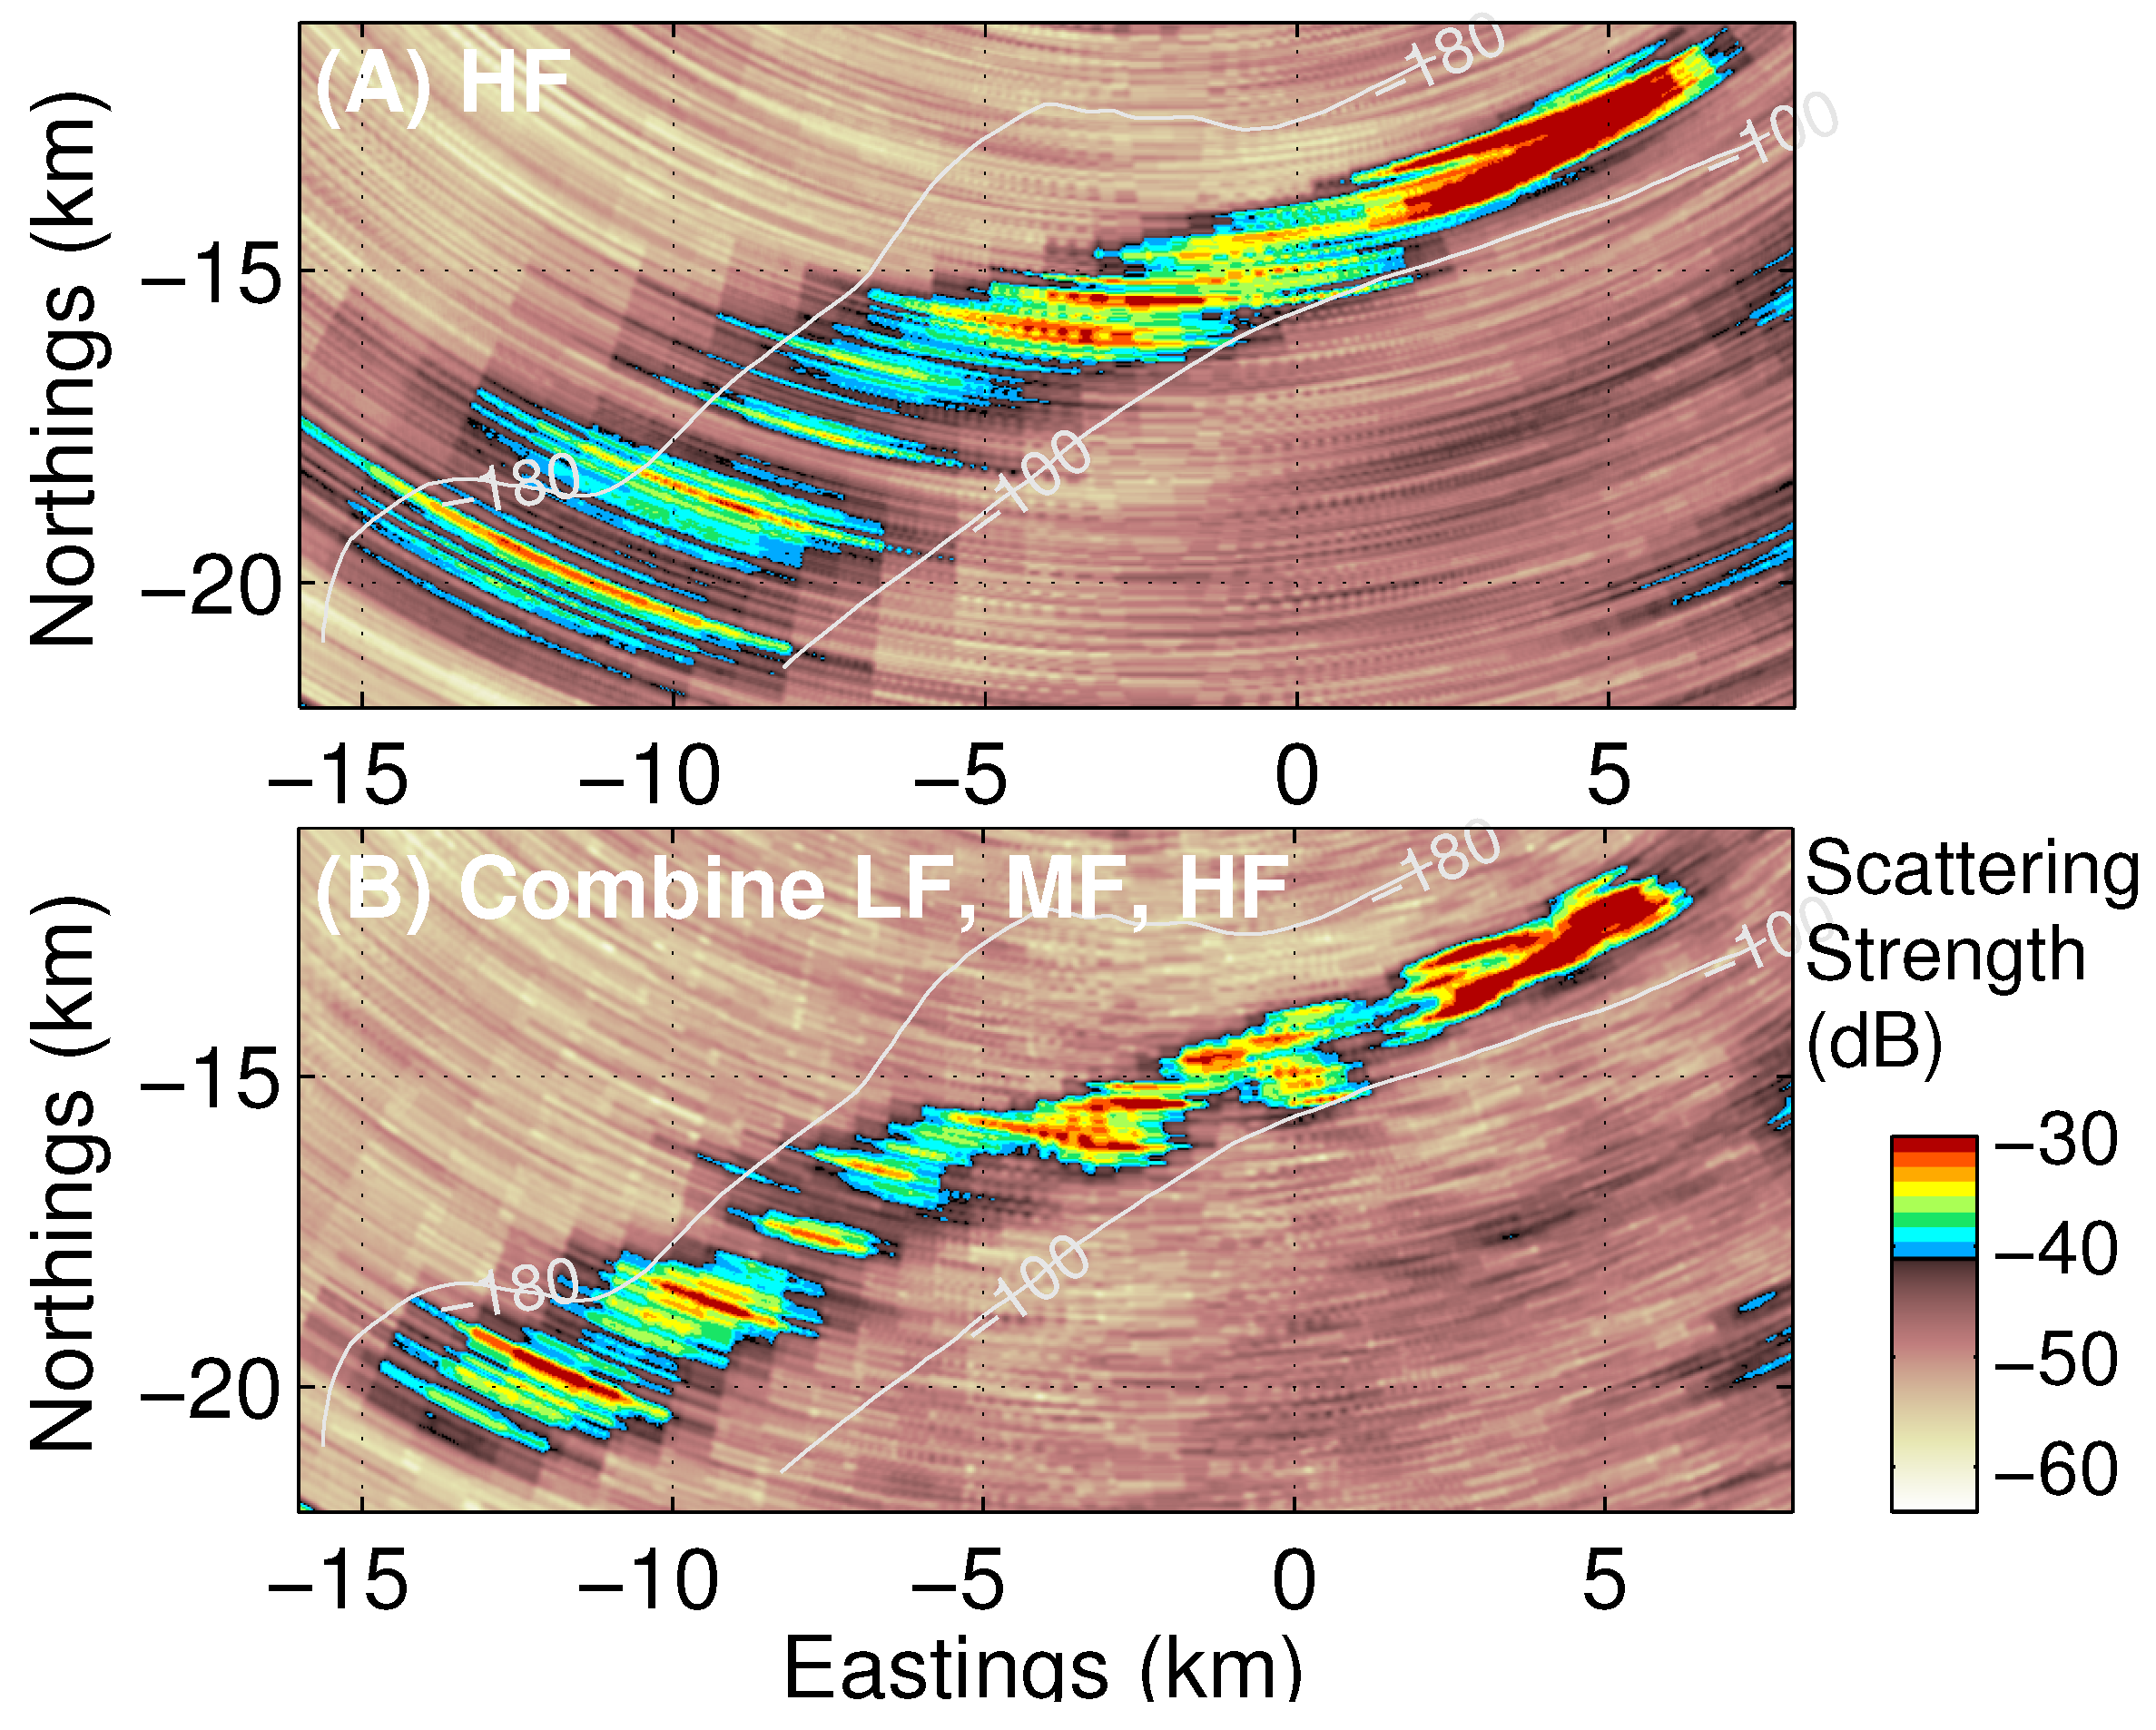
Figure 7.
Two-dimensional beam-time series converted from acoustic pressure-time series measured by sensors across the receiver array using the conventional time-domain beamforming for (A) the uniformly-spaced HF subaperture, and (B) the newly defined subarray that combines LF, MF and HF subapertures. The received vocalization pressure level within the shading area bounded by the gray solid lines in (A,B) are averaged and shown in (C) as a function of scan angle . The ambient noise floor is reduced by an approximately 4 dB because of an approximate factor of 2 narrower beam width provided by the nonuniformly-spaced subarray.

Figure 8.
A comparison of spectrograms containing whistles from a pilot whale after coherent beamforming using (A) the conventional HF subaperture, and (B) the newly defined nonuniformly-spaced subarray combining LF, MF, and HF subapertures. Power spectral density within areas bounded by the white solid lines in (A,B) are integrated along the frequency axis and plotted in (C) as a function of time. The ambient noise floor is reduced by approximately 4 dB in agreement with the results shown in Figure 7.

Table 1.
The number of elements N, total array length L, inter-element spacing d, array gain , beam width , and maximum grating lobe height of the conventional uniformly-spaced subapertures, including the low-frequency (LF), mid-frequency (MF) and high-frequency (HF) subapertures, and newly defined nonuniformly-spaced subarrays of the Office of Naval Research Five Octave Research Array for signals with 50 Hz bandwidth centered at Hz and Hz, respectively. The azimuth of the incident signal is set to be 0 for calculating broadside beam width and array gain, and is set to be for calculating maximum grating lobe height.
| Subaperture | LF | MF | HF | LF + MF | LF + MF + HF | |||||
|---|---|---|---|---|---|---|---|---|---|---|
| N | 64 | 64 | 64 | 96 | 128 | |||||
| L (m) | 94.5 | 47.25 | 23.625 | 94.5 | 94.5 | |||||
| d (m) | 1.5 | 0.75 | 0.375 | variable | variable | |||||
| (Hz) | 950 | 1125 | 950 | 1125 | 950 | 1125 | 950 | 1125 | 950 | 1125 |
| (dB) | 19.45 | 15.42 | 16.44 | 17.18 | 13.43 | 14.17 | 18.75 | 19.29 | 17.71 | 18.37 |
| (deg) | 1.26 | 1.05 | 2.50 | 2.11 | 4.97 | 4.19 | 1.44 | 1.21 | 1.74 | 1.47 |
| (dB) | −3.92 | −3.21 | −42.64 | −3.21 | −42.64 | −42.59 | −21.39 | −5.75 | −24.88 | −16.21 |
© 2017 by the authors. Licensee MDPI, Basel, Switzerland. This article is an open access article distributed under the terms and conditions of the Creative Commons Attribution (CC BY) license (http://creativecommons.org/licenses/by/4.0/).
Share and Cite
MDPI and ACS Style
Wang, D.; Ratilal, P. Angular Resolution Enhancement Provided by Nonuniformly-Spaced Linear Hydrophone Arrays in Ocean Acoustic Waveguide Remote Sensing. Remote Sens. 2017, 9, 1036. https://doi.org/10.3390/rs9101036
AMA Style
Wang D, Ratilal P. Angular Resolution Enhancement Provided by Nonuniformly-Spaced Linear Hydrophone Arrays in Ocean Acoustic Waveguide Remote Sensing. Remote Sensing. 2017; 9(10):1036. https://doi.org/10.3390/rs9101036
Chicago/Turabian StyleWang, Delin, and Purnima Ratilal. 2017. "Angular Resolution Enhancement Provided by Nonuniformly-Spaced Linear Hydrophone Arrays in Ocean Acoustic Waveguide Remote Sensing" Remote Sensing 9, no. 10: 1036. https://doi.org/10.3390/rs9101036
Note that from the first issue of 2016, this journal uses article numbers instead of page numbers. See further details here.