Article

Spatiotemporal Variation of Snow Cover in Tianshan Mountains, Central Asia, Based on Cloud-Free MODIS Fractional Snow Cover Product, 2001–2015

1
National-Local Joint Engineering Laboratory of Geo-Spatial Information Technology, Hunan University of Science and Technology, Xiangtan 411201, China
2
Key Laboratory of Remote Sensing of Gansu Province, Northwest Institute of Eco-Environment and Resources, Chinese Academy of Sciences, Lanzhou 730000, China
*
Author to whom correspondence should be addressed.
Remote Sens. 2017, 9(10), 1045; https://doi.org/10.3390/rs9101045
Submission received: 27 August 2017 / Revised: 25 September 2017 / Accepted: 11 October 2017 / Published: 13 October 2017
(This article belongs to the Special Issue Snow Remote Sensing)

Abstract

:
The change in snow cover under climate change is poorly understood in Tianshan Mountains. Here, we investigate the spatiotemporal characteristics and trends of snow-covered area (SCA) and snow-covered days (SCD) in the Tianshan Mountains by using the cloud-removed MODIS fractional snow cover datasets from 2001–2015. The possible linkage between the snow cover and temperature and precipitation changes over the Tianshan Mountains is also investigated. The results are as follows: (1) The distribution of snow cover over the Tianshan Mountains exhibits a large spatiotemporal heterogeneity. The areas with SCD greater than 120 days are distributed in the principal mountains with elevations of above 3000 m. (2) In total, 26.39% (5.09% with a significant decline) and 34.26% (2.81% with a significant increase) of the study area show declining and increasing trend in SCD, respectively. The SCD mainly decreases in Central and Eastern Tianshan (decreased by 11.88% and 8.03%, respectively), while it increases in Northern and Western Tianshan (increased by 9.36% and 7.47%). (3) The snow cover variations are linked to the temperature and precipitation changes. Temperature tends to be the major factor effecting the snow cover changes in the Tianshan Mountains during 2001–2015.

Graphical Abstract

1. Introduction

Snow cover, as an important component of land cover, is one of the natural materials on the Earth’s surface with wide distribution, obvious seasonal variation, and high sensitivity to climate change [1]. Snow plays an important role in the global energy and water cycles because of its high albedo and thermal and water storage properties, and can indicate the changes in global climate [2,3,4]. Studying snow cover variation is of great importance in monitoring and maintaining water management for ecosystem processes and irrigation practices [5]. For example, in arid and semi-arid regions of Western China, snow cover is a very important water resource, since water from melted snow forms the headwaters for several of the largest rivers in Asia. In these regions, the snowmelt water is dominant among all water sources [6]. Consequently, snow can also largely influence agriculture and animal husbandry [7,8]. More importantly, more than one sixth of the global population relies on water from mountainous snowmelt [9].
The Tianshan Mountains, as the water tower of Central Asia [10], are the source of major rivers in Central Asia (e.g., the Chu River, Syr Darya River, Ili River, Tarim River and others). They have attracted a large amount of attention for climate and cryosphere studies during the past decades; being consistent with the global warming, most mountain glaciers and glacial lakes in Tianshan Mountains are in a state of rapid change [11,12,13]. Snow cover in Tianshan Mountains, is an important predictor of regional climate change, as well as a crucial water source for its surrounding arid regions, and greatly influences the hydrological and biological processes. The snowmelt water from Tianshan Mountains is the lifeblood of agriculture and animal husbandry in its downstream arid regions [14]. Particularly, in Xinjiang, the big agricultural province of China, the rivers runoff comes from the Tianshan Mountains is 474 × 108 m3, accounting for 53.6% of the total rivers runoff in Xinjiang Province [14]. However, due to the scarcity and limitation of meteorological station, the in-situ snow cover observations are difficult to adequately quantify the spatiotemporal variability of snow cover in the mountainous regions [15,16]. There should be many uncertainties and incompleteness in those previous studies that only applied in-situ observations to monitor the long-term snow cover change in the Tianshan Mountains [17,18,19,20,21]. Therefore, an updated and exhaustive analysis of spatiotemporal variation of snow cover in the Tianshan Mountains is necessary.
Recent technological advances in satellite remote sensing have allowed remote sensing data to extract the information of snow cover in the inaccessible areas with rugged terrain and hostile climate [16]. The most recent and advanced remote sensing snow cover product is produced by the Moderate Resolution Imaging Spectroradiometer (MODIS) flown on the Earth Observing System (EOS) Terra and Aqua platforms, is launched in 1999 and 2002, respectively [22,23]. A suite of MODIS snow cover products [24], including binary snow cover map (snow or non-snow) and fractional snow cover (FSC) map at various spatial and temporal resolutions, have been widely used to depict the spatiotemporal patterns of snow cover in mountainous areas [16,25,26,27]. Evaluation studies have suggested a high accuracy of MODIS snow cover products under clear skies, when comparing with the in-situ observations and other higher resolution satellite data at both regional and global scales [15,23,26,27,28,
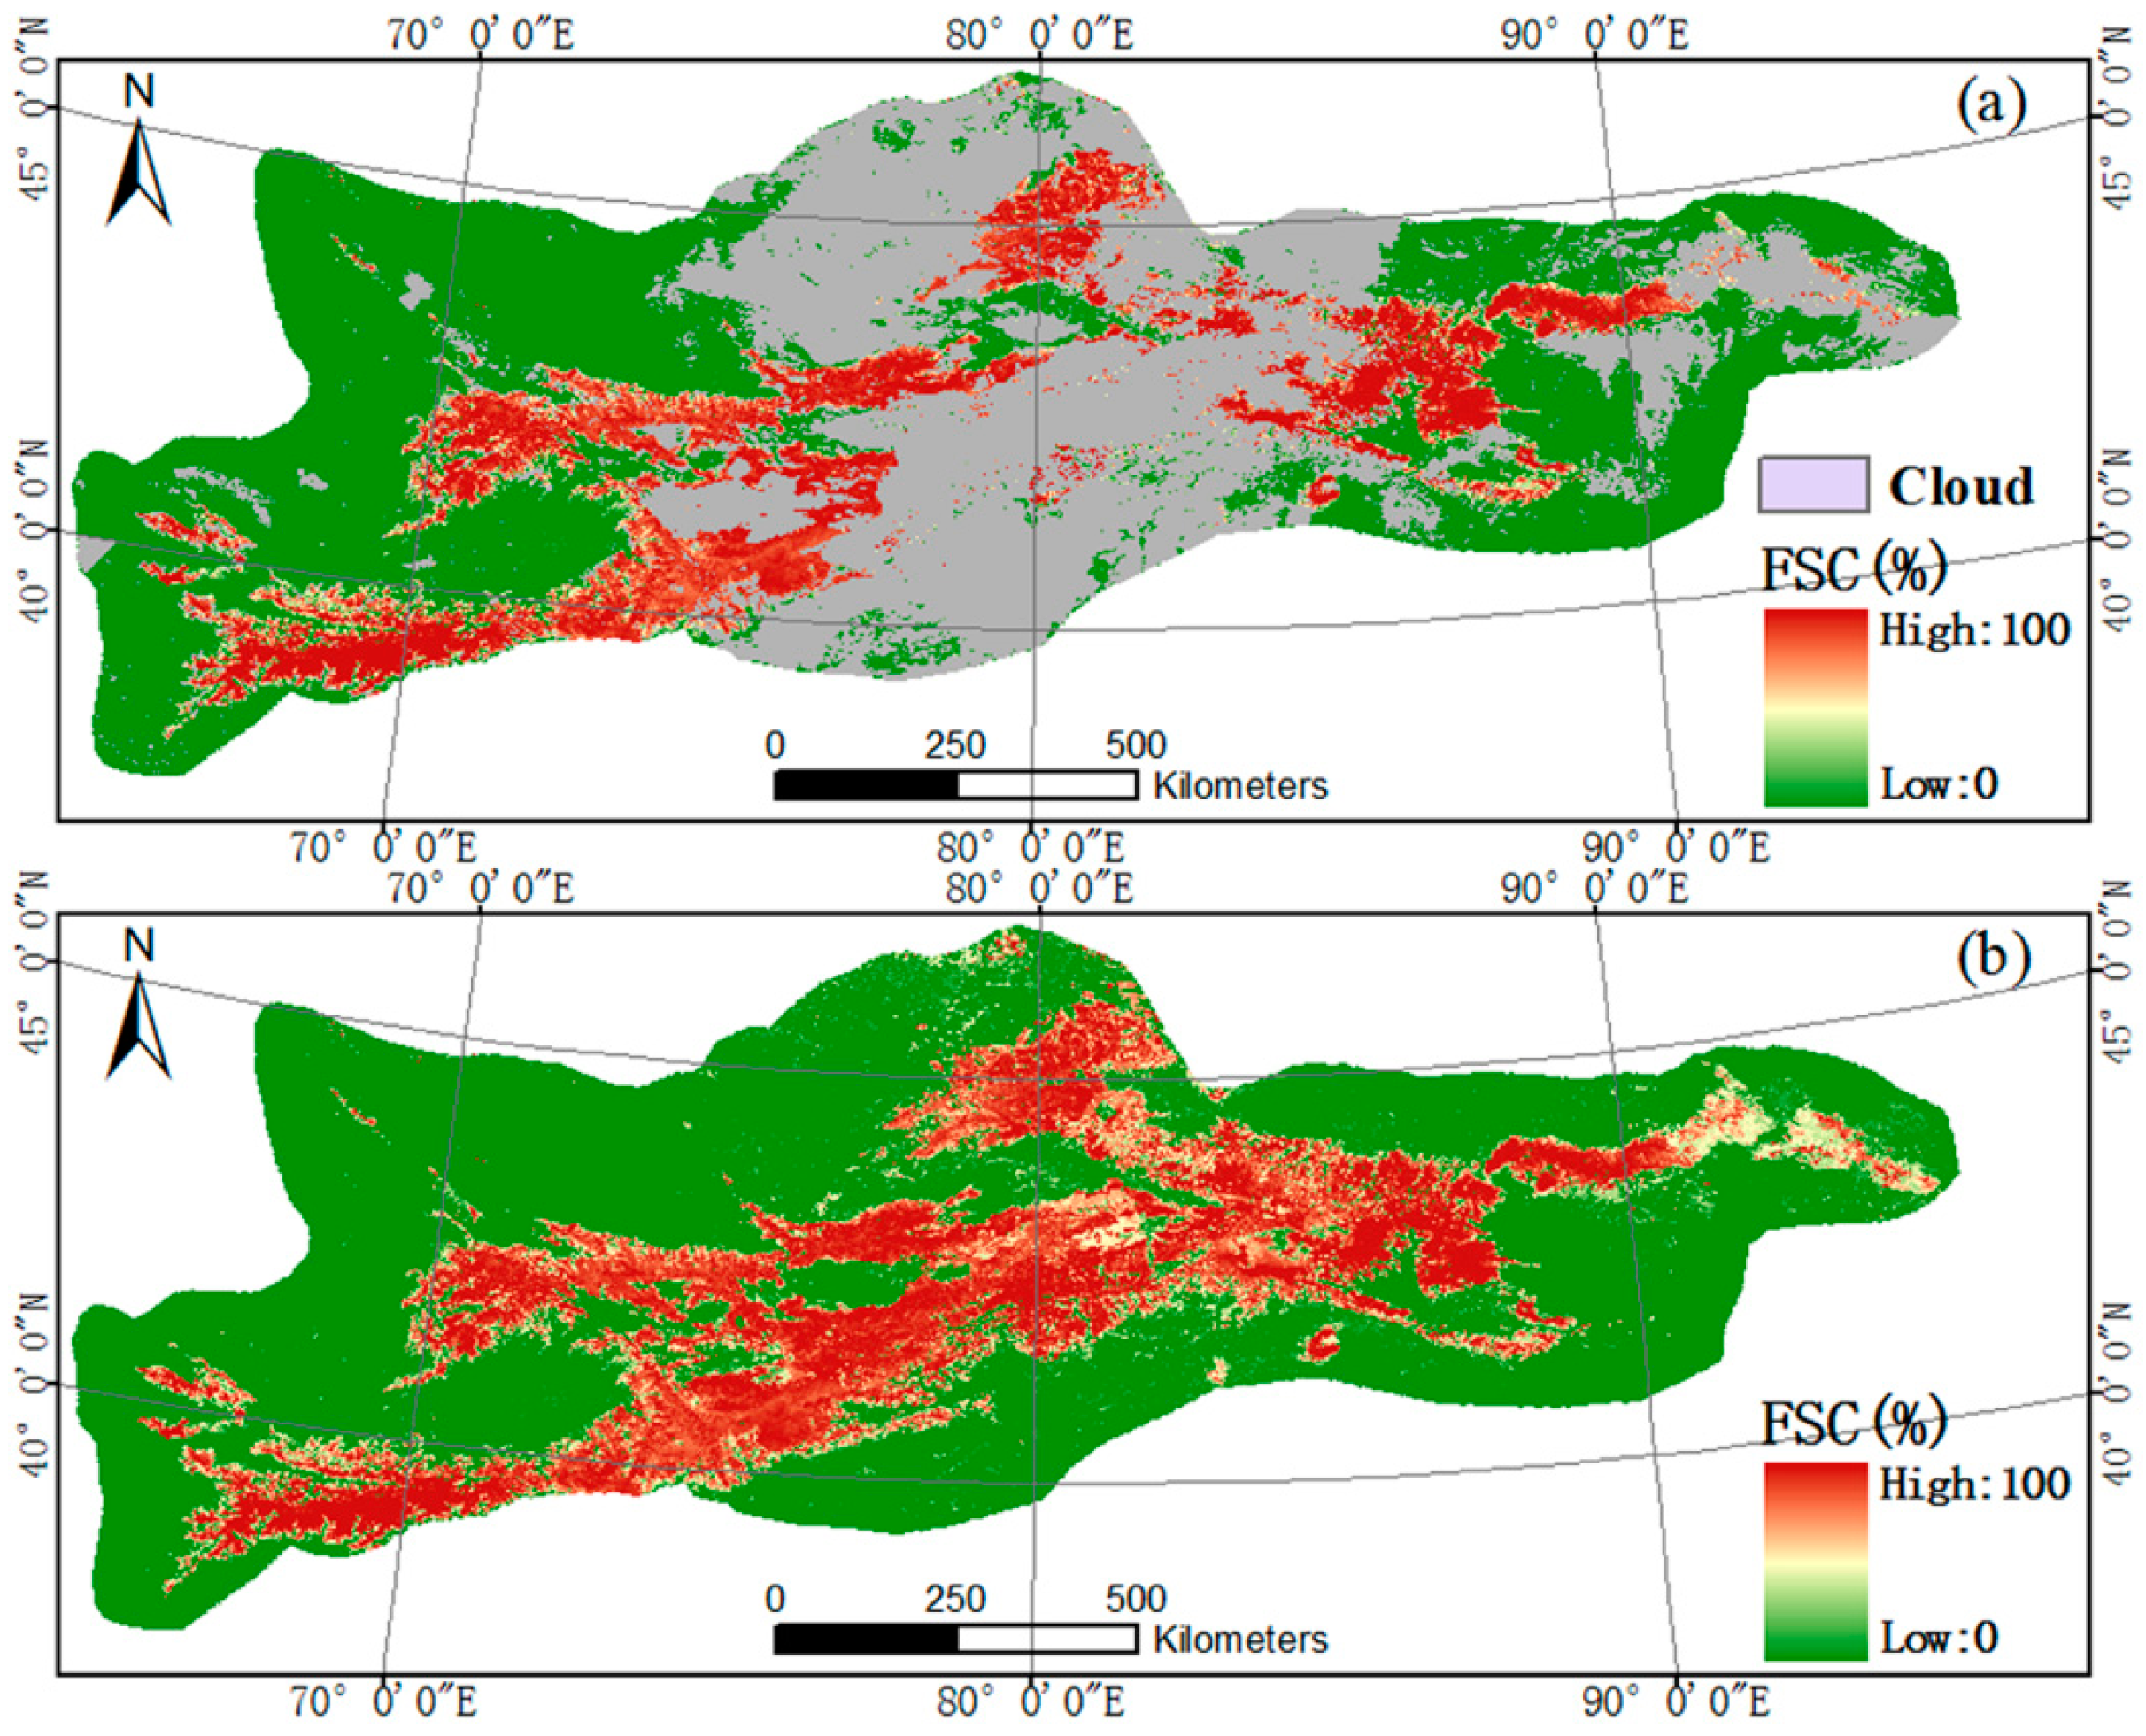
29]. However, the extensive cloud obscuration in MODIS snow cover products greatly limits their applications [22,23]. A validation study of MODIS snow cover images over Tibetan Plateau by Tang et al. [26] found that about 47.3% of the areas were cloud-covered. In recent years, A series of methods have been developed to eliminate the cloud obscuration in using the binary MODIS snow cover products, such as the daily images combination from two MODIS platforms (Terra and Aqua) [30,31], adjacent temporal deduction [32,33,34], multi-sensor combination [35,36,37] (combining MODIS and passive microwave snow products), and the snow-line method (SNOWL) [38]. These methods can effectively reduce the cloud obscuration in the daily MODIS binary snow-cover maps for the monitoring of snow cover dynamics. However, they sacrifice temporal and spatial resolution and introduce some uncertainties to different degrees [39]. Because the MODIS fractional snow cover (FSC) maps [24,40] more accurately represent the gradual changes in snow cover in each pixel than the binary snow cover maps, the use of the FSC data could be better for the removal of the cloud cover by temporal filtering. Consequently, a cubic spline interpolation cloud removal method was developed to effectively eliminate the cloud covered pixels from the MODIS FSC products and was well applied in Tibetan Plateau [26,41,42]. The advantage of the cloud removed MODIS FSC products is that the FSC changing curve (the characteristic of gradual changes) for each pixel are considered, rather than the simple substitution by multiday combination for the binary snow cover products, and all of the cloud pixels and other missing or abnormal pixels are removed with a high snow-classification accuracy, thus providing considerable application value for snow cover monitoring.
The spatiotemporal variation of the snow cover is affected substantially by both the temperature and precipitation [6,16,26,43]. As one of the most sensitive and prominent areas responding to global climate changes, the temperature of the Tianshan Mountains in Central Asia has increased more than twice the rate of global warming in the past decades (1960–1998) [44,45]. Under the context of global warming hiatus [46,47], since there was a sharp increase in 1998, the temperatures of the Tianshan Mountains have been in a state of high variability from 1998 to 2015; and this 17-year period is still the warmest in nearly half a century [44,48]. Precipitation in Tianshan Mountains remained relatively stable and with a small increase [44]. The state of high variability in temperature of the Tianshan Mountains has led to changes in mountainous hydrological processes and water resources, and increased the runoff in the Tianshan Mountains due to the accelerated glacier/snowmelt [44,49,50,51]. Therefore, it is very necessary to examine the possible linkages between the snow cover and the climatic parameters (precipitation and temperature) in the Tianshan Mountains.
In this work, we investigate the spatiotemporal variations of snow cover in the Tianshan Mountains during 2001–2015, based on the cloud removed daily MODIS FSC data, and the possible linkages between snow cover and two main climate parameters (temperature and precipitation). We also examine the snow cover variations from different subregions (Central Tianshan, Western Tianshan, Northern Tianshan and Eastern Tianshan) of the Tianshan Mountains. The specific aims are to examine the snow cover variations in the Tianshan Mountains during the state of high variability in temperature of the Tianshan Mountains since 1998 [44,48] and to address the possible cause for the snow cover changes from the perspective of climate factors.

2. Study Area

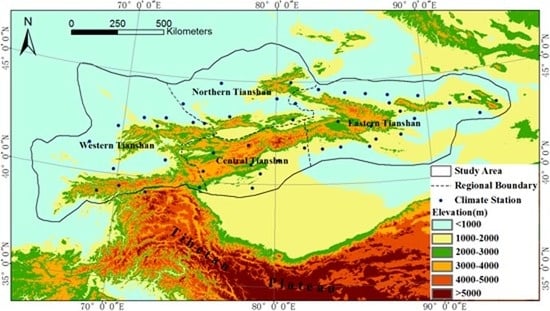
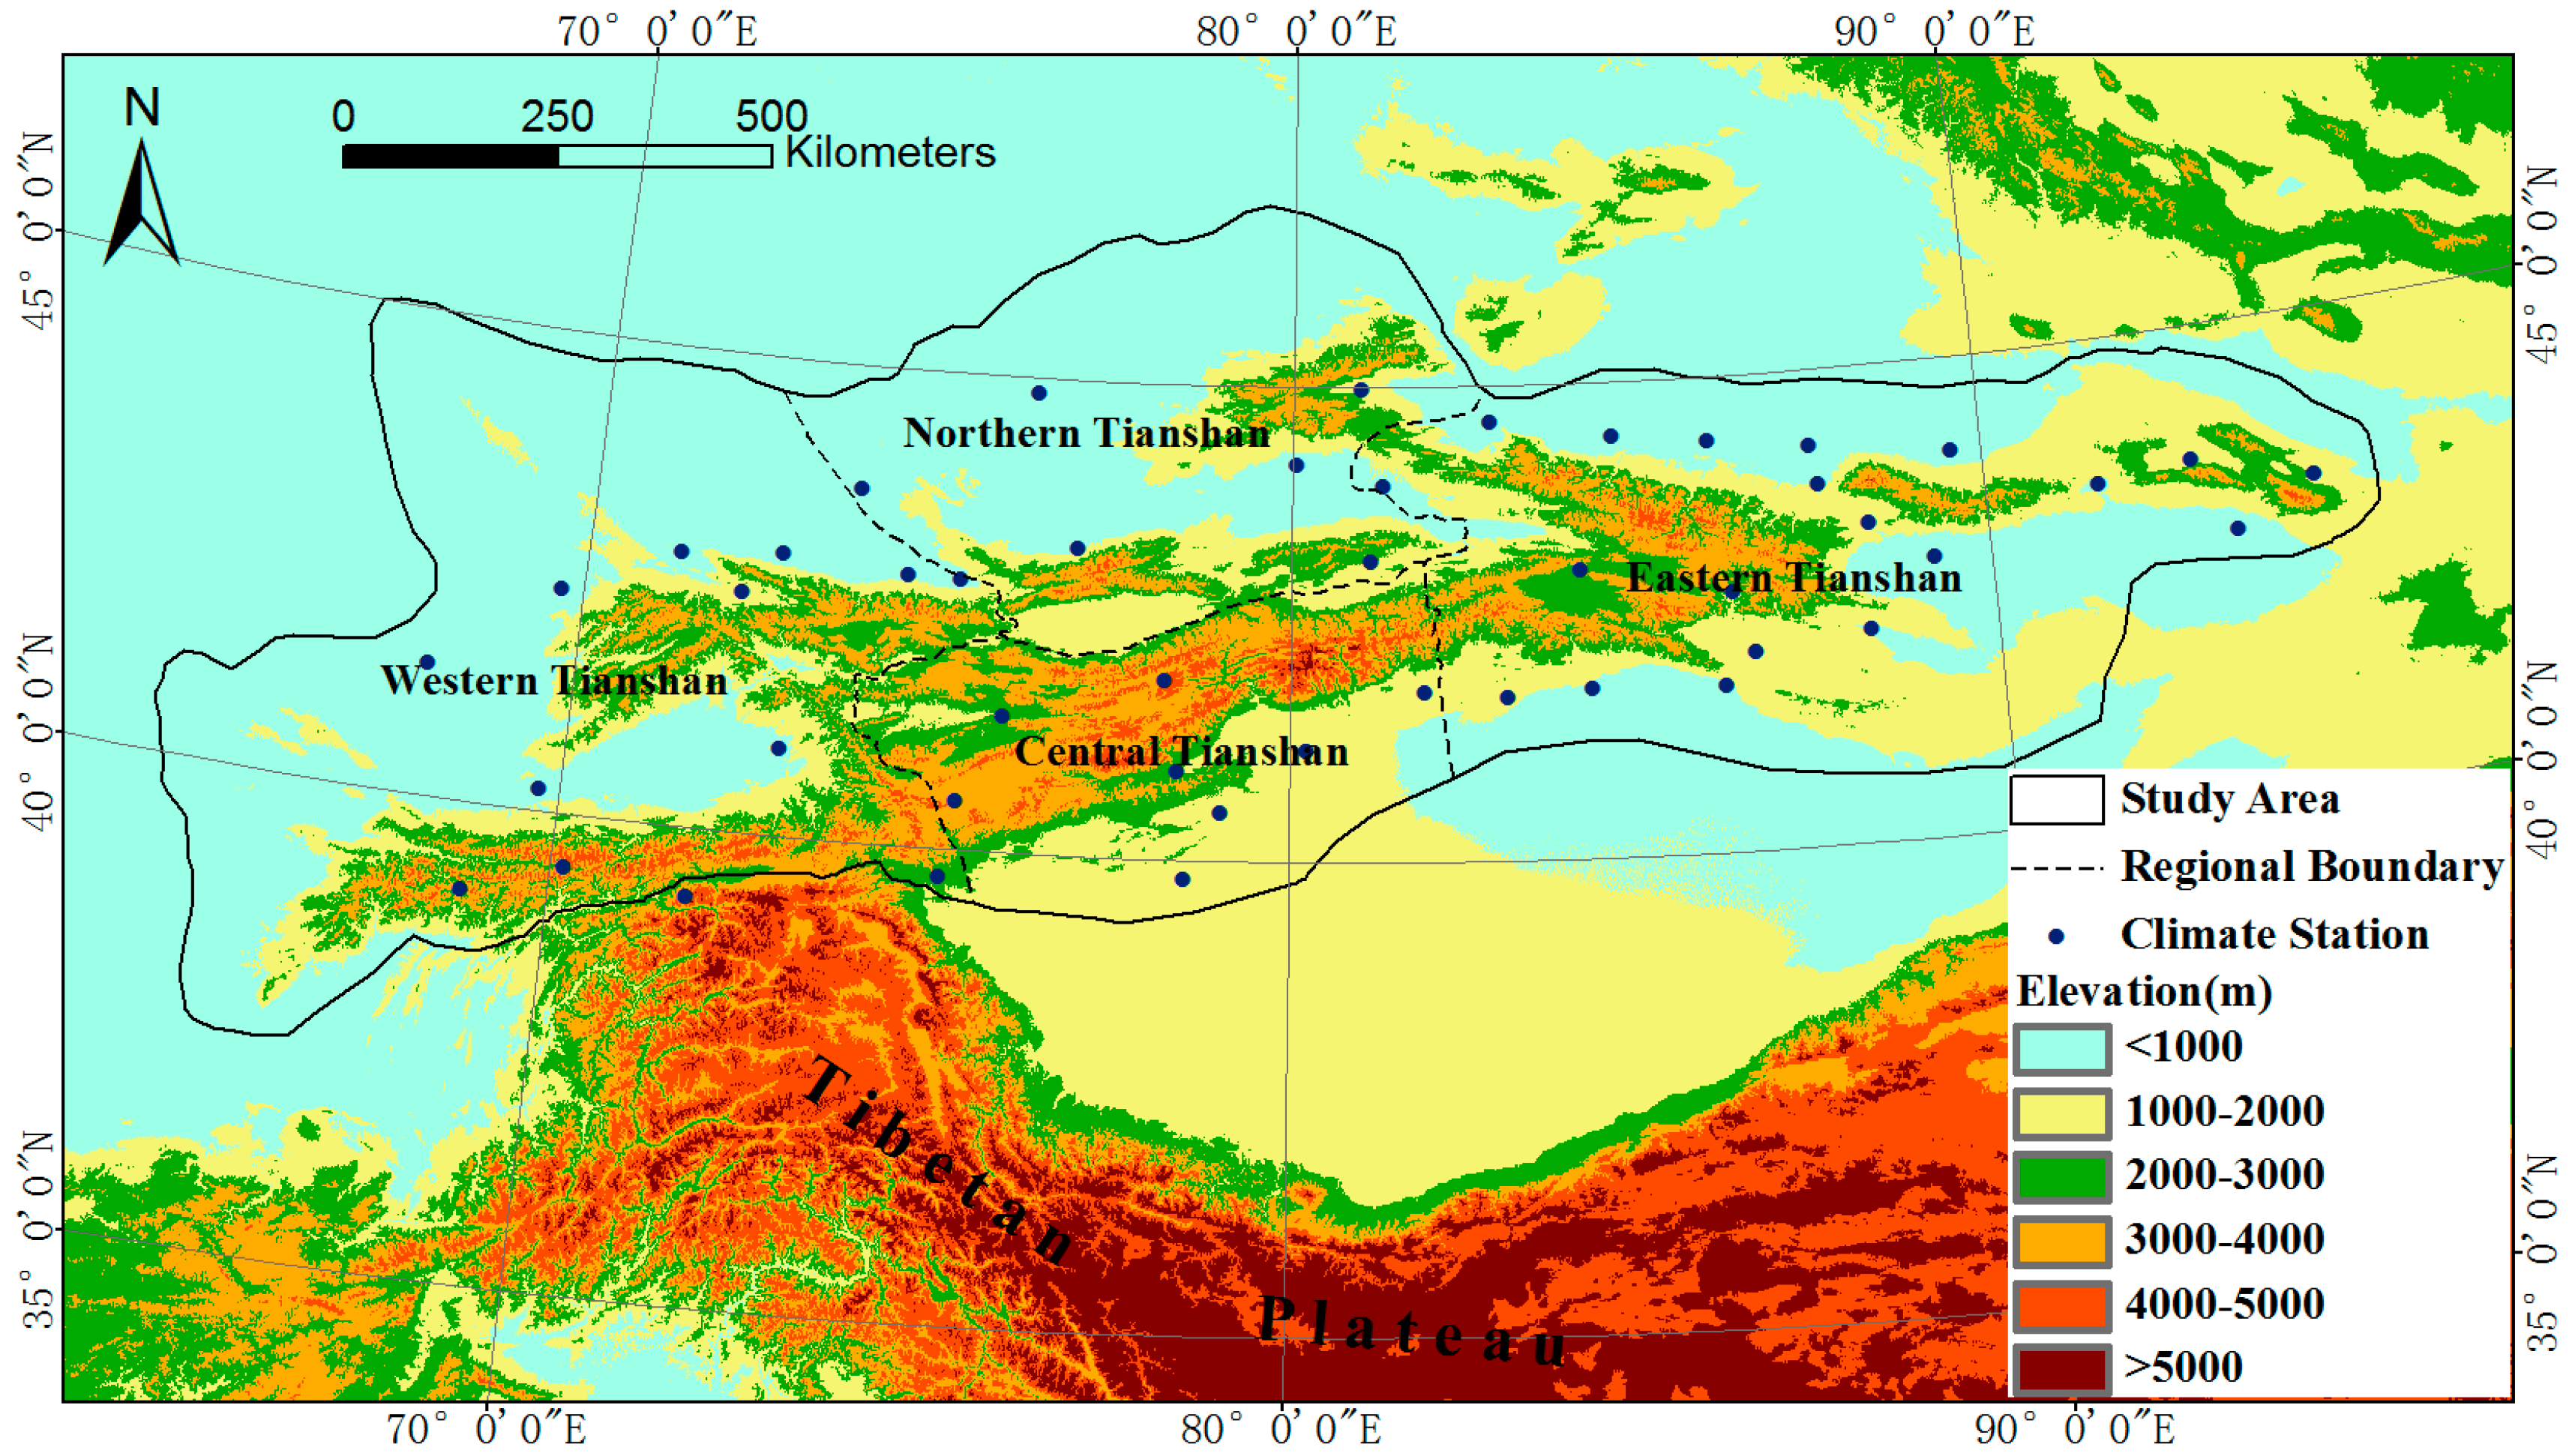
The Tianshan Mountains are largest mountain systems in Asia, stretching 2500 km across Central Asia within 67°–95°E and 38°–47°N (Figure 1). The Tianshan Mountains cover a large fraction of Central Asia, spanning regions from Uzbekistan to Kyrgyzstan and from southeastern Kazakhstan to Xinjiang of China. The major peaks in Tianshan Mountains stand about 4000 to 6000 m above sea level, with the highest peak, Thomuer, at 7439 m [20]. Tianshan Mountains are heavily glaciated and snow-covered region; there are 15,953 glaciers with a total area of 15,416 km2 [52]. The Tianshan Mountains play an important role in determining the climatic processes in northern Central Asia. It is also a region of internal drainage in Central Asia, which affects the great Aralo-Caspian, Central Asia, Balkhash, Issik Kul, and Tarim hydrographic systems [20]. Based on mountain ranges, drainage and climate features, Tianshan Mountains are subdivided into the following regions [10,13]: Central Tianshan, Western Tianshan, Northern Tianshan and Eastern Tianshan (Figure 1). The climate characteristics and cryosphere change showed obvious differences in these four subregions [10,13,20]. The total area of the study area is 135.5 × 10⁴ km2; and the areas of these subregions are accounted for 13.9% (Central Tianshan), 34.7% (Western Tianshan), 20.3% (Northern Tianshan), and 31.1% (Eastern Tianshan), respectively (
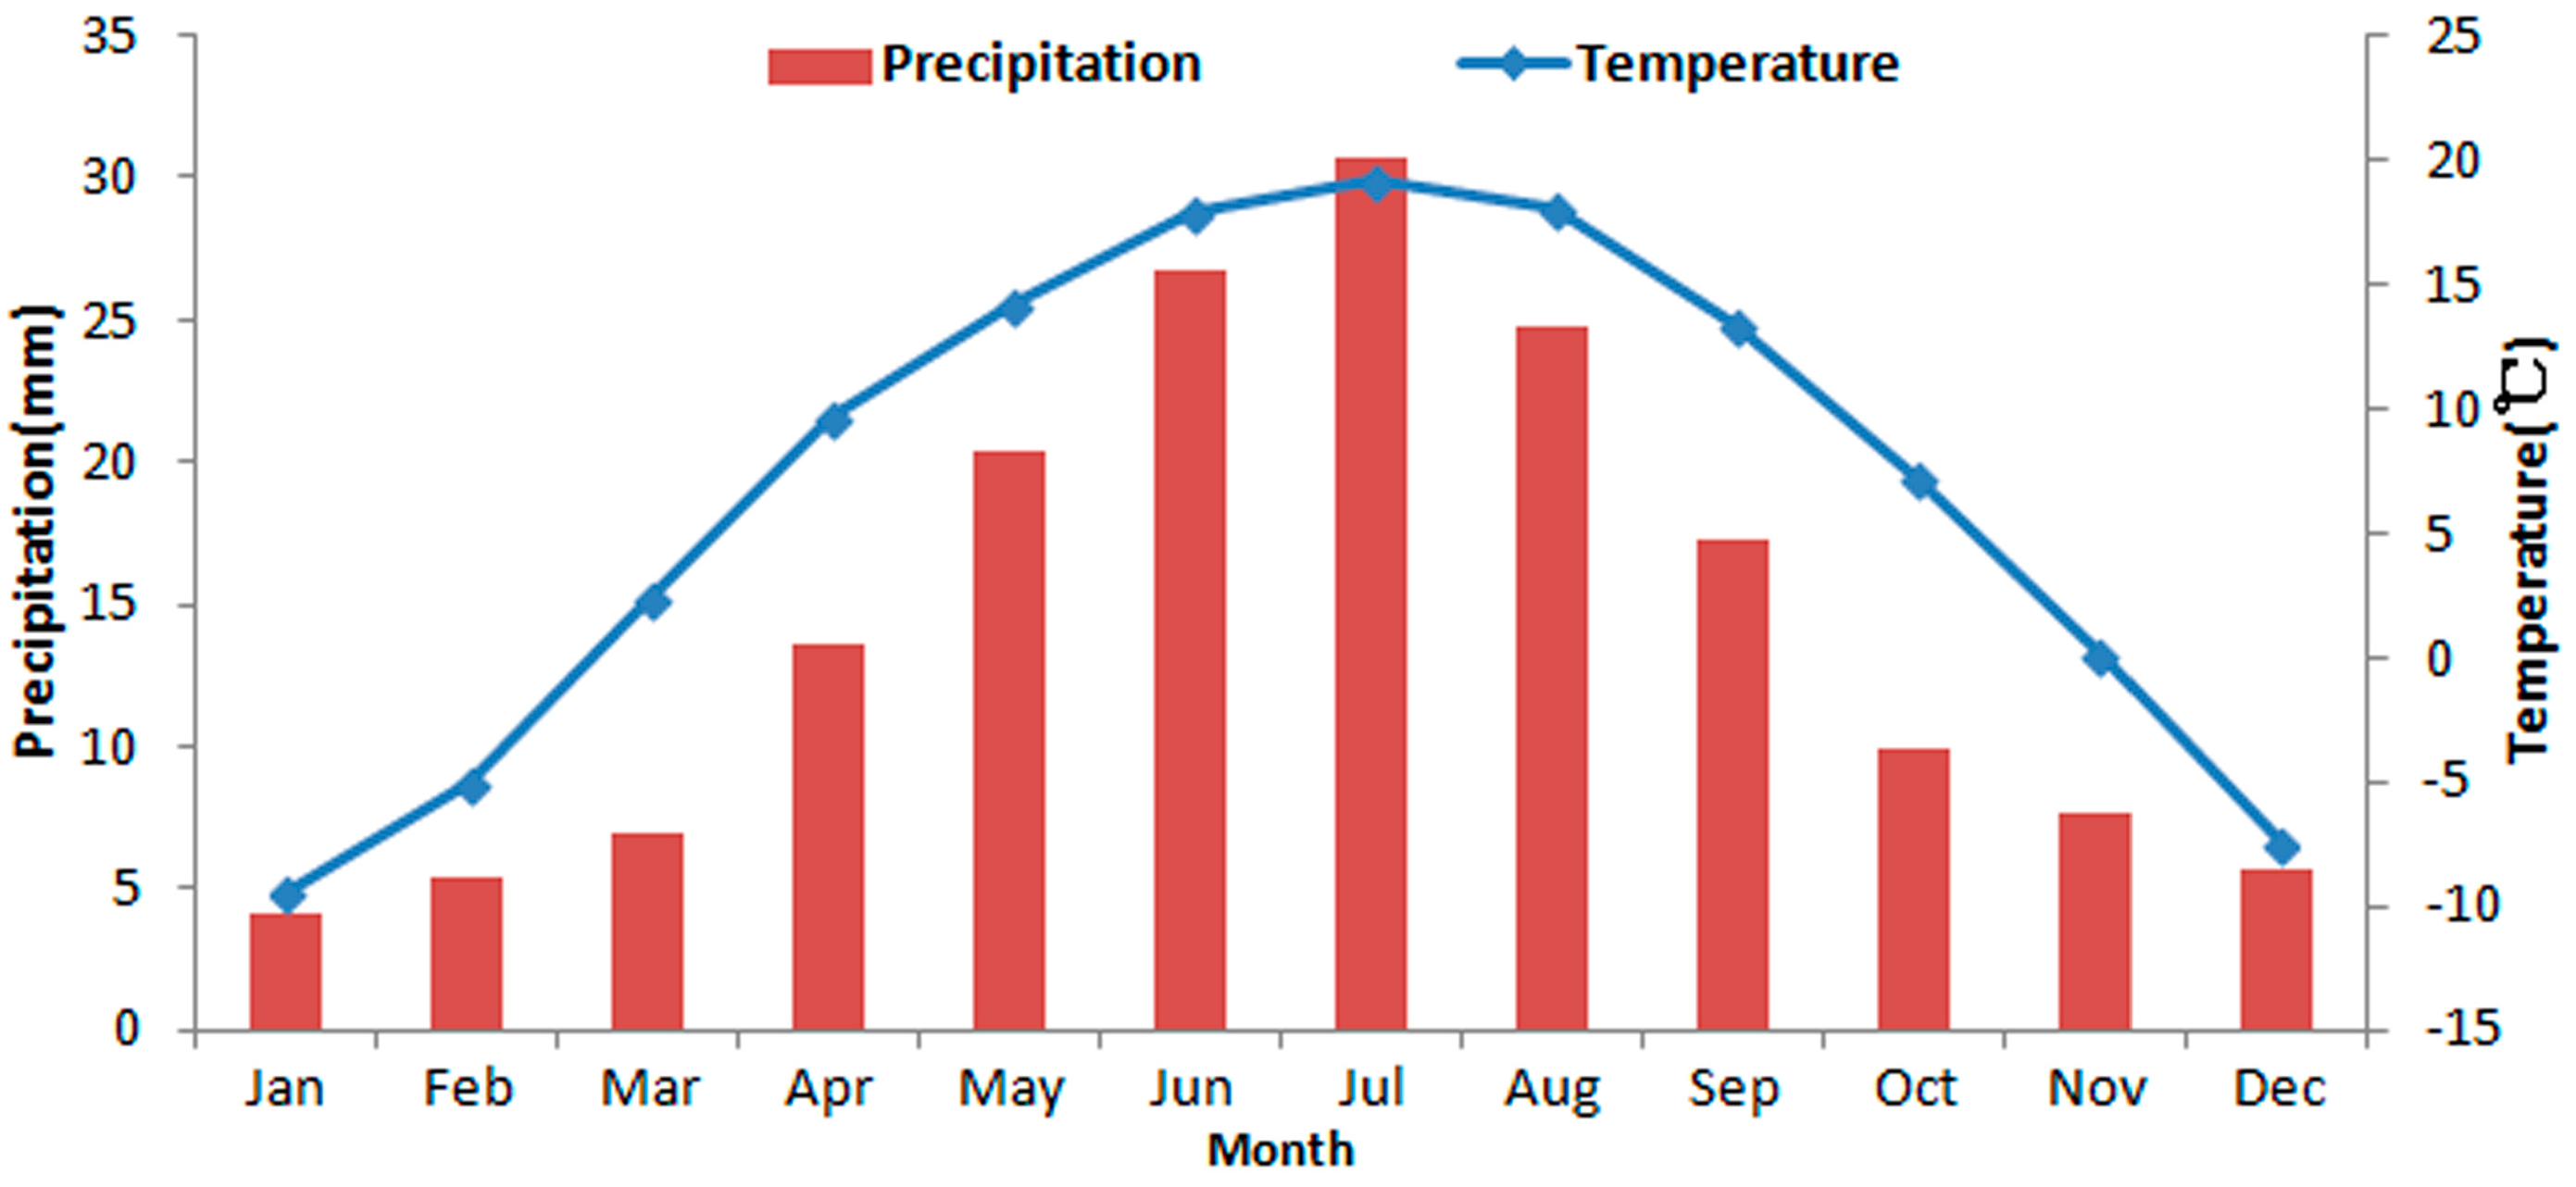
Figure 1). The monthly average of precipitation and temperature in the Tianshan Mountains are shown in Figure 2.

3. Data and Methodology

3.1. Data

3.1.1. MODIS Fractional Snow Cover (FSC) Data

In this study, the MOD10A1 data for 2001–2015 from the National Snow & Ice Data Center (NSIDC) (https://nsidc.org/) are employed to investigate snow cover variations in the Tianshan Mountains. MOD10A1 data are daily snow cover products, which include both binary snow cover and fractional snow cover (FSC) products (with a resolution of 463.3 m), gridded in sinusoidal projection [24]. The MODIS FSC mapping algorithm is developed by Salomonson and Appel [40], which is based on a statistical-linear relationship developed between the normalized-difference snow index (NDSI) from MODIS and the true subpixel fraction of snow cover as determined using Landsat scenes. Evaluation studies have proved a high accuracy (with a mean absolute error less than 0.1) of the MODIS FSC data [23,26,40]. The daily MOD10A1 FSC products, including five MODIS tiles (h22v04, h23v04, h23v05, h24v04 and h24v05), are used in this study.
Using the MODIS Reprojection Tool (MRT) [53], the MOD10A1 FSC data are mosaicked and resampled from the original 463.3 m pixel size to 500 m, and georeferenced into a UTM projection with a datum of WGS84. The final mosaicked images are converted to GeoTIFF file format.

3.1.2. Meteorological Observation Data

Daily temperature and precipitation and snow depth data from 47 meteorological stations (Figure 1) in the Tianshan Mountains for 2001–2015 are collected from China Meteorological Administration (http://data.cma.cn) and NOAA’s National Centers for Environmental Information (NCEI) (https://www.ncdc.noaa.gov/), formerly known as National Climatic Data Center. The temperature and precipitation data are used to survey the linkages between snow cover changes and climate variations during the study periods. Snow depth data are used to validate the improved daily cloud-free MODIS FSC maps produced in this study.

3.2. Methods

3.2.1. Cloud Removal from MODIS FSC Data

The extensive cloud obscuration in the mountainous area greatly limits the use of MODIS snow cover products to monitor the snow cover change [23,26,54]. Due to the daily shifting characteristics of the clouds, and the FSC changes gradually (day by days) with the snow melting, it is possible to accurately acquire the FSC value of the cloud pixel through temporal filtering using the observations in the days of clear sky. Therefore, the cloud removal method for MODIS FSC products developed by Tang et al. [26,41], which is based on the cubic spline interpolation algorithm, is used in this study to remove cloud cover. Details on the cubic spline interpolation cloud removal method and the relevant accuracy evaluation strategies can be found in the work of Tang et al. [26,41]. It was efficient in retrieving the FSC information of these cloud covered pixels over Tibetan Plateau, with the overall mean absolute error is 0.092; and there was a high consistency between MODIS-derived snow-covered days (SCD) (derived from the cloud-removed MODIS FSC products) and the in-situ observed SCD, the mean absolute error is 3.82 days [26,41].
Based on this cloud removal method, the daily cloud-free MODIS FSC datasets in Tianshan Mountains from 2001 to 2015 are produced. Figure 3 shows the comparisons of original MODIS FSC map and cloud-free MODIS FSC map in the Tianshan Mountains, using the 315th day of 2014 as an example. Two methods have been used to evaluate the accuracy of the cloud-free MODIS FSC products.
(1) The “cloud assumption” method, which was mentioned in the Section 3.3.2 and Figure 3 in Tang et al. [26]. In this validation process, the four original MODIS FSC images of the Tianshan Mountains with relatively less cloud obscuration (on 62nd, 109th, 272nd, and 307th day of 2012) are selected as the reference images (i.e., “true value” images) for validation. Our results show the overall mean absolute error for the retrieved FSC information of these cloud covered pixels in the Tianshan Mountains is 0.097, which indicates that the cubic spline interpolation cloud removal method is possible to accurately acquire the FSC value of the cloud pixels.
(2) The in-situ observed snow-covered days (SCD) validation. The MODIS-derived SCD (derived from the cloud-free MODIS FSC products) values are validated using in-situ observed SCD at the 47 climate stations in the Tianshan Mountains (Figure 1) for the 15 years (2001–2015). The in-situ observed SCD is the days in a year when the snow depth is larger or equal to 1 cm. The MODIS-derived SCD is calculated as the description in Section 3.2.2. The mean consistency (%) between MODIS-derived SCD and in-situ SCD is determined by:
C = 1 N i = 1 N ( 1 | S C D mod S C D ground | S C D ground ) × 100
where C is the mean consistency (%), and SCDmod and SCDground are MODIS-derived SCD and in-situ SCD, respectively. N is the total number of in-situ SCD observations for the 15 years.
The validation results show that the MODIS-derived SCD maps have a mean consistency of 85.79% with in-situ observed SCD, and the mean absolute error is 4.17 days. The higher consistency between MODIS-derived SCD and in-situ SCD indicates that the cloud-free MODIS FSC datasets have a high accuracy to monitor the snow cover in the Tianshan Mountains.

3.2.2. Methodology of Snow Cover Changes

For the period from 2001 to 2015, the daily cloud-free MODIS FSC datasets of the Tianshan Mountains are derived from MOD10A1 FSC products using the cubic spline interpolation cloud removal method. To investigate the spatiotemporal variations of snow cover, we obtain the snow-covered area (SCA) and snow-covered days (SCD) from daily cloud-free MODIS FSC data and examine them from the study area and the four subregions. In addition, four seasons, spring (March–May), summer (June–August), autumn (September–November), and winter (December–February), are used to differentiate the seasonal effects.
In the process of SCA analysis, only the pixels in the MODIS FSC images with the value greater than 50 (i.e., FSC greater than 50%) are considered as snow covered pixels. The SCD is the total number of days that a pixel is covered with snow in a year [31]. The SCD represents the overall snow cover conditions for a region in a year. Therefore, the maps of the spatial distribution of SCD have potential significance for local water resources, the livestock industry, agriculture, and emergency management [43]. In this study, the SCD images are calculated using all cloud-free MODIS FSC images for a given year. The calculation equation is shown as:
SCD = i = 1 N C e i l ( D i 50 )
where N is the total number of days (images) within a year and Di is the snow cover fraction (%) in a pixel (0 ≤ Di ≤ 100). Ceil (Di ≥ 50) counts the numbers of Di ≥ 50. For instance, if the pixel value on the image is 60 (i.e., 60% snow cover), the SCD adds 1. If the pixel value on the image is 10 (i.e., 10% snow cover), the SCD adds 0 and is unchanged.
Trend analysis of a time series consists of the magnitude of trend and its statistical significance. Linear regression analysis is one of the most common methods of simulating the change trend of a time series. In this study, the ordinary least squares (OLS) regression is employed to calculate the linear trends of the SCD over the 15 years. A trend is considered statistically significant if its significance levels at 5%. Specifically, the slope of the least-squares line fitting of the SCD is calculated as:
S l o p e = n × i = 1 n i × S C D i i = 1 n i i = 1 n S C D i n × i = 1 n i 2 ( i = 1 n i ) 2
where Slope is the slope of the least-squares line fitting; i is the serial number from 1 to 15 for the years from 2001 to 2015; n is the cumulative number of years; and SCDi is the value of SCD in the ith year. When Slope > 0, there is an increasing tendency; when Slope = 0, there is no increasing or decreasing tendency; when Slope < 0, there is a decreasing tendency. Their significance levels (p) of F-test are presented.
In addition, change percentage (ChP) (%) of SCD in the 15 years is calculated using the following equation:
C h P = 100 × S l o p e × ( n 1 ) / ( 1 n × i = 1 n S C D i )
In the same way, the linear trend analysis (Slope) and the change percentage (ChP) are also used to examine the interannual variations of SCA.

3.2.3. Linkages between Snow Cover and Temperature and Precipitation

Pearson correlation analysis is used to investigate the correlations between snow cover (SCA or SCD), and temperature and precipitation dynamics for the 15 years (2001–2015). Pearson correlation coefficient (r) is a measure of the linear correlation between two variables x and y, which can be calculated with Equation (5).
r x y = i = 1 n ( x i x ¯ ) ( y i y ¯ ) i = 1 n ( x i x ¯ ) 2 i = 1 n ( y i y ¯ ) 2
where rxy is the correlation coefficients between x and y; x is the SCA (or SCD), y is the temperature or precipitation; n is the number of the samples; and x ¯ and y ¯ denote the average values of the x and y, respectively. Since the correlation coefficients are determined in the period from 2001 to 2015, n equals to 15 here. The correlation is considered significant if it is at the 5% significance levels.

4. Results

4.1. Annual Cycle and Spatial Pattern of Snow Cover

Figure 4 shows the time series of the daily SCA (%) for the four subregions from 2001 to 2015, and the annual cycle of SCA (%) over the entire Tianshan Mountains and the four subregions. There are strong seasonal variations in SCA for the study area (Figure 4). At the entire Tianshan Mountains scale, the SCAs from the end of November to the middle of March are greater than 20%, with relatively large standard deviations reflecting the high interannual variability, whereas, in the June–September period, the SCAs are less than 5% and with a relatively small interannual variability (Figure 4c). The SCAs over the Tianshan Mountains show the highest in January–February (about 62.7%), and then progressively decrease as snow melting, and reach the lowest in August (about 1.2%, 16,260 km2). The annual mean SCF over the Tianshan Mountains is about 20.6% during the study period.
At subregion scales, the differences in the seasonal fluctuations of SCA exhibit distinct climatological characteristics (Figure 4b). Northern Tianshan is situated under strong influence of the Siberian anticyclonic circulation, where precipitation is mostly in the form of snowfall in the cold season; and it is also influenced by frontal cyclonic circulation and northern jet stream, which bring considerable precipitation, even in cold season [20]. As a result, there are the highest SCAs during winter in Northern Tianshan, unlike the other subregions of the Tianshan Mountains (Figure 4b). In winter, Western Tianshan is under weak influence from the Siberian anticyclonic circulation and moderate southwest cyclonic circulation, which bring in warm moist air and maximize precipitation; but the winter precipitations in Central and Eastern Tianshan are relatively rare [20]. Correspondingly, winter SCAs in Western Tianshan are relatively higher than Central and Eastern Tianshan (Figure 4b). Due to huge mountains of the Central Tianshan, the SCAs during April–October in Central Tianshan are dramatically higher than the other regions. The glaciers and perennial snow cover in July–August are mainly located in Central Tianshan (Figure 4b).
Figure 5 presents the spatial patterns of monthly mean FSC (%) over the Tianshan Mountains during 2001–2015. The distribution of snow cover exhibits a large spatiotemporal heterogeneity over the Tianshan Mountains. In Figure 4 and Figure 5, seasonal dynamic rule of snow cover can conclude as three stages: (1) snow accumulation period from September to January, in which the SCA continue to expand from high altitude mountains to valleys and plains; (2) snowmelt period from February to June, in which the SCA gradually decrease from plains to high mountains; and (3) perennial snow cover appearing stage (July–August), in which the perennial snow cover almost exclusively distributes on the top of high mountains in the study area.

4.2. Spatiotemporal Variations of Snow Cover during 2001–2015

4.2.1. Interannual Variations of Snow Cover Area

Figure 6 illustrates the interannual variation of seasonal mean SCA (%) for different subregions and whole Tianshan Mountains during 2001 to 2015. The corresponding linear trends (Slope, %/year) and change percentage (ChP, %) are presented in Table 1. The time series fluctuations in seasonal mean SCA over the Tianshan Mountains show very high interannual variability (Figure 6). The mean SCA in summer over the Tianshan Mountains displays a decreasing trend (−0.016%/year, and ChP of 12.17%), indicating the mean SCA in summer during 2001–2015 decreased by 12.17%; and the decreases occur at the all subregions, especially for the significant decrease in Northern Tianshan (Slope of −0.018%/year, and ChP of −30.49%). A slight decreasing trend of the mean SCA in winter is also found from the entire Tianshan Mountains (Slope of −0.114%/year, and ChP of 2.93%) during 2001–2015, while the decreases mostly occur in Eastern and Central Tianshan, 14.78% and 12.16%, respectively. Generally, the mean SCA in autumn shows increasing trends in all the subregions (with the ChP of 23.76–24.70%), except for a slight decreasing trend in Central Tianshan. The mean SCA in spring over the Tianshan Mountains displays a slight increasing trend, mostly occurring in Northern and Western Tianshan (Figure 6 and Table 1).

4.2.2. Interannual Variations of Snow Covered Days

The spatial distributions of SCD from 2001 to 2015 over the Tianshan Mountains are shown in Figure 7. Table 2 presents the area ratio for different SCD categories during 2001–2015. The spatial distribution and pattern of SCD from year to year over the Tianshan Mountains seem very similar and relatively stable. The areas with SCD greater than 60 account for about half (50.44%) of the Tianshan Mountains, which are mainly distributed in high elevation mountains and northern areas of the Tianshan Mountains. Those areas with SCD greater than 60 are usually considered as regions with stable snow cover [26], are the major source of snowmelt water, and are where numerous large rivers originate. Considering the DEM in Figure 1, the areas with SCD greater than 120 (occupied the area of 20.2%) are consistent with the elevation zone of 3000 m and higher. Corresponding well with the major huge mountains, they are essential water source areas for the Tianshan Mountains. There is a slight decreasing trend for the areas with SCD greater than 240, which can be regarded as an approximate change trend for cryosphere (permanent snow cover, glaciers and glacier lakes) of the Tianshan Mountains. The areas of other SCD categories show relatively high fluctuations in the 15 years, although there is no significant tendency (Table 2).
Figure 8 illustrates the trend (Slope) of SCD (including its significance level) and the change percentage (ChP) at the pixel scale for the 15 years. A large number of pixels (39.35%) are characterized by very small change trends in SCD (i.e., −0.5 < Slope < 0.5 days/year), and are mainly distributed in the low altitude areas with small SCD value. In total, 26.39% of pixels are characterized by the decrease in SCD (Slope < −0.5 days/year) during 2001 to 2015. Although only 5.09% of pixels with the trend of decrease are statistically significant (p < 0.05), large decreases that with the Slope of less than −1.5 days/year (9.2%) are mostly located in Northern Tianshan and the east of Eastern Tianshan. In contrast, 34.26% of pixels are characterized by the increase in SCD (Slope > 0.5 days/year), with only 2.81% of these statistically significant (p < 0.05). The increases with the Slope greater than 1.5 days/year account for 8.1%. Most of the pixels (60.6%) are with relative small change percentages (−20% < ChP < 20%) in SCD during the 15 years. Overall, 7.9% of the pixels are with the SCD decreased by >40% (ChP < −40%), and 3.7% increased by >40% (ChP > 40%). These pixels with large change percentage of SCD are mainly distributed in the low altitude areas, in which the yearly mean SCD are very small.
Figure 9 and Table 3 further present the linear trends of SCD for different subregions and whole Tianshan Mountains during 2001–2015. Decreasing trends of SCD are found in Central and Eastern Tianshan during the 15 years, with Slope of −0.78 and −0.35 days/year, and decreased by 11.88% and 8.03%, respectively. In Northern and Western Tianshan, the SCD present slight increasing trends, increasing by about 9.36% and 7.47%, respectively. However, the SCD for the whole Tianshan Mountains shows almost no increase or decrease from 2001 to 2015, although it presents a high fluctuation. These results are roughly compatible with the changes of seasonal snow cover (in Table 1).

4.3. Correlations between Snow Cover, Temperature and Precipitation

To explore the possible mechanisms for snow cover changes over the Tianshan Mountains, we examined the linkages between the snow cover (including SCD and SCA) and two important climate parameters (temperature and precipitation) variations by the correlation analysis. Table 4 presents the Pearson correlation coefficients between the SCD, temperature, and precipitation at annual scale for the period of 2001–2015. Table 5 and Table 6 show the Pearson correlation coefficients between the monthly SCA and temperature and precipitation, respectively, from 2001 to 2015. The SCD shows a significant negative correlation with the annual mean temperature (r = −0.702), and a very slight positive correlation with the precipitation (r = 0.091) over the entire Tianshan Mountains; and analogous correlations are found in the subregions (Table 4). These results suggest that temperature was the dominant climatic factor affecting the interannual variations of SCD in the study area, and the high fluctuation of SCD over the Tianshan Mountains (Figure 9) is mostly due to the variability of temperature.
At monthly scales, although there are big differences of the correlation coefficients between SCA and the two climate parameters (varying among different months and subregions), the SCA is mostly negatively correlated with the temperature and positively correlated with the precipitation (Table 5 and Table 6). This means the approximate rule is that a decrease (increase) in the SCA is associated with a decrease (increase) in precipitation or warming (cooling) in climate. In general, the correlation coefficients between SCA and temperature are higher than that of SCA and precipitation (except for autumn months), suggesting that the interannual variations of snow cover over the Tianshan Mountains are mainly caused by temperature. This is in consistent with the significant negative correlation between SCD and temperature at annual scale (Table 4). Specifically, the effects of temperature on SCA over the Tianshan Mountains are highlighted with significant negative correlations in the snowmelt period of February–June (Table 5); it also means that large interannual changes of temperature in February–June will lead to considerable variations of the SCA, advancing or postponing the snowmelt and spring peak runoff. The effects of temperature on snow cover in August is mainly manifested by the rises or falls of snow line rather than the SCA, which contributes to the low correlation coefficients between temperature and SCA in the August. The positive correlation between SCA and precipitation over the Tianshan Mountains is mainly presented in the snow accumulation season (especially in autumn) with the high correlation coefficients.

5. Discussion

In this study, the MODIS FSC products (MOD10A1) are used to investigate the spatiotemporal changes of snow cover over the Tianshan Mountains. Using the developed cloud removal method for MODIS FSC products, the daily cloud-free MODIS FSC datasets in Tianshan Mountains from 2001 to 2015 are produced accurately, allowing efficient and accurate mapping of the SCA and SCD.
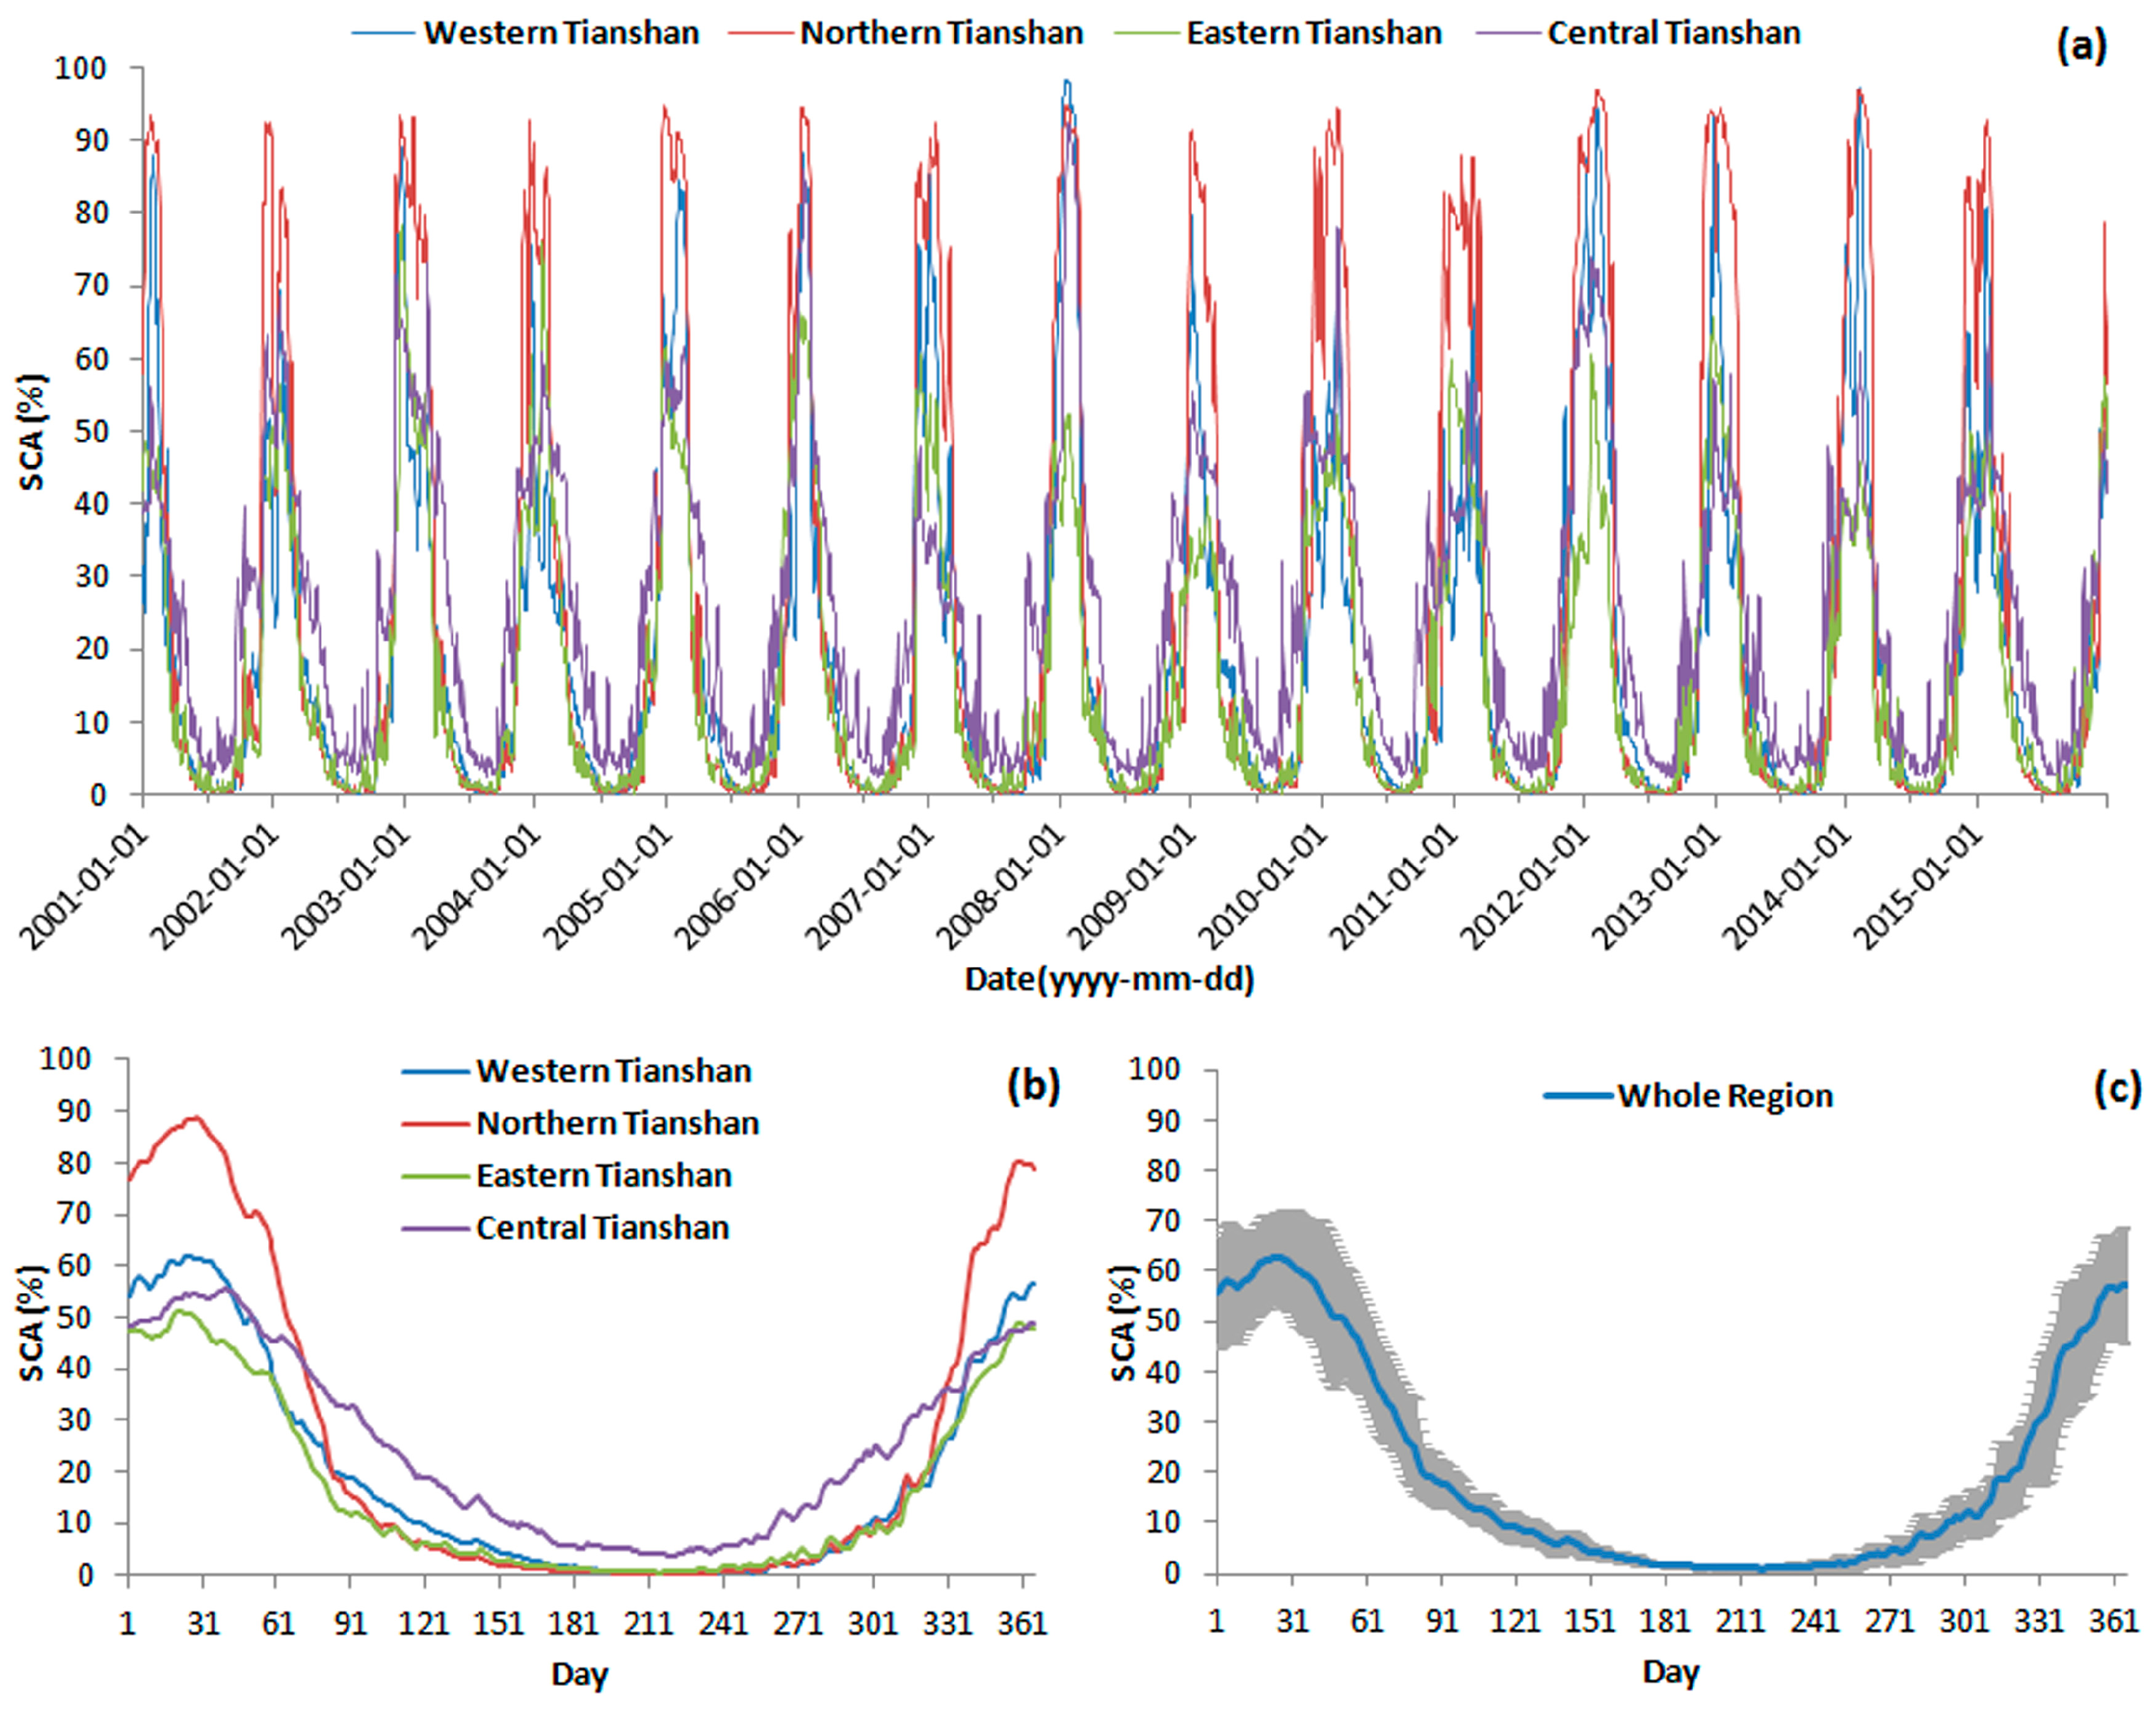
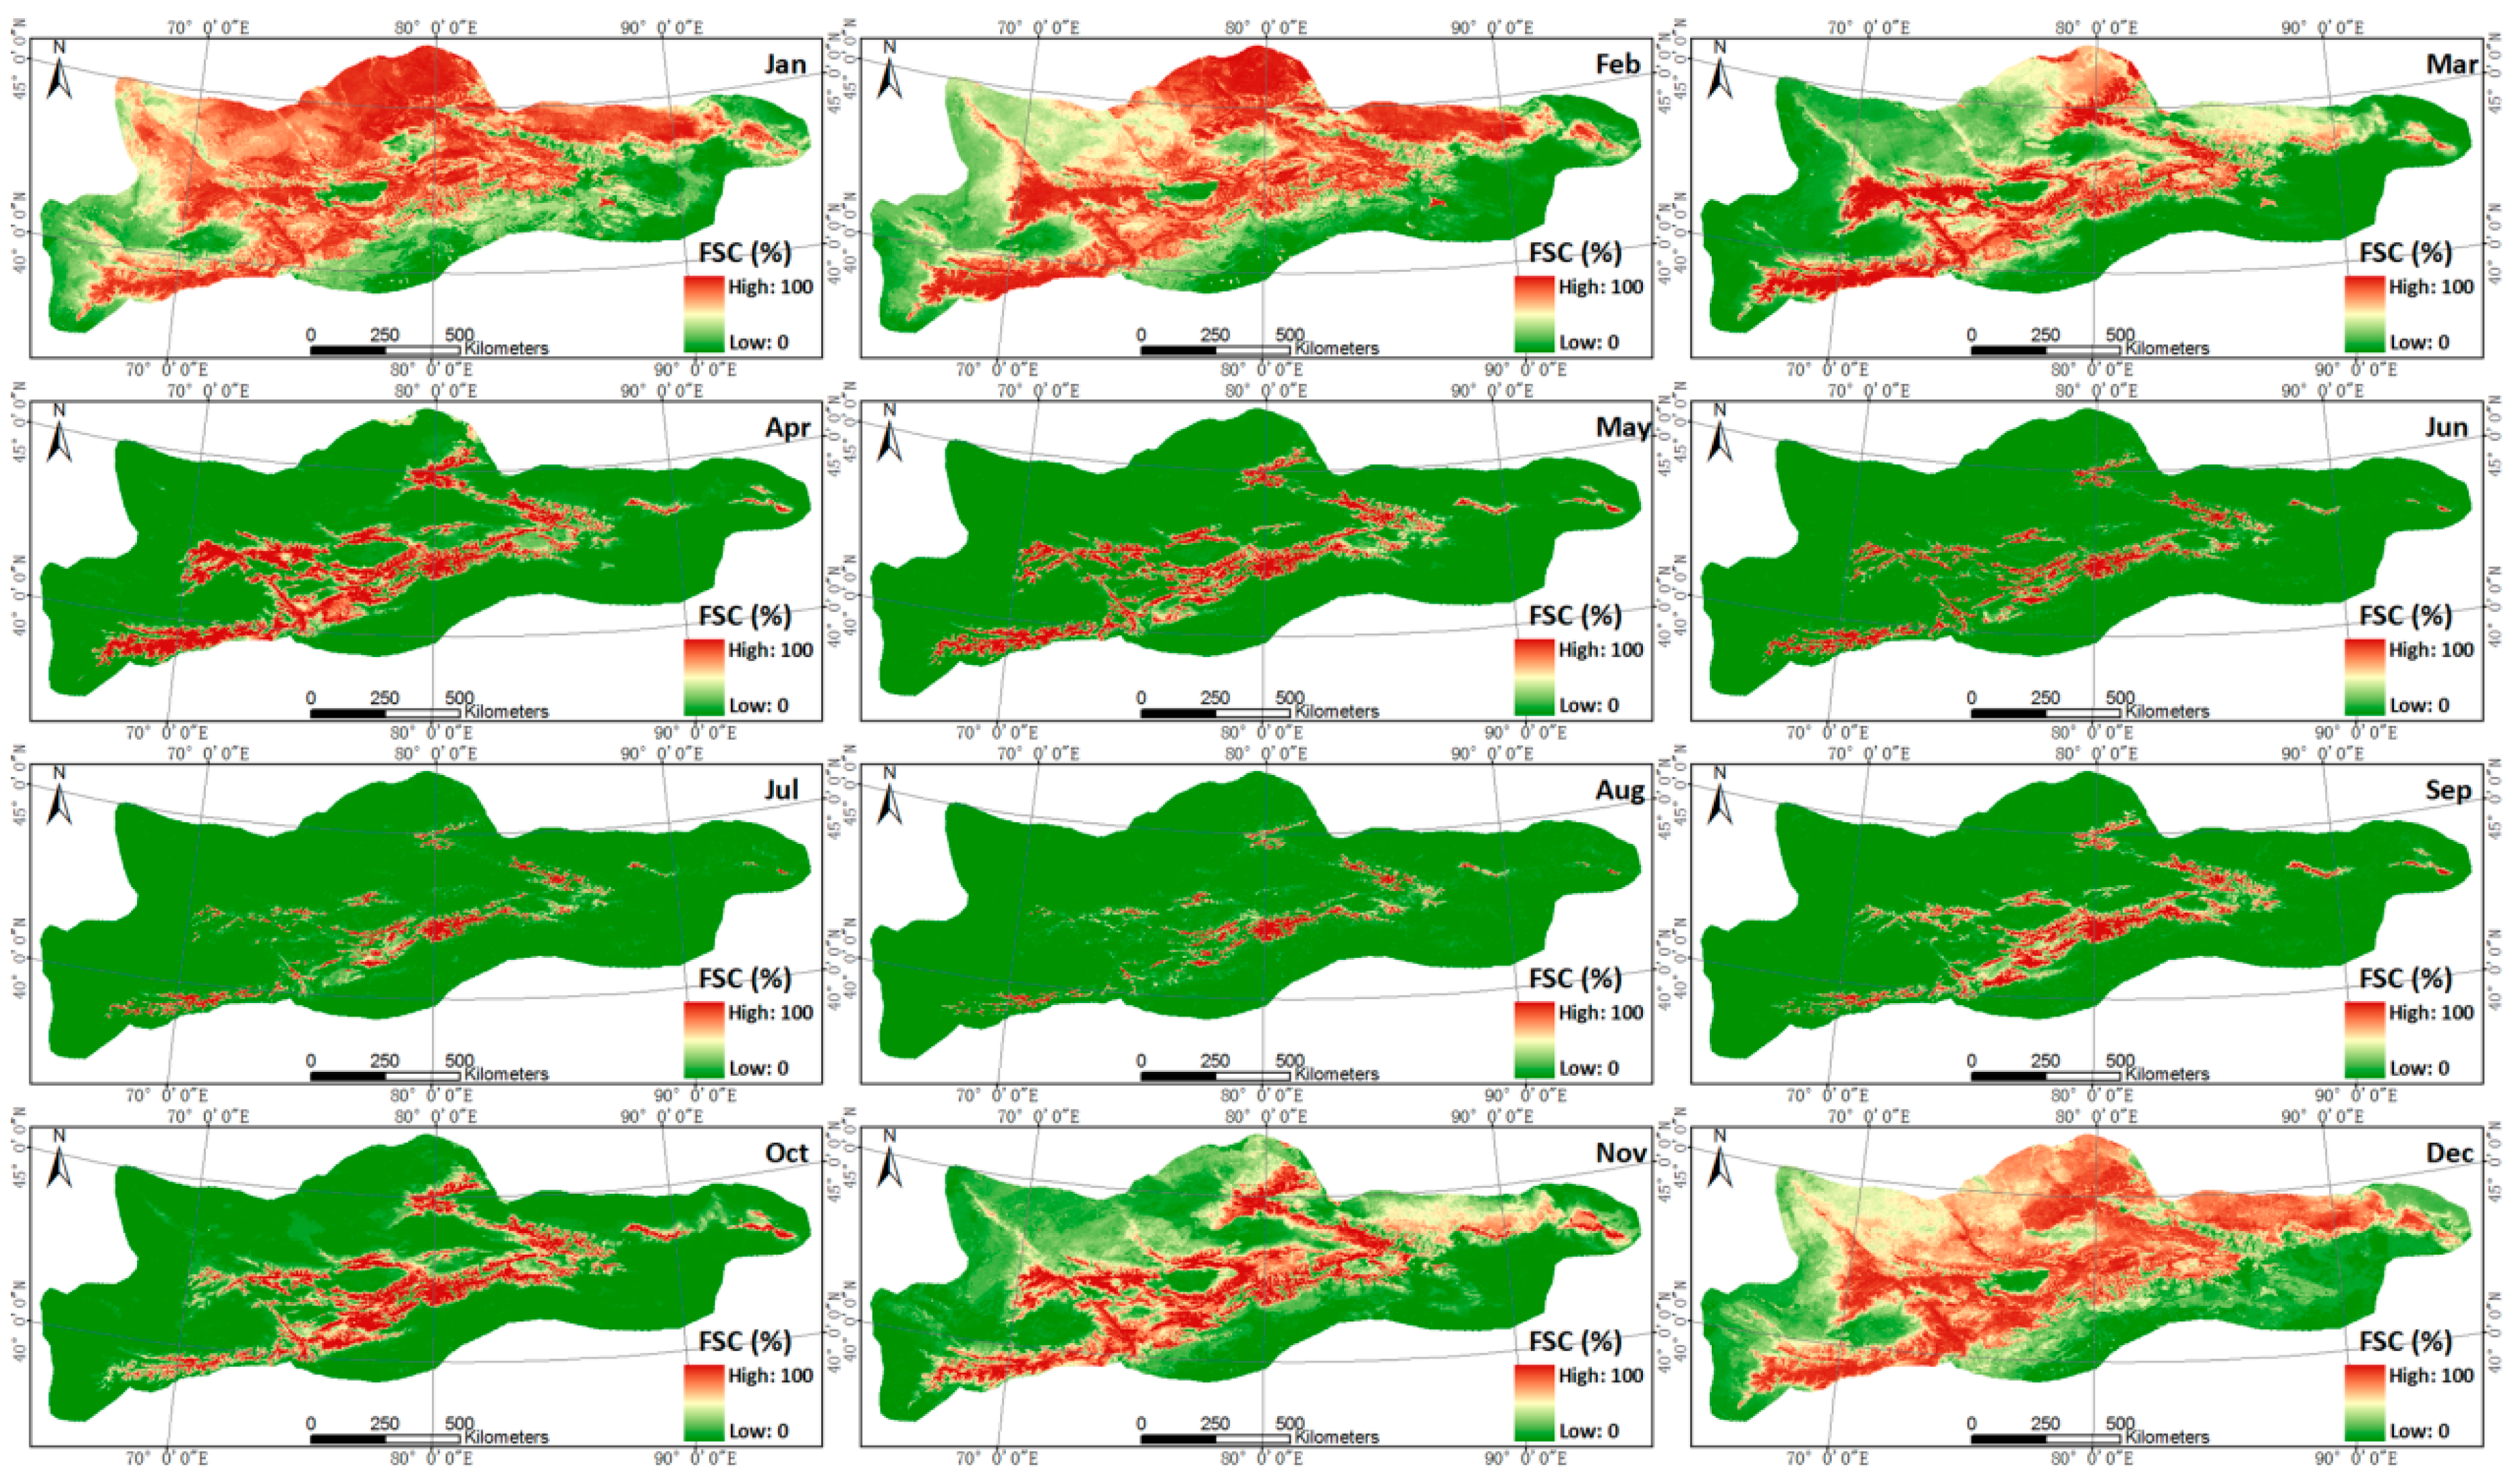
Several studies [15,16,26] have shown that there are two maxima appearing in spring and autumn and a relative minimum during winter months for the annual cycle of SCA over the Tibetan Plateau (which is adjacent to the Tianshan Mountains). In this work, we find that only one maximum (62.7%) and minimum (1.2%) of SCA occur in January–February and August (1.2%), respectively. This reflects a clear regional difference and seasonal variance in climate between the Tianshan Mountains and Tibetan Plateau. The lowest SCA values in August over the Tianshan Mountains are compatible with the glaciers area of 15,416 km2 [
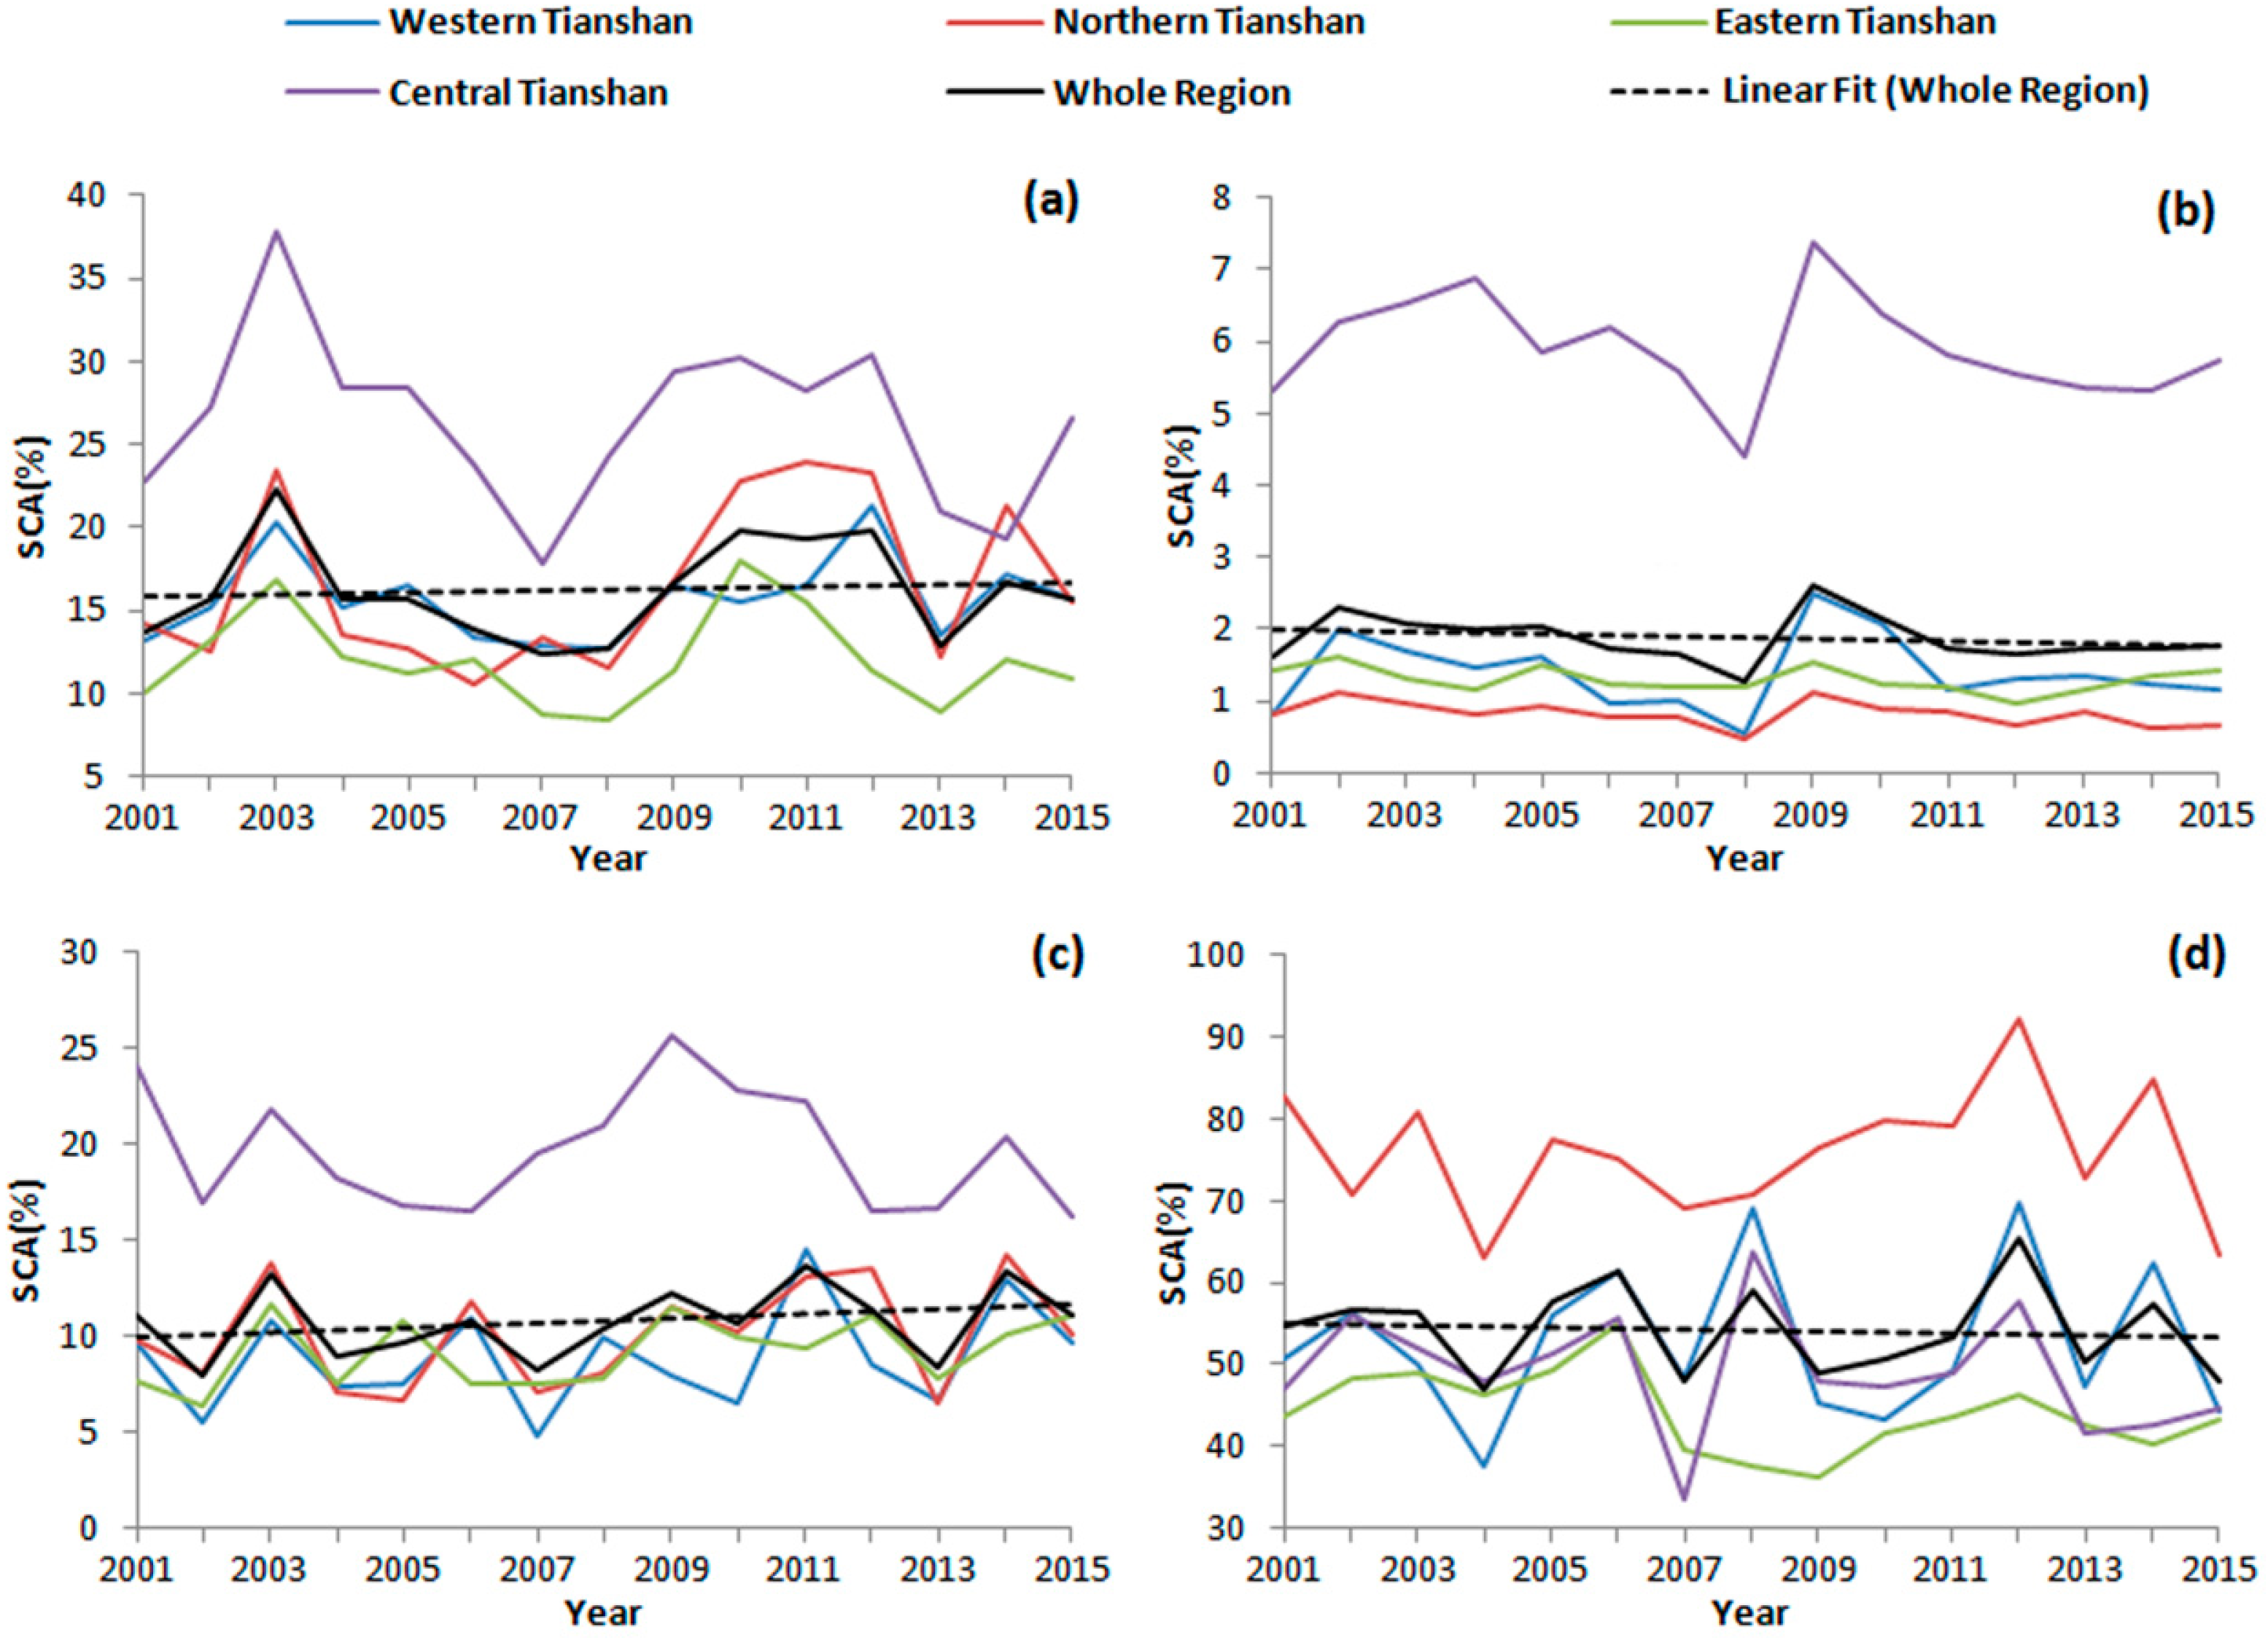
52], representing the glaciers and permanent snow cover. The differences of seasonal fluctuations in SCA for different subregions exhibit distinct climatological characteristics in Tianshan Mountains (Figure 4), especially the relative higher SCA of winter months in Northern and Western Tianshan are basically congruent with the regional difference of winter precipitation [20].
Under the context of global warming, and the state of high variability in temperature of the Tianshan Mountains since 1998 [44,48], the cryosphere of the Tianshan Mountains has been changing rapidly [10,11,12,13]. A number of studies have investigated snow cover change in Tianshan Mountains of china, using meteorological stations data [17,18,19,
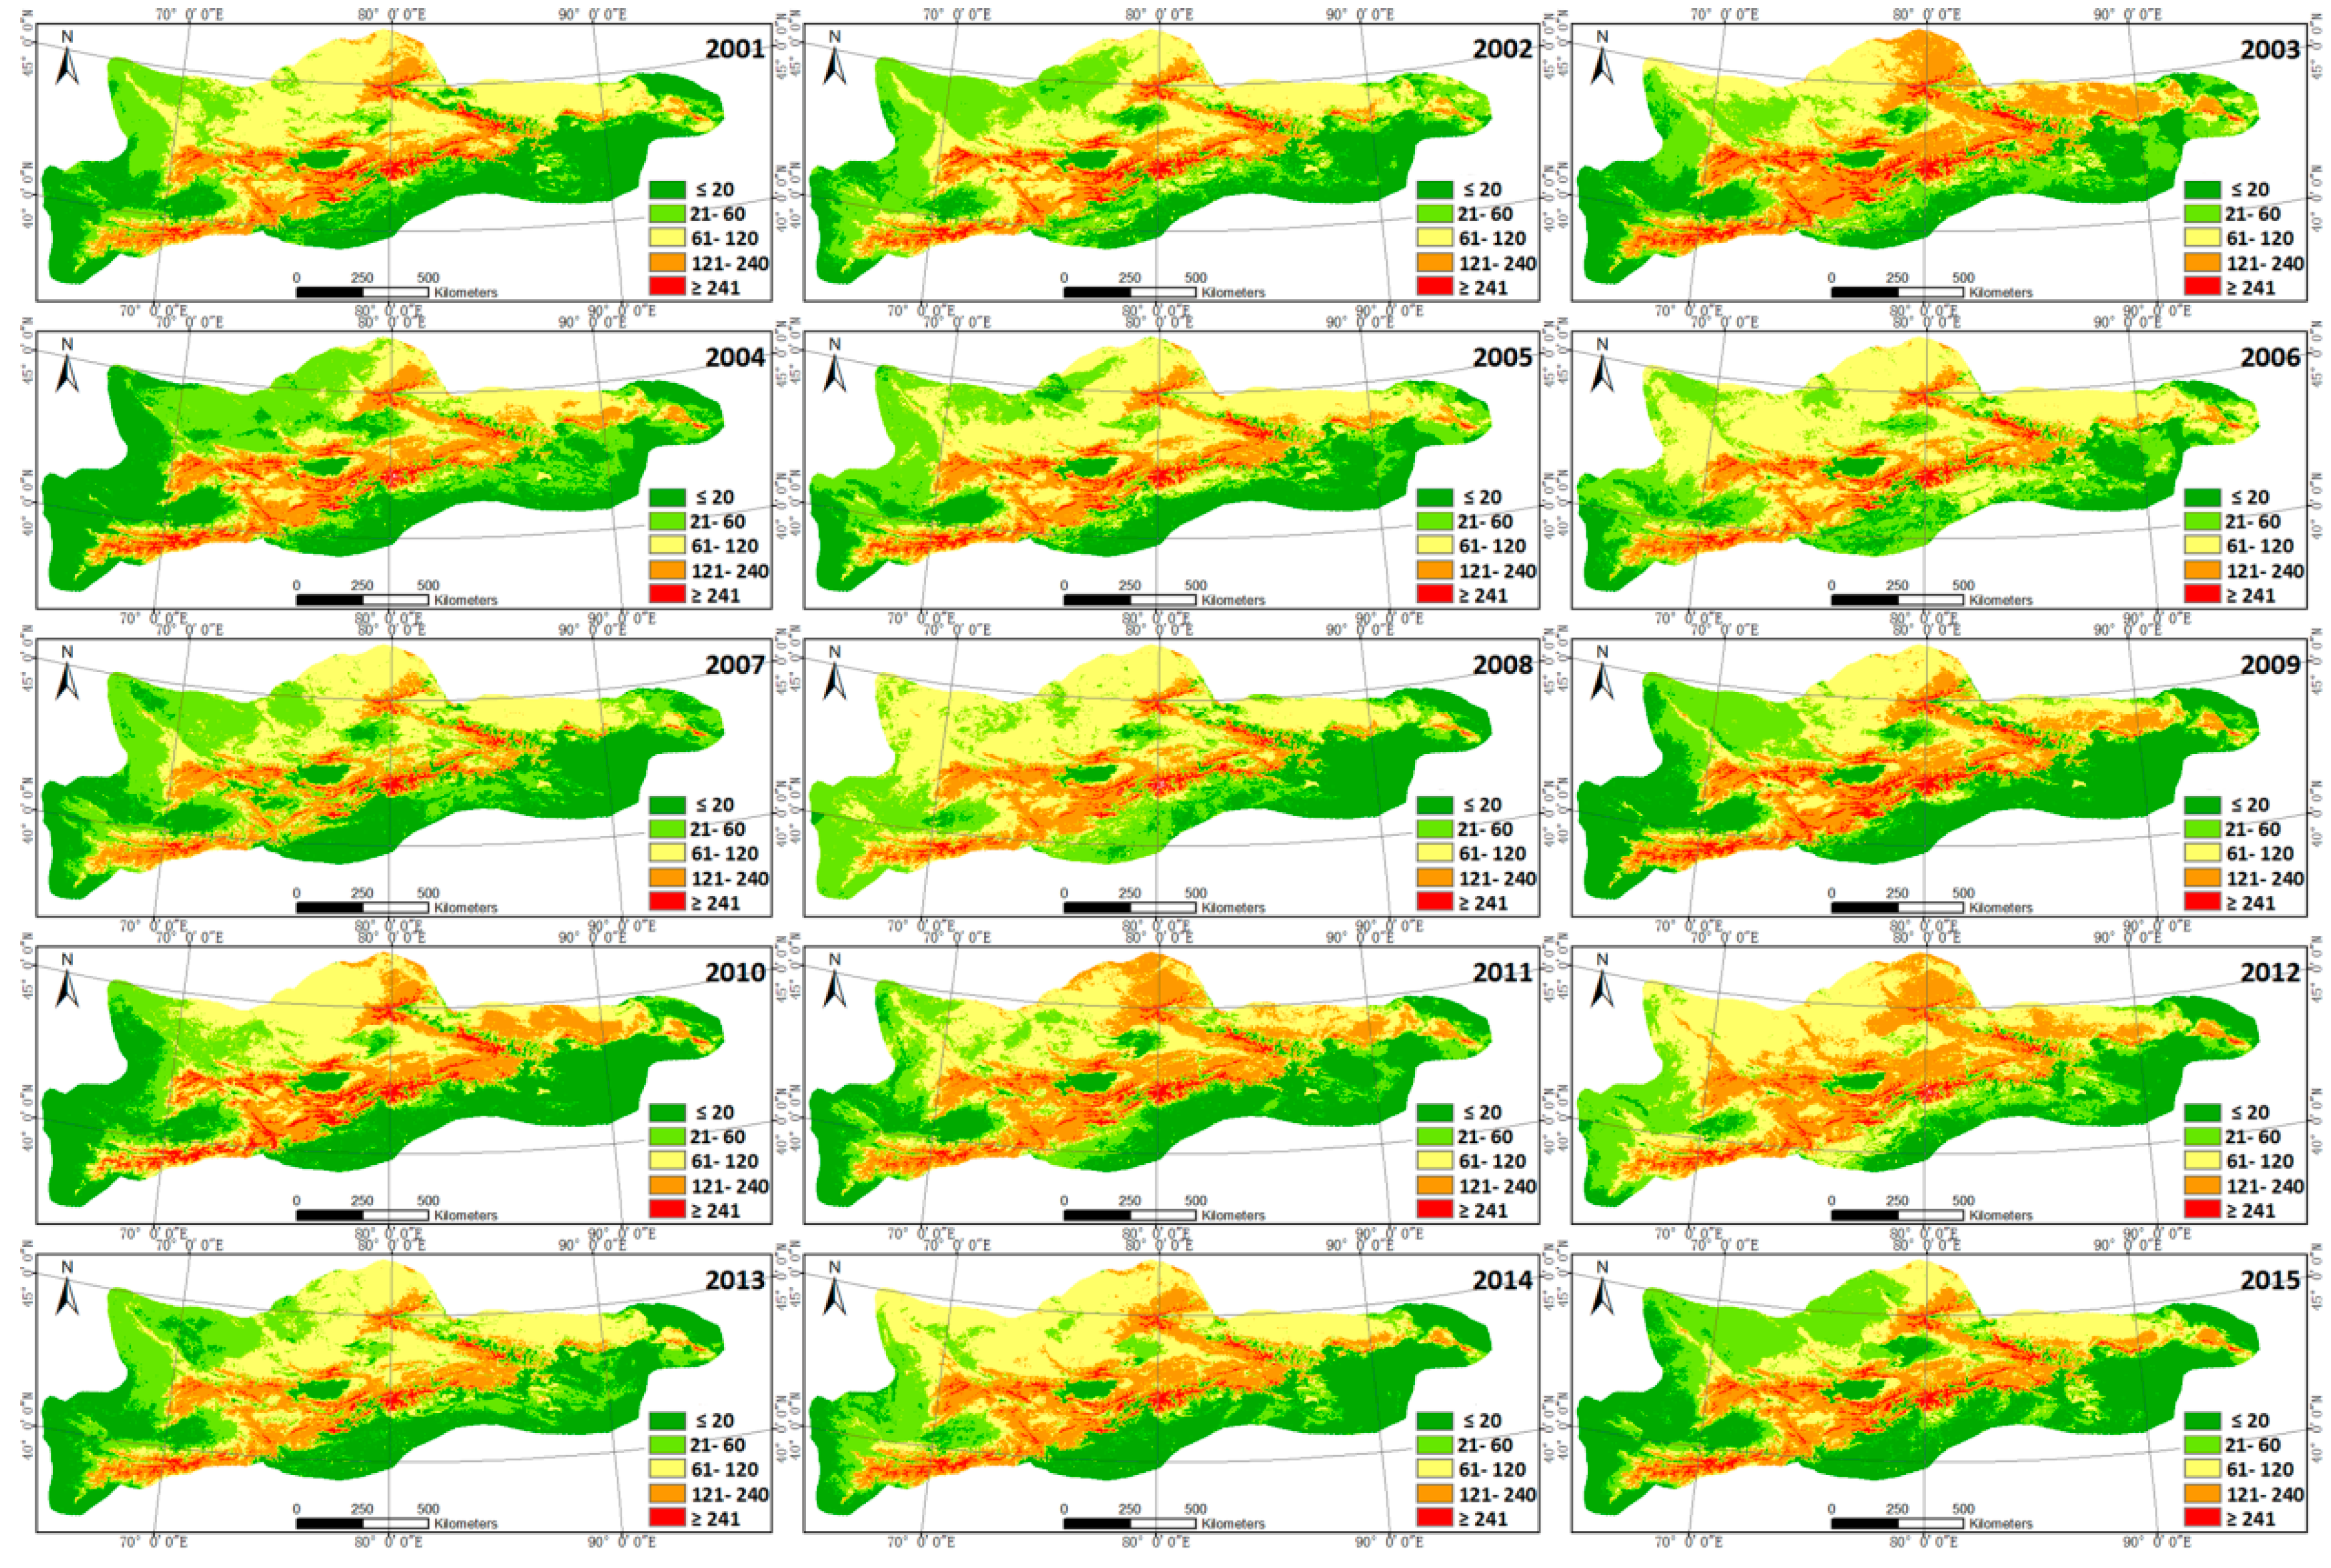
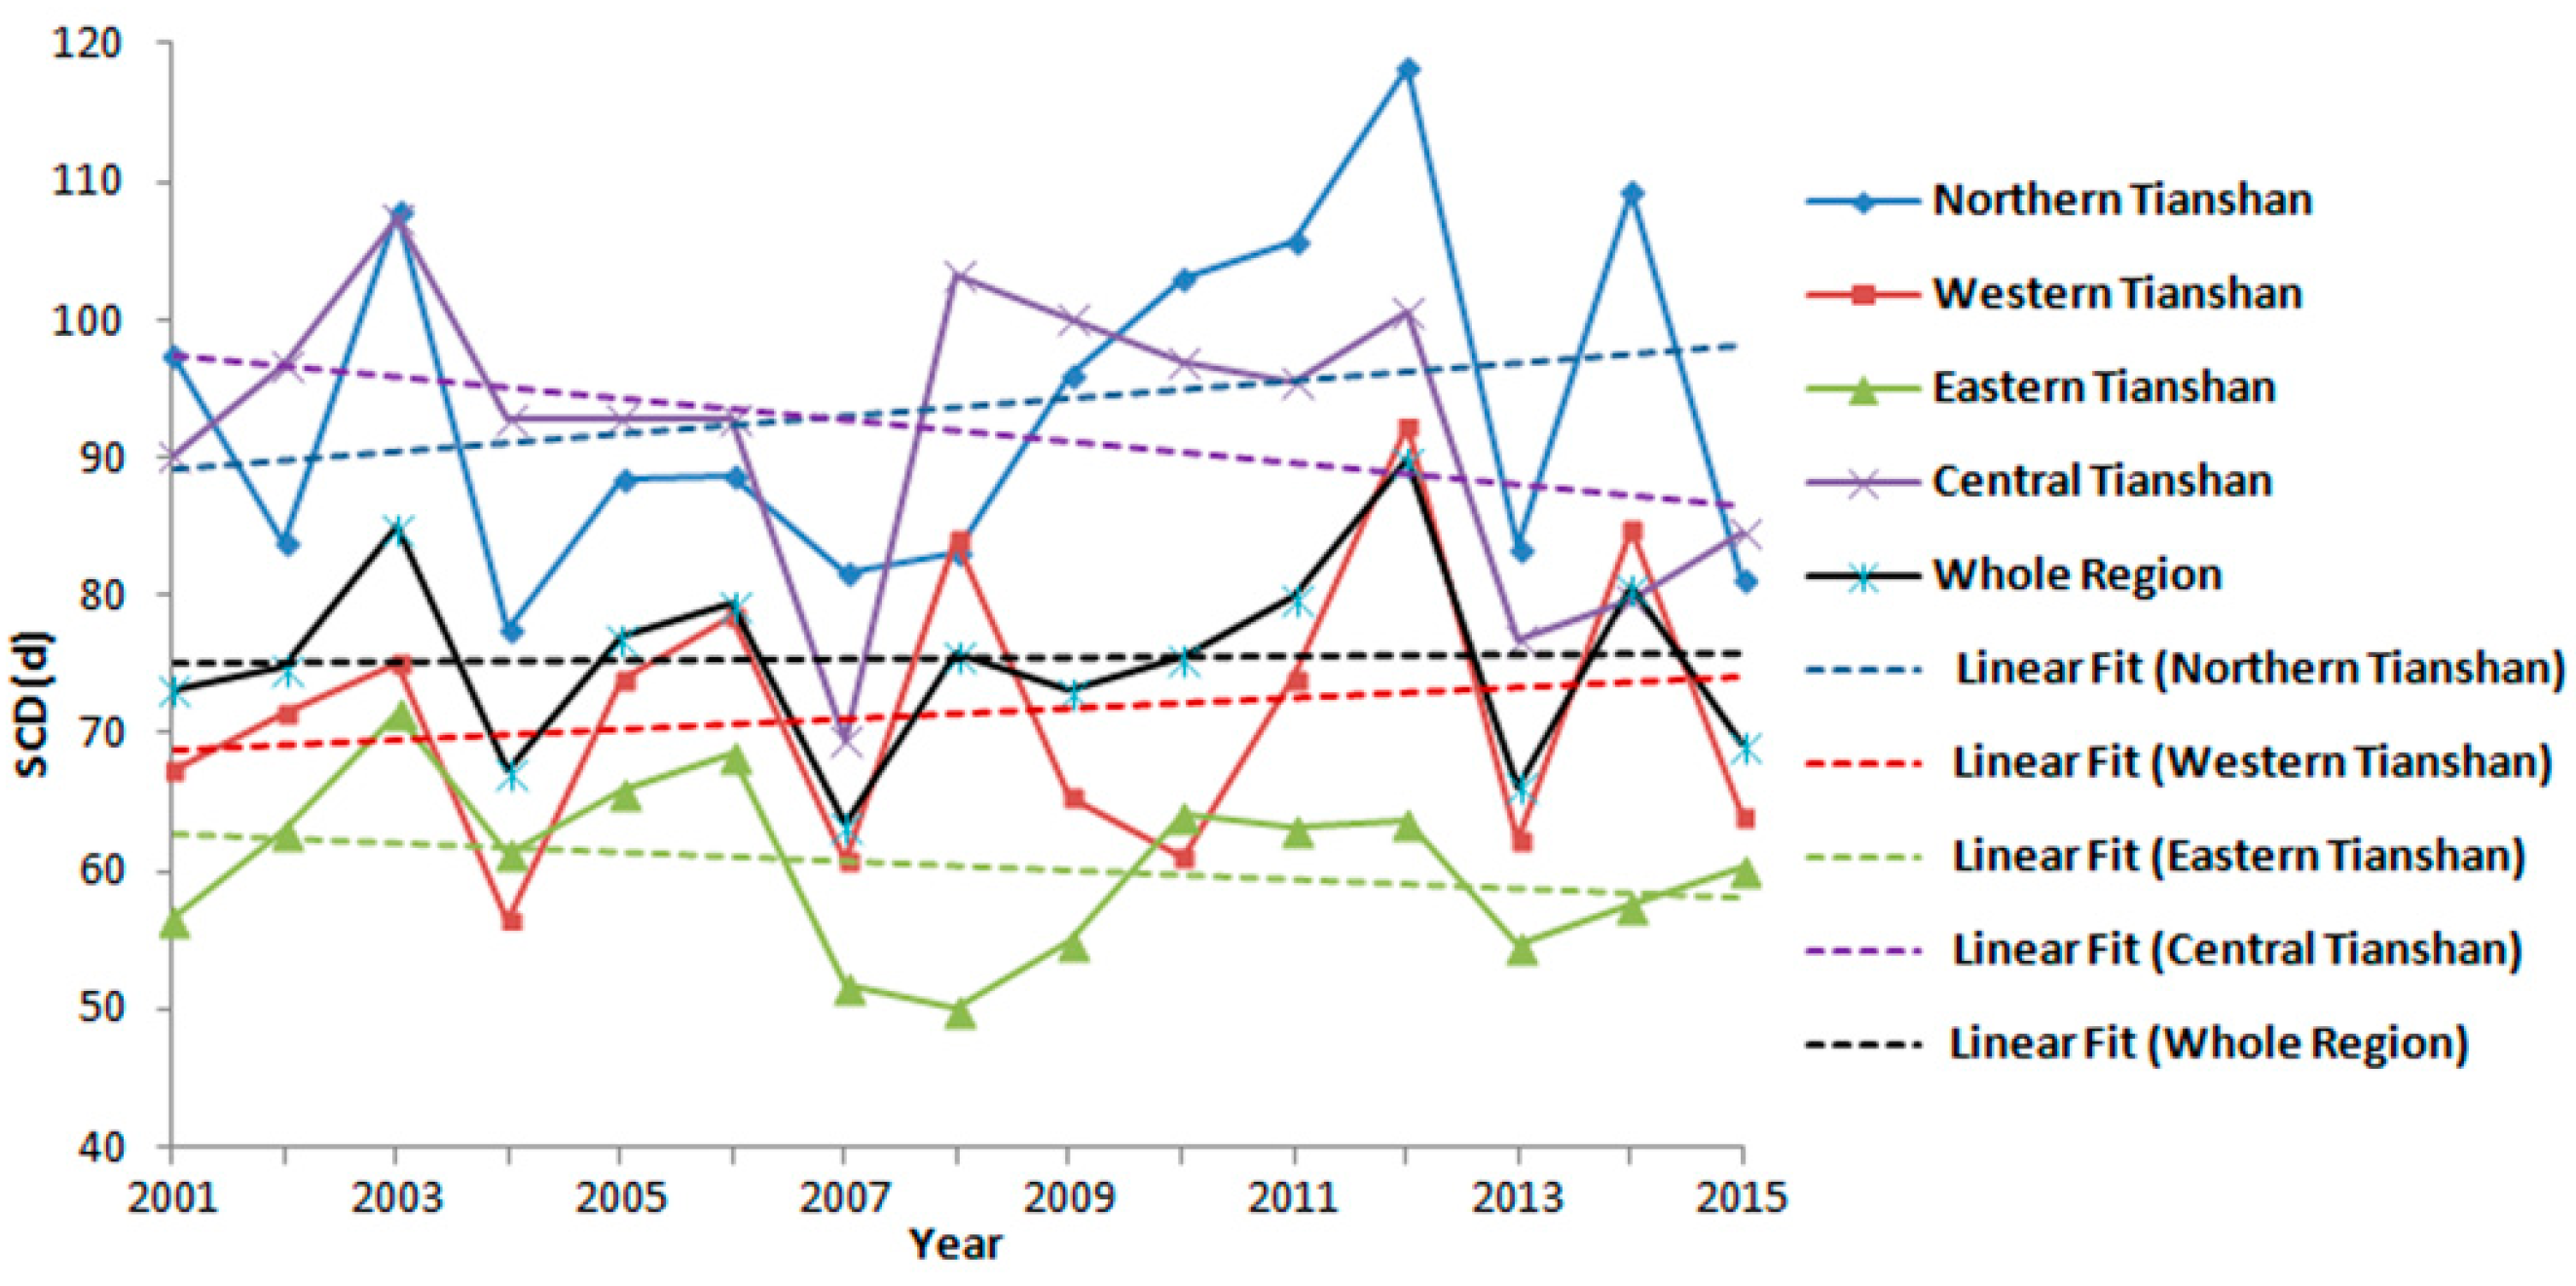
21]; one general conclusion of them is that snowfall and snow cover depth in Tianshan Mountains of China show an increasing tendency in the last decades of the 20th century. In this work, we find decreasing trends of snow cover in Central and Eastern Tianshan (the SCD decreased by 11.88% and 8.03% respectively), and slight increasing trends in Northern and Western Tianshan (respectively, the SCD increased by 9.36% and 7.47%) during the 15 years. However, the snow cover for the whole Tianshan Mountains shows almost no apparent tendency from 2001 to 2015, although it presents a high fluctuation (Figure 9 and Table 3). The changes of seasonal snow cover (Table 1) are roughly compatible with the above results. These findings on snow cover changes in Tianshan Mountains are not consistent with the reported snow cover depth increases in the last decades of the 20th century [17,18,19,21], but in keeping with a recent study by Chen et al. [44], which shows the maximum snow cover decreases in Central and Eastern Tianshan, while slight increases in Western Tianshan during 2002–2013.
In a warmer world, less winter precipitation falls as snow and the melting of winter snow occurs earlier in spring, leading to a shift in peak river runoff to winter and early spring, away from summer and autumn when demand is highest [9]. In this study, the snow cover in summer decreases for all the subregions of Tianshan Mountains; and the decreasing trends of the snow cover in spring for Central and Eastern Tianshan are found during 2001–2015 (Table 1). These may imply an early snowmelt and early arrival of spring peak runoff along with the global warming and the state of high variability in temperature of the Tianshan Mountains. Changes of runoff and peaks moving forward are already detected in Central Asian rivers that are mainly supplied by glacier and snowmelt water from Tianshan Mountains [49,50,51]. Changes in SCA may also change the future runoff regimes and water availability in high-altitude catchments [55], thus impacting ecosystem, irrigation and agriculture, and water resources in the densely populated downstream areas [16,26].
It is true that the meteorological stations used in the correlation analysis of this study are heterogeneous and mostly located in the valley, which may not represent the temperature and precipitation conditions at higher altitudes where the snow cover frequently presents. While, strong linkage between the snow cover and climate factors (temperature and precipitation) is found, although the absolute values of the correlation coefficients vary due to the different subregions. That is, the monthly mean SCA variation is generally negatively correlated with the temperature (especially in snowmelt periods) and positively correlated with the precipitation (especially during the snow accumulation periods). In addition, the overall effect of temperature on snow cover was far greater than the influence of precipitation. These results are roughly consistent with the relevant studies that analyzed the linkages between snow cover and climates in this study area, using only the meteorological stations data [17,21]. However, the effect of climate change on snow cover is very complex. First, the other climate factors such as sunshine duration, vapor pressure, wind velocity, and their synergistic effect also give rise to snow cover variation, which should not be ignored. Second, climate changes and their effect on snow cover vary with geographical environment, especially the elevations [16,56]. Furthermore, the period of 15 years, which is a long time considering available MODIS information, is not sufficient for statements about climate change. Most of the trends for snow cover change are not reached at the statistical significant level. A longer time series of data needs to be examined to obtain some more definitive conclusions about temporal trends of snow cover and the relationship with climate change. Therefore, quantifying the effects of climate factors on snow cover is an extraordinary challenge for further studies.

6. Conclusions

In this study, the spatiotemporal characteristics of snow cover in the Tianshan Mountains during 2001–2015 are investigated by cloud removed daily MODIS FSC data, with specific attentions to the four subregions. We also explore the possible linkage between snow cover and temperature and precipitation over the entire Tianshan Mountains and individual subregions. The main findings are summarized as the follows:
(1) The distribution of snow cover exhibits a large spatiotemporal heterogeneity over the Tianshan Mountains. The maximum (62.7%) and minimum (1.2%) of SCA occurs in January–February and August, respectively. The areas with SCD greater than 120 (about 20.2%), located in the elevations above 3000 m, are essential snowmelt water source areas for the Tianshan Mountains.
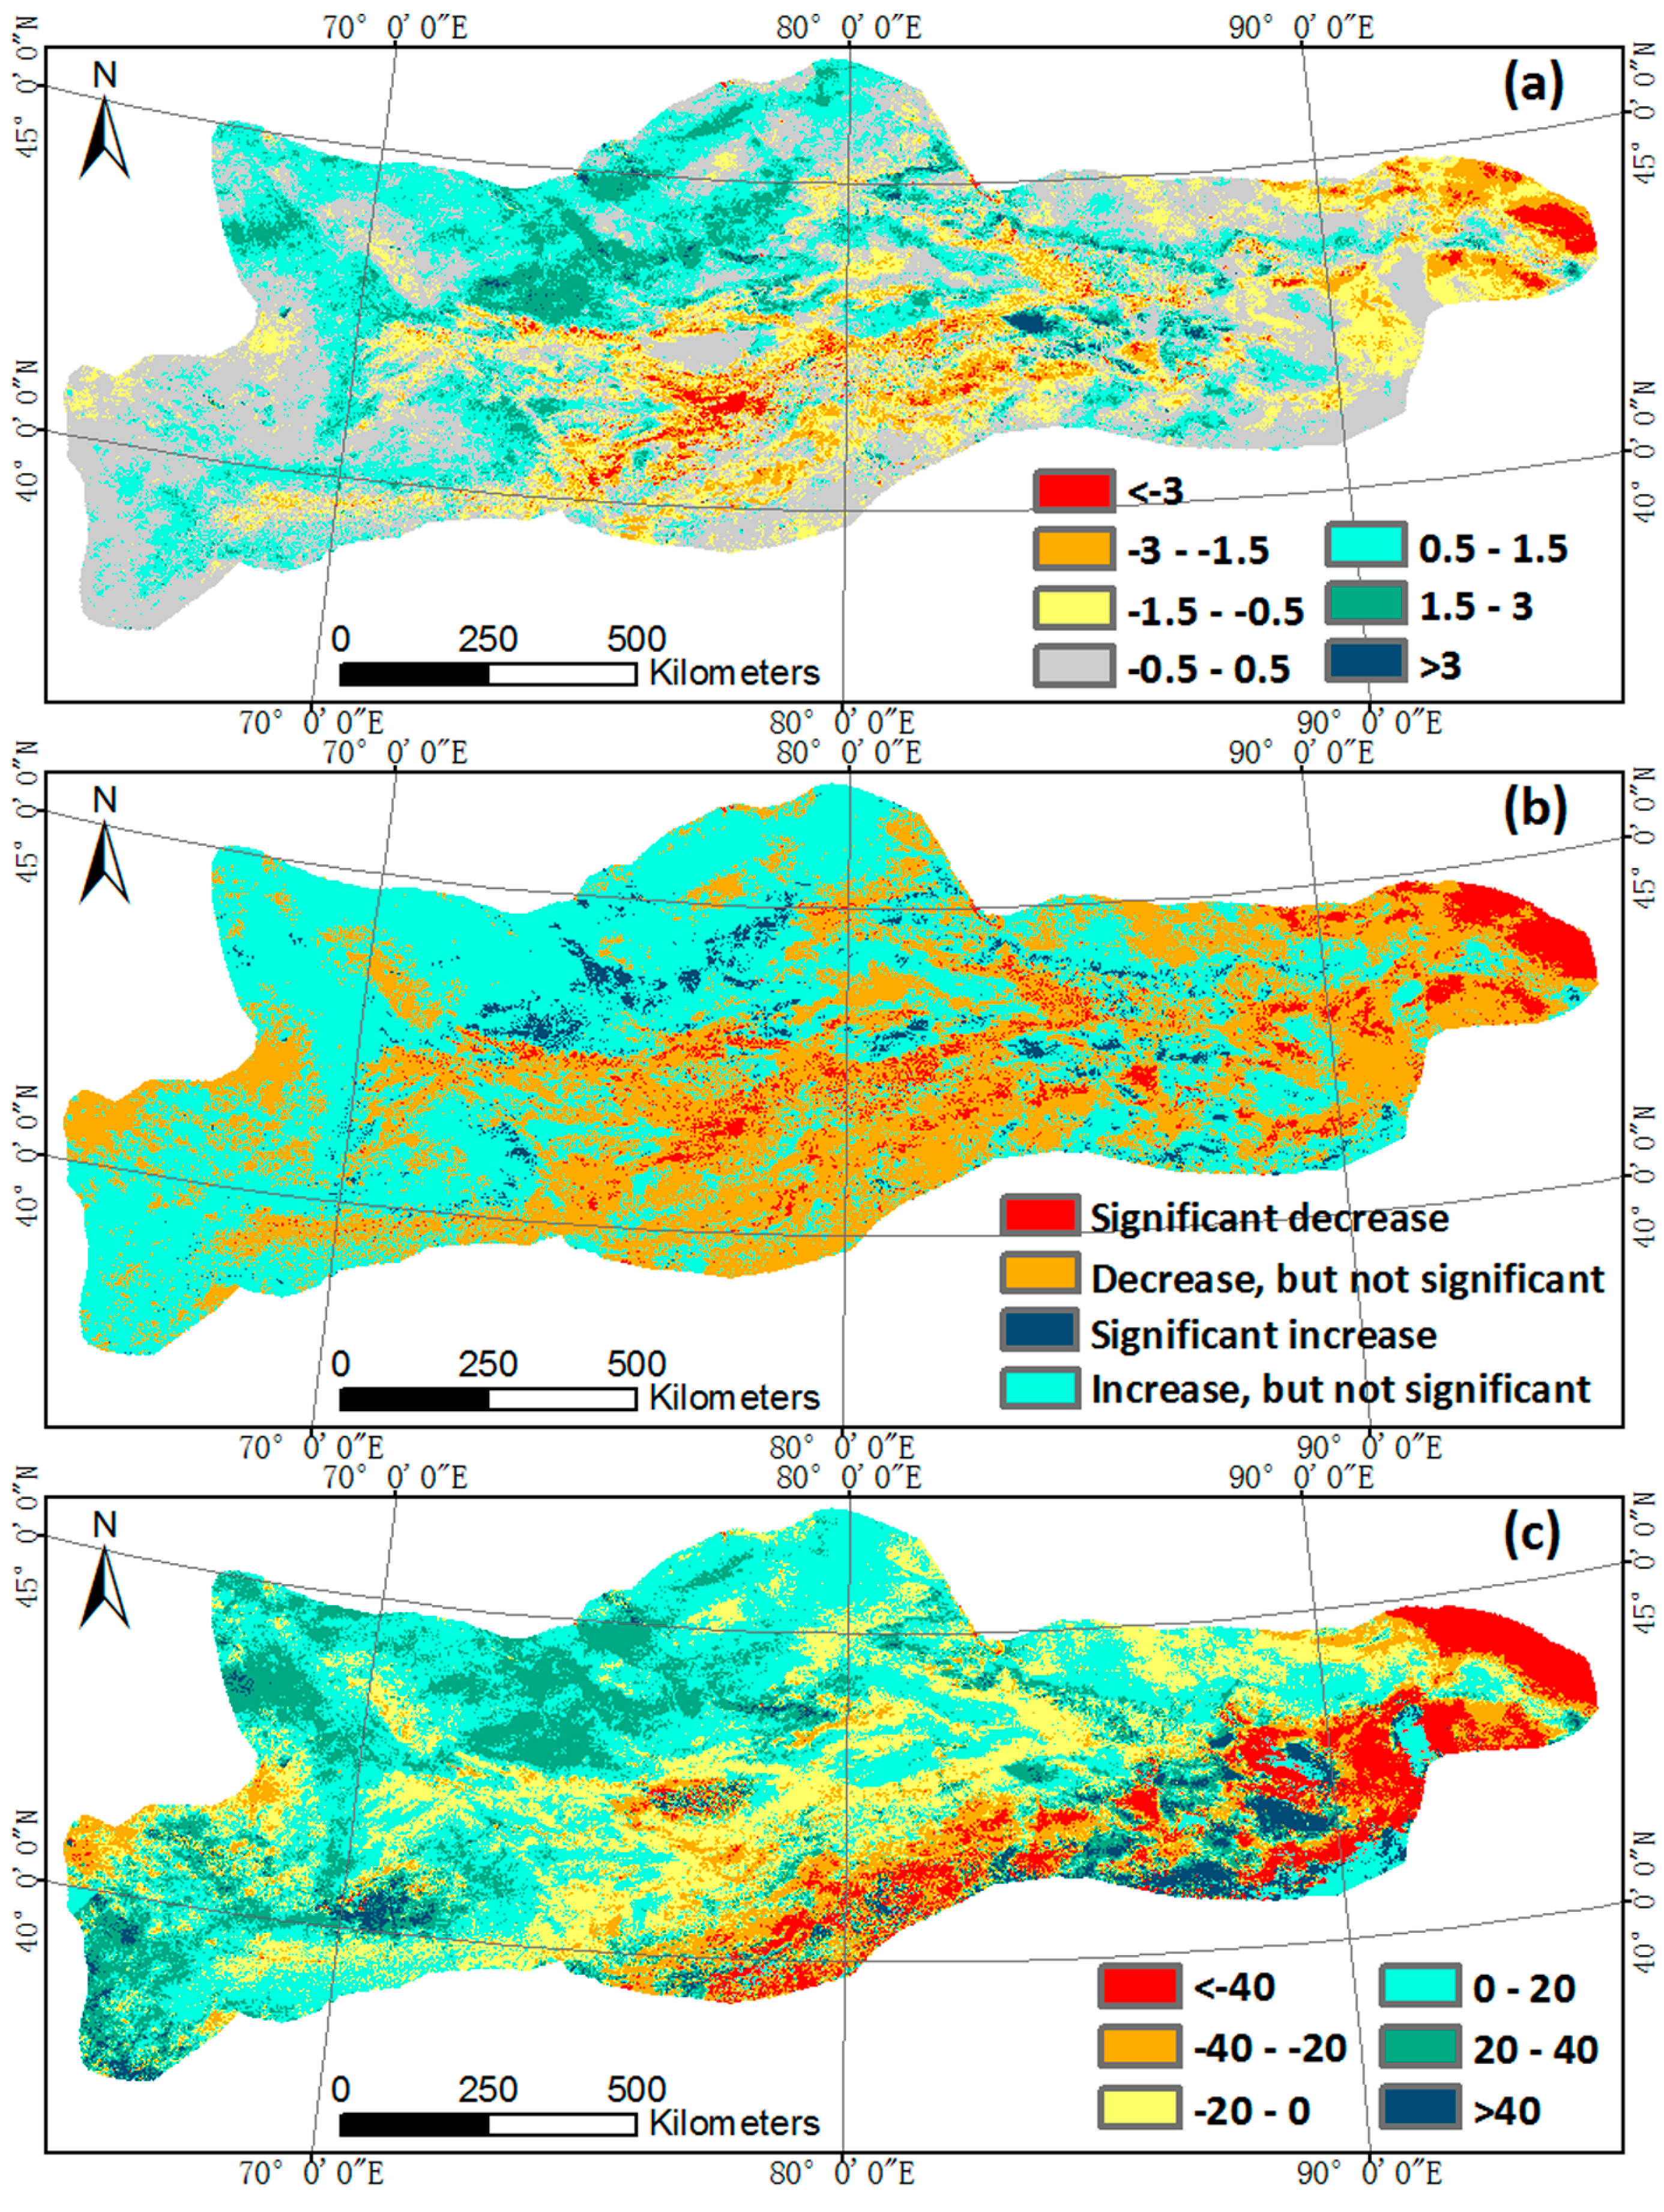
(2) The mean SCA in summer and autumn over the Tianshan Mountains show decreasing (decreased by 12.17%) and increasing (decreased by 15.96%) trends, respectively. In total, 26.39% (5.09% with a significant decline) and 34.26% (2.81% with a significant increase) of the study area show declining (Slope < −0.5 days/year) and increasing trends (Slope > 0.5 days/year) in SCD, respectively. The SCD decreases in Central and Eastern Tianshan (decreased by about 11.88% and 8.03%), while increases in Northern and Western Tianshan (increased by about 9.36% and 7.47%).
(3) The SCD over the entire Tianshan Mountains shows a significant negative correlation with the annual mean temperature (r = −0.702), and a slight positive correlation with the precipitation (r = 0.091). The monthly mean SCA variation is generally negatively correlated with the temperature (especially in snowmelt periods) and positively correlated with the precipitation (especially in the snow accumulation periods). The overall effect of temperature on snow cover was far greater than the influence of precipitation. If the global warming continues, melting of snow and peak runoff in Tianshan Mountains will occur earlier. The early snowmelt may lead to a reduction in summer flows, and subsequently change the flow regimes and water availability, thus impacting ecosystem, agriculture and water resources in the densely populated downstream areas.

Acknowledgments

This study was financially supported by the National Natural Science Foundation of China (Grant No. 41501070), Scientific Research Foundation of Hunan Education Department (Grant No. 16C0633), and the National Natural Science Foundation of China (Grant No. 41471067).

Author Contributions

Zhiguang Tang and Jian Wang conceived and designed the experiments; Zhiguang Tang and Xiaoru Wang performed the experiments and wrote the paper; Zhiguang Tang, Xiaoru Wang and Xin Wang analyzed the data; and Hongyi Li and Zongli Jiang contributed to discussions and revisions.

Conflicts of Interest

The authors declare no conflict of interest.

References

  1. Hu, R. Snow and Its Disaster Control in China, 1st ed.; China Environmental Press: Beijing, China, 2013; pp. 1–11. (In Chinese) [Google Scholar]
  2. Groisman, P.Y.; Karl, T.R.; Knight, R.W. Observed impact of snow cover on the heat-balance and the rise of continental spring temperatures. Science 1994, 263, 198–200. [Google Scholar] [CrossRef] [PubMed]
  3. Foster, J.L.; Sun, C.; Walker, J.P.; Kelly, R.; Chang, A.; Dong, J.; Powell, H. Quantifying the uncertainty in passive microwave snow water equivalent observations. Remote Sens. Environ. 2005, 94, 187–203. [Google Scholar] [CrossRef]
  4. Wang, J.; Li, S. Effect of climate change on snowmelt runoffs in mountainous regions of inland rivers in northwestern China. Sci. China Ser. D Earth Sci. 2006, 49, 881–888. [Google Scholar] [CrossRef]
  5. Robinson, D.A.; Dewey, K.F.; Heim, R.J. Global snow cover monitoring: An update. Bull. Am. Meteorol. Soc. 1993, 74, 1689–1696. [Google Scholar] [CrossRef]
  6. Qin, D.; Liu, S.; Li, P. Snow cover distribution, variability, and response to climate change in western China. J. Clim. 2006, 19, 1820–1833. [Google Scholar]
  7. Wang, W.; Liang, T.; Huang, X.; Feng, Q.; Xie, H.; Liu, X.; Chen, M.; Wang, X. Early warning of snow-caused disasters in pastoral areas on the Tibetan Plateau. Nat. Hazards Earth Syst. Sci. 2013, 13, 1411–1425. [Google Scholar] [CrossRef]
  8. Mijinyawa, Y.; Dlamini, S.S. Impact assessment of water scarcity at Somntongo in the lowveld region of Swaziland. Sci. Res. Essays 2008, 3, 061–065. [Google Scholar]
  9. Barnett, T.P.; Adam, J.C.; Lettenmaier, D.P. Potential impacts of a warming climate on water availability in snow-dominated regions. Nature 2005, 438, 303–309. [Google Scholar] [CrossRef] [PubMed]
  10. Sorg, A.; Bolch, T.; Stoffel, M.; Solomina, O.; Beniston, M. Climate change impacts on glaciers and runoff in Tien Shan (Central Asia). Nat. Clim. Chang. 2012, 2, 725–731. [Google Scholar] [CrossRef]
  11. Farinotti, D.; Longuevergne, L.; Moholdt, G.; Duethmann, D.; Mölg, T.; Bolch, T.; Vorogushyn, S.; Güntner, A. Substantial glacier mass loss in the Tien Shan over the past 50 years. Nat. Geosci. 2015, 8, 716–722. [Google Scholar] [CrossRef]
  12. Liu, Q.; Liu, S. Response of glacier mass balance to climate change in the Tianshan Mountains during the second half of the twentieth century. Clim. Dyn. 2016, 46, 301–316. [Google Scholar] [CrossRef]
  13. Wang, X.; Ding, Y.; Liu, S.; Jiang, L.; Wu, K.; Jiang, Z.; Guo, W. Changes of glacial lakes and implications in Tian Shan, central Asia, based on remote sensing data from 1990 to 2010. Environ. Res. Lett. 2013, 8, 575–591. [Google Scholar] [CrossRef]
  14. Hu, R. Physical Geography of the Tianshan Mountains in China, 1st ed.; China Environmental Science Press: Beijing, China, 2004; pp. 122–153. (In Chinese) [Google Scholar]
  15. Pu, Z.; Xu, L.; Salomonson, V.V. MODIS/Terra observed seasonal variations of snow cover over the Tibetan Plateau. Geophys. Res. Lett. 2007, 34, L06706. [Google Scholar] [CrossRef]
  16. Li, C.; Su, F.; Yang, D.; Tong, K.; Meng, F.; Kan, B. Spatiotemporal variation of snow cover over the Tibetan Plateau based on MODIS snow product, 2001–2014. Int. J. Climatol. 2017. [Google Scholar] [CrossRef]
  17. Gao, W.; Wei, W.; Zhang, L. Climate changes and seasonal snow cover variability in the Western Tianshan Mountains, Xinjiang in 1967–2000. J. Glaciol. Geocryol. 2005, 27, 68–73. (In Chinese) [Google Scholar]
  18. Yang, Q.; Cui, C.; Sun, C.; Ren, Y. Snow cover variation during 1959–2003 in Tianshan Mountains, China. Adv. Clim. Chang. Res. 2007, 3, 80–84. (In Chinese) [Google Scholar]
  19. Xu, J.; Qiu, J. A Study on snowfall variation in the Tianshan Mountains during the recent 30 winters. J. Glaciol. Geocryol. 1996, 18, 123–128. (In Chinese) [Google Scholar]
  20. Aizen, V.B.; Aizen, E.M.; Melack, J.M. Climate, snow cover, glaciers, and runoff in the Tien Shan, central Asia. J. Am. Water Resour. Assoc. 1995, 31, 1113–1129. [Google Scholar] [CrossRef]
  21. Li, X.; Gao, P.; Li, Q.; Tang, H. Muti-paths impact from climate change on snow cover in Tianshan Mountainous area of China. Clim. Chang. Res. 2016, 12, 303–312. (In Chinese) [Google Scholar]
  22. Hall, D.K.; Riggs, G.A.; Salomonson, V.V.; DiGirolamo, N.E.; Bayr, K.J. MODIS snow-cover products. Remote Sens. Environ. 2002, 83, 181–194. [Google Scholar] [CrossRef]
  23. Hall, D.K.; Riggs, G.A. Accuracy assessment of the MODIS snow products. Hydrol. Process. 2007, 21, 1534–1547. [Google Scholar] [CrossRef]
  24. Riggs, G.A.; Hall, D.K.; Salomonson, V.V. MODIS Snow Products User Guide to Collection 5. 2006. Available online: https://modis-snow-ice.gsfc.nasa.gov/ (accessed on 10 May 2014).
  25. Jain, S.K.; Goswami, A.; Saraf, A.K. Role of elevation and aspect in snow distribution in Western Himalaya. Water Resour. Manag. 2009, 23, 71–83. [Google Scholar] [CrossRef]
  26. Tang, Z.; Wang, J.; Li, H.; Yan, L. Spatiotemporal changes of snow cover over the Tibetan plateau based on cloud-removed moderate resolution imaging spectroradiometer fractional snow cover product from 2001 to 2011. J. Appl. Remote Sens. 2013, 7, 073582. [Google Scholar] [CrossRef]
  27. Klein, A.G.; Barnett, A.C. Validation of daily MODIS snow cover maps of the Upper Rio Grande River Basin for the 2000–2001 snow year. Remote Sens. Environ. 2003, 86, 162–176. [Google Scholar] [CrossRef]
  28. Huang, X.; Zhang, X.; Li, X.; Liang, T. Accuracy analysis for MODIS snow products of MOD10A1 and MOD10A2 in northern Xinjiang area. J. Glaciol. Geocryol. 2007, 29, 722–729. (In Chinese) [Google Scholar]
  29. Jain, S.K.; Goswami, A.; Saraf, A.K. Accuracy assessment of MODIS, NOAA and IRS data in snow cover mapping under Himalayan conditions. Int. J. Remote Sens. 2008, 29, 5863–5878. [Google Scholar] [CrossRef]
  30. Xie, H.; Liang, T.; Wang, X. Development and assessment of combined Terra and Aqua snow cover products in Colorado Plateau, USA and northern Xinjiang, China. J. Appl. Remote Sens. 2009, 3, 033559. [Google Scholar] [CrossRef]
  31. Wang, X.; Xie, H. New methods for studying the spatiotemporal variation of snow cover based on combination products of MODIS Terra and Aqua. J. Hydrol. 2009, 371, 192–200. [Google Scholar] [CrossRef]
  32. Hall, D.K.; Riggs, G.A.; Foster, J.L.; Kumar, S.V. Development and evaluation of a cloud-gap-filled MODIS daily snow-cover product. Remote Sens. Environ. 2010, 114, 496–503. [Google Scholar] [CrossRef]
  33. Gafurov, A.; Bárdossy, A. Cloud removal methodology from MODIS snow cover product. Hydrol. Earth Syst. Sci. 2009, 13, 1361–1373. [Google Scholar] [CrossRef]
  34. Gao, Y.; Lu, N.; Yao, T. Evaluation of a cloud-gap-filled MODIS daily snow cover product over the Pacific Northwest USA. J. Hydrol. 2011, 404, 157–165. [Google Scholar] [CrossRef]
  35. Liang, T.; Zhang, X.; Xie, H.; Wu, C.; Feng, Q.; Huang, X.; Chen, Q. Toward improved daily snow cover mapping with advanced combination of MODIS and AMSR-E measurements. Remote Sens. Environ. 2008, 112, 3750–3761. [Google Scholar] [CrossRef]
  36. Gao, Y.; Xie, H.; Lu, N.; Yao, T.; Liang, T. Toward advanced daily cloud-free snow cover and snow water equivalent products from Terra–Aqua MODIS and Aqua AMSR-E measurements. J. Hydrol. 2010, 385, 23–35. [Google Scholar] [CrossRef]
  37. Foster, J.L.; Hall, D.K.; Eylander, J.B.; Riggs, G.A.; Nghiem, S.V.; Tedesco, M.; Kim, E.; Montesano, P.M.; Kelly, R.E.J.; Casey, K.A.; et al. A blended global snow product using visible, passive microwave and scatterometer satellite data. Int. J. Remote Sens. 2011, 32, 1371–1395. [Google Scholar] [CrossRef]
  38. Parajka, J.; Pepe, M.; Rampini, A.; Rossi, S.; Blöschl, G. A regional snow-line method for estimating snow cover from MODIS during cloud cover. J. Hydrol. 2010, 381, 203–212. [Google Scholar] [CrossRef]
  39. Gao, Y.; Xie, H.; Yao, T.; Xue, C. Integrated assessment on multi-temporal and multi-sensor combinations for reducing cloud obscuration of MODIS snow cover products of the Pacific Northwest USA. Remote Sens. Environ. 2010, 114, 1662–1675. [Google Scholar] [CrossRef]
  40. Salomonson, V.; Appel, I. Estimating fractional snow cover from MODIS using the normalized difference snow index. Remote Sens. Environ. 2004, 89, 351–360. [Google Scholar] [CrossRef]
  41. Tang, Z.; Wang, J.; Li, H.; Yan, L.; Liang, J. Accuracy validation and cloud obscuration removal of MODIS fractional snow cover products over Tibetan Plateau. Remote Sens. Tech. Appl. 2013, 28, 423–430. (In Chinese) [Google Scholar]
  42. Tang, Z.; Wang, J.; Li, H.; Liang, J.; Li, C.; Wang, X. Extraction and assessment of snowline altitude over the Tibetan plateau using MODIS fractional snow cover data (2001 to 2013). J. Appl. Remote Sens. 2014, 8, 084689. [Google Scholar] [CrossRef]
  43. Wang, W.; Huang, X.; Deng, J.; Xie, H.; Liang, T. Spatio-temporal change of snow cover and its response to climate over the Tibetan plateau based on an improved daily cloud-free snow cover product. Remote Sens. 2014, 7, 169–194. [Google Scholar] [CrossRef]
  44. Chen, Y.; Li, Z.; Fang, G.; Deng, H. Impact of climate change on water resources in the Tianshan Mountians, Central Asia. Acta Geogr. Sin. 2017, 72, 18–26. [Google Scholar]
  45. Hu, Z.; Zhang, C.; Hu, Q.; Tian, H. Temperature changes in central Asia from 1979 to 2011 based on multiple datasets. J. Clim. 2013, 27, 1143–1167. [Google Scholar] [CrossRef]
  46. Yu, K.; Xie, S.P. Recent global-warming hiatus tied to equatorial Pacific surface cooling. Nature 2013, 501, 403–407. [Google Scholar]
  47. Easterling, D.R.; Wehner, M.F. Is the climate warming or cooling? Geophys. Res. Lett. 2009, 36, 262–275. [Google Scholar] [CrossRef]
  48. Li, Z.; Chen, Y.; Li, W.; Deng, H.; Fang, G. Potential impacts of climate change on vegetation dynamics in Central Asia. J. Geophys. Res. 2015, 120, 12345–12356. [Google Scholar] [CrossRef]
  49. Zhang, Y.; Lou, Y.; Sun, L.; Liu, S.; Chen, X.; Wang, X. Using glacier area ratio to quantify effects of melt water on runoff. J. Hydrol. 2016, 538, 269–277. [Google Scholar] [CrossRef]
  50. Kaldybayev, A.; Chen, Y.; Issanova, G.; Wang, H.; Mahmudova, L. Runoff response to the glacier shrinkage in the Karatal river basin, Kazakhstan. Arab. J. Geosci. 2016, 9, 208. [Google Scholar] [CrossRef]
  51. Duethmann, D.; Bolch, T.; Farinotti, D.; Kriegel, D.; Vorogushyn, S.; Merz, B.; Pieczonka, T.; Jiang, T.; Su, B.; Güntner, A. Attribution of streamflow trends in snow and glacier melt-dominated catchments of the Tarim River, Central Asia. Water Resour. Res. 2015, 51, 4727–4750. [Google Scholar] [CrossRef]
  52. Aizen, V.B.; Aizen, E.M.; Kuzmichonok, V.A. Glaciers and hydrological changes in the Tien Shan: Simulation and prediction. Environ. Res. Lett. 2007, 2, 45019. [Google Scholar] [CrossRef]
  53. Dwyer, J.; Schmidt, G. The MODIS reprojection tool. In Earth Science Satellite Remote Sensing, 1st ed.; Qu, J.J., Gao, W., Kafatos, M., Murphy, R.E., Salomonson, V.V., Eds.; Springer: Berlin/Heidelberg, Germany, 2006; pp. 162–177. [Google Scholar]
  54. Parajka, J.; Blöschl, G. Validation of MODIS snow cover images over Austria. Hydrol. Earth Syst. Sci. 2006, 10, 679–689. [Google Scholar] [CrossRef]
  55. Wang, R.; Yao, Z.; Liu, Z.; Wu, S.; Jiang, L.; Wang, L. Snow cover variability and snowmelt in a high-altitude ungauged catchment. Hydrol. Process. 2015, 29, 3665–3676. [Google Scholar] [CrossRef]
  56. Bi, Y.; Xie, H.; Huang, C.; Ke, C. Snow cover variations and controlling factors at upper Heihe river basin, northwestern China. Remote Sens. 2015, 7, 6741–6762. [Google Scholar] [CrossRef]
Figure 1. Location and the extent of the study area, and boundaries of four subregions. Blue dots denote meteorological stations.
Remotesensing 09 01045 g001
Figure 2. Monthly average of precipitation and temperature in the Tianshan Mountains during 2001–2015.
Remotesensing 09 01045 g002
Figure 3. Original MODIS fractional snow cover (FSC) map (a); and the cloud-removed MODIS FSC map (b) on the 315th day of 2014.
Remotesensing 09 01045 g003
Figure 4. Dynamic changes of daily snow-covered area (SCA) percentage (%) for four subdivided regions during 2001–2015 (a); and annual cycle of SCA (%) for the four subregions (b); and the whole region of the Tianshan Mountains (b). The SCA values in (b,c) are averages of 15 years from 2001 to 2015. The error bars in (c) show the standard deviation, indicating the interannual variations of SCA from 2001 to 2015.
Remotesensing 09 01045 g004
Figure 5. Spatial patterns of monthly mean fractional snow cover (FSC, %) in the Tianshan Mountains for 2001–2015.
Remotesensing 09 01045 g005
Figure 6. Interannual variation of seasonal mean snow-covered area (SCA, %) in: spring (a); summer (b); autumn (c); and winter (d), for different subregions and whole Tianshan Mountains from 2001 to 2015.
Remotesensing 09 01045 g006
Figure 7. Spatial distribution of yearly Snow-covered days (SCD) in the Tianshan Mountains from 2001 to 2015.
Remotesensing 09 01045 g007
Figure 8. Change trend (Slope, days/year) of SCD (a); and its significance level (b); and the change percentage (Chp, %) (c) in pixel scale during 2001–2015 over the Tianshan Mountains. Significant changes indicate its statistical significance at the 5% level.
Remotesensing 09 01045 g008
Figure 9. Interannual variation of SCD for different subregions and whole Tianshan Mountains from 2001 to 2015.
Remotesensing 09 01045 g009
Table 1. Linear trends (Slope, %/year) and change percentage (ChP, %) of seasonal mean SCA (%) for different subregions and the whole Tianshan Mountains during 2001–2015.
RegionsSpringSummerAutumnWinter
SlopeChPSlopeChPSlopeChPSlopeChP
Western Tianshan0.1019.05−0.008−7.660.15324.170.1704.52
Northern Tianshan0.37731.91−0.018 *−30.490.17123.760.1582.92
Eastern Tianshan−0.056−6.54−0.013−13.450.16224.70−0.466 *−14.78
Central Tianshan−0.261−13.83−0.044−10.39−0.115−8.18−0.427−12.16
Whole Region0.0584.99−0.016−12.170.12215.96−0.114−2.93
* indicates statistical significance at the 0.05 level of the trends.
Table 2. Area ratio for different SCD categories over the Tianshan Mountains during 2001–2015.
YearArea of SCD (%)
SCD ≤ 2021 ≤ SCD ≤ 6061 ≤ SCD ≤ 120121 ≤ SCD ≤ 240SCD ≥ 241
200129.3519.7732.3914.683.81
200221.4731.6729.4413.563.85
200323.0623.5823.7824.884.70
200433.5027.4318.7717.033.27
200523.0124.0634.1615.193.58
200615.4125.5841.9314.053.04
200729.3629.2527.3111.892.18
200817.3326.1439.9614.082.49
200935.1818.9823.9017.993.95
201034.5416.3726.8418.224.03
201127.1019.1727.5323.312.88
201216.8819.1336.1624.942.90
201328.8825.3329.7014.012.07
201426.3317.0234.3719.412.87
201533.0925.4121.3517.083.08
Table 3. Linear trends (Slope) (days/year) and change percentage (ChP) (%) of SCD for different subregions and the whole Tianshan Mountains during 2001–2015.
RegionsSlopeChP
Western Tianshan0.3817.473
Northern Tianshan0.6269.357
Eastern Tianshan−0.347−8.034
Central Tianshan−0.780−11.882
Whole Region0.0370.686
None of the trends (Slope) meet the statistical significance at the 5% level.
Table 4. Pearson correlation coefficients between the annually SCD, temperature, and precipitation in different subregions and the whole Tianshan Mountains for the period of 2001–2015.
RegionsTemperaturePrecipitation
Western Tianshan−0.680 **0.116
Northern Tianshan−0.810 **−0.149
Eastern Tianshan−0.3990.159
Central Tianshan−0.4870.221
Whole Region−0.702 **0.091
** indicates statistical significance at the 0.01 level.
Table 5. Pearson correlation coefficients between the monthly SCA and temperature in different subregions and the whole Tianshan Mountains for the period of 2001–2015.
MonthsWestern TianshanNorthern TianshanEastern TianshanCentral TianshanWhole Region
January−0.598 *−0.384−0.379−0.576 *−0.432
February−0.834 **−0.580 *−0.400−0.910 **−0.716 **
March−0.525 *−0.681 **−0.599 *−0.553 *−0.643 **
April−0.627 *−0.581 *−0.523 *−0.672 **−0.702 **
May−0.327−0.756 **−0.426−0.740 **−0.647 **
June−0.770 **−0.521 *−0.369−0.486−0.573 *
July−0.545 *−0.436−0.246−0.456−0.529 *
August−0.491−0.262−0.1520.332−0.325
September−0.656 **−0.4050.034−0.483−0.530 *
October−0.414−0.574 *−0.170−0.360−0.478
November−0.510−0.498−0.366−0.380−0.459
December−0.505−0.523 *−0.323−0.405−0.498
** and * indicate statistical significance at the 0.01 and 0.05 level, respectively.
Table 6. Pearson correlation coefficients between the monthly SCA and precipitation in different subregions and the whole Tianshan Mountains for the period of 2001–2015.
MonthsWestern TianshanNorthern TianshanEastern TianshanCentral TianshanWhole Region
January0.647 **0.2020.3160.797 **0.408
February0.2860.4600.2460.4580.307
March0.585 *0.1130.1070.730 **0.274
April0.559 *−0.0090.0750.624 *0.264
May0.3520.349−0.0010.2670.214
June0.2910.4410.3050.2490.313
July0.0560.3530.3470.1930.212
August0.2790.4570.0900.3740.341
September0.690 **0.514 *0.3400.798 **0.656 **
October0.568 *0.520 *0.543 *0.785 **0.711 **
November0.697 **0.3860.527*0.725 **0.582 *
December0.636 *0.2110.1380.542 *0.385
** and * indicate statistical significance at the 0.01 and 0.05 level, respectively.

