A Region-Based Hierarchical Cross-Section Analysis for Individual Tree Crown Delineation Using ALS Data

Department of Forest Management, School of Forestry, Northeast Forestry University, Harbin 150040, Heilongjiang, China
*
Author to whom correspondence should be addressed.
Remote Sens. 2017, 9(10), 1084; https://doi.org/10.3390/rs9101084
Submission received: 31 August 2017
/
Revised: 30 September 2017
/
Accepted: 19 October 2017
/
Published: 24 October 2017
(This article belongs to the Section Forest Remote Sensing)
Abstract
:In recent years, airborne Light Detection and Ranging (LiDAR) that provided three-dimensional forest information has been widely applied in forest inventory and has shown great potential in automatic individual tree crown delineation (ITCD). Usually, ITCD algorithms include treetop detection and crown boundary delineation procedures. In this study, we proposed a novel method called region-based hierarchical cross-section analysis (RHCSA), which combined the two procedures together based on a canopy height model (CHM) derived from airborne LiDAR data for ITCD. This method considers the CHM as a three-dimensional topological surface, simulates stereoscopic scanning from top to bottom using an iterative process, and utilizes the individual crown and vertical structure of crowns to progressively detect individual treetops and delineate crown boundaries. The proposed method was tested in natural forest stands with high canopy densities in Liangshui National Nature Reserve and Maoershan Forest Farm, Heilongjiang Province, China. Its performance was evaluated by an accuracy procedure that considered both the relative position of treetops and overlapped area of crowns. The average overall accuracy achieved was 85.12% for coniferous plots, 83.86% for deciduous plots and 86.44% for coniferous and broad-leaved mixed forest plots. The results revealed that the RHCSA method can detect and delineate individual tree crowns with little influence from forest types and crown size. It could provide technical support for individual tree crown delineation in coniferous, deciduous and mixed forests with high canopy densities.
1. Introduction
Forests are an important natural resource which play a significant role in modulating stores and fluxes of water and carbon, maintaining ecological diversity, and regulating climate on the Earth’s surface, and provides timber and other forest products constantly which are closely related to humans [1,2,3]. Parameters of individual trees, such as tree location, tree species, tree height, diameter at breast height (DBH), and crown diameter, are vital for sustainable and precise forest management [4,5,6]. These individual tree-related properties can also be utilized to estimate forest parameters at stand level, such as tree species composition, mean tree height, timber volume, canopy density, and mean basal area [7,8,9,10].
Traditionally, forest parameters at the individual tree level have been measured by means of field surveys [11], which are time consuming and cost-intensive when carried out over broad areas [12,13]. Since the early 1960s, with the extensive application of remote sensing data in forest inventory [14,15,16] a variety of image processing techniques were developed for automatically detecting and delineating individual tree crowns, such as local maxima filtering with fixed or variable window size [17,18,19], valley-following [20,21,22], region-growing [23,24], and watershed segmentation [25,26]. These methods make it possible to obtain individual tree-based attributes that can be directly used as input parameters for environmental modeling without the limitations of the sample sizes and inaccessible areas [27,28]. In recent decades, airborne Light Detection and Ranging (LiDAR), also referred to airborne laser scanning (ALS), is becoming one of the most common remotely-sensed data sources for forest inventory analysis [29,30,31]. LiDAR remote sensing can provide detailed and precise three-dimensional structural information of the forest area [32], thus improving the development of individual tree crowns delineation (ITCD) algorithms [4,33]. Laser-based individual tree crown delineation can reflect accurate geometrical properties of trees, such as tree height and crown diameter which cannot be affected by illumination angle and shadows on multispectral imageries [34], and become attractive techniques for both forestry and remote sensing communities [13].
According to the inputs of ITCD algorithms, LiDAR data can be mainly divided into three categories: LiDAR point cloud, LiDAR-derived raster, e.g., canopy height model (CHM), and raster-point combined data [13]. With the increased point density of LiDAR data, a growing number of ITCD studies have begun to use LiDAR point clouds directly as the data source. Point cloud-based methods take advantage of multi-return information to describe vertical characteristics under canopies [35], which cause low information loss and provide an opportunity to multi-layer forests structure modelling [36,37]. For example, Ferraz et al. [38] firstly defined forest layers and then applied a clustering method based on mean-shift algorithm using LiDAR point cloud. Vega et al. [39] developed a multi-scale dynamic segmentation method called PTrees to extract individual trees from point clouds. However, the method that focused on full exploitation of 3-D points may be currently restricted by computational burden, which is difficult to be applied broadly [40,41]. Since raster-based methods are easy to be exploited and improved by powerful knowledge-based approaches [6,13], it becomes the most commonly used method for individual tree crown delineation. CHM, a type of LiDAR-derived raster, is the dominant dataset for representing canopy surface in individual tree crown delineation [8]. Besides CHM, other LiDAR-derived datasets, such as Height-Scaled Crown Openness Index (HSCOI) and Canopy Maximum Model, were also used for ITCD [42,43]. Sometimes, researchers combined both raster and LiDAR point data for ITCD studies. For example, researchers applied CHM for the initial segmentation and subsequently refined the results using a LiDAR point cloud [4,44,45].
Recently, many ITCD methods have been developed and applied for various forests conditions [43,46,47]. Thereinto, most studies focus on coniferous forest because (1) many study area were located in high latitude regions that are dominated by coniferous forests; and (2) the basic assumption of a conical crown shape which many algorithms were developed based on is more appropriate for conifers than other forest types [11]. However, it is not easy to obtain satisfied accuracy under other forest conditions. Ke and Quackenbush [34] compared watershed segmentation, region-growing, and valley-following method for different forest types on different images and found that all methods works well on coniferous stand and have demonstrated lower accuracy for the deciduous stand on either image set. Other researchers also found that the results of individual tree crown detection are largely influenced by forest types [48,49]. Over-segmentation and under-segmentation may be greatly increased in complex and closed forests.
Majority of previous methods extracted individual tree crowns by two steps: (1) treetop detection; and (2) crown boundary delineation. Most treetop detection methods assumed that a treetop is the local maximum brightness or height value and detected individual treetops using local maxima filter. However, during treetop detection, branches, or sub-crowns of a deciduous tree may be detected as small trees (commission error), and small trees with smaller crown size or tree height than average trees tended to be omitted (omission error). To avoid issues mentioned above, researchers have developed a series of local maxima filters with variable window sizes to detect individual treetops [16,19,43]. Although local maximum filtering with variable window sizes has been widely developed and used, structure of tree crowns are not always regular and cannot be represented by a simple 2-D filtering window. In the crown delineation process, watershed segmentation and region-growing, as two of classic image segmentation methods, were often employed based on the markers produced by treetop detection [16,43]. Although, researchers have improved delineation algorithms by priori knowledge and morphology of crowns [46,50], the two-steps methods could transfer errors from treetop detection to crown boundary delineation procedure.
Researchers also developed some ITCD algorithms without prior treetop detection. For example, Jing et al. [51] segmented multispectral images at different scales by watershed algorithm and then integrated the multi-layered segments. This approach effectively reduced the over-segmentation which are caused by branches of the deciduous tree, but required the dominant tree crown sizes beforehand. Liu et al. [52] developed a boundary refining program called Fishing Net Dragging (FiND) based on watershed segmentation and used a boundary classification model to merge the adjacent segments. These approaches do not rely on prior detected treetops, but require some complicated post-process procedures.
Beyond the ITCD algorithms, accuracy assessment for ITCD studies also varies greatly, which make it difficult to compare the performance of the algorithms [35]. Some studies evaluated ITCD accuracy at both plot and individual tree level (e.g., [16,34]), while others only provided accuracy assessment at individual tree level (e.g., [52]). From two-step perspective, ITCD accuracy assessment can be divided into detection accuracy and delineation accuracy assessment. Pouliot et al. [53] proposed accuracy index (AI) to represent detection accuracy and used the root mean square error (RMSE) of the crown diameters between reference and delineated crowns for delineation accuracy. Ke et al. [11] used a confusion table to describe the detail of tree crown detection and evaluated accuracy from both producer’s and user’s perspectives. Some studies used overall accuracy that was evaluated by the number of matched reference and detected trees [4,51]. While some researchers analyzed different cases of individual tree crowns matching [51,52]. It is necessary to develop a comprehensive and stable accuracy assessment system which contains individual tree crown matching and other accuracy indices for ITCD studies.
In this study, we aimed to propose a novel ITCD algorithm for different forest types in northeastern China based on LiDAR data. The specific objectives were to (1) develop a one-step ITCD algorithm that combines the procedures of treetop detection and crown boundary delineation into an iterative process, which could utilize horizontal relationship among crowns in vertical direction to reduce commission and omission errors; (2) explore the proposed algorithm under different forest types with high canopy density, including coniferous forest, deciduous forest, and conifer-broadleaves forest, and compare it with the marker-controlled watershed algorithm; (3) combine beneficial and complementary aspects of existed accuracy assessment methods into a new ITCD accuracy assessment program to evaluate the accuracy of proposed algorithm. It could provide technical support for individual tree crown delineation in coniferous, deciduous, and mixed forests with high canopy density.
2. Materials
2.1. Study Areas
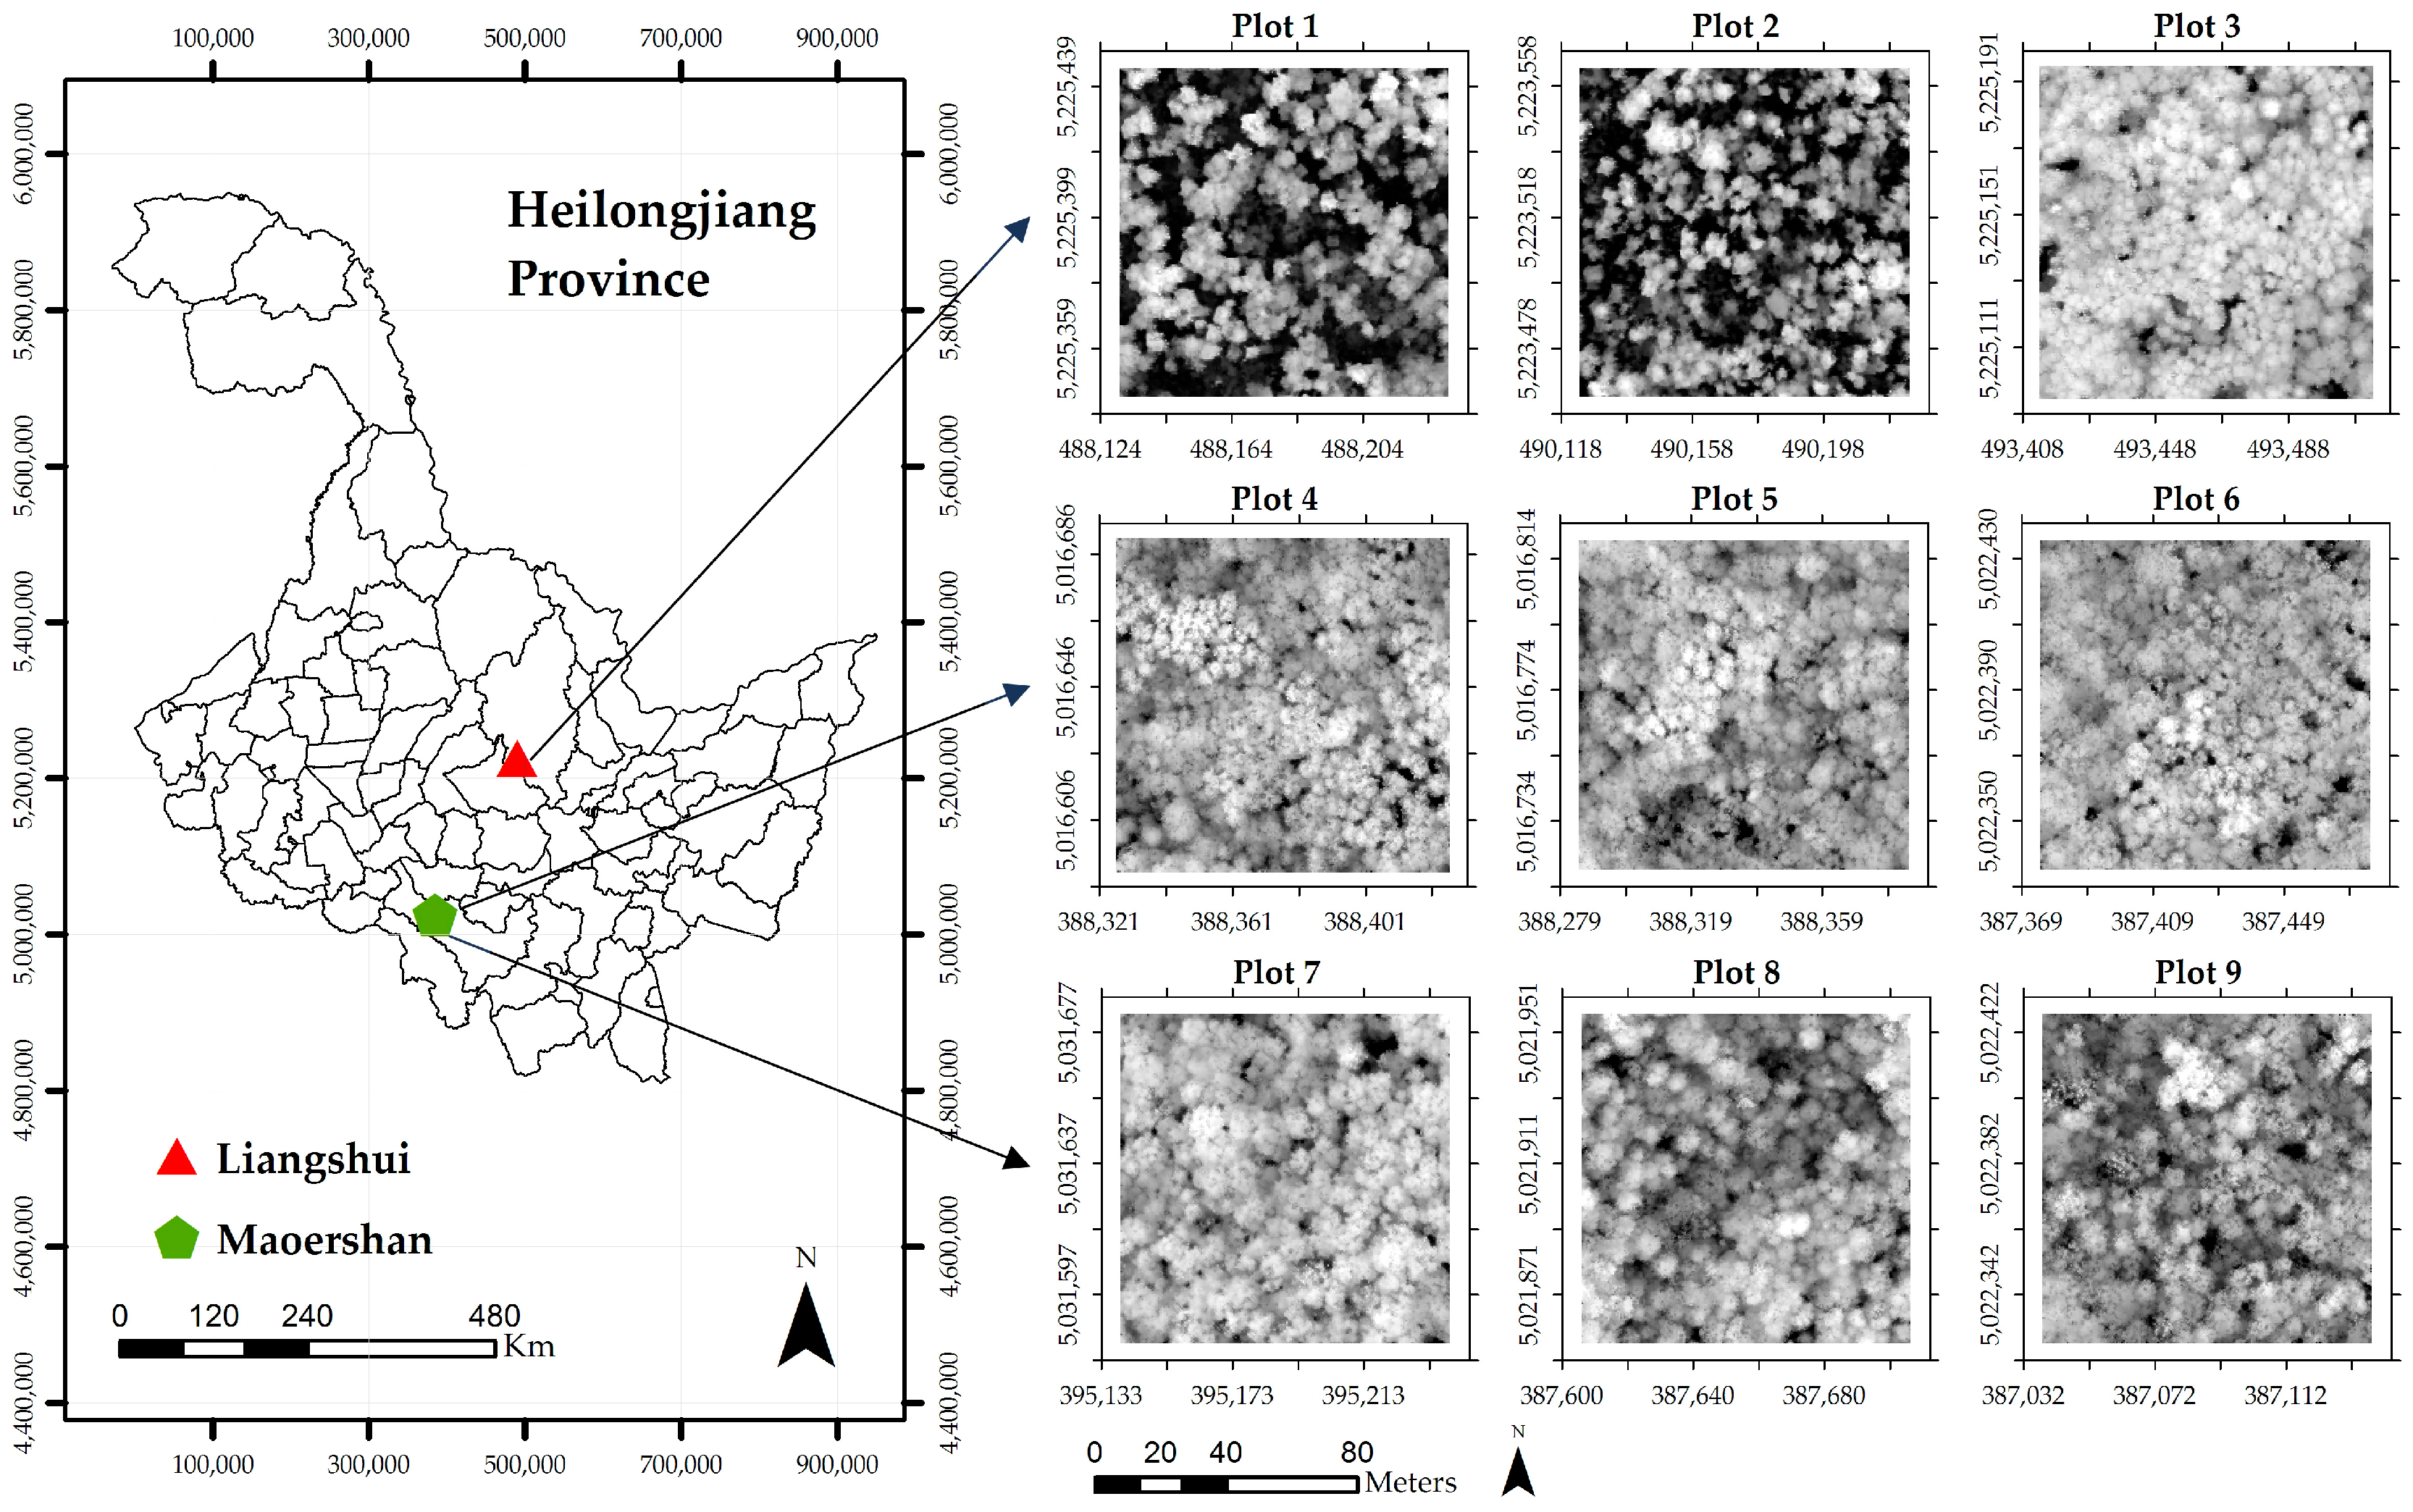
In this study, nine plots in two study areas (study area I and II) were selected according to forest types. Study area I is primary forests dominated by conifers and study area II is secondary forests dominated by deciduous forests and coniferous and broad-leaved mixed forests. Both of study areas are the typical forests in Northeastern China. All plots were set to 100 × 100 m.
Study area I (Figure 1, Liangshui) is situated in the Liangshui National Nature Reserve, Dailing district, Yichun , Helongjiang Province, China. Liangshui is geographically located at 128°47′8″–128°57′19″E, 47°6′49″–47°16′10″N, which was known as the hometown of Korean pine (Pinus koraiensis). The total area of Liangshui is 12,133 km2 with a total forest volume of 1.7 million m3 and a vegetation coverage of 98% [54]. Korean pine (Pinus koraiensis) accounts for 63.7% of forest area in this study area and other coniferous species include Korean spruce (Picea koraiensis), larch (Larix gmelinii), and fir (Abies nephrolepis). White birch (Betula platyphylla), Ussuri poplar (Populus ussuriensis), Amur corktree (Phellodendrona murense), Manchurian ash (Fraxinus mandshurica), and Manchurian walnut (Juglans mandshuria) are the most common deciduous species. Plot 1, 2, 3 are coniferous plots used in this study (Figure 1).
Study area II (Figure 1, Maoershan) is situated in the Maoershan Forest Farm, Shangzhi, Heilongjiang Province, China. Maoershan forest farm is geographically located in 127°30′–127°34′E, 45°21′–45°25′N. It is a typical natural secondary forests in the Northeast of China. The tree species mainly comprises Mongolia oak (Quercus mongolica), birch (Betula platyphylla), aspen (Populus davidiana), Hailar pine (Pinus sylvestris var. mongolica), Korean pine (Pinus koraiensis), larch (Larix gmelinii), and etc. Plots 4–6 and Plots 7–9 used in this study are conifer-deciduous mixed forests and deciduous forests, respectively (Figure 1).
2.2. LiDAR Data
The LiDAR data were acquired on September 2009 and 2015 using a LiteMapper 5600 airborne LiDAR system (Integrated Geospatial Innovations company, Kreuztal, Germany) and CAF’s LiCHy airborne observation system (The Chinese Academy of Forestry, Beijing, China) for study area I and study area II, respectively [55,56]. These two sets of LiDAR data were both acquired by the Chinese Academy of Forestry (Beijing, China) and Northeast Forestry University (Harbin, Heilongjiang, China). The characteristics of LiDAR data for these two study areas are summarized in Table 1.
2.3. Reference Data
Since it is difficult to obtain accurate field data for validation, the reference data used in this study were visually interpreted from high spatial resolution orthoimages for accuracy assessment, which was a common method used in ITCD studies (e.g., [12,16,34]). The spatial resolution of orthoimageries were 0.5 m and 0.2 m for study area I and study area II, respectively. Both of the orthoimageries had three broad spectral bands: blue (with a center wavelength of 450 nm), green (550 nm), and red (625 nm). The reference data, including treetops and tree crowns, were determined using ArcGIS 10.2.
3. Methods
3.1. Data Preprocessing
Data preprocessing in our study consisted of three steps: (1) classify the raw LiDAR point data into ground and above-ground points using TerraSolid’s TerraScan software (Terrasolid Ltd., Helsinki, Finland); (2) derive CHM using the classified point clouds, that is the difference between Digital Surface Model (DSM) and Digital Terrain Model (DTM) interpolated from surface points and ground points, respectively; (3) correct and smooth the CHM by using a pit-filling algorithm [57] and Gaussian filtering with a window size of 3 × 3 pixels.
In original CHM, some unnatural black or grey holes caused by abnormal or sudden changes of the height values exists regularly [58]. These pits may cause potential errors in the treetop detection and crown delineation [3,59]. In this study, the original CHM was filled by a semi-automated pit-filling algorithm outlined by Ben-Arie et al. [57]. Then, a Gaussian filtering with window size of 3 × 3 pixels was used for image smoothing and noise removal according to trial-and-error.
3.2. ITCD Algorithm
3.2.1. Algorithm Description
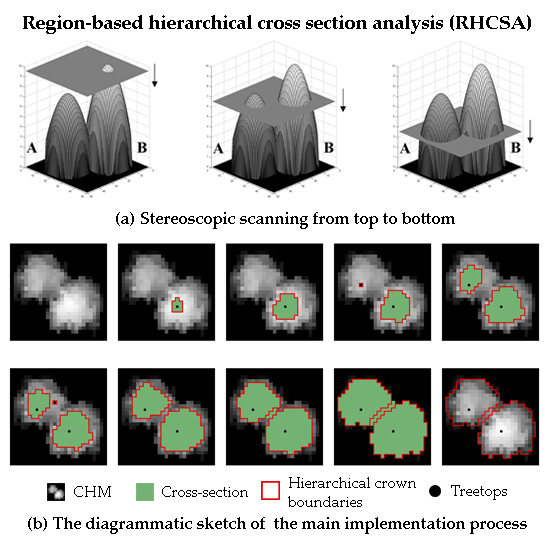
In this study, we proposed a novel method called region-based hierarchical cross-section analysis (RHCSA) based on a canopy height model (CHM) derived from airborne LiDAR data for ITCD. Like other tree crown delineation algorithms (such as watershed segment, level-set, and valley-following), this algorithm considered tree canopies as a three-dimensional topographic surface that a tree crown can be manifested as a mountain-like uplift on a CHM. A tree apex is equal to a mountaintop and the height values decrease continuously from the treetop to crown the boundary. From a three-dimensional perspective, the RHCSA algorithm vertically scanned the CHM from top to bottom by a horizontal plane, see Figure 2a–c. In the process, the higher individual tree (tree B) produced a cross-section earlier (Figure 2d) than the shorter tree (tree A). Figure 2e,f indicated that the two cross-sections dilated with the decrease of scanning height. The cross-sections of tree A and B appeared at previous step must be contained in the subsequent cross-section. Cross-sections of individual tree crown regions that do not contact with others typically appear circular, as shown in Figure 2d,e, and the cross-sections produced by multiple contacted trees often appear irregular shape, like Figure 2f.
Thus, RHCSA is a discretization method that slices the CHM by a series of equidistant horizontal planes to simulate stereoscopic scanning from top to bottom. After level cutting, a CHM was resolved into horizontal crown regions at different heights in vertical space. The nth cross-section region (CSR) in the ith layer of level cutting was defined as , and the set containing all the in ith level was defined as a . The containment relationship of among successive cutting levels can be defined as Equation (1) according to the vertical structure of raster data:
Based on the containment relationship, RHCSA automatically determined whether a was emerged for the first time, or produced by a single crown or an intersection of several crowns, then segmented the that contained more than one tree from top to bottom. In RHCSA algorithm, each level cutting represented one iteration. Individual tree crowns and treetops will be extracted completely until all iteration ends (until level cutting reach the last layer).
3.2.2. Iterative Process
In the iterative process of RHCSA algorithm, the iteration time is defined by users which can be calculated as follow:
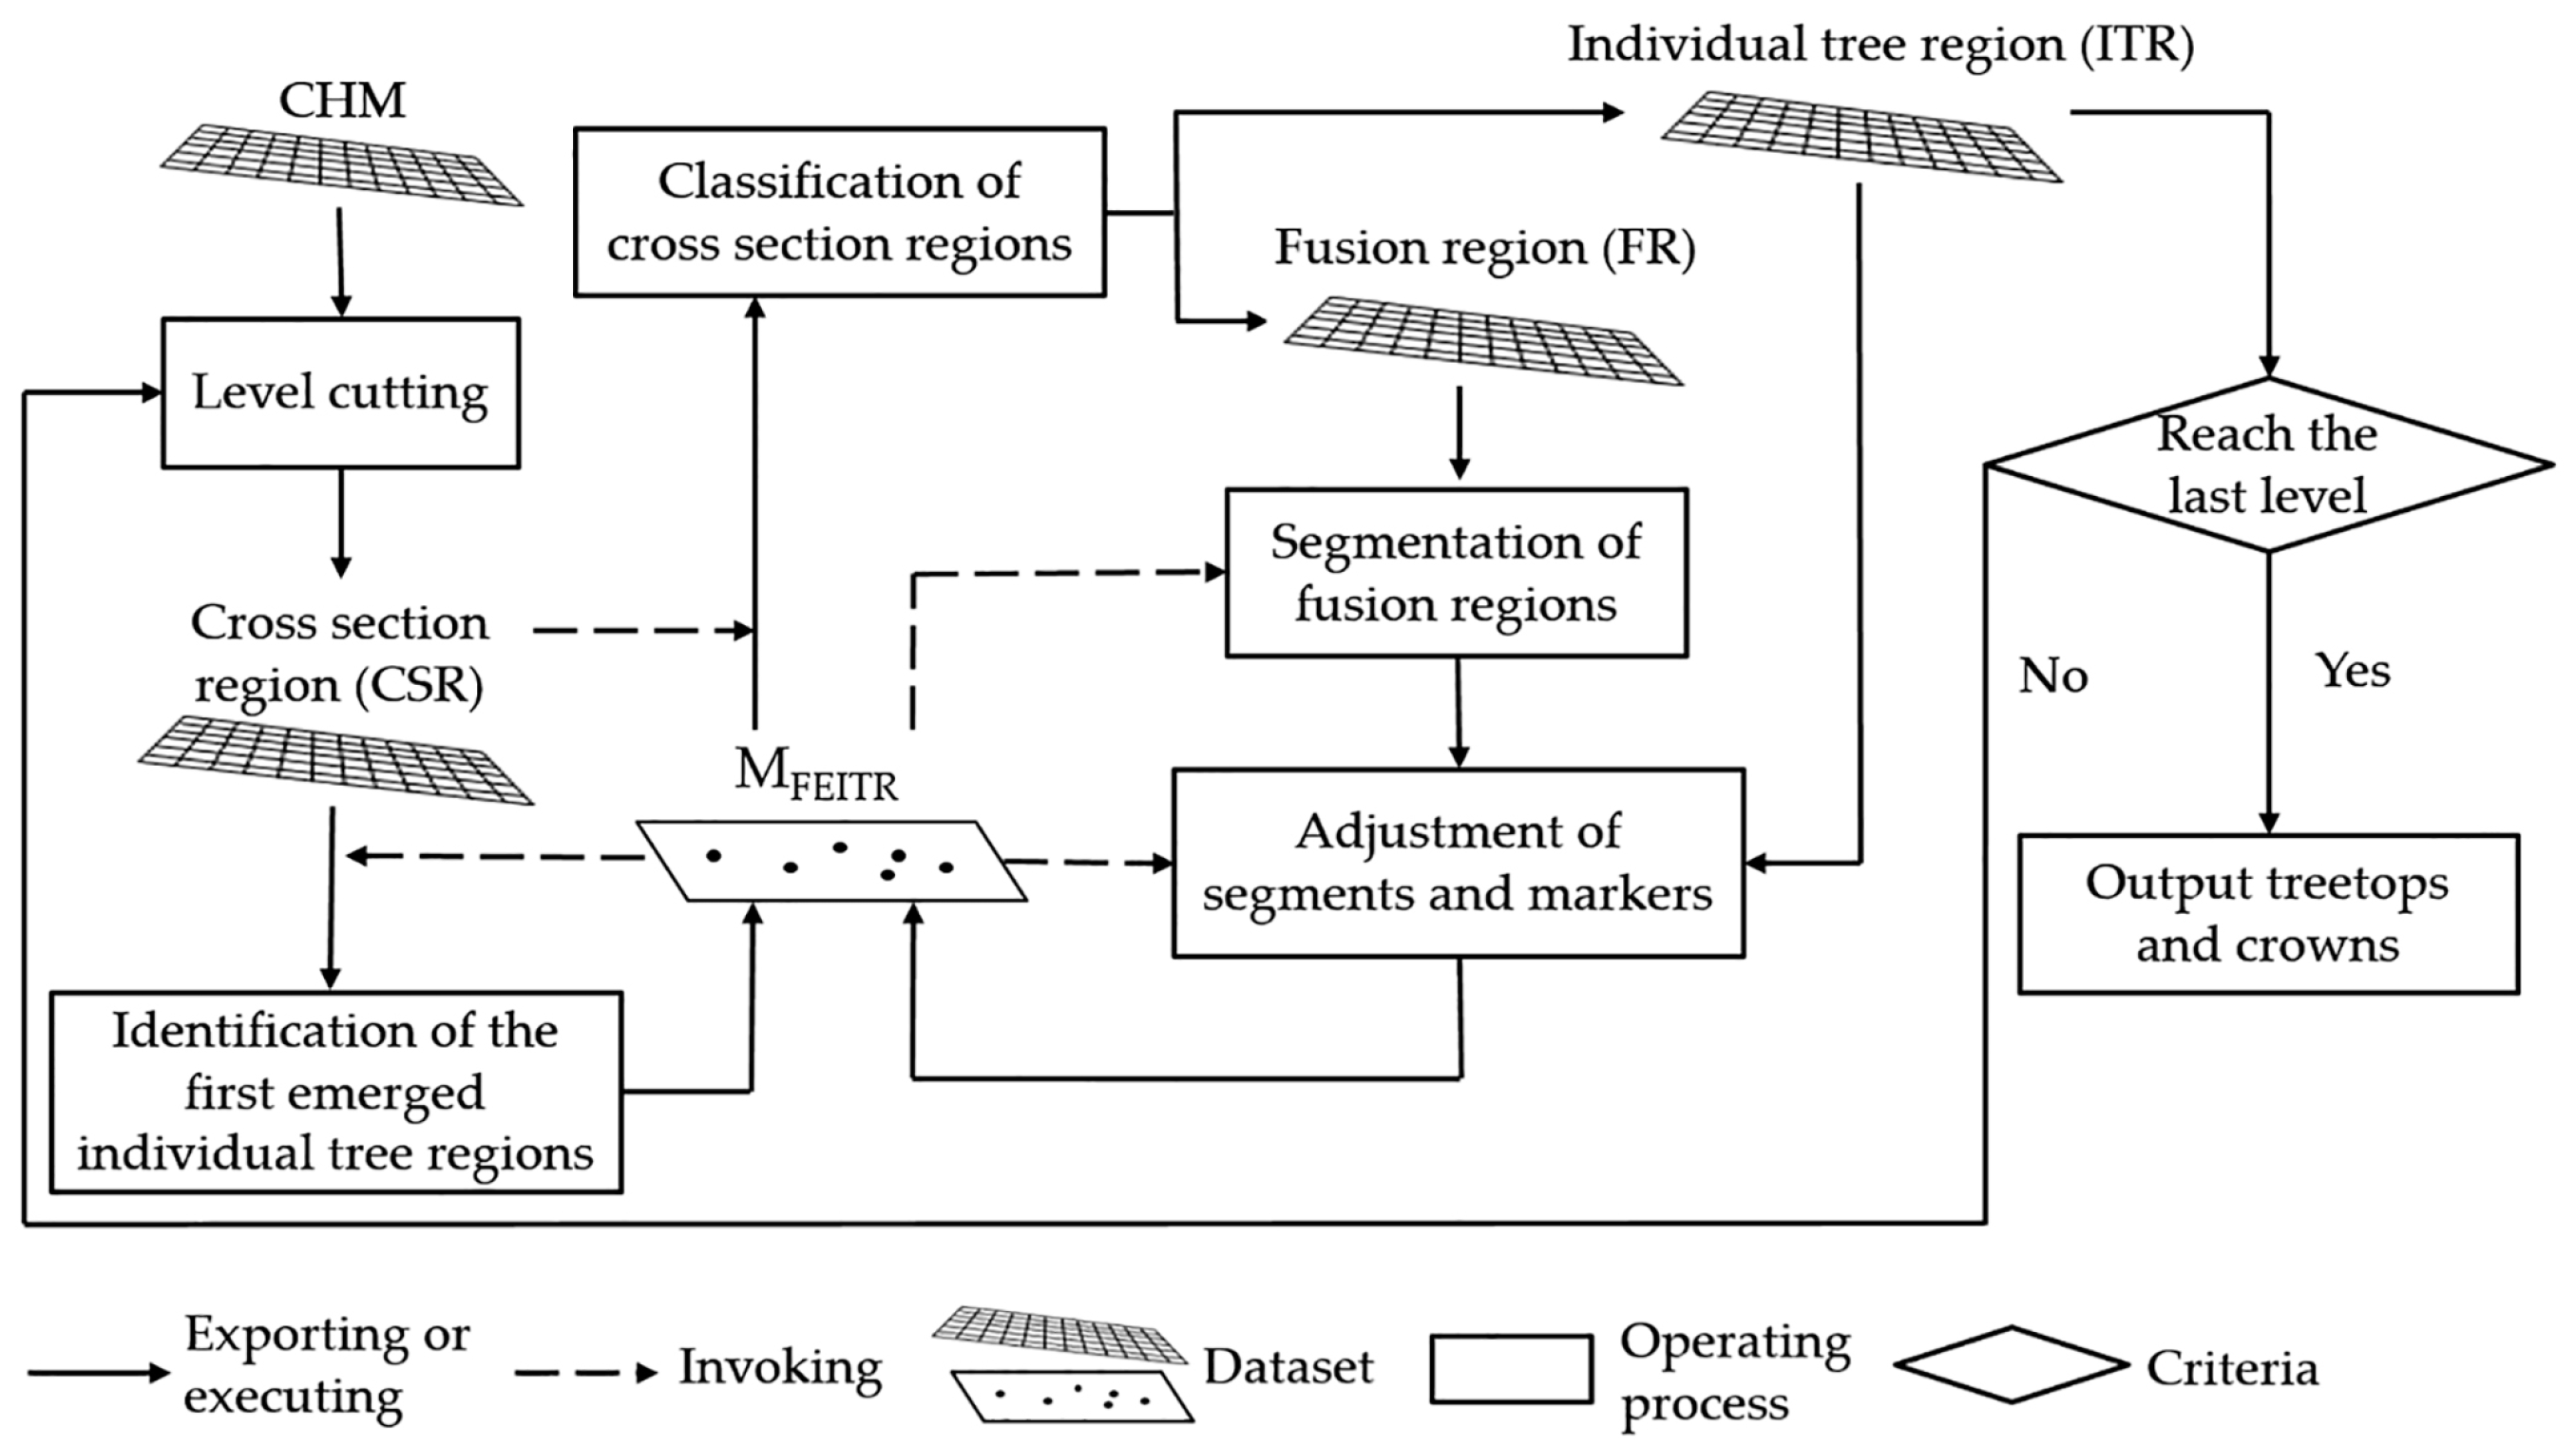
where I is the iteration time, and represent starting height and ending height in scanning process, respectively. is equal to the maxima pixel-value of the input CHM, and is a user-defined parameter which could be decided by the crown base height of study area. is the step of level cutting. The detailed of vertical crown scanning may be improved with the step subdivision, but the efficiency of this algorithm will decrease. In this study, we set up a small step of 0.1 m to make sure that no obvious uplift exists during scanning. was set to 2 m in this study in order to remove soil and grass. The iteration process of this method is illustrated in Figure 3. The main steps of one iteration are described as follows, including level cutting, identification of first emerged individual tree regions, classification of cross-section regions, segmentation of fusion regions, and adjustment of segments and markers.
• Level cutting
The iterative process started with level cutting which can be seen as an image binarization procedure at different levels. Cross-section image (CSI) produced by image binarization can be defined as Equation (3):
where means the pixel values on CHM and represents the threshold of image binarization at the ith level which can be calculated by Equation (4). On the CSI, crown regions have values of ones and non-crown regions have values of zeros. Then, cross-section regions were separated from CSI by connected-component labeling which is an algorithmic application of graph theory used in computer vision to detect connected regions in binary digital images [60].
• Identification of the first emerged individual tree regions
During top-to-bottom level cutting, an individual tree crown follows a “growing” process among levels, that is, CSR of an individual tree emerges firstly and then grows with the iterations progressing. In one iteration, we defined the that do not contain any CSR at the previous iteration () as the first emerged individual tree region (FEITR). Then, the centroid of the belonging to FEITR was defined as a marker. An overall dataset called was created to save all markers of FEITR produced at each level. is defined as Equation (5):
where is the function to determine the center of the current region, is the nth cross-section region in the ith layer of level cutting. represents intersection, and represents an empty set.
• Classification of cross-section regions
In this step, all cross-section regions were classified into two categories: individual tree region (ITR) and fusion region (FR). ITR is the cross-section region that belongs to an individual tree, and FR represents a cross-section of multiple contacted trees. According to the relationship of between and , can be classified by Equation (6):
where is the function that determines count. is the nth ITR in the ith level and is the nth FR in the ith level. When has the only one intersection with , it can be classified as , otherwise it is classified as .
• Segmentation of fusion regions
After classification of cross-section regions, we employed marker-controlled watershed segmentation to segment FRs into separated ITRs. Watershed segmentation is one of the most popular techniques for segmentation and treats each concave tree crown in the inverted CHM as a catchment basin [61]. We segmented FRs using as markers. As a result, all FRs were divided into ITRs and there is no CSR with more than one marker inside.
However, branches and sub-crowns of deciduous trees may be misclassified as FEITR markers that are included in and will cause commission errors in this step. Thus, we considered the containment relationship between and CSR and the horizontal shapes of crown regions produced by level cutting to reduce commission errors. Similar to other algorithms [15,16,51], circularity was applied as an index to reduce over-segmentation, see Equation (7):
where is the area of the and r is the largest distance between the centroid and the border of the .
At a certain height, an individual tree crown does not contract with other crowns, its cross-section usually appears circular. While a cross-section of a tree cluster is likely to be composed of overlapped circles, and the edge of the cluster also becomes somewhat lobate [51]. Thus, simple rules have been added in the segmentation process to reduce commission errors.
- (a)
- if , segment into ITRs.
- (b)
- if and , segment into ITRs.
- (c)
- if and , reclassify into a ITR.
where and are the area and circularity of the , respectively; and are thresholds of area and circularity, respectively. was designed for controlling crown area and avoiding the special condition that a CSR of a large closed tree cluster appears to be circular. In this study, was empirically set to 500 pixels. was designed to make sure that the shape of every crown is not far from circular. The parameter was set to 0.85 in this study as typical values mentioned in Wolf and Heipke [15]. The sensitivity of parameters under different forest conditions will be discussed in Section 5.2.
• Adjustment of segments and markers
After classification and segmentation of the CSR, a pixel-based binary morphology opening operation was applied to refine the crown boundaries at each level and remove the objects that are smaller than the structuring element (SE) [51]. We employed the opening operation with a disk SE width of three pixels after watershed segmentation to refine the segment boundaries and remove the irregular segment objects produced by small noise in the CHM.
During the segmentation and refinement procedure, the containment relationship between and ITR may be changed. The ITR which was directly reclassify from FR may have more than one markers. The marker in need to be adjusted before next iteration. Each individual tree crown should contain only one marker and only the highest one was preserved. Through this procedure, invalid markers (i.e., false treetops) caused by large branches and the noise in the CHM was removed efficiently. After the adjustment procedure, the RHCSA algorithm skips to the next iteration and continues level cutting the CHM.
3.2.3. Output of Individual Treetops and Crowns
According to above procedures, false treetops were removed from , which represented the set of all emerged treetops at each level. After the iteration, was the output of the detected treetops. ITR images represented the horizontal boundary of crowns at different heights. According to the containment relationship in the RHSCA algorithm, the ITR image at the last level contained all the previous ITRs and should be the output of delineated individual tree crowns.
3.3. Accuracy Assessment
Based on some existing accuracy assessment methods (e.g., [13,52]), an evaluation system was proposed to comprehensively assess the accuracy of ITCD studies. The accuracy assessment scheme started with individual tree crowns matching between delineated and reference crowns, then quantitative assessment metrics were calculated on the basis of matched crowns.
3.3.1. Individual Tree Crowns Matching
The accuracy assessment of individual tree crown delineation considers correspondence between delineated crowns and reference crowns on a location-by-location basis [11,13]. Since individual tree crowns matching may be affected by the matching order, this study defined correspondence of “individuals” from the perspectives of reference crowns and detected crowns. The reference crown perspective represents how well each reference crown was delineated, while the detected crown perspective reflects whether a detected crown is represented by reference crowns. From each perspective, different correspondences were determined by considering both the overlapped crown area and the position of treetops. The accuracy metrics from the two perspectives were defined as Table 2.
3.3.2. Quantitative Assessment
In this study, producer’s accuracy (PA) and user’s accuracy (UA) were introduced from traditional accuracy assessment of classification [26,34], corresponding to the reference crown perspective and detected crown perspective, respectively. Producer’s accuracy indicates the probability that a reference tree is correctly delineated, as defined in Equation (8). User’s accuracy indicates the probability that a delineated tree will be correctly represented by reference trees, as defined in Equation (9):
where , are the number of 1:1 matches and near-matches, respectively, from reference crown perspective. is the total number of reference crowns. , are the number of 1:1 matches and near-matches, respectively, from detected crown perspective. is the total number of detected crowns.
Overall accuracy (OA) can describe the relationship between reference crowns and detected crowns on both perspectives. In this study, overall accuracy was calculated by the harmonic mean of PA and UA, as defined in Equation (10), which was similar to the definition of F-score in previous ITCD studies [35,39].
Since 1:1 match and near-match crowns from reference and detected crown perspectives are different, we introduced an “overall match” that consider the two cases from both perspectives. In this study, if a crown belongs to a 1:1 match or near-match crown from both detected and reference crown perspectives, it is defined as an “overall match”. Detection accuracy (RMSE(P)) was defined as root mean square error (RSME) of the Euclidean distance between the reference and detected treetops of the overall match crowns [62], see (Equation (11)). Delineation accuracy (RMSE(D)) was defined as the difference of crown diameter between delineated and reference crowns [34], see (Equation (12)),
where, is the function of calculating Euclidean distance, is the total number of the overall match. and represent the position of the reference and detected treetops for the ith overall crowns, respectively. and represent the crown diameter of the reference and the delineated crowns for ith overall crown, respectively.
4. Results
4.1. Individual Tree Crowns Matching
This study conducted the proposed RHCSA algorithm in nine plots of 100 × 100 m, which belonged to coniferous forest, coniferous-broadleaved mixed forest, and deciduous forest. A total of 2768 reference crowns were manually delineated according to high spatial resolution orthoimages. A total of 2898 crowns were delineated by the proposed algorithm and slightly over-segmented reference crowns. Since both the overlapped area and treetop locations were considered in the proposed accuracy assessment approach, the number of each cases from the reference crown perspective is different from that from detected crown perspective [52]. Table 3 summarizes the result of individual tree crowns matching in the nine plots from both reference and detected crown perspectives. In the coniferous (Plots 1–3) and mixed forest plots (Plots 4–6), the numbers of reference crowns were always greater than that of detected crowns, while the results of deciduous stands are in direct contradiction. This is because deciduous trees with irregular branches tended to be over-segmented and conifers with small crowns tended to be omitted. In general, 1:1 matches are dominant in all metrics from both perspectives and the number of near-matches accounted for about 10% of the number of 1:1 matches. This illustrated that most reference crowns can be delineated well and a majority of delineated crowns can represent reference crowns. The number of “merge” errors (about 40) was much larger than that of “split” errors (about 10) in coniferous stands. In deciduous and mixed forest stands, “split” errors increased, especially in deciduous forests. However, “merge” errors of deciduous forests were much lower than that of the other two from both reference and detected crown perspectives. This is because a conifer tree that usually has a small crown tends to be merged with adjacent trees. However, deciduous trees that usually have larger crowns are not easy to be omitted. It is observed that no omission errors occurred except for Plot 3 (only two). This indicated that the RHCSA method has great potential to control omission and commission error. Due to the small number (less than five), “Multi-intersected” and “Mis-located match” were not the main errors in the nine plots, either.
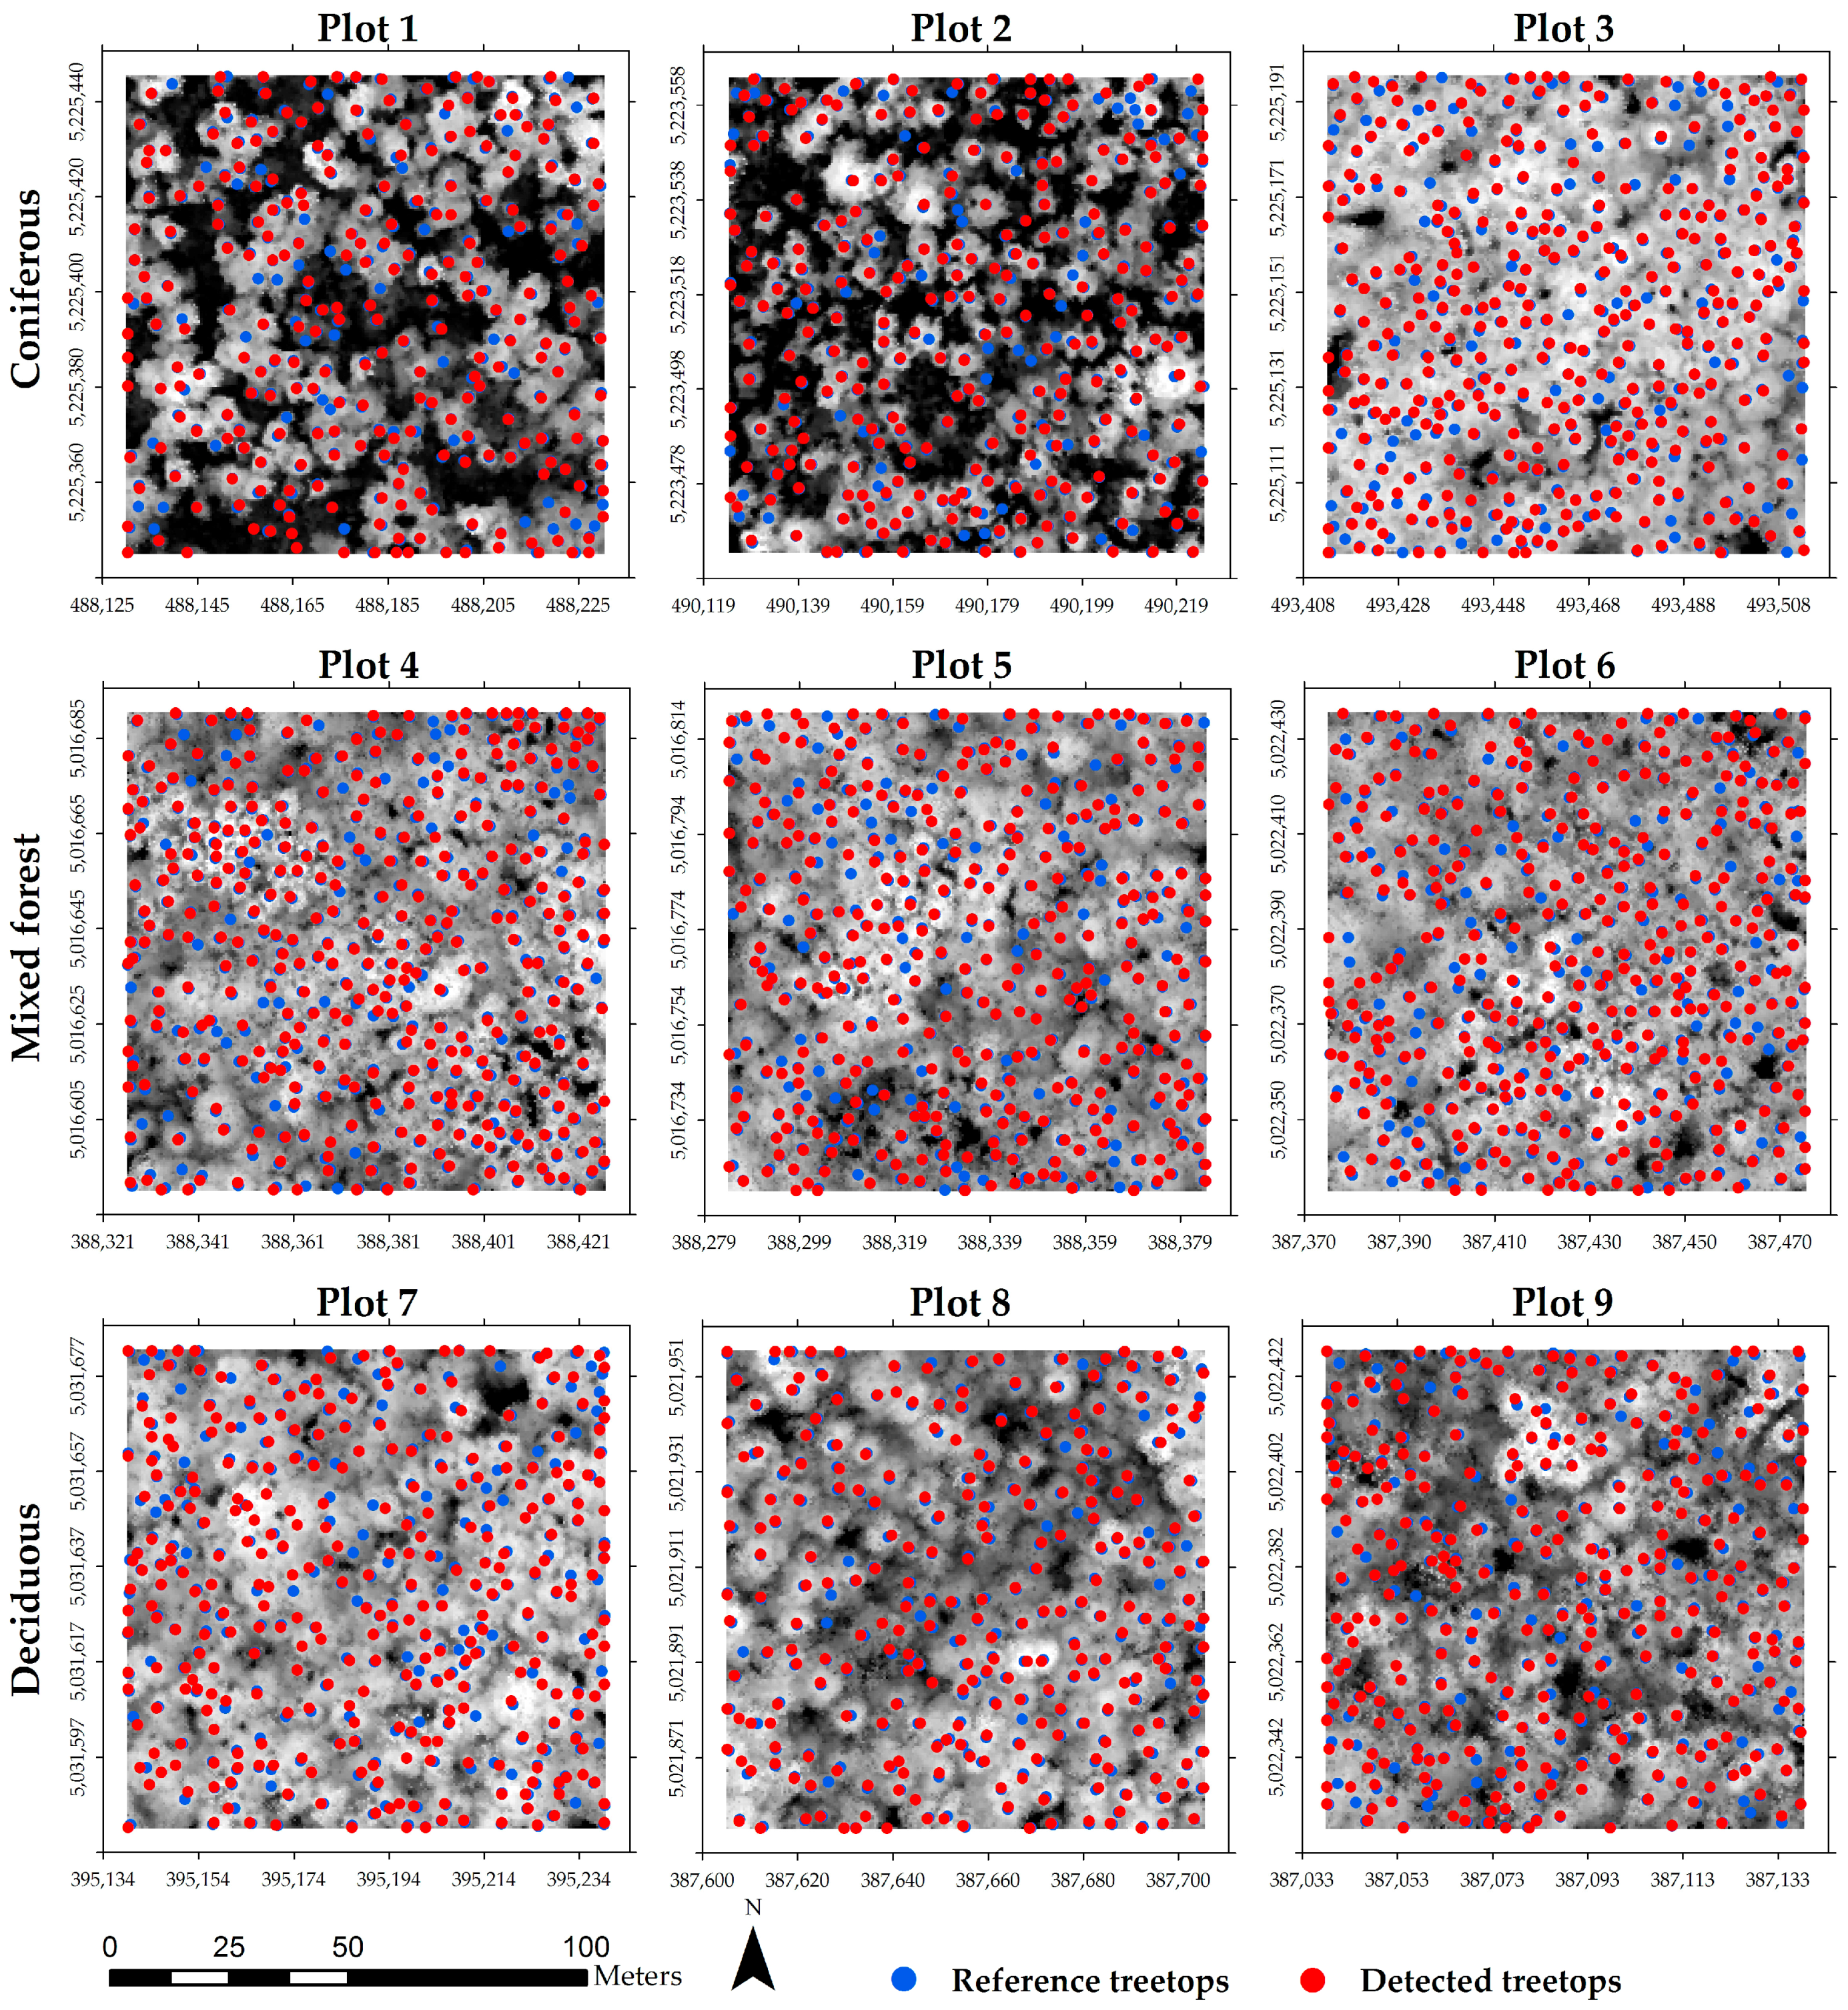
Figure 4 and Figure 5 illustrated the results of the detected individual treetops and tree crowns by the proposed methods for the nine plots. In these figures red points and blue points present detected treetops and reference treetops, respectively; red lines and blue lines represent the boundaries of detected individual tree crowns and reference individual tree crowns, respectively. The blue points that were not corresponding to red points in Figure 4 may belong to omission errors, split or multi-intersected errors. Overall, the proposed algorithm detected most individual treetops and successfully delineated most individual tree crowns in three types of forests. However, there are still some omitted trees and some over-segmented crowns in each plot.
4.2. Quantitative Assessment
Quantitative assessment based on PA, UA, OA, detection accuracy, and delineation accuracy was conducted in this study. Table 4 shows that the RHCSA method had good performances and obtained PA, UA, and OA of around 85% for all nine plots. The accuracies of mixed forest plots were highest (i.e., PA: 87.02%, UA: 85.88%, OA: 86.44%), and followed by coniferous plots (i.e., PA: 85.35%, UA: 84.91%, OA: 85.12%). The lowest accuracies were obtained in deciduous plots (i.e., PA: 85.24%, UA: 82.55%, OA: 83.87%), but still above 80%. For the detection and delineation accuracy assessment, the detection accuracy (i.e., RMSE(P)) and delineation accuracy (i.e., RMSE(D)) varied from about 0.6–1 m and about 0.5–0.7 m for nine plots, respectively. The RHCSA method could accurately describe individual tree positions and crown diameters for overall matched trees.
To further explore the performance of the RHCSA in three different forest types, ANOVA (Analysis of Variance) was conducted for the five accuracy metrics (i.e., PA, UA, OA, detection and delineation accuracy). Table 5 illustrated the means of the accuracy metrics in three forest types and the p-values of ANOVA. The null hypothesis of the ANOVA was that there was no statistically significant difference of every accuracy index among the three forest types. From Table 5, it showed that the p-values of all accuracy metrics were much greater than 0.05, which indicated that no statistically significant differences of accuracies were found among the three forest types. Thus, the proposed RHCSA algorithm had very stable performances for different forest types.
5. Discussion
5.1. Comparison with Previous Studies
According to the above results analysis, it is evident that a region-based hierarchical cross-section analysis has obtained high and consistent accuracy for all three forest types. Under the natural forest condition with high canopy density, the RHCSA method was less affected by the variation of crown size and required less prior information. From Table 5, the highest overall accuracy (86.44%) was derived from the closed coniferous-broadleaved mixed forest, which is different from the other ITCD studies where the algorithms performed well in coniferous stands [46,52]. That is because the RHCSA algorithm could detect “dumpy” protrusions on CHM and not be limited by the typical conical structures. Thus, RHCSA performed well in coniferous-broadleaved mixed forest and had stable performances for the three forest types.
For comparison, we implemented a local maxima filter (LMF) [63] and the marker-control watershed segmentation (MCWS) [43] to extract individual tree crowns in Plots 3, 6 and 9 (coniferous, mixed forest, and deciduous stands). Firstly, we adopted the same preprocessing steps as that we used in RHCSA. Secondly, 5 × 5 and 7 × 7 local maxima filters were used to detect treetops in Plots 3, 6 and 9, respectively, according to crown diameter. Then we employed a marker-control watershed segmentation using detected treetops as markers. The results are summarized in Table 6 and Table 7.
From Table 6, according to the total number of reference crowns and detected crowns, the MCWS method generally overestimated the number of individual trees. For example, the MCWS method detected 461 individual crowns, compared to 361 reference crowns in Plot 6 The counts of “split” error of MCWS were quite high from both two perspectives, especially in deciduous and mixed forest plots. Compared to the results of RHCSA method in the same plot, the number of “split” error decreased by approximately 70%. It indicated that RHCSA method can effectively reduce the over-segmentation, which was a common error for the MCWS method. This is because the RHCSA method combines the procedures of treetop detection and crown delineation into an iterative process which considers the horizontal relationship between the crowns in vertical space, instead of considering an appropriate window size for a given tree crown.
From Table 7, the overall accuracies of the RHCSA method were consistently higher than those of the MCWS method, and obtained 85.36%, 84.46%, and 83% in mixed forest, coniferous and deciduous stands, respectively. Different from the RHCSA method, the highest overall accuracy (74.35%) of the MCWS method was acquired in coniferous plot (Plot 3), and followed by mixed forest (64.29%, Plot 6) and deciduous forest (57.24%, Plot 9). The MCWS method is ideal for detecting and delineating conifers with uniform crown sizes [11] and difficult to perform well in deciduous forests because of various sizes and shapes. For detection and delineation accuracy, there was no significant difference between the two methods. Both methods could provide accurate information on tree location and crown diameter for overall matched trees (less than 1 m for detection accuracy; around 0.5 m for delineation accuracy).
To better delineate individual tree crowns, many study utilize complicated user-defined parameters in ITCD algorithms according to field or empirical data [51,64]. For example, Jing et al. [65] proposed multi-scale crown delineation method and correctly delineated 69%, 65%, and 73% of individual tree crowns in coniferous, deciduous, and mixed forests, respectively. This method had great advantages in eliminating false treetops caused by branches (commission error). However, the ITCD accuracy greatly depended on the selection of the scale. A few representative scales may not be adequate for complex forests with various trees species. In RHCSA algorithm, level cutting was applied to avoid over-segmentation caused by various crown sizes instead of scales, and no complicated parameters were required. The main parameter that directly affect the accuracy and efficiency in the RHCSA algorithm is level cutting step. The default step was set to 0.1 m which is adequate for most situations, because the horizontal shape of crowns varies little in every 0.1 m on the CHM. The efficiency of the ITCD algorithm depends on iteration times (level cutting step) and image size without the influence of the number of trees. It took about 60–70 s to complete ITCD for the each 1 ha plot, using Matlab R 2014a on a computer with a 2.5 GHz Intel Core i7-4710 HQ CPU. When we shorted the step into 0.01 m, the time consuming increased to about 600 s while the overall accuracy has an increase of only 2%. Readers could ask for the application code of the RHCSA algorithm for academic use. The sample data (Plots 3, 6 and 9) is available online for academic use (mat format).
5.2. Sensitivity Analysis of
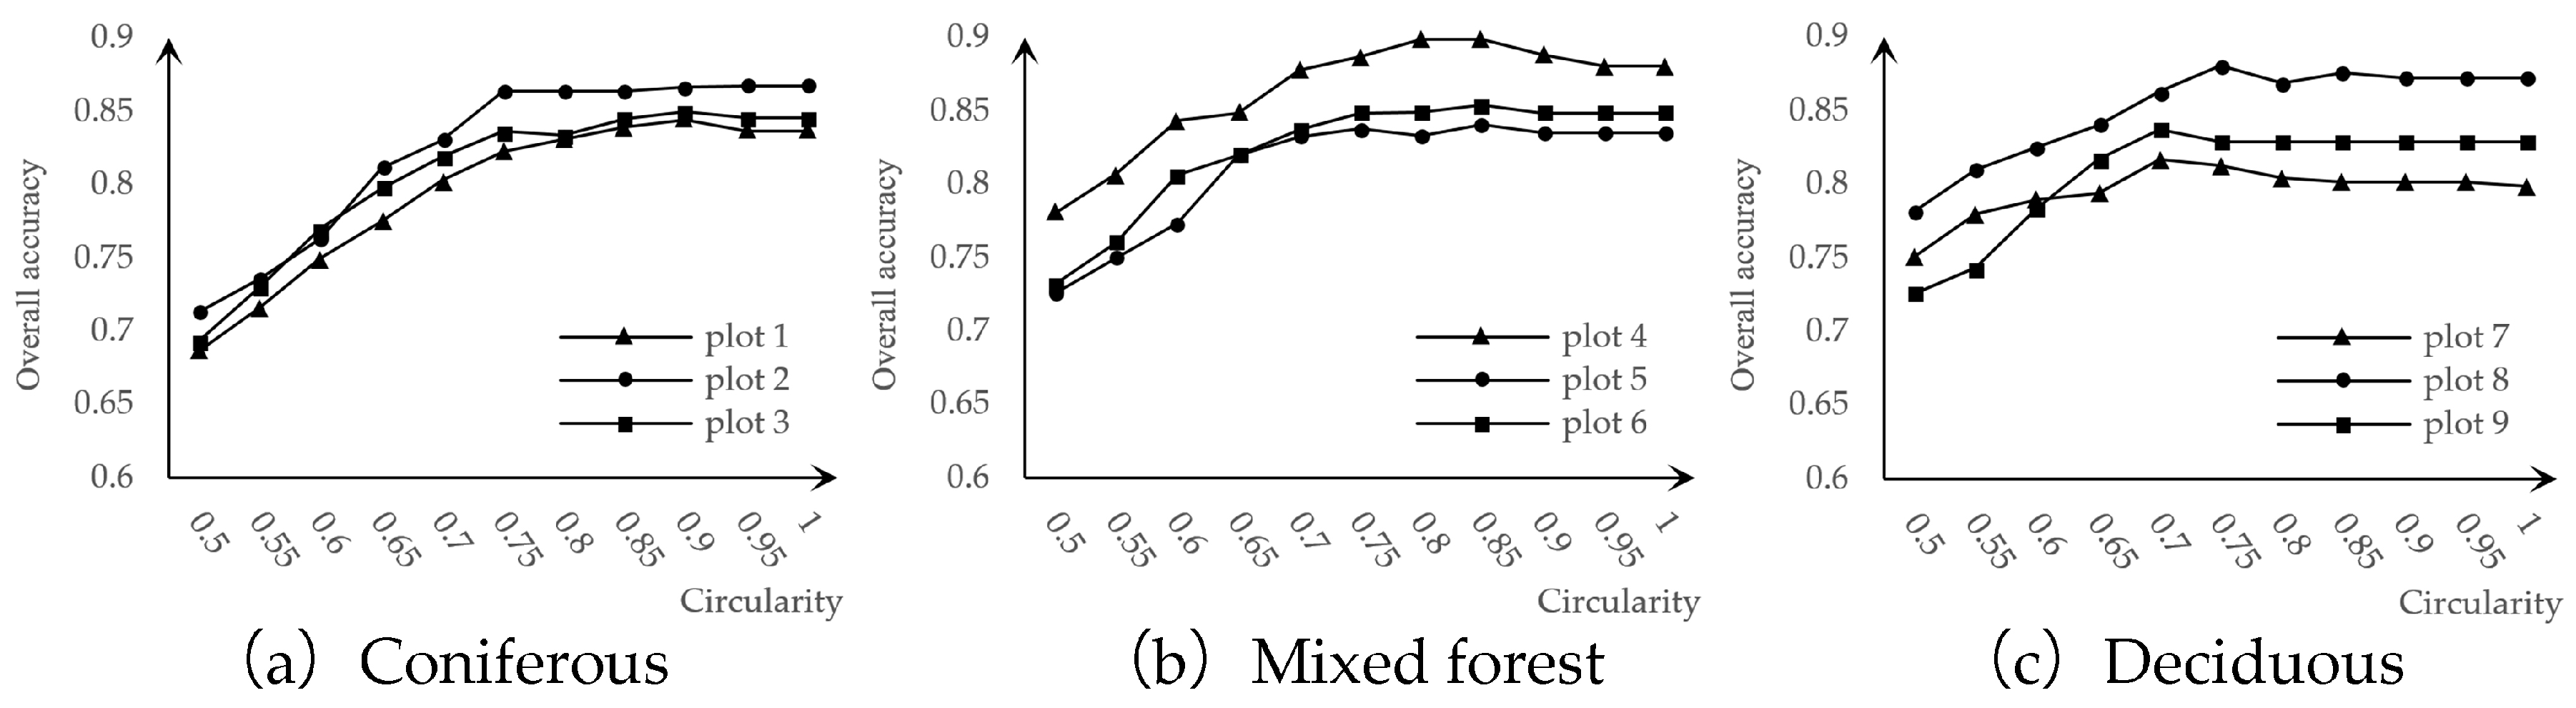
Another major parameter that affected the overall accuracy in the RHCSA algorithm was the circularity, which was applied for segmenting fusion regions in the iterative process. To further investigate the impact of circularity under different forest conditions, we adjusted the circularity threshold () from 0.5 to 1 with a step of 0.5 and analyzed the variation of overall accuracy in all plots. Figure 6 showed the impact of the circularity threshold on the overall accuracy of ITCD for three forest types. For coniferous forests, the overall accuracy increased rapidly with the increase of until reaching a sill, see Figure 6a. A small value tended to prevent fusion regions from further segmentation and resulted in more “merge” errors. Figure 6a illustrated that the with the highest overall accuracy for coniferous forests was about 0.9, which indicated that the crown of a conifer tree appears close to a circle [25]. Although the overall accuracy increased with the increase of for mixed and deciduous forests as well, the increase rates were not as high as that of coniferous forest. The that led to the peak values of the overall accuracy for mixed forest and deciduous forest were slightly lower than that for coniferous forest, that is, about 0.8–0.85 and 0.7–0.75, respectively (see Figure 6b,c). This is because that coniferous crowns are more circular than deciduous and mixed forests, while deciduous trees have larger and more irregular crowns. Although a higher could lead to higher accuracy in coniferous stands, the average circularity will decrease and a lower could obtain higher accuracy with the number of deciduous trees increased in a plot.
5.3. Limitations
Although RHCSA is a promising ITCD algorithm, several limitations still exist. First of all, RHCSA considers CHM as mountain-like topographic surfaces, some flat crowns and suppressed trees without a dominant protrusion on CHM are difficult to detect and delineate. It becomes serious when a small tree is under adjacent tree crowns and causes “merge” error. Second, since RHCSA was developed for the forests in Northeastern China, it performed well for boreal temperate forest. The performances of other forests, like bamboo forests and rainforests, are unknown due to lack of data. In the future, the RHCSA method could be validated using other types of forest data from other countries.
Additionally, the topographic effect is another factor that influenced the accuracy of the ITCD method [6,66]. Since the RHCSA algorithm detection and delineation of individual tree crowns relied on the “peak” and “valley” structures shown on CHM, it could result in errors if the structure changed due to extreme topographic factors (e.g., steep slope). However, the terrain is relatively flat in our study area, and no significant correlation was found between the slope and the overall accuracy based on correlation analysis. From a topography perspective, the RHCSA algorithm performed well for a relatively flat area. The performance influenced by other topographic factors (e.g., slope) should be investigated in the future.
6. Conclusions
Individual tree crown delineation using airborne LiDAR techniques plays a significant role in precise forestry and forest inventory and analysis. In this study, we developed a region-based hierarchical cross-section analysis (RHCSA) for treetop detection and crown delineation using LiDAR-derived CHM. This novel method used level cutting method to detect individual trees and delineate its horizontal boundaries at each level through an iterative process. The proposed algorithm is a one-step individual tree crown delineation (ITCD) algorithm with a few user-defined parameters and not influenced by treetop detection accuracy. Additionally, we also developed a comprehensive accuracy assessment scheme which could provide a guidance for ITCD studies and future applications using single tree approach.
Results showed that RHCSA method obtained stable and high accuracy for different forest types, including coniferous forest, coniferous-broadleaves forest and deciduous forest. The accuracies of mixed forest plots were highest (i.e., producer’s accuracy (PA): 87.02%, user’s accuracy (UA): 85.88%, overall accuracy (OA): 86.44%), followed by coniferous plots (i.e., PA: 85.35%, UA: 84.91%, OA: 85.12%) and deciduous plots (i.e., PA: 85.24%, UA: 82.55%, OA: 83.87%). The detection and delineation accuracy (i.e., RMSE(P) and RMSE(D)) were relatively small (less than 1 m). RHCSA method effectively improved OA by more than 10% comparing with the traditional marker-control watershed segmentation (MCWS) algorithm, especially for deciduous forest (more than 20%) and mixed forest (about 20%). Both RHCSA and MCWS algorithms could provide accurate information on tree location and crown diameter for overall matched trees (less than 1 m for detection accuracy; around 0.5 m for delineation accuracy). However, there are still some limitations in RHCSA method. Since the RHCSA process only considers the segmentation of canopy surface, some intersected crowns and small crowns under the surface are difficult to detect and delineate. Next, RHCSA has been designed and tested for boreal temperate forest. It is still necessary to investigate the performances of other forests (e.g., bamboo forests and rainforests). In addition, although it is suitable to use the RHCSA algorithm for a relatively flat area, the effect of topographic factors (e.g., slope) on accuracy should be explored in the future. In future, ITCD studies could combine basic image segmentation algorithms and tree morphological characteristics to improve the accuracy of the crown delineation based on LiDAR point cloud data.
Supplementary Materials
The following are available online at www.mdpi.com/2072-4292/9/10/1084/s1, Sample data: CHM for plots 3, 6 and 9.
Acknowledgments
This work was supported by “National Natural Science Foundation of China”, three dimensional individual tree crown delineation based on multiple remotely sensed data sources and tree competition mechanism, 31400491 and “the Fundamental Research Funds for the Central Universities”, 2572017CA02.
Author Contributions
Z.Z. contributed ideas and comments on the paper, revised the paper, supported the research as project manager; Y.H. developed the RHCSA algorithm and conducted the experiments; Y.Q. organized the experimental data; Y.Z. wrote the paper.
Conflicts of Interest
The authors declare no conflict of interest.
References
- Lee, H.; Slatton, K.C.; Roth, B.E. Adaptive clustering of airborne LiDAR data to segment individual tree crowns in managed pine forests. Int. J. Remote Sens. 2010, 31, 117–139. [Google Scholar] [CrossRef]
- Estornell, J.; Velázquezmartí, B.; Lópezcortés, I.; Salazar, D.; Fernándezsarría, A. Estimation of wood volume and height of olive tree plantations using airborne discrete-return LiDAR data. GISci. Remote Sens. 2014, 51, 17–29. [Google Scholar] [CrossRef]
- Stournara, P.; Patias, P. Automatic delineation of individual tree crowns in Calabrian pine stands of mediterranean suburban forest with high spatial resolution satellite imagery. South-East. Eur. J. Earth Obs. Geomat. 2012, 1, 27–40. [Google Scholar]
- Hu, B.; Li, J.; Jing, L. Improving the efficiency and accuracy of individual tree crown delineation from high-density LiDAR data. Int. J. Appl. Earth Obs. Geoinf. 2014, 26, 145–155. [Google Scholar] [CrossRef]
- Koch, B.; Heyder, U.; Weinacker, H. Detection of Individual Tree Crowns in Airborne LiDAR Data. Photogramm. Eng. Remote Sens. 2006, 72, 357–363. [Google Scholar] [CrossRef]
- González-Ferreiro, E.; Diéguez-Aranda, U.; Barreiro-Fernández, L. A mixed pixel- and region-based approach for using airborne laser scanning data for individual tree crown delineation in Pinus radiata D. Don plantations. Int. J. Remote Sens. 2013, 34, 7671–7690. [Google Scholar] [CrossRef]
- Næsset, E. Predicting forest stand characteristics with airborne scanning laser using a practical two-stage procedure and field data. Remote Sens. Environ. 2002, 80, 88–99. [Google Scholar] [CrossRef]
- Ene, L.; Næsset, E.; Gobakken, T. Single tree detection in heterogeneous boreal forests using airborne laser scanning and area-based stem number estimates. Int. J. Remote Sens. 2012, 33, 5171–5193. [Google Scholar] [CrossRef]
- Unger, D.R.; Hung, I.; Brooks, R. Estimating number of trees, tree height and crown width using LiDAR data. GISci. Remote Sens. 2014, 51, 227–238. [Google Scholar] [CrossRef]
- Lee, S.; Kim, J.; Choi, Y. The extraction of forest CO2 storage using high resolution airborne LiDAR data. GISci. Remote Sens. 2013, 50, 154–171. [Google Scholar]
- Ke, Y.; Quackenbush, L.J. A review of methods for automatic individual tree-crown detection and delineation from passive remote sensing. Int. J. Remote Sens. 2011, 32, 4725–4747. [Google Scholar] [CrossRef]
- Wu, B.; Yu, B.; Wu, Q. Individual tree crown delineation using localized contour tree method and airborne LiDAR data in coniferous forests. Int. J. Appl. Earth Obs. Geoinf. 2016, 52, 82–94. [Google Scholar] [CrossRef]
- Zhen, Z.; Quackenbush, L.J.; Zhang, L. Trends in automatic individual tree crown detection and delineation—evolution of LiDAR data. Remote Sens. 2016, 8, 333. [Google Scholar] [CrossRef]
- Pitt, D.G.; Glover, G.R. Large-scale 35-mm aerial photographs for assessment of vegetation–management research plots in eastern Canada. Can. J. For. Res. 1993, 23, 2159–2169. [Google Scholar] [CrossRef]
- Wolf, B.; Heipke, C. Automatic extraction and delineation of single trees from remote sensing data. Mach. Vis. Appl. 2007, 18, 317–330. [Google Scholar] [CrossRef]
- Zhen, Z.; Quackenbush, L.; Zhang, L. Impact of Tree-oriented growth order in marker-controlled region growing for individual tree crown delineation using airborne laser scanner (ALS) data. Remote Sens. 2014, 6, 555–579. [Google Scholar] [CrossRef]
- Pitkänen, J. Individual tree detection in digital aerial images by combining locally adaptive binarization and local maxima methods. Can. J. For. Res. 2001, 31, 832–844. [Google Scholar] [CrossRef]
- Wulder, M.; Niemann, K.O.; Goodenough, D.G. Local maximum filtering for the extraction of tree locations and basal area from high spatial resolution imagery. Remote Sens. Environ. 2000, 73, 103–114. [Google Scholar] [CrossRef]
- Popescu, S.C. Seeing the Trees in the Forest: Using LiDAR and Multispectral Data Fusion with Local Filtering and Variable Window Size for Estimating Tree Height. Photogramm. Eng. Remote Sens. 2004, 70, 589–604. [Google Scholar] [CrossRef]
- Gougeon, F.A.; Leckie, D.G. The individual tree crown approach applied to Ikonos images of a coniferous plantation area. Photogramm. Eng. Remote Sens. 2006, 72, 1287–1297. [Google Scholar] [CrossRef]
- Leckie, D.G.; Gougeon, F.A.; Tinis, S.; Nelson, T.; Burnett, C.N.; Paradine, D. Automated tree recognition in old growth conifer stands with high resolution digital imagery. Remote Sens. Environ. 2005, 94, 311–326. [Google Scholar] [CrossRef]
- Gougeon, F.A. A Crown-Following Approach to the Automatic Delineation of Individual Tree Crowns in High Spatial Resolution Aerial Images. Can. J. For. Res. 1995, 21, 274–284. [Google Scholar] [CrossRef]
- Culvenor, D.S. TIDA: An algorithm for the delineation of tree crowns in high spatial resolution remotely sensed imagery. Comput. Geosci. 2002, 28, 33–44. [Google Scholar] [CrossRef]
- Hirschmugl, M.; Ofner, M.; Raggam, J.; Schardt, M. Single tree detection in very high resolution remote sensing data. Remote Sens. Environ. 2007, 110, 533–544. [Google Scholar] [CrossRef]
- Wang, L.; Gong, P.; Biging, G.S. Individual tree-crown delineation and treetop detection in high-spatial-resolution aerial imagery. Photogramm. Eng. Remote Sens. 2004, 70, 351–357. [Google Scholar] [CrossRef]
- Lamar, W.R.; Mcgraw, J.B.; Warner, T.A. Multitemporal censusing of a population of eastern hemlock (Tsuga canadensis L.) from remotely sensed imagery using an automated segmentation and reconciliation procedur. Remote Sens. Environ. 2005, 94, 133–143. [Google Scholar] [CrossRef]
- Chang, A.; Eo, Y.; Kim, Y.; Kim, Y. Identification of individual tree crowns from LiDAR data using a circle fitting algorithm with local maxima and minima filtering. Remote Sens. Lett. 2013, 4, 29–37. [Google Scholar] [CrossRef]
- Lichstein, J.W.; Dushoff, J.; Ogle, K. Unlocking the forest inventory data: relating individual tree performance to unmeasured environmental factors. Ecol. Appl. 2010, 20, 684–699. [Google Scholar] [CrossRef] [PubMed]
- Hyyppä, J.; Hyyppä, H.; Leckie, D.; Gougeon, F.; Yu, X.; Maltamo, M. Review of methods of small-footprint airborne laser scanning for extracting forest inventory data in boreal forests. Int. J. Remote Sens. 2008, 29, 1339–1366. [Google Scholar] [CrossRef]
- Lim, K.; Treitz, P.; Wulder, M.; St-Onge, B.; Flood, M. LiDAR remote sensing of forest structure. Prog. Phys. Geogr. 2003, 27, 88–106. [Google Scholar] [CrossRef]
- Manzanera, J.A.; Garcíaabril, A.; Pascual, C. Fusion of airborne LiDAR and multispectral sensors reveals synergic capabilities in forest structure characterization. GISci. Remote Sens. 2016, 53, 723–738. [Google Scholar] [CrossRef]
- Sačkov, I.; Smreček, R.; Tuček, J. Forest transportation survey based on airborne laser scanning data and GIS analyses. GISci. Remote Sens. 2014, 51, 83–98. [Google Scholar] [CrossRef]
- Barnes, C.; Balzter, H.; Barrett, K.; Eddy, J.; Milner, S.; Suárez, J.C. Individual Tree Crown Delineation from Airborne Laser Scanning for Diseased Larch Forest Stands. Remote Sens. 2017, 9, 231. [Google Scholar] [CrossRef]
- Ke, Y.; Quackenbush, L.J. A comparison of three methods for automatic tree crown detection and delineation methods from high spatial resolution imagery. Int. J. Remote Sens. 2011, 32, 3625–3647. [Google Scholar] [CrossRef]
- Li, W.; Guo, Q.; Jakubowski, M.K.; Kelly, M. A new method for segmenting individual trees from the LiDAR point cloud. Photogramm. Eng. Remote Sens. 2012, 78, 75–84. [Google Scholar] [CrossRef]
- Yao, W.; Krull, J.; Krzystek, P. Sensitivity analysis of 3D individual tree detection from LiDAR point clouds of temperate forests. Forests 2014, 5, 1122–1142. [Google Scholar] [CrossRef]
- Jakubowski, M.K.; Li, W.; Guo, Q.; Kelly, M. Delineating Individual Trees from LiDAR Data: A Comparison of Vector- and Raster-based Segmentation Approaches. Remote Sens. 2013, 5, 4163–4186. [Google Scholar] [CrossRef]
- Ferraz, A.; Bretar, F.; Jacquemoud, S.; Goncalves, G.; Pereira, L.; Tomé, M.; Soares, P. 3-D mapping of a multi-layered Mediterranean forest using ALS data. Remote Sens. Environ. 2012, 121, 210–223. [Google Scholar] [CrossRef]
- Vega, C.; Hamrouni, A.; Mokhtari, S.E.; Morel, J.; Bock, J.; Renaud, J.-P.; Bouvier, M.; Durrieu, S. PTrees: A point-based approach to forest tree extraction from LiDAR data. Int. J. Appl. Earth Obs. Geoinf. 2014, 33, 98–108. [Google Scholar] [CrossRef]
- Zhao, D.; Pang, Y.; Li, Z.Y.; Liu, L.J. Isolating individual trees in a closed coniferous forest using small footprint LiDAR data. Int. J. Remote Sens. 2014, 35, 7199–7218. [Google Scholar] [CrossRef]
- Koch, B.; Kattenborn, T.; Straub, C.; Vauhkonen, J. Segmentation of Forest to Tree Objects. In Forestry Applications of Airborne Laser Scanning, 2nd ed.; Maltamo, M., Næsset, E., Vauhkonen, J., Eds.; Springer: Dordrecht, The Netherlands, 2014; Chapter 5; pp. 89–112. [Google Scholar]
- Lee, A.C.; Lucas, R.M. A LiDAR-derived canopy density model for tree stem and crown mapping in Australian forests. Remote Sens. Environ. 2007, 111, 493–518. [Google Scholar] [CrossRef]
- Chen, Q.; Baldocchi, D.; Gong, P.; Kelly, M. Isolating individual trees in a Savanna woodland using small footprint LiDAR data. Photogramm. Eng. Remote Sens. 2006, 72, 923–932. [Google Scholar] [CrossRef]
- Reitberger, J.; Schnörr, Cl.; Krzystek, P.; Stilla, U. 3D segmentation of single trees exploiting full waveform LiDAR data. ISPRS J. Photogramm. 2009, 64, 561–574. [Google Scholar] [CrossRef]
- Duncanson, L.I.; Cook, B.D.; Hurtt, G.C.; Dubayah, R.O. An efficient, multi-layered crown delineation algorithm for mapping individual tree structure across multiple ecosystem. Remote Sens. Environ. 2014, 154, 378–386. [Google Scholar] [CrossRef]
- Solberg, S.; Næsset, E.; Bollandsas, O.M. Single tree segmentation using airborne laser scanner data in a structurally heterogeneous spruce forest. Photogramm. Eng. Remote Sens. 2006, 72, 1369–1378. [Google Scholar] [CrossRef]
- Heinzel, J.; Koch, B. Investigating multiple data sources for tree species classification in temperate forest and use for single tree delineation. Int. J. Appl. Earth Obs. Geoinf. 2012, 18, 101–110. [Google Scholar] [CrossRef]
- Vauhkonen, J.; Ene, L.; Gupta, S. Comparative testing of single-tree detection algorithms under different types of forest. Forestry 2012, 85, 27–40. [Google Scholar] [CrossRef]
- Larsen, M.; Eriksson, M.; Descombes, X.; Perrin, G.; Brandtberg, T.; Gougeon, F.A. Comparison of six individual tree crown detection algorithms evaluated under varying forest conditions. Int. J. Remote Sens. 2011, 32, 5827–5852. [Google Scholar] [CrossRef]
- Fang, F.; Im, J.; Lee, J.; Kim, K. An improved tree crown delineation method based on live crown ratios from airborne LiDAR data. GISci. Remote Sens. 2016, 53, 402–419. [Google Scholar] [CrossRef]
- Jing, L.; Hu, B.; Noland, T.; Li, J. An individual tree crown delineation method based on multi-scale segmentation of imagery. ISPRS J. Photogramm. 2012, 70, 88–98. [Google Scholar] [CrossRef]
- Liu, T.; Im, J.; Quackenbush, L.J. A novel transferable individual tree crown delineation model based on Fishing Net Dragging and boundary classification. ISPRS J. Photogramm. 2015, 110, 34–47. [Google Scholar] [CrossRef]
- Pouliot, D.A.; King, D.J.; Bell, F.W.; Pitt, D.G. Automated tree crown detection and delineation in high-resolution digital camera imagery of coniferous forest regeneration. Remote Sens. Environ. 2002, 82, 322–334. [Google Scholar]
- Zhen, Z.; Li, F.; Liu, Z.; Liu, C.; Zhao, Y.; Ma, Z.; Zhang, L. Geographically local modeling of occurrence, count, and volume of downwood in Northeast China. Appl. Geogr. 2013, 37, 114–126. [Google Scholar] [CrossRef]
- Hug, C.; Ullrich, A.; Grimm, A. Litemapper 5600 a waveform-digitizing LiDAR terrain and vegetation mapping system. Int. Arch. Photogramm. Remote Sens. Spat. Inf. Sci. 2004, XXXVI, 24–29. [Google Scholar]
- Pang, Y.; Li, Z.; Ju, H.; Lu, H.; Jia, W.; Si, L.; Guo, Y.; Liu, Q.; Li, S.; Liu, L.; et al. LiCHy: The CAF’s LiDAR, CCD and Hyperspectral Integrated Airborne Observation System. Remote Sens. 2016, 8, 398. [Google Scholar] [CrossRef]
- Ben-Arie, J.R.; Hay, G.J.; Powers, R.P.; Castilla, G.; St-Onge, B. Development of a pit filing algorithm for LiDAR canopy height models. Comput. Geosci. 2009, 35, 1940–1949. [Google Scholar] [CrossRef]
- Zhao, D.; Pang, Y.; Li, Z.Y.; Sun, G.Q. Filling invalid values in a LiDAR-derived canopy height model with morphological crown control. Int. J. Remote Sens. 2013, 34, 4636–4654. [Google Scholar] [CrossRef]
- Khosravipour, A.; Skidmore, A.K.; Isenburg, M.; Wang, T.; Hussin, Y.A. Generating pit-free canopy height models from airborne LiDAR. Photogramm. Eng. Remote Sens. 2014, 80, 863–872. [Google Scholar] [CrossRef]
- Haralick, R.M.; Shapiro, L.G. Computer and Robot Vision, Volume I; Addison-Wesley: Boston, MA, USA, 1992; pp. 28–48. [Google Scholar]
- Zhao, K.; Popescu, S. Hierarchical Watershed Segmentation of Canopy Height Model for Multi-Scale Forest Inventory. In Proceedings of the ISPRS Workshop on Laser Scanning 2007 and SilviLaser 2007, Espoo, Finland, 12–14 September 2007. [Google Scholar]
- Korpela, I.; Anttila, P.; Pitkänen, J. The performance of a local maxima method for detecting individual tree tops in aerial photographs. Int. J. Remote Sens. 2006, 27, 1159–1175. [Google Scholar] [CrossRef]
- Hyyppä, J.; Kelle, O.; Lehikoinen, M.; Inkinen, M. A segmentation-based method to retrieve stem volume estimates from 3D tree height models produced by laser scanners. IEEE Trans. Geosci. Remote Sens. 2001, 39, 969–975. [Google Scholar] [CrossRef]
- Strîmbu, V.F.; Strîmbu, B.M. A graph-based segmentation algorithm for tree crown extraction using airborne LiDAR data. ISPRS J. Photogramm. 2015, 104, 30–43. [Google Scholar] [CrossRef]
- Jing, L.; Hu, B.; Li, J.; Noland, T. Automated delineation of individual tree crowns from LiDAR data by multi-scale analysis and segmentation. Photogramm. Eng. Remote Sens. 2012, 78, 1275–1284. [Google Scholar] [CrossRef]
- Khosravipour, A.; Skidmore, A.K.; Wang, T.; Isenburg, M.; Khoshelham, K. Effect of slope on treetop detection using a LiDAR canopy height model. ISPRS J. Photogramm. Remote Sens. 2015, 104, 44–52. [Google Scholar] [CrossRef]
Figure 1.
Study area located in Liangshui and Maoershan, Heilongjiang Province, China. Plots 1–3 are coniferous plots; Plots 4–5 are conifer-deciduous mixed plots; Plots 7–9 are deciduous plots. (Projected coordinate system: WGS_1984_UTM_Zone_52N; Projection: Transverse_Mercator).
Figure 1.
Study area located in Liangshui and Maoershan, Heilongjiang Province, China. Plots 1–3 are coniferous plots; Plots 4–5 are conifer-deciduous mixed plots; Plots 7–9 are deciduous plots. (Projected coordinate system: WGS_1984_UTM_Zone_52N; Projection: Transverse_Mercator).

Figure 2.
A 3D schematic diagram of RHCSA algorithm based on a CHM containing tree A and tree B. (a–c) represents vertical scanning process on CHM; (d–f) are the corresponding cross-sections produced from (a) to (c), respectively.
Figure 2.
A 3D schematic diagram of RHCSA algorithm based on a CHM containing tree A and tree B. (a–c) represents vertical scanning process on CHM; (d–f) are the corresponding cross-sections produced from (a) to (c), respectively.

Figure 3.
Workflow of the RHCSA algorithm.

Figure 4.
Detected treetops using the RHCSA algorithm for all nine plots, which was set to 0.85. The blue points represent reference treetops and the red points represent detected treetops.
Figure 4.
Detected treetops using the RHCSA algorithm for all nine plots, which was set to 0.85. The blue points represent reference treetops and the red points represent detected treetops.

Figure 5.
Detected tree crowns using the RHCSA algorithm for all nine plots, which was set to 0.85. The blue boundaries represent reference crowns and the red boundaries represent detected crowns.
Figure 5.
Detected tree crowns using the RHCSA algorithm for all nine plots, which was set to 0.85. The blue boundaries represent reference crowns and the red boundaries represent detected crowns.

Figure 6.
The impact of on the overall accuracy of ITCD in three forest types: (a) coniferous forest, (b) coniferous-broadleaved mixed forest, and (c) deciduous forest.
Figure 6.
The impact of on the overall accuracy of ITCD in three forest types: (a) coniferous forest, (b) coniferous-broadleaved mixed forest, and (c) deciduous forest.


Table 1.
Characteristics of LiDAR data used for two study areas.
| Characteristics | Study Area I | Study Area II |
|---|---|---|
| LiDAR sensor | Riegl LMS-Q560 | Riegl LMS-Q680i |
| Flying altitude AGL | 1000 m | 1200 m |
| Scan angle range | ±30° | ±30° |
| Laser beam divergence | 0.5 mrad | 0.5 mrad |
| Laser wavelength | 1550 nm | 1550 nm |
| Laser pulse length | 3.5 ns | 3 ns |
| Total coverage area | 200 km2 | 360 km2 |
| Point density | >2 pts/m2 (max: 8 pts/m2) | >2 pts/m2 (max: 10 pts/m2) |
Table 2.
Summary of accuracy metrics for individual tree crowns matching from reference crown and detected crown perspectives.
Table 2.
Summary of accuracy metrics for individual tree crowns matching from reference crown and detected crown perspectives.
| Perspective | Accuracy Metrics | Descriptions 1 |
|---|---|---|
| Reference crown perspective | 1:1 match | Only one DetT inside a RefC, O is greater than 50% of both area of DetC and RefC |
| Near-match | Only one DetT inside a RefC, O is greater than 50% of the area of DetC or RefC | |
| Split | More than one DetT inside a RefC, O is greater than 50% of RefC area | |
| Merge | No DetT inside a RefC, O is greater than 50% of RefC area | |
| Multi-intersected | More than one DetT inside a RefC, O is less than 50% of RefC area | |
| Mis-located match | Only one DetT inside a RefC, O is less than 50% of both area of DetC and RefC | |
| Omission | No DetT inside a RefC, O is less than 50% of both area of DetC and RefC | |
| Detected crown perspective | 1:1 match | Only one RefT inside a DetC, O is greater than 50% of both area of DetC and RefC |
| Near-match | Only one RefT inside a DetC, O is greater than 50% of the area of DetC or RefC | |
| Split | No RefT inside a DetC, O is greater than 50% of DetC area | |
| Merge | More than one RefT inside a DetC, O is greater than 50% of DetC area | |
| Multi-intersected | More than one RefT inside a DetC, O is less than 50% of both area of DetC and RefC | |
| Mis-located match | Only one RefT inside a DetC, O is less than 50% of both area of DetC and RefC | |
| Commission | No RefT inside a DetC, O is less than 50% of both area of DetC and RefC |
1 DetT: detected treetop; DetC: detected crown; RefT: reference treetop; RefC: reference crown; O: the overlapped area between delineated crown and reference crown.
Table 3.
Accuracy assessment of individual tree crowns matching on both reference and detected crown perspectives using RHCSA method.
Table 3.
Accuracy assessment of individual tree crowns matching on both reference and detected crown perspectives using RHCSA method.
| Forest Type | Plot | Perspective 1 | 1:1 Match | Near-Match | Split | Merge | Multi-Intersected | Mis-Located Match | Omission/Commission | Total 2 |
|---|---|---|---|---|---|---|---|---|---|---|
| Coniferous | Plot 1 | RCP | 212 | 28 | 2 | 37 | 1 | 0 | 0 | 280 |
| DCP | 198 | 12 | 3 | 31 | 0 | 0 | 8 | 252 | ||
| Plot 2 | RCP | 224 | 30 | 1 | 42 | 1 | 0 | 0 | 298 | |
| DCP | 213 | 13 | 2 | 30 | 0 | 0 | 0 | 258 | ||
| Plot 3 | RCP | 296 | 30 | 10 | 44 | 1 | 0 | 2 | 383 | |
| DCP | 282 | 13 | 11 | 39 | 1 | 1 | 5 | 352 | ||
| Mixed forest | Plot 4 | RCP | 319 | 22 | 4 | 32 | 3 | 0 | 0 | 380 |
| DCP | 306 | 9 | 6 | 28 | 0 | 0 | 1 | 350 | ||
| Plot 5 | RCP | 281 | 26 | 11 | 44 | 1 | 1 | 0 | 364 | |
| DCP | 263 | 17 | 13 | 38 | 0 | 0 | 3 | 334 | ||
| Plot 6 | RCP | 287 | 27 | 14 | 32 | 0 | 1 | 0 | 361 | |
| DCP | 281 | 14 | 17 | 31 | 0 | 0 | 9 | 352 | ||
| Deciduous | Plot 7 | RCP | 208 | 31 | 25 | 25 | 2 | 0 | 0 | 291 |
| DCP | 214 | 30 | 38 | 20 | 5 | 0 | 5 | 312 | ||
| Plot 8 | RCP | 209 | 19 | 12 | 17 | 0 | 0 | 0 | 257 | |
| DCP | 209 | 14 | 14 | 16 | 3 | 0 | 2 | 258 | ||
| Plot 9 | RCP | 228 | 13 | 22 | 18 | 2 | 1 | 0 | 284 | |
| DCP | 228 | 21 | 34 | 16 | 1 | 0 | 0 | 300 |
1 RCP: Reference crown perspective; DCP: Detected crown perspective; 2 total: the total number of reference crowns and detected crowns from the reference and the detected crown perspective, respectively.
Table 4.
Quantitative assessment results of the RHCSA algorithm.
| Forest Type | Plot | PA (%) | UA (%) | OA (%) | Detection (m) | Delineation (m) |
|---|---|---|---|---|---|---|
| Coniferous | Plot 1 | 85.71 | 83.33 | 84.51 | 0.63 | 0.61 |
| Plot 2 | 85.23 | 87.60 | 86.40 | 0.67 | 0.65 | |
| Plot 3 | 85.12 | 83.81 | 84.46 | 0.69 | 0.54 | |
| Average | 85.35 | 84.91 | 85.12 | 0.67 | 0.6 | |
| Mixed forest | Plot 4 | 89.74 | 90.00 | 89.87 | 0.67 | 0.58 |
| Plot 5 | 84.34 | 83.83 | 84.09 | 0.75 | 0.50 | |
| Plot 6 | 86.98 | 83.81 | 85.36 | 0.83 | 0.56 | |
| Average | 87.02 | 85.88 | 86.44 | 0.75 | 0.55 | |
| Deciduous | Plot 7 | 82.13 | 78.21 | 80.12 | 0.91 | 0.67 |
| Plot 8 | 88.72 | 86.43 | 87.56 | 0.63 | 0.72 | |
| Plot 9 | 84.86 | 83.00 | 83.92 | 0.84 | 0.56 | |
| Average | 85.24 | 82.55 | 83.87 | 0.79 | 0.66 |
Table 5.
Mean and ANOVA results of the five accuracy metrics for three forest types.
| Forest Type | PA (%) | UA (%) | OA (%) | Detection (m) | Delineation (m) |
|---|---|---|---|---|---|
| Coniferous forest | 85.35 | 84.91 | 85.12 | 0.67 | 0.60 |
| Mixed forest | 87.02 | 85.88 | 86.44 | 0.75 | 0.55 |
| Deciduous forest | 85.24 | 82.55 | 83.87 | 0.79 | 0.67 |
| p-value | 0.64 | 0.51 | 0.57 | 0.33 | 0.19 |
α = 0.05.
Table 6.
Comparison of individual tree crowns matching between MCWS and RHCSA.
| Plot | Method | Perspective 1 | 1:1 Match | Near-match | Split | Merge | Multi-Intersected | Mis-Located Match | Omission/Commission | Total 2 |
|---|---|---|---|---|---|---|---|---|---|---|
| Plot 3 (Coniferous) | MCWS | RCP | 257 | 26 | 49 | 50 | 1 | 0 | 0 | 383 |
| DCP | 267 | 33 | 55 | 32 | 3 | 1 | 10 | 401 | ||
| RHCSA | RCP | 296 | 30 | 10 | 44 | 1 | 0 | 2 | 383 | |
| DCP | 282 | 13 | 11 | 39 | 1 | 1 | 5 | 352 | ||
| Plot 6 (Mixed forest) | MCWS | RCP | 209 | 25 | 87 | 37 | 3 | 0 | 0 | 361 |
| DCP | 251 | 43 | 118 | 27 | 5 | 0 | 17 | 461 | ||
| RHCSA | RCP | 287 | 27 | 14 | 32 | 0 | 1 | 0 | 361 | |
| DCP | 281 | 14 | 17 | 31 | 0 | 0 | 9 | 352 | ||
| Plot 9 (Deciduous) | MCWS | RCP | 149 | 13 | 87 | 34 | 0 | 1 | 0 | 284 |
| DCP | 182 | 46 | 125 | 22 | 3 | 2 | 17 | 397 | ||
| RHCSA | RCP | 228 | 13 | 22 | 18 | 2 | 1 | 0 | 284 | |
| DCP | 228 | 21 | 34 | 16 | 1 | 0 | 0 | 300 |
1 RCP: reference crown perspective; DCP: detected crown perspective; 2 total: the total number of reference crowns and detected crowns on reference crown and detected crown perspective, respectively.
Table 7.
Comparison of accuracy metrics between MCWS and RHCSA.
| Plot | Method | PA (%) | UA (%) | OA (%) | Detection (m) | Delineation (m) |
|---|---|---|---|---|---|---|
| Plot 3 (Coniferous) | MCWS | 73.89 | 74.81 | 74.35 | 0.81 | 0.51 |
| RHCSA | 85.12 | 83.81 | 84.46 | 0.69 | 0.54 | |
| Plot 6 (Mixed forest) | MCWS | 64.82 | 63.77 | 64.29 | 0.85 | 0.58 |
| RHCSA | 86.98 | 83.81 | 85.36 | 0.83 | 0.56 | |
| Plot 9 (Deciduous) | MCWS | 57.04 | 57.43 | 57.24 | 0.91 | 0.54 |
| RHCSA | 84.86 | 83.00 | 83.92 | 0.84 | 0.56 |
© 2017 by the authors. Licensee MDPI, Basel, Switzerland. This article is an open access article distributed under the terms and conditions of the Creative Commons Attribution (CC BY) license (http://creativecommons.org/licenses/by/4.0/).
Share and Cite
MDPI and ACS Style
Zhao, Y.; Hao, Y.; Zhen, Z.; Quan, Y. A Region-Based Hierarchical Cross-Section Analysis for Individual Tree Crown Delineation Using ALS Data. Remote Sens. 2017, 9, 1084. https://doi.org/10.3390/rs9101084
AMA Style
Zhao Y, Hao Y, Zhen Z, Quan Y. A Region-Based Hierarchical Cross-Section Analysis for Individual Tree Crown Delineation Using ALS Data. Remote Sensing. 2017; 9(10):1084. https://doi.org/10.3390/rs9101084
Chicago/Turabian StyleZhao, Yinghui, Yuanshuo Hao, Zhen Zhen, and Ying Quan. 2017. "A Region-Based Hierarchical Cross-Section Analysis for Individual Tree Crown Delineation Using ALS Data" Remote Sensing 9, no. 10: 1084. https://doi.org/10.3390/rs9101084
Note that from the first issue of 2016, this journal uses article numbers instead of page numbers. See further details here.