Article

A Hybrid Pansharpening Algorithm of VHR Satellite Images that Employs Injection Gains Based on NDVI to Reduce Computational Costs

Department of Civil Engineering, Chungbuk National University, Chungdae-ro 1, Seowon-Gu, Cheongju Chungbuk 28644, Korea
*
Author to whom correspondence should be addressed.
Remote Sens. 2017, 9(10), 976; https://doi.org/10.3390/rs9100976
Submission received: 1 August 2017 / Revised: 12 September 2017 / Accepted: 19 September 2017 / Published: 21 September 2017
(This article belongs to the Section Remote Sensing Image Processing)

Abstract

:
The objective of this work is to develop an algorithm for pansharpening of very high resolution (VHR) satellite imagery that reduces the spectral distortion of the pansharpened images and enhances their spatial clarity with minimal computational costs. In order to minimize the spectral distortion and computational costs, the global injection gain is transformed to the local injection gains using the normalized difference vegetation index (NDVI), on the assumption that the NDVI are positively or negatively correlated with local injection gains obtained from each band of the satellite data. In addition, the local injection gains are then applied in the hybrid pansharpening algorithm to optimize the spatial clarity. In particular, in the proposed algorithm, a synthetic intensity image is determined using block-based linear regression. In experiments using imagery collected by various satellites, such as KOrea Multi-Purpose SATellite-3 (KOMPSAT-3), KOMPSAT-3A and WorldView-3, the pansharpened results obtained using the proposed Hybrid Pansharpening algorithm using NDVI and based on the spectral mode (HP-NDVIspectral) provide a better representation of the values of the Erreur Relative Globale Adimensionnelle de Synthèse (ERGAS), the spectral angle mapper (SAM) and the Q4/Q8 than those produced by existing pansharpening algorithms. In terms of spatial quality, the pansharpened images obtained using the proposed pansharpening algorithm based on the spatial mode (HP-NDVIspatial) have higher average gradient (AG) values than those obtained using existing pansharpening methods. In addition, the computational complexity of our method is similar to that of a pansharpening algorithm that is based on a global injection model, although our methodology has characteristics that are similar to those of a local injection gain-based model that has a very high computational cost. Thus, the quantitative and qualitative assessments presented here indicate that the proposed algorithm can be utilized in various applications that employ spectral information or require high spatial clarity.

Graphical Abstract

1. Introduction

With the development of remote sensing satellites, various algorithms for integrating or fusing optical or synthetic aperture radar (SAR) satellite images have been proposed [1,2,3]. Because various satellite sensors used for remote sensing, including very high resolution (VHR) satellite sensors such as IKONOS, QuickBird, GeoEye, WorldView-2/3 and the Korea Multi-Purpose Satellite (KOMPSAT)-2/3/3A, provide simultaneous multispectral and panchromatic images that have different spatial resolutions, pansharpening algorithms represent an essential element of the utilization of remote sensing data in data fusion frameworks. Such algorithms sharpen the spatial resolution of multispectral images using high spatial resolution panchromatic images obtained by identical satellite sensors [1,4,5]. In particular, pansharpening methods function as pre-processors and are used in various applications, such as visual interpretation, image classification, change detection and digital mapping [5,6,7,8].
Pansharpening algorithms can be classified as multi-resolution analysis (MRA) or component substitution (CS) methods, depending on the characteristics of each algorithm [9]. In MRA-based algorithms, pansharpened images are generated by injecting spatial details found in the original and spatially-reduced panchromatic images into the multispectral image [9,10]. Various multi-resolution decomposition techniques, such as a generalized version of the additive wavelet luminance proportional (AWLP) model that uses the spectral response function (SRF), ridgelets, curvelets and shearlets, have been proposed in order to enhance the quality of pansharpened images [4,11,12,13,14]. Meanwhile, in recent studies of pansharpening algorithms, a version of the generalized Laplacian pyramid (GLP) in which a Gaussian filter is matched with the modulation transfer function (MTF) of the satellite sensor being considered, is referred to as MTF-GLP [15,16]. In performing pansharpening with MTF-GLP, various injection gains are applied [5,17]. In addition, Yang et al. [18] proposed a new pansharpening algorithm based on a matting model and a multiscale transform. Recently, morphological operators have been applied to extract spatial details from panchromatic images [19]. Meanwhile, some researchers have indicated that spatial enhancement using MRA-based pansharpening algorithms that employ decimated analysis may not be satisfactory due to the occurrence of aliasing effects, artifacts and the blurring of textures, although MRA-based algorithms can minimize the spectral distortion of pansharpened images [11,20,21]. This issue is important in that the interpretation of pansharpened images is one of the most representative applications in the field of remote sensing.
Therefore, CS-based pansharpening algorithms have been developed in order to optimize the spatial and spectral quality of pansharpened images. General CS-based algorithms sharpen the spatial resolution of multispectral images through the injection of spatial differences between synthetic intensity images generated from multispectral images, instead of the degradation of panchromatic images. In particular, the development of the fast intensity-hue-saturation (FIHS) fusion method, which can quickly fuse large volumes of remote sensing data and can be extended to four or more spectral bands, has accelerated the advancement of pansharpening technology [22,23]. Subsequently, Dou et al. [24] showed that many pansharpening algorithms can be generalized to the CS framework. Based on the FIHS method and the generalized CS framework, various modifications of the FIHS method have been developed [25,26,27]. Laben and Brower [28] proposed the Gram–Schmidt (GS) method, which has been implemented in the Environment for Visualizing Images (ENVI) software environment. Aiazzi et al. [29] proposed various versions of the GS method that use different means of producing intensity images and experimented with carrying out the pansharpening process using global and local injection models. This study argued that the pansharpening results obtained using a local injection model are of higher quality than those obtained using a global model. However, they demonstrated that the local injection model has a high computational cost compared with the global model [15,29]. Xu et al. [30] suggested the use of a data fitting scheme to minimize the spectral distortion associated with CS-based methods. The band-dependent spatial detail (BDSD) algorithm, which is stated to be the one of most efficient algorithms in [9], generates spectrally-optimized pansharpened images using injection gains. These gains can be applied globally or locally, based on the minimum mean square error (MMSE) joint estimator [31]. In addition, Zhong et al. [32] generalized the BDSD algorithm using a combination of the CS and MRA methods.
The hybrid pansharpening algorithm, which employs two types of spatial detail in its injection model, was developed in order to improve the spatial quality of pansharpened images [33]. The nearest-neighbor diffusion (NNDiffuse) algorithm aims to enhance spatial details while preserving spectral fidelity, and the partial replacement adaptive component substitution (PRACS) method is designed to optimize the preservation of spectral information in pansharpened images through the construction of high- and low-resolution component images [21,34]. In addition, pansharpening algorithms of clustered multispectral and panchromatic images considering mixed pixels is proposed using the fuzzy c-means algorithm [35]. However, the spectral distortion produced by most CS-based algorithms needs to be addressed, because the injection models used to minimize spectral distortion in some CS-based methods cause a loss of spatial clarity during the pansharpening process. In particular, the moving window-based local injection models used in [9,15,33] are not practical in terms of their computational costs, although these methods show good performance in terms of spectral preservation.
Therefore, in this work, we attempted to reduce the computational costs associated with pansharpening through the generation of local injection gains. In particular, the optimal local injection gains for hybrid pansharpening are newly developed based on the normalized difference vegetation index (NDVI), as motivated in [36,37], except that sliding windows and clustering algorithms are not used. The developed local injection gains are optimized through the similarity between the NDVI and the injection gain parameter model of the pansharpening algorithm in order to minimize the spectral distortion of the pansharpened images. In contrast, existing algorithms, which are proposed in [36,37], require the generation of the global injection gain using the NDVI or an image clustering method. In addition, block-based intensity images are applied in the hybrid pansharpening process in order to enhance the spectral and spatial quality of the pansharpened images.
The manuscript is organized as follows. In Section 2, we provide a brief overview of the CS-based pansharpening algorithm and describe its characteristics. We then propose our new pansharpening algorithm, which is intended to reduce computational costs, in Section 3. In Section 4, we compare the quantitative and qualitative quality of the pansharpened images obtained using our algorithm with those obtained using existing state-of-the-art algorithms. Section 5 includes a discussion, followed by the conclusions of the paper.

2. Overview and Characteristics of CS-Based Pansharpening Methods

Some researchers have demonstrated a general pansharpening framework that can be defined by Equation (1) [9,15].
M S ^ k = M S ˜ k + g k ( P I L ) ,   k = 1 , ,   N
where P is a panchromatic image with high spatial resolution, N is the number of spectral bands, M S ^ k is a pansharpened image that corresponds to the k-th spectral band, M S ˜ k is an interpolated version of the original multispectral image M S k at the scale of P , g k indicates the injection gains of the k-th spectral band and I L is a synthetic intensity image with a low spatial resolution that is identical to the spatial resolution of M S ˜ k . Generally, the original multispectral image is interpolated to the same pixel size as the panchromatic image using a polynomial interpolator with 23 coefficients [16]. In addition, in pansharpening, CS- and MRA-based algorithms are classified in terms of how I L is generated, as mentioned in Section 1. I L is determined through spatial degradation of panchromatic images in MRA-based methods; however, CS-based methods generate I L using multispectral images with low spatial resolution. In the CS-based algorithms, the combination of multispectral images by using empirical formulas using the SRFs of satellite-based sensors or a multiple linear regression model between M S ˜ k and P is applied for producing I L .
Meanwhile, the determination of g k is another key step in CS-based pansharpening. Except for empirical estimation of the parameters for each sensor based on trial and error, injection gains are most often extracted using a statistical model. In particular, some researchers have noted that spectral distortion of CS-based pansharpened images can occur due to the use of global injection gain models. As optimal values for different regions that have different spectral characteristics are applied to satellite images, local parameter values based on moving windows about overlapping image blocks can minimize spectral distortion [15,16,31,33]. In addition, due to the high computational costs of moving window-based algorithms, methods that employ segment- and non-overlapping block-based processing have been proposed [38,39].

3. The Proposed Methodology

In this work, we developed a new pansharpening algorithm based on optimal injection gains and the hybrid pansharpening framework. The overall workflow of the proposed pansharpening algorithm is shown as Figure 1. We first extract the optimal local injection gains based on NDVI. In addition, the intensity image, which is based on the non-overlapping block-based algorithm, is then generated. Finally, the injection gains and the intensity image are applied in the hybrid pansharpening framework. The details are as follows.

3.1. Similarities between the NDVI and Injection Gain Parameter Models

In general, in CS-based pansharpening methods, the major reason why spectral distortion occurs is the difference of spectral characteristics between the panchromatic image and each multispectral band. Spectral distortion is caused by mismatches between the dynamic range of the SRF associated with the panchromatic sensor and that of the multispectral sensor. If a satellite image is obtained from a region that includes various land cover types, such as vegetated areas, bodies of water, agricultural areas and buildings, the spectral dissimilarity between panchromatic and multispectral images may be intensified. For the reasons mentioned above, most pansharpening algorithms are evaluated using various satellite images containing different land cover types. Moreover, several methodologies for estimating the injection gain parameter have been proposed that are based on the spectral characteristics of land cover types. The NDVI is a representative index that quantifies the biophysical characteristics of vegetation. Given that major spectral distortion of pansharpened images occurs within vegetated areas, the NDVI may provide an effective means to estimate injection gain parameters. For example, a simple relationship between mean NDVI values and weighting factors that is based on trial and error and 200 IKONOS-2 images was determined in [36]. Moreover, only global injection gains with the same value for all bands were extracted. Xu et al. [37] classified panchromatic and multispectral images into two classes, vegetated and non-vegetated regions, using the k-means algorithm and then applied pansharpening to the classified pixel groups separately. This study indicates that injection gains can be determined according to the spectral characteristics of the land cover types of satellite images. Therefore, in this manuscript, we propose algorithms that identify optimized values of the local gain parameter using NDVI for hybrid pansharpening [40]. This algorithm is novel compared to previous studies in that it extends the global injection gains to local injection gains using NDVI, based on the assumption that the NDVI displays high similarity with the local injection gains obtained from each band of the satellite imagery. In particular, we tried to optimize the local gain parameter through standardization and adjustment of the dynamic range of the NDVI in order to minimize the spectral distortion of the pansharpened image.
First, we analyze the similarity between local injection gains and NDVI. Local injection gains are obtained from the Gram–Schmidt adaptive (GSA) method and the hybrid pansharpening algorithm, which is representative of pansharpening algorithms that employ local window processing to extract local gains [15,33].
Figure 2 represents the NDVI and the local injection gain image from GSA and hybrid pansharpening. As shown in Figure 2b,c,e, for the blue band, the values of the local injection gain are low within the vegetated areas, where the NDVI values are high. On the other hand, the values of the local injection gain are relatively high in the unvegetated areas, which contain low NDVI values. In contrast, in the case of the near-infrared (NIR) band, the local injection gain values display a positive correlation with the NDVI, as shown in Figure 2b,d,f. To enable a quantitative comparison between local injection gains and NDVI values, the correlation coefficient between the NDVI values and the local injection gains of GSA and hybrid pansharpening was calculated. As shown in Table 1, the injection gains of the blue, green and red bands display weak (0.2–0.4) to moderate (0.4–0.6) correlations with the NDVI. Moreover, the injection gains of the NIR band display a positive and moderate correlation value. Therefore, the local injection gain of the visible bands can be transformed based on this positive correlation, whereas that of the NIR band can be transformed based on the negative correlation. In particular, it appears that the local injection gains can be obtained through transformation of the NDVI without performing image processing based on overlapping image blocks and moving windows, which are used to extract the local injection gains in general pansharpening methods.

3.2. Optimization of Pansharpening Parameter Using the NDVI

In general, terms, the NDVI can be defined using Equation (2) [41]:
N D V I = N I R r e d N I R + r e d
where N I R and r e d are the reflectance values of the NIR and red bands of M S ˜ k . However, in our algorithm, it is possible to use a digital number (DN) in Equation (2) instead of a reflectance value because we only consider the NDVI in terms of the relative spectral characteristics of vegetated and non-vegetated areas. After determining the NDVI, it should be adjusted so that it contains values that are similar to those of the general local injection gains. To meet this requirement, the NDVI is reconstructed using the dynamic range and a histogram of the NDVI values obtained using existing global injection gain algorithms. Initially, I L is determined through linear regression between P ˜ L and M S ˜ k , where P ˜ L indicates a panchromatic image with low spatial resolution to which the Starck and Murtagh filter has been applied [42]. The initial injection gains g k G of band k can then be calculated using Equation (3) [33]:
g k G = σ ( M S ˜ k ) σ ( I L ) × ( S k ) 3
where S k is the correlation coefficient between the high-frequency information of I L and M S ˜ k obtained by Laplacian filtering, and σ ( A ) is the standard deviation of image A . Considering that the global gain is similar to the mean of the local injection gains, the local injection gains g k based on NDVI values are expanded using Equation (4).
g k = ( 1 ) a × N D V I + N D V I ¯ + g k G
where N D V I ¯ is the mean value of the overall NDVI values, and a indicates the adjustment variable for the dynamic range of the local injection gains. NDVI is negatively correlated with the local injection gains of the visible wavelength, and NDVI and the local injection gains of the NIR band are positively correlated. Therefore, the sign of NDVI values is transformed based on a using Equation (5).
a = { 1 ,   i f   corr ( M S ˜ k ,   N D V I ) < 0 0 ,   i f   corr ( M S ˜ k ,   N D V I ) > 0
where corr ( A , B ) is the correlation coefficient between A and B . Finally, the value of g k is revised to avoid over- or under-estimation of g k , as described by Equation (6).
g k ( i , j ) = { 0 ,   i f   g k ( i , j ) < 0 1.5 × g k G ,   i f   g k ( i , j ) > 1.5 × g k G
Here, g k ( i , j ) indicates the local injection value at an image position of ( i , j ) . In Equation (6), the minimum value of g k is set to zero because injection gains should be greater than zero. In addition, then, the maximum value of g k is considered to be 1.5 × g k G in order to prevent the over-injection of spatial details. Figure 2 shows g k corresponding to the blue and NIR bands. As shown in Figure 2 and Figure 3, the g k image obtained using our algorithm is qualitatively similar to the general local injection gains obtained by convolution. Using Equations (3)–(6), the optimal local injection gains according to the spectral characteristics of each wavelength range and land cover type were determined without the use of overlapping blocks-based convolution.

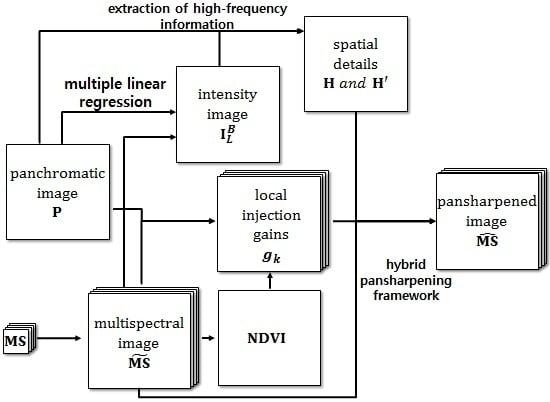
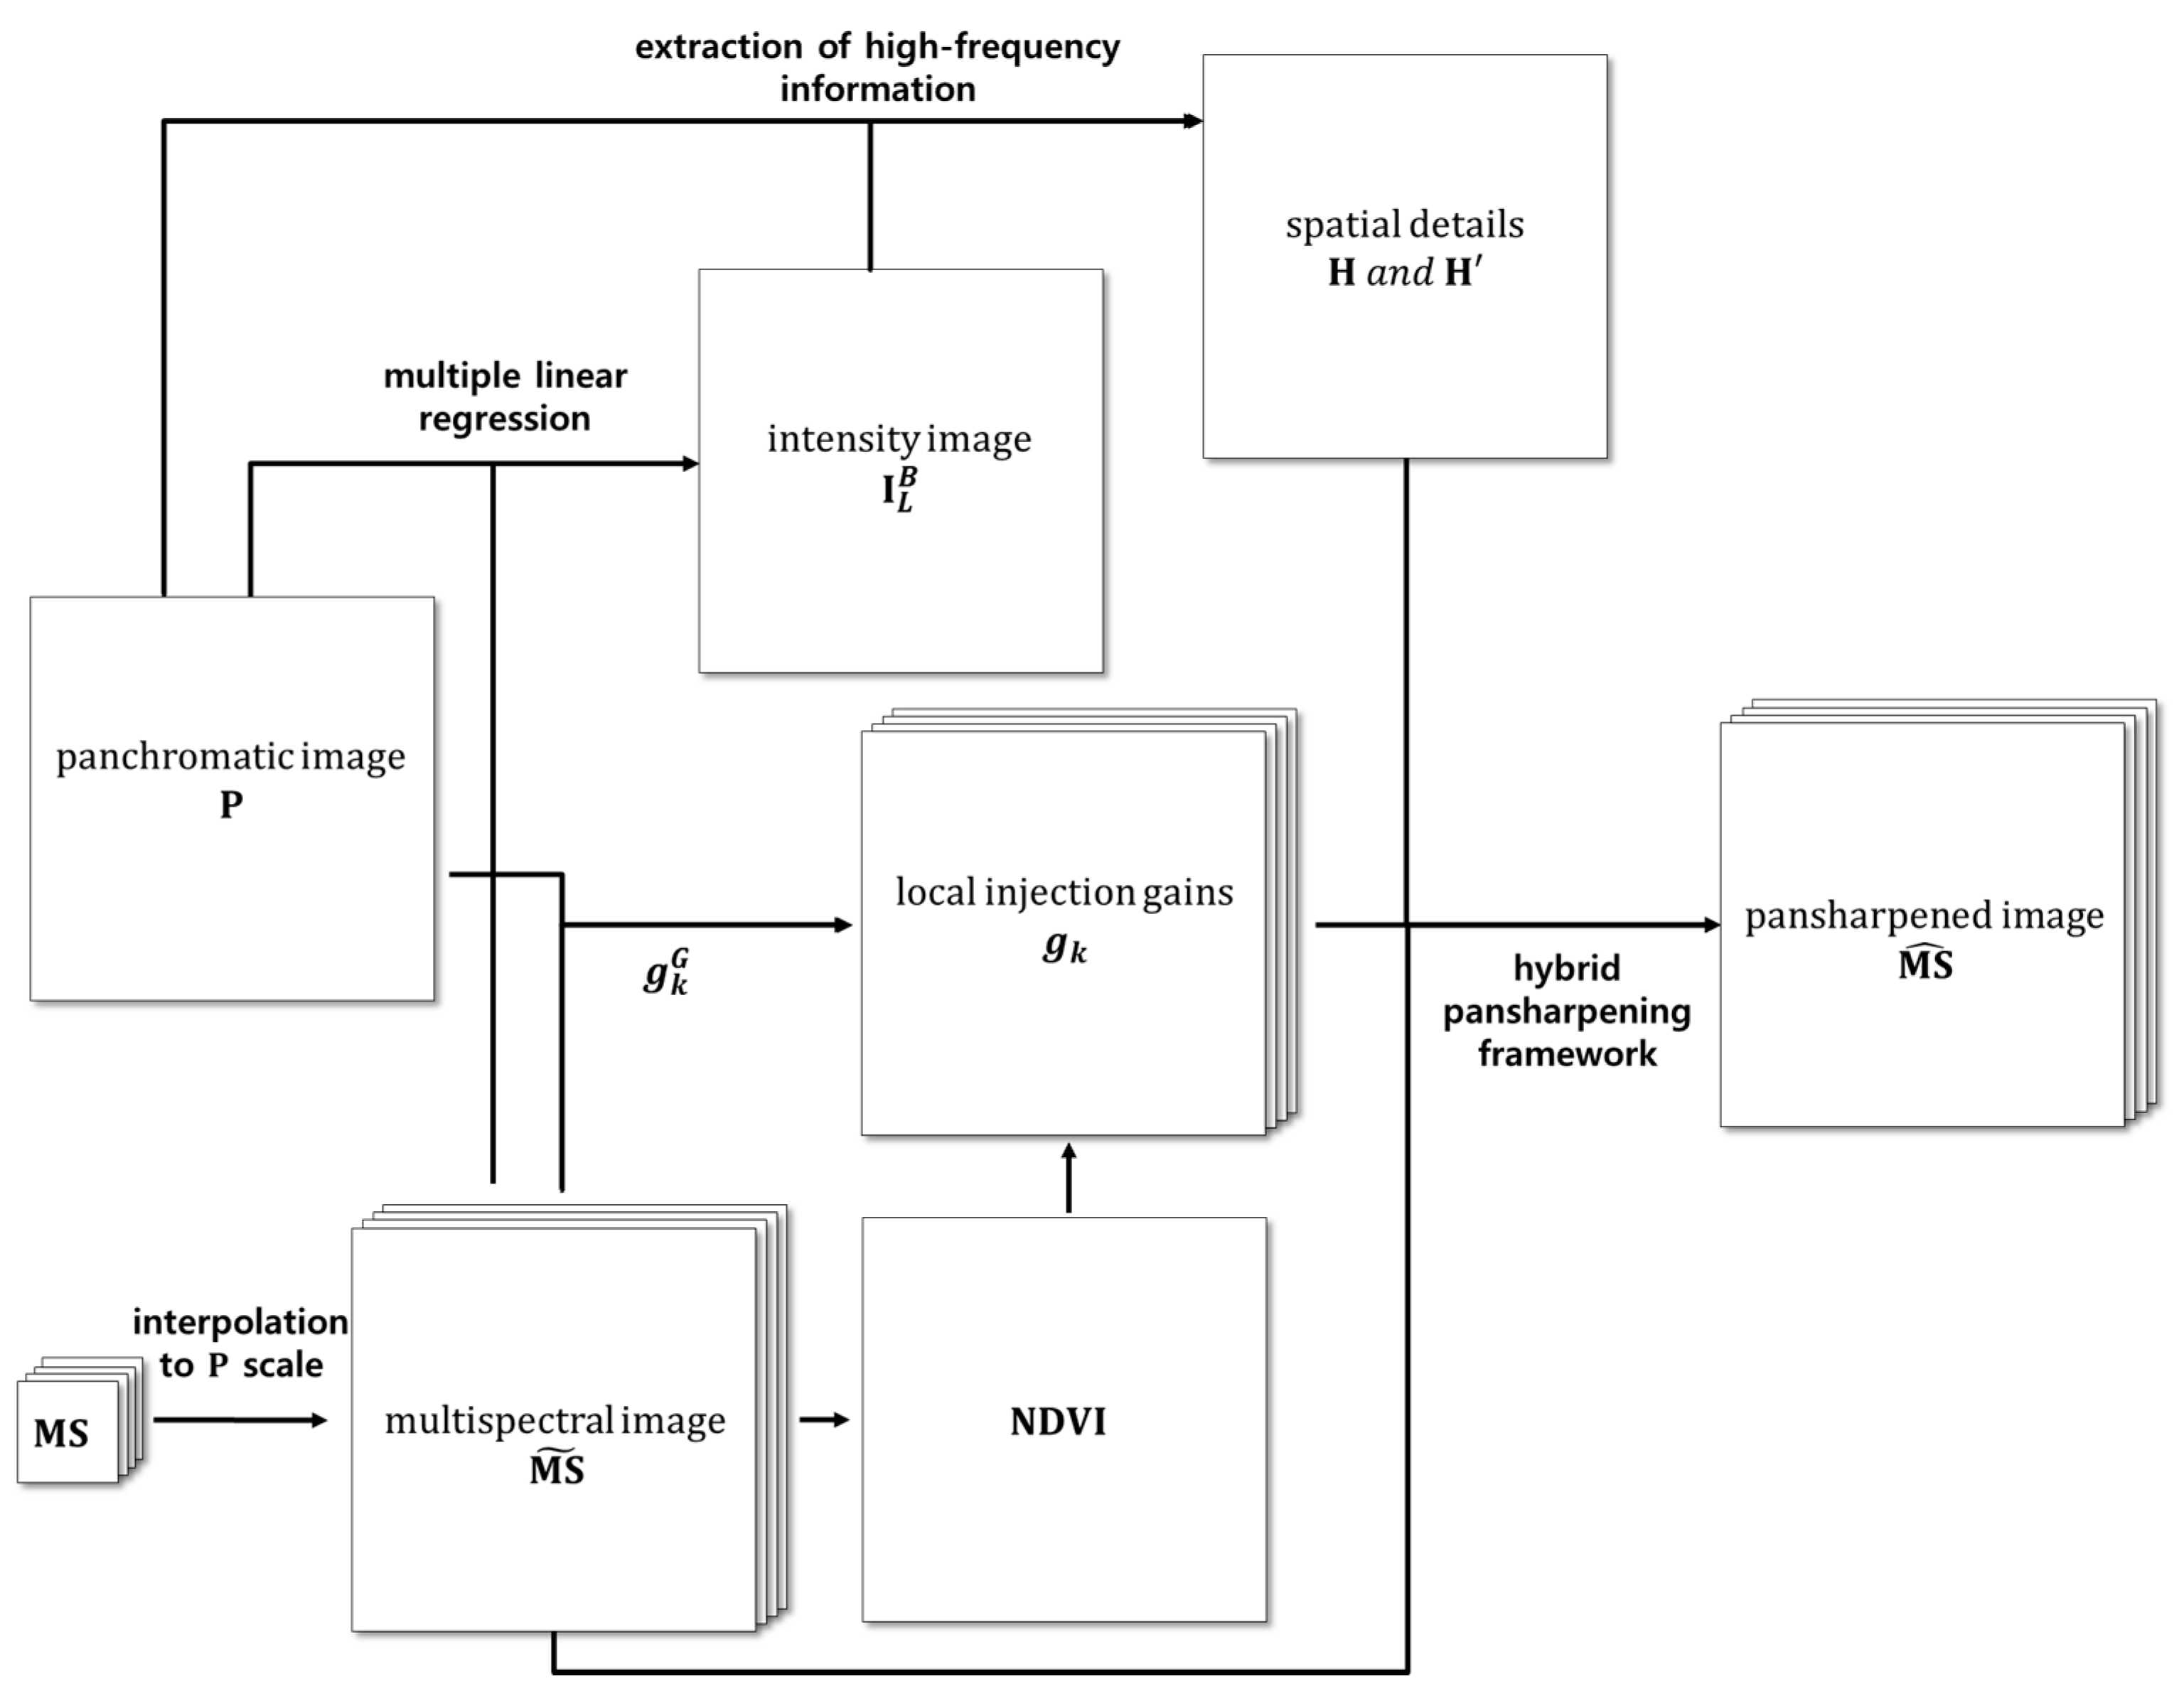
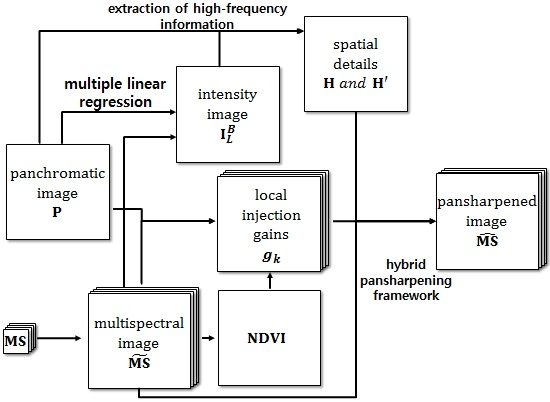
3.3. Construction of a Modified Hybrid Pansharpening Model

To apply g k , we adapted the hybrid pansharpening framework, instead of the general CS-based pansharpening algorithm that is based on Equation (1). This revised framework can be defined as Equation (7) [33]:
M S ^ k = M S ˜ k + g k ( H k + α H k ) = M S ˜ k + g k [ ( P I L B ) + α ( 2 ( P I L B ) ) ]
where M S ^ k represents the pansharpened images, H k and H k indicate the spatial details obtained using the primary and secondary high-frequency information and α is a decision parameter for selecting the hybrid pansharpening mode. First, H k is the difference between P and the non-overlapping block-based intensity image I L B . Let P , which has a pixel size of R × C , be partitioned into R × C S 2 blocks. Here, S is the block size. The intensity image corresponding to the b-th block can be obtained using Equation (8):
I L B ( b ) = k = 1 N ω k B ( b ) M S ˜ k B ( b )
where M S ˜ k B ( b ) indicates the multispectral image (k-th spectral band) corresponding to the b-th block. Using a linear regression between P L B ( b ) and M S ˜ k B ( b ) , the weight parameter ω k B ( b ) can be determined. In addition, for pansharpening, I L B is integrated using Equation (9).
I L B = { I L B ( b ) } ,   b = 1 , R × C S 2
In Equations (8) and (9), the value of the block size S is important in determining the performance of our algorithm. If S is similar to the original image size, the spectral residual between I L B and P can be increased, whereas a small block size would cause spatial decline. If S is set to one, the pansharpening framework is identical to MRA-based pansharpening because I L B with S = 1 is equal to P ˜ L . For our algorithm, S = 256 has been determined to be the optimal value in terms of spatial and spectral quality through trial and error using various types of satellite images. This value maintains the spatial quality of CS-based pansharpening and minimizes the spectral distortion caused by the spectral residual in linear regression. Based on an intensity image obtained with Equations (8) and (9), the spatial details H k and H k can be extracted. Meanwhile, H k can be obtained from the application of a Laplacian filter, such as that shown in Equation (10), to H k , which is defined as the differencing between the panchromatic and intensity images.
2 = [ 1 1 1 1 8 1 1 1 1 ]
H k plays a role that is similar to that of high boost filtering in order to improve the level of spatial detail and maximize the spectral clarity of the pansharpened image [33]. Meanwhile, the injection of spatial detail may cause spectral distortion, due to the tradeoff between spectral and spatial quality. Therefore, in this work, we set the decision parameter α in order to control the spectral and spatial quality of the pansharpened image. Our algorithm can be classified as having a spectral and spatial mode, and the mode used is determined by the value of α . If α is set to zero, the pansharpening framework is identical to the original CS-based pansharpening framework of Equation (1), and H k is not used in the pansharpening. This means that only primary high-frequency information is applied. In this manuscript, this mode is called the spectral mode, which does not reflect the additional spatial details contained in H k . The spatial mode considers the injection of secondary high-frequency information H k using Equation (11) [33]:
α = σ ( H k ) 2 σ ( H k )
The spatial mode is designed to generate a pansharpened image that contains high quality spatial details when compared to pansharpened images generated using the spectral mode. Therefore, users can choose the spatial or spectral mode, depending on the type of application.

4. Experimental Results

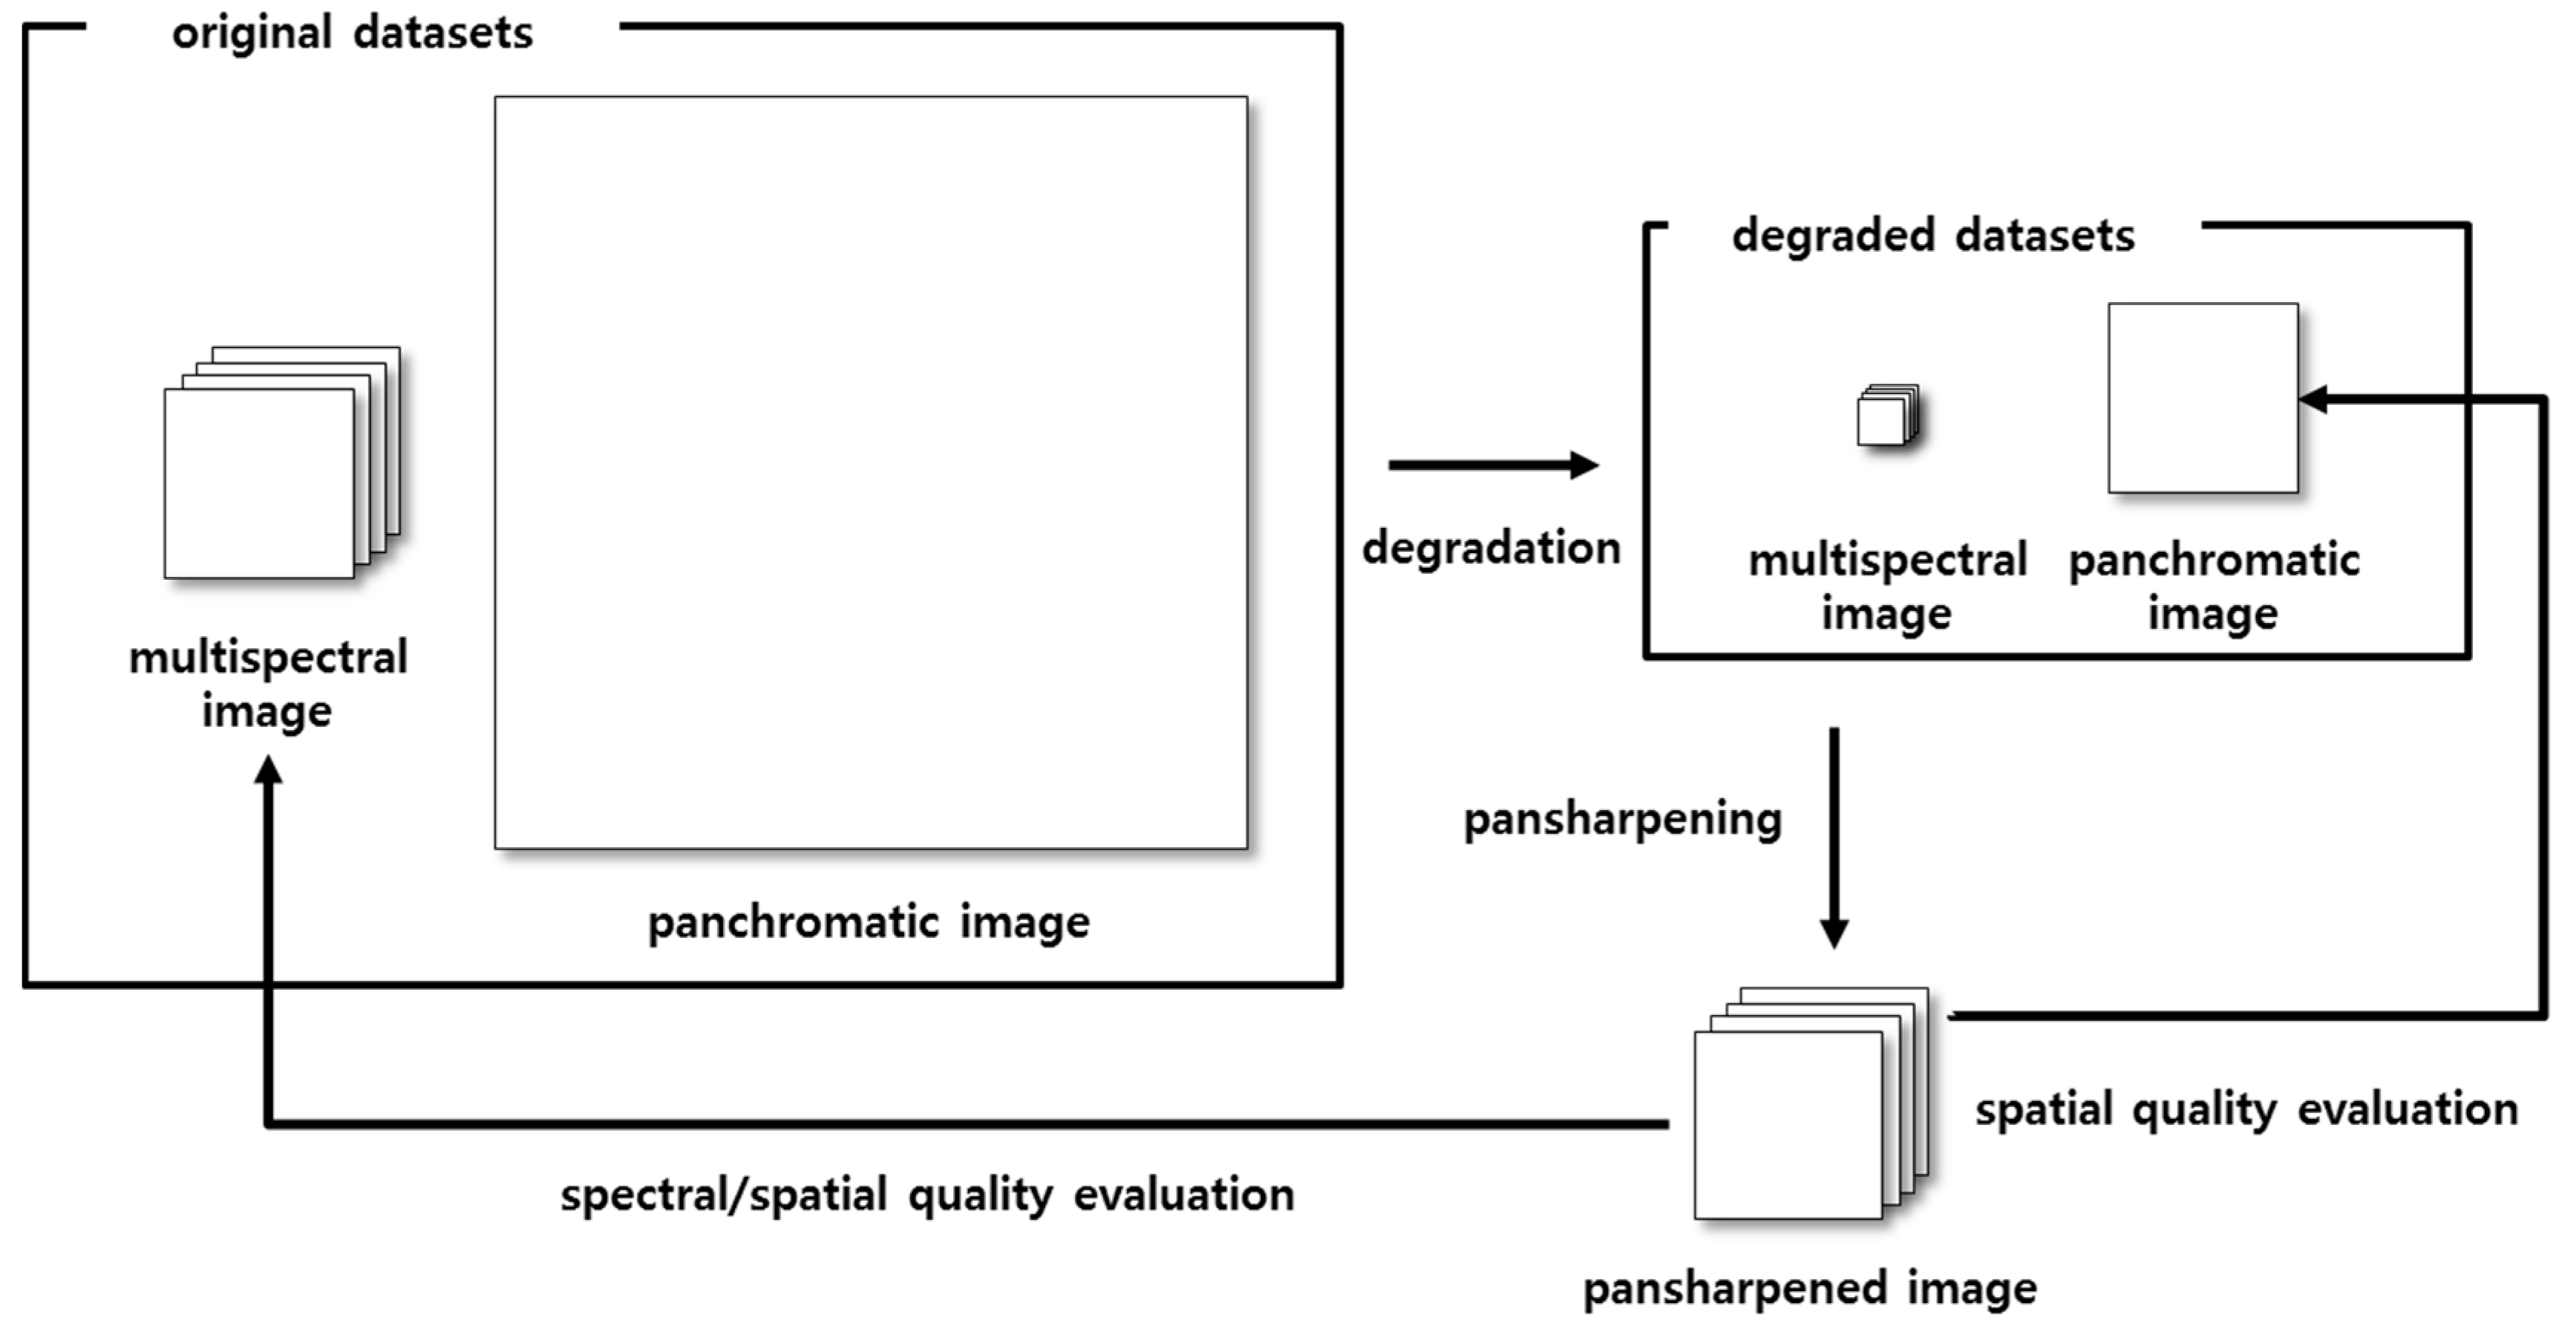
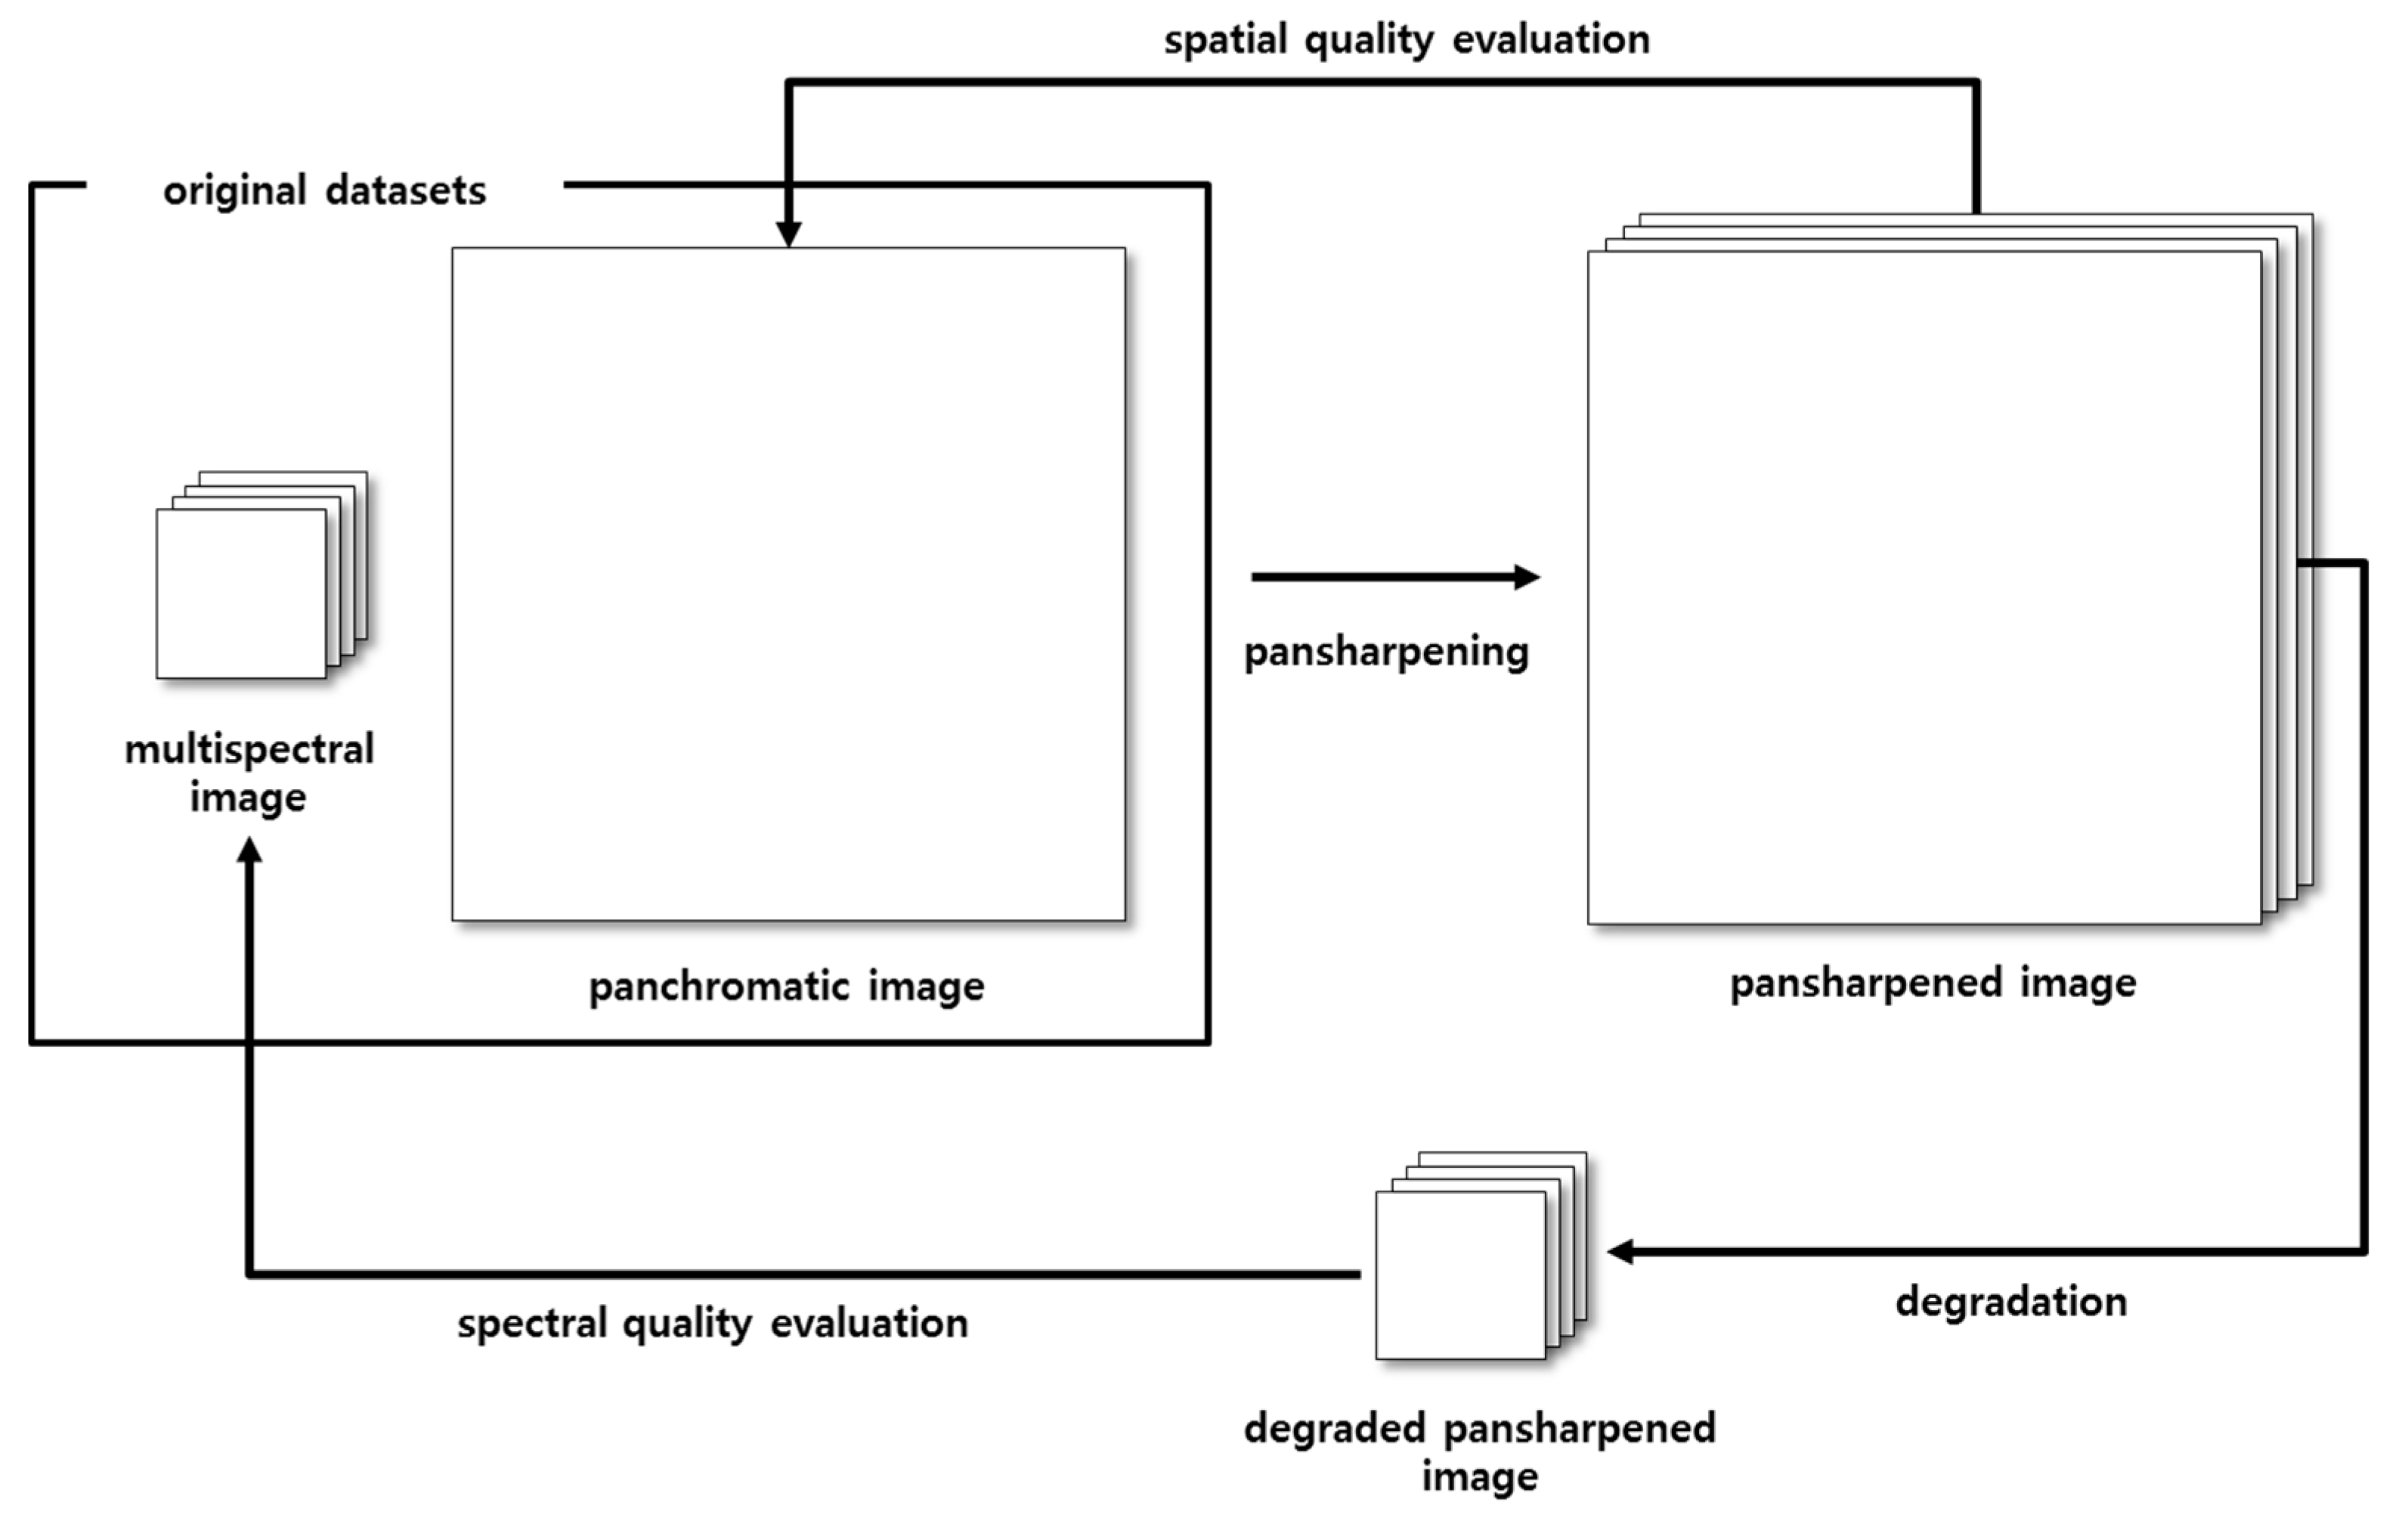
4.1. Quality Assessment of Pansharpened Images
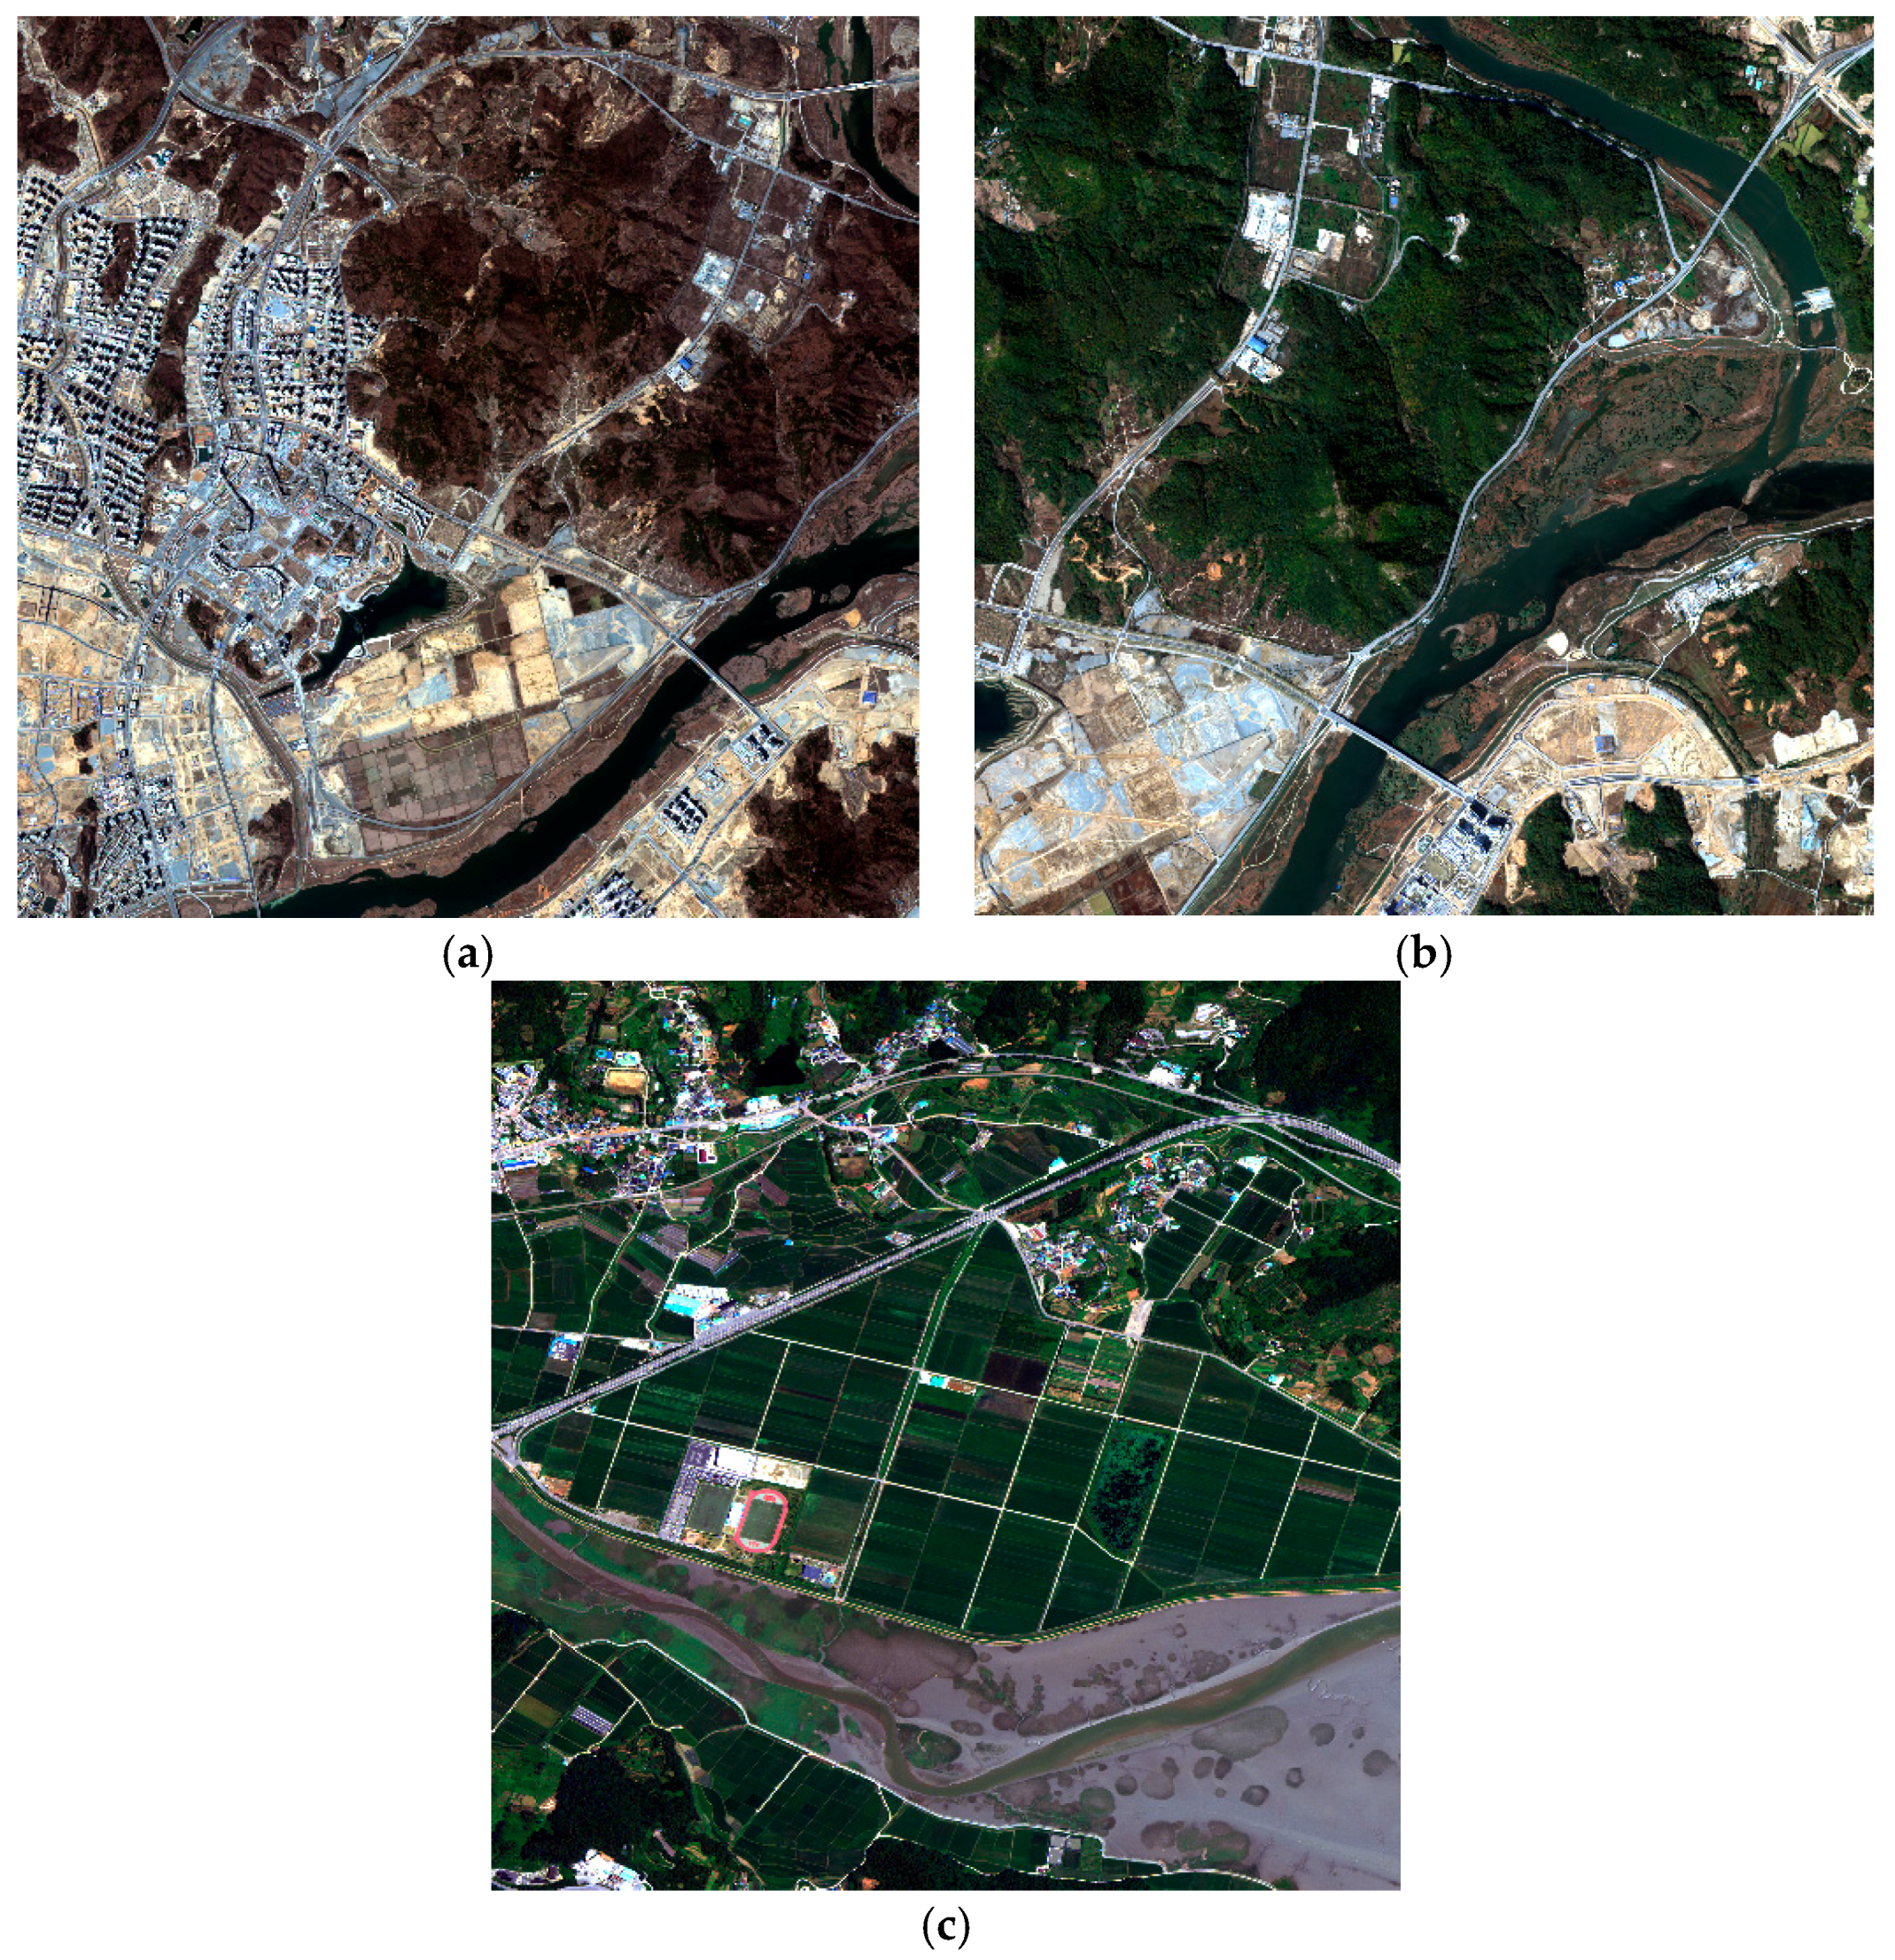
In evaluating the quality of pansharpened images, the method used to determine the reference image for comparison with the pansharpened image is an important issue because the original multispectral and panchromatic images do not include reference pansharpened datasets. To solve this problem, the synthesis and consistency properties have been used to conduct quality assessments of pansharpened images [9,43]. In the case of the synthesis property, the pansharpening framework is applied to degraded multispectral and panchromatic images, as shown in Figure 4. Thus, the spatial and spectral resolutions of the pansharpened image obtained from the degraded datasets will be identical to those of the original multispectral image. Therefore, the multispectral image in the original dataset can be used as a reference.
However, evaluations performed using the synthesis property may not guarantee identical spectral and spatial quality when the pansharpening algorithm is applied to the original datasets. Therefore, some researchers have proposed the quality estimation methodology, which evaluates the consistency property [43]. To evaluate the consistency property, pansharpened images are produced from the original multispectral and panchromatic datasets, as shown in Figure 5. Subsequently, the spatial resolution of the pansharpened image is degraded to the resolution of the original multispectral image. The spatial quality is assessed using the original panchromatic image and the pansharpened image.
Meanwhile, the quality no reference (QNR) metric, which is a representative quality index used in assessing pansharpened images, examines the cross similarity between each pair of pansharpened images [44]. However, QNR is not strongly correlated with the results of quality evaluations based on the synthesis and consistency properties [43]. In particular, the QNR index does not efficiently reflect spatial quality; artifacts and saturation of spatial details are visible in some pansharpened images with high QNR values. Therefore, in this work, we employ the consistency property to evaluate the quality of pansharpened images.
To estimate the quality of pansharpened images based on the consistency property, we employ the Erreur Relative Globale Adimensionnelle de Synthèse (ERGAS), the spectral angle mapper (SAM) algorithm, the Q4/Q8 metric, the spatial correlation coefficient (sCC) and the average gradient (AG) [9,12,43,45,46,47]. Particularly when assessing spatial quality, visual analysis was prioritized over quantitative evaluation [9,43]. The quality indices used in this experiment are specified as follows.
1. ERGAS
This metric calculates the global relative spectral/spatial error of pansharpened images [9,43]. It is given by Equation (12).
ERGAS = 100 R 1 N k = 1 N ( RMSE ( I k , J k ) μ ( I k ) ) 2
where I k and J k are the reference multispectral and pansharpened images, respectively, and R is the spatial resolution ratio. The closer the ERGAS value is to zero, the less distorted the pansharpened image is.
2. SAM
This metric calculates the average difference in angle between the corresponding pixels of the reference and pansharpened images [9,43]. It is defined as Equation (13).
SAM = arccos ( I { k } , J { k } I { k } J { k } )
where I { k } indicates a pixel vector of image I in the k-th band. The SAM index approaches zero when the pansharpened image is similar to the reference image.
3. Q4/Q8
Wang and Bovik proposed the Q-index [45]. It quantifies three factors, loss of correlation, luminance distortion and contrast distortion, using Equation (14).
Q = σ I J σ I σ J 2 I J ¯ ( I ¯ ) 2 + ( J ) 2 2 σ I σ J ( σ I 2 + σ J 2 )
where σ I J is the covariance of I and J . The Q-index has a range of [ 1 , 1 ] and the optimal value of the Q-index is one. The Q4 and Q8 metrics are hypercomplex vector extensions of the Q-index that can be applied to multispectral images with 2 n bands, where n is an integer [46]. In the case of the Q4 index, each pixel in a multispectral image with four bands is modeled as a quaternion, whereas each pixel in multispectral images with eight bands, such as those produced by WorldView-2 and -3, is modeled as an octonion.
4. sCC
This metric is based on the spatial similarity between reference and pansharpened images. The correlation coefficient between the spatial details of the reference and pansharpened images, as determined using the Laplacian filter of Equation (10), is used to measure sCC [12]. The closer the sCC is to one, the greater the spatial similarity of the pansharpened image and the reference dataset is. In this manuscript, we extracted the sCC using the original panchromatic images as reference datasets.
5. AG
This metric is defined as the amount of high-frequency information in the pansharpened image. The AG reflects the spatial sharpness in terms of the spatial difference between the pixels in the pansharpened image. It is calculated using Equation (15) [33,47,48].
AG = 1 N k = 1 N ( 1 R × C x = 1 R 1 1 C 1 ( F k ( x , y ) x ) 2 + ( F k ( x , y ) y ) 2 2 )
where F is a pansharpened image of pixel size R × C , and F k ( x , y ) x indicates the pixel differential of F in the k-th band at position (x, y). High AG values indicate pansharpened images with high spatial sharpness. However, high AG values may affect the degree of spectral distortion because there is a tradeoff between spectral and spatial distortion.

4.2. Test Data

In this work, datasets obtained from three different sensors are applied. Their characteristics are summarized in Table 2, and an overview of the datasets is provided in Figure 6. The details of the test data are as follows.
1. KOMPSAT-3
The Korean Multi-Purpose Satellite (KOMPSAT)-3 was launched by the Korea Aerospace Research Institute (KARI) on 17 May 2012. The site of the experiment includes various land cover types, such as buildings and mountainous and vegetated areas of the Sejong region in Korea. The spatial resolution of KOMPSAT-3 is 0.7 m (panchromatic) at nadir.
2. KOMPSAT-3A
KOMPSAT-3A was launched by KARI on 26 May 2015. The characteristics of KOMPSAT-3A are similar to those of KOMPSAT-3. However, the images collected by KOMPSAT-3A have a higher spatial resolution than the images acquired by the KOMPSAT-3 sensor, as shown in Table 2. As with the site examined using KOMPSAT-3 data, the site examined using KOMPSAT-3A data is located in the Sejong region in Korea. This site contains mainly mountainous areas with urban areas. Therefore, it can be used for the evaluation of pansharpening algorithms using data from different sensors.
3. WorldView-3
The site examined using the WorldView-3 sensor is a rural area that contains farmland and wetlands within the Beolgyo region in Korea. The WorldView-3 sensor provides one panchromatic and eight multispectral bands. Using this dataset, we assessed the performance of the algorithm when various multispectral bands are sharpened.

4.3. Experimental Results and Analysis

To evaluate the performance of the proposed pansharpening algorithm, the pansharpening results obtained using our method are compared to several representative pansharpening algorithms. Primarily CS-based algorithms are selected because our algorithm is based on CS for the injection of spatial details, and the tendency of the evaluation indices resulting from CS-based algorithms is different from that of MRA-based algorithms. An overview of the algorithms employed follows.
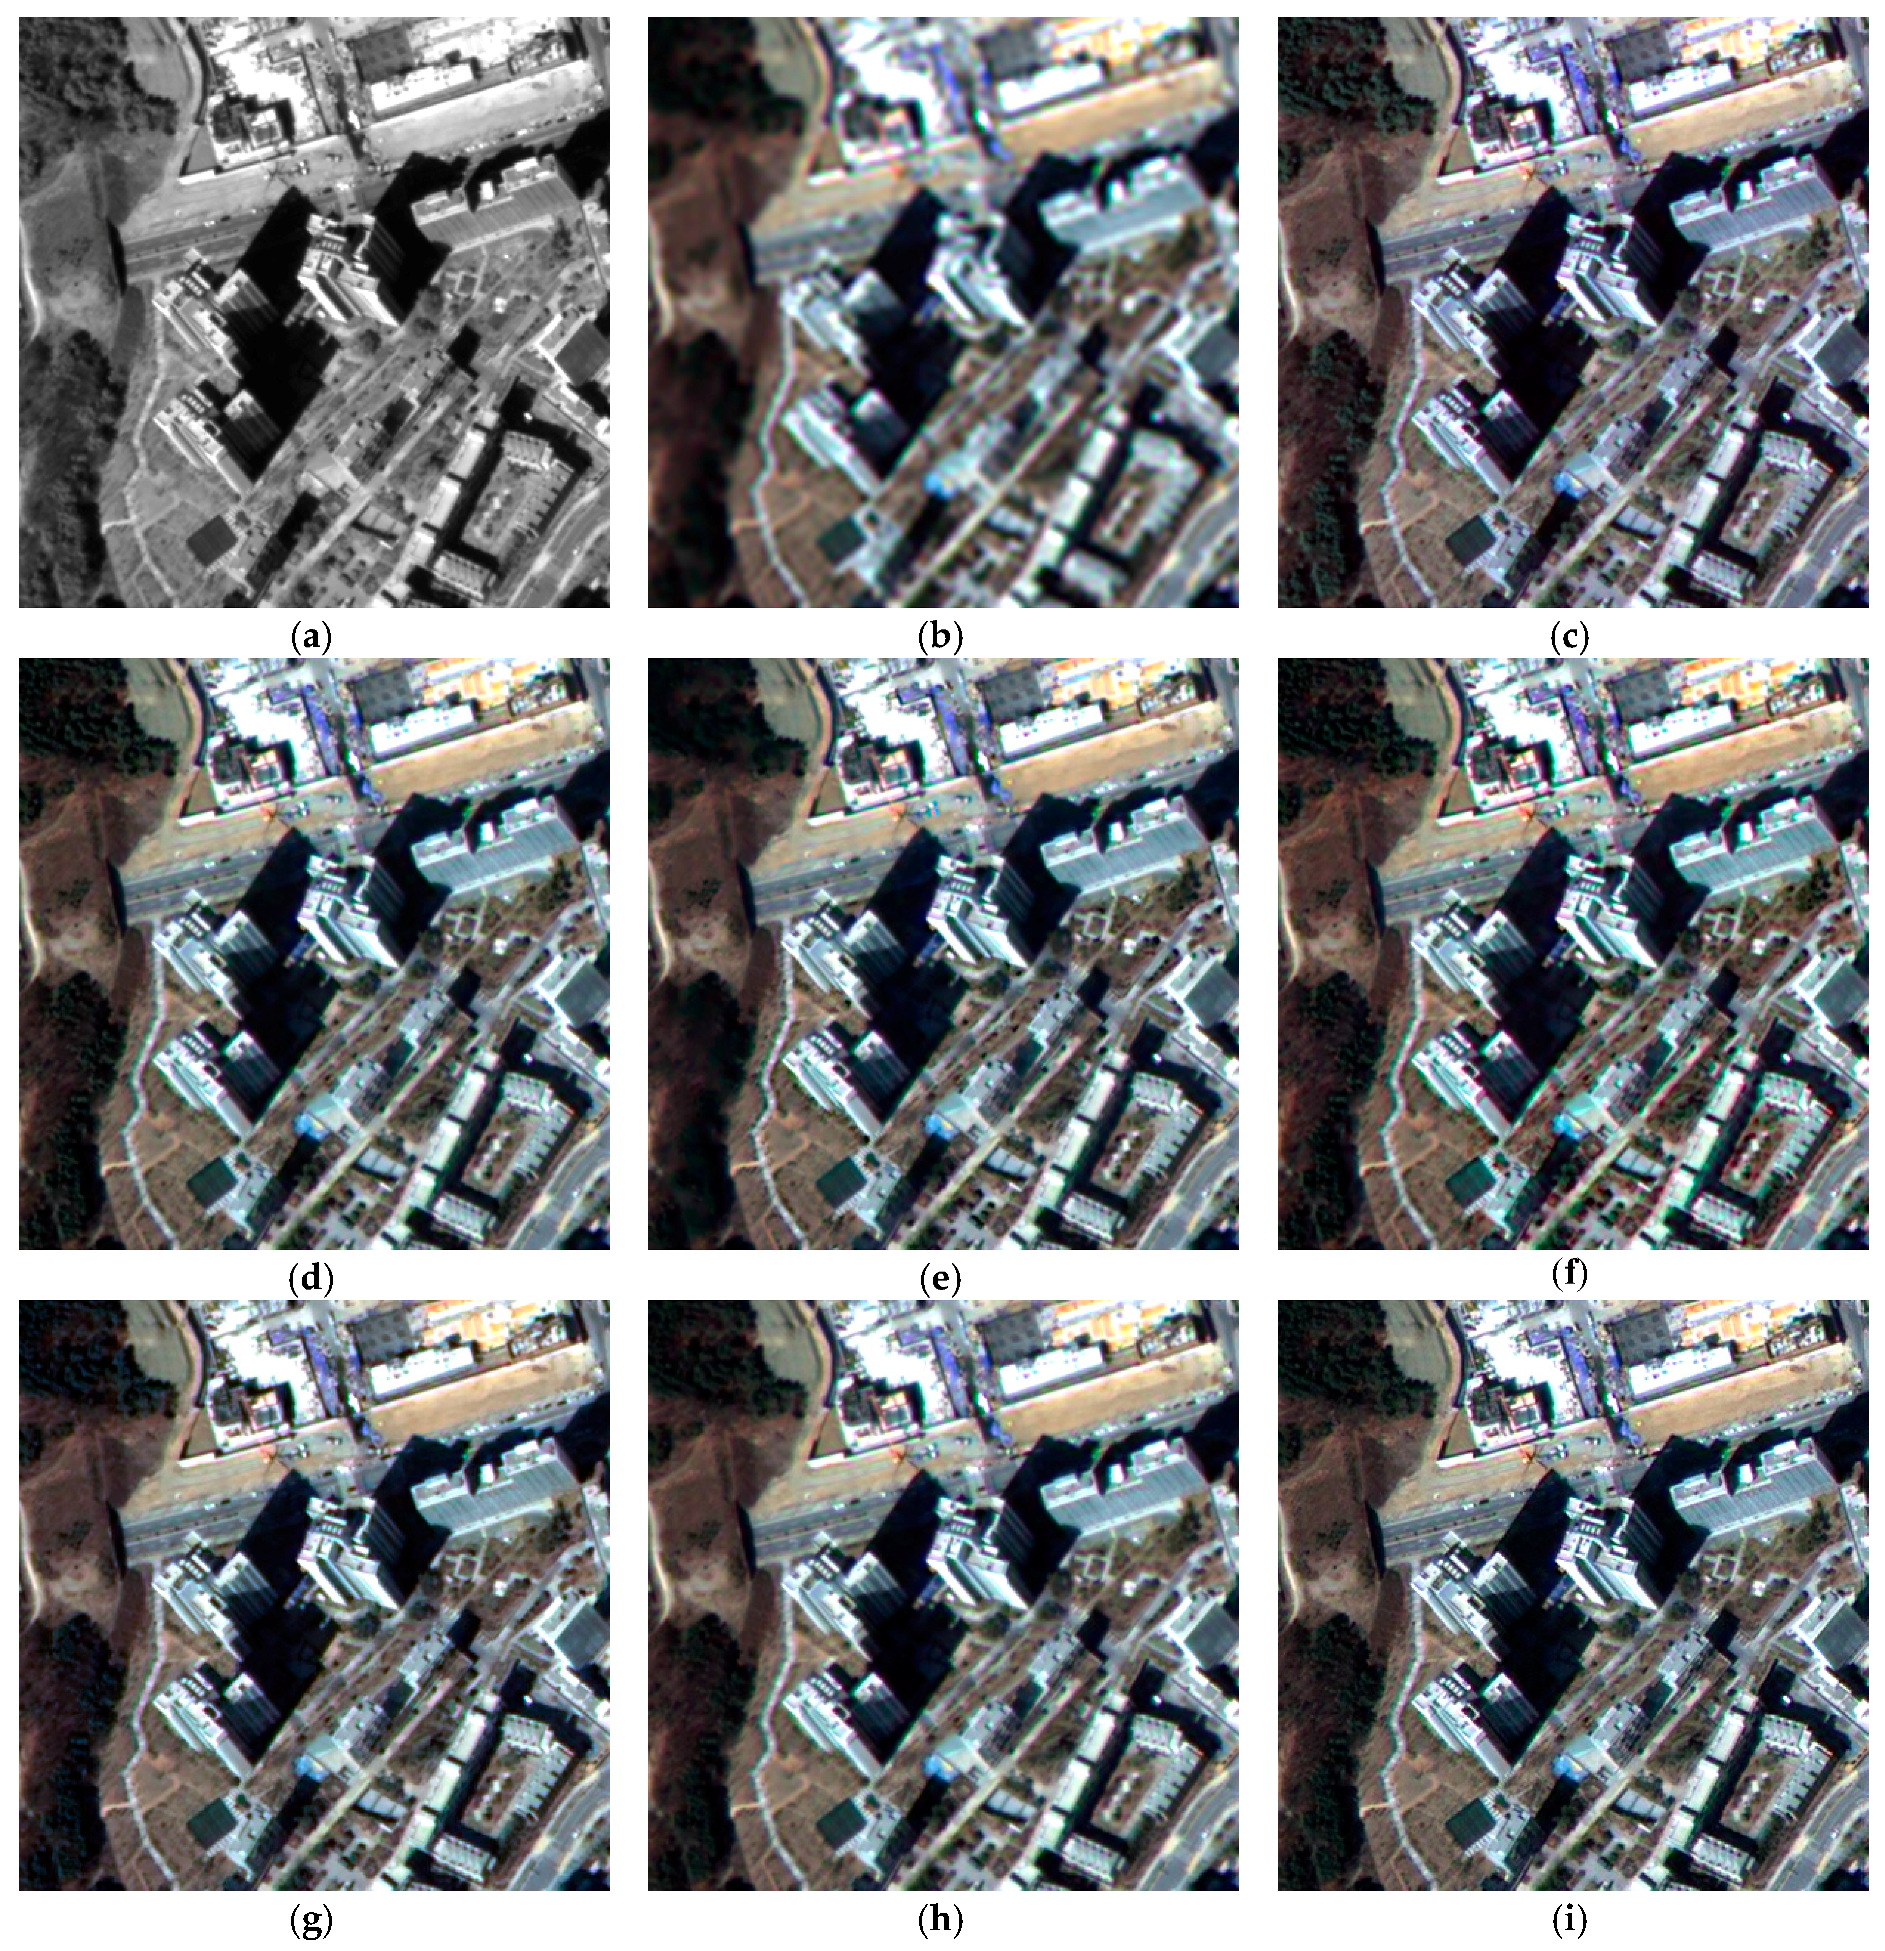
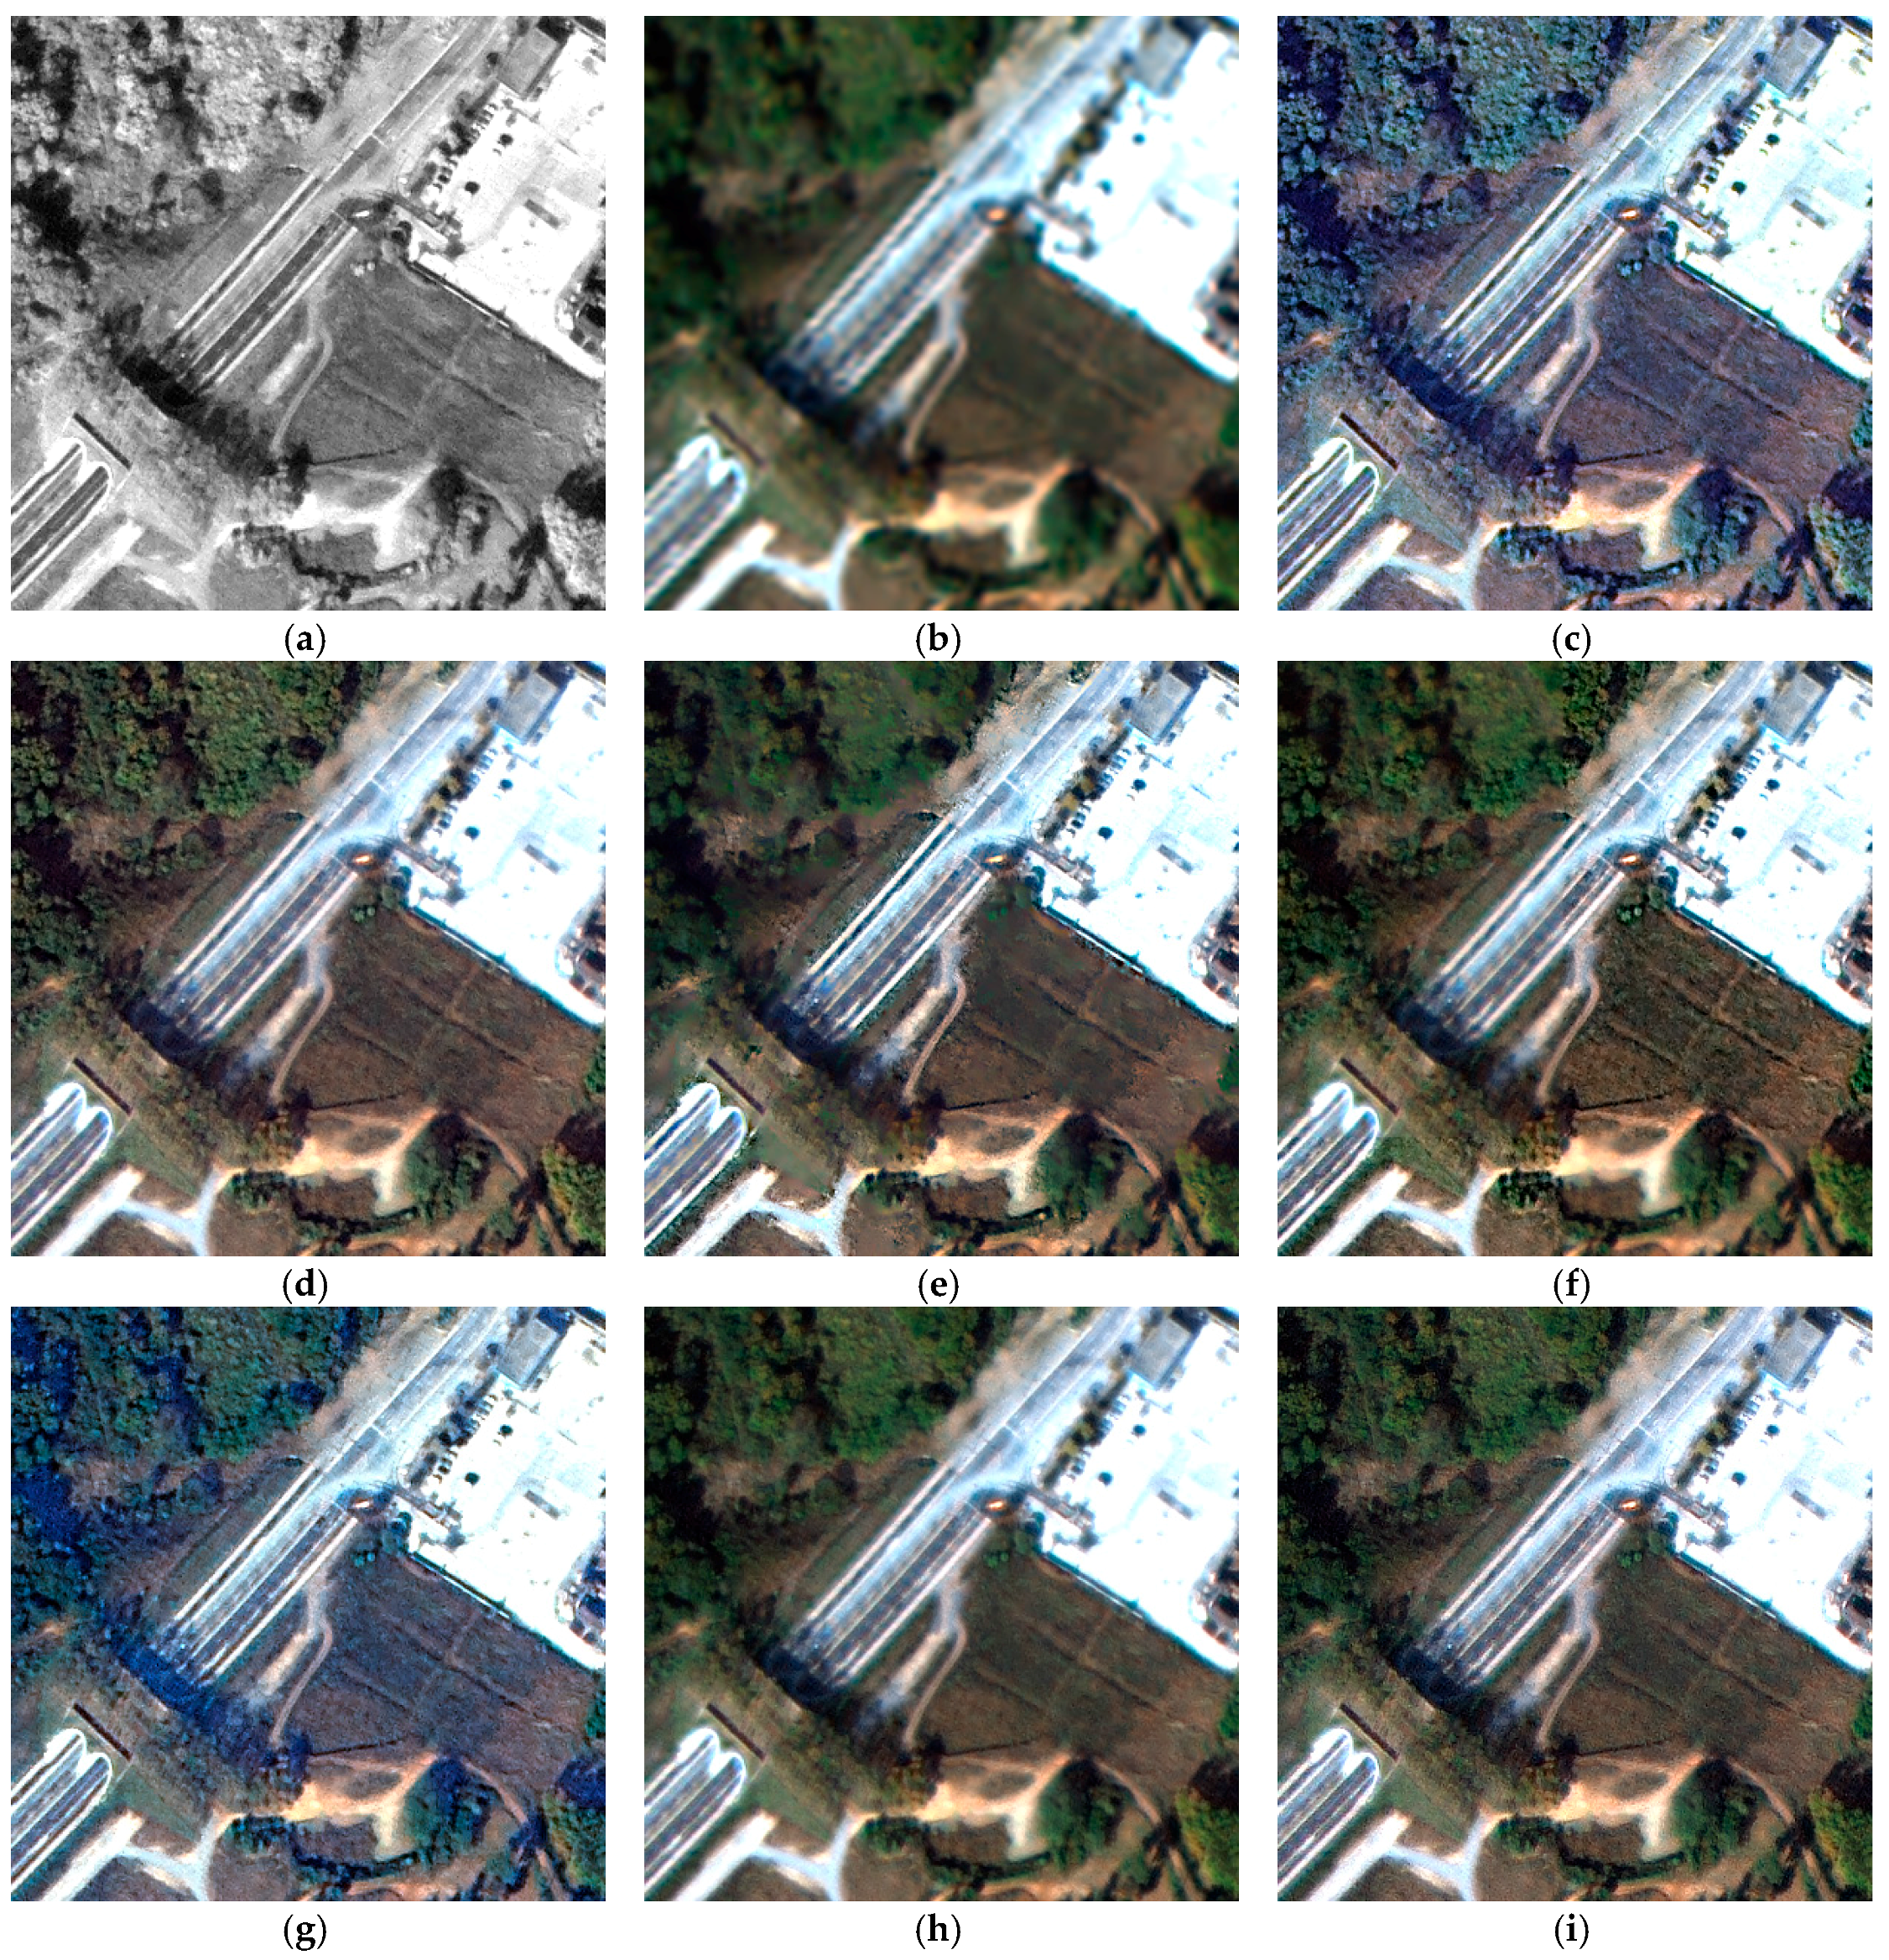
  • EXP: expanded multispectral image. EXP is interpolated to the image size of the pansharpened image using a polynomial kernel with 23 coefficients [16].
  • GIHS: generalized intensity-hue-saturation image fusion [21].
  • GSA: Gram–Schmidt adaptive [29]. GSA is subdivided into GSAG and GSAL, depending on whether local injection gains are used. GSAG uses global injection gains, whereas GSAL utilizes local injection gains determined using overlapping image blocks.
  • BDSD: band-dependent spatial detail with local parameter estimation [9,31]. The BDSD algorithm is generally applied using non-overlapping image blocks. In this manuscript, image blocks with a window size of 256, which are the same size as those applied in our algorithm, are used.
  • NNDiffuse: nearest-neighbor diffusion-based pansharpening algorithm [34]. This approach has been implemented in the ENVI software package.

4.3.1. Quantitative Analysis

Table 3 represents the quantitative results of the spatial and spectral quality indices based on the consistency property corresponding to the datasets obtained using the three different sensors. In Table 3, HP-NDVIspectral indicates hybrid pansharpening using NDVI based on the spectral mode, and HP-NDVIspatial is based on the proposed spatial mode.
As shown in Table 3, the pansharpened images obtained using the GIHS algorithm generally show poor values of the quantitative indices; however, the results of using GIHS to pansharpen the KOMPSAT-3 data are associated with the highest sCC value. The results of applying GSAG to the KOMPSAT-3A and WorldView-3 data are associated with the highest sCC values. Moreover, the spectral quality of GSAG is associated with low ERGAS and SAM values compared to those of GSAL, although GSAL employs local injection gains. The result of pansharpening the KOMPSAT-3A data using GSAL shows a higher Q4 value than that obtained using GSAG. This result indicates that the results of the GSA algorithm based on global and local injection gains may depend on the spectral and spatial characteristics of the original data. The pansharpening result obtained using the BDSD algorithm shows the best ERGAS, SAM and Q4/Q8 values compared to those obtained using GIHS, GSA and NNDiffuse. A large amount of spectral distortion occurs in the case of NNDiffuse, whereas the AG value associated with NNDiffuse is very large. This result indicates that NNDiffuse may frequently produce over-sharpened images during the injection of high-frequency information. The pansharpened images obtained using our algorithms, HP-NDVIspectral and HP-NDVIspatial, have lower ERGAS and SAM values than those obtained with other pansharpening methods for all of the datasets examined. The Q4 and Q8 values obtained from pansharpened images produced by our algorithms are also higher than those associated with any of the other algorithms. The pansharpened images obtained using HP-NDVIspatial tend to have lower spectral quality indices compared to those of HP-NDVIspectral, whereas the highest AG values are associated with the application of HP-NDVIspatial to the KOMPSAT-3 and Worldview-3 datasets (though not the KOMPSAT-3A dataset). However, in terms of the pansharpening results obtained using the KOMPSAT-3A dataset, the higher AG value obtained using NNDiffuse is due to the over-injection of high-frequency information. This result indicates that HP-NDVIspectral has advantages in minimizing spectral distortion, and HP-NDVIspatial is efficient in producing spatial sharpness. In particular, HP-NDVIspatial showed the best spectral quality and AG values compared to the results from GSAG, GSAL, BDSD and NNDiffuse, though not HP-NDVIspectral.

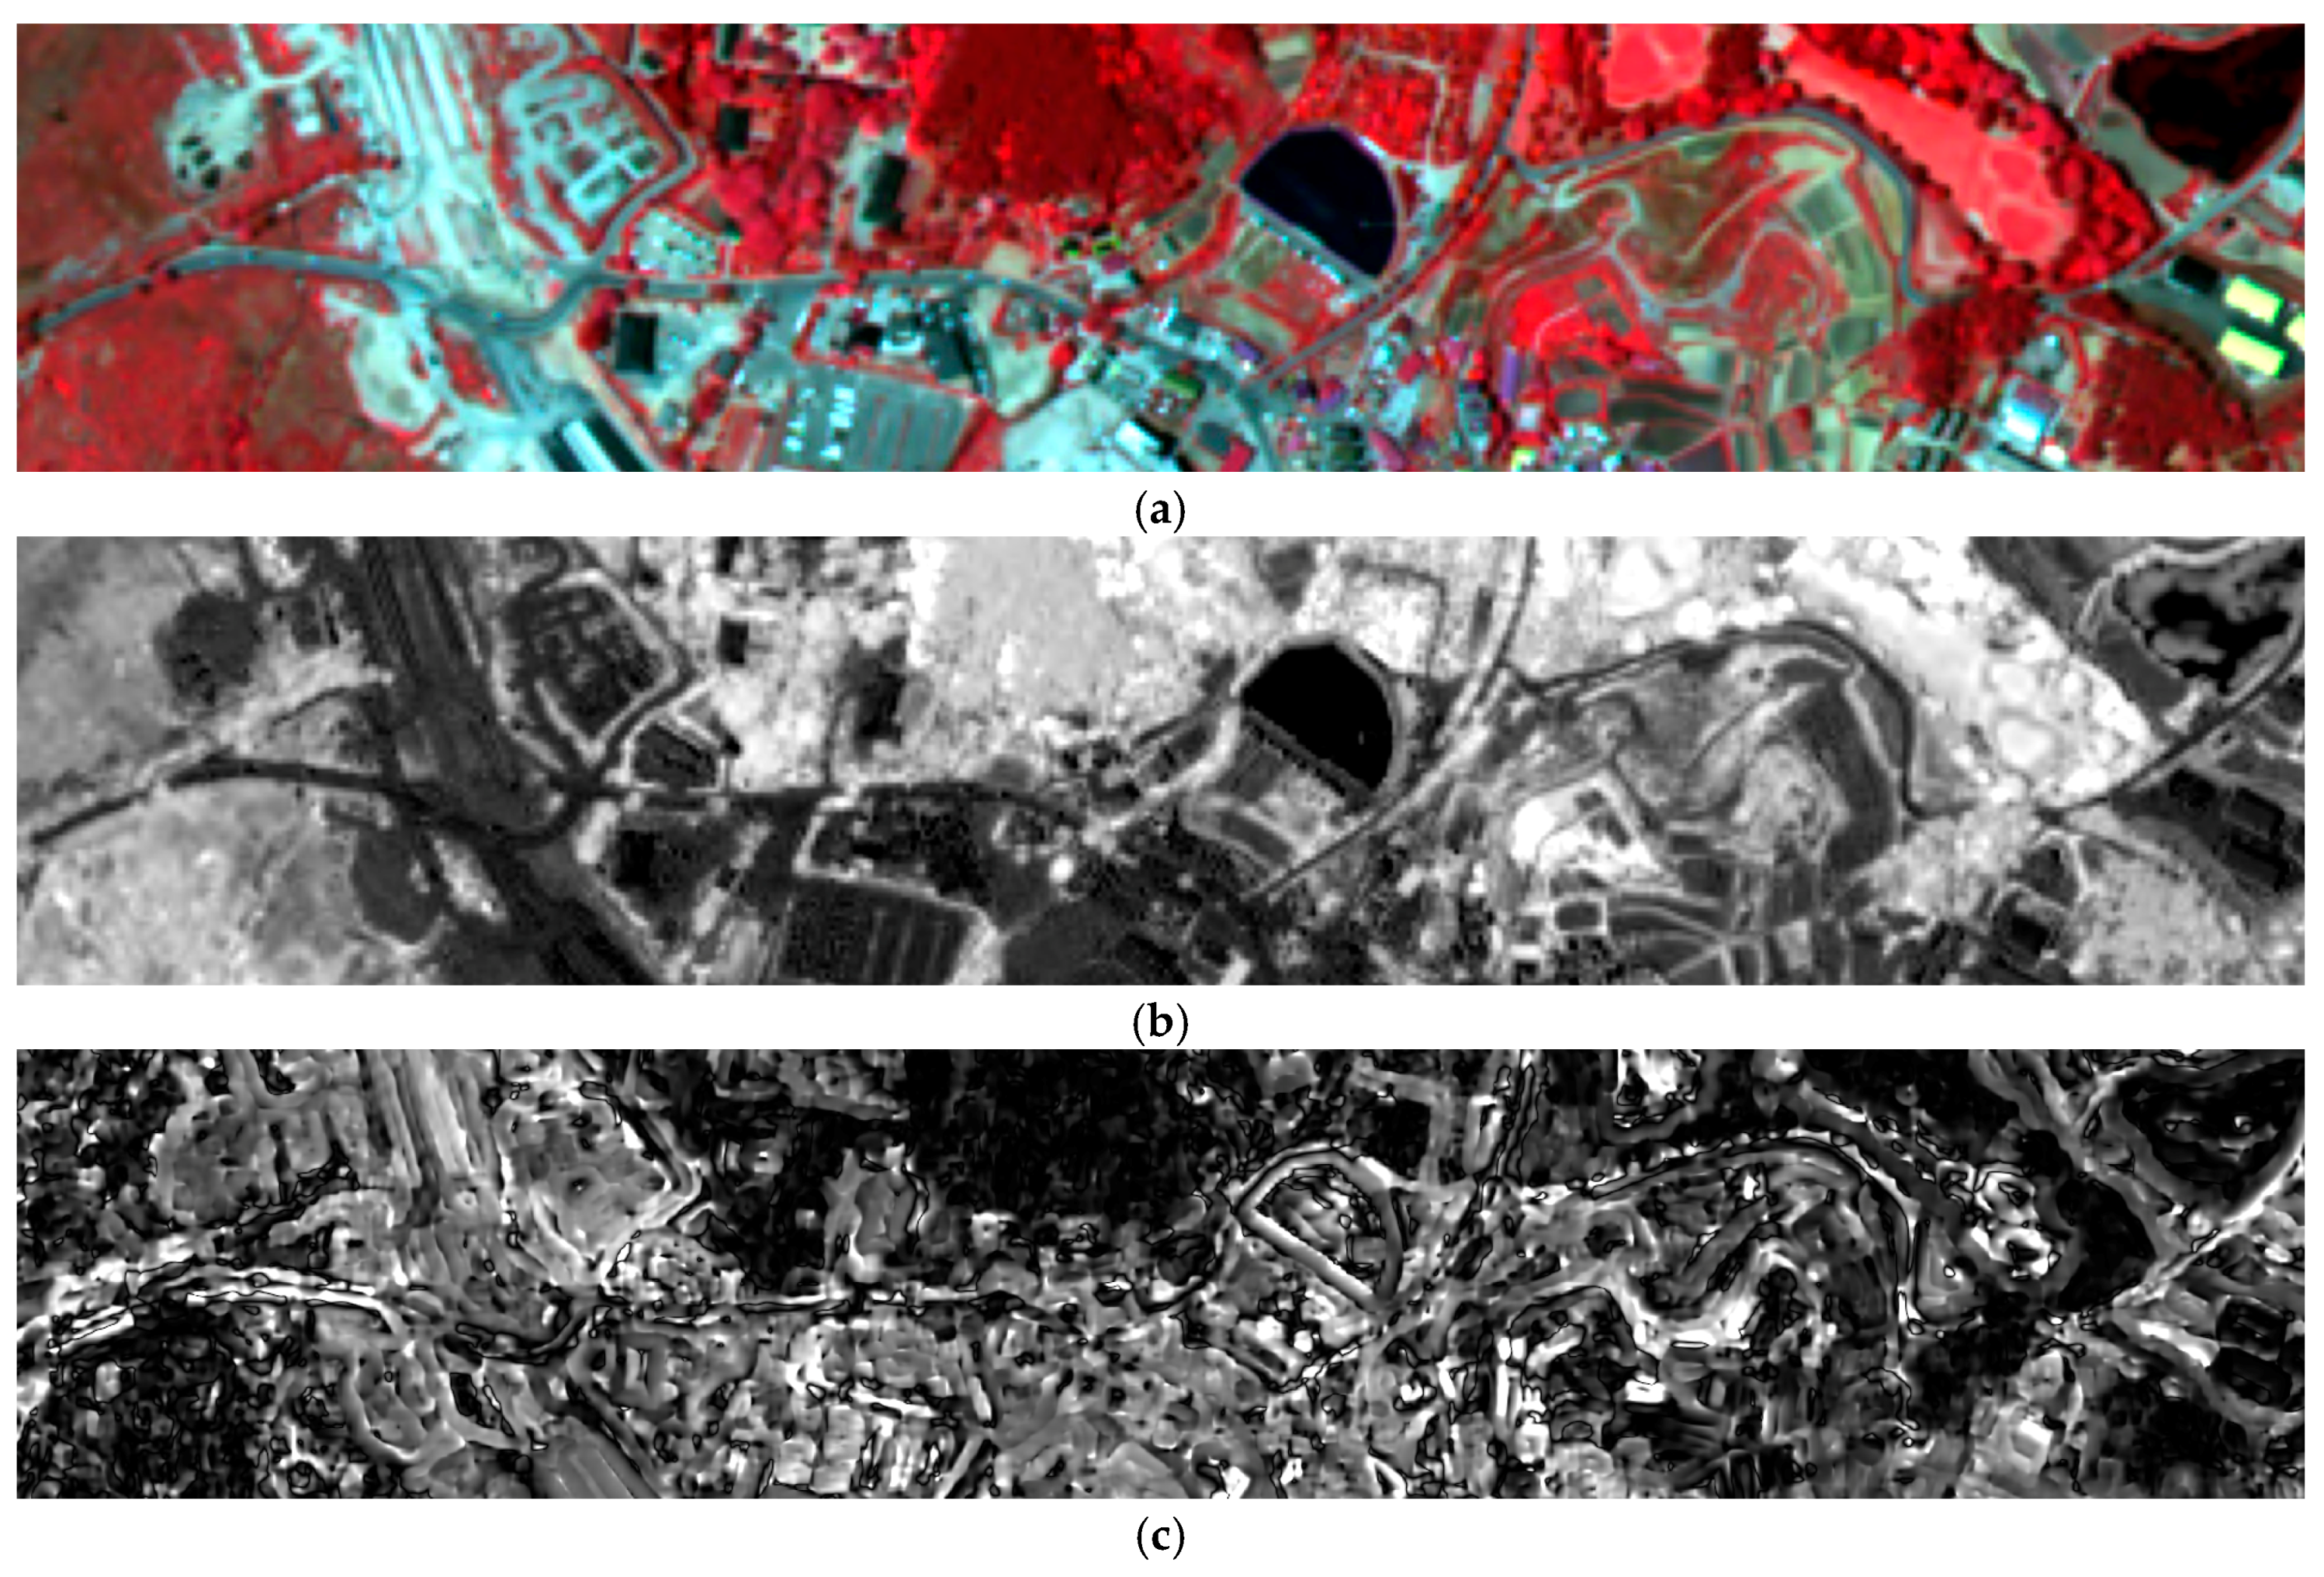
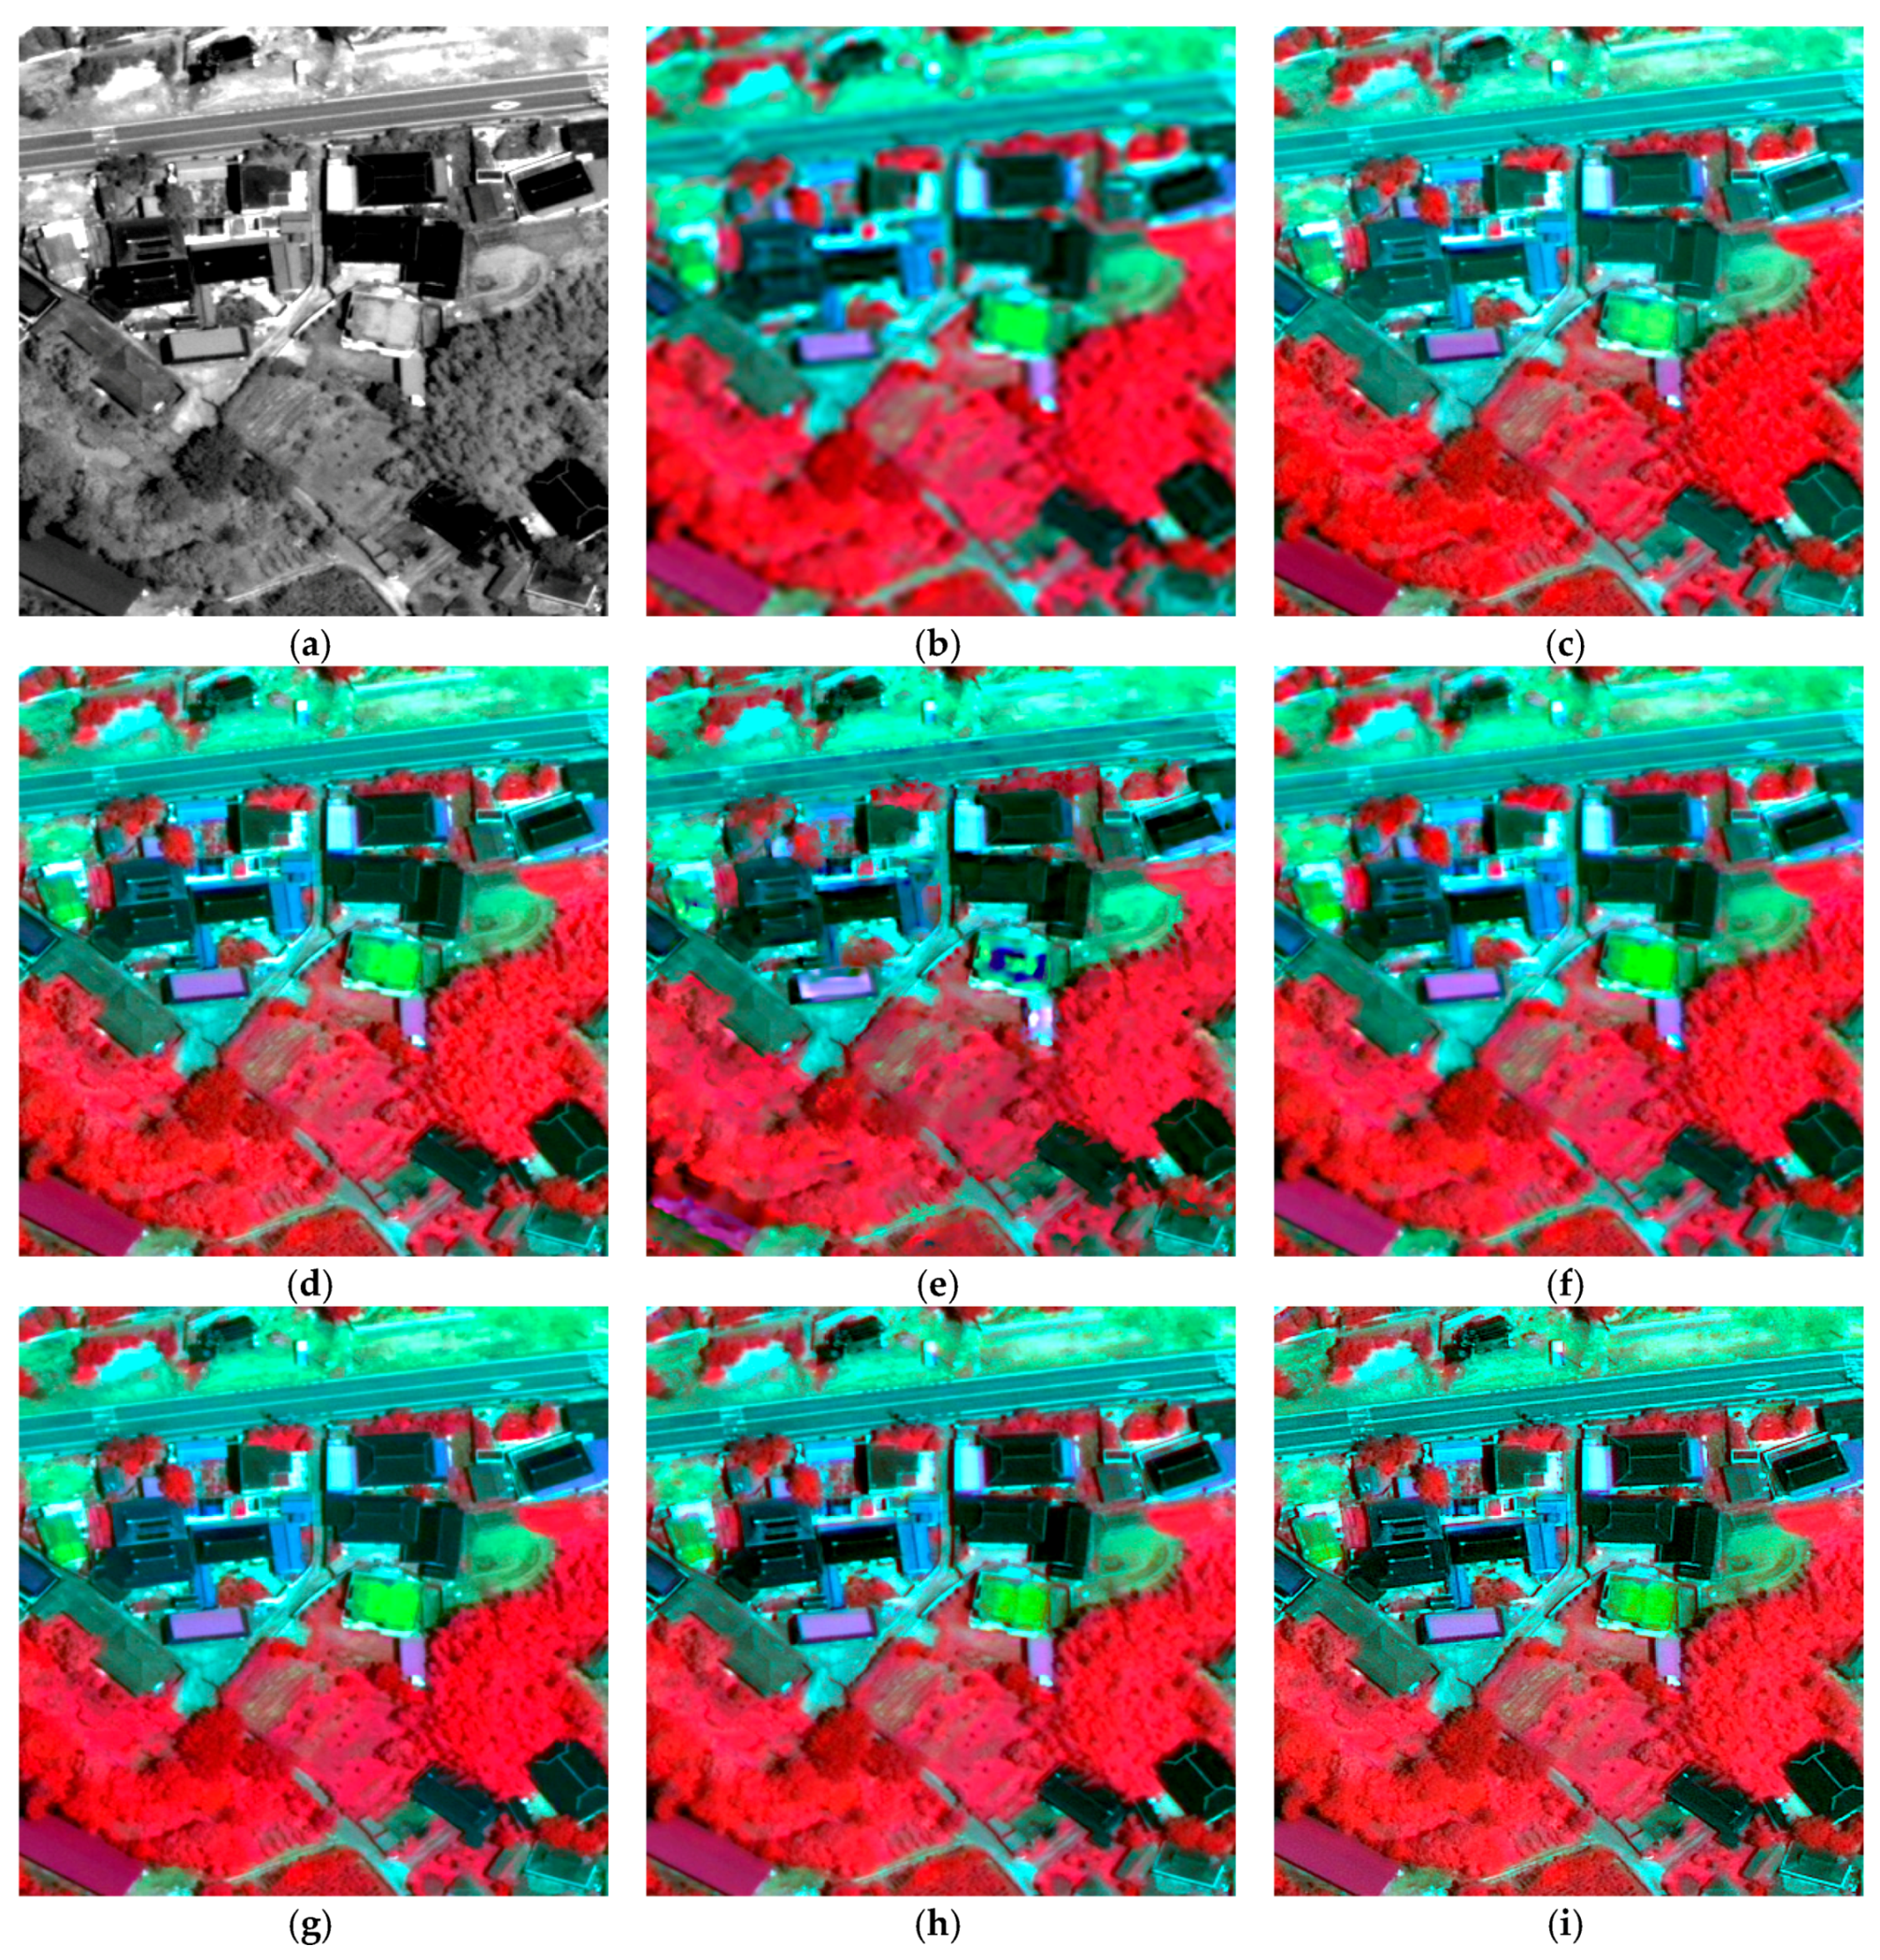
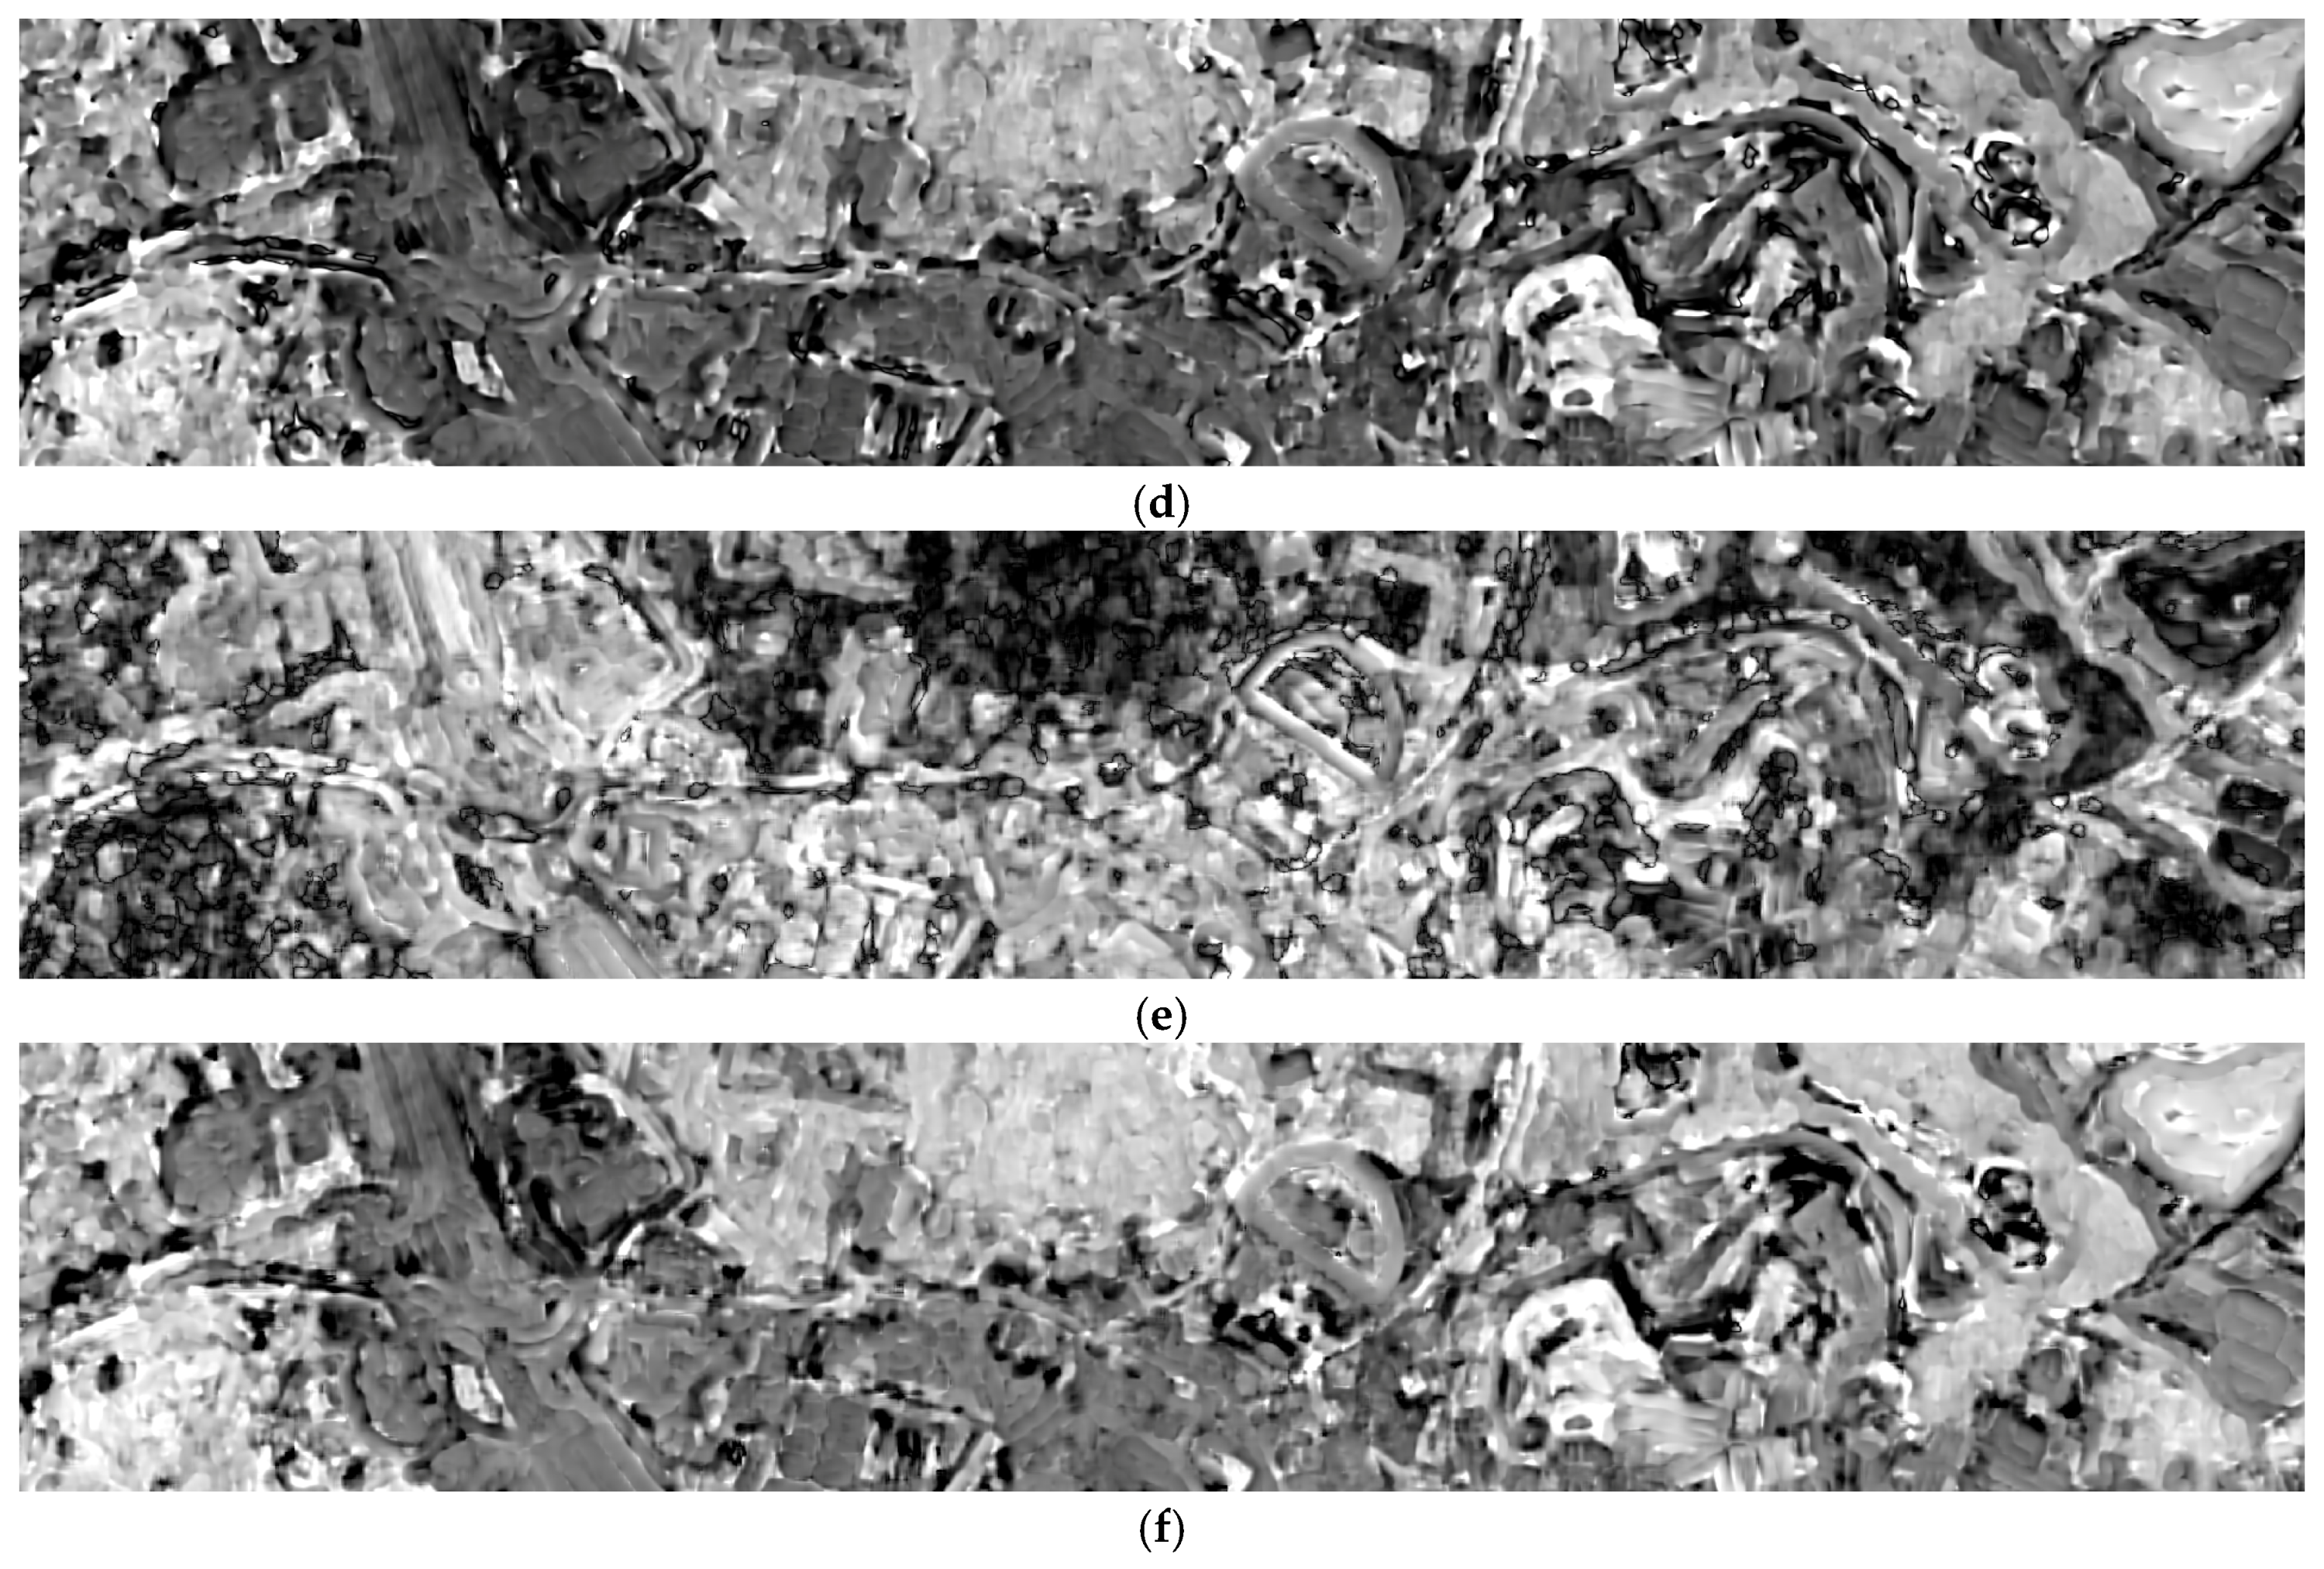
4.3.2. Qualitative Analysis

Figure 7, Figure 8 and Figure 9 represent the visual results for detailed 400 × 400 subregions of the pansharpened images obtained from each satellite sensor. The pansharpening results obtained using GIHS show the largest spectral distortion in vegetated areas and forests (Figure 7c and Figure 8c). However, the sharpened images obtained using GIHS show good visual quality in terms of spatial sharpness, whereas most of the vegetated area is over-sharpened. The GSA-based technique shows relatively high spectral distortion. In addition, in the case of the result obtained using GSAL, the spatial clarity of the fused image decreases due to the error in the boundary portion of the local process, as shown in Figure 8e and Figure 9e. In the case of NNDiffuse, the spatial clarity was represented effectively, but spectral distortion was also generated. Visual inspection shows that the pansharpened image obtained using NNDiffuse displays greatly improved spatial sharpness; however, the spectral distortion caused by the tradeoff between spectral and spatial quality has also increased substantially. As shown in Figure 8g in particular, the pansharpened image obtained using the KOMPSAT-3A dataset shows that excessive high-frequency information has been injected, which indicates that NNDiffuse cannot be applied independently to the data from the various sensors. The pansharpening results from BDSD confirm that, although less spectral distortion occurs overall, the spatial clarity in some areas has decreased. This observation indicates that the injection gains based on non-overlapping block processing differ significantly from each other in the BDSD algorithm. Therefore, some differences in pixel values occur at the boundaries between the blocks (Figure 8f). In addition, as seen in the results obtained using the WorldView-3 dataset, blurring or saturation occurs in some areas (Figure 9f). Although the method proposed in this manuscript is a block-based injection gain technique that employs NDVI, the errors associated with spectral distortion occurring at the boundaries of the blocks are relatively small compared with those seen in the results of pansharpening performed using BDSD. It can be confirmed that, of the proposed methods, HP-NDVIspectral causes the least spectral distortion, and the results of this method show spectral fidelity to the original multispectral image and have characteristics that are similar to those of the original image. In particular, the results of the HP-NDVIspatial method have the best spatial clarity, compared to the existing algorithms (Figure 7i, Figure 8i and Figure 9i). Meanwhile, the sCC values associated with HP-NDVIspatial are relatively low because the pansharpened images obtained using HP-NDVIspatial are based on the injection of secondary high-frequency information, which is not highly correlated with the high-frequency information contained in the original panchromatic image. However, the pansharpened image obtained using HP-NDVIspatial has the best visual clarity. In addition, then, HP-NDVIspatial has the best AG value among the results obtained using the KOMPSAT-3 and Worldview-3 datasets.

5. Discussion

This manuscript proposes a new pansharpening algorithm that applies local injection models to NDVI to minimize spectral distortion while maintaining spatial clarity. Quantitative and qualitative assessments of the results of the proposed algorithm yield the following findings.
(1) In quantitative assessments performed by applying spectral quality indices to the pansharpened images, the pansharpened images produced by HP-NDVIspectral are associated with the lowest ERGAS and SAM values and the highest Q4/Q8 values in all of the datasets obtained using three different satellite sensors. In addition, except for the results obtained using HP-NDVIspectral, the pansharpening results obtained using HP-NDVIspatial show better spectral quality than those obtained using existing state-of-the-art pansharpening algorithms. Therefore, these results indicate that the proposed technique for determining injection gains based on NDVI minimizes the spectral distortion of pansharpened images.
(2) In the evaluation of spatial quality, the sCC values of the pansharpened images obtained using HP-NDVIspatial are lower than those of the pansharpening results obtained using HP-NDVIspectral; however, the pansharpened images obtained using HP-NDVIspatial display the best spatial clarity when inspected visually. In addition, the pansharpened images obtained using HP-NDVIspatial have higher sCC values compared to those obtained using GSAL, BDSD and NNDiffuse. This result indicates that the AG index provides a more efficient assessment of the spatial quality and clarity of pansharpened images than the sCC index, because the sCC index evaluates only the similarity between the original panchromatic and pansharpened images. However, the spatial characteristics of each multispectral band used in pansharpening differ from those of the panchromatic image. Therefore, in the experimental analysis, the AG index and visual estimation provide more effective evaluations of the spatial quality and clarity of pansharpened images. From this point of view, we conclude that the proposed hybrid pansharpening algorithm based on the spatial mode increases the spatial clarity while maintaining the spectral characteristics of HP-NDVIspectral.
(3) The algorithm proposed in this work are intended to generate pansharpened images with optimal spectral and spatial quality and to reduce the computational costs associated with image processing. For example, because algorithms that employ overlapping block-based processes, such as hybrid pansharpening and GSAL, have very high computational costs, they are difficult to apply to large volumes of satellite imagery. Therefore, we compare the computational complexity of GSAG and GSAL, which are representative algorithms that are based on global and local injection gains, in order to evaluate the efficiency of the extraction of local injection gains using our algorithms. The experiment was carried out using a 64 bit quad-core CPU (3.50 GHz processor). As seen in Table 4, HP-NDVIspatial has a computational cost that is similar to that of GSAG, which is based on global injection gains, and its processing time is much faster than that of GSAL, which is based on local injection gains.
Therefore, it is confirmed that the processing speed associated with the use of local injection gains in our proposed algorithms, which employ NDVI, is similar to those of pansharpening algorithms based on global injection gains.
(4) In pansharpening algorithms based on non-overlapping block processing, such as BDSD, some spatial and spectral distortion may occur at block boundaries. Our proposed algorithms employ non-overlapping block processing to generate optimal intensity images; however, it has been confirmed that the proposed method does not cause spectral and spatial distortion at the block boundaries when compared with the results obtained using the BDSD method.
(5) Based on the above discussion, we make the following suggestions. The proposed pansharpening algorithms can be effectively applied to data collected by various satellite sensors with various spectral and spatial resolutions. In particular, based on quantitative and qualitative assessments, HP-NDVIspectral can be utilized in applications that employ spectral information, such as image classification and change detection, whereas HP-NDVIspatial can be applied to image interpretation and feature extraction.

6. Conclusions

In this work, a new pansharpening algorithm that applies local injection models to NDVI to minimize spectral distortion while maintaining spatial clarity and that have a low computational cost is developed. This algorithm is based on the assumption that the general local injection gains obtained from each band of satellite imagery are positively or negatively correlated with the NDVI. Two variants of this algorithm, which are named HP-NDVIspectral and HP-NDVIspatial, according to their spectral and spatial characteristics, are applied to the satellite imagery obtained using various sensors. The results of these experiments show that the HP-NDVIspectral algorithm displays the least spectral distortion. In addition, the HP-NDVIspatial algorithm displays the best spectral and spatial quality compared to existing algorithms, whereas the computational cost of the proposed algorithms is similar to that of traditional pansharpening algorithms based on global injection models. Therefore, spectral-based analysis involving image classification can be performed using pansharpened images obtained with HP-NDVIspectral, whereas image interpretation can be performed using pansharpened images obtained with HP-NDVIspatial.

Acknowledgments

This work was supported by the Space Core Technology Development Program through the National Research Foundation of Korea (NRF), which is funded by the Ministry of Science, ICT & Future Planning (NRF-2014M1A3A3A03034798), and the Basic Science Research Program through the National Research Foundation of Korea (NRF), which is funded by the Ministry of Education (NRF-2017R1D1A3B03034602).

Author Contributions

Jaewan Choi designed the proposed algorithm, implemented the experiments and wrote the manuscript. Guhyeok Kim, Nyunghee Park and Honglyun Park provided support in carrying out the experiments. Seokkeun Choi provided guidance in developing the proposed algorithm and provided suggestions for improving the manuscript.

Conflicts of Interest

The authors declare no conflict of interest.

References

  1. Zhang, Y. Understanding image fusion. Photogramm. Eng. Remote Sens. 2004, 70, 653–660. [Google Scholar]
  2. Byun, Y.; Choi, J.; Han, Y. An area-based image fusion scheme for the integration of SAR and optical satellite imagery. IEEE J. Sel. Top. Appl. Earth Obs. Remote Sens. 2013, 6, 2212–2220. [Google Scholar] [CrossRef]
  3. Ghassemian, H. A review of remote sensing image fusion methods. Inf. Fusion 2016, 32, 75–89. [Google Scholar] [CrossRef]
  4. Nencini, F.; Garzelli, A.; Baronti, S.; Alparone, L. Remote sensing image fusion using the curvelet transform. Inf. Fusion 2007, 8, 143–156. [Google Scholar] [CrossRef]
  5. Alparone, L.; Wald, L.; Chanussot, J.; Thomas, C.; Gamba, P.; Bruce, L.M. Comparison of pansharpening algorithms: Outcome of the 2006 GRS-S data-fusion contest. IEEE Trans. Geosci. Remote Sens. 2007, 45, 3012–3021. [Google Scholar] [CrossRef] [Green Version]
  6. Bovolo, F.; Bruzzone, L.; Capobianco, L.; Garzelli, A.; Marchesi, S.; Nencini, F. Analysis of the effects of pansharpening in change detection on VHR images. IEEE Geosci. Remote Sens. Lett. 2010, 7, 53–57. [Google Scholar] [CrossRef]
  7. Johnson, B. Effects of pansharpening on vegetation indices. ISPRS Int. J. Geo-Inf. 2014, 3, 507–522. [Google Scholar] [CrossRef]
  8. Laporterie-Déjean, F.; de Boissezon, H.; Flouzat, G.; Lefèvre-Fonollosa, M.-J. Thematic and statistical evaluations of five panchromatic/multispectral fusion methods on simulated PLEIADES-HR images. Inf. Fusion 2005, 6, 193–212. [Google Scholar] [CrossRef]
  9. Vivone, G.; Alparone, L.; Chanussot, J.; Mura, M.D.; Garzelli, A.; Licciardi, G.A.; Restaino, R.; Wald, L. A critical comparison among pansharpening algorithms. IEEE Trans. Geosci. Remote Sens. 2015, 53, 2565–2586. [Google Scholar] [CrossRef]
  10. Chavez, P.S., Jr.; Sides, S.C.; Anderson, J.A. Comparison of three different methods to merge multiresolution and multispectral data: Landsat TM and SPOT panchromatic. Photogramm. Eng. Remote Sens. 1991, 57, 295–303. [Google Scholar]
  11. González-Audícana, M.; Otazu, X.; Fors, O.; Seco, A. Comparison between Mallat’s and the ‘à trous’ discrete wavelet transform based algorithms for the fusion of multispectral and panchromatic images. Int. J. Remote Sens. 2005, 26, 595–614. [Google Scholar] [CrossRef]
  12. Otazu, X.; González-Audícana, M.; Fors, O.; Núñez, J. Introduction of sensor spectral response into image fusion methods. Application to wavelet-based methods. IEEE Trans. Geosci. Remote Sens. 2005, 43, 2376–2385. [Google Scholar] [CrossRef] [Green Version]
  13. Kim, Y.; Lee, C.; Han, D.; Kim, Y.; Kim, Y. Improved additive-wavelet image fusion. IEEE Geosci. Remote Sens. Lett. 2011, 8, 263–267. [Google Scholar] [CrossRef]
  14. Amro, I.; Mateos, J. General shearlet pansharpening method using Bayesian inference. In Proceedings of the Signal Processing: Algorithms, Architectures, Arrangements, and Applications (SPA), Poznan, Poland, 26–28 September 2013; pp. 231–235. [Google Scholar]
  15. Aiazzi, B.; Baronti, S.; Lotti, F.; Selva, M. A comparison between global and context-adaptive pansharpening of multispectral images. IEEE Geosci. Remote Sens. Lett. 2009, 6, 302–306. [Google Scholar] [CrossRef]
  16. Aiazzi, B.; Alparone, L.; Baronti, S.; Garzelli, A. Context-driven fusion of high spatial and spectral resolution images based on oversampled multiresolution analysis. IEEE Trans. Geosci. Remote Sens. 2002, 40, 2300–2312. [Google Scholar] [CrossRef]
  17. Aiazzi, B.; Alparone, L.; Baronti, S.; Garzelli, A.; Selva, M. An MTF-based spectral distortion minimizing model for pan-sharpening of very high resolution multispectral images of urban areas. In Proceedings of the 2nd GRSS/ISPRS Joint Workshop Remote Sensing and Data Fusion URBAN Areas, Berlin, Germany, 22–23 May 2003; pp. 90–94. [Google Scholar]
  18. Yang, Y.; Wan, W.; Huang, S.; Lin, P.; Que, Y. A novel pan-sharpening framework based on matting model and multiscale transform. Remote Sens. 2017, 9, 391. [Google Scholar] [CrossRef]
  19. Restaino, R.; Vivone, G.; Mura, M.D.; Chanussot, J. Fusion of multispectral and panchromatic images based on morphological operators. IEEE Trans. Image-Process. 2016, 25, 2882–2895. [Google Scholar] [CrossRef] [PubMed]
  20. Aiazzi, B.; Alparone, L.; Baronti, S.; Garzelli, A.; Selva, M. MTF-tailored multiscale fusion of high-resolution MS and Pan imagery. Photogramm. Eng. Remote Sens. 2006, 72, 591–596. [Google Scholar] [CrossRef]
  21. Choi, J.; Yu, K.; Kim, Y. A new adaptive component-substitution based satellite image fusion by using partial replacement. IEEE Trans. Geosci. Remote Sens. 2011, 49, 295–309. [Google Scholar] [CrossRef]
  22. Tu, T.M.; Huang, P.S.; Hung, C.L.; Chang, C.P. A fast intensity-hue-saturation fusion technique with spectral adjustment for IKONOS imagery. IEEE Geosci. Remote Sens. Lett. 2004, 1, 309–312. [Google Scholar] [CrossRef]
  23. Kim, G.; Park, N.; Choi, S.; Choi, J. Performance evaluation of pansharpening algorithms for Worldview-3 satellite imagery. J. Korean Soc. Surv. Geodesy Photogramm. Cartogr. 2016, 24, 413–423. [Google Scholar] [CrossRef]
  24. Dou, W.; Chen, Y.; Li, X.; Sui, D.Z. A general framework for component substitution image fusion: An implementation using the fast image fusion method. Comput. Geosci. 2007, 33, 219–228. [Google Scholar] [CrossRef]
  25. Kim, Y.; Eo, Y.; Kim, Y.; Kim, Y. Generalized IHS-based satellite imagery fusion using spectral response functions. ETRI J. 2011, 33, 497–505. [Google Scholar] [CrossRef]
  26. Rahmani, S.; Strait, M.; Merkurjev, D.; Moeller, M.; Wittman, T. An adaptive IHS pan-sharpening method. IEEE Geosci. Remote Sens. Lett. 2010, 7, 746–750. [Google Scholar] [CrossRef]
  27. Chien, C.L.; Tsai, W.H. Image fusion with no gamut problem by improved nonlinear IHS transforms for remote sensing. IEEE Trans. Geosci. Remote Sens. 2014, 52, 651–663. [Google Scholar] [CrossRef]
  28. Laben, C.A.; Brower, B.V. Process for Enhancing the Spatial Resolution of Multispectral Imagery Using Pan-Sharpening. U.S. Patent 6,011,875, 4 January 2000. [Google Scholar]
  29. Aiazzi, B.; Alparone, L.; Baronti, S.; Selva, M. Improving component substitution pansharpening through multivariate regression of MS + Pan data. IEEE Trans. Geosci. Remote Sens. 2007, 45, 3230–3239. [Google Scholar] [CrossRef]
  30. Xu, Q.; Li, B.; Zhang, Y.; Ding, L. High-fidelity component substitution pansharpening by the fitting of substitution data. IEEE Trans. Geosci. Remote Sens. 2014, 52, 7380–7392. [Google Scholar]
  31. Garzelli, A.; Nencini, F.; Capobianco, L. Optimal MMSE pan sharpening of very high resolution multispectral images. IEEE Trans. Geosci. Remote Sens. 2008, 46, 228–236. [Google Scholar] [CrossRef]
  32. Zhong, S.; Zhang, Y.; Chen, Y.; Wu, D. Combining component substitution and multiresolution analysis: A novel generalized BDSD pansharpening algorithm. IEEE J. Sel. Top. Appl. Earth Obs. Remote Sens. 2017, 10, 2867–2875. [Google Scholar] [CrossRef]
  33. Choi, J.; Yeom, J.; Chang, A.; Byun, Y.; Kim, Y. Hybrid pansharpening algorithm for high spatial resoluation satellite imagery to improve spatial quality. IEEE Geosci. Remote Sens. Lett. 2013, 10, 490–494. [Google Scholar] [CrossRef]
  34. Sun, W.; Chen, B.; Messinger, D.W. Nearest-neighbor diffusion-based pan-sharpening algorithm for spectral images. Opt. Eng. 2014, 53. [Google Scholar] [CrossRef]
  35. Shahdoosti, H.R.; Javaheri, N. Pansharpening of clustered MS and Pan images considering mixed pixels. IEEE Geosci. Remote Sens. Lett. 2017, 14, 826–830. [Google Scholar] [CrossRef]
  36. Dhamecha, H.M.; Zaveri, T.H.; Potdar, M.B. NDVI controlled based high frequency injection multispectral image fusion method. In Proceedings of the 2012 IEEE International Geoscience and Remote Sensing Symposium, Munich, Germany, 22–27 July 2012; pp. 3513–3516. [Google Scholar]
  37. Xu, Q.; Zhang, Y.; Li, B.; Ding, L. Pansharpening using regression of classified MS and Pan images to reduce color distortion. IEEE Geosci. Remote Sens. Lett. 2015, 12, 28–32. [Google Scholar]
  38. Wang, H.; Jiang, W.; Lei, C.; Qin, S.; Wang, J. A robust image fusion method based on local spectral and spatial correlation. IEEE Geosci. Remote Sens. Lett. 2014, 11, 454–458. [Google Scholar] [CrossRef]
  39. Mura, M.D.; Vivone, G.; Restaino, R.; Chanussot, J. Context-adaptive pansharpening based on binary partition tree segmentation. In Proceedings of the 2014 IEEE International Conference on Image-Processing (ICIP), Paris, France, 27–30 October 2014; pp. 3924–3928. [Google Scholar]
  40. Kim, G.; Choi, J. Pansharpening optimization of KOMPSAT-3 satellite imagery using NDVI. In Proceedings of the KAGIS Fall Conference 2015 & International Symposium on GIS, Busan, Korea, 5–7 November 2015; pp. 126–127. [Google Scholar]
  41. Nouri, H.; Beecham, S.; Anderson, S.; Nagler, P. High spatial resolution WorldView-2 imagery for mapping NDVI and its relationship to temporal urban landscape evapotranspiration factors. Remote Sens. 2014, 6, 508–602. [Google Scholar] [CrossRef]
  42. Starck, J.L.; Fadili, J.; Murtagh, F. The undecimated wavelet decomposition and its reconstruction. IEEE Trans. Image-Process. 2007, 16, 297–309. [Google Scholar] [CrossRef] [PubMed]
  43. Palsson, F.; Sveinsson, J.R.; Ulfarsson, M.O.; Benediktsson, J.A. Quantitative quality evaluation of pansharpened imagery: Consistency versus synthesis. IEEE Trans. Geosci. Remote Sens. 2016, 54, 1247–1259. [Google Scholar] [CrossRef]
  44. Alparone, L.; Aiazzi, B.; Baronti, S.; Garzelli, A.; Nencini, F.; Selva, M. Multispectral and panchromatic data fusion assessment without reference. Photogramm. Eng. Remote Sens. 2004, 74, 193–200. [Google Scholar] [CrossRef]
  45. Wang, Z.; Bovik, A.C. A universal image quality index. IEEE Signal Process. Lett. 2002, 9, 81–84. [Google Scholar] [CrossRef]
  46. Garzelli, A.; Nencini, F. Hypercomplex quality assessment of multi-/hyper-spectral images. IEEE Geosci. Remote Sens. Lett. 2009, 6, 662–665. [Google Scholar] [CrossRef]
  47. Li, Z.; Jing, Z.; Yang, X.; Sun, S. Color transfer based remote sensing image fusion using non-separable wavelet frame transform. Pattern Recognit. Lett. 2005, 26, 2006–2014. [Google Scholar] [CrossRef]
  48. Yang, S.; Wang, M.; Jiao, L. Fusion of multispectral and panchromatic images based on support value transform and adaptive principal component analysis. Inf. Fusion 2012, 13, 177–184. [Google Scholar] [CrossRef]
Figure 1. Workflow of the proposed pansharpening methodology.
Remotesensing 09 00976 g001
Figure 2. Spatial similarity between an NDVI and local injection gains: (a) false-color composite image (R: NIR, G: red, B: green); (b) NDVI; (c) local injection gains associated with the blue band determined by the Gram–Schmidt adaptive (GSA) method; (d) local injection gains associated with the NIR determined by GSA; (e) local injection gains associated with the blue band determined by hybrid pansharpening; (f) local injection gains associated with the NIR band determined by hybrid pansharpening (high values are white, and low values are black).
Remotesensing 09 00976 g002aRemotesensing 09 00976 g002b
Figure 3. Examples of local injection gains based on NDVI values: (a) injection gains of the blue band determined using our algorithm; (b) injection gains of the NIR band determined using our algorithm.
Remotesensing 09 00976 g003
Figure 4. Workflow for assessing the synthesis property in evaluating the quality of pansharpened images.
Remotesensing 09 00976 g004
Figure 5. Workflow for evaluating the consistency property in evaluating the quality of pansharpened images.
Remotesensing 09 00976 g005
Figure 6. True-color composites of the test data: (a) KOMPSAT-3 imagery; (b) KOMPSAT-3A imagery; (c) WorldView-3 imagery.
Remotesensing 09 00976 g006
Figure 7. The 400   × 400 details of KOMPSAT-3 true-color (red, green, and blue) composites: (a) panchromatic image; (b) EXP; (c) GIHS; (d) GSAG; (e) GSAL; (f) BDSD; (g) NNDiffuse; (h) HP-NDVIspectral; (i) HP-NDVIspatial.
Remotesensing 09 00976 g007
Figure 8. The 400 × 400 details of KOMPSAT-3A true-color (red, green, and blue) composites: (a) panchromatic image; (b) EXP; (c) GIHS; (d) GSAG; (e) GSAL; (f) BDSD; (g) NNDiffuse; (h) HP-NDVIspectral; (i) HP-NDVIspatial.
Remotesensing 09 00976 g008
Figure 9. The 400 × 400 details of WorldView-3 false-color (NIR1, red, and green) composites: (a) panchromatic image; (b) EXP; (c) GIHS; (d) GSAG; (e) GSAL; (f) BDSD; (g) NNDiffuse; (h) HP-NDVIspectral; (i) HP-NDVIspatial.
Remotesensing 09 00976 g009
Table 1. Correlation coefficients between an NDVI and representative local injection gain models.
Correlation CoefficientLocal Injection Gain by GSALocal Injection Gain by Hybrid Pansharpening
Band 1 (blue)−0.3120−0.4460
Band 2 (green)−0.4114−0.5104
Band 3 (red)−0.3363−0.4772
Band 4 (NIR)0.46940.5095
Table 2. Specifications of the satellite sensors and datasets used in this study. KOMPSAT, Korean Multi-Purpose Satellite.
SensorKOMPSAT-3KOMPSAT-3AWorldView-3
locationSejong KoreaSejong KoreaBeolgyo Korea
date25 March 201528 October 201526 July 2015
multispectral resolution/size2.8 m2.2 m1.2 m
2048 × 20482048 × 20482048 × 2048
panchromatic resolution/size0.7 m0.55 m0.3 m
8192 × 81928192 × 81928192 × 8192
wavelengthpanchromatic450–900 nm448–808 nm
coastal blue-397–454 nm
blue450–520 nm445–517 nm
green520–600 nm507–586 nm
yellow-580–629 nm
red630–690 nm626–696 nm
red edge-698–749 nm
NIR1760–900 nm765–899 nm
NIR2-857–1039 nm
Table 3. Comparative pansharpening result corresponding to each satellite sensor. ERGAS: erreur relative globale adimensionnelle de synthèse; SAM, the spectral angle mapper; sCC, spatial correlation coefficient; AG, average gradient; EXP: expanded multispectral image; GIHS: generalized intensity-hue-saturation; GSA: Gram–Schmidt adaptive; BDSD: band-dependent spatial detail; NNDiffuse: nearest-neighbor diffusion; HP-NDVIspectral: hybrid pansharpening using NDVI based on the spectral mode; HP-NDVIspatial: hybrid pansharpening using NDVI based on the spatial mode.
DatasetAlgorithmERGASSAMQ4/Q8sCCAG
KOMPSAT-3EXP0.81180.64090.98700.303663.82
GIHS1.65051.02550.90880.9886110.48
GSAG1.00230.73360.96710.9858113.68
GSAL1.10290.94800.96080.9176103.75
BDSD0.95320.82230.97910.9439117.73
NNDiffuse1.18650.82440.93980.9366119.04
HP-NDVIspectral0.87660.66270.98280.9737101.67
HP-NDVIspatial0.89260.66940.98160.9471146.95
KOMPSAT-3AEXP0.52880.51470.98850.102749.07
GIHS1.80831.02590.71420.9952167.29
GSAG0.92060.73430.91210.9968175.17
GSAL1.05001.17130.93010.7616149.74
BDSD0.84790.91220.96950.8688159.34
NNDiffuse3.05930.71030.55510.9451216.92
HP-NDVIspectral0.53550.52210.97690.9471106.40
HP-NDVIspatial0.55740.52980.97440.9382168.62
WorldView-3EXP0.70300.67090.98450.05264.88
GIHS3.29531.74820.63270.97849.00
GSAG1.78840.91600.88650.97878.93
GSAL2.85042.32640.80700.63099.24
BDSD1.73851.58360.92480.76298.77
NNDiffuse2.78600.95710.64120.84819.91
HP-NDVIspectral1.59240.89330.94740.82577.27
HP-NDVIspatial1.70450.92050.94030.833111.21
Table 4. Comparison of the computational cost of the proposed algorithm with those of GSA-based algorithms.
Pansharpening AlgorithmComputational Cost (s)
GSAG240 s
GSAL25,246 s
HP-NDVIspatial245 s

