Wuhan Surface Subsidence Analysis in 2015–2016 Based on Sentinel-1A Data by SBAS-InSAR
by
 , and
, and
Lv Zhou
1,2,3, 
Jiming Guo
1,4,*,
Jiyuan Hu
1,
Jiangwei Li
5,
Yongfeng Xu
6,
Yuanjin Pan
7 and
Miao Shi
5 1
School of Geodesy and Geomatics, Wuhan University, Wuhan 430079, China
2
Guangxi Key Laboratory of Spatial Information and Geomatics, Guilin University of Technology, Guilin 541004, China
3
Key Laboratory for Digital Land and Resources of Jiangxi Province, East China University of Technology, Nanchang 330013, China
4
Key Laboratory of Precise Engineering and Industry Surveying of National Administration of Surveying, Mapping and Geoinformation, Wuhan University, Wuhan 430079, China
5
Wuhan Geomatics Institute, Wuhan 430022, China
6
ChangJiang Wuhan Waterway Bureau, Wuhan 430014, China
7
State Key Laboratory of Information Engineering in Surveying, Mapping and Remote Sensing, Wuhan 430079, China
*
Author to whom correspondence should be addressed.
Remote Sens. 2017, 9(10), 982; https://doi.org/10.3390/rs9100982
Submission received: 18 July 2017
/
Revised: 11 September 2017
/
Accepted: 18 September 2017
/
Published: 22 September 2017
(This article belongs to the Special Issue Urban Deformation Monitoring using Persistent Scatterer Interferometry and SAR tomography)
Abstract
:The Terrain Observation with Progressive Scans (TOPS) acquisition mode of Sentinel-1A provides a wide coverage per acquisition and features a repeat cycle of 12 days, making this acquisition mode attractive for surface subsidence monitoring. A few studies have analyzed wide-coverage surface subsidence of Wuhan based on Sentinel-1A data. In this study, we investigated wide-area surface subsidence characteristics in Wuhan using 15 Sentinel-1A TOPS Synthetic Aperture Radar (SAR) images acquired from 11 April 2015 to 29 April 2016 with the Small Baseline Subset Interferometric SAR (SBAS InSAR) technique. The Sentinel-1A SBAS InSAR results were validated by 110 leveling points at an accuracy of 6 mm/year. Based on the verified SBAS InSAR results, prominent uneven subsidence patterns were identified in Wuhan. Specifically, annual average subsidence rates ranged from −82 mm/year to 18 mm/year in Wuhan, and maximum subsidence rate was detected in Houhu areas. Surface subsidence time series presented nonlinear subsidence with pronounced seasonal variations. Comparative analysis of surface subsidence and influencing factors (i.e., urban construction, precipitation, industrial development, carbonate karstification and water level changes in Yangtze River) indicated a relatively high spatial correlation between locations of subsidence bowl and those of engineering construction and industrial areas. Seasonal variations in subsidence were correlated with water level changes and precipitation. Surface subsidence in Wuhan was mainly attributed to anthropogenic activities, compressibility of soil layer, carbonate karstification, and groundwater overexploitation. Finally, the spatial-temporal characteristics of wide-area surface subsidence and the relationship between surface subsidence and influencing factors in Wuhan were determined.
1. Introduction
Surface subsidence is one of the main engineering geological problems worldwide, and it is caused by consolidation and compression of underground unconsolidated strata because of non-human-related (e.g., earthquake and natural consolidation of soil) or human-related (e.g., groundwater extraction and underground construction) activities [1,2,3]. Surface subsidence is also one of the major regional geological disasters that cause serious damage to buildings, infrastructures, roads, and bridges and affect human safety in cities [4,5,6].
In recent years, Interferometric Synthetic Aperture Radar (InSAR) technique has been widely used to investigate surface subsidence [7,8,9]. Compared with traditional monitoring methods, such as Global Navigation Satellite System (GNSS) [10,11], leveling [12,13], geological and geophysical investigation methods [14], InSAR can detect and monitor regional-scale surface subsidence at low costs with centimeter-to-millimeter accuracy [9,15]. However, problems accompany InSAR due to scatterer changes with time [16,17]. This phenomenon leads to signal decorrelation (e.g., temporal and spatial decorrelation) and reduces monitoring accuracy of InSAR [18]. To overcome limitations of this technique, time-series InSAR (TS-InSAR) has been proposed [19,20,21]. TS-InSAR extracts deformation information by simultaneously processing multi-SAR images obtained on different dates. Ferretti et al. [22] proposed a TS-InSAR method, which was referred to as Persistent Scatterer InSAR (PS InSAR), that can overcome decorrelation and atmospheric delay problems by identifying and analyzing point-like stable reflectors (PSs). Small Baseline Subset InSAR (SBAS InSAR) [23] is another TS-InSAR method that effectively mitigates decorrelation phenomena by analyzing distributed scatterers (DSs) with high coherence based on an appropriate combination of interferograms [24]. To combine advantages of PS InSAR and SBAS InSAR, Multi-temporal InSAR (MTInSAR) [25], which can simultaneously detect PSs and DSs, was presented to retrieve surface subsidence. Aside from the above-mentioned TS-InSAR methods, other approaches, e.g., the Temporally Coherent Point InSAR (TCPInSAR) [26], the Quasi-PS (QPS) [27], and the Intermittent SBAS (ISBAS) [28], were proposed for different monitoring situations. These TS-InSAR methods have been widely applied in urban surface subsidence monitoring in Beijing [2,29], Mexico [30], Hanoi [31], Shanghai [32,33], and Jinan [34].
Wuhan, as a central city in Central China, has suffered from serious surface subsidence over the past decades because of rapid urban development [35]. Surface collapse in Wuhan was first recorded in 1931 [36]. This surface collapse caused the Yangtze River dike to burst and to flood the Baishazhou area. Since 1978, varying scales and degrees of surface collapses intermittently occurred in various areas (e.g., Hanyang Steel Mill, Wuchang Lujia Street Middle School, Fenghuo Village, and Qingling (QL) Township) in Wuhan [37]. In recent years, owing to groundwater overexploitation, metro construction, and karst collapse, multiple subsidence areas (e.g., Houhu (HH) and Jianghan (JH) subsidence areas) have formed in Wuhan [38], and settlement range and magnitude of these subsidence areas gradually expanded. At present more than 300 benchmarks were arranged in Wuhan by Wuhan Geomatics Institute to monitor surface subsidence. However, given the low spatial resolution and high cost of leveling, difficulty arises from obtaining regional subsidence information and distribution of subsidence bowl. Consequently, effective data (e.g., SAR data) and methods are needed to monitor surface subsidence distribution and state in Wuhan for disaster prevention and sustainable development. Several studies have monitored and analyzed subsidence in Wuhan using TS-InSAR methods with SAR data. Bai et al. [35] retrieved surface subsidence in Wuhan from October 2009 to August 2010 using TerraSAR-X images based on MTInSAR. Results indicated that subsidence rates ranged from −63.7 mm/year to 17.5 mm/year in the study area. Costantini et al. [38] investigated spatial-temporal characteristics of subsidence in Hankou District, Wuhan, from June 2013 to June 2014 with COSMO-SkyMed SAR images. However, the above-mentioned studies adopted high-cost SAR data to extract deformation information in Wuhan before 2014 and only investigated major urban areas in Wuhan, neglecting large non-central regions where various surface subsidence patterns also exist. Prior to this study, wide-coverage surface subsidence information in Wuhan was still little known. Fortunately, Sentinel-1A data are easily and freely accessible. The Interferometric Wide swath (IW) products of Sentinel-1A, which images three sub-swaths by adopting the Terrain Observation with Progressive Scans (TOPS) SAR technique, offer SAR images at 5 m × 20 m (range × azimuth) spatial resolution around a 250 km-wide area [39,40,41]. Owing to large swath width, surface subsidence monitoring of large areas can be easily realized using Sentinel-1A SAR images. Therefore, in this study, Sentinel-1A IW single-look complex (SLC) products are used to capture wide-area subsidence information in Wuhan, and the relationship between surface subsidence and influencing factors (e.g., urban construction, industrial development, carbonate karstification, and water level changes) were analyzed in detailed based on leveling data, daily water level changes data on Yangtze River, and distribution data of carbonate rock belt and industrial areas, etc.
In this study, to analyze spatial-temporal characteristics of wide-area surface subsidence in Wuhan, we first adopted the SBAS InSAR method to derive surface subsidence rate and time series using leveling data and 15 free Sentinel-1A TOPS images acquired between 11 April 2015 and 29 April 2016. Subsequently, 110 leveling benchmarks were used to verify the SBAS InSAR-derived results. Water level changes in Yangtze River, precipitation, groundwater, urban construction, and geological conditions were considered influencing factors, and mechanisms underlying their effects on surface subsidence were studied. Finally, the correlation between surface subsidence and these influencing factors were analyzed in detail.
2. Study Area and Data
2.1. Study Area
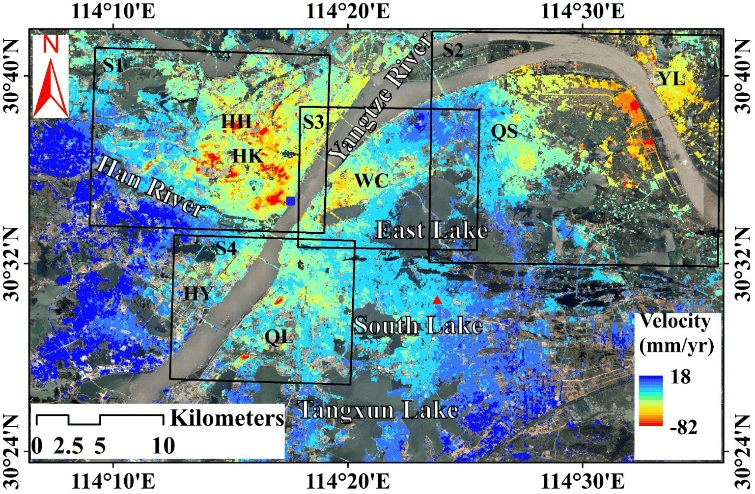
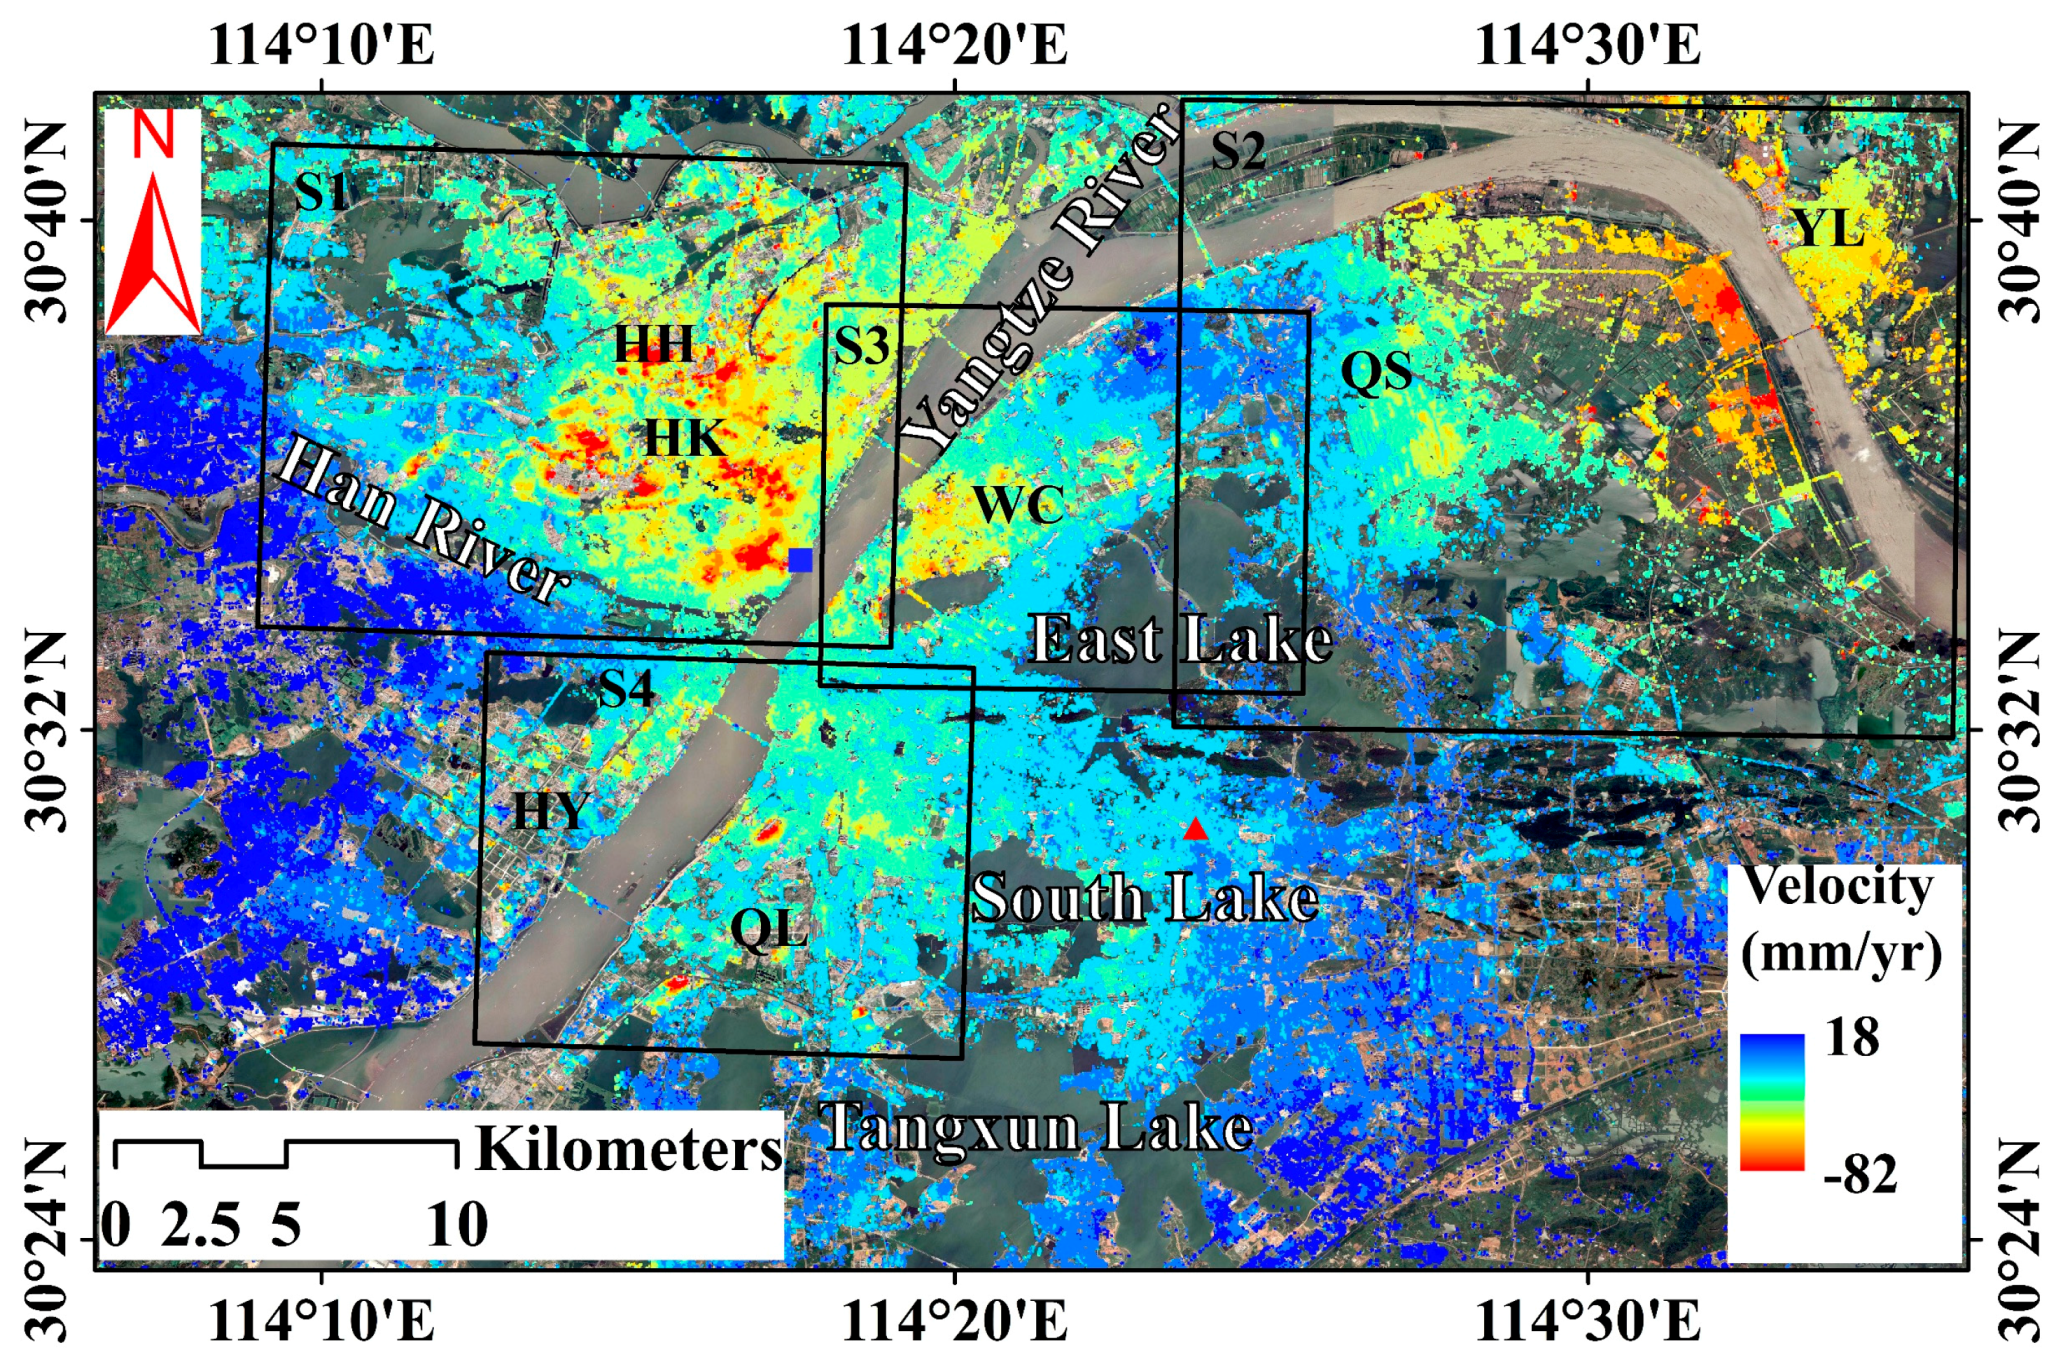
Wuhan is the central city of Central China. This city is located in the east of Jianghan Plain and southern slope of Ta-pieh Mountains (Figure 1a). Geographical coordinates of Wuhan include 113°41′–115°05′E and 29°58′–31°22′N. Yangtze and Han rivers pass through the central urban area of Wuhan and divide it into three main regions, i.e., Hankou (HK), Wuchang (WC), and Hanyang (HY). Many lakes (e.g., East Lake, Tangxun Lake, and Liangzi Lake) and rivers are distributed in Wuhan, in which water areas account for 25.79% of total area of the city. The study area is outlined by red rectangle in Figure 1a, covering most of Wuhan City. Figure 1b shows SAR mean intensity map of the Sentinel-1A, the map covers the study area. Length of mean intensity map in east–west and south–north directions measures approximately 46.62 and 34.22 km, respectively.
The general terrain in Wuhan is low in south and high in the north. The northern part features low mountain and hilly regions with elevation ranging from 100 m to 500 m. The middle part is mainly the relatively flat middle reaches of the Yangtze River Plain. The southern part is surrounded by hills and mounds, and its average elevation reaches approximately 55 m. Six independent carbonate rock belts with the trend of WNW to ESE are distributed in Wuhan, and its distribution area reaches 1100 km2 [37]. Since 1931, at least 15 karst surface collapse disasters have been recorded in Wuhan [36]. Wuhan also serves as an important industrial base, science and education base, and comprehensive transportation hub in China due to its geographical location. In recent years, in line with economic development, numerous buildings and subways were constructed and have gradually led to multiple surface inhomogeneous subsidence areas (e.g., Hankou subsidence area) in Wuhan.
2.2. Data
In this paper, 15 ascending Sentinel-1A TOPS SAR images (C-band) acquired from 11 April 2015 to 29 April 2016 covering Wuhan were selected to estimate vertical average surface subsidence velocity and subsidence time series. Specific parameters of Sentinel-1A data are illustrated in Table 1. The three arc-second Shuttle Radar Topography Mission (SRTM) DEM provided by the National Aeronautics and Space Administration (NASA) was adopted to remove topographic phases. Precise Orbit Determination (POD) data released by the European Space Agency (ESA) were used to the orbital refinement and phase re-flattening. To validate SBAS InSAR-derived results, 110 benchmarks (location distribution of benchmarks will be illustrated in Section 5.1) provided by the Wuhan Geomatics Institute were used, and the leveling data were acquired from 2013 to 2016. Daily water level changes in Yangtze River collected from 11 April 2015 to 29 April 2016 were provided by Changjiang Wuhan Waterway Bureau. These information and precipitation data from meteorological station of Wuhan were utilized to investigate the relationship between surface subsidence and water level changes.
3. Methodology
3.1. Fundamental Principle of SBAS-InSAR Technique
First, the SBAS-InSAR technique generates an appropriate combination of differential interferograms produced by SAR data pairs based on baseline threshold values. Then, this technique estimates deformation information of every single differential interferogram and regards them as observed values. Finally, SBAS-InSAR retrieves deformation rate and time series based on observed values acquired in the previous step [23,42].
Considering a set of SAR acquisitions acquired at ordered times covering the study area, interferograms are generated based on baseline threshold values. satisfies the following inequality:
Assuming interferogram is generated by combining SAR acquisitions at times and , after removing flat-earth and topographic phases, the interferometric phase in pixel of azimuth and range coordinates can be expressed as follows [43]:
where and represent phase values of SAR images at and , respectively. refers to deformation phase between times and . corresponds to residual phase due to inaccuracies in reference DEM. depicts atmospheric phase error. denotes random noise phases (e.g., orbital errors, thermal noise, and spatial decorrelation).
To achieve deformation information, components , , and should be separated from . After removing the above-mentioned components, a system of equations in unknowns can be obtained from Equation (2). The matrix form of the system can be expressed as follows:
where corresponds to an coefficient matrix, . and represent the numbers of interferograms and SAR acquisitions, respectively. denotes the vector of unknown phase values related to high-coherence pixels. represents the vector of unwrapped phase values associated with differential interferograms.
To retrieve deformation rates of high-coherence pixels, Equation (3) can be organized as follows:
where represents an coefficient matrix, and vT can be expressed as follows:
Deformation rate can be achieved from Equation (4) by least squares (LS) or singular value decomposition (SVD) method [44]. Finally, the corresponding deformation time series can be derived according to the time span between SAR acquisitions.
3.2. Data Processing
In this study, to obtain surface subsidence rate and time series in the Wuhan region, we adopted the SBAS-InSAR technique to process 15 Sentinel-1A TOPS SAR images over the study area. The main steps are as follows:
3.2.1. Generation of Multiple Differential Interferograms
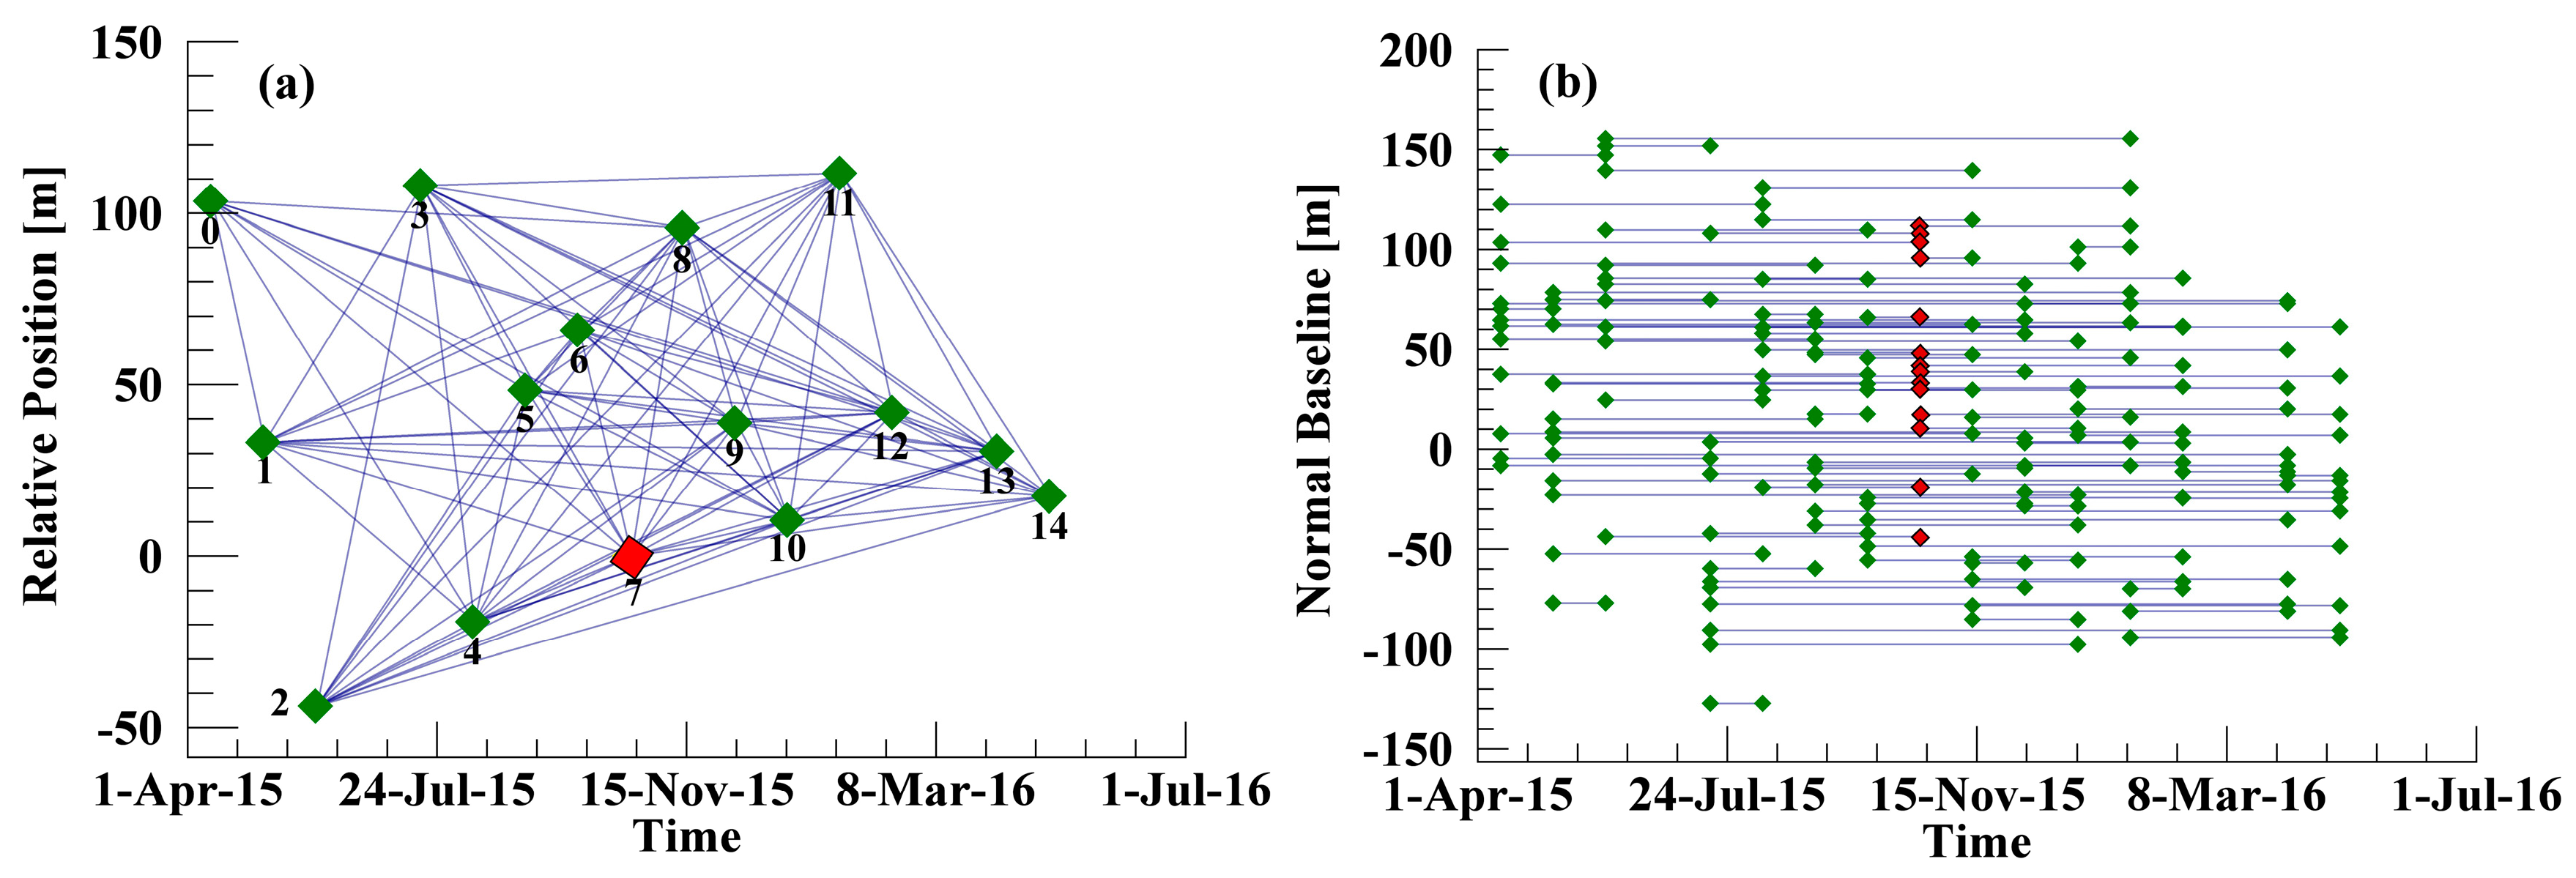
The image acquired on 20 October 2015, was selected as super master image for the interferometric combinations, and all slave images were co-registered and resampled to the super master image. Interferometric pairs were selected based on the spatial baseline shorter than 300 m and temporal baseline less than 200 days. The longest temporal baseline used in the analysis was 155 days. Meanwhile, interferometric pairs with low coherence and poor unwrapping were removed. Finally, a combination with 92 differential interferograms was generated (Figure 2).
3.2.2. Removal of Flat-Earth and Topographic Phases
POD data released by the ESA were adopted to remove the flat-earth phase. Topographic phase was eliminated using the three arc-second SRTM DEM provided by the NASA.
3.2.3. Orbital Refinement and Phase Re-Flattening
In this study, after adaptive filtering [45] and phase unwrapping (using Delaunay minimum cost flow), based on leveling data provided by the Wuhan Geomatics Institute, 24 stable points distributed in the study area were selected to execute orbital refinement and phase re-flattening for all interferometric pairs.
3.2.4. Subsidence Rate and Time Series Retrieval
No isolated interferogram clusters existed during combination of differential interferograms. Hence, subsidence rates were estimated using the LS method [25]. To retrieve subsidence time series, the estimated linear subsidence was subtracted first from raw subsidence time series. The remaining components comprised atmospheric phase, random noise phases, and nonlinear subsidence. Atmospheric and noise phases components are characterized by high spatial correlation but show a notably low temporal correlation. Subsequently, nonlinear subsidence component was separated through spatial and temporal bandpass filtering [46]. Finally, subsidence time series were retrieved by adding up linear subsidence and nonlinear subsidence components.
4. Results
4.1. Subsidence Rate Map
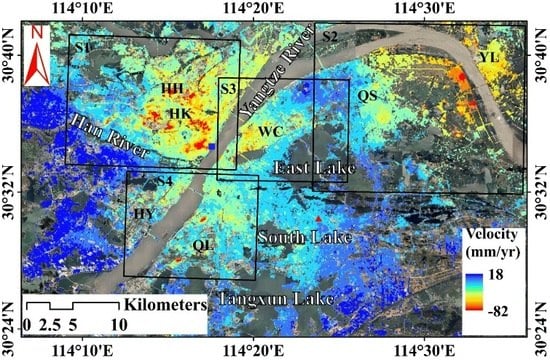
Figure 3 shows the subsidence rate map derived using SBAS InSAR; the map is superimposed on the Google Earth image of Wuhan acquired in 2016. Based on collected leveling data, a stable point located at 30°30′25′′N and 114°22′44′′E (red triangle in Figure 3) was selected as reference point, and subsidence rates in the study area were considered based on the reference point. Positive values of rate map indicate that the surface is uplifting in the vertical direction, whereas negative values denote surface subsidence in the vertical direction. Total number of PS points extracted from Sentinel-1A TOPS dataset by SBAS InSAR technique reached 2,101,453. Average density of PS points in the study area totaled 1317 PS points/km2. SBAS InSAR-derived results in Figure 3 reveal that annual average subsidence rates in Wuhan range from −82 mm/year to 18 mm/year, and the largest subsidence rate was detected in HH region, Hangkou District (HK).
As shown in Figure 3, prominent uneven subsidence patterns were identified in Wuhan. The major subsidence areas include Region S1 (i.e., HK), Region S2 (mainly includes Qingshan (QS) and Yangluo (YL) Districts), Region S3 (i.e., WC), and Region S4 (mainly include QL Township, HY and Hongshan (HS) Districts). Regions S1 and S3 are central urban areas of Wuhan. The main large-scale industrial areas of Wuhan, e.g., Wuhan Iron and Steel Company (WISC), Sinopec Wuhan Company (SWC), and Huaneng Yangluo Power Plant (HYPP), are located in Region S2. Among the above-mentioned four regions, Region S1 features the most number of subsidence bowls, and most of the serious subsidence bowls are also distributed in Regions S1. Region S4 features the smallest subsidence bowls, but its subsidence range is gradually expanding. Additionally, these subsidence areas are mainly distributed along the Yangtze River. In addition to Regions S1–S4, other areas in study area present small surface subsidence, and most subsidence rates are less than 10 mm/year. More detailed subsidence analysis and explanation for Regions S1–S4 will be discussed in Section 5.
4.2. Subsidence Time Series
Figure 4 shows surface cumulative subsidence time series in Wuhan from 11 April 2015 to 29 April 2016. The Sentinel-1A TOPS SAR image acquired on 11 April 2015 was considered reference time of the time series in SBAS InSAR method. Maximum cumulative subsidence in this period is −86 mm, and it was noted at HH in HK, as marked by the black rectangle in Figure 4n. Eastern and western parts of Wuhan are relatively stable, and most of the cumulative subsidence in these areas range from −10 mm to 10 mm. Magnitude of subsidence in major subsidence areas (i.e., Regions S1–S4) gradually increased with time. Size of these subsidence areas also gradually expanded. However, changes in subsidence magnitude and range were small between May 2015 and July 2015. Wuhan experienced heavy rainfall in May, June, and July 2015, which possibly recharged groundwater effectively during the indicated months. Consequently, surface subsidence in Wuhan was possibly affected by rainfall and shows nonlinear subsidence with pronounced seasonal variations.
4.3. Internal Precision Checking
To assess internal precision of subsidence rates extracted from Sentinel-1A TOPS data by SBAS InSAR technique, standard deviations of subsidence rates were statistically analyzed. Figure 5 shows distributions of standard deviations of subsidence rates. The standard deviations were obtained by computing the deviations of the linear fitting of velocities. If a PS point shows a strong nonlinear motion, it resulted in a large residual with respect to the linear model, i.e., in a high standard deviation value. Standard deviation of SBAS InSAR-derived results using Sentinel-1A TOPS data is 3 mm/year. Maximum standard deviation of PS point reaches 11 mm/year, and standard deviations of subsidence rates of 86.27% PS points are less than 6 mm/year. According to the above analysis, surface subsidence derived by SBAS InSAR technique using Sentinel-1A TOPS data features high reliability and precision.
5. Discussion
5.1. Validation with Leveling
To further quantitatively verify accuracy of surface subsidence monitoring using Sentinel-1A TOPS data by SBAS InSAR, a comparative analysis of differences between SBAS InSAR- and leveling-derived results was performed. A total of 110 benchmarks (i.e., BM1–BM110) were used in validation. Figure 6 shows location distribution of benchmarks for monitoring surface subsidence. Before validation, overlapping period data of Sentinel-1A TOPS and leveling data were selected. Given the limited opportunities for a benchmark and corresponding PS point located in the same place, Kriging method was adopted using ArcGIS 10.2 software and its geostatistical analyst extension to extract subsidence of the PS point corresponding to the nearest benchmark.
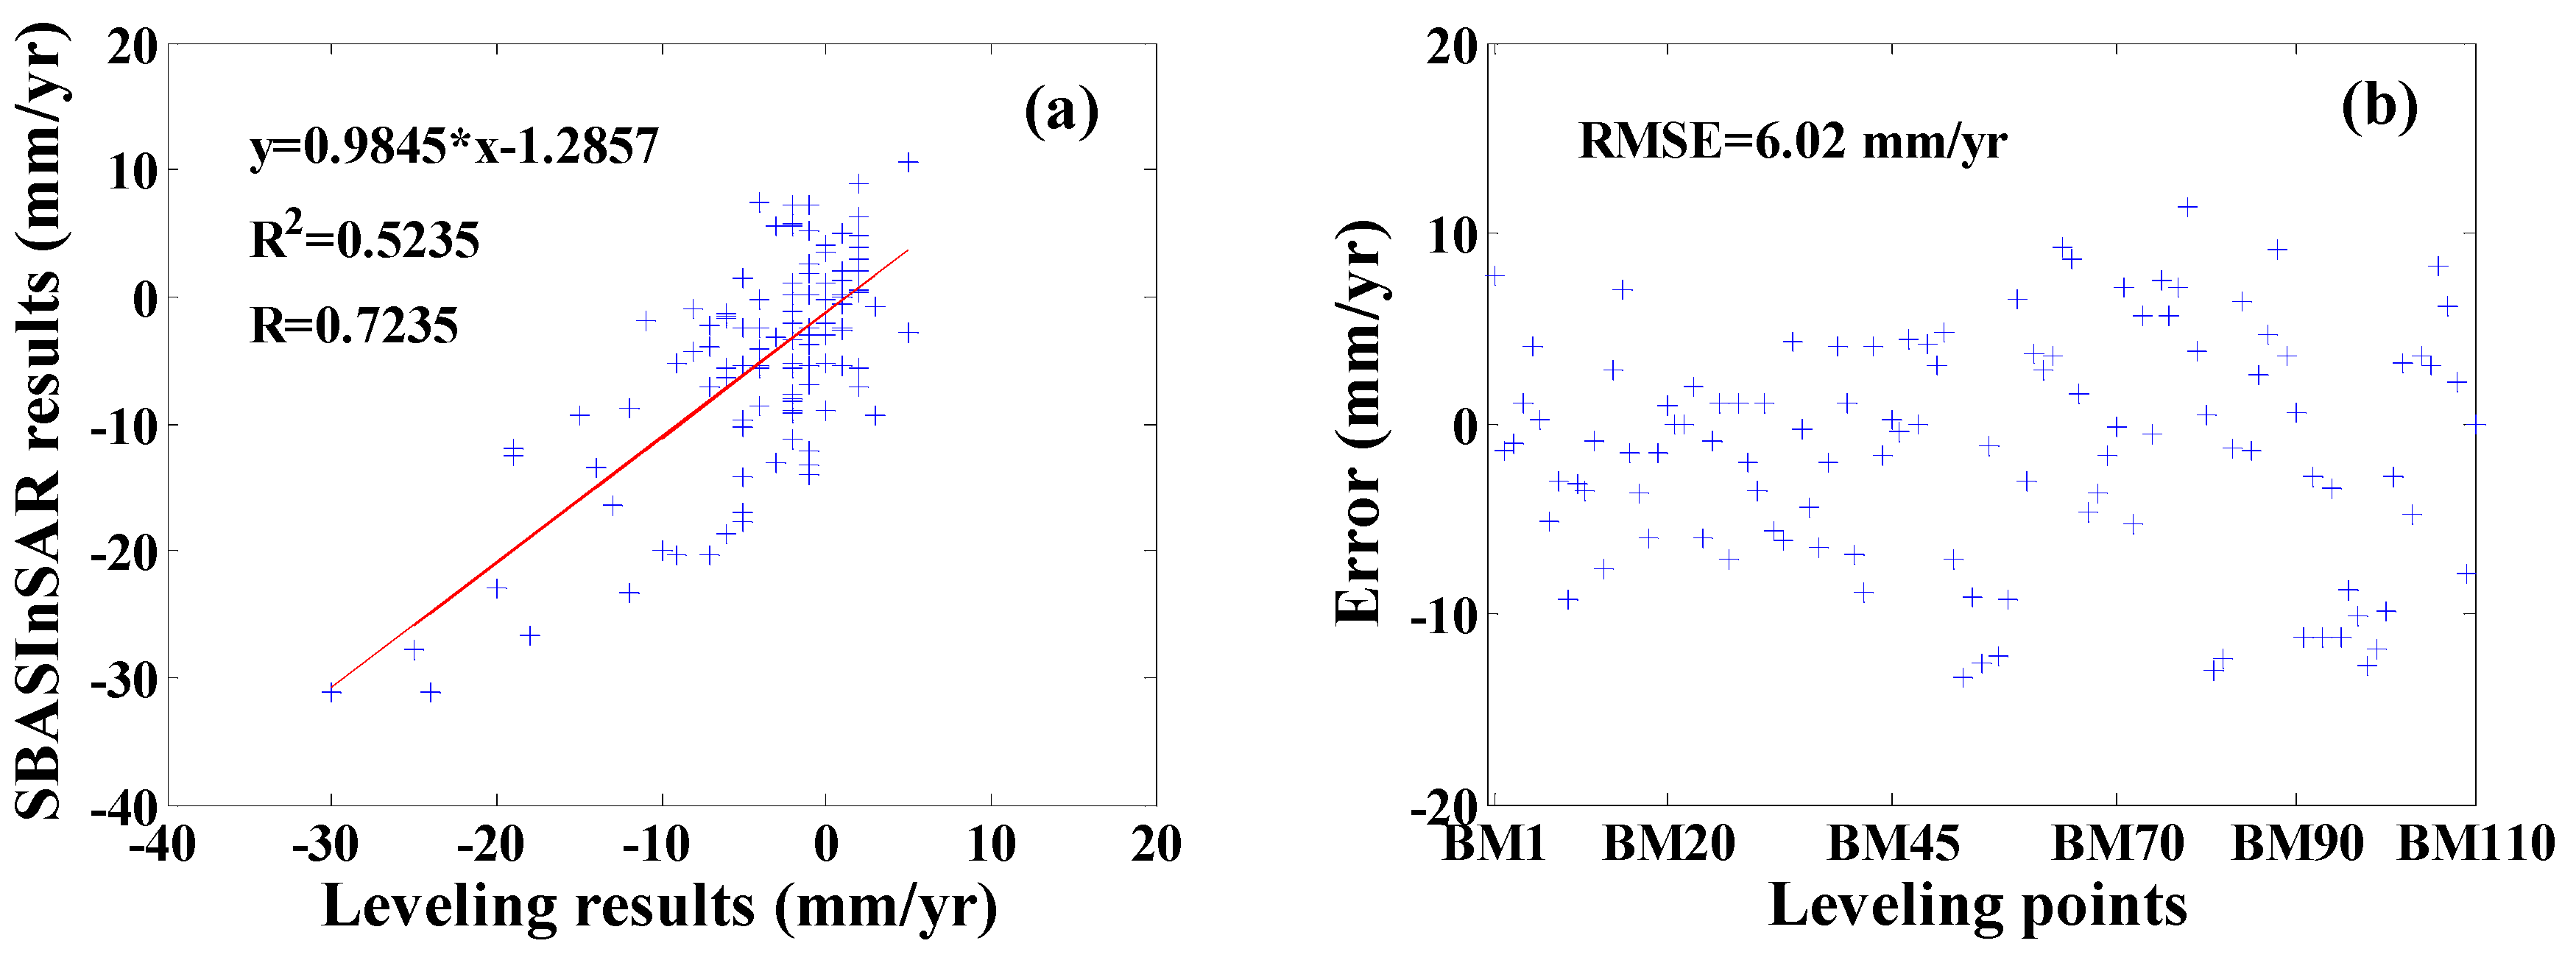
The linear regression of average subsidence rate was performed between SBAS InSAR- and leveling-derived results, as illustrated in Figure 7a. SBAS InSAR and leveling rates present a relatively high correlation, with a correlation coefficient value of 0.72. Figure 7b shows differences between SBAS InSAR- and leveling-derived results. Differences mainly ranged from −10 mm/year to 10 mm/year. Table 2 lists statistical results of differences. Mean error, maximum (MAX) and minimum (MIN) errors totaled −1, 11, and −13 mm/year, respectively. Root-mean-square error (RMSE) of differences averaged 6 mm/year. Therefore, validation results suggest that SBAS InSAR-derived results agree well with results obtained by leveling data, and SBAS InSAR technique can successfully extract surface subsidence information in Wuhan using Sentinel-1A TOPS data with an accuracy of 6 mm/year. This accuracy is similar to the subsidence monitoring accuracies derived by Luo et al. [47] and Zhang et al. [48].
5.2. Surface Subsidence Associated with Urban Construction and Precipitation
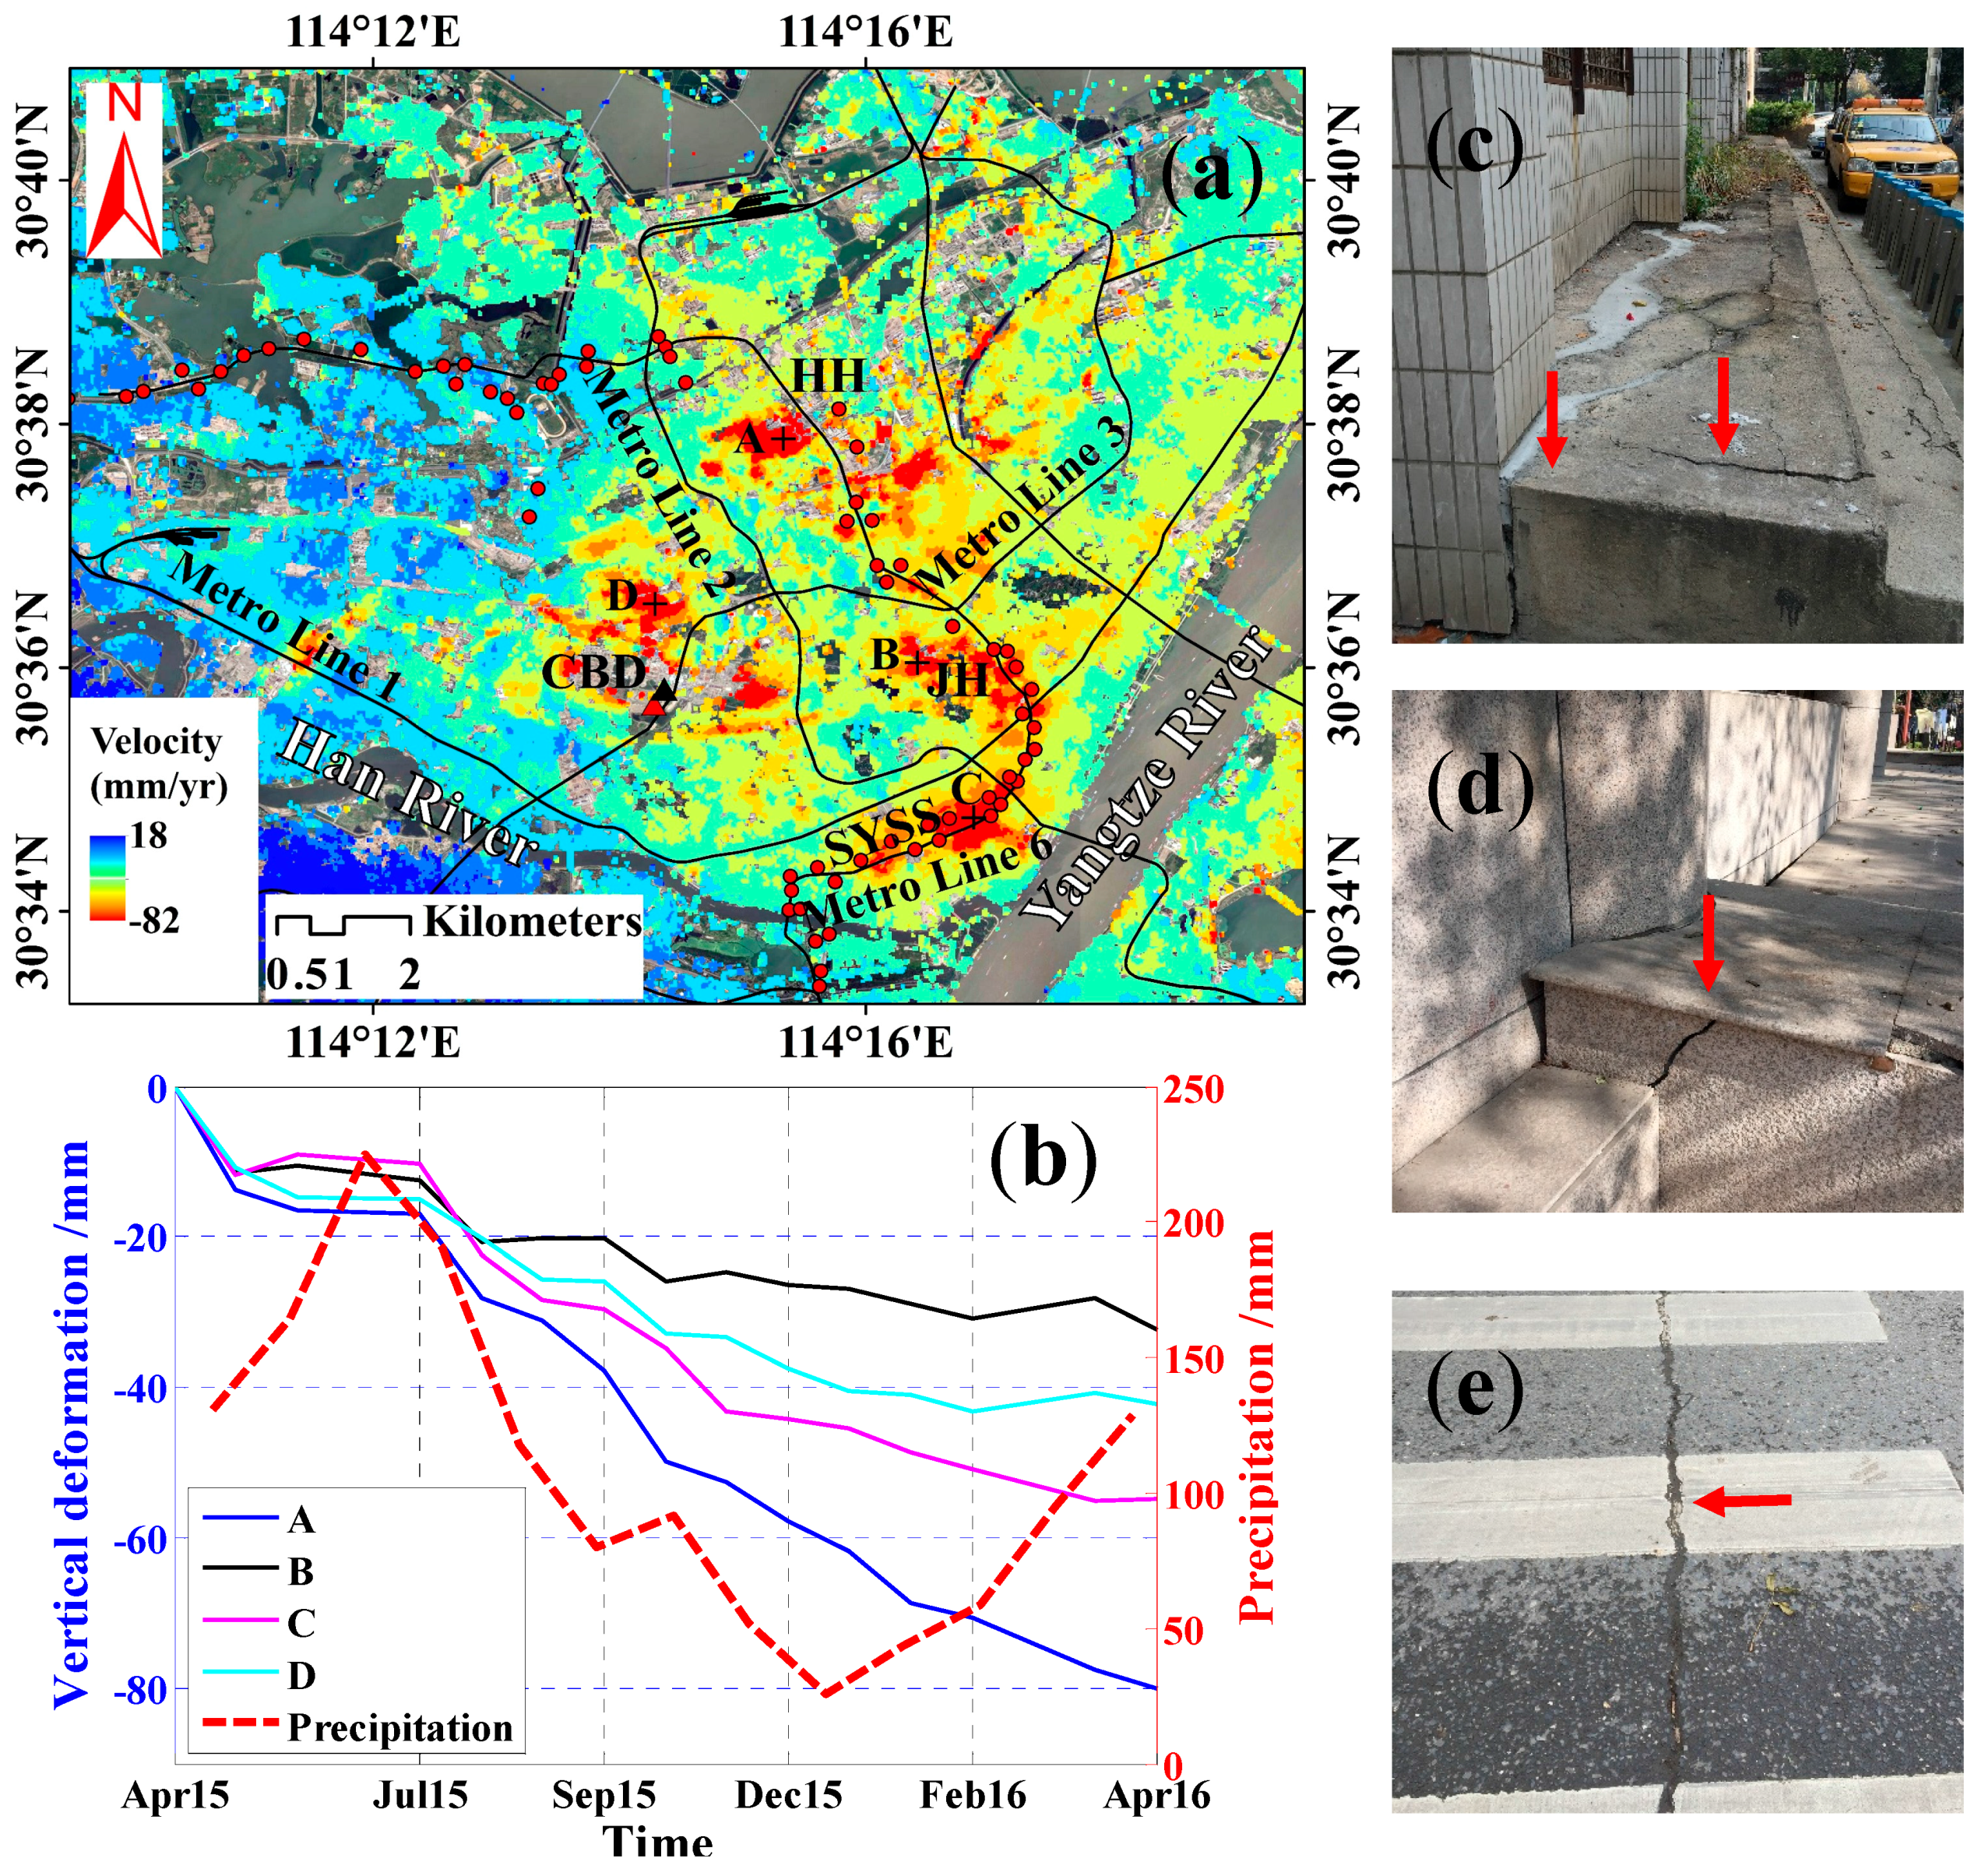
In recent years, as the largest land and water transportation hub city in central China, Wuhan has witnessed significant changes, especially in urban construction. At present, Wuhan is in a critical period of urban development, and over 10,000 construction sites simultaneously operate throughout the city. HK (Region S1) and WC (Region S3) (Figure 3) are economic and cultural centers of Wuhan, respectively, and most urban construction activities are concentrated in these areas. Remarkable uneven subsidence patterns were detected in these regions (Figure 3). Therefore, the relationship between surface subsidence and urban construction corresponding to Regions S1 and S3 was analyzed in detail. Figure 8a and Figure 9a show zoomed subsidence rate maps of Regions S1 and S3, respectively.
As shown in Figure 8a, four significant subsidence areas were detected in Regions S1, i.e., HH, Jianghan District (JH), Sun Yat-Sen Street (SYSS), and Wuhan Central Business District (CBD). Their surface subsidence distribution is similar to results extracted by Costantini et al. [38]. The most serious subsidence area is HH, where maximum subsidence rate exceeds −80 mm/year. Maximum subsidence rates in JH and SYSS reach −51 and −65 mm/year, respectively. Additionally, many large-scale buildings (e.g., Wuhan Center, a 438 m-tall skyscraper under construction) were constructed in the CBD area during the study period. As a result, density of PS points in CBD area was sparse, and detected maximum subsidence rate totaled −59 mm/year. HH, JH, and SYSS subsidence areas are mainly distributed along Metro Line 6, which is still under construction, and these subsidence areas gradually connect into a continuous area. To validate the uneven subsidence, fieldwork was carried out on HH, SYSS, and CBD areas in October 2016. Figure 8c–e illustrates significant effects caused by uneven subsidence observed in two buildings and a road.
In Region S1, extensive urban construction activities, including those for Metro Line 6 and Wuhan World Trade Center, were simultaneously under development during the study period (Figure 8a). During excavation of deep foundation pit and underground structure, groundwater level was often higher than construction surface. To ensure smooth excavation and avoid underwater operation, the foundation pit should be discharged of water. The entire Metro Line 6 and various buildings in CBD area were simultaneously under construction. Hence, a large volume of groundwater was extracted, and groundwater level gradually declined. This phenomenon reduced uplift pressure of groundwater in soil layer for the aboveground structures, compressed the soil, and finally led to surface subsidence. Region S1 is mainly located in the alluvial plain formed by joint actions of Yangtze River, Han River, and lakes, so that compressibility of alluvial deposit in this area is high. The above analysis indicates that extensive urban construction plays a dominant role in surface subsidence in Region S1. Surface subsidence is also affected by compressibility of soil layer.
Thus, to analyze temporal evolution of surface subsidence and the relationship between surface subsidence and precipitation, subsidence time series of four PS points (i.e., A, B, C, and D shown in Figure 8a) and monthly average precipitation during the study period were compared and analyzed. Figure 8b illustrates obtained results. Subsidence time series of selected PS points showed a nonlinear decline with seasonal variability. Accumulated subsidence of selected point is different depending on their spatial location. Accumulated subsidence of A located in HH area (approximately −80 mm) is significantly larger than that of other points, and it is related to poor soil-bearing capacity of the silt layer in HH area [49]. Subsidence of selected points from May 2015 to July 2015 was visibly small. As illustrated by the red line in Figure 8b, monthly average precipitations from May to July were the highest during the study period in Wuhan. These precipitations effectively replenished groundwater and slowed down surface subsidence rate. After July, precipitation declined noticeably, and subsidence increased as the temperature and domestic water consumption in Wuhan increased significantly, and groundwater was increasingly extracted, leading to increase in surface subsidence rates after July 2015. Comparative analysis suggests the following: surface subsidence in Region S1 experiences pronounced seasonal variations; surface subsidence is correlated not only to precipitation but also to other factors; and precipitation is a dominant factor influencing seasonal component of surface subsidence.
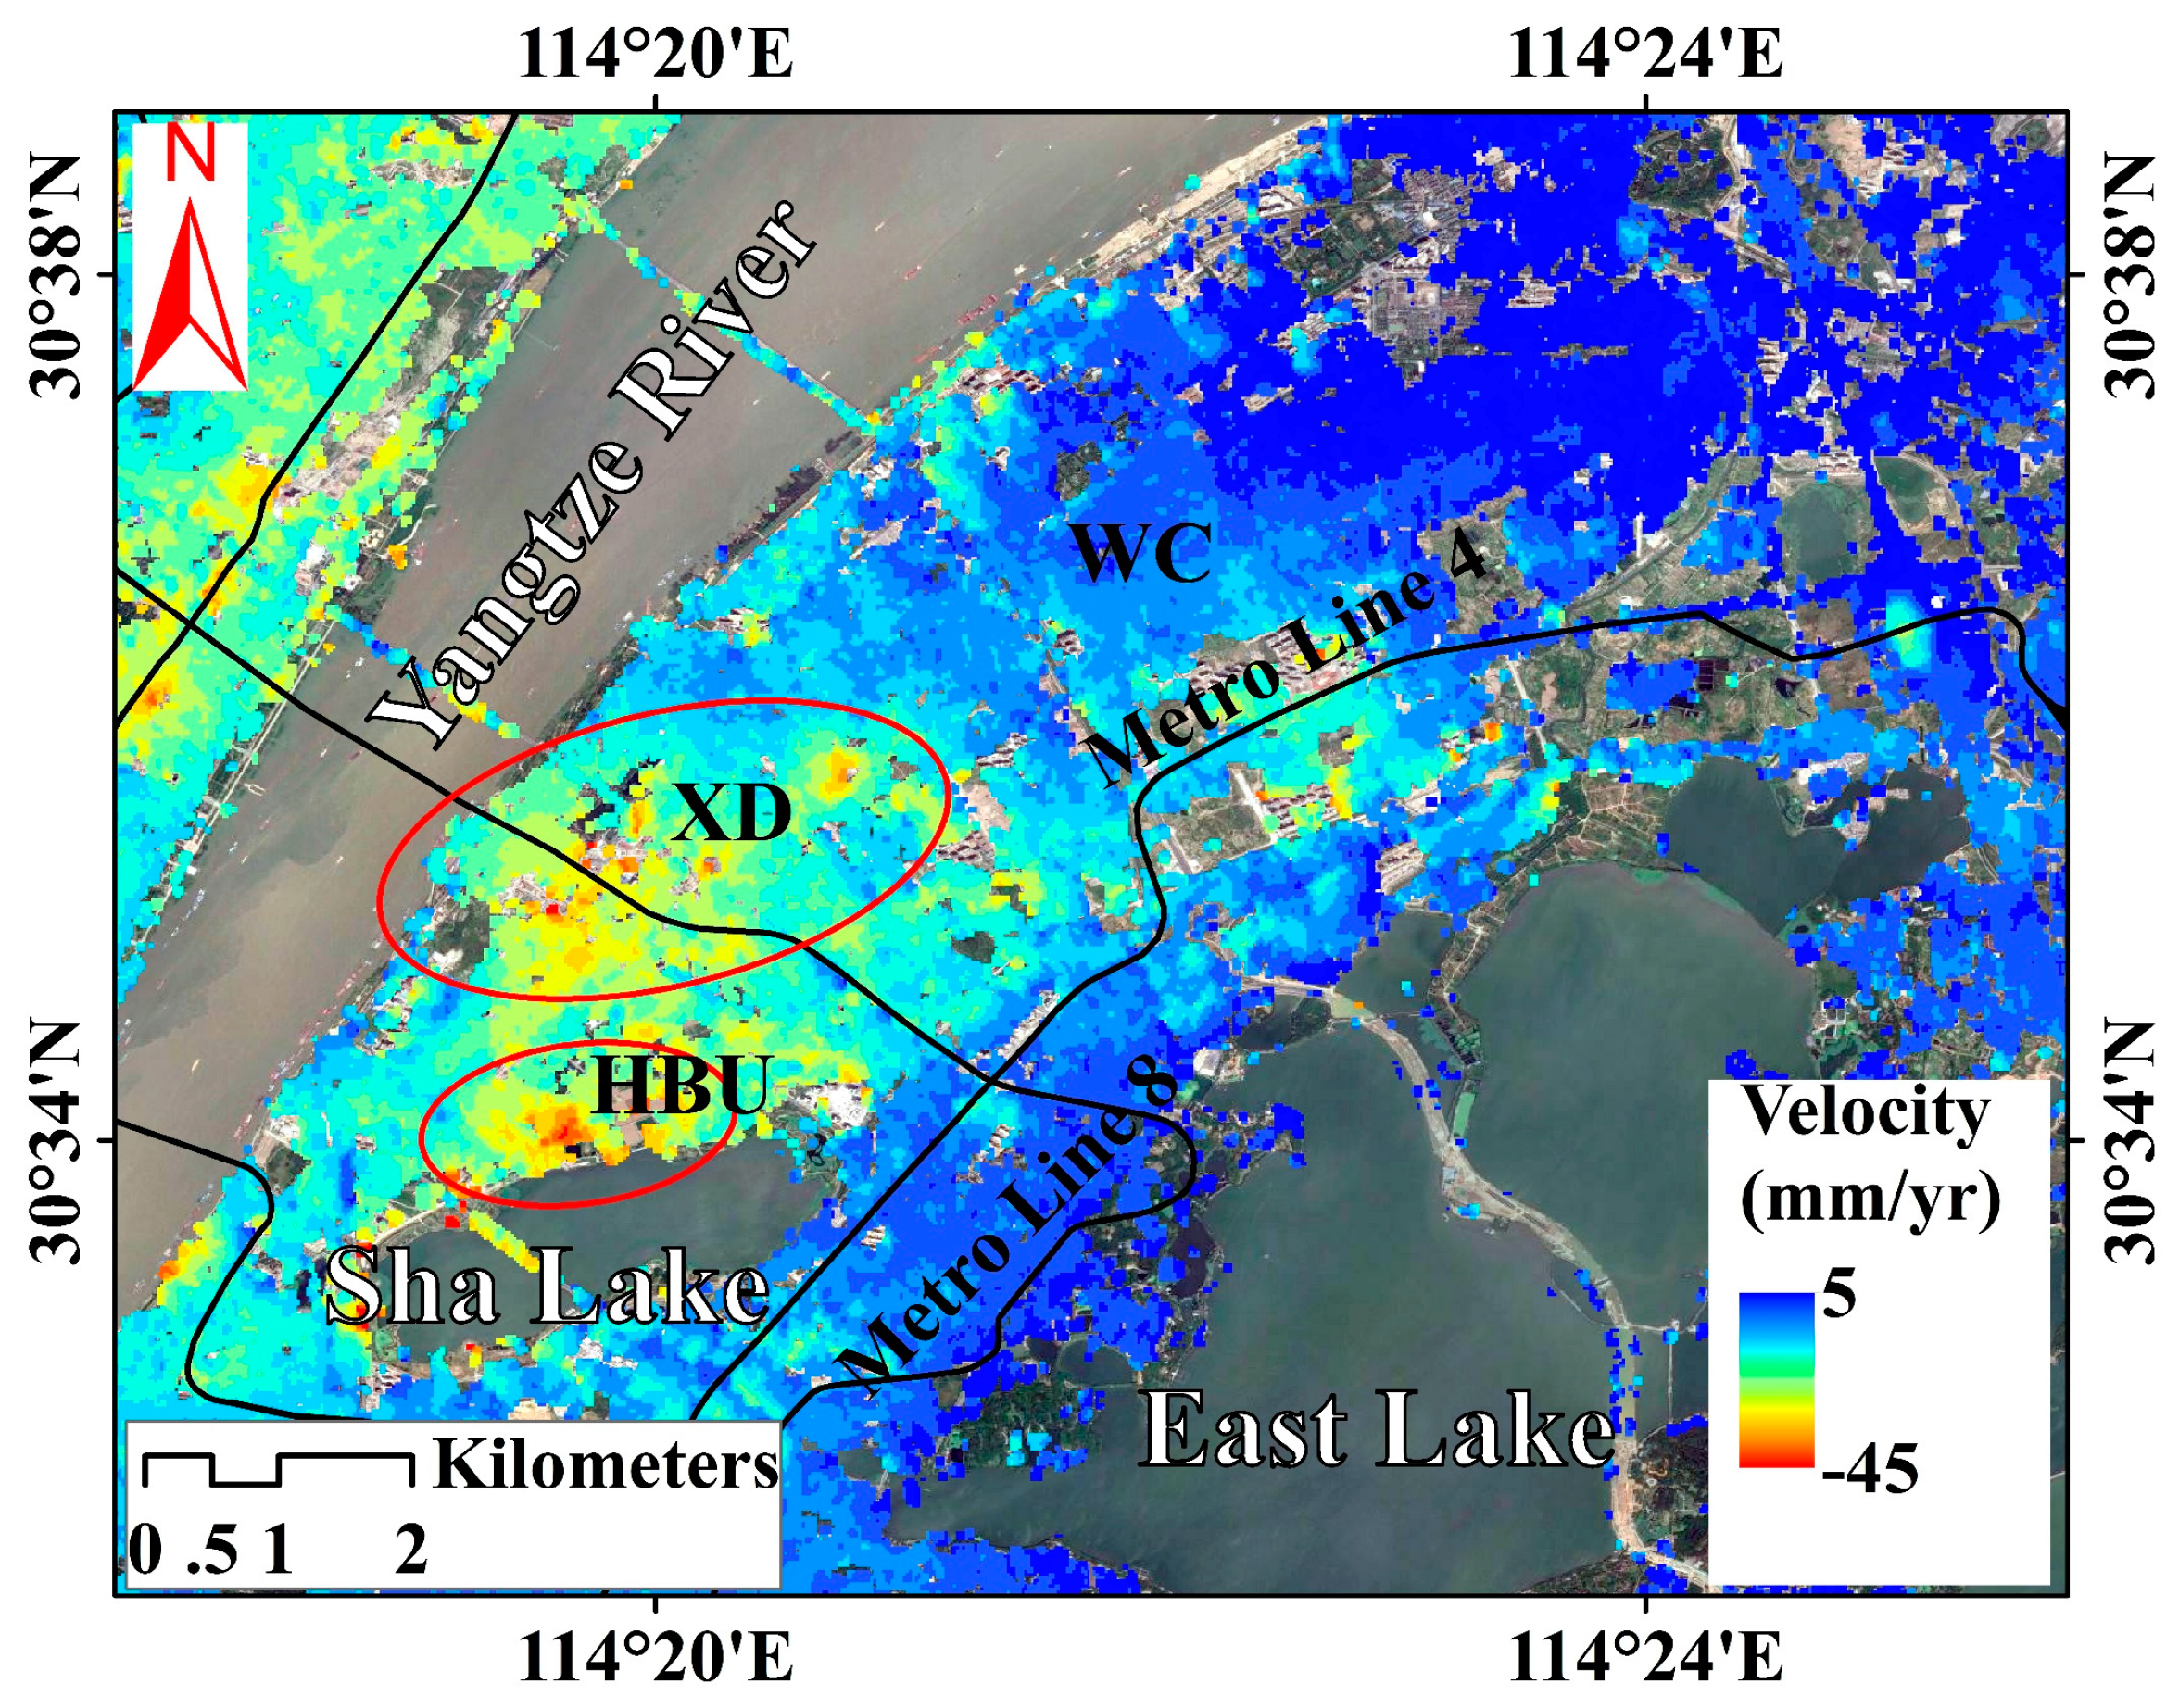
Figure 9 shows zoomed subsidence rate map of Region S3. In comparison with Region S1, subsidence rates in this region are much lower, and maximum subsidence rate just exceeds −40 mm/year. Two significant subsidence areas, namely, Xudong (XD) and Hubei University (HBU) subsidence areas (red ellipses in Figure 9), were identified in Region S3. The Metro Line 8 under construction runs through XD area along a northwest–southeast direction. The HBU area is located in the northern region of Sha Lake, where multiple super-tall residential communities are distributed along the lake. Distribution of settlement areas indicates that surface subsidence in Region S3 correlates with urban construction.
5.3. Effects of Surface Subsidence coupled with Industrial Development
Wuhan is one of the important old industrial bases in China. Many important industries are distributed in Wuhan. Multiple large-scale industrial plants (e.g., WISC, SWC, Yangluo Cement Plant (YCP), and HYPP) are located in Region S2. As shown in Figure 10a, severe subsidence areas are mainly yellow or red areas, and the most severe subsidence area is situated in SWC (white polygons in Figure 10a). The SWC subsidence area features the most serious subsidence rate, with maximum exceeding −46 mm/year. The subsidence bowl and the industrial area in WISC are consistent to some extent, although the distribution range of the subsidence bowl is smaller than that of the industrial area.The spatial distribution of the subsidence bowl overlaps the industrial regions in SWC, YCP and HYPP. In addition to industrial districts, a subsidence area has formed east of the YL urban area, and its highest subsidence rate reaches up to −32 mm/year.
Fieldwork was implemented in severe subsidence areas of Region S2 in October 2016. Figure 10b shows an approximately 2 cm-width crack on the step of a building located in YCP subsidence area. Figure 10c illustrates a 1.5 cm-wide crack on the roadside step caused by differential settlement situated in YL urban area.
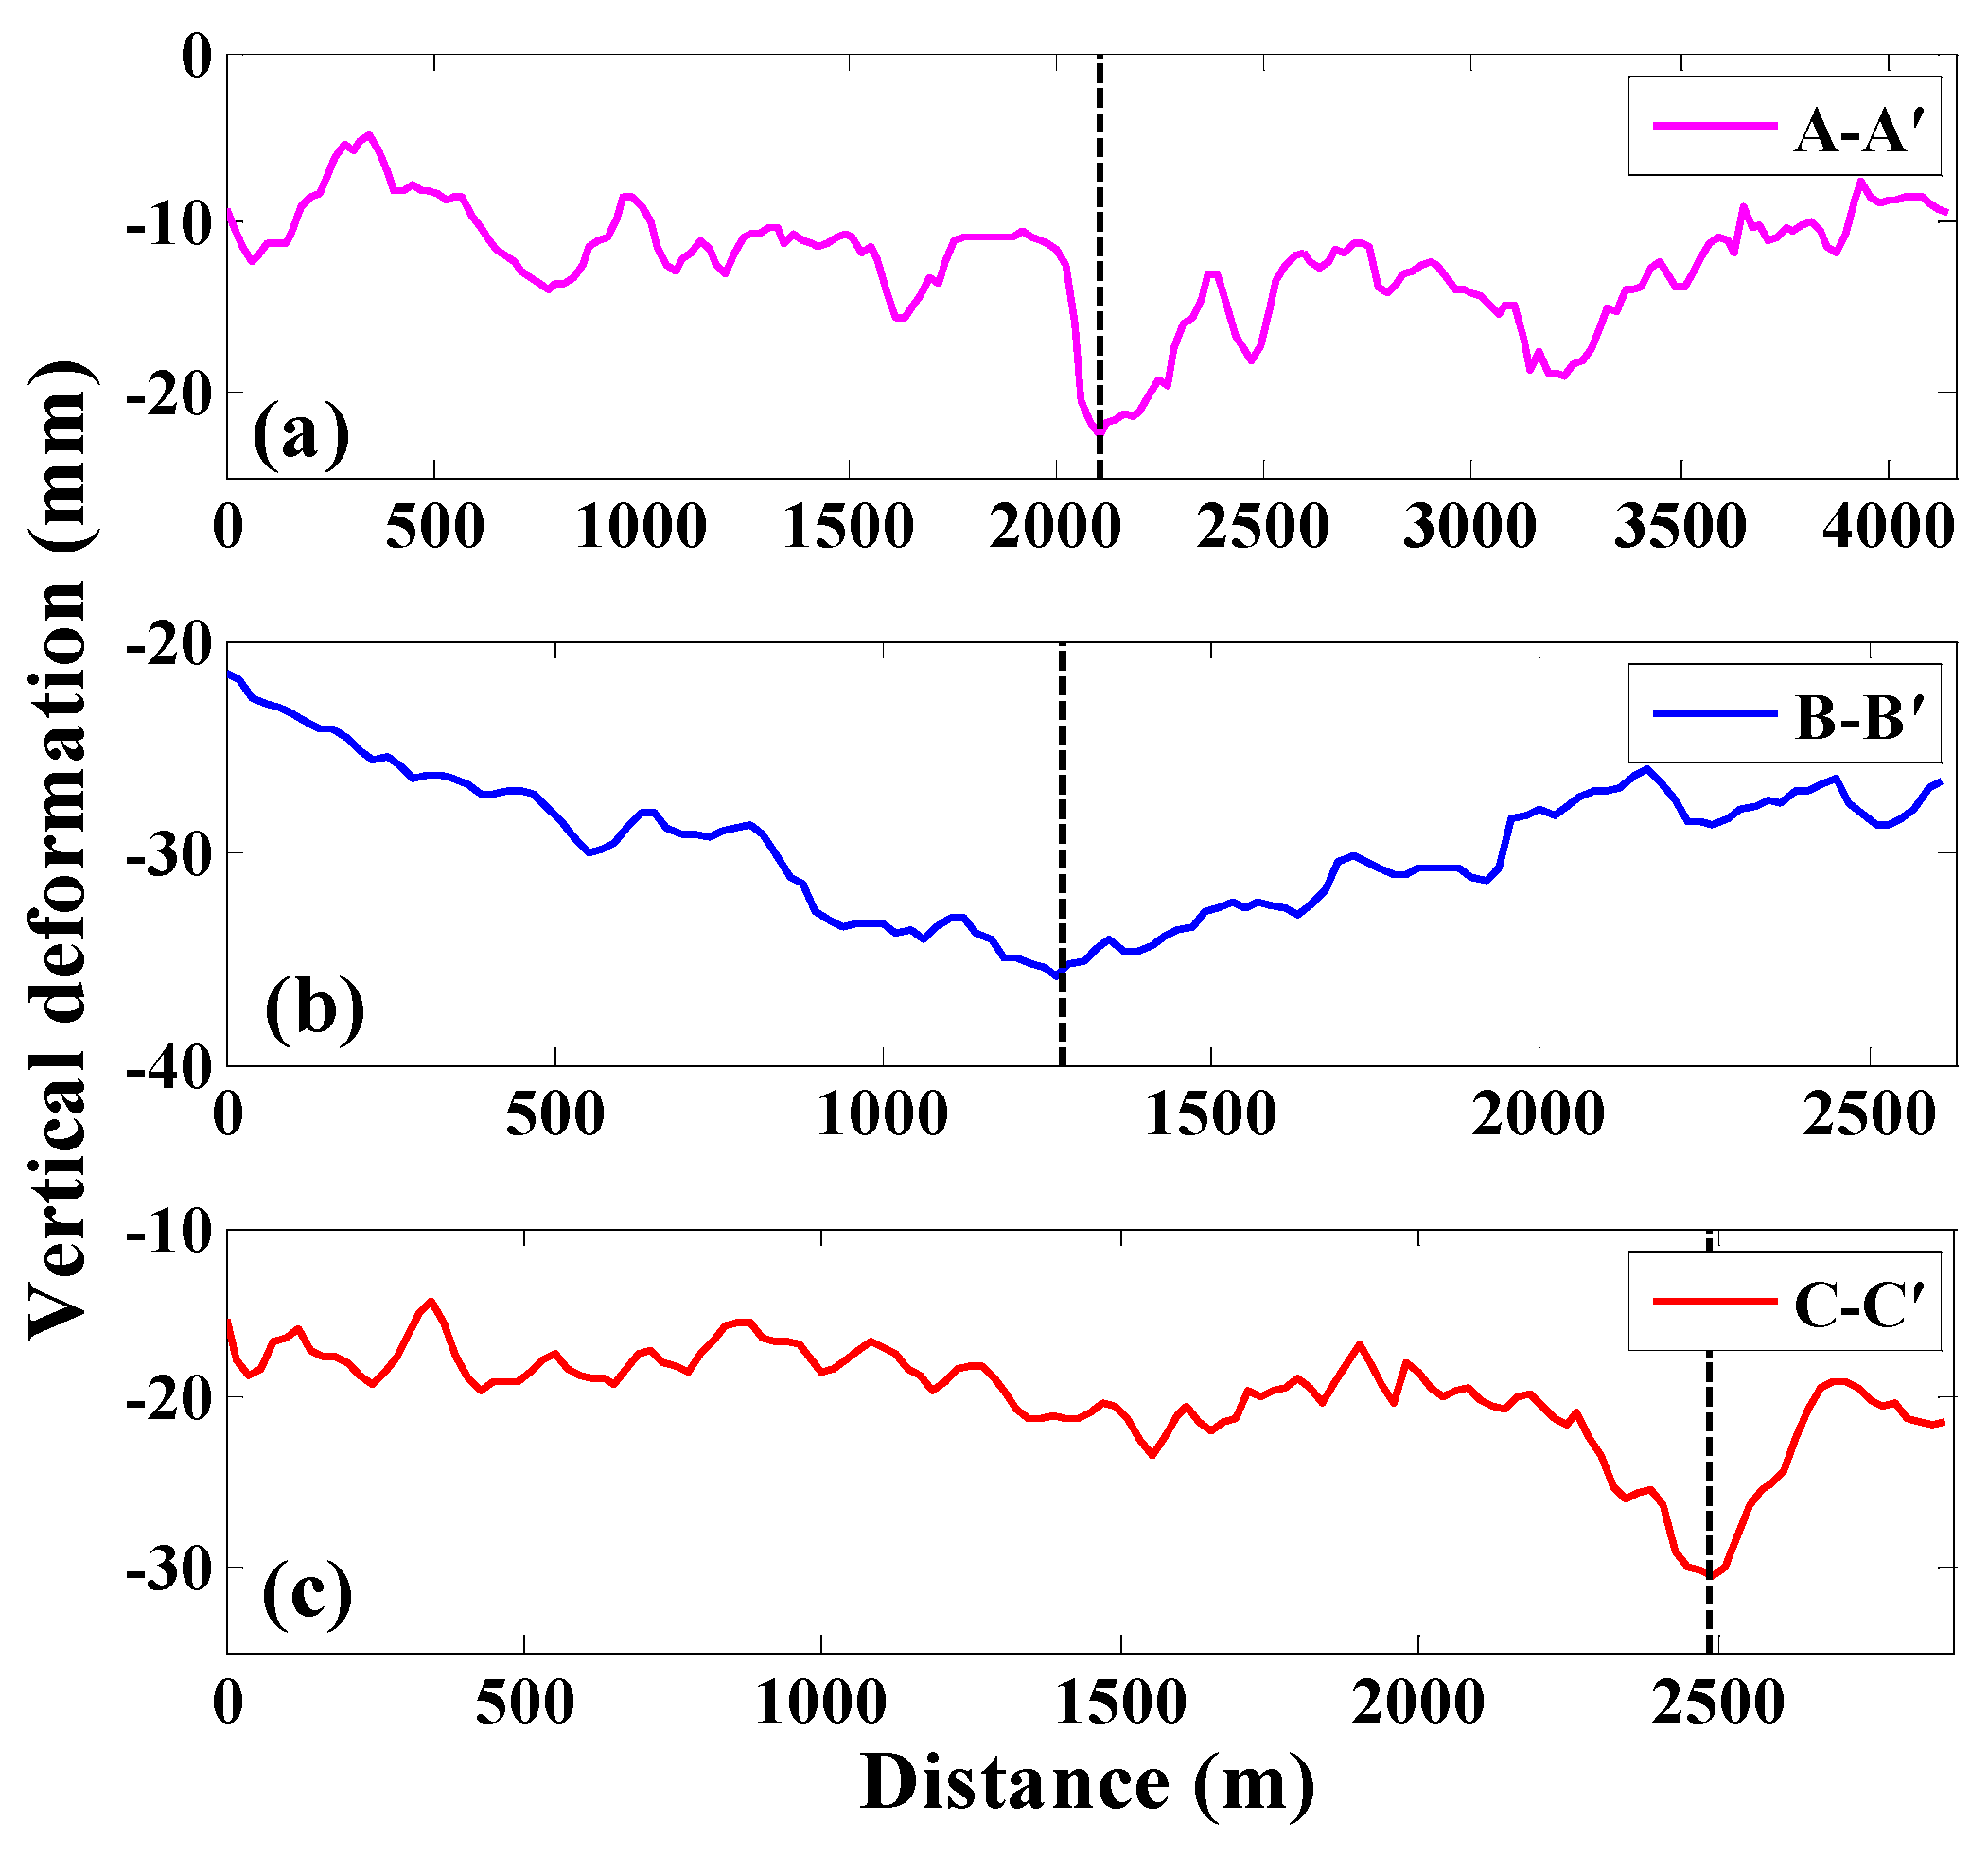
Three profiles in representative areas were selected for subsidence analysis (A-A′, B-B′, and C-C′ in Figure 10). From A-A′ in Figure 11a, two remarkable subsidence bowls formed in the WISC area, and the largest subsidence along profiles A-A′ reaches up to −23 mm. In this area, the main factor inducing surface subsidence is groundwater overdraft caused by industrial development. By combining Figure 10a and Figure 11b, we can conclude that a large subsidence bowl has formed in SWC area. The profile length reaches approximately 2.6 km, and maximum subsidence along profile B-B′ totals −36 mm. Figure 11c illustrates subsidence variation along a profile through the YL urban area in approximately east–west direction. Maximum subsidence measures −31 mm, which is close to point C′.
Overall, as multiple large-scale industrial plants are distributed in Region S2, high amounts of groundwater are pumped for industrial production, reducing pore water pressure in the aquifer of the overlaying soil and leading to uneven surface subsidence. A relatively high spatial correlation also exists between locations of surface subsidence bowl and that of industrial area.
5.4. Correlation between Surface Subsidence and Carbonate Karstification
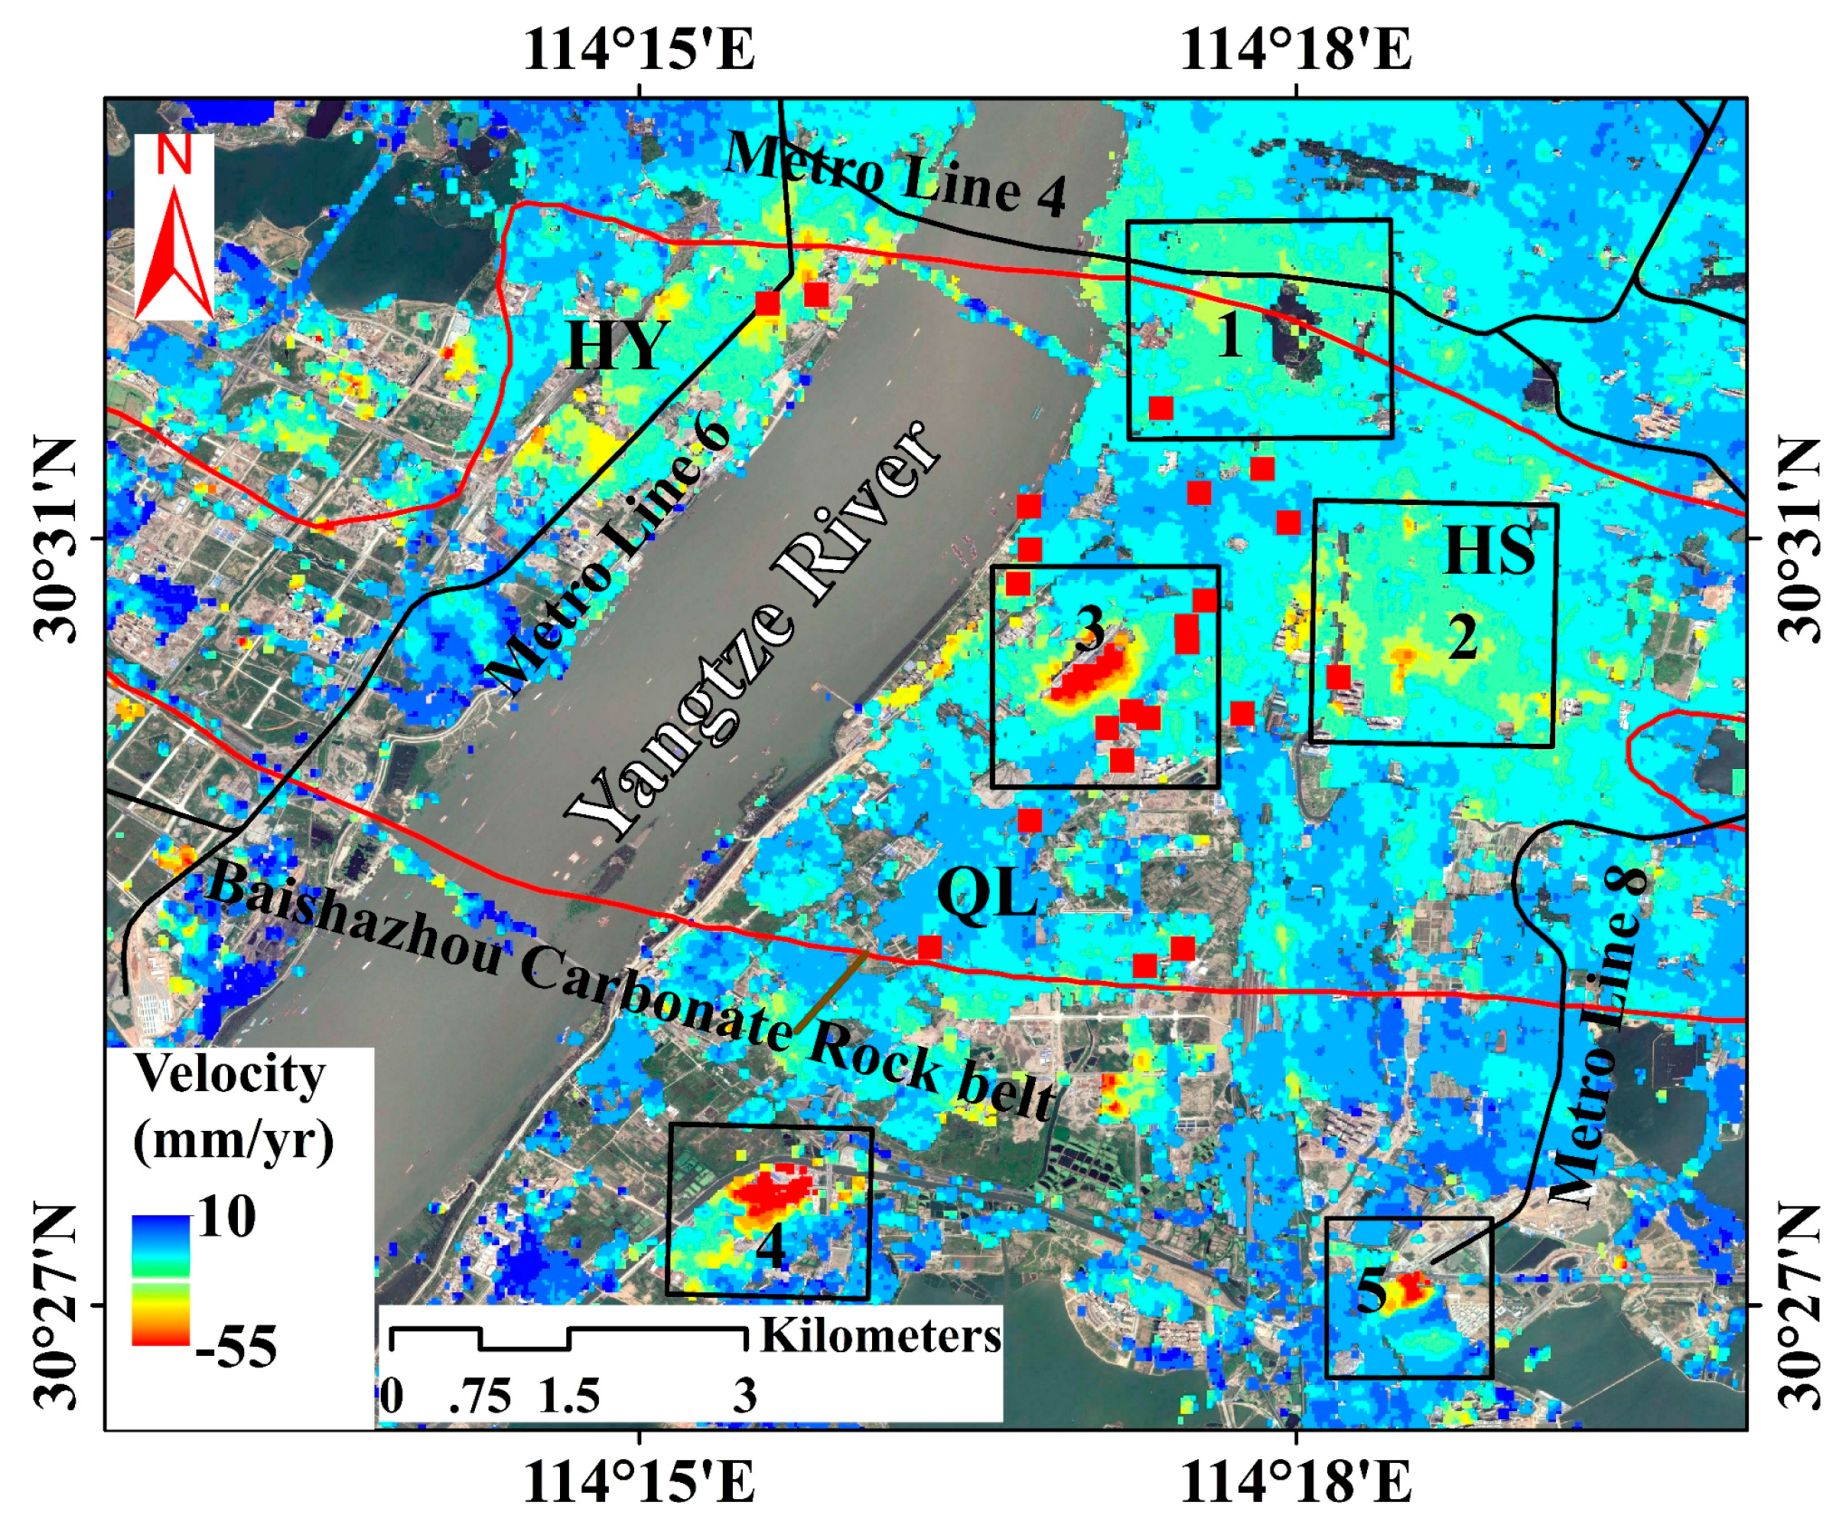
Covered karst is widely distributed in Wuhan, and the area covered by quaternary loose sediments on the karst can easily induce surface collapse [50]. The covered karst area of the first terrace on both sides of Yangtze River are extremely prone to surface subsidence. Karst surface collapse is mainly distributed in HS, HY, and WC Districts. From 1977 to 2014, 29 karst surface collapses occurred in various locations in Wuhan, with 22 occurring in Region S4 (red squares in Figure 12) [51]. The Baishazhou Carbonate Rock belt (the area enclosed by red lines in Figure 12) is located in Region S4, where karst cave encountering rate of borehole and linear karst rate of borehole total 46.0% and 6.0%, respectively, and silty-fine sand is directly located above carbonate formations [52]. Cohesion of holocene silty-fine sand is small or equal to zero. Hence, silty-fine sand can easily enter the underlying karst channel under the influence of gravity and seepage force, thereby resulting in surface subsidence or karst surface collapse.
As illustrated in Figure 12, uneven settlement is notable in Region S4, and five significant subsidence bowls were detected, namely, areas 1, 2, 3, 4, and 5, as labeled in Figure 12. Maximum subsidence rates in subsidence bowls 1, 2, 3, 4, and 5 reach up to −20, −29, −48, −53, and −35 mm/year, respectively. Subsidence rates in HY located west of the Yangtze River are small compared with that of the east, and subsidence areas are mainly distributed along Metro Line 6, which is under construction. Most subsidence bowls and surface collapses are located in the Baishazhou Carbonate Rock belt in the eastern part of Yangtze River (Figure 12). Groundwater level in this area is closely related to water level in Yangtze River, whereas active water level variations in Yangtze River can exacerbate groundwater cycle and promote development of underground karst caves. This situation can easily lead to surface subsidence and then surface collapse. The above analysis suggests that surface subsidence in Region S4 is seriously affected by carbonate karstification. Both water level variations of Yangtze River and urban engineering construction influence surface subsidence in this area.
5.5. Comparison between Surface Subsidence Changes and Water Level Changes
To analyze the relationship between surface subsidence and water level changes in Yangtze River, six PS points distributed along the sides of Yangtze River (the five-pointed star in Figure 13) and data on daily water level changes observed by Hankou hydrological station (black square in Figure 13) were selected to compare and analyze their changes time series.
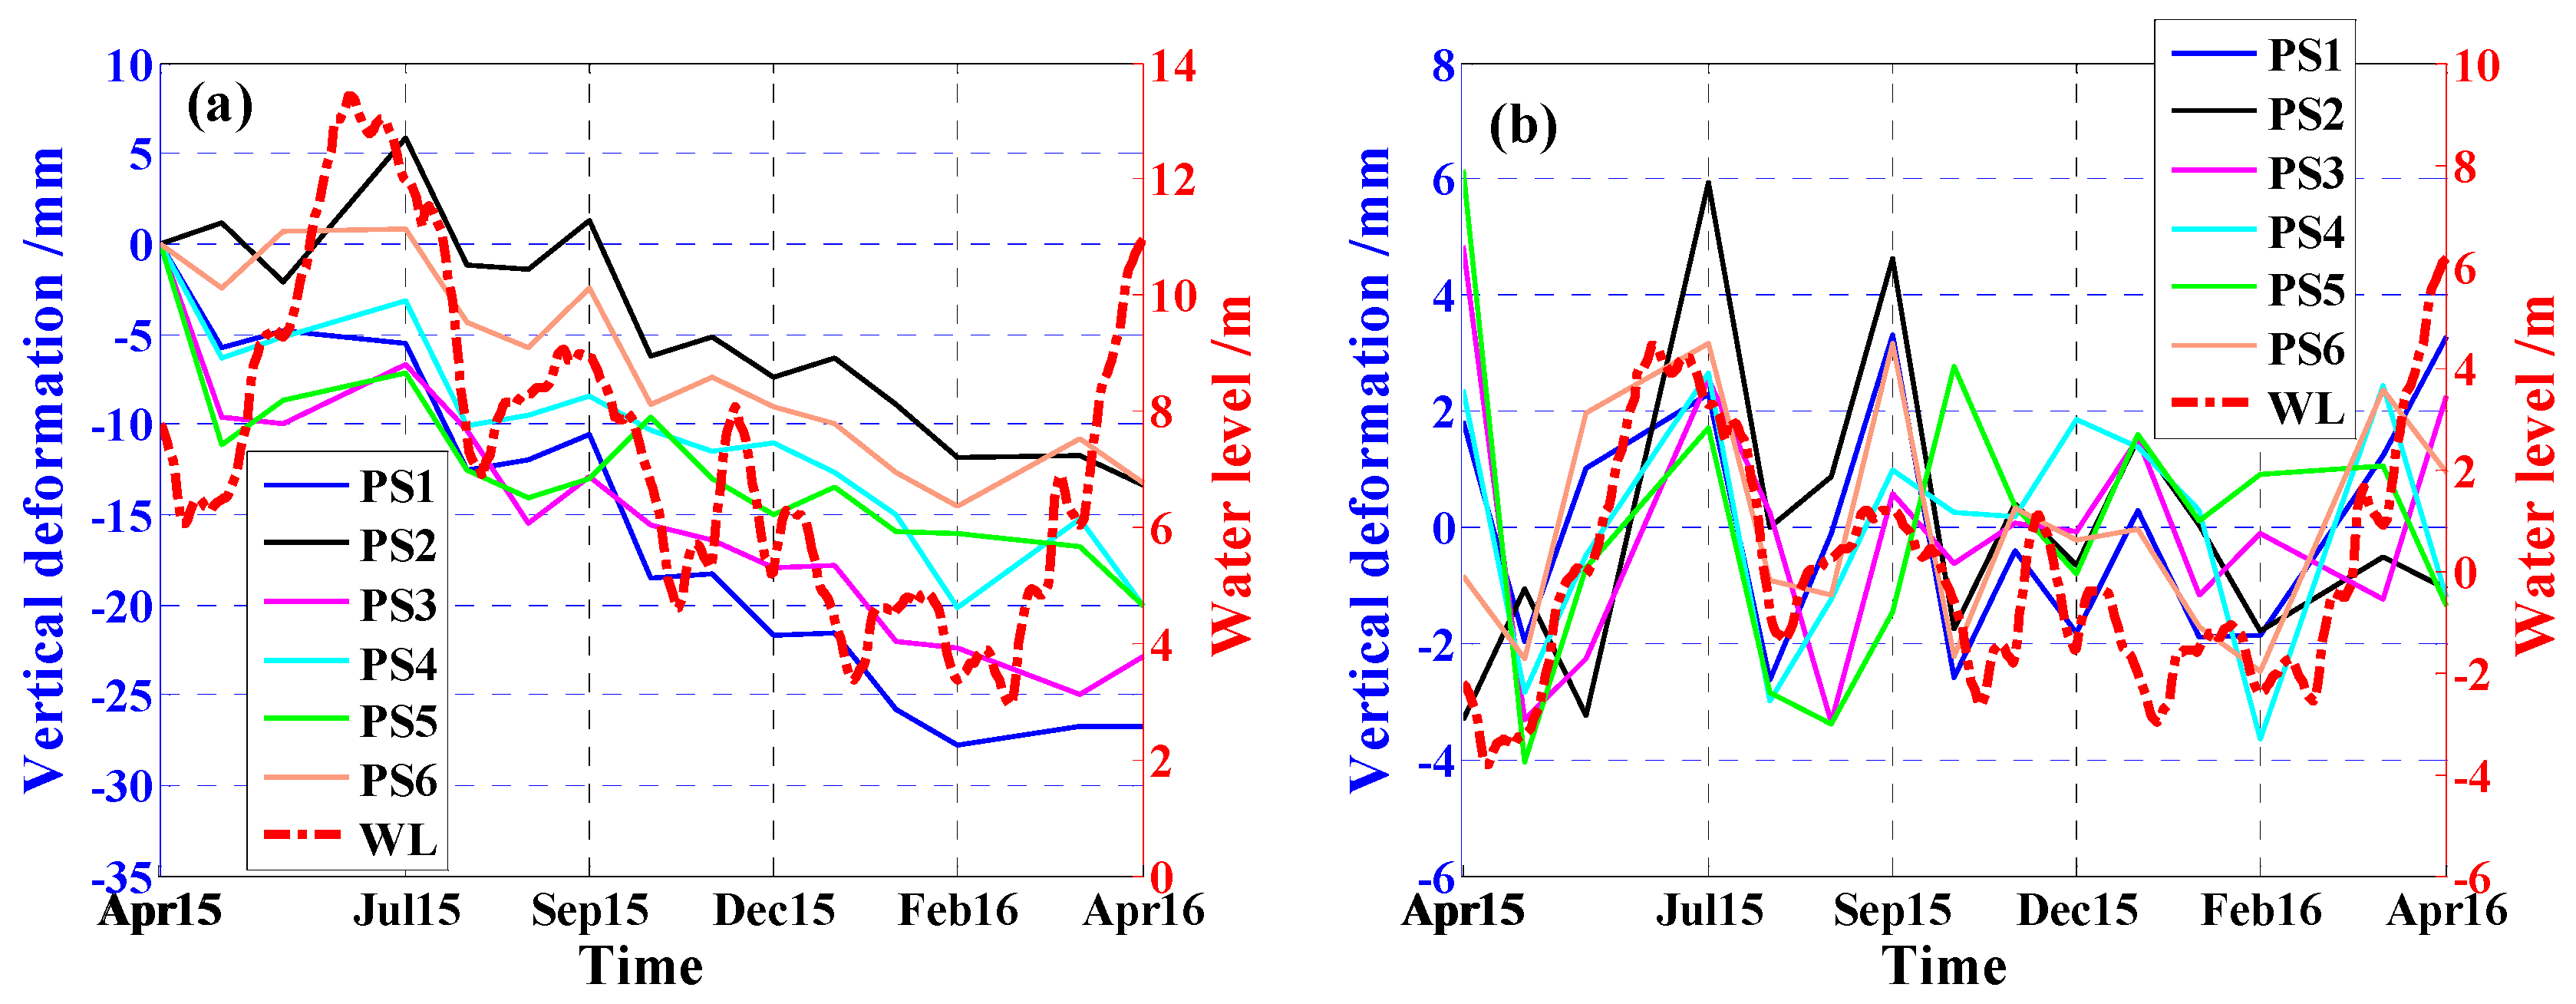
As illustrated in Figure 14a, water level changes in Yangtze River exhibit obvious seasonal variability during the study period. Water level was typically high from May to July but low from January to March. On the other side, surface subsidence time series of the six PS points also showed a nonlinear decline with seasonal oscillation. Water level was high from May to July, and subsidence was low because of high water level in Yangtze River during this period. These conditions can effectively replenish groundwater and mitigate surface subsidence. From July 2015 to March 2016, water level dropped by 9 m, and average accumulated subsidence of six PS points reached approximately −19 mm.
To quantitatively analyze the relationship between surface subsidence and water level changes, we adopted the grey relational analysis (GRA) [53,54] to analyze proximity between subsidence and water level changes. Proximity is described by the grey relational grade (GRG), which is regarded a measure of similarities of discrete time-series data [55,56]. Temporal samplings of Sentinel-1A TOPS and water level data differ. Hence, we first interpolated subsidence time-series data to the same temporal sampling as water level data. Subsequently, we adopted GRA to calculate the GRG between subsidence and water level time series and the GRG between detrended subsidence and water level time series (results are listed in Table 3). The GRG indicates the magnitude of correlation between subsidence and water level time series. The closer the GRG value is to 1, the better the correlation [57,58]. Table 3 lists the standard deviation of subsidence with respect to the six PS points (i.e., PS1–PS6) and the standard deviations of the six selected PS points are approximately 1 mm. All GRGs between subsidence and water level time series are greater than 0.8, it is concluded that subsidence of PS points in Figure 14a is relatively highly related to the decline of water level.
To further analyze the relationship between surface subsidence changes and water level changes, linear trends in surface subsidence changes and water level changes were removed by the least squares (LS) method. After removing the linear trend, the settlement changes of these PS points exhibit a certain periodic characteristics, as shown in Figure 14b. The peaks between detrended water level changes and subsidence changes show a similar pattern, but subsidence reaches its peak later than the water level. Furthermore, the GRGs between detrended subsidence and water level time series are close to 1, as shown in Table 3, indicating changes of subsidence may be closely related to that of water level. Therefore, we infer that seasonal signal is present in subsidence changes time series. In addition, as shown in Figure 14b, the fluctuation magnitude of displacement curves is about 3–4 mm, which is larger than the standard deviation of subsidence of the six selected PS points. This is because the curves shown in Figure 14b include nonlinear variations and error (i.e., the incompletely removed systematic error). While the standard deviation of subsidence were derived from the systematic error.
Overall, surface subsidence along sides of the Yangtze River correlated with water level changes. Specifically, seasonal component of subsidence time series is probably influenced by water level changes. Because of insufficient data, we cannot investigate the seasonal variations in subsidence time series in detail. In addition, longer time series will help to confirm the correlation between surface subsidence and water level changes. Therefore, we will study the periodic characteristics of signals using more data in the future research.
6. Conclusions
This paper presented spatial-temporal distribution of wide-area surface subsidence in Wuhan as derived by 15 Sentinel-1A TOPS SAR images using SBAS-InSAR technique. Cross-validation was conducted between InSAR- and leveling-derived results. The relationship between surface subsidence patterns and anthropogenic activities (e.g., metro construction, large-scale building construction and industrial development) and natural factors (e.g., precipitation, carbonate karstification and water level changes) were analyzed in detail, based on Sentinel-1A data, leveling data, daily water level changes data on Yangtze River, and distribution data of carbonate rock belt and industrial areas, etc. The main conclusions are as follows:
- (1)
- Surface subsidence in Wuhan is remarkably uneven, and four significant subsidence areas were detected in Wuhan. These surface subsidence areas are mainly distributed in the central urban areas of Wuhan (i.e., HK and WC Districts), industrial areas in QS and YL Districts, and Baishazhou Carbonate Rock belt. Annual average subsidence rates in Wuhan range from −82 mm/year to 18 mm/year. The most serious subsidence bowl was identified in HH area with a maximum rate exceeding −80 mm/year. Additionally, surface subsidence time series shows nonlinear subsidence with pronounced seasonal variations.
- (2)
- Internal precision checking indicated that standard deviation of Sentinel-1A SBAS InSAR results in the study area is 3 mm/year, and 86.27% of the PS point standard deviations are within 6 mm/year, implying high reliability and precision of surface subsidence derived by SBAS InSAR technique using Sentinel-1A data. Results obtained by SBAS InSAR and leveling showed good agreement. Specifically, RMSE and mean error reach 6 and −1 mm/year, respectively.
- (3)
- Surface subsidence in Wuhan is seriously affected by urban construction and industrial development, and spatial distribution of subsidence bowl is relatively highly correlated to that of engineering construction and industrial areas. In addition, carbonate karstification in Wuhan also plays a significant impact factor in surface subsidence. Seasonal variations in surface subsidence are correlated to water level changes and precipitation. The GRGs between detrended subsidence and water level time series are close to 1, indicating changes of subsidence may be closely related to that of water level. However, anthropogenic activities pose more notable influence on surface subsidence in Wuhan than natural factors.
Supplementary Materials
Supplementary File 1Acknowledgments
This work was supported by the National Nature Science Foundation of China (Grant Nos. 41474004, 41461089 and 41604019); the Key Laboratory for Digital Land and Resources of Jiangxi Province, East China University of Technology (No. DLLJ201711); and the Open Fund of Guangxi Key Laboratory of Spatial Information and Geomatics (Grant No. 15-140-07-32). The authors wish to thank the ESA for arranging the Sentinel-1A data, NASA for providing the SRTM3 DEM data, ESA for releasing the POD data, the Wuhan Geomatics Institute for providing leveling data and the Changjiang Wuhan Waterway Bureau for providing the daily water level changes of Yangtze River.
Author Contributions
All authors contributed to the manuscript and discussed the results. Jiming Guo and Lv Zhou developed the idea that led to this paper. Lv Zhou performed Sentinel-1A data processing and analyses, and contributed to the manuscript of the paper. Jiming Guo provided critical comments and contributed to the final revision of the paper. Jiangwei Li performed the leveling data processing and analyzed the leveling-derived results. Yongfeng Xu performed the water level changes data processing and provided critical comments. Jiyuan Hu and Yuanjin Pan interpreted the SBAS InSAR-derived results and revised the manuscript. During the revision of manuscript, Miao Shi helped to calculate the GRG between subsidence and water level time series and analyze the relationship between surface subsidence and water level changes, and revised the manuscript. In addition, all authors contributed to the final revision of manuscript.
Conflicts of Interest
The authors declare no conflict of interest.
References
- Ge, L.; Ng, A.; Li, X.; Abidin, H.; Gumilar, I. Land subsidence characteristics of Bandung Basin as revealed by ENVISAT ASAR and ALOS PALSAR interferometry. Remote Sens. Environ. 2014, 154, 46–60. [Google Scholar] [CrossRef]
- Guo, J.M.; Zhou, L.; Yao, C.; Hu, J. Surface Subsidence Analysis by Multi-Temporal InSAR and GRACE: A Case Study in Beijing. Sensors 2016, 16, 1495. [Google Scholar] [CrossRef] [PubMed]
- Du, Z.; Ge, L.; Li, X.; Ng, A. Subsidence Monitoring over the Southern Coalfield, Australia Using both L-Band and C-Band SAR Time Series Analysis. Remote Sens. 2016, 8, 543. [Google Scholar] [CrossRef]
- Qu, F.; Zhang, Q.; Lu, Z.; Zhao, C.; Yang, C.; Zhang, J. Land subsidence and ground fissures in Xi’an, China 2005–2012 revealed by multi-band InSAR time-series analysis. Remote Sens. Environ. 2014, 155, 366–376. [Google Scholar] [CrossRef]
- Yang, H.L.; Peng, J.H. Monitoring Urban Subsidence with Multi-master Radar Interferometry Based on Coherent Targets. J. Indian Soc. Remote Sens. 2015, 43, 529–538. [Google Scholar] [CrossRef]
- Duan, G.Y.; Gong, H.L.; Liu, H.; Zhang, Y.; Chen, B.; Lei, K. Monitoring and Analysis of Land Subsidence Along Beijing-Tianjin Inter-City Railway. J. Indian Soc. Remote Sens. 2016, 44, 915–931. [Google Scholar]
- Amelung, F.; Galloway, D.L.; Bell, J.W.; Zebker, H.A.; Laczniak, R.J. Sensing the ups and downs of Las Vegas: InSAR reveals structural control of land subsidence and aquifer-system deformation. Geology 1999, 27, 483–486. [Google Scholar] [CrossRef]
- Motagh, M.; Walter, T.R.; Sharifi, M.A.; Fielding, E.; Schenk, A.; Anderssohn, J.; Zschau, J. Land subsidence in Iran caused by widespread water reservoir overexploitation. Geophys. Res. Lett. 2008, 35, L16403. [Google Scholar] [CrossRef]
- Chaussard, E.; Amelung, F.; Abidin, H.; Hong, S.H. Sinking cities in Indonesia: ALOS PALSAR detects rapid subsidence due to groundwater and gas extraction. Remote Sens. Environ. 2013, 128, 150–161. [Google Scholar] [CrossRef]
- Poland, M.; Bürgmann, R.; Dzurisin, D.; Lisowski, M.; Marsterlark, T.; Owen, S.; Fink, J. Constraints on the mechanism of long-term, steady subsidence at Medicine Lake volcano, northern California, from GPS, leveling, and InSAR. J. Volcanol. Geotherm. Res. 2006, 150, 55–78. [Google Scholar] [CrossRef]
- Baldi, P.; Casula, G.; Cenni, N.; Loddo, F.; Pesci, A. GPS-based monitoring of land subsidence in the Po Plain (Northern Italy). Earth Planet. Sci. Lett. 2009, 288, 204–212. [Google Scholar] [CrossRef]
- Carminati, E.; Martinelli, G. Subsidence rates in the Po Plain, northern Italy: the relative impact of natural and anthropogenic causation. Eng. Geol. 2002, 66, 241–255. [Google Scholar] [CrossRef]
- Psimoulis, P.; Ghilardi, M.; Fouache, E.; Stiros, S. Subsidence and evolution of the Thessaloniki plain, Greece, based on historical leveling and GPS data. Eng. Geol. 2007, 90, 55–70. [Google Scholar] [CrossRef]
- Anell, I.; Thybo, H.; Artemieva, I.M. Cenozoic uplift and subsidence in the North Atlantic region: Geological evidence revisited. Tectonophysics 2009, 474, 78–105. [Google Scholar] [CrossRef]
- Gabriel, A.K.; Goldstein, R.M.; Zebker, H.A. Mapping small elevation changes over large areas: Differential radar interferometry. J. Geophys. Res. 1989, 94, 9183–9191. [Google Scholar] [CrossRef]
- Zebker, H.A.; Villasenor, J. Decorrelation in Interferometric Radar Echoes. IEEE Trans. Geosci. Remote Sens. 1992, 30, 950–959. [Google Scholar] [CrossRef]
- Biswas, K.; Chakravarty, D.; Mitra, P.; Misra, A. Spatial-Correlation Based Persistent Scatterer Interferometric Study for Ground Deformation. J. Indian Soc. Remote Sens. 2017, 45, 1–14. [Google Scholar] [CrossRef]
- Hanssen, R.F. Radar Interferometry Data Interpretation and Error Analysis, 1st ed.; Springer: Berlin, Germany, 2001. [Google Scholar]
- Ferretti, A.; Savio, G.; Barzaghi, R.; Borghi, A.; Musazzi, S.; Novali, F.; Prati, C.; Rocca, F. Submillimeter accuracy of InSAR time series: Experimental validation. IEEE Trans. Geosci. Remote Sens. 2007, 45, 1142–1153. [Google Scholar] [CrossRef]
- Vajedian, S.; Motagh, M.; Nilfouroushan, F. StaMPS improvement for deformation analysis in mountainous regions: Implications for the Damavand volcano and Mosha fault in Alborz. Remote Sens. 2015, 7, 8323–8347. [Google Scholar] [CrossRef]
- Zhang, L.; Ding, X.; Lu, Z. Modeling PSInSAR time series without phase unwrapping. IEEE Trans. Geosci. Remote Sens. 2011, 49, 547–556. [Google Scholar] [CrossRef]
- Ferretti, A.; Prati, C.; Rocca, F. Permanent scatterers in SAR interferometry. IEEE Trans. Geosci. Remote Sens. 2001, 39, 8–20. [Google Scholar] [CrossRef]
- Beradino, P.; Fornaro, G.; Lanari, R.; Sansosti, E. A new algorithm for Surface deformation monitoring based on small baseline differential SAR interferograms. IEEE Trans. Geosci. Remote Sens. 2002, 40, 2375–2383. [Google Scholar] [CrossRef]
- Lanari, R.; Mora, O.; Manunta, M.; Mallorquí, J.J.; Beradino, P.; Sansosti, E. A small-baseline approach for investigating deformations on full-resolution differential SAR interferograms. IEEE Trans. Geosci. Remote Sens. 2004, 42, 1377–1386. [Google Scholar] [CrossRef]
- Hooper, A. A multi-temporal InSAR method incorporating both persistent scatterer and small baseline approaches. Geophys. Res. Lett. 2008, 30, L16302. [Google Scholar] [CrossRef]
- Zhang, L.; Ding, X.; Lu, Z. Ground settlement monitoring based on temporarily coherent points between two SAR acquisitions. ISPRS J. Photogramm. 2011, 66, 146–152. [Google Scholar] [CrossRef]
- Perissin, D.; Wang, T. Repeat-pass SAR interferometry with partially coherent targets. IEEE Trans. Geosci. Remote Sens. 2011, 50, 271–280. [Google Scholar] [CrossRef]
- Bateson, L.; Cigna, F.; Boon, D.; Sowter, A. The application of the Intermittent SBAS (ISBAS) InSAR method to the South Wales Coalfield, UK. Int. J. Appl. Earth Obs. Geoinf. 2015, 34, 249–257. [Google Scholar] [CrossRef] [Green Version]
- Chen, B.; Gong, H.; Li, X.; Lei, K.; Zhu, L.; Gao, M.; Zhou, C. Characterization and causes of land subsidence in Beijing, China. Int. J. Remote Sens. 2017, 38, 808–826. [Google Scholar] [CrossRef]
- Castellazzi, P.; Arroyo-Domínguez, N.; Martel, R.; Calderhead, A.; Normand, J.; Gárfias, J.; Rivera, A. Land subsidence in major cities of Central Mexico: Interpreting InSAR-derived land subsidence mapping with hydrogeological data. Int. J. Appl. Earth Obs. Geoinf. 2016, 47, 102–111. [Google Scholar] [CrossRef]
- Le, T.; Chang, C.P.; Nguyen, X.; Yhokha, A. TerraSAR-X Data for High-Precision Land Subsidence Monitoring: A Case Study in the Historical Centre of Hanoi, Vietnam. Remote Sens. 2016, 8, 338. [Google Scholar] [CrossRef]
- Dong, S.; Samsonov, S.; Yin, H.; Ye, S.; Cao, Y. Time-series analysis of subsidence associated with rapid urbanization in Shanghai, China measured with SBAS InSAR method. Environ. Earth Sci. 2014, 72, 677–691. [Google Scholar] [CrossRef]
- Wu, J.; Hu, F. Monitoring Ground Subsidence along the Shanghai Maglev Zone Using TerraSAR-X Images. IEEE Geosci. Remote Sens. 2017, 14, 117–121. [Google Scholar] [CrossRef]
- Liu, X.; Cao, Q.; Xiong, Z.; Yin, H.; Xiao, G. Application of small baseline subsets D-InSAR technique to estimate time series land deformation of Jinan area, China. J. Appl. Remote Sens. 2016, 10, 026014. [Google Scholar] [CrossRef]
- Bai, L.; Jiang, L.; Wang, H.; Wang, H.; Sun, Q. Spatiotemporal Characterization of Land Subsidence and Uplift (2009–2010) over Wuhan in Central China Revealed by TerraSAR-X InSAR Analysis. Remote Sens. 2016, 8, 350. [Google Scholar] [CrossRef]
- Fan, S. A Discussion on Karst Collapse in Wuhan (Hubei). Resour. Environ. Eng. 2006, 20, 608–616. [Google Scholar]
- Luo, X. Division of “Six Belts and Five Types” of carbonate region and control of karst geological disaster in Wuhan. J. Hydraul. Eng. 2014, 45, 171–179. [Google Scholar]
- Costantini, M.; Bai, J.; Malvarosa, F.; Minati, F.; Vecchioli, F.; Wang, R.; Hu, Q.; Xiao, J.; Li, J. Ground deformations and building stability monitoring by COSMO-SkyMed PSP SAR interferometry: Results and validation with field measurements and surveys. In Proceedings of the IGARSS 2016—IEEE International Geoscience and Remote Sensing Symposium, Beijing, China, 10–15 July 2016. [Google Scholar]
- Velotto, D.; Bentes, C.; Tings, B.; Lehner, S. First Comparison of Sentinel-1 and TerraSAR-X Data in the Framework of Maritime Targets Detection: South Italy Case. IEEE J. Ocean. Eng. 2016, 41, 993–1006. [Google Scholar] [CrossRef]
- Sowter, A.; Amat, M.B.C.; Cigna, F.; Marsh, S.; Athab, A.; Alshammari, L. Mexico City land subsidence in 2014–2015 with Sentinel-1 IW TOPS: Results using the Intermittent SBAS (ISBAS) technique. Int. J. Appl. Earth Obs. Geoinf. 2016, 52, 230–242. [Google Scholar] [CrossRef]
- Nannini, M.; Prats-Iraola, P.; Zan, F.D.; Geudtner, D. TOPS Time Series Performance Assessment with TerraSAR-X Data. IEEE J. Sel. Top. Appl. Earth Obs. Remote Sens. 2016, 9, 3832–3848. [Google Scholar] [CrossRef]
- Hu, B.; Wang, H.; Sun, Y.; Hou, J.; Liang, J. Land-term land subsidence monitoring of Beijing (China) using the Small Baseline Subset (SBAS) technique. Remote Sens. 2014, 6, 3648–3661. [Google Scholar] [CrossRef]
- Hooper, A.; Segall, P.; Zebker, H. Persistent scatterer interferometric synthetic aperture radar for crustal deformation analysis, with application to Volcán Alcedo, Galápagos. J. Geophys. Res. Atmos. 2007, 112, B07407. [Google Scholar] [CrossRef]
- Casu, F.; Manzo, M.; Lanari, R. A quantitative assessment of the SBAS algorithm performance for surface deformation retrieval from DInSAR data. Remote Sens. Environ. 2006, 102, 195–210. [Google Scholar] [CrossRef]
- Goldstein, R.M.; Werner, C.L. Radar interferogram filtering for geophysical applications. Geophys. Res. Lett. 1998, 25, 4035–4038. [Google Scholar] [CrossRef]
- Ferretti, A.; Prati, C.; Rocca, F. Nonlinear subsidence rate estimation using permanent scatterers in differential SAR interferometry. IEEE Trans. Geosci. Remote Sens. 2000, 38, 2202–2212. [Google Scholar] [CrossRef]
- Luo, Q.L.; Perissin, D.; Zhang, Y.; Jia, Y. L- and X-Band Multi-Temporal InSAR Analysis of Tianjin Subsidence. Remote Sens. 2014, 6, 7933–7951. [Google Scholar] [CrossRef]
- Zhang, Y.; Wu, H.; Kang, Y.; Zhu, C. Ground Subsidence in the Beijing-Tianjin-Hebei Region from 1992 to 2014 Revealed by Multiple SAR Stacks. Remote Sens. 2016, 8, 675. [Google Scholar] [CrossRef]
- Wu, C. Study and analysis of settlement in the estate of Houhu, Wuhan. Technol. Innov. Appl. 2014, 22, 216. [Google Scholar]
- Zhong, Y.; Zhang, M.K.; Pan, L.; Zhao, S.K.; Hao, Y.H. Risk Assessment for Urban Karst Collapse in Wuchang District of Wuhan Based on GIS. J. Tianjin Norm. Univ. (Nat. Sci. Ed.) 2015, 35, 48–53. [Google Scholar]
- Xu, G. Mechanism Study and Hazard Assessment of Cover Karst Sinkholes in Wuhan City, China. Ph.D. Thesis, China University of Geosciences, Wuhan, China, 2016. [Google Scholar]
- Luo, X.J. Features of the shallow karst development and control of karst collapse in Wuhan. Carsologica China 2013, 32, 419–432. [Google Scholar]
- Deng, J. The GRA in Cause-Effect Space of Resources. J. Grey Syst. 2009, 21, 113–119. [Google Scholar]
- Deng, J. To Analyze the Connotation and Extension (C & E) of Grey Theory. J. Grey Syst. 2012, 24, 293–298. [Google Scholar]
- Ip, W.C.; Hu, B.Q.; Wong, H.; Xia, J. Applications of grey relational method to river environment quality evaluation in China. J. Hydrol. 2009, 379, 284–290. [Google Scholar] [CrossRef]
- Wei, G.W. Gray Relational Analysis Method For Intuitionistic Fuzzy Multiple Attribute Decision Making. Expert Syst. Appl. 2011, 38, 11671–11677. [Google Scholar] [CrossRef]
- Du, J.C.; Kuo, M.F. Grey relational-regression analysis for hot mix asphalt design. Constr. Build. Mater. 2011, 25, 2627–2634. [Google Scholar] [CrossRef]
- Mu, R.; Zhang, J.T. Research of hierarchy synthetic evaluation based on grey relational analysis. Syst. Eng. Theor. Prac. 2008, 28, 125–130. [Google Scholar]
Figure 1.
Location of study area and Sentinel-1A TOPS SAR data coverage: (a) the study area is outlined by a red rectangle; and (b) a SAR mean intensity image of Sentinel-1A covering the study area.
Figure 1.
Location of study area and Sentinel-1A TOPS SAR data coverage: (a) the study area is outlined by a red rectangle; and (b) a SAR mean intensity image of Sentinel-1A covering the study area.
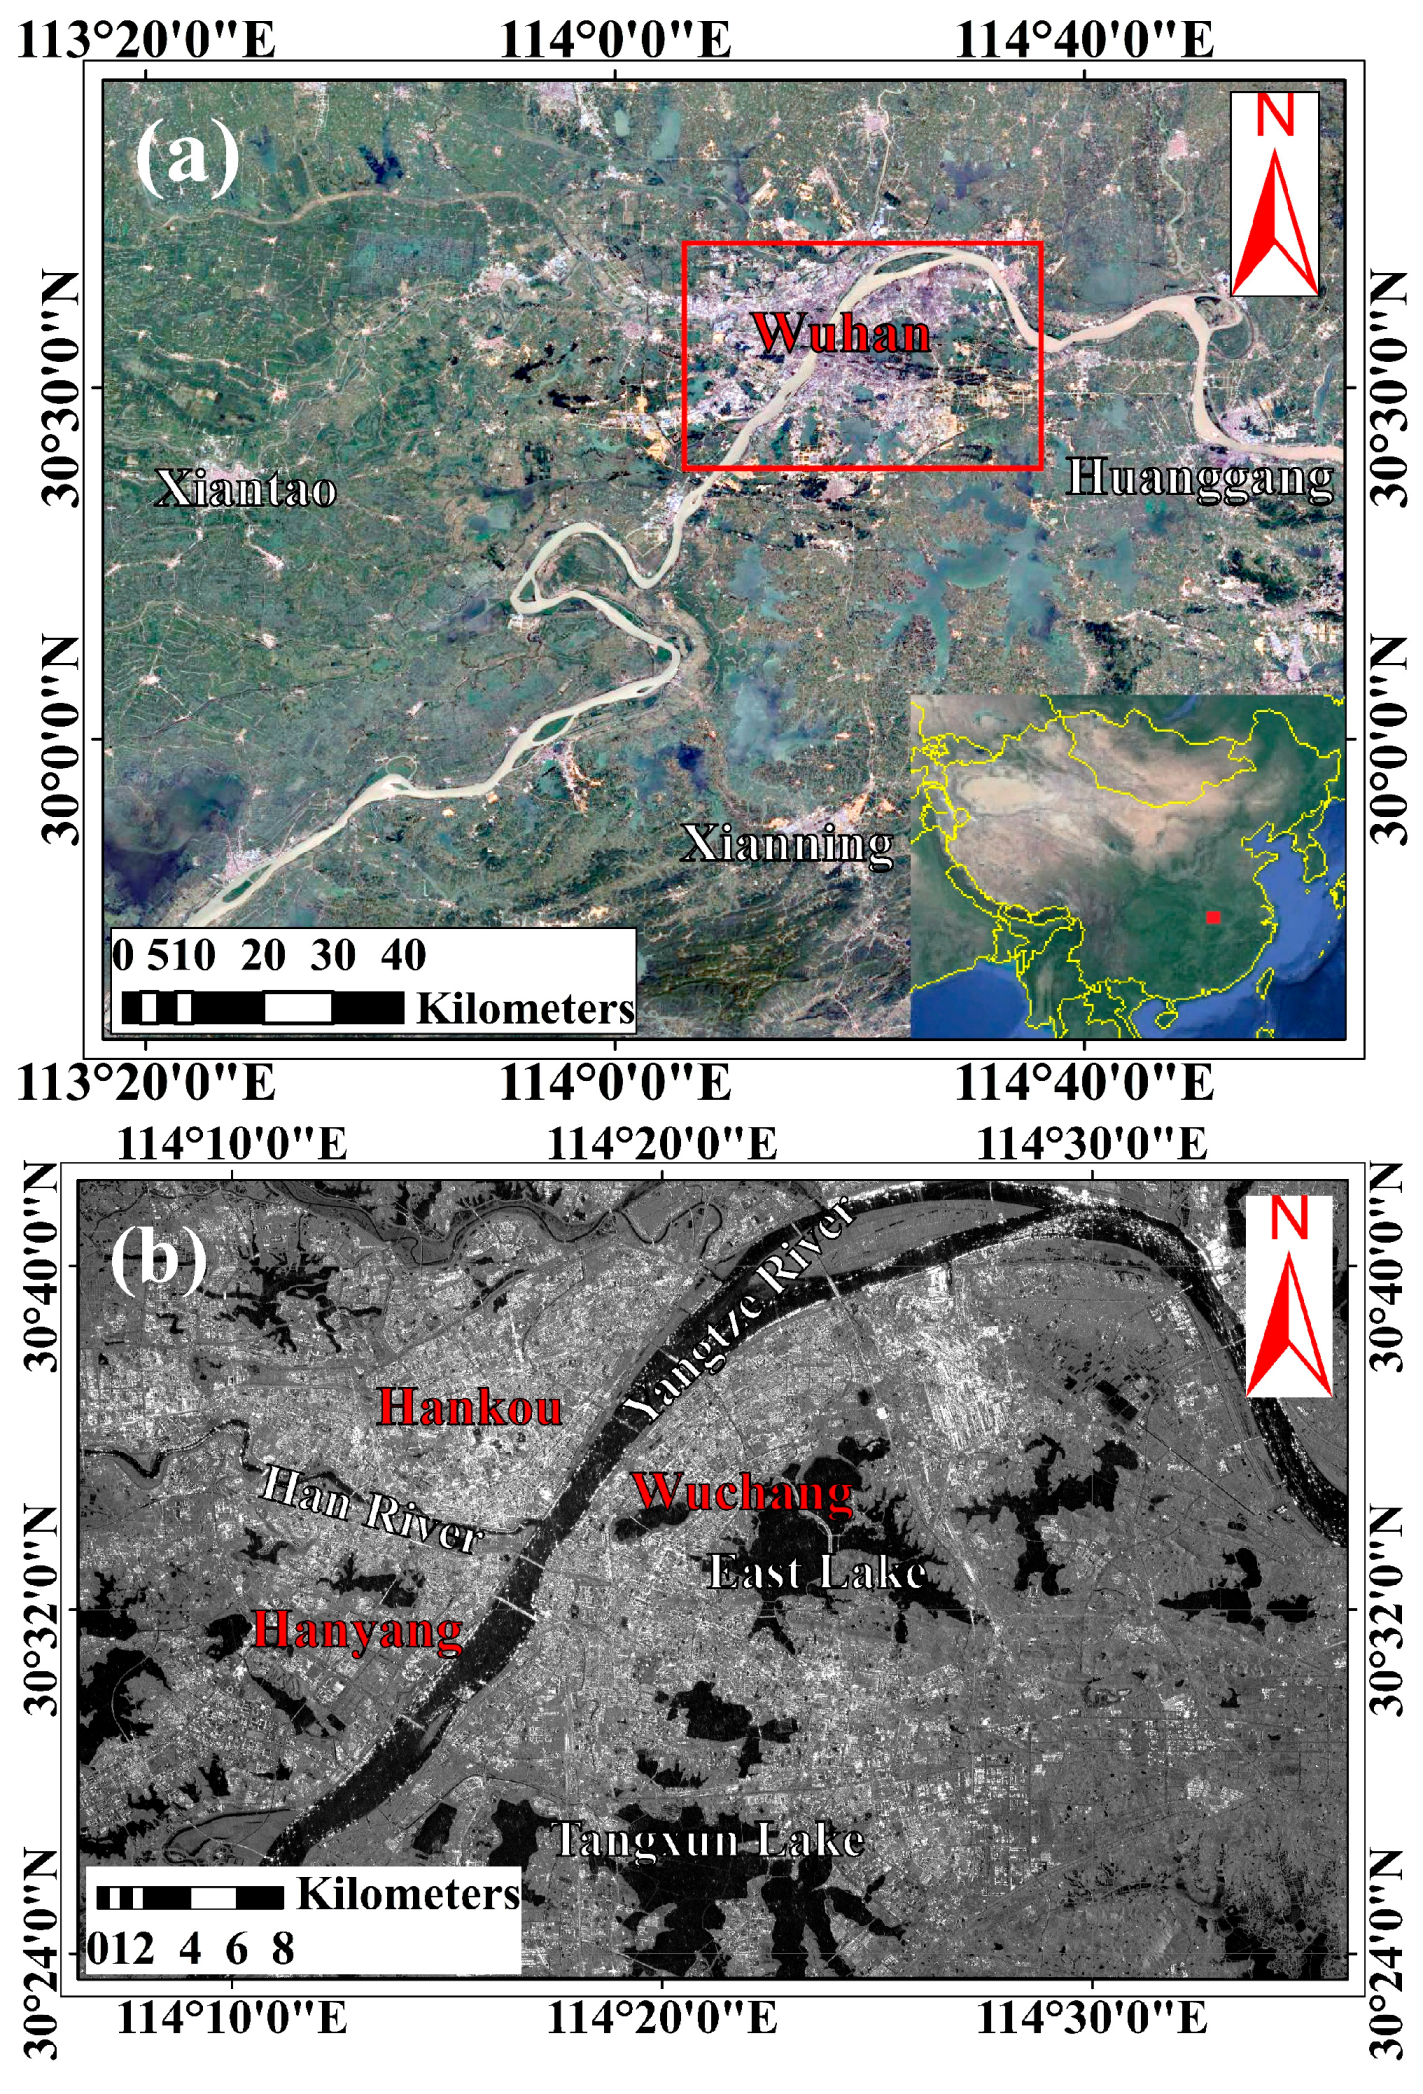
Figure 2.
(a) Time–position of Sentinel-1A image interferometric pairs; and (b) time–baseline of Sentinel-1A image interferometric pairs. The red diamond denotes the super master image. Blue lines represent interferometric pairs. Green diamonds denote slave images.
Figure 2.
(a) Time–position of Sentinel-1A image interferometric pairs; and (b) time–baseline of Sentinel-1A image interferometric pairs. The red diamond denotes the super master image. Blue lines represent interferometric pairs. Green diamonds denote slave images.

Figure 3.
Vertical deformation rates derived by SBAS InSAR for the whole study area during the period from 11 April 2015 to 29 April 2016. The background is a Google Earth image acquired in 2016. Red triangle and blue square denote locations of reference point and Hankou hydrological station, respectively. Regions S1–S4 marked with black rectangles are major subsidence areas in Wuhan. These areas will be further analyzed in the discussion section. HK, HH, WC, QS, YL, HY, and QL are the abbreviations of Hankou, Houhu, Wuchang, Qingshan, Yangluo, Hanyang, and Qingling, respectively.

Figure 4.
Cumulative subsidence (in the vertical direction) time series from 2015 to 2016. The image acquired on 11 April 2015 was not shown because it was selected as a reference image. The background is Sentinel-1A TOPS mean intensity image of Wuhan. (a–n) Cumulative subsidence in 14 stages in Wuhan. (a) 11 April 2015–5 May 2015; (b) 11 April 2015–29 May 2015; (c) 11 April 2015–16 July 2015; (d) 11 April 2015–9 August 2015; (e) 11 April 2015–2 September 2015; (f) 11 April 2015–26 September 2015; (g) 11 April 2015–20 October 2015; (h) 11 April 2015–13 November 2015; (i) 11 April 2015–7 December 2015; (j) 11 April 2015–31 December 2015; (k) 11 April 2015–24 January 2016; (l) 11 April 2015–17 February 2016; (m) 11 April 2015–5 April 2016; (n) 11 April 2015–29 April 2016. HH region in HK is marked by black rectangle in (n).
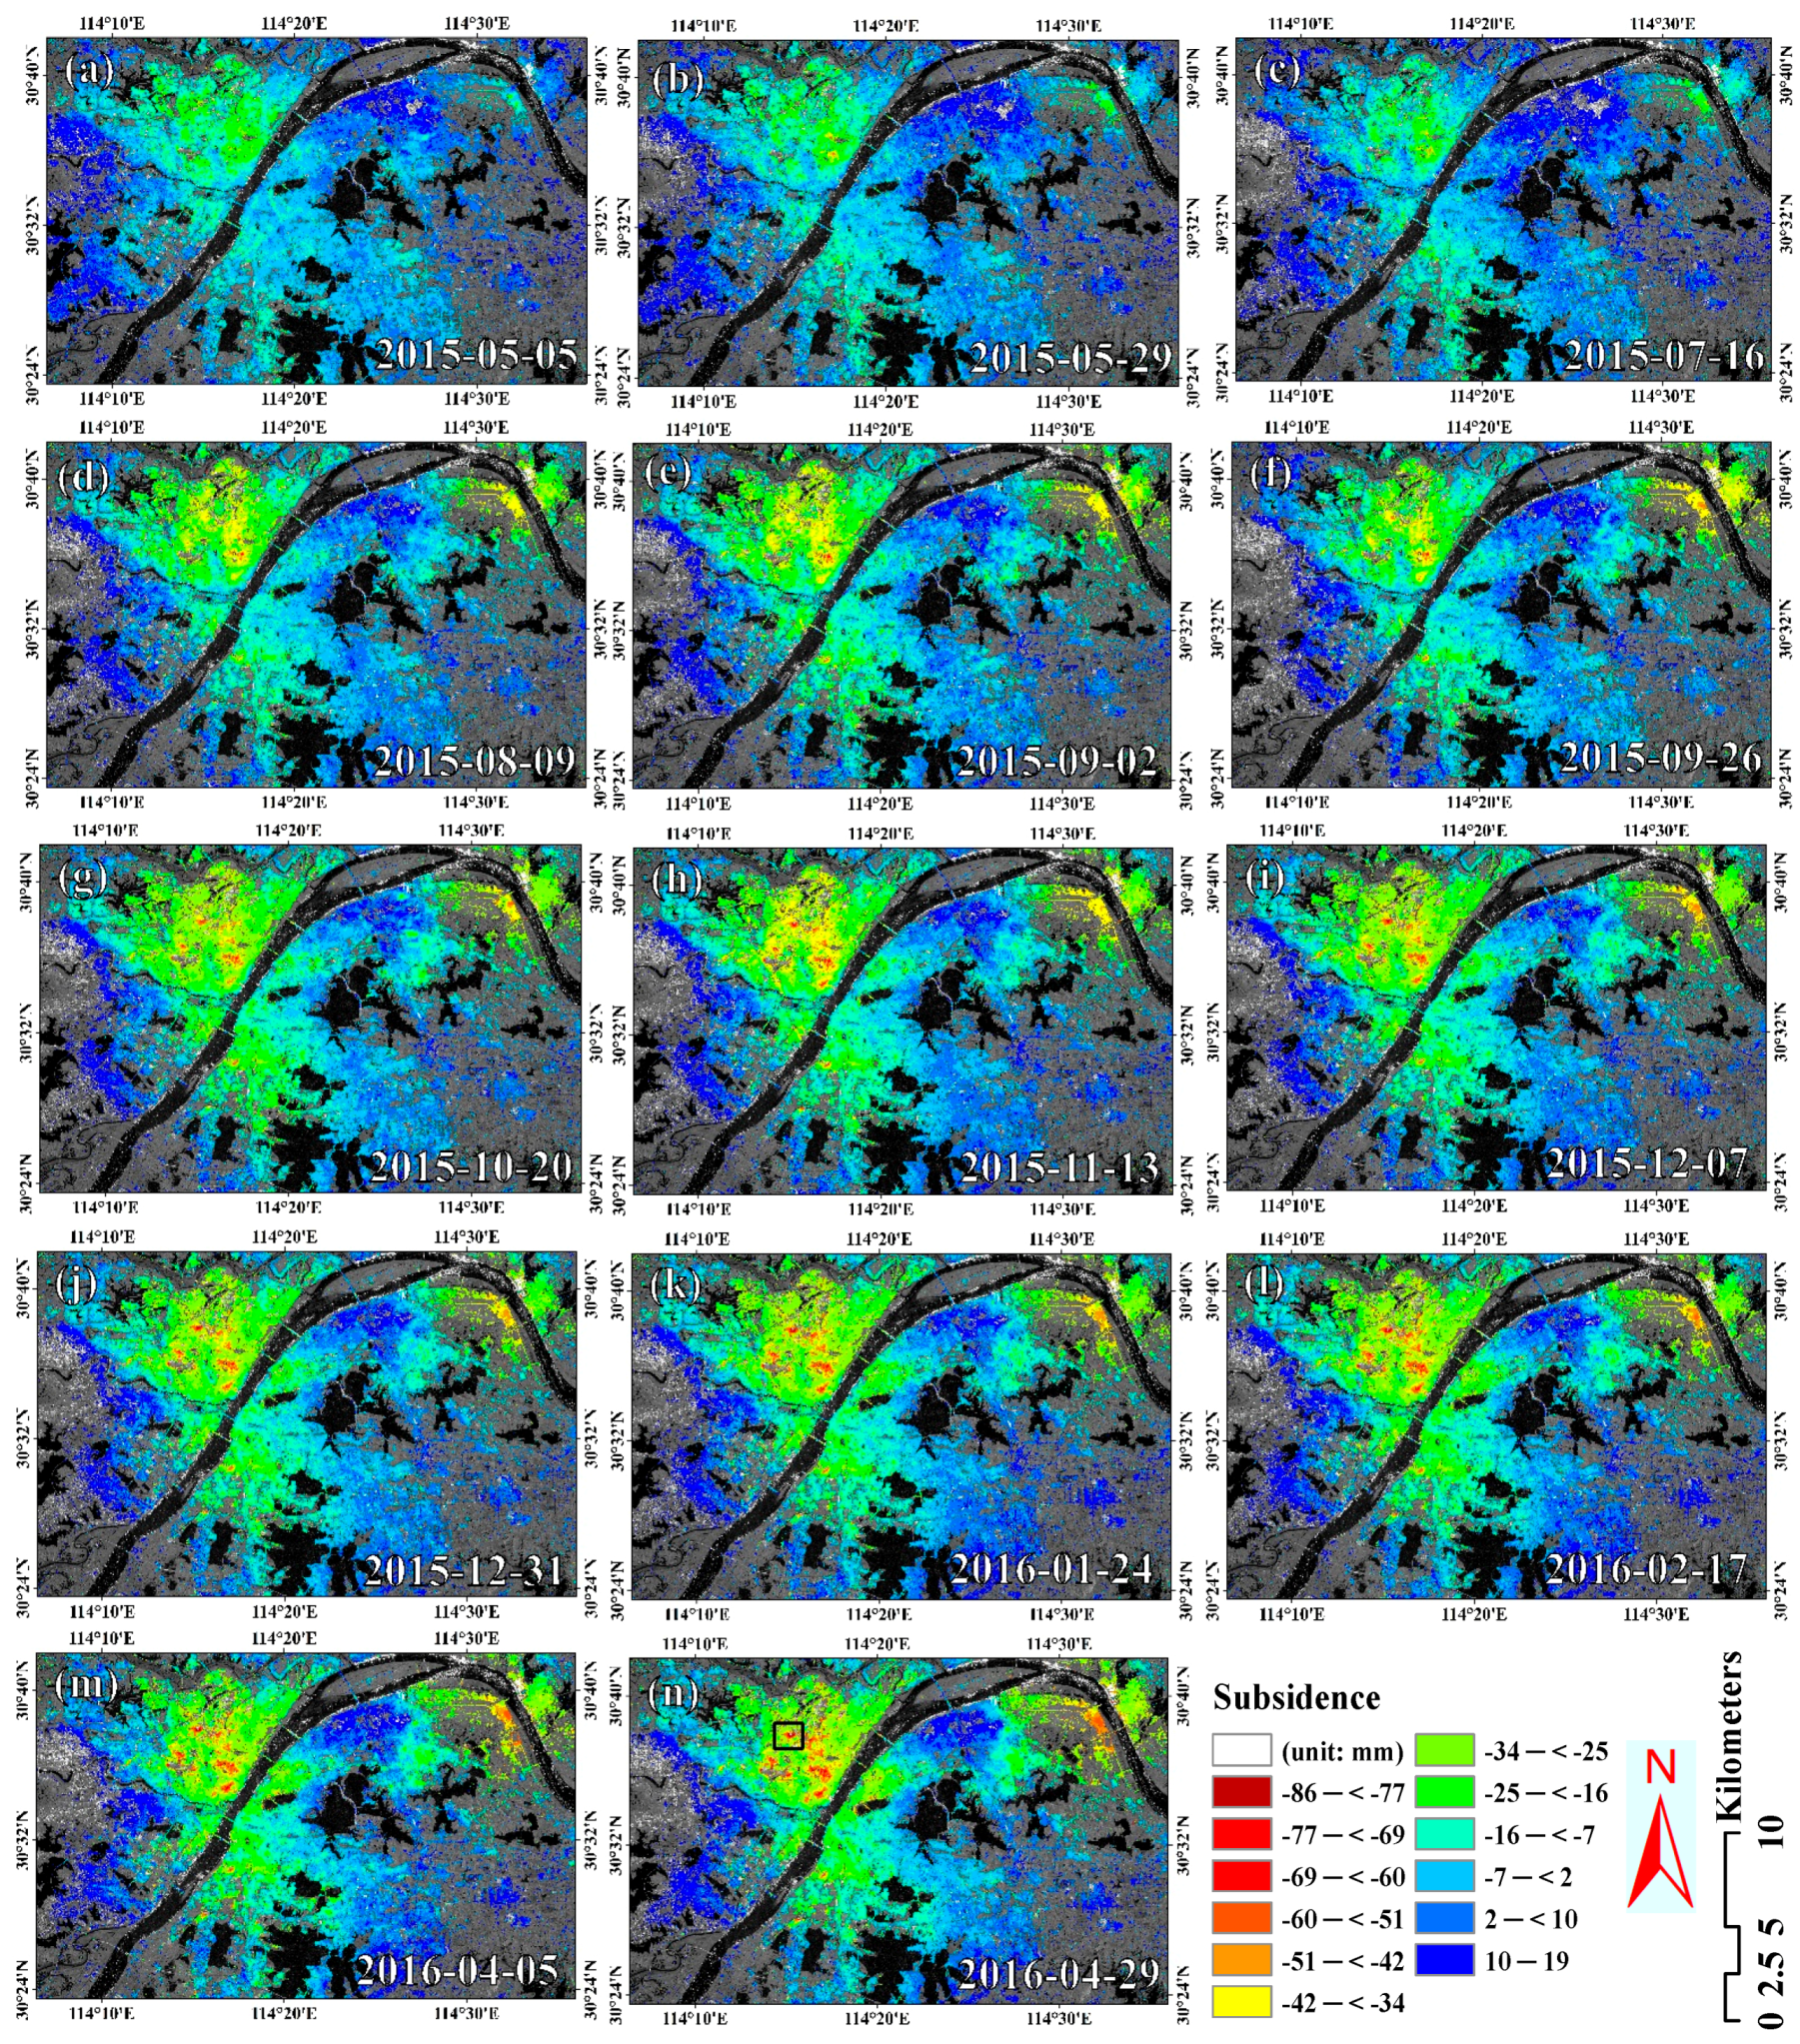
Figure 5.
Distributions of standard deviations of subsidence rates.
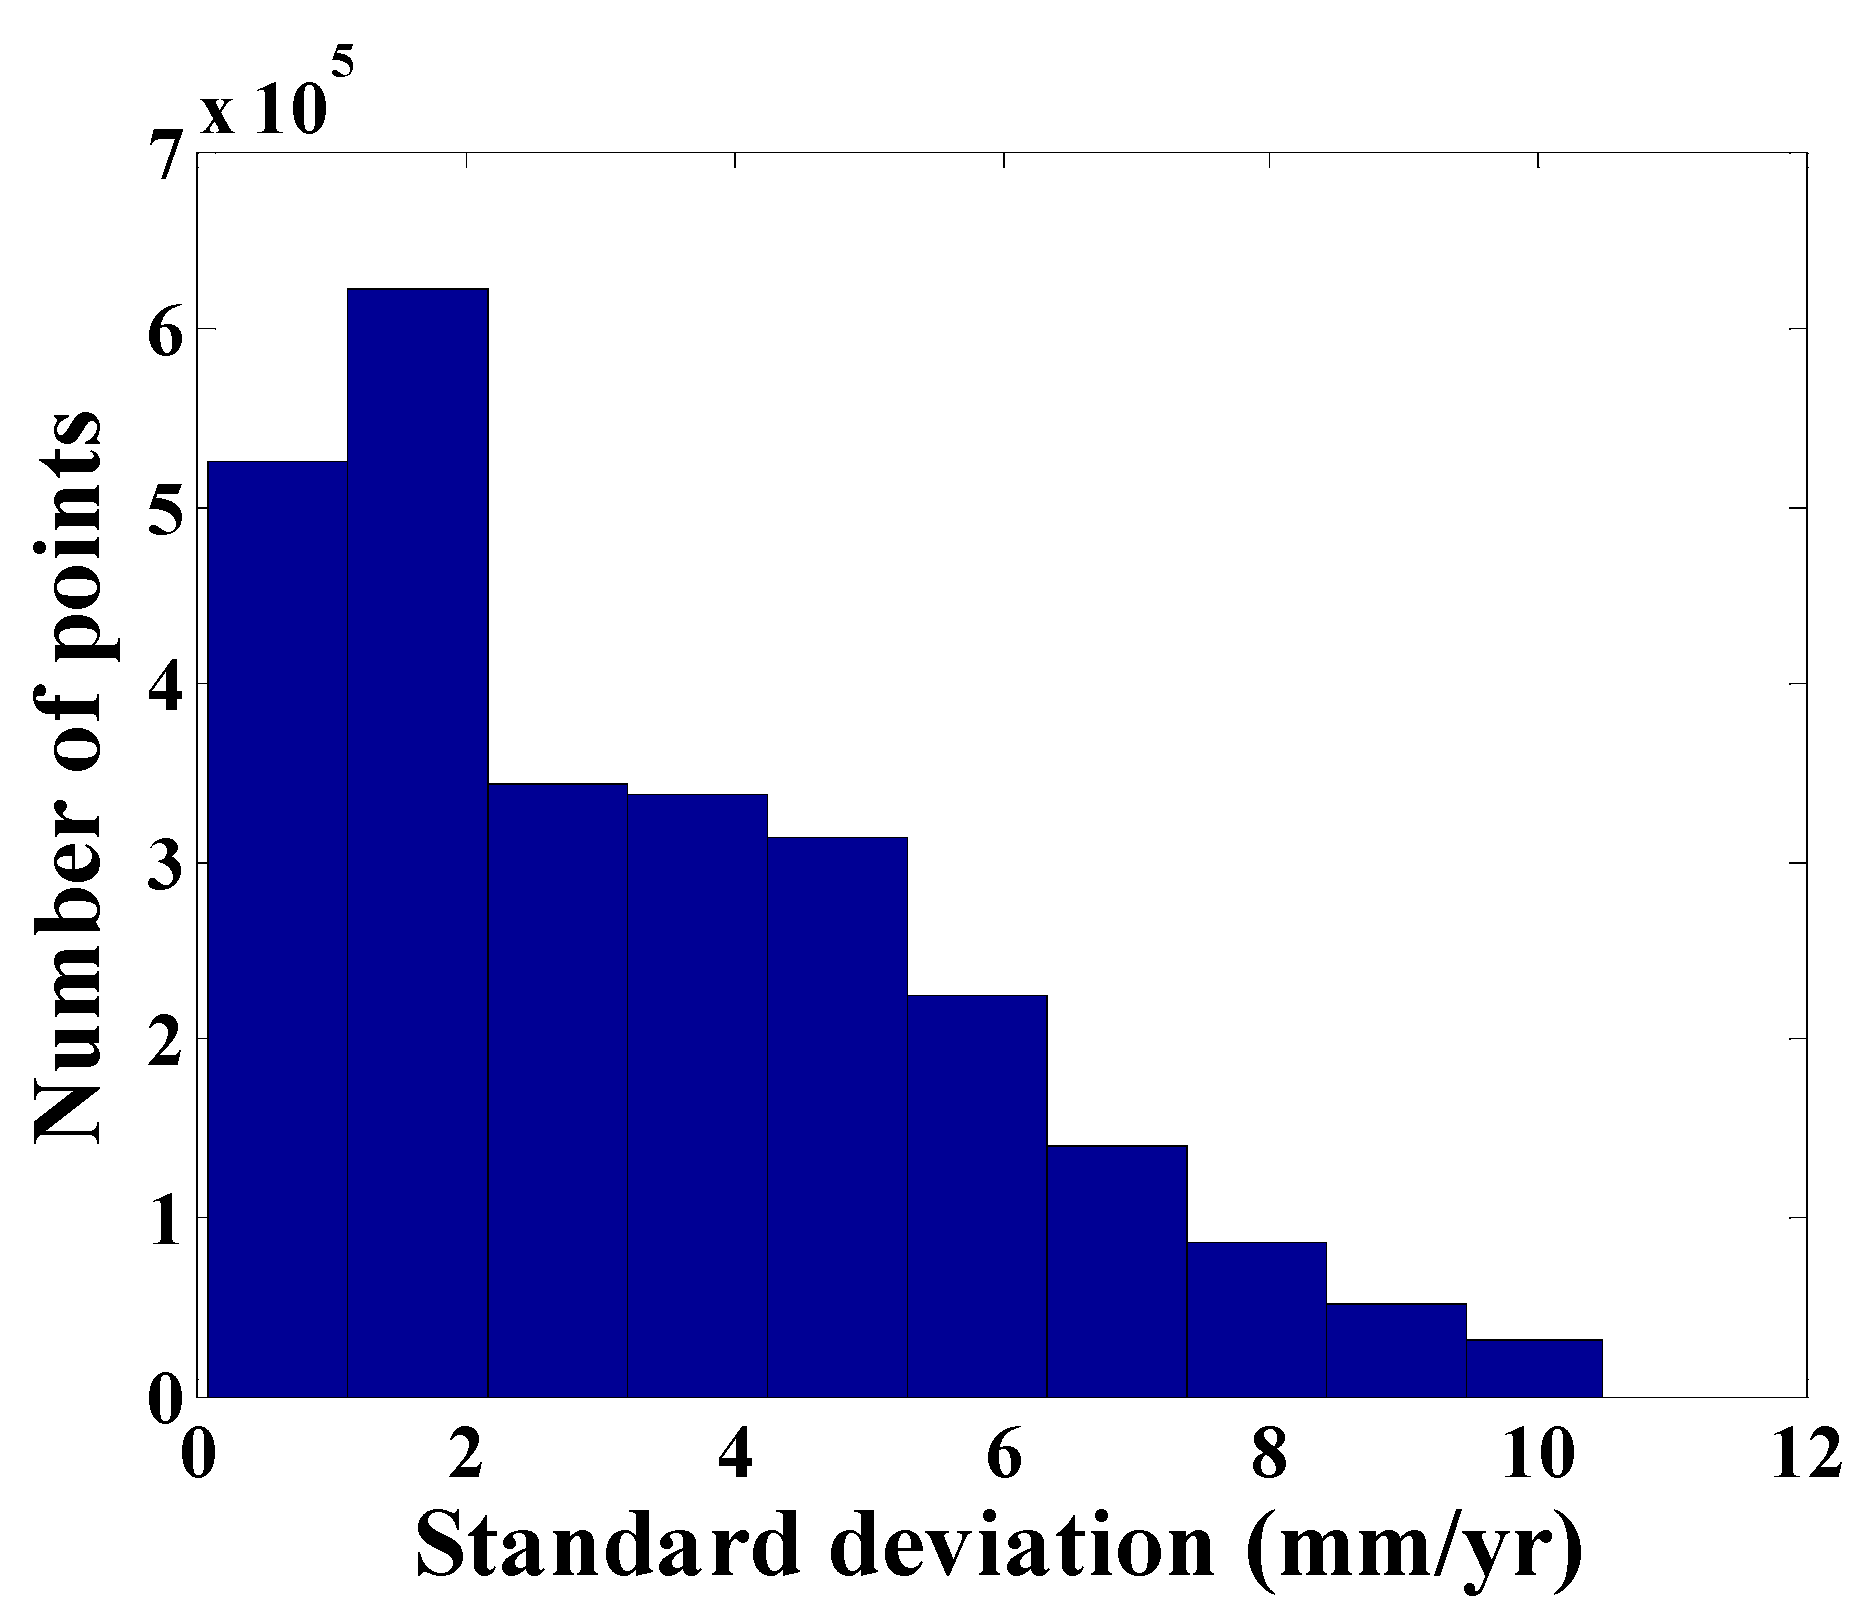
Figure 6.
Distribution of benchmarks for surface subsidence monitoring over Wuhan. The red circle and triangle denote leveling point and reference point, respectively.
Figure 6.
Distribution of benchmarks for surface subsidence monitoring over Wuhan. The red circle and triangle denote leveling point and reference point, respectively.
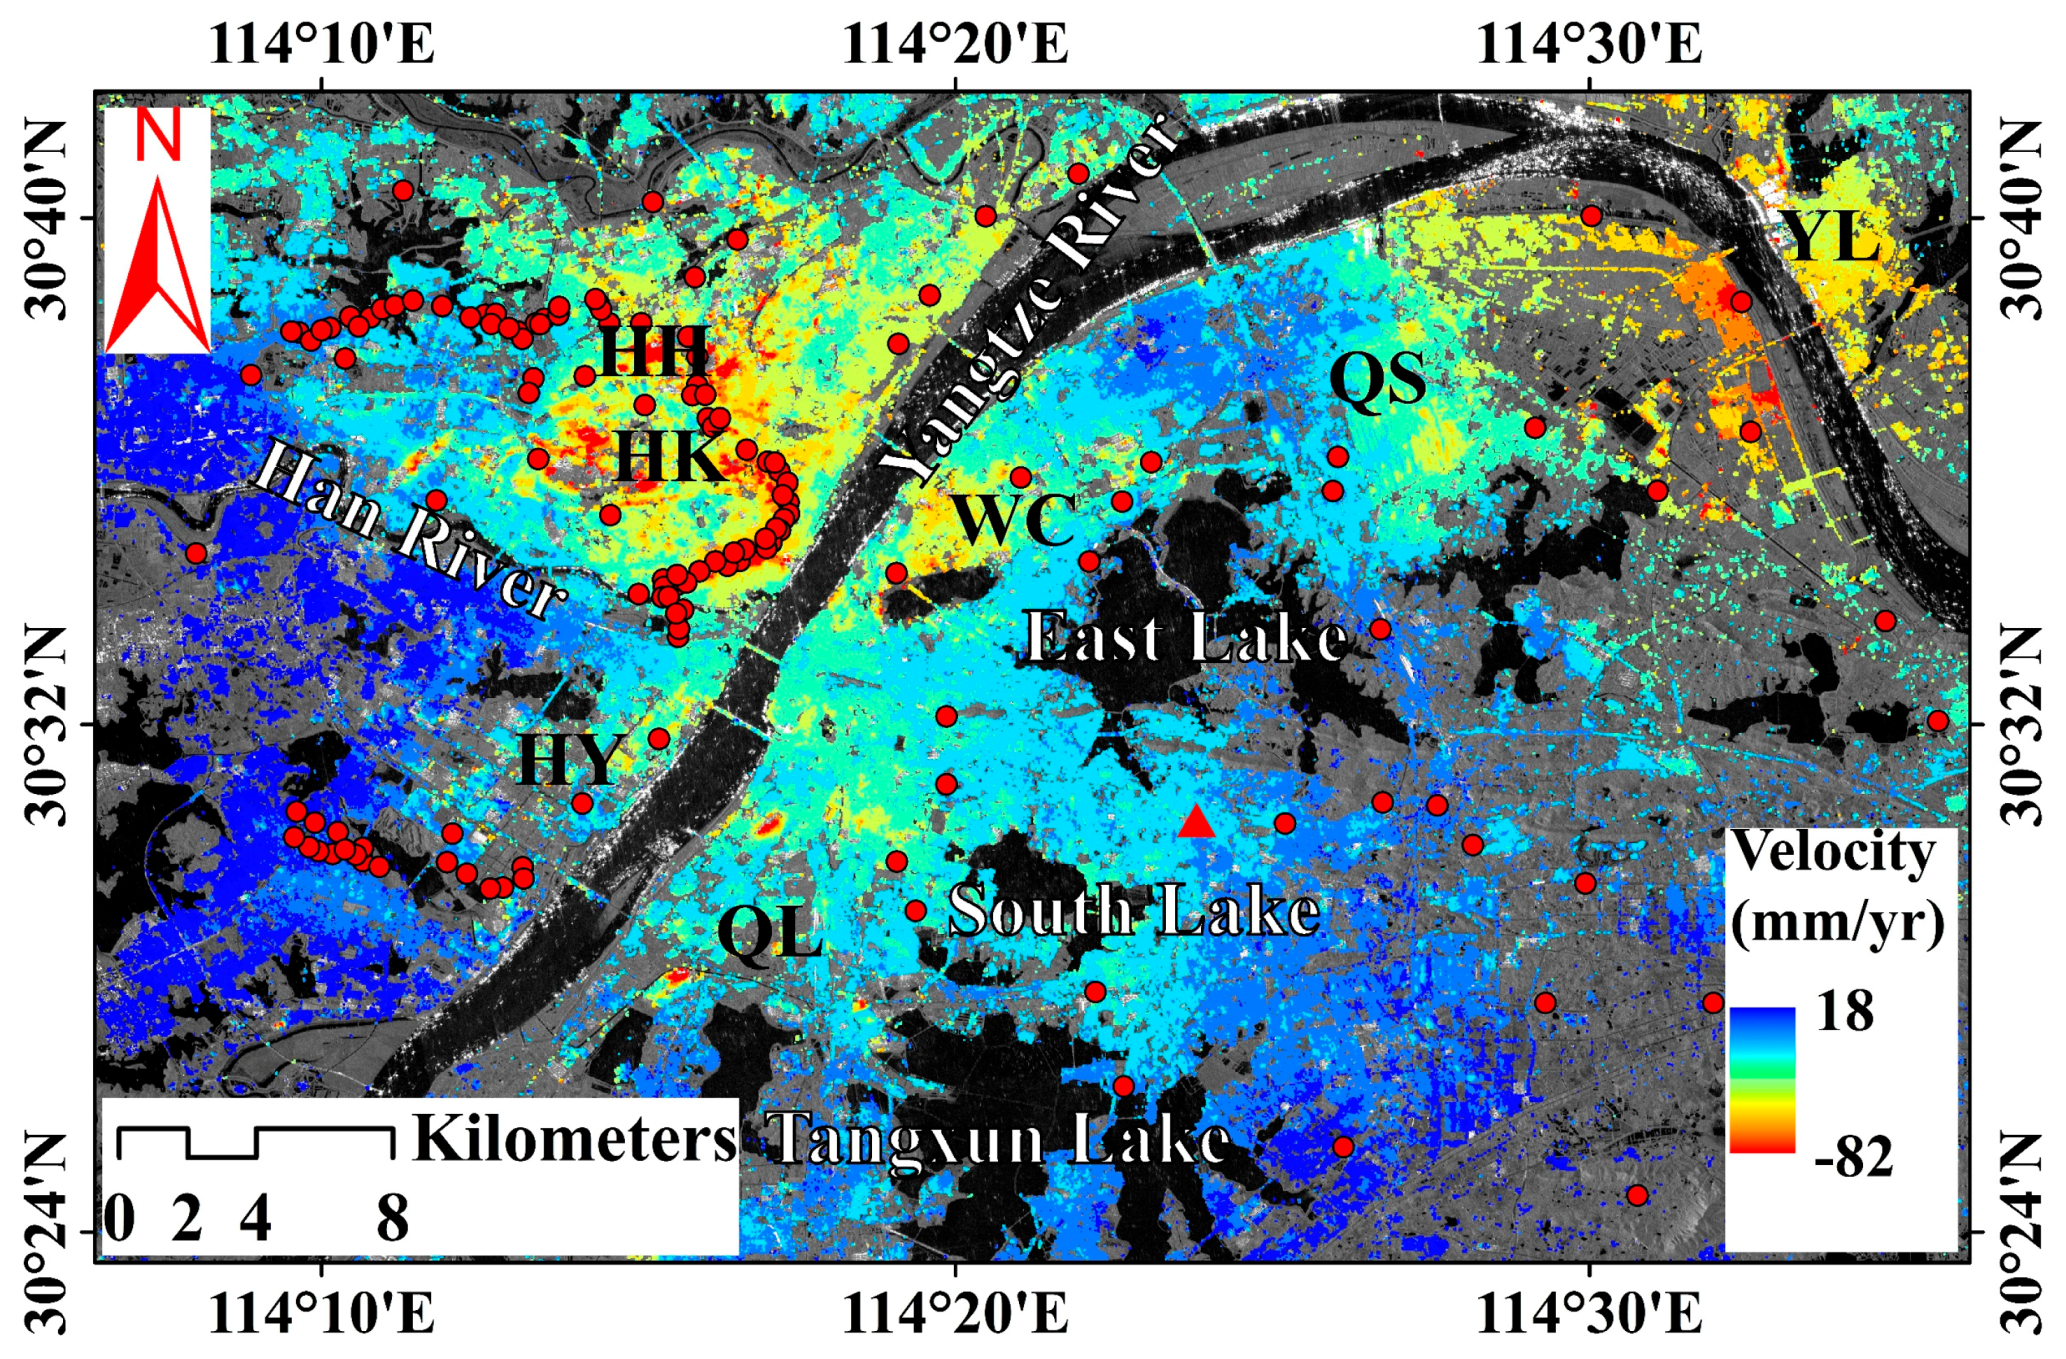
Figure 7.
(a) Regression analysis between surface vertical deformation rates derived by SBAS InSAR and leveling; and (b) differences between SBAS InSAR- and leveling-derived results.
Figure 7.
(a) Regression analysis between surface vertical deformation rates derived by SBAS InSAR and leveling; and (b) differences between SBAS InSAR- and leveling-derived results.

Figure 8.
Surface vertical deformation rate map derived by SBAS InSAR superimposed on Google Earth image covering (a) Region S1. Black lines denote Wuhan Metro Lines, including metro lines in operation and under construction. Red circles represent leveling points distributed along Metro Line 6, which is under construction. Black and red triangles denote Wuhan Center and Wuhan World Trade Center, respectively. (b) Surface subsidence (in the vertical direction) time series with respect to PS points (marked by black crosses in Figure 8a) labeled as A, B, C, and D in Figure 8a versus average monthly precipitation of Wuhan area. (c–e) Structural damage caused by surface subsidence.

Figure 9.
Surface vertical deformation rate map derived by SBAS InSAR superimposed on Google Earth image covering Region S3. Black lines denote the Wuhan Metro Lines, including the metro lines in operation and under construction. Red ellipses represent the two subsidence areas, i.e., XD and HBU subsidence bowls.

Figure 10.
Surface vertical deformation rate map superimposed on Google Earth image covering (a) Region S2. Red, white, blue and black polygons denote the industrial areas of WISC, SWC, YCP, and HYPP, respectively. Black lines represent subsidence profiles that will be further analyzed in the Section 5.3. (b,c) Structural damage due to surface subsidence.
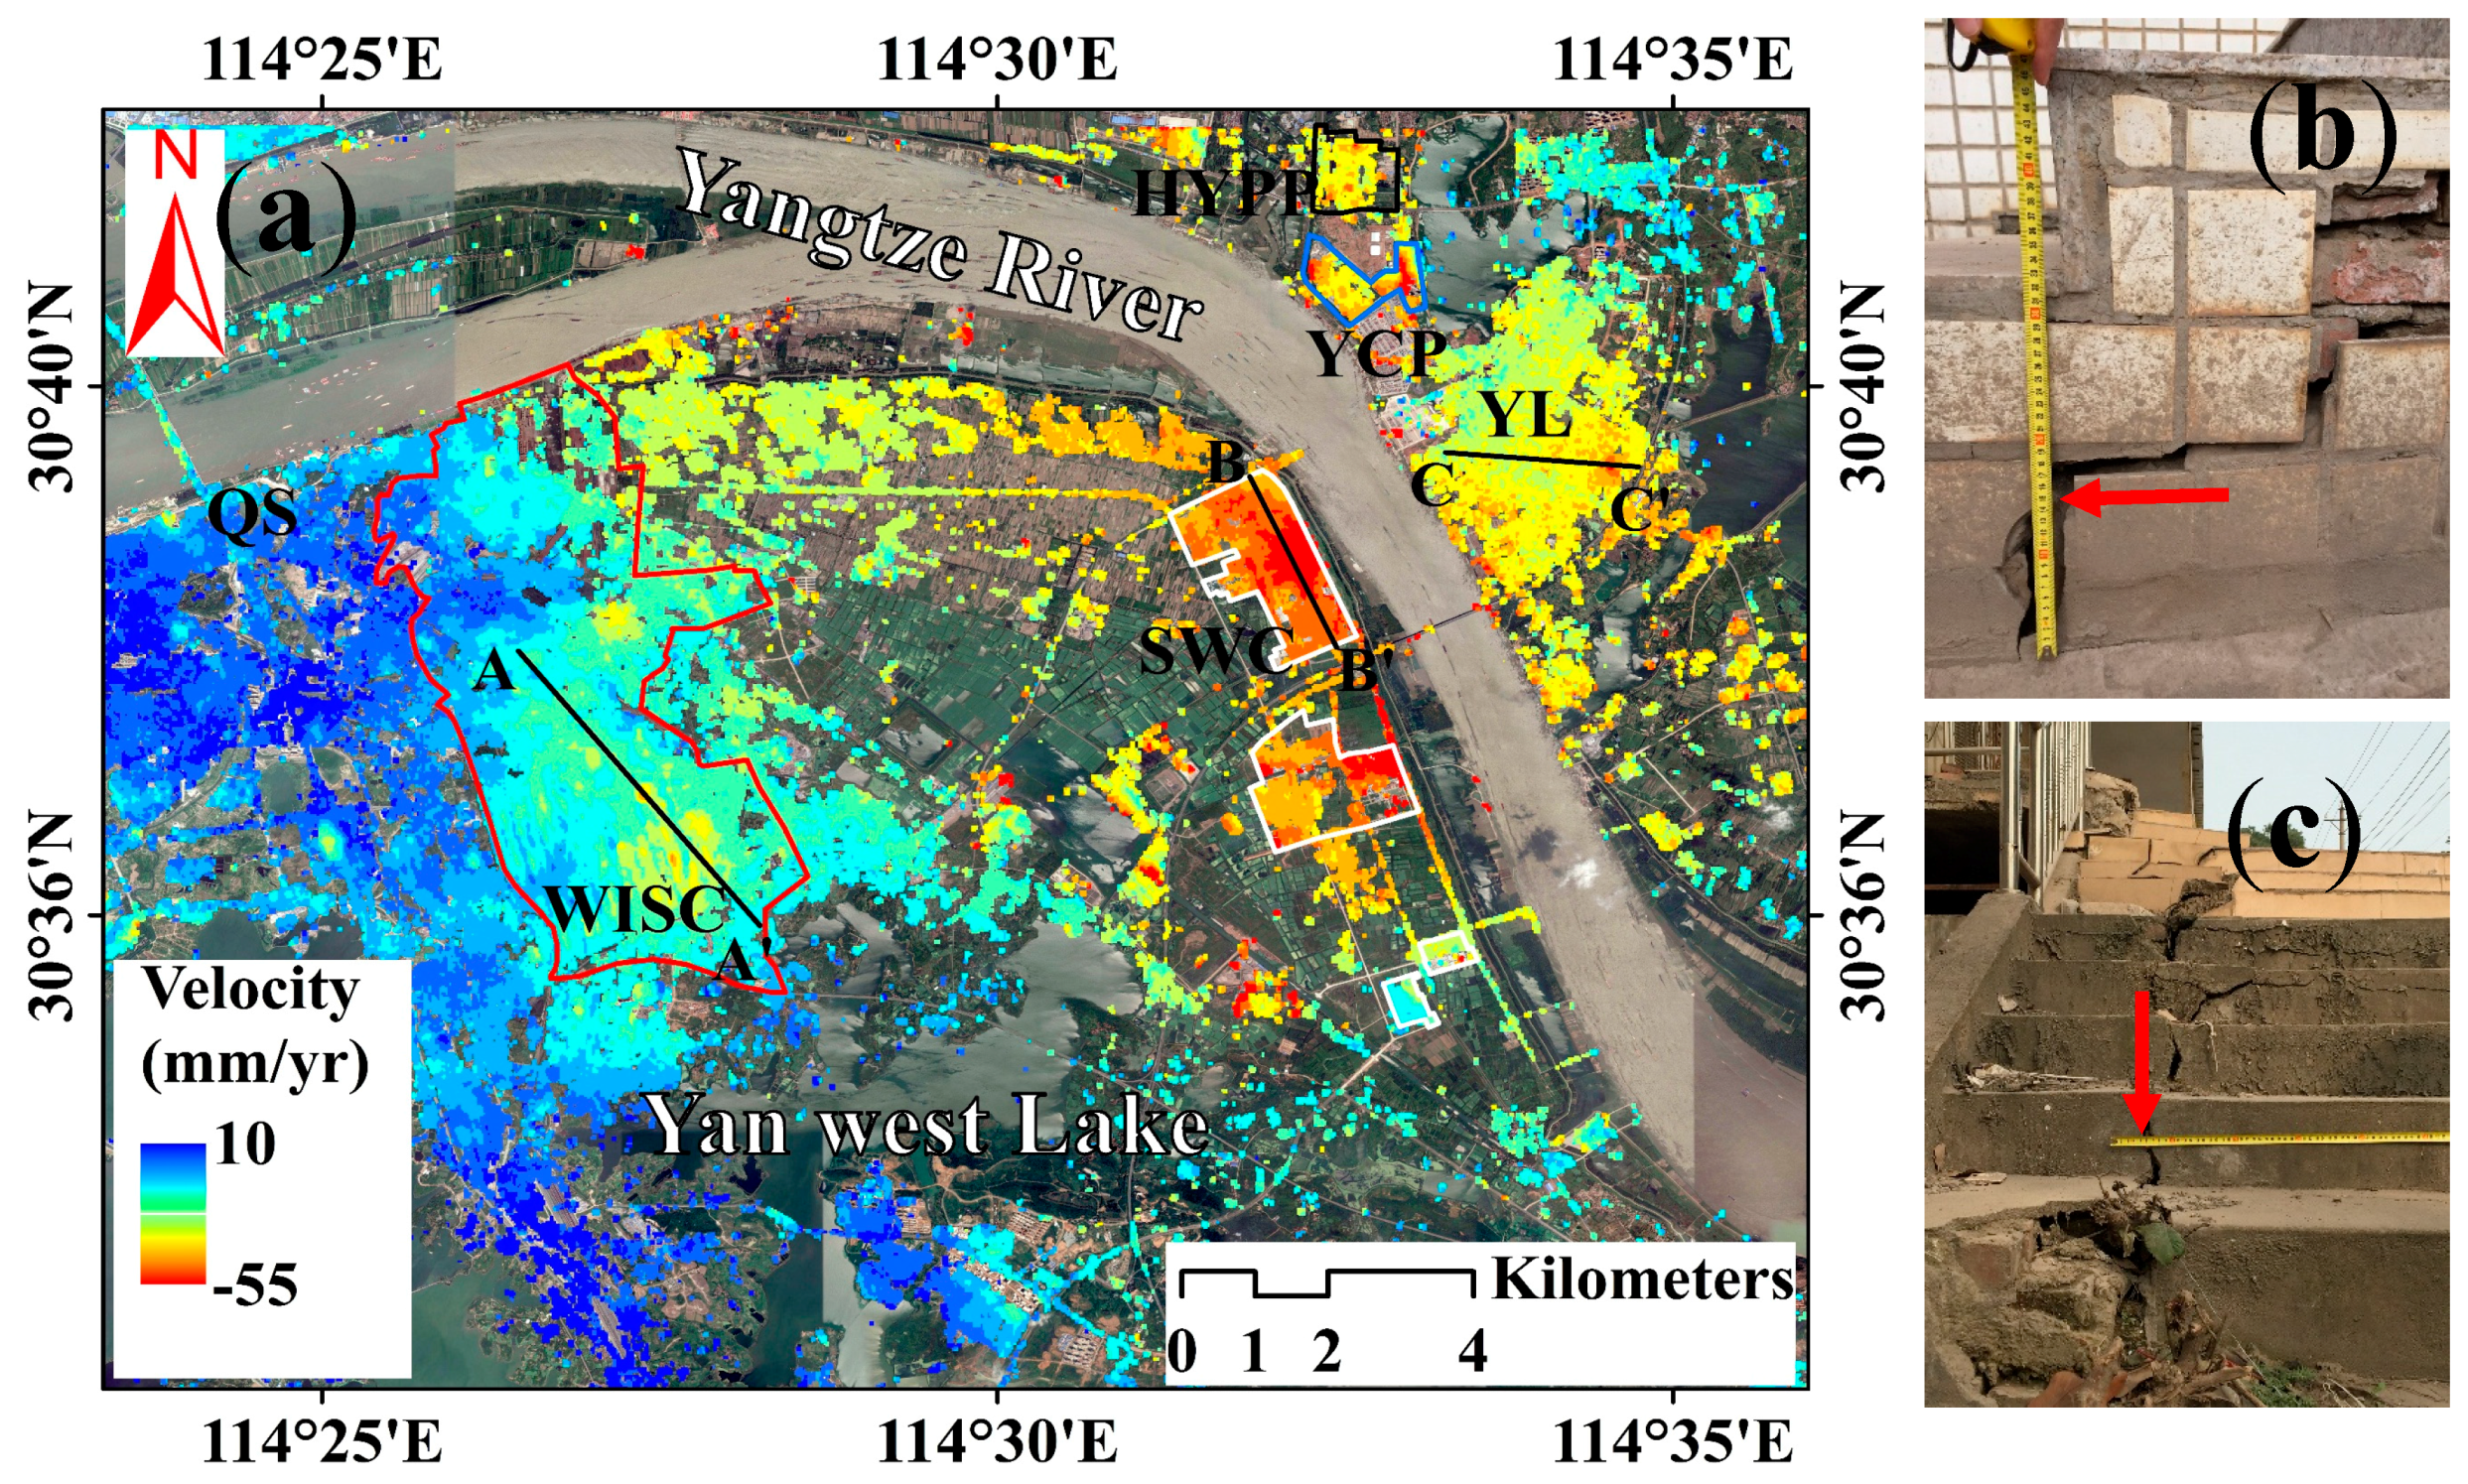
Figure 11.
(a–c) Variation in accumulated subsidence (in the vertical direction) during the period from 11 April 2015 to 29 April 2016 along profiles A-A′, B-B′, and C-C′ (in Figure 10). Black dotted lines mark locations of the largest accumulated subsidence of profiles.
Figure 11.
(a–c) Variation in accumulated subsidence (in the vertical direction) during the period from 11 April 2015 to 29 April 2016 along profiles A-A′, B-B′, and C-C′ (in Figure 10). Black dotted lines mark locations of the largest accumulated subsidence of profiles.

Figure 12.
Surface vertical deformation rates map derived by SBAS InSAR superimposed on Google Earth image covering Region S4. Black lines denote the Wuhan Metro Lines, including metro lines in operation and under construction. The area enclosed by red line represents the Baishazhou Carbonate Rock belt. The red square denotes karst surface collapse. Areas 1, 2, 3, 4, and 5 marked with black rectangles are significant subsidence areas in Region S4.

Figure 13.
Surface vertical deformation rate map superimposed on Google Earth image covering both sides of the Yangtze River. The black square and five-pointed star denote the Hankou hydrological station and PS point, respectively. JH and XD are the abbreviations of Jianghan and Xudong, respectively.
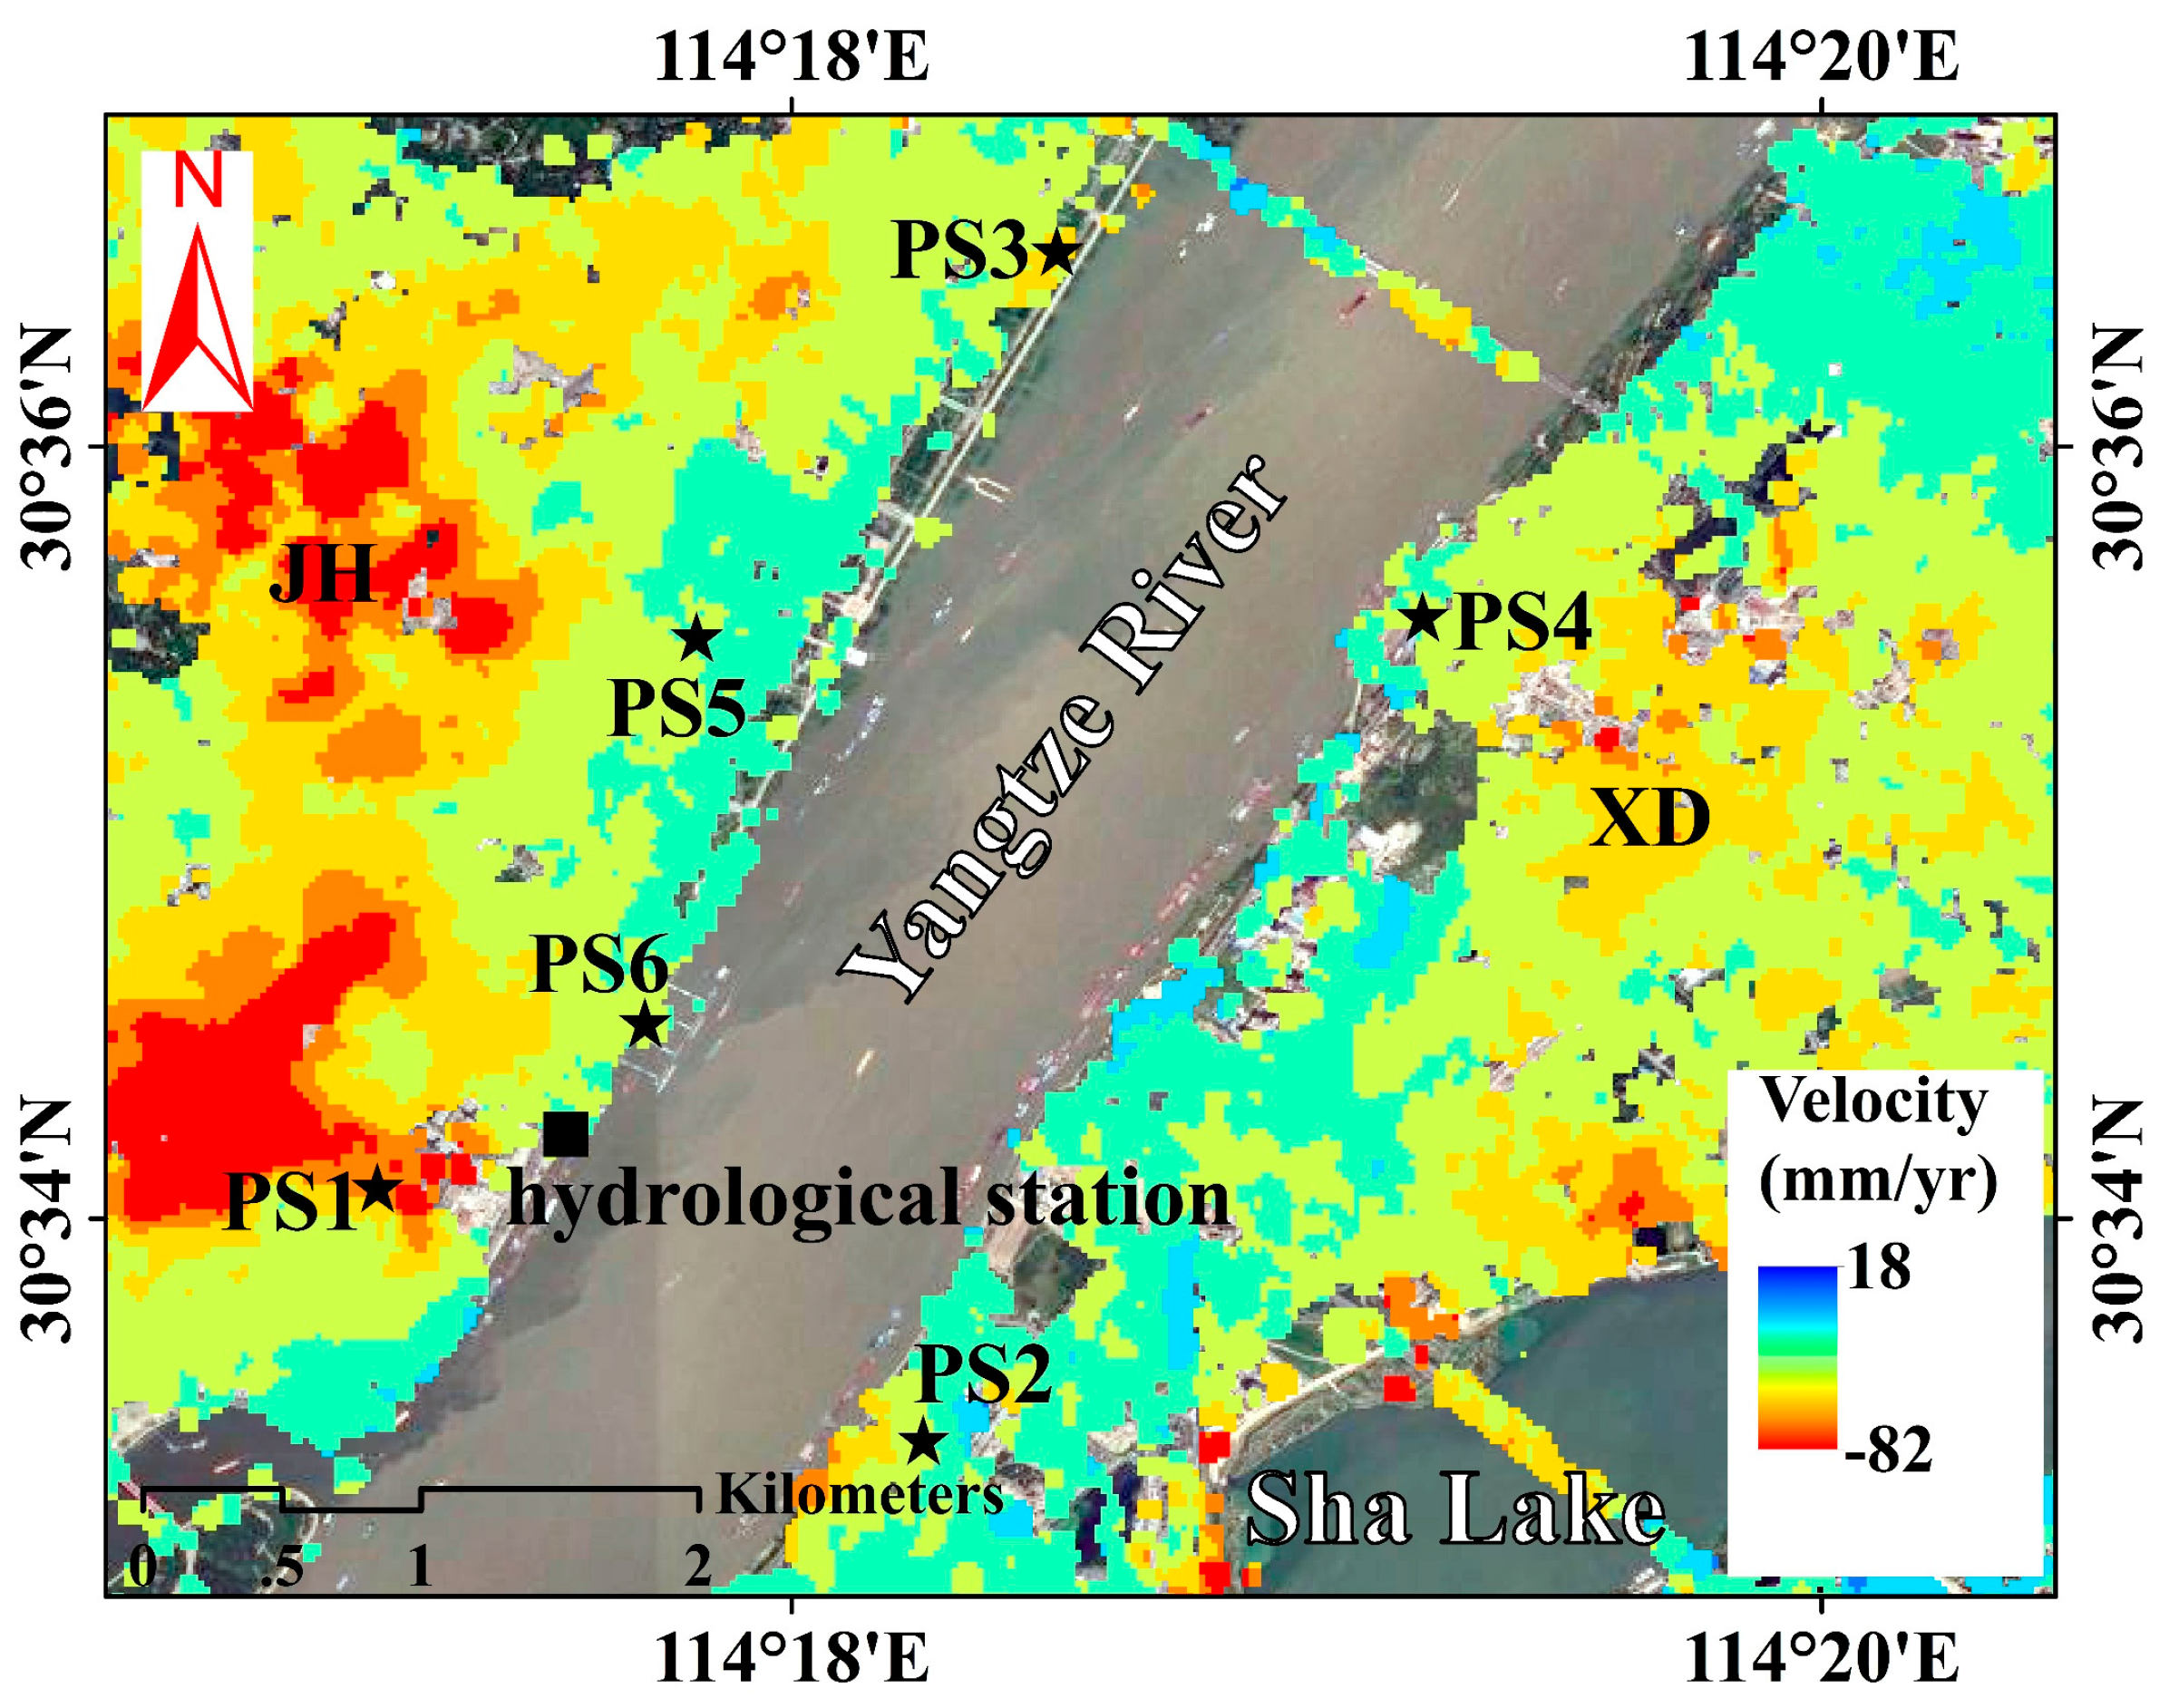
Figure 14.
(a) Surface vertical deformation time series with respect to PS points labeled as PS1–PS6 in Figure 13 versus water level (WL) changes (red-dotted line) in Yangtze River; (b) Detrended surface vertical deformation time series relevant to the above PS points versus detrended water level changes (red dotted line) in Yangtze River.

Table 1.
Specific parameters of Sentinel-1A TOPS data.
| Parameters | Description |
|---|---|
| Product type | Sentinel1 SLC IW |
| Track number | 113 |
| Central incidence angle on the test site (degree) | 41.9 |
| Azimuth angle (degree) | 90 |
| Slant range resolution (m) | 2.3 |
| Azimuth resolution (m) | 13.9 |
| Orbit direction | Ascending |
| Polarization | VV |
Table 2.
Comparison of average subsidence rates between SBAS InSAR- and leveling-derived results. Mean error is the mean of the differences between SBAS InSAR- and leveling-derived rates. RMSE represents the standard deviation of the differences between SBAS InSAR- and leveling-derived rates (unit: mm/year).
| Method | Mean Error | RMSE | MAX Error | MIN Error |
|---|---|---|---|---|
| Kriging | −1 | 6 | 11 | −13 |
Table 3.
The GRG between the subsidence and water level of Yangtze River before and after the linear trend is removed and the standard deviations of displacement with respect to the six PS points.
Table 3.
The GRG between the subsidence and water level of Yangtze River before and after the linear trend is removed and the standard deviations of displacement with respect to the six PS points.
| PS Points | GRG | Standard Deviation | |
|---|---|---|---|
| Time Series | Detrended Time Series | Displacement (mm) | |
| PS1 | 0.82 | 0.92 | 1.2 |
| PS2 | 0.91 | 0.97 | 0.7 |
| PS3 | 0.87 | 0.96 | 0.7 |
| PS4 | 0.88 | 0.94 | 1.1 |
| PS5 | 0.92 | 0.96 | 1.1 |
| PS6 | 0.88 | 0.96 | 1.4 |
© 2017 by the authors. Licensee MDPI, Basel, Switzerland. This article is an open access article distributed under the terms and conditions of the Creative Commons Attribution (CC BY) license (http://creativecommons.org/licenses/by/4.0/).
Share and Cite
MDPI and ACS Style
Zhou, L.; Guo, J.; Hu, J.; Li, J.; Xu, Y.; Pan, Y.; Shi, M. Wuhan Surface Subsidence Analysis in 2015–2016 Based on Sentinel-1A Data by SBAS-InSAR. Remote Sens. 2017, 9, 982. https://doi.org/10.3390/rs9100982
AMA Style
Zhou L, Guo J, Hu J, Li J, Xu Y, Pan Y, Shi M. Wuhan Surface Subsidence Analysis in 2015–2016 Based on Sentinel-1A Data by SBAS-InSAR. Remote Sensing. 2017; 9(10):982. https://doi.org/10.3390/rs9100982
Chicago/Turabian StyleZhou, Lv, Jiming Guo, Jiyuan Hu, Jiangwei Li, Yongfeng Xu, Yuanjin Pan, and Miao Shi. 2017. "Wuhan Surface Subsidence Analysis in 2015–2016 Based on Sentinel-1A Data by SBAS-InSAR" Remote Sensing 9, no. 10: 982. https://doi.org/10.3390/rs9100982
Note that from the first issue of 2016, this journal uses article numbers instead of page numbers. See further details here.