Fractional Snow Cover Mapping from FY-2 VISSR Imagery of China
by
 , , , ,
Gongxue Wang
1 ,
,
Lingmei Jiang
1,*,
Shengli Wu
2,
Jiancheng Shi
3,
Shirui Hao
1 and
Xiaojing Liu
1 1
State Key Laboratory of Remote Sensing Science, Institute of Remote Sensing Science and Engineering, Faculty of Geographical Science, Beijing Normal University, Beijing 100875, China
2
National Satellite Meteorological Center, China Meteorological Administration, Beijing 100081, China
3
State Key Laboratory of Remote Sensing Science, Institute of Remote Sensing and Digital Earth, Chinese Academy of Sciences, Beijing 100101, China
*
Author to whom correspondence should be addressed.
Remote Sens. 2017, 9(10), 983; https://doi.org/10.3390/rs9100983
Submission received: 3 August 2017
/
Revised: 18 September 2017
/
Accepted: 19 September 2017
/
Published: 22 September 2017
(This article belongs to the Special Issue Snow Remote Sensing)
Abstract
:Daily fractional snow cover (FSC) products derived from optical sensors onboard low Earth orbit (LEO) satellites are often discontinuous, primarily due to prevalent cloud cover. To map the daily cloud-reduced FSC over China, we utilized clear-sky multichannel observations from the first-generation Chinese geostationary orbit (GEO) satellites (namely, the FY-2 series) by taking advantage of their high temporal resolution. The method proposed in this study combines a newly developed binary snow cover detection algorithm designed for the Visible and Infrared Spin Scan Radiometer (VISSR) onboard FY-2F with a simple linear spectral mixture technique applied to the visible (VIS) band. This method relies upon full snow cover and snow-free end-members to estimate the daily FSC. The FY-2E/F VISSR FSC maps of China were compared with the Moderate Resolution Imaging Spectroradiometer (MODIS) FSC data based on the multiple end-member spectral mixture analysis (MESMA), and with Landsat-8 Operational Land Imager (OLI) FSC maps based on the SNOWMAP approach. The FY-2E/F VISSR FSC maps, which demonstrate a lower cloud coverage, exhibit the root mean squared errors (RMSEs) of 0.20/0.19 compared with the MODIS FSC data. When validated against the Landsat-8 OLI FSC data, the FY-2E/F VISSR FSC maps, which display overall accuracies that can reach 0.92, have an RMSE of 0.18~0.29 with R2 values ranging from 0.46 to 0.80.
1. Introduction
The extent and variability of snow cover highly influences Earth’s water cycle, surface energy balance, climate, and weather. The accumulation and depletion of seasonal snow cover, which possesses a substantial capacity for water storage, has profound effects on hydrological processes [1,2]. Since snow can blanket an average annual maximum area of 47.4 million km2 in the Northern Hemisphere [3], high albedo and low thermal diffusivity values make snow cover an important factor in the surface energy balance [4,5]. The sensitivity of snow cover to temperature also makes it a high-profile indicator of climate change [6,7]. At short-term scales, snow-related hazards and disasters have drawn additional research efforts toward timely snow cover monitoring [8,9].
Satellite remote sensing provides a unique ability to monitor snow cover and its dynamics at large scales that sparse meteorological observation networks cannot accomplish. To the extent possible, snow can be reliably distinguished from other surface features (e.g., soil, rock, vegetation, and water bodies) by utilizing the differences between them in the visible and near-infrared parts of the electromagnetic spectrum. Hence, a regional or global snow-covered area (SCA) can be accurately estimated from optical imagery. The Moderate Resolution Imaging Spectroradiometer (MODIS), which has flown on board the Terra and Aqua satellites since 1999 and 2002, respectively, has been used to map the daily global SCA at 500 m resolution for years by taking advantage of a wide scanning swath and advanced spectral resolution. The normalized difference snow index (NDSI), which employs the high reflectance of snow in the visible wavelengths and a strong absorptive manner of snow in near-infrared wavelengths, has often been used to detect snow cover and estimate the fractional snow cover (FSC) from Landsat-5 Thematic Mapper (TM) and MODIS imagery [10,11,12].
The overall accuracy of the MODIS standard binary snow cover product is close to 93%, while the root mean squared error (RMSE) of the MODIS standard FSC product can reach approximately 0.10 [12,13]. However, the overall accuracy varies with different regions and the SCA estimation would be impacted by snow/cloud confusion [14,15]. The linear statistical relationship between the NDSI and FSC adopted in the NASA standard MODIS snow cover product, i.e., the MOD10 suite, can be confused by varying spectral properties of snow and other surface features. Multiple end-member spectral mixture analysis (MESMA), which accounts for linear contributions from the sub-pixel reflectances of different surfaces to a single pixel, has been used in FSC estimations as well, e.g., the MODIS Snow-Covered Area and Grain size (MODSCAG) algorithm, which is considered to be more accurate than the NDSI method [16,17,18,19]. However, the MODSCAG product is available for the Tibetan Plateau (TP) but not for other stable snow-covered regions in China, including Northwest and Northeast China. An alternative MODIS FSC mapping algorithm proposed by Shi [20] and developed by Zhu et al. [21] utilizes MESMA with an image-based end-member library. Selecting optimal end-members from a particular local MODIS image contributes to more accurate FSC estimates with an RMSE of 0.05~0.18.
Daily SCA maps derived from optical sensors tend to have serious data gaps, which are primarily due to clouds that obscure the optical detection of Earth’s surfaces. This problem greatly hinders applications of daily SCA maps, including MODIS daily snow cover products. In addition, some clouds may persist for hours or days, and clouds are particularly prevalent during snowfall and over snow-capped mountains. In an analysis using Visible and Infrared Spin Scan Radiometer (VISSR) data acquired from FY-2F, we found an average of 24 cloudy days out of three months during the 2013/2014 winter throughout the seasonal SCAs within China. The Terra and Aqua MODIS instruments can optically observe the same location in the morning and afternoon, respectively; consequently, the combination of them could be employed to develop cloud-reduced snow cover maps with high accuracies [22,23], although Aqua MODIS generates slightly less accurate snow information than Terra MODIS [12]. Active and passive microwave sensors have also been used to detect snow cover, but they can do so in all weather, day and night. Synthetic aperture radar (SAR) instruments operating at the C-band or at higher frequencies are able to detect wet snow with a fine spatial resolution, but they cannot easily distinguish dry snow from snow-free surfaces [24,25,26]. Snow cover can be acquired from cloud-free snow depth (SD) or snow water equivalent (SWE) maps derived from passive microwave sensors [27,28,29,30]. Among these, the Advanced Microwave Scanning Radiometer-Earth Observing System (AMSR-E) might be the most common instrument used for the fusion of daily cloud-free snow cover maps [31,32,33,34,35]. However, the coarse spatial resolution (~25 km) and the accuracy of SCA derived from passive microwave sensors is considerably inconsistent with those of SCA derived from optical sensors. Moreover, currently employed active and passive microwave imaging sensors exhibit relatively narrow swaths during daily revisits over mid-latitude regions. Such inherent limitations of microwave sensor data typically reduce their ability to alleviate the deficiencies of SCA products in terms of spatiotemporal continuity.
Among the spaceborne sensors with the ability to detect snow cover concerning spatiotemporal continuity, optical imagers onboard geostationary orbit (GEO) satellites are likely the most effective and reliable because they have the unique capacity to frequently observe approximately one-third of Earth’s surface in near real-time. The satellites of the Geostationary Operational Environmental Satellite Program (GOES-13 through 15), the Meteosat Second Generation (MSG-1 through 3), the FY-2E through G, and Himawari-8, which are either currently operational or on standby, highlight the potential for immensely cloud-reduced snow cover mapping with multitemporal clear-sky observations in a single day. GOES imagery has long been used to automatically map snow cover over North America [36,37,38,39] with the aspiration of reducing human labor within the Interactive Snow and Ice Mapping System [40,41]. Romanov and Tarpley [39] computed the FSC through a linear interpolation of snow-free reflectance observed by the GOES satellites during the late fall with snow reflectance of non-forested flat terrains. Subsequently, the location-independent snow reflectance, which decreases proportionally to the square root of the grain size (ranging from 0.1 to 1 mm), was determined empirically from wintertime GOES measurements over several selected target areas. In terms of the utilization of the MSG satellites carrying the Spinning Enhanced Visible and Infrared Imager (SEVIRI), both spectral and temporal information can be explored to capture dynamics of snow cover over Europe [42,43].
To monitor snow cover over China, a two-phase classification scheme to produce binary snow cover maps using the Multifunction Transport Satellite-2 (MTSAT-2, also known as Himawari-7) was proposed and developed into a new multisensor algorithm using the VISSR onboard FY-2D/E in addition to the Microwave Radiation Imager (MWRI) onboard FY-3B [44,45]. The visible (VIS) band and IR4 channel of the FY-2 VISSR can be used to construct multiple snow indices, including the NDSI and ratio snow index (RSI), in order to estimate the FSC through an empirical relationship. However, surface reflectances vary over different land cover types, and residual effects from the directional reflectance of surface features may exist after the preprocessing of GEO satellite images. As a consequence, uncertainties could be generated by utilizing either a linear spectral mixing analysis with snow reflectance values collected solely from a single area or the curve fitting method with a snow index.
To accurately estimate the daily cloud-mitigated SCA over China, we developed the two-phase classification scheme and proposed a daily FSC mapping method based on linear spectral mixing analysis using FY-2E/F VISSR observations.
2. Data
2.1. FY-2 VISSR Observations
The first-generation Chinese geostationary meteorological satellites, i.e., the FengYun-2 (FY-2) series, are equipped with VISSR instrumentation to observe the main part of Asia. The new-generation geostationary meteorological satellite, i.e., FY-4A, which was successfully launched on 11 December 2016, is carrying the Advanced Geosynchronous Radiation Imager (AGRI) and providing observations with significant improvements over the VISSR. The FY-4A AGRI has 14 spectral channels at the spatial resolution of 0.5~4 km, and obtains full-disk images every 15 min. Before the FY-4A AGRI data becomes available to users, however, the FY-2 VISSR is still useful in meteorological applications. FY-2C and FY-2D have been retired, while FY-2E has been operational since 15 June 2008. FY-2F and FY-2G were launched on 13 January 2012 and 31 December 2014, respectively. FY-2F is currently situated over the equator at 112°E. Since 1 July 2015, FY-2G has taken the place of FY-2E at 104.5°E, while FY-2E has replaced FY-2D at 86.5°E.
The calibration accuracy of the FY-2F/G VISSR has been improved, and is more stable than the FY-2D/E VISSR due to a better spaceborne calibration system. The VISSR spreading over visible, shortwave infrared, and thermal infrared wavelengths has a nominal temporal resolution of 1 h (the combination of two complementary satellites enhances this resolution to 30 min) and a nadir spatial resolution of 1.25 km in the VIS band and 5 km in the IR channels (see Table 1). These characteristics of the FY-2 VISSR make it a good data source for mapping the FSC over China with enhanced spatiotemporal continuity.
The combination of FY-2E/F VISSR was selected for the mapping of cloud-reduced FSC over China due to its long time coverage. FY-2G VISSR was not included in the combination for improving temporal resolution, because its work mode is nearly contemporary but not temporally complementary with FY-2F VISSR. The FY-2E/F VISSR daytime multitemporal and multispectral full-disk observations were acquired from National Satellite Meteorological Center, China Meteorological Administration (http://satellite.nsmc.org.cn/portalsite/default.aspx).
In this study, we focused on mapping the cloud-reduced FSC only during the winter season (from December through February) because little snowfall is observed within China during the other seasons. Meanwhile, observations from the autumn season (particularly from November) were used to obtain snow-free ground reflectance data.
2.2. Validation Data
The validation of FSC maps derived from spaceborne optical sensors are hindered by nearly unavailable ground truth data. The extents of field surveys and the timing and spacing of snow observation networks only allow for validation efforts that are limited to certain conditions. One feasible method used to approximate the ground truth corresponding to FSC maps is the aggregation of fine-resolution snow cover derived from multispectral imagery. Because snow cover maps derived from Landsat TM and Enhanced TM Plus (ETM+) imagery are well-accepted as references for the validation of lower-resolution snow cover maps, we acquired and processed five images from the Landsat-8 Operational Land Imager (OLI) for evaluation. However, a maximum of approximately 2200 grid cells within the FY-2 VISSR image can be found in a respective Landsat-8 OLI scene due to the immense differences in their spatial resolutions and scanning widths. The Landsat-8 OLI multispectral reflectance scenes were provided by the Earth Resources Observation and Science (EROS) Center of the U.S. Geological Survey (USGS), and it can be freely ordered and downloaded at https://earthexplorer.usgs.gov/.
Accurate snow cover from Landsat-8 OLI images at 30 m resolution was determined using the SNOWMAP method [12,46]. After binary snow cover mapping, the resulting maps were aggregated into the 0.05° resolution FSC maps. Reflectance models that account for the characteristics of snow and the canopy effect can be used to improve snow mapping accuracy in forested areas [47]. The SNOWMAP method may derive smaller SCA estimates than the relatively reasonable approach based on coupled reflectance models applied to the snow beneath dense canopies; nevertheless, we employed the SNOWMAP method for all of Landsat-8 OLI images used in this study because it is well-accepted and can be easily implemented.
The SNOWMAP approach mainly relies on the NDSI, which can be estimated using the following equation:
where and represent the reflectances of two bands (around 0.5 μm and 1.6 μm, respectively) that correspond to Band 3 and 6 for Landsat-8 OLI, and Band 4 and 6 for MODIS.
According to the standards of the China Meteorological Administration for ground measurements, the SD is recorded only if the snow cover exceeds one-half of a view. Generally, the FSC reaches 0.5 when the NDSI is >0.4, and, therefore, the binary snow cover can be identified using this rule. We empirically employed the rule wherein Rband5 >0.2 rather than the widely utilized threshold of 0.11 to screen out water bodies.
To evaluate the performance of the FY-2E/F VISSR FSC at 0.05° (approximately 5 km) resolution and investigate its cloud-removal abilities, we chose the 500 m resolution MODIS FSC based on MESMA as reference data [20,21]. When aggregated into 0.05° grids, this MODIS FSC product has an average RMSE of approximately 0.05 and is fairly reliable for the evaluation of the FY-2E/F FSC. With the surface reflectance data of seven bands from the MOD09GA product, we retrieved the FSC over China and aggregated it to match the spatial resolution of the FY-2E/F FSC maps. The cloud removal scheme of Zhu et al. [21] was excluded from the snow cover mapping process, because snow cover information that is substituted with corresponding cloud-free observations from another MODIS image might be inconsistent with FY-2E/F high temporal resolution observations. The cloud cover in the reference FSC data was determined based on the cloud state in the MOD09GA product, which is likely to exhibit less erroneous cloud detection results than the MOD35 cloud mask employed in the MOD10 suite. The MODIS images selected for comparison are slightly contaminated by clouds and are dominated by a snow cover transition from snow-free areas.
2.3. Auxiliary Data
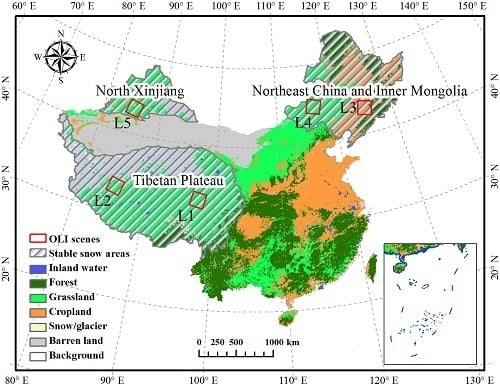
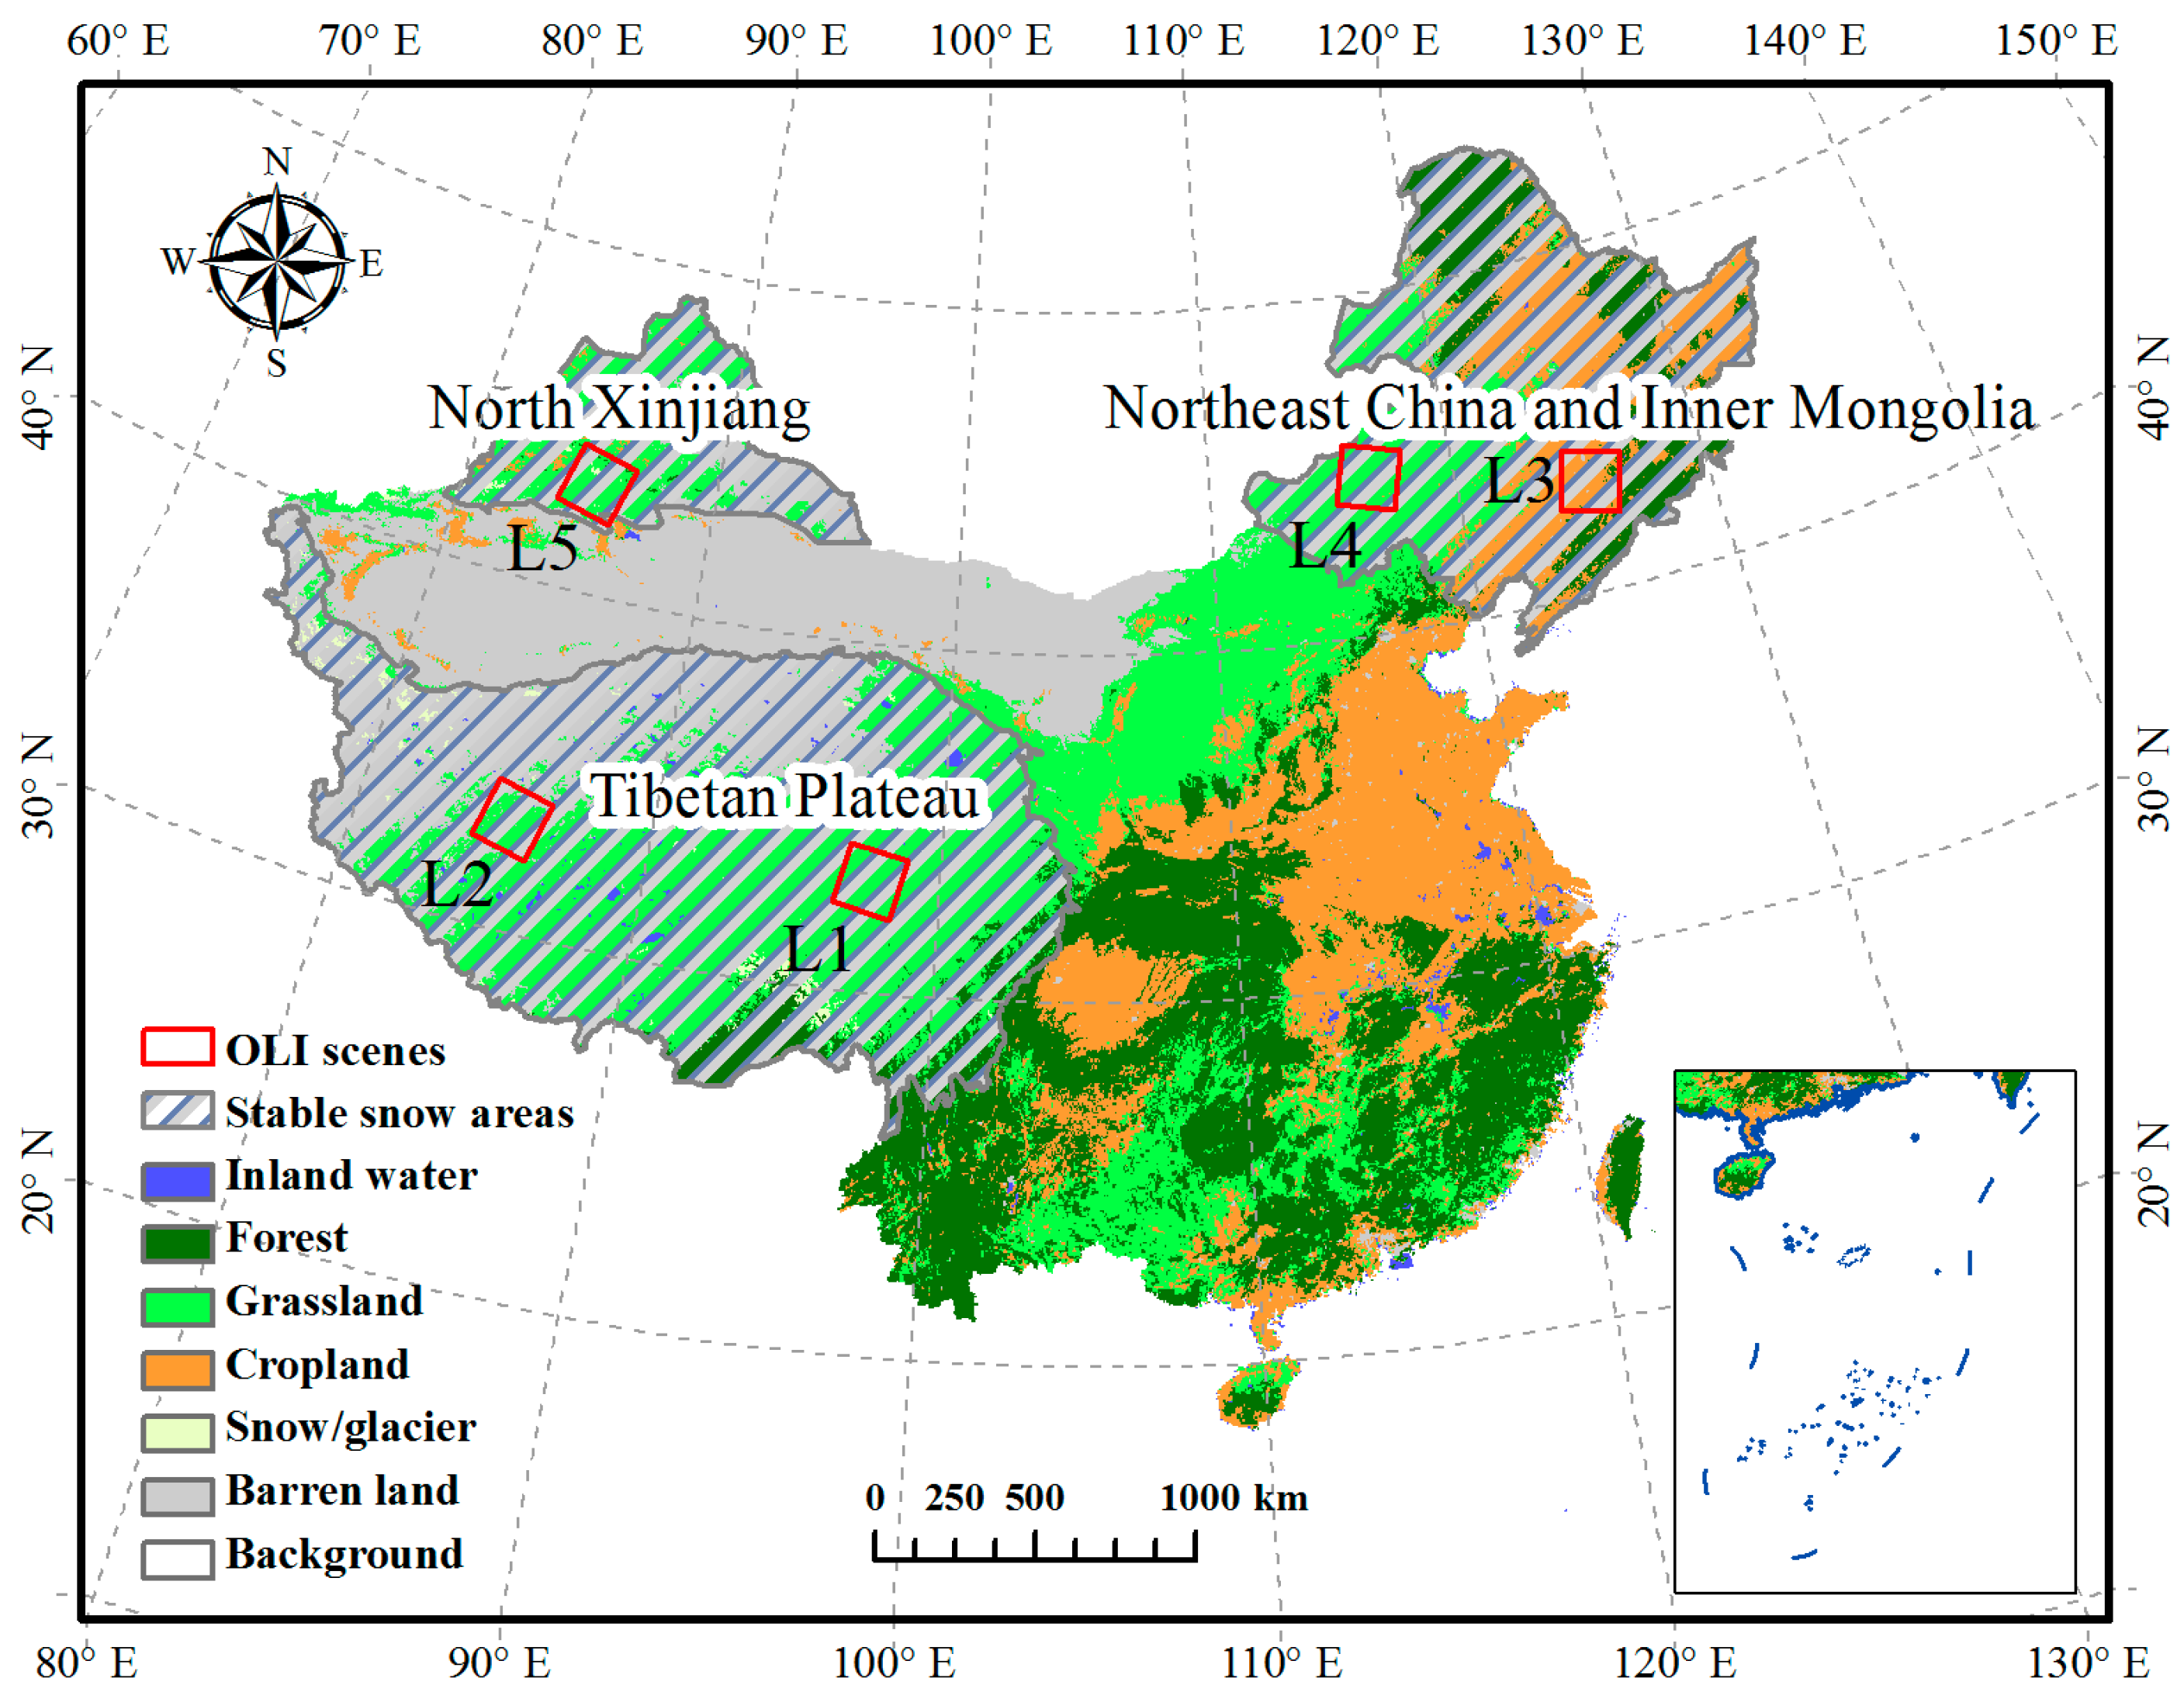
To account for the effects of land cover types on the FSC maps, we also used the 2012 International Geosphere-Biosphere Programme (IGBP) land cover data from the MCD12C1 product and clustered 17 land cover classes into 6 categories: inland water, forest, grassland, cropland, barren land, and snow/glacier (see Figure 1). The MCD12C1 product is available from the NASA Land Processes Distributed Active Archive Center (LP DAAC) located at the USGS EROS Center (https://lpdaac.usgs.gov/). For the elevation information used in this study, we collected Shuttle Radar Topography Mission (SRTM) digital elevation model (DEM) version 4.1 data [48], which is available from the Consultative Group for International Agricultural Research (CGIAR)-Consortium for Spatial Information (CSI) SRTM website (http://srtm.csi.cgiar.org).
3. Methodology
3.1. FY-2 VISSR Snow Detection
We developed a new version of the snow cover detection algorithm proposed by Yang et al. [44] and Yang et al. [45] to map the binary snow cover over China. The preprocessing of the FY-2E/F VISSR imagery was consistent with the techniques presented by Yang et al. [45], who instead focused on FY-2D/E VISSR images. Top-of-atmosphere reflectance data from the VIS band and temperature brightness data from the IR channels were calculated using look-up tables and then projected onto the geographic projection with a grid size of 0.05°. Despite the higher spatial resolution of the VIS band, the 0.05° grid size is unlikely to forfeit much information due to the coarse spatial resolutions of the highly useful IR channels and the pixel distortions at off-nadir angles in all of the channels. The IR4 channel, which is a mid-infrared band observing the reflection of solar radiation from Earth’s surface and the surface’s own emission, can be treated as a substitution for the useful 1.6 μm band, which the VISSR does not carry. Using the corresponding observations and spectral response functions of the IR1 and IR4 channels, we also calculated the reflectance of the IR4 channel for snow/cloud discrimination [49]. We used the cosine of the solar zenith angle to correct the diurnal variations in the VIS and IR4 reflectance data, since most of the surface features are non-Lambertian and because the reflectance data are potentially impacted by the imaging time differences.
This binary snow cover mapping algorithm consists of two phases of decision tree through which the accuracy and computational efficiency can be improved. All of the unclassified pixels that passed phase 1 (generally containing most of the snow-covered pixels) were eventually classified within the supplemental snow cover algorithm phase 2. However, the FY-2D/E VISSR currently fails to map the snow cover using the original version of this two-phase algorithm due to sensor degradation over a long lifetime. The thresholds of the algorithm were modified to match the characteristics of the FY-2F VISSR (see Table 2 and Figure 2), of which the spaceborne calibration system has been improved. The FY-2E VISSR can also be used in this algorithm after inter-calibration using the FY-2F VISSR as a reference. This suite of thresholds designed for FY-2F VISSR is also appropriate for the FY-2G VISSR because of the consistency of the spaceborne calibration system. After the two phases of the decision tree, a temporal stability test was applied to detect moving clouds that may be erroneously assigned as snow cover. Additionally, snow cover would be screened out if the brightness temperature of Band IR1 is 20 K higher than the monthly average of the land surface temperature from 2001 to 2016. Unnaturally warm “snow”, which was actually cloud cover that was particularly prevalent over South China, can be filtered out to alleviate snow/cloud confusion.
The daily binary snow cover maps were generated by compositing hourly snow maps following a priority principle, i.e., snow covered surfaces > snow-free surfaces > clouds. To obtain more stable and reliable daily binary snow cover maps with less snow/cloud confusion, the FY-2 VISSR snow detection approach was further developed with stricter criteria to determine the snow cover within the daily maps. The pixelwise daily snow cover was only assigned if snow was identified more than three times in hourly images under low solar zenith angles. In this study, we did not blend the FY-2 VISSR images with FY-3B MWRI snow cover data to reduce the cloud coverage [45], because the coarse spatial resolution of the FY-3B MWRI data could lead to substantial uncertainties.
3.2. FY-2 VISSR FSC Mapping
Following the generation of the FY-2E/F daily binary snow cover maps, a linear spectral mixing analysis that incorporates the autoselection of end-members can be used to map the cloud-reduced FSC over China. To extract the snow-free and full snow cover end-members, the NDSI for the FY-2E/F VISSR and the reflectance data from the VIS band were utilized in the design of a group of simple rules, wherein the empirical thresholds were determined using land cover data, MODIS FSC data based on the MESMA, and FY-2E/F VISSR binary snow cover data from the early winter of 2013/2014.
Following the rules listed in Table 3, the snow cover and snow-free end-members were extracted from the FY-2E/F VISSR hourly images. Due to an insufficient number of reflective bands for extracting multiple end-members, we utilized the most frequent reflectance values from the histogram of snow reflectances of the same land cover type to be representative of the snow cover end-members.
A linear interpolation approach was subsequently implemented for those pixels designated as snow cover, using the VIS band reflectances observed in certain hourly images to calculate the pixelwise FSC. The two groups of pixelwise end-members within the different hourly images served to reduce the impacts of non-Lambertian surfaces and varying atmospheric path lengths. Again, the solar zenith angle was used to generate the daily FSC from the hourly FSC, wherein the FSC under the lowest solar zenith angle was considered the most confident result.
3.3. Validation Metrics
The performance of the FY-2E/F VISSR FSC maps can be quantitatively characterized by a set of metrics using reference data. The 30 m resolution Landsat-8 OLI FSC maps based on the SNOWMAP method and the 500 m resolution Terra MODIS FSC maps based on the MESMA were taken as reference data for the validation of the FY-2E/F VISSR FSC maps based on a simple linear spectral mixture analysis with full snow cover and snow-free end-members.
The selected validation metrics for the FY-2E/F VISSR FSC include the overall accuracy, the RMSE, and the coefficient of determination (R2), which are defined as below:
where TP indicates true positive, TN indicates true negative, FP indicates false positive, FN indicates false negative, fVISSR indicates the FSC derived from the FY-2E/F VISSR, and freference similarly indicates the FSC derived from Terra MODIS or Landsat-8 OLI data.
The binary snow detection results of the FY-2E/F VISSR do not indicate that FSC is persistently greater than a certain value. Thus, to use the binary metric of overall accuracy, a threshold of 0.15 was selected for the calculation. The fractional metrics, including RMSE and R2, were used to compare the FSC values from the FY-2E/F VISSR and the Terra MODIS data only for those grids where the MODIS was able to detect snow, thereby excluding the majority of the snow-free land of China. The FY-2E/F VISSR is relatively weakly impacted by the presence of cloud cover, and thus any situation wherein it discovers snow when the MODIS did not would be excluded from the calculations.
4. Results
The advantages and disadvantages of the FY-2E/F VISSR FSC were analyzed using reference data from high spatial resolution images. The 30 m resolution Landsat-8 OLI images can reliably delineate details of the snow cover at the watershed scale rather than at the continent scale. With daily revisit intervals in mid- and high-latitude regions, the 500 m resolution MODIS imagery can infer FSC at the global scale; moreover, geo-location uncertainties can be alleviated by averaging the binary snow cover over a coarser resolution. Therefore, the MODIS FSC maps served as complementary information for evaluating the FSC using Landsat-8 OLI data and for demonstrating the cloud removal capabilities of the FY-2E/F VISSR. In this study, we chose not to present the specific performance details of the FY-2E/F VISSR binary snow maps, as they have been discussed in previous studies [44,45].
We selected several cases to account for variable conditions of FSC mapping. The Landsat-8 OLI images used for the evaluations encounter a transition from snow-free to full snow-covered ground, allowing for the FSC to spread throughout the range of 0.0~1.0. All of the selected Landsat-8 OLI images are absent of or are only slightly influenced by clouds during the 2013/2014 winter season. The topography encompasses a transition from flat terrains to mountainous areas, and different land cover types are also used during the evaluations. The evaluations were carried out at a spatial resolution of 0.05° in the main part of China using MODIS data, and in the three selected regions of China using Landsat-8 OLI data (See Figure 1). These selected regions account for the three largest stable seasonal SCAs in China, i.e., the TP, North Xinjiang (including the Tianshan Mountains), and the Northeast China and Inner Mongolia region [50].
4.1. Results in China
Following the FSC retrieval methods and evaluation techniques described above, daily cloud-reduced 0.05° resolution FSC can be derived from FY-2E/F VISSR and compared to Terra MODIS FSC over the main part of China. An illustration of the comparison between the FY-2E/F VISSR FSC versus the Terra MODIS FSC for 19 February 2014 is shown in Figure 3.
In Figure 3a, the false color composite using Band 6, 5, and 4 of Terra MODIS results in the snow cover being colored with deep blue, ice clouds with shallow blue, water clouds with white, and land surfaces with a range from green to brown. Based on a comparison of the FSC maps from Terra MODIS with those from the FY-2E/F VISSR (Figure 3b–d), the MODIS FSC maps tend to detect more clouds than those of the FY-2E/F VISSR.
In this case, a cloud coverage of 51%, 33%, and 20% over the main part of China was observed by Terra MODIS, the FY-2E VISSR, and the FY-2F VISSR, respectively. The daily composite of the FY-2E/F VISSR observations could reduce the cloud coverage to only 15%, which is similar to the conclusions of Yang et al. [45] that FY-2D/E images have a lower cloud coverage than the combination of Terra and Aqua MODIS images (about 16% and 47%, respectively). At the same time, Terra MODIS infers an SCA of 10% over the main part of China while FY-2E and FY-2F have a relatively high SCA estimation of 15%. Multitemporal observations from the FY-2F VISSR in a single day contribute to relatively cloud-reduced daily FSC maps and greater SCA, although underestimations of the FY-2E and FY-2F VISSR FSC results can be observed in comparison to the MODIS FSC at the pixel scale under clear-sky conditions (see Figure 4).
Figure 4 shows the scatter plots of the FY-2E and FY-2F FSC results versus the Terra MODIS FSC over the main part of China. The resulting R2 values of 0.67/0.66, which are slightly low, are acquired for FY-2E/F, indicating the extent to which the FY-2E/F VISSR FSC results agree with the MODIS FSC. There is a persistently low behavior of the FY-2E/F VISSR FSC (with RMSEs of 0.20/0.19) compared with the MODIS FSC. This might be partially explained by the imperfect approximation of the coarse-resolution reference FSC. The direct aggregation of the high-resolution binary snow cover would persistently generate FSC estimates higher than those derived from coarse-resolution imagery [51]. The overall accuracy is 0.85 for the FY-2E VISSR and 0.84 for the FY-2F VISSR snow cover maps compared with the MODIS FSC; these values would be different from the evaluation results if the sparse ground station observations were used as the reference.
4.2. Results in Tibetan Plateau
The Tibetan Plateau (TP), widely known as the Third Pole, has an average elevation >4000 m. Snow cover is patchy in the mountainous areas, and is typically thin over the inland plateau regions. The performance of the FY-2E/F VISSR FSC over the TP was demonstrated through a validation against the Landsat-8 OLI FSC. The generated Landsat-8 OLI FSC for two scenes (Path 134/Row 37 on 20 January 2014, and Path 142/Row 37 on 28 January 2014), which are labeled as L1 and L2 in Figure 1, represent reference estimates of the patchy and shallow snow in this region (see Figure 5 and Figure 6).
For the comparison in Figure 5, the FY-2E/F VISSR FSC maps demonstrate RMSE results of 0.18/0.20 with R2 values of 0.76/0.72, which are also listed in Table 4. The coarse resolution often causes the FY-2E/F VISSR to erroneously detect variable snow in the regions where the terrain dramatically transitions from high mountains to flat terrain (i.e., the bottom-right corner of Figure 5). Where snow is spatially extensive, the FY-2E/F VISSR successfully achieves high FSC estimates. A scatter plot of the corresponding comparison is not presented herein because a single Landsat scene aggregated into the 0.05° resolution cannot provide a sufficient number of points to demonstrate the comparison. The subsequent cases of the other regions analyzed hereafter also follow this reasoning.
Another example represents the case for the inland plateau (Figure 6). Few high mountains are located in this Landsat-8 OLI scene, and small non-icebound lakes are masked within Figure 6a. The RMSE of the FY-2F VISSR FSC is approximately 0.21 with an R2 of 0.72. The FY-2E VISSR FSC exhibits similar evaluation results in this case. The discrimination of snow and snow-free land in the FY-2E/F VISSR imagery is limited where patchy and shallow snow dominates, for which there are some reasons. Off-nadir viewing geometry may introduce uncertainties into the VIS band observations; more significantly, high reflectances (>0.4) are often observed in the inland plateau, perhaps due to the existence of deserts and bare rocks. Hence, differentiating the reflectances of snow and snow-free land is restricted here, and inherent limitations in the radiometric resolution also make the reflectance observations less sensitive to variable FSC values.
4.3. Results in Northeast China
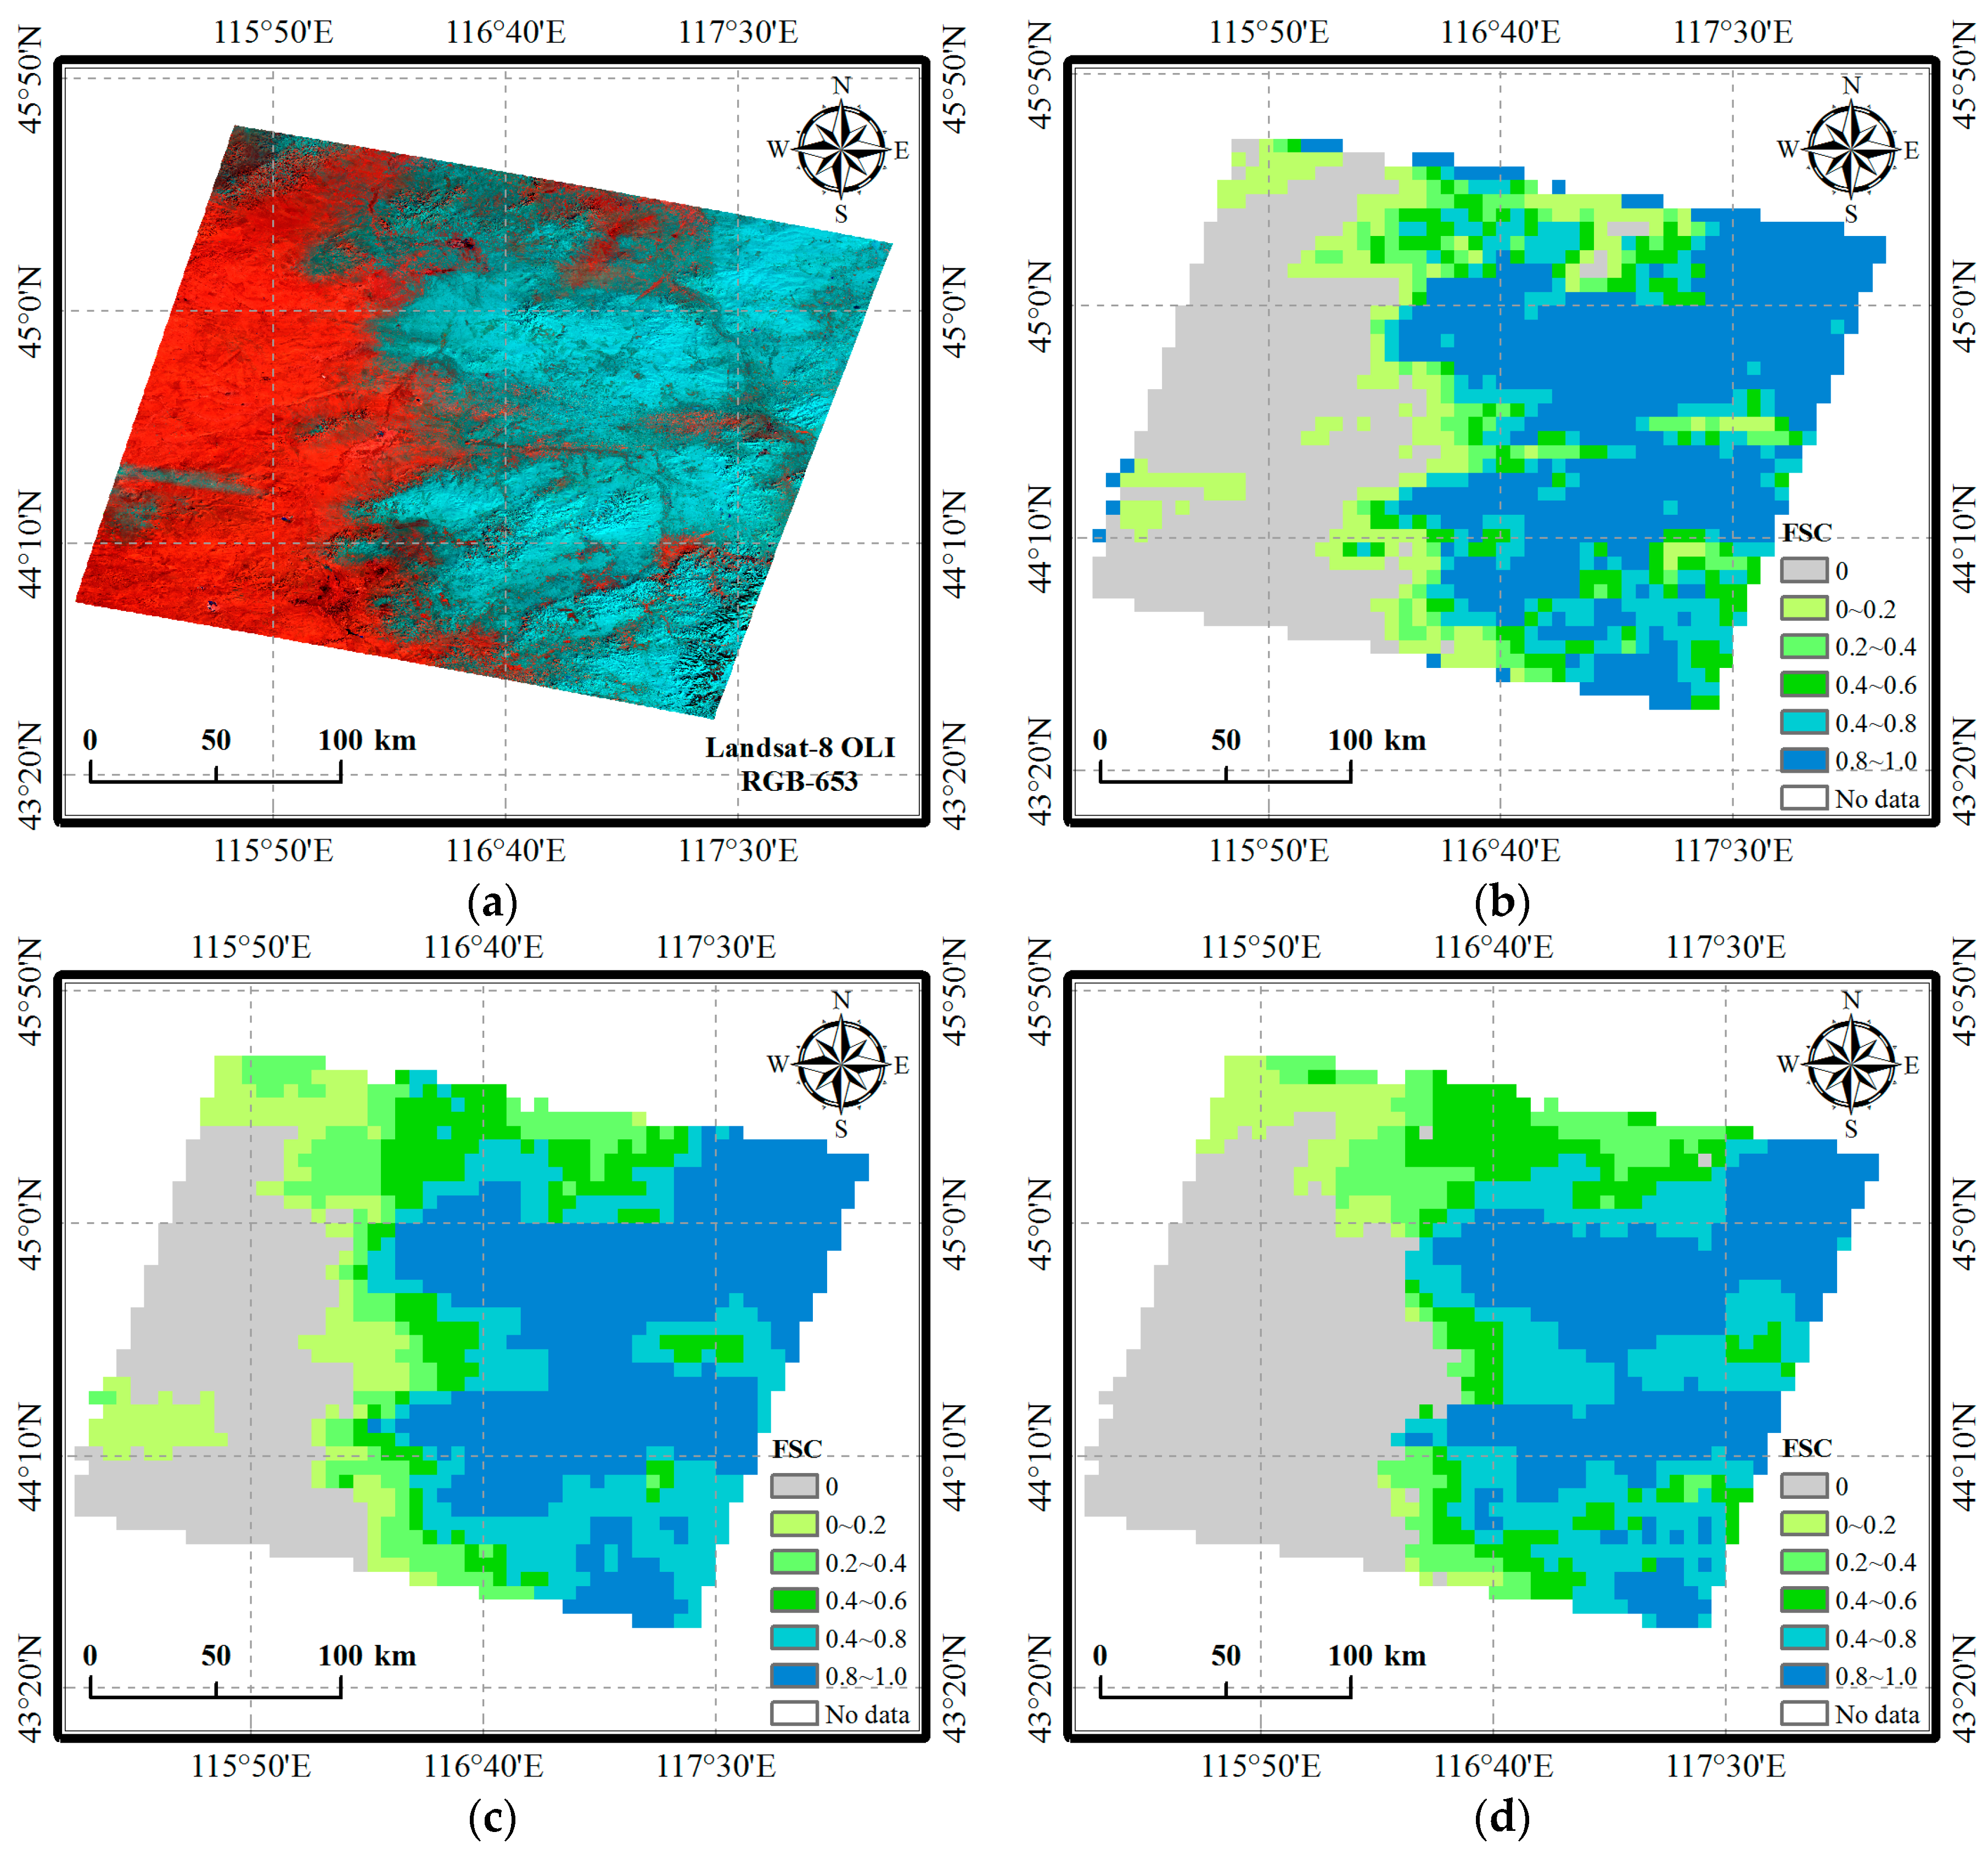
The behavior of the FY-2E/F VISSR FSC over Northeast China and Inner Mongolia was also depicted using Landsat-8 OLI estimates (the L3 and L4 scenes in Figure 1). Northeast China comprises large plains that are surrounded on three sides by the Greater and Lesser Khingan Ranges and the Changbai Mountains, which are covered by dense forests with canopies that obscure optical viewing from space.
Figure 7a,b shows snow in forested areas as well as snow-free grassland areas and residential areas. The FY-2F VISSR FSC agrees well with the Landsat-8 OLI FSC with an RMSE result of 0.26, while FY-2E has a higher RMSE of 0.29. Both the FY-2E and FY-2F VISSR obtained high overall accuracies no less than 0.90. According to Figure 7c,d, the FY-2E and FY-2F VISSR FSC maps demonstrate good snow detection performances in the grassland and sparse forested areas, but they tend to have relatively low estimates in dense forests compared with the Landsat-8 OLI FSC.
Inner Mongolia, which is adjacent to Northeast China, is dominated by large areas of seasonal snow cover during the winter. The behavior of the FY-2E/F VISSR FSC over the grassland of Inner Mongolia is depicted in Figure 8. In this situation, FY-2E VISSR FSC obtains the best RMSE and R2 among all scenes (see Table 4). The RMSE, R2, and overall accuracy of the FY-2E/F VISSR FSC are 0.18/0.22, 0.80/0.62, and 0.87/0.91, respectively. The FY-2F VISSR FSC exhibits a poorer performance than the FY-2E VISSR FSC with respect to the RMSE, likely because FY-2F missed some snow cover.
4.4. Results in North Xinjiang
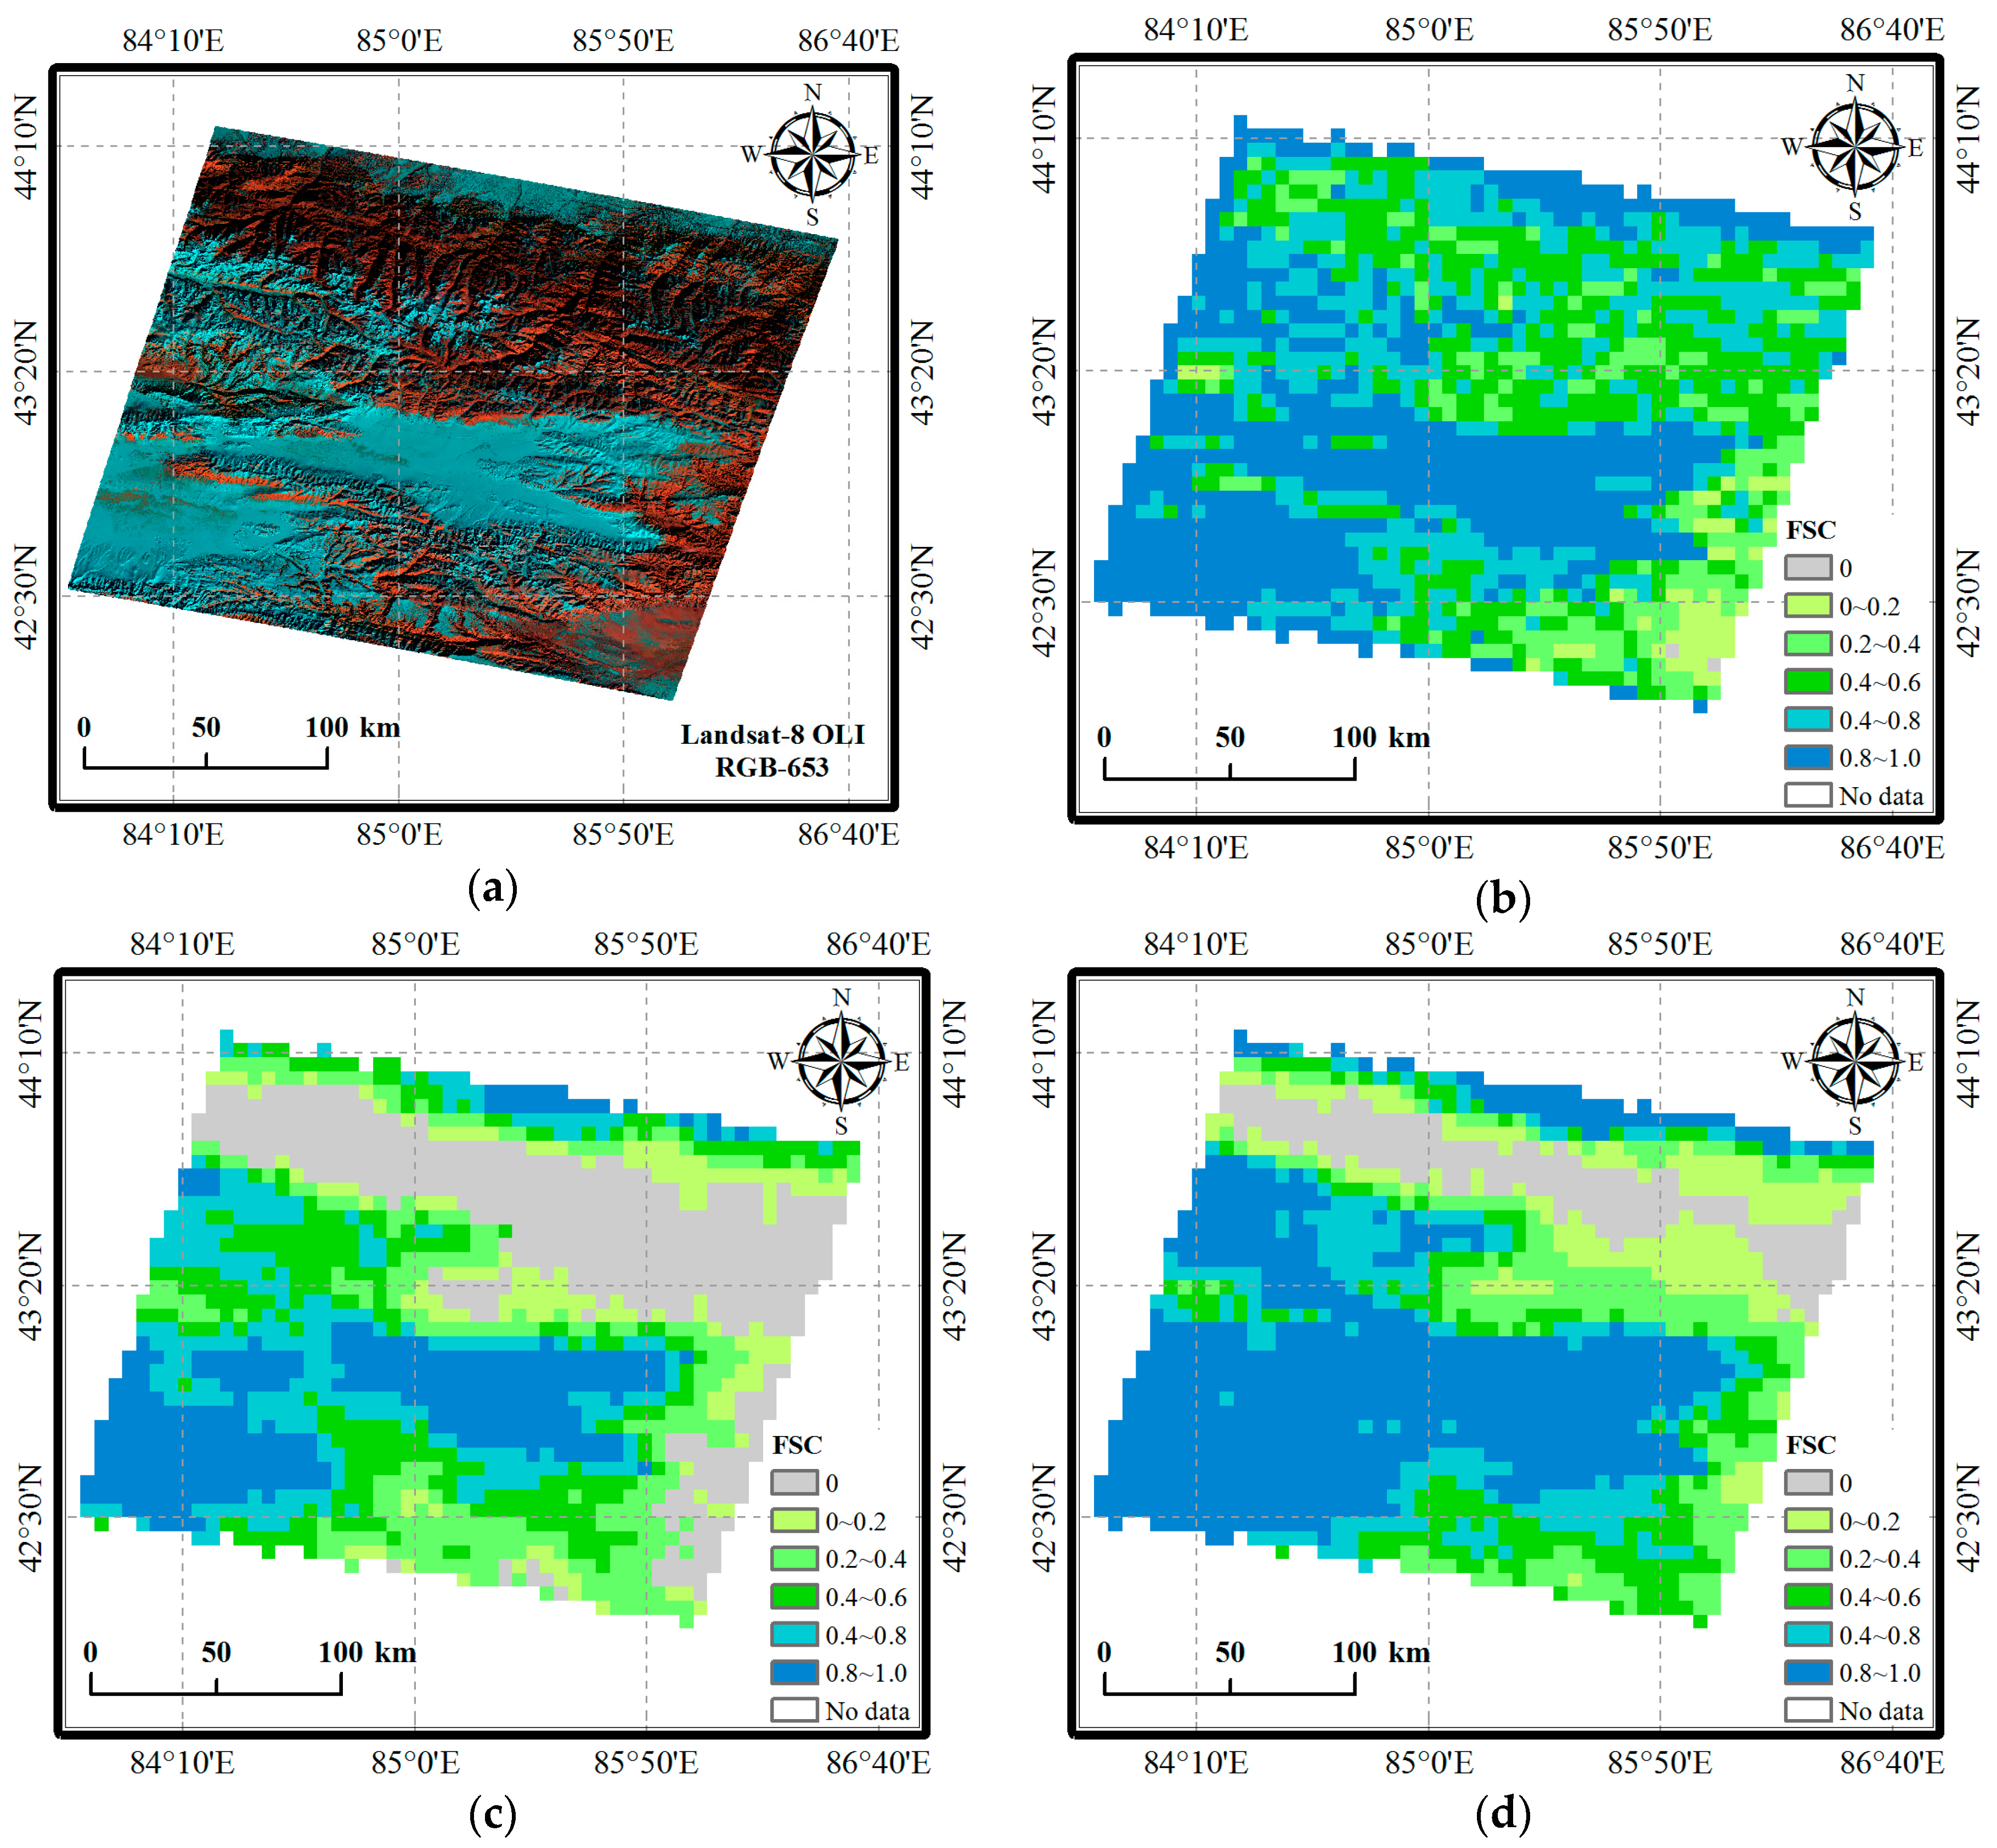
The third region selected for the evaluation of the FY-2E/F VISSR FSC spans North Xinjiang and the Tianshan Mountains, which are dominated by seasonal snow cover and glaciers throughout the winter season. Only one Landsat-8 OLI scene, which is labeled as L5 in Figure 1, was processed here because this region has a relatively small area and can be fundamentally characterized as patchy snow atop mountains.
As shown in Figure 9, continuously full snow cover is distributed throughout some of the intermountain basins in the eastern part of the Tianshan Mountains, wherein the FY-2E/F VISSR infer relatively accurate FSC results. Calculations conducted only for the regions where the FY-2E/F VISSR detected snow cover result in RMSE values of 0.28/0.25 and R2 values of 0.46/0.49 (listed in Table 4 as well). However, the FY-2E/F VISSR tends to miss some areas of patchy snow, particularly on the northern slopes of high mountains (i.e., close to the upper boundary of Figure 9). Therefore, the overall accuracy of the FY-2E/F VISSR FSC only reaches 0.65/0.68. The FY-2E/F VISSR views flat terrains in this region at zenith angles beyond 57° and receives little reflected light from the northern slopes. This is significantly different from the viewing geometry of the Landsat-8 OLI sensor. In addition, the residual angle effects of the cosine correction also limit the snow-mapping ability of the FY-2E/F VISSR.
5. Discussion
Spatially extensive and temporally persistent clouds significantly obscure the optical remote sensing of snow cover, and make it difficult to discriminate between snow and certain types of clouds. As a result, daily snow cover maps derived from optical sensors often exhibit gaps and can hardly be applied toward hydrological or land surface models without reconstruction. Combining spatially and temporally adjacent observations cannot account for highly variable snow cover, whereas blending multisensor data would introduce uncertainties related to the inherent characteristics of different sensors. These problems can be effectively alleviated by increasing the observation frequency and combining multitemporal observations from the same sensor.
Given that the FY-2E/F VISSR binary snow cover maps evidently demonstrate their advantage in removing cloud cover, we have further developed a simple FSC retrieval method to derive reliable and adequate snow cover under clear skies. This method is based on a linear spectral analysis of the VIS band and can be used to map the daily cloud-reduced FSC over China. The linear spectral analysis that employs snow-free end-members and snow end-members is more theoretically reasonable than the snow index method. The snow-free end-members are spatially and temporally localized because their reflectance values fluctuate insignificantly over the period of a few days at the same location and local time. Inter-class spectral variability and residual uncertainties of the angle correction can be alleviated using this technique. The snow end-members can scarcely be selected locally, and therefore the most commonly observed reflectance of full snow cover from the same land cover type is taken as the representative value. The FSC results derived from the linear spectral analysis are constrained to an RMSE over 0.18 primarily as a consequence the single reflective band of the VISSR (i.e., the reflectance from the IR4 channel was not used for the FSC calculation) and the coarse spatial resolution. Direct linear interpolation would not be reasonable in many conditions. Due to lacking enough spectral information, it is difficult to tell if decreasing reflectance is from snow disappearance or because snow is covered by other things, such as soot and dust. Therefore, the detection of snow variation needs improvements. Without enough spectral information from the VISSR, it is also difficult to explore vegetation information, e.g., the use of the normalized difference vegetation index (NDVI), which is important for snow cover mapping in forests. The spatial resolution of FY-2E/F VISSR is relatively coarser than MODIS and Landsat TM/OLI that can be used in simulating snowmelt at the watershed scale [52,53]. At the continental and global scales, the 0.05° resolution of FY-2E/F snow maps is same with MOD10C1, highlighting potential applications in land surface models [54].
Different imaging diurnal times and variable viewing conditions across different scanning regions also introduce uncertainties, which partly account for the small differences between FY-2E and FY-2F FSC maps revealed in the validation. Moreover, the interoperability of FY-2E and FY-2F (or FY-2G) for FSC mapping would be compromised because FY-2E VISSR is aging. However, the priority of FY-2E VISSR over FY-2F VISSR is recommended in the composite of daily FSC maps derived from these two instruments, because the long lifetime of FY-2E VISSR is of prime significance for the creation of a long-term daily cloud-reduced snow cover data of China.
The limitations of snow mapping from Landsat-8 OLI on complex surface features and in forest areas also have potential implications for the validation results; therefore, improvements in reference data are needed to conduct a more reliable validation. To alleviate the effects of the non-flat surfaces on the observation variation, which may result in false FY-2 E/F VISSR FSC variation, topographic correction and investigating the impact of illumination and observation geometry in near-future are necessary as well.
A combination of complementary FY-2E/F VISSR data would remove the clouds that are moving rapidly, and thus can enhance the spatiotemporal continuity of daily FSC maps. The snow/cloud discrimination would be improved as well by utilizing the temporal information, because clouds generally change more quickly than snow. Since the MTSAT-2 and GOES satellites have similar instrument characteristics to FY-2 and have been implemented in our binary snow mapping method in earlier versions [44,55], these satellites could also hopefully use the FSC mapping method for snow monitoring. The Japanese Himawari-8 satellite, which has spectral and spatial characteristics that are comparable to MODIS but with a higher temporal resolution of 10 min, has been operational since 7 July 2015. As a consequence, the cloud removal capability can be significantly enhanced and the process of snowmelt can be captured. Near-future studies utilizing observations of China from the new generation of GEO satellites, e.g., FY-4A and Himawari-8, would hopefully minimize the cloud coverage with the high temporal resolution, and improve the snow/cloud discrimination with high spatial and spectral resolution in monitoring snow cover. However, it should be noted that this cloud removal capability, based on the increase in the temporal resolution, could be hindered by clouds that remain in a single location for days or longer.
6. Conclusions
The VISSR onboard operational FY-2 geostationary satellites with multitemporal and multichannel observations have been used to monitor snow cover over China. As such, the FY-2 VISSR can infer daily FSC estimates coincident with the significant mitigation of prevalent clouds, thereby allowing for applicable snow cover maps with enhanced spatiotemporal continuity. We have improved the current FY-2E/F VISSR binary snow mapping method and proposed an FSC mapping method that uses a linear spectral mixture analysis relying upon snow and snow-free end-members that are locally selected. This method is both feasible and reliable for incorporating local snow-free observations from days prior to snowfall and snow end-members over the same land cover type.
As expected, the FY-2E/F VISSR is able to reduce the cloud coverage percentage over China from 51 to 15%. In China, the FY-2E/F VISSR presents RMSEs of 0.20/0.19 with R2 values of 0.67/0.66 when compared with the FSC reference from MODIS using the MESMA. Over the three largest stable seasonal SCAs in China, the RMSEs of the FY-2E/F VISSR FSC is 0.18~0.29 with R2 values ranging from 0.46 to 0.80 when compared with the FSC reference from the Landsat-8 OLI data using the SNOWMAP method. The overall accuracy of the FY-2E/F VISSR FSC ranges broadly from 0.55 to 0.92 depending upon the validation region.
Although the performance of the FY-2E/F VISSR FSC at 0.05° resolution finds it difficult to meet an error of 0.10 or less, which is recommended by the National Research Council [56], it still provides complementary estimates when low Earth orbit (LEO) optical sensors encounter clouds that move quickly. Combining well-developed Terra/Aqua MODIS FSC results with the FSC derived from the FY-2E/F VISSR multitemporal observations probably generate a daily FSC product with a substantially improved spatiotemporal continuity, which should hopefully alleviate the obscuring effects of clouds and enhance the reliability.
Acknowledgments
This study was supported by the National Basic Research Program of China (2015CB953701), the National Natural Science Foundation of China (41671334), and the National Basic Survey Program of China (2017FY100502).
Author Contributions
Gongxue Wang performed the study and wrote the manuscript. Lingmei Jiang conceived the study and provided supervision during manuscript construction and revision. Shengli Wu and Jiancheng Shi gave insightful suggestions in processing data and developing methodology. Shirui Hao and Xiaojing Liu participated in the validation work.
Conflicts of Interest
The authors declare no conflict of interest.
References
- Barnett, T.P.; Adam, J.C.; Lettenmaier, D.P. Potential impacts of a warming climate on water availability in snow-dominated regions. Nature 2005, 438, 303–309. [Google Scholar] [CrossRef] [PubMed]
- Liston, G.E. Interrelationships among snow distribution, snowmelt, and snow cover depletion: Implications for atmospheric, hydrologic, and ecologic modeling. J. Appl. Meteorol. 1999, 38, 1474–1487. [Google Scholar] [CrossRef]
- Estilow, T.W.; Young, A.H.; Robinson, D.A. A long-term Northern Hemisphere snow cover extent data record for climate studies and monitoring. Earth Syst. Sci. Data 2015, 7, 137–142. [Google Scholar] [CrossRef]
- Pomeroy, J.; Gray, D.; Shook, K.; Toth, B.; Essery, R.; Pietroniro, A.; Hedstrom, N. An evaluation of snow accumulation and ablation processes for land surface modelling. Hydrol. Process. 1998, 12, 2339–2367. [Google Scholar] [CrossRef]
- Ling, F.; Zhang, T. A numerical model for surface energy balance and thermal regime of the active layer and permafrost containing unfrozen water. Cold Reg. Sci. Technol. 2004, 38, 1–15. [Google Scholar] [CrossRef]
- Rohrer, M.; Salzmann, N.; Stoffel, M.; Kulkarni, A.V. Missing (In-Situ) snow cover data hampers climate change and runoff studies in the Greater Himalayas. Sci. Total Environ. 2013, 468–469, S60–S70. [Google Scholar] [CrossRef] [PubMed]
- Dedieu, J.P.; Lessard-Fontaine, A.; Ravazzani, G.; Cremonese, E.; Shalpykova, G.; Beniston, M. Shifting mountain snow patterns in a changing climate from remote sensing retrieval. Sci. Total Environ. 2014, 493, 1267–1279. [Google Scholar] [CrossRef] [PubMed]
- Chen, X.; Jiang, L.; Yang, J.; Pan, J. Validation of ice mapping system snow cover over southern China based on Landsat Enhanced Thematic Mapper Plus imagery. J. Appl. Remote Sens. 2014, 8, 084680. [Google Scholar] [CrossRef]
- Shi, J.; Jiang, L.; Yang, J. Monitoring daily snow cover for disaster mitigation purposes. SPIE Newsroom 2012. [Google Scholar] [CrossRef]
- Dozier, J. Spectral signature of alpine snow cover from the landsat thematic mapper. Remote Sens. Environ. 1989, 28, 9–22. [Google Scholar] [CrossRef]
- Salomonson, V.V.; Appel, I. Estimating fractional snow cover from MODIS using the normalized difference snow index. Remote Sens. Environ. 2004, 89, 351–360. [Google Scholar] [CrossRef]
- Salomonson, V.V.; Appel, I. Development of the Aqua MODIS NDSI fractional snow cover algorithm and validation results. IEEE. Trans. Geosci. Remote 2006, 44, 1747–1756. [Google Scholar] [CrossRef]
- Hall, D.K.; Riggs, G.A. Accuracy assessment of the MODIS snow products. Hydrol. Process. 2007, 21, 1534–1547. [Google Scholar] [CrossRef]
- Dong, C.; Menzel, L. Improving the accuracy of MODIS 8-day snow products with in situ temperature and precipitation data. J. Hydrol. 2016, 534, 466–477. [Google Scholar] [CrossRef]
- Dong, C.; Menzel, L. Producing cloud-free MODIS snow cover products with conditional probability interpolation and meteorological data. Remote Sens. Environ. 2016, 186, 439–451. [Google Scholar] [CrossRef]
- Nolin, A.W.; Dozier, J.; Mertes, L.A. Mapping alpine snow using a spectral mixture modeling technique. Ann. Glaciol. 1993, 17, 121–124. [Google Scholar] [CrossRef]
- Painter, T.H.; Dozier, J.; Roberts, D.A.; Davis, R.E.; Green, R.O. Retrieval of subpixel snow-covered area and grain size from imaging spectrometer data. Remote Sens. Environ. 2003, 85, 64–77. [Google Scholar] [CrossRef]
- Painter, T.H.; Rittger, K.; McKenzie, C.; Slaughter, P.; Davis, R.E.; Dozier, J. Retrieval of subpixel snow covered area, grain size, and albedo from MODIS. Remote Sens. Environ. 2009, 113, 868–879. [Google Scholar] [CrossRef]
- Rittger, K.; Painter, T.H.; Dozier, J. Assessment of methods for mapping snow cover from MODIS. Adv. Water Resour. 2013, 51, 367–380. [Google Scholar] [CrossRef]
- Shi, J. An automatic algorithm on estimating sub-pixel snow cover from MODIS. Quat. Sci. 2012, 32, 6–15. [Google Scholar]
- Zhu, J.; Shi, J.; Wang, Y. Subpixel snow mapping of the Qinghai–Tibet Plateau using MODIS data. Int. J. Appl. Earth Obs. 2012, 18, 251–262. [Google Scholar] [CrossRef]
- Parajka, J.; Blöschl, G. Spatio-temporal combination of MODIS images—Potential for snow cover mapping. Water Resour. Res. 2008, 44. [Google Scholar] [CrossRef]
- Wang, X.; Xie, H.; Liang, T.; Huang, X. Comparison and validation of MODIS standard and new combination of Terra and Aqua snow cover products in northern Xinjiang, China. Hydrol. Process. 2009, 23, 419–429. [Google Scholar] [CrossRef]
- Shi, J.; Dozier, J.; Rott, H. Snow mapping in alpine regions with synthetic aperture radar. IEEE Trans. Geosci. Remote Sens. 1994, 32, 152–158. [Google Scholar]
- Nagler, T.; Rott, H. Retrieval of wet snow by means of multitemporal SAR data. IEEE Trans. Geosci. Remote Sens. 2000, 38, 754–765. [Google Scholar] [CrossRef]
- Rondeau-Genesse, G.; Trudel, M.; Leconte, R. Monitoring snow wetness in an Alpine Basin using combined C-band SAR and MODIS data. Remote Sens. Environ. 2016, 183, 304–317. [Google Scholar] [CrossRef]
- Chang, A.; Foster, J.; Hall, D.K. Nimbus-7 SMMR derived global snow cover parameters. Ann. Glaciol. 1987, 9, 39–44. [Google Scholar] [CrossRef]
- Kelly, R.E.; Chang, A.T.; Leung, T.; Foster, J.L. A prototype AMSR-E global snow area and snow depth algorithm. IEEE Trans. Geosci. Remote Sens. 2003, 41, 230–242. [Google Scholar] [CrossRef]
- Jiang, L.; Wang, P.; Zhang, L.; Yang, H.; Yang, J. Improvement of snow depth retrieval for FY3B-MWRI in China. Sci. China Earth Sci. 2014, 57, 1278–1292. [Google Scholar] [CrossRef]
- Wang, G.; Jiang, L.; Wu, S.; Liu, X.; Hao, S. Intercalibrating FY-3B and FY-3C/MWRI for synergistic implementing to snow depth retrieval algorithm. Remot. Sens. Technol. Appl. 2017, 32, 49–56. [Google Scholar]
- Liang, T.; Zhang, X.; Xie, H.; Wu, C.; Feng, Q.; Huang, X.; Chen, Q. Toward improved daily snow cover mapping with advanced combination of MODIS and AMSR-E measurements. Remote Sens. Environ. 2008, 112, 3750–3761. [Google Scholar] [CrossRef]
- Gao, Y.; Xie, H.; Yao, T.; Xue, C. Integrated assessment on multi-temporal and multi-sensor combinations for reducing cloud obscuration of MODIS snow cover products of the Pacific Northwest USA. Remote Sens. Environ. 2010, 114, 1662–1675. [Google Scholar] [CrossRef]
- Gao, Y.; Xie, H.; Lu, N.; Yao, T.; Liang, T. Toward advanced daily cloud-free snow cover and snow water equivalent products from Terra–Aqua MODIS and Aqua AMSR-E measurements. J. Hydrol. 2010, 385, 23–35. [Google Scholar] [CrossRef]
- Bergeron, J.; Royer, A.; Turcotte, R.; Roy, A. Snow cover estimation using blended MODIS and AMSR-E data for improved watershed-scale spring streamflow simulation in Quebec, Canada. Hydrol. Process. 2014, 28, 4626–4639. [Google Scholar] [CrossRef]
- Wang, W.; Huang, X.; Deng, J.; Xie, H.; Liang, T. Spatio-temporal change of snow cover and its response to climate over the Tibetan Plateau based on an improved daily cloud-free snow cover product. Remote Sens. 2014, 7, 169–194. [Google Scholar] [CrossRef]
- Romanov, P.; Gutman, G.; Csiszar, I. Automated monitoring of snow cover over North America with multispectral satellite data. J. Appl. Meteorol. 2000, 39, 1866–1880. [Google Scholar] [CrossRef]
- Romanov, P.; Gutman, G.; Csiszar, I. Satellite-derived snow cover maps for North America: Accuracy assessment. Adv. Space Res. 2002, 30, 2455–2460. [Google Scholar] [CrossRef]
- Romanov, P.; Tarpley, D.; Gutman, G.; Carroll, T. Mapping and monitoring of the snow cover fraction over North America. J. Geophys. Res. Atmos. 2003, 108. [Google Scholar] [CrossRef]
- Romanov, P.; Tarpley, D. Enhanced algorithm for estimating snow depth from geostationary satellites. Remote Sens. Environ. 2007, 108, 97–110. [Google Scholar] [CrossRef]
- Ramsay, B.H. The interactive multisensor snow and ice mapping system. Hydrol. Process. 1998, 12, 1537–1546. [Google Scholar] [CrossRef]
- Helfrich, S.R.; McNamara, D.; Ramsay, B.H.; Baldwin, T.; Kasheta, T. Enhancements to, and forthcoming developments in the Interactive Multisensor Snow and Ice Mapping System (IMS). Hydrol. Process. 2007, 21, 1576–1586. [Google Scholar] [CrossRef]
- De Ruyter de Wildt, M.; Seiz, G.; Gruen, A. Operational snow mapping using multitemporal Meteosat SEVIRI imagery. Remote Sens. Environ. 2007, 109, 29–41. [Google Scholar] [CrossRef]
- Siljamo, N.; Hyvärinen, O. New geostationary satellite-based snow-cover algorithm. J. Appl. Meteorol. Clim. 2011, 50, 1275–1290. [Google Scholar] [CrossRef]
- Yang, J.; Jiang, L.; Wu, F.; Sun, R. Monitoring snow cover over China with MTSAT-2 geostationary satellite. J. Remot. Sens. 2013, 17, 1264–1280. [Google Scholar]
- Yang, J.; Jiang, L.; Shi, J.; Wu, S.; Sun, R.; Yang, H. Monitoring snow cover using Chinese meteorological satellite data over China. Remote Sens. Environ. 2014, 143, 192–203. [Google Scholar] [CrossRef]
- Hall, D.K.; Riggs, G.A.; Salomonson, V.V.; DiGirolamo, N.E.; Bayr, K.J. MODIS snow-cover products. Remote Sens. Environ. 2002, 83, 181–194. [Google Scholar] [CrossRef]
- Klein, A.G.; Hall, D.K.; Riggs, G.A. Improving snow cover mapping in forests through the use of a canopy reflectance model. Hydrol. Process. 1998, 12, 1723–1744. [Google Scholar] [CrossRef]
- Reuter, H.I.; Nelson, A.; Jarvis, A. An evaluation of void-filling interpolation methods for SRTM data. Int. J. Geogr. Inf. Sci. 2007, 21, 983–1008. [Google Scholar] [CrossRef]
- Li, S.; Yan, H.; Liu, C. Study of snow detection using FY-2C satellite data. J. Remot. Sens. 2007, 11, 406–413. [Google Scholar]
- Li, P.; Mi, D. Distribution of snow cover in China. J. Glaciol. Geocryol. 1983, 4, 9–17. [Google Scholar]
- Metsämäki, S.; Pulliainen, J.; Salminen, M.; Luojus, K.; Wiesmann, A.; Solberg, R.; Böttcher, K.; Hiltunen, M.; Ripper, E. Introduction to GlobSnow Snow Extent products with considerations for accuracy assessment. Remote Sens. Environ. 2015, 156, 96–108. [Google Scholar] [CrossRef]
- Tekeli, A.E.; Akyürek, Z.; Arda Şorman, A.; Şensoy, A.; Ünal Şorman, A. Using MODIS snow cover maps in modeling snowmelt runoff process in the eastern part of Turkey. Remote Sens. Environ. 2005, 97, 216–230. [Google Scholar] [CrossRef]
- Rango, A.; Martinec, J. Application of a snowmelt-runoff model using Landsat data. Hydrol. Res. 1979, 10, 225–238. [Google Scholar]
- Hall, D.K.; Riggs, G.A.; Foster, J.L.; Kumar, S.V. Development and evaluation of a cloud-gap-filled MODIS daily snow-cover product. Remote Sens. Environ. 2010, 114, 496–503. [Google Scholar] [CrossRef]
- Yang, J.; Jiang, L.; Pan, J.; Zhang, L. Study of monitoring snow cover using GOES geostationary satellite and AMSR-E. Remote Sens. Technol. Appl. 2013, 28, 920–927. [Google Scholar]
- National Research Council. Prospects and Concerns for Satellite Remote Sensing of Snow and Ice; National Academies Press: Washington, DC, USA, 1989. [Google Scholar]
Figure 1.
Land cover types and fractional snow cover (FSC) validation regions of China. OLI: Operational Land Imager.
Figure 1.
Land cover types and fractional snow cover (FSC) validation regions of China. OLI: Operational Land Imager.

Figure 2.
FY-2 binary snow cover algorithm (phase 2).
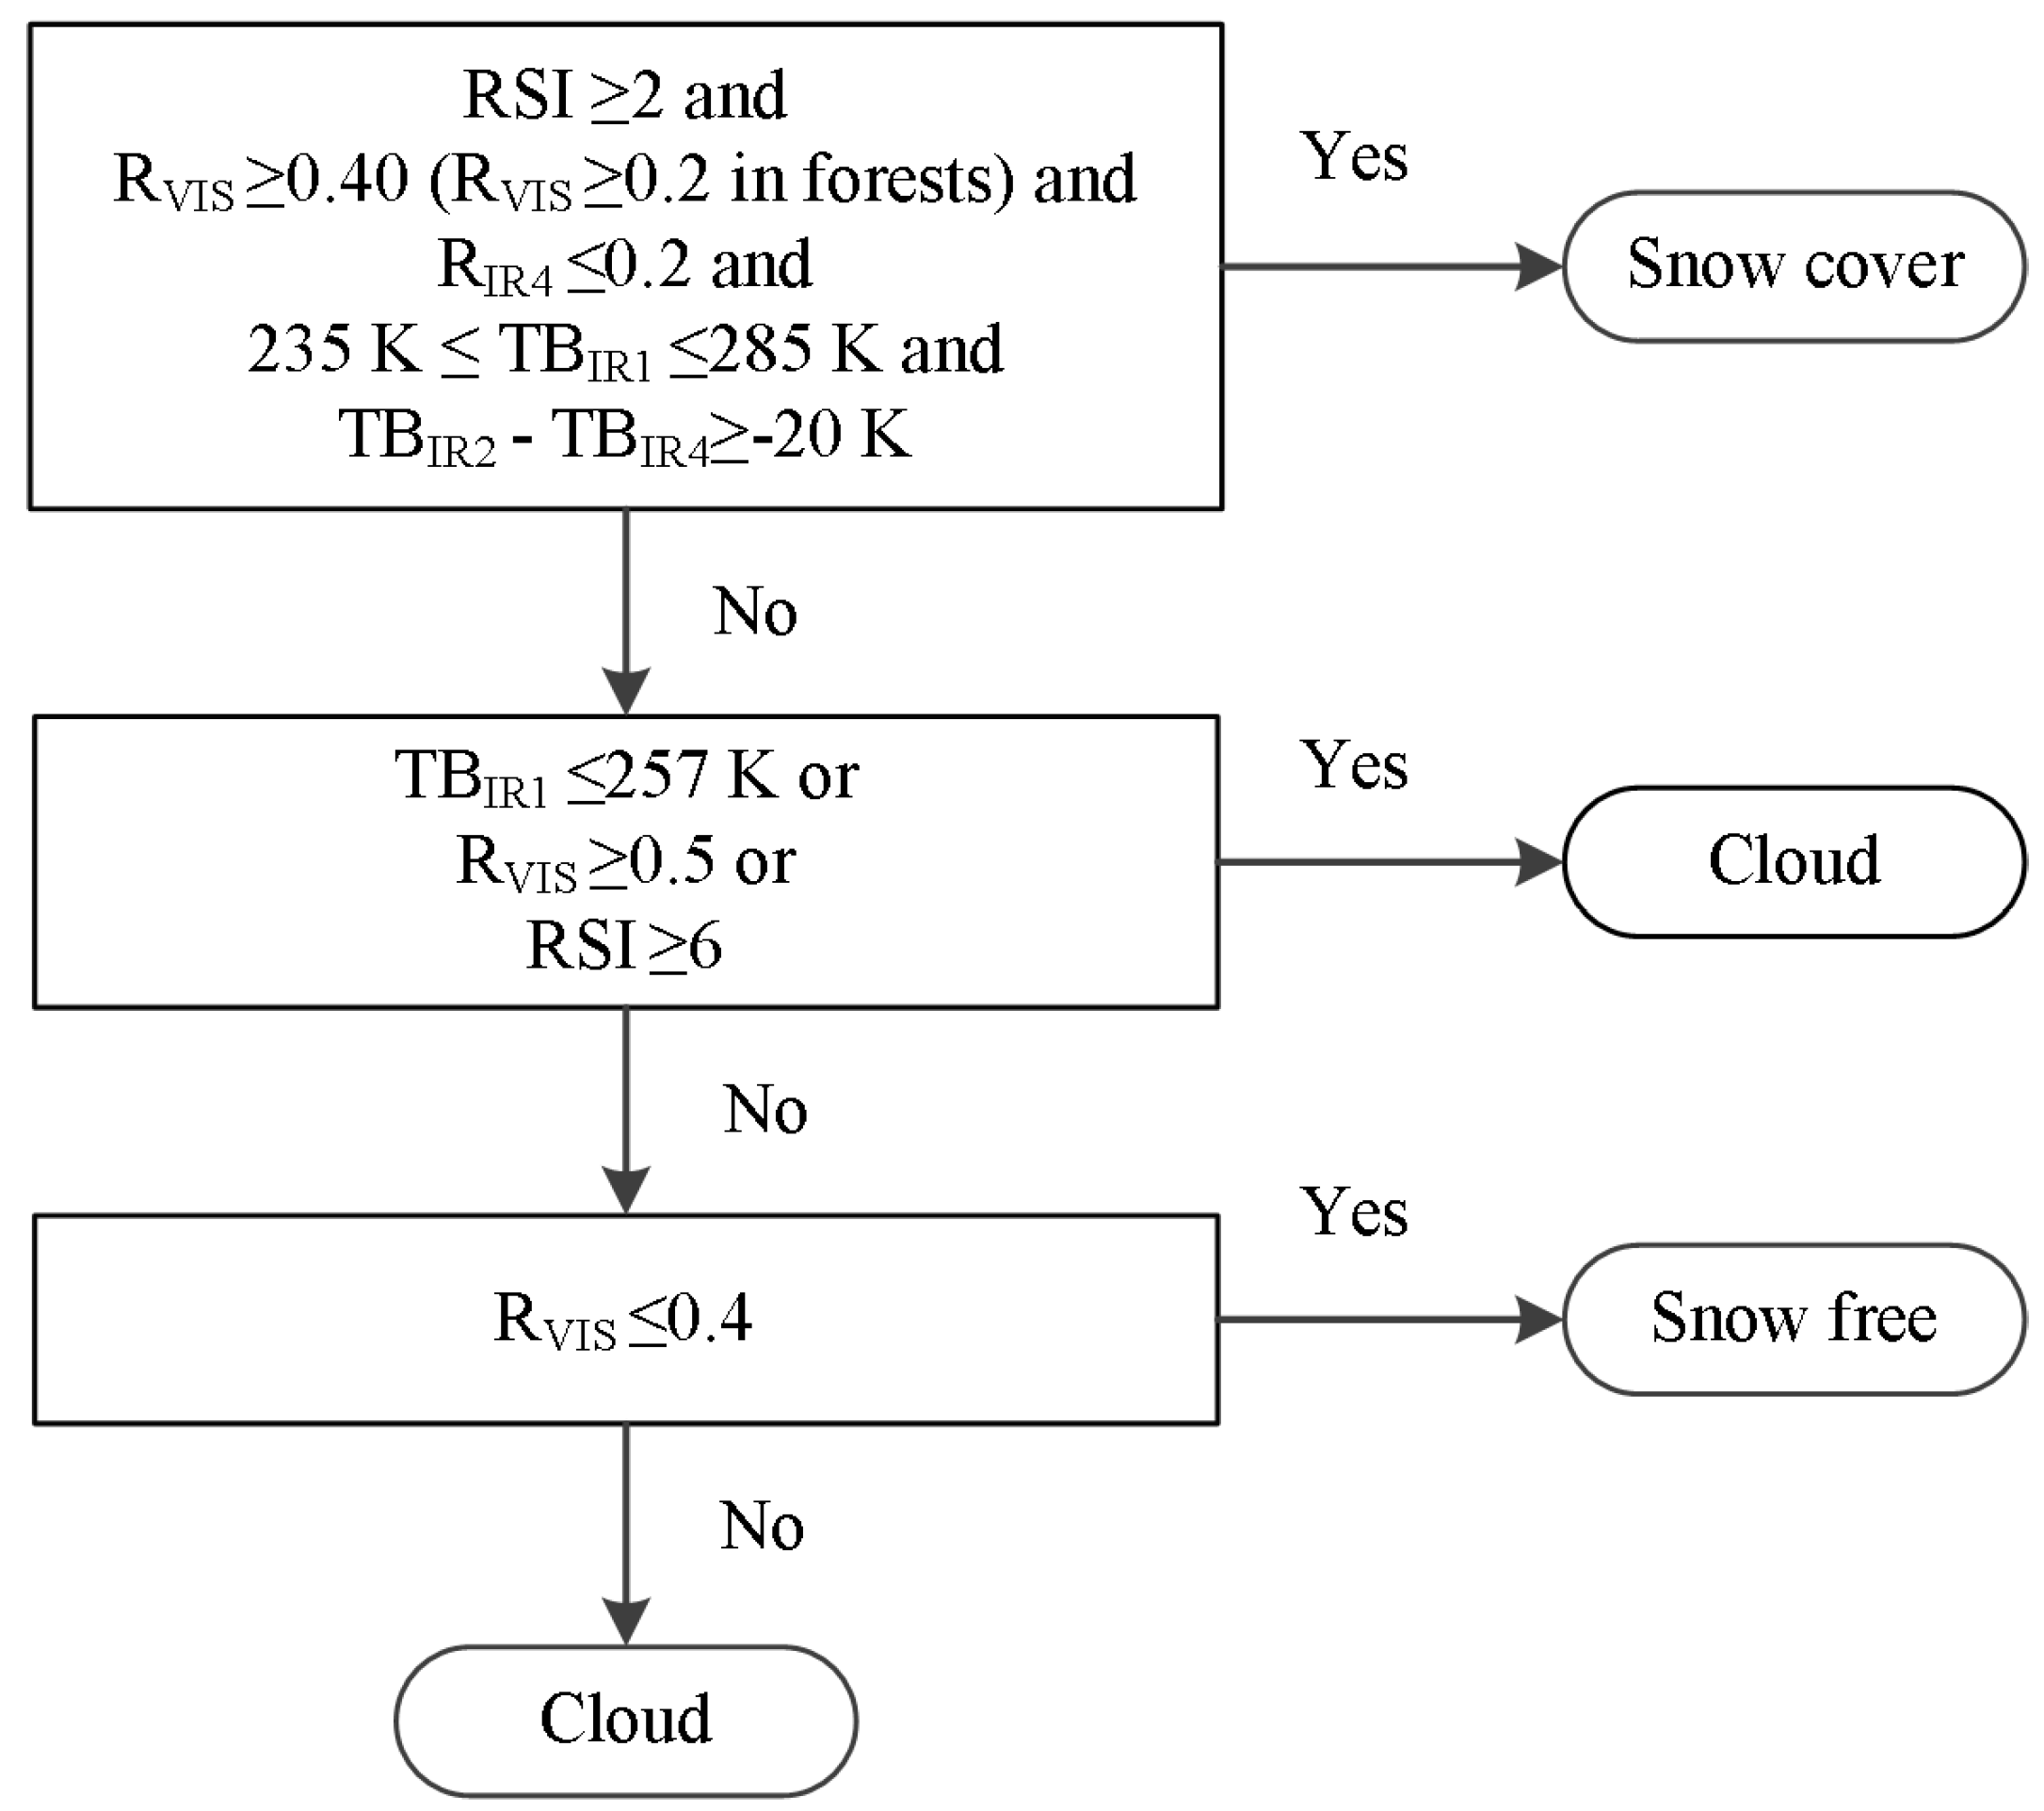
Figure 3.
Comparison of results from Terra Moderate Resolution Imaging Spectroradiometer (MODIS) and FY-2E/F VISSR over the main part of China on 19 February 2014: (a) the false color image of Terra MODIS Band 6, 5, and 4; (b) FSC from Terra MODIS using the multiple end-member spectral mixture analysis (MESMA); (c) daily FSC from the FY-2E VISSR using the linear spectral mixture analysis; and (d) daily FSC from the FY-2F VISSR using the linear spectral mixture analysis.
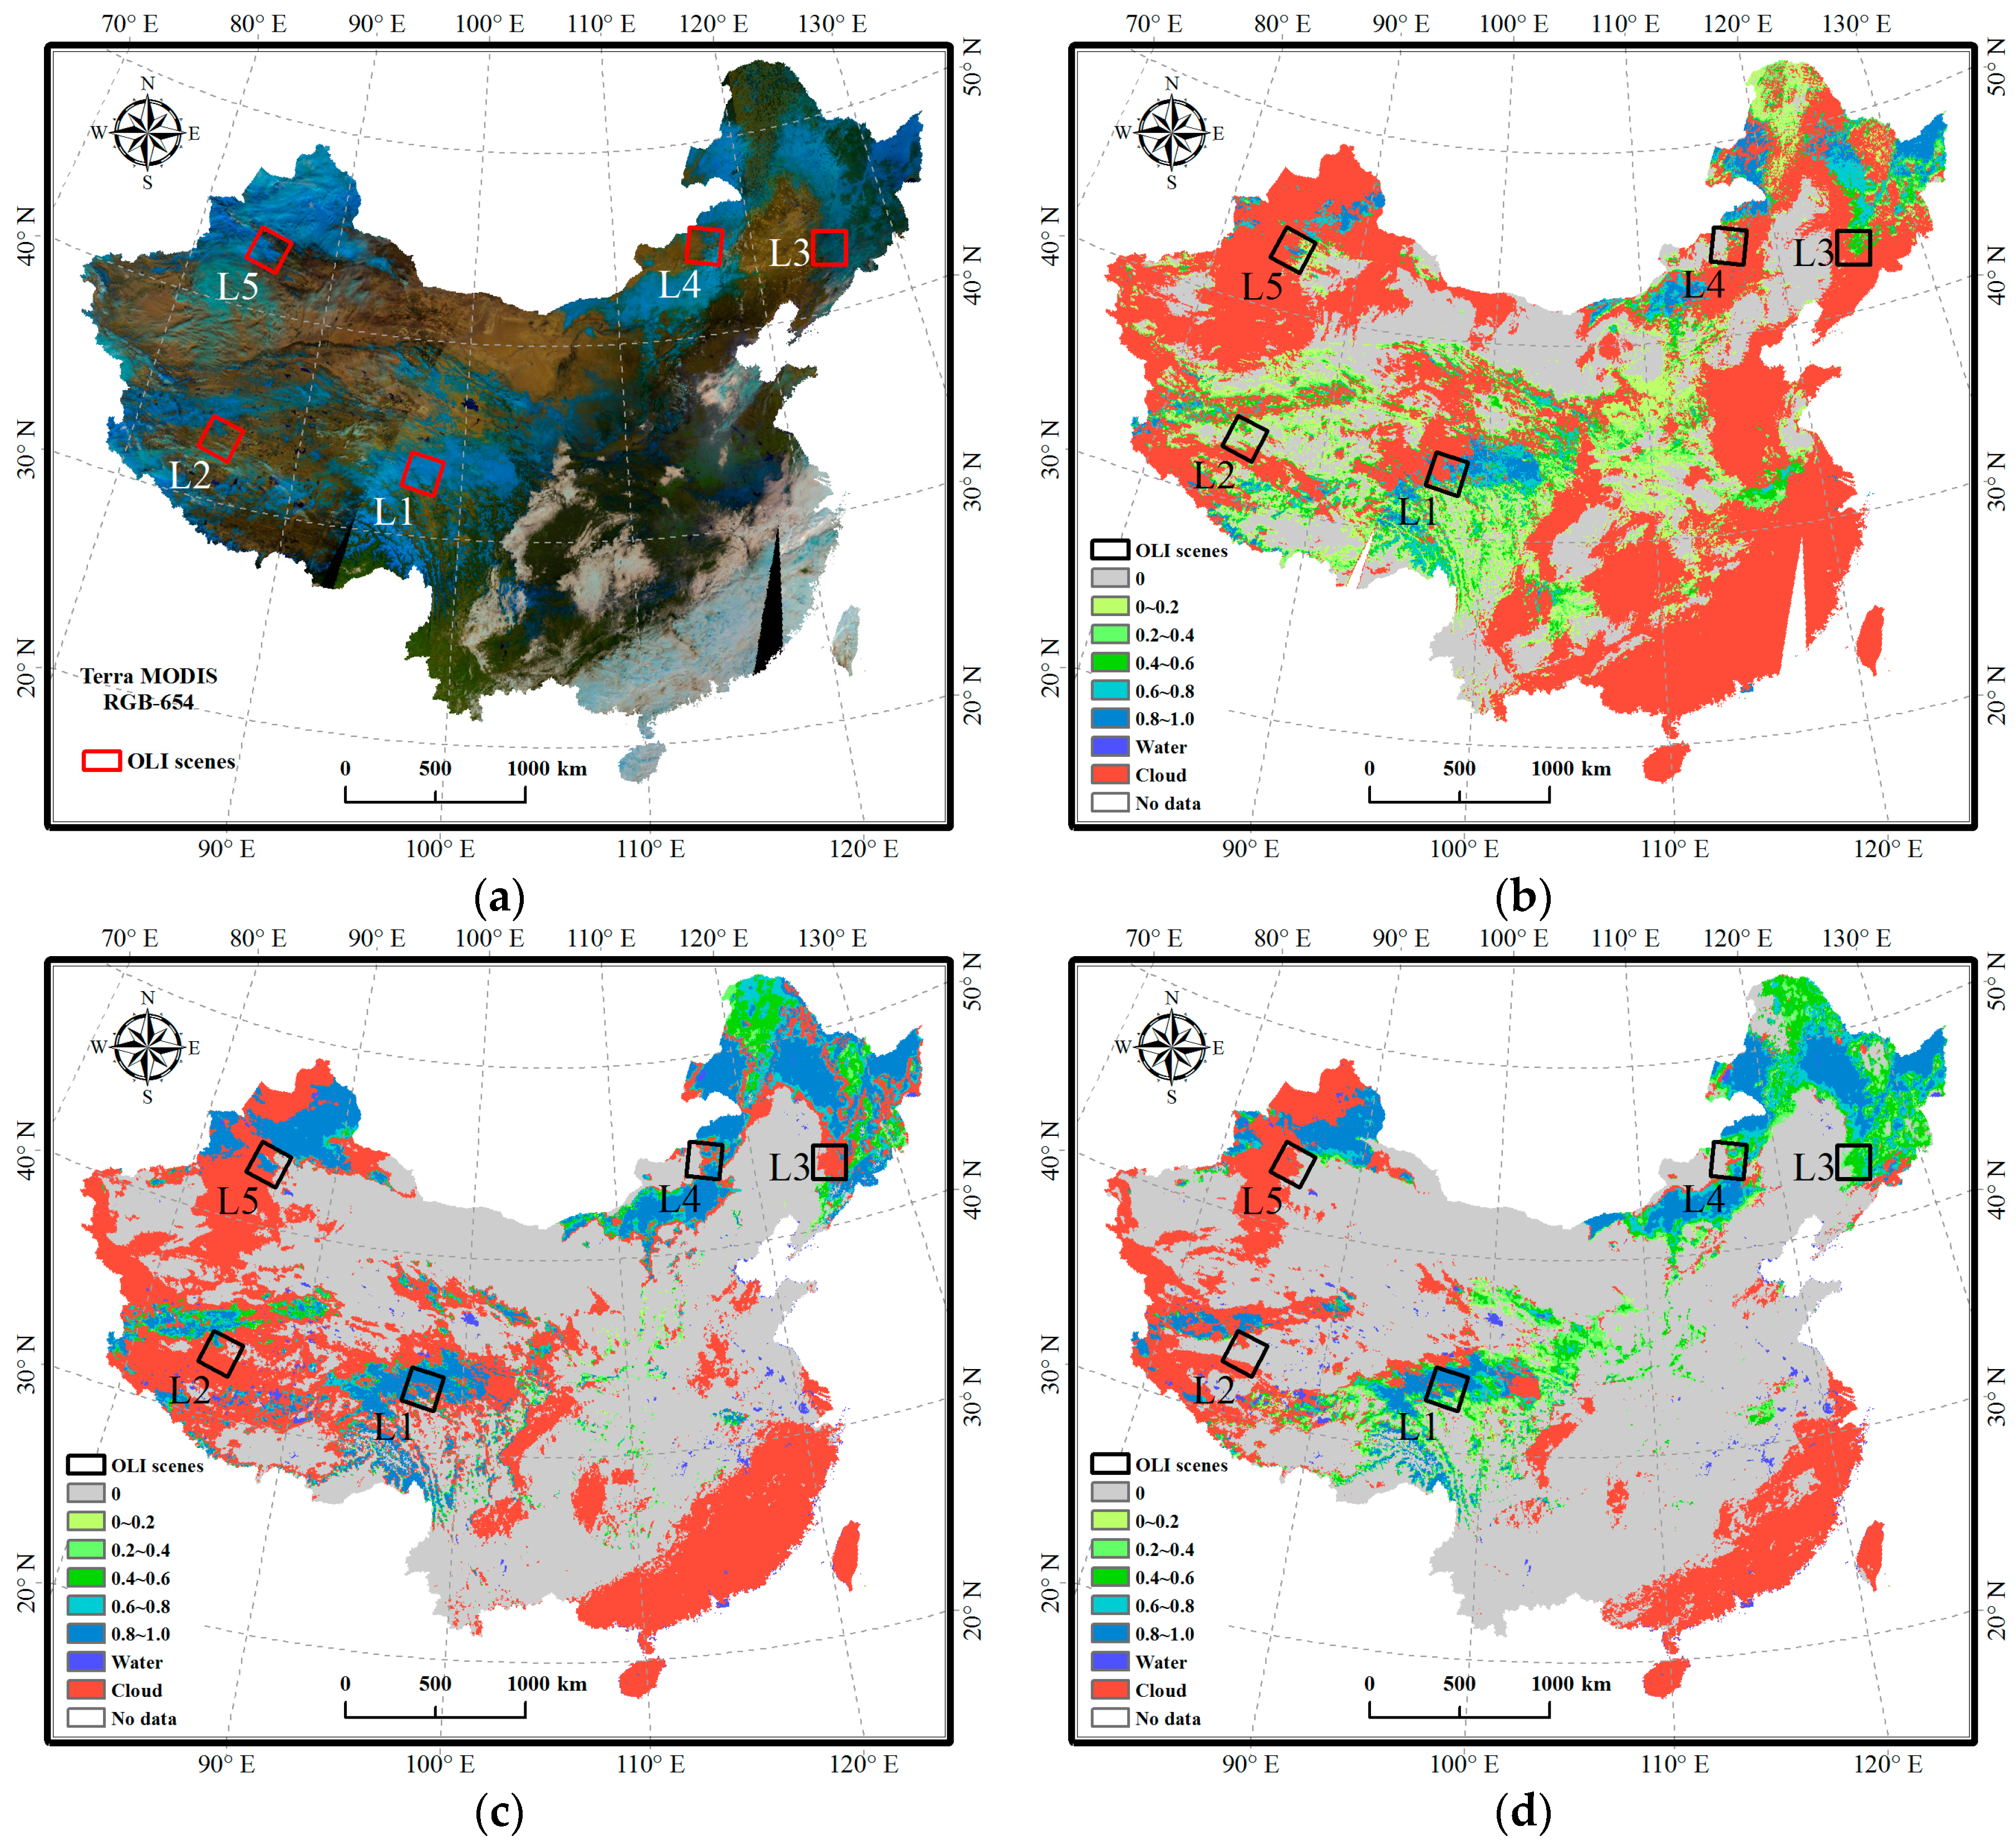
Figure 4.
Scatter plots of the FY-2E (a) and FY-2F (b) FSC results versus the Terra MODIS FSC over the main part of China on 19 February 2014.
Figure 4.
Scatter plots of the FY-2E (a) and FY-2F (b) FSC results versus the Terra MODIS FSC over the main part of China on 19 February 2014.
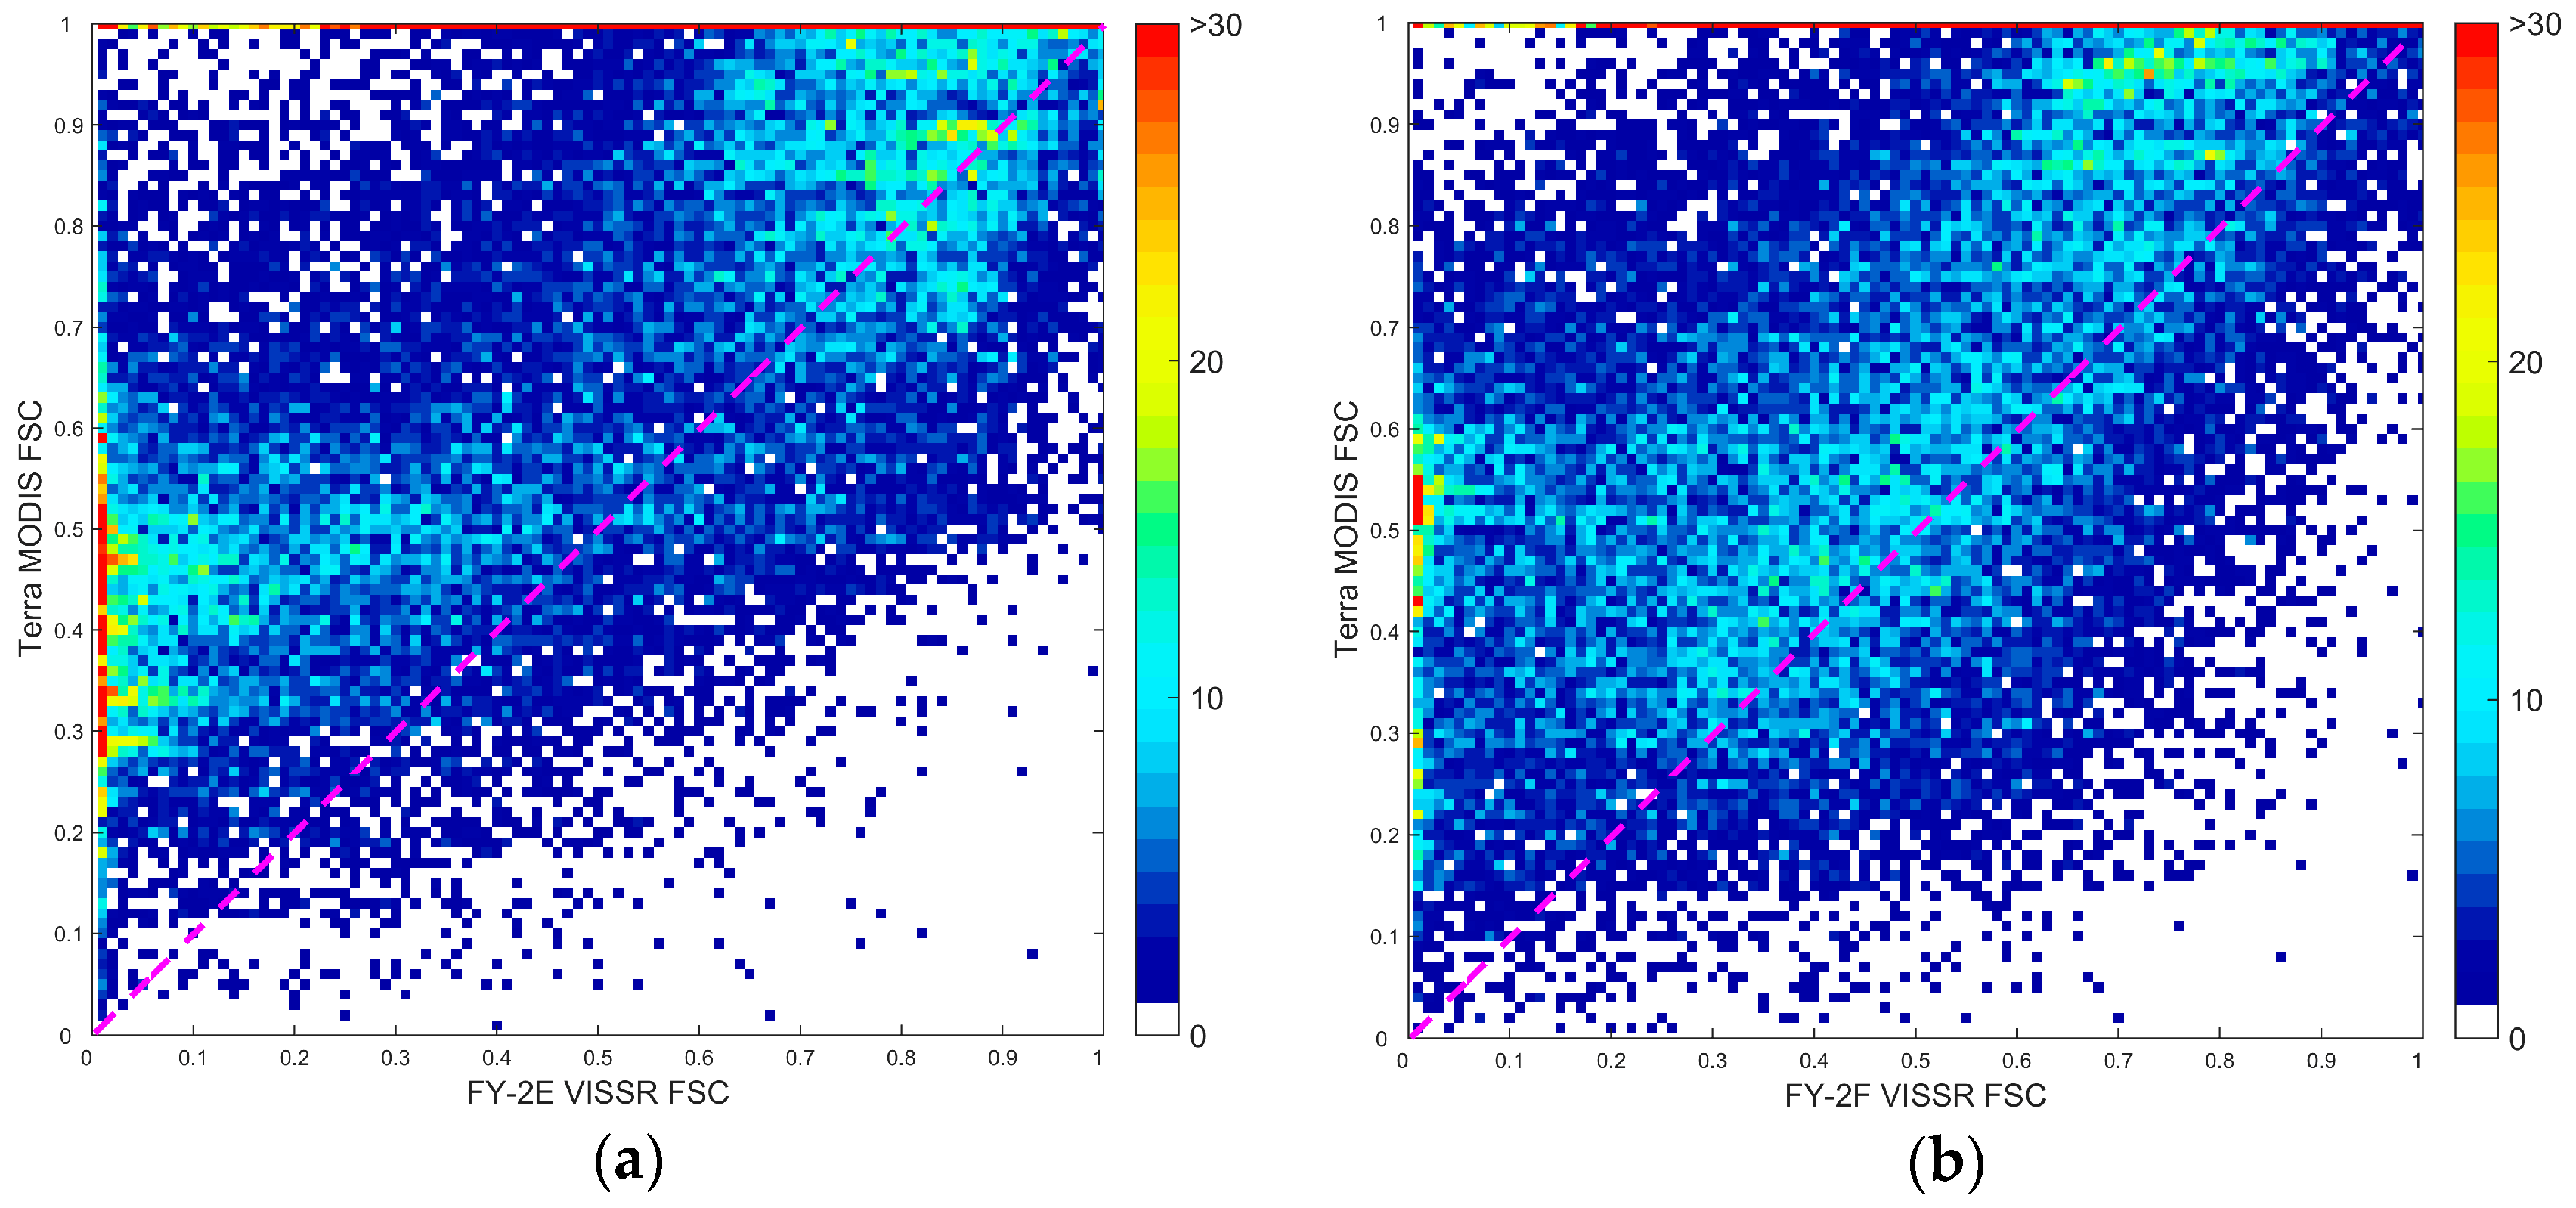
Figure 5.
Comparison of results from Landsat-8 OLI and FY-2E/F VISSR of the region L1 on 20 January 2014: (a) the false color composite of Landsat-8 OLI Band 6, 5, and 3 at Path 134/Row 37; (b) the 0.05° FSC map from Landsat-8 OLI; (c) the FY-2E VISSR FSC map at 03:00 UTC; and (d) the FY-2F VISSR FSC map at 03:30 UTC.
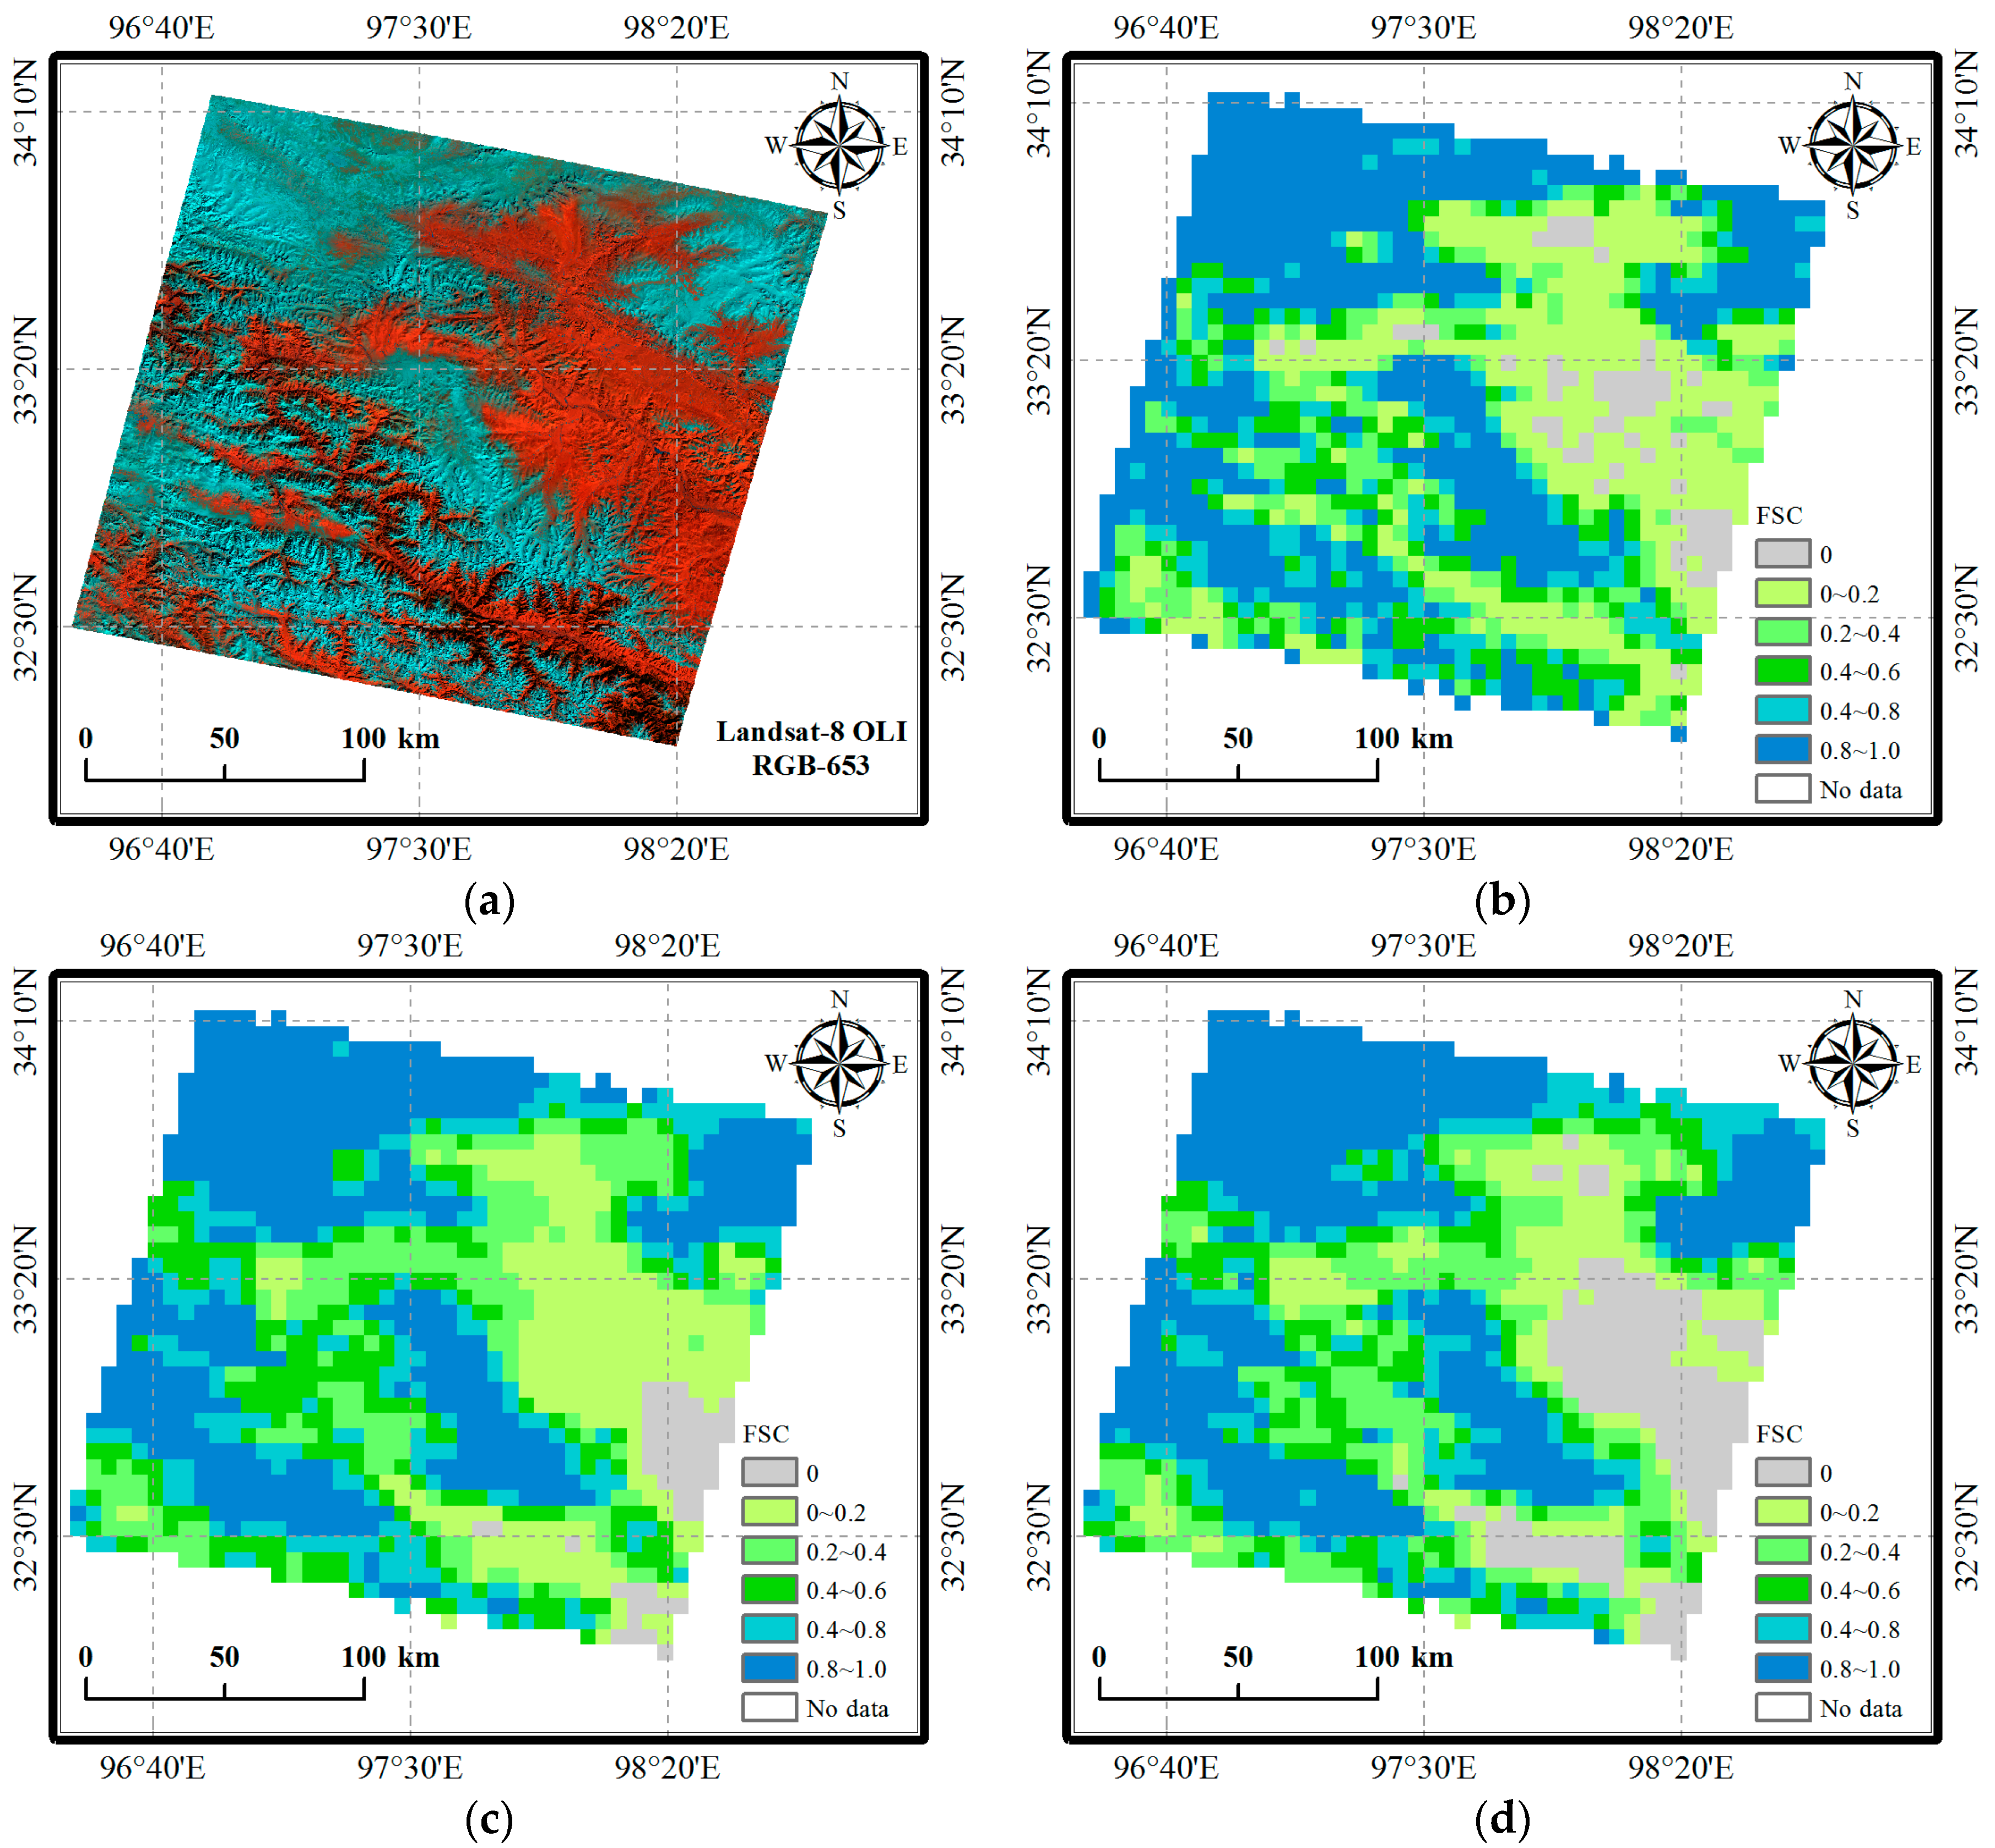
Figure 6.
Comparison of results from Landsat-8 OLI and FY-2E/F VISSR of the region L2 on 28 January 2014: (a) the false color composite of Landsat-8 OLI Band 6, 5, and 3 at Path 142/Row 37; (b) the 0.05° FSC map from Landsat-8 OLI; (c) the FY-2E VISSR FSC map at 04:00 UTC; and (d) the FY-2F VISSR FSC map at 04:30 UTC.
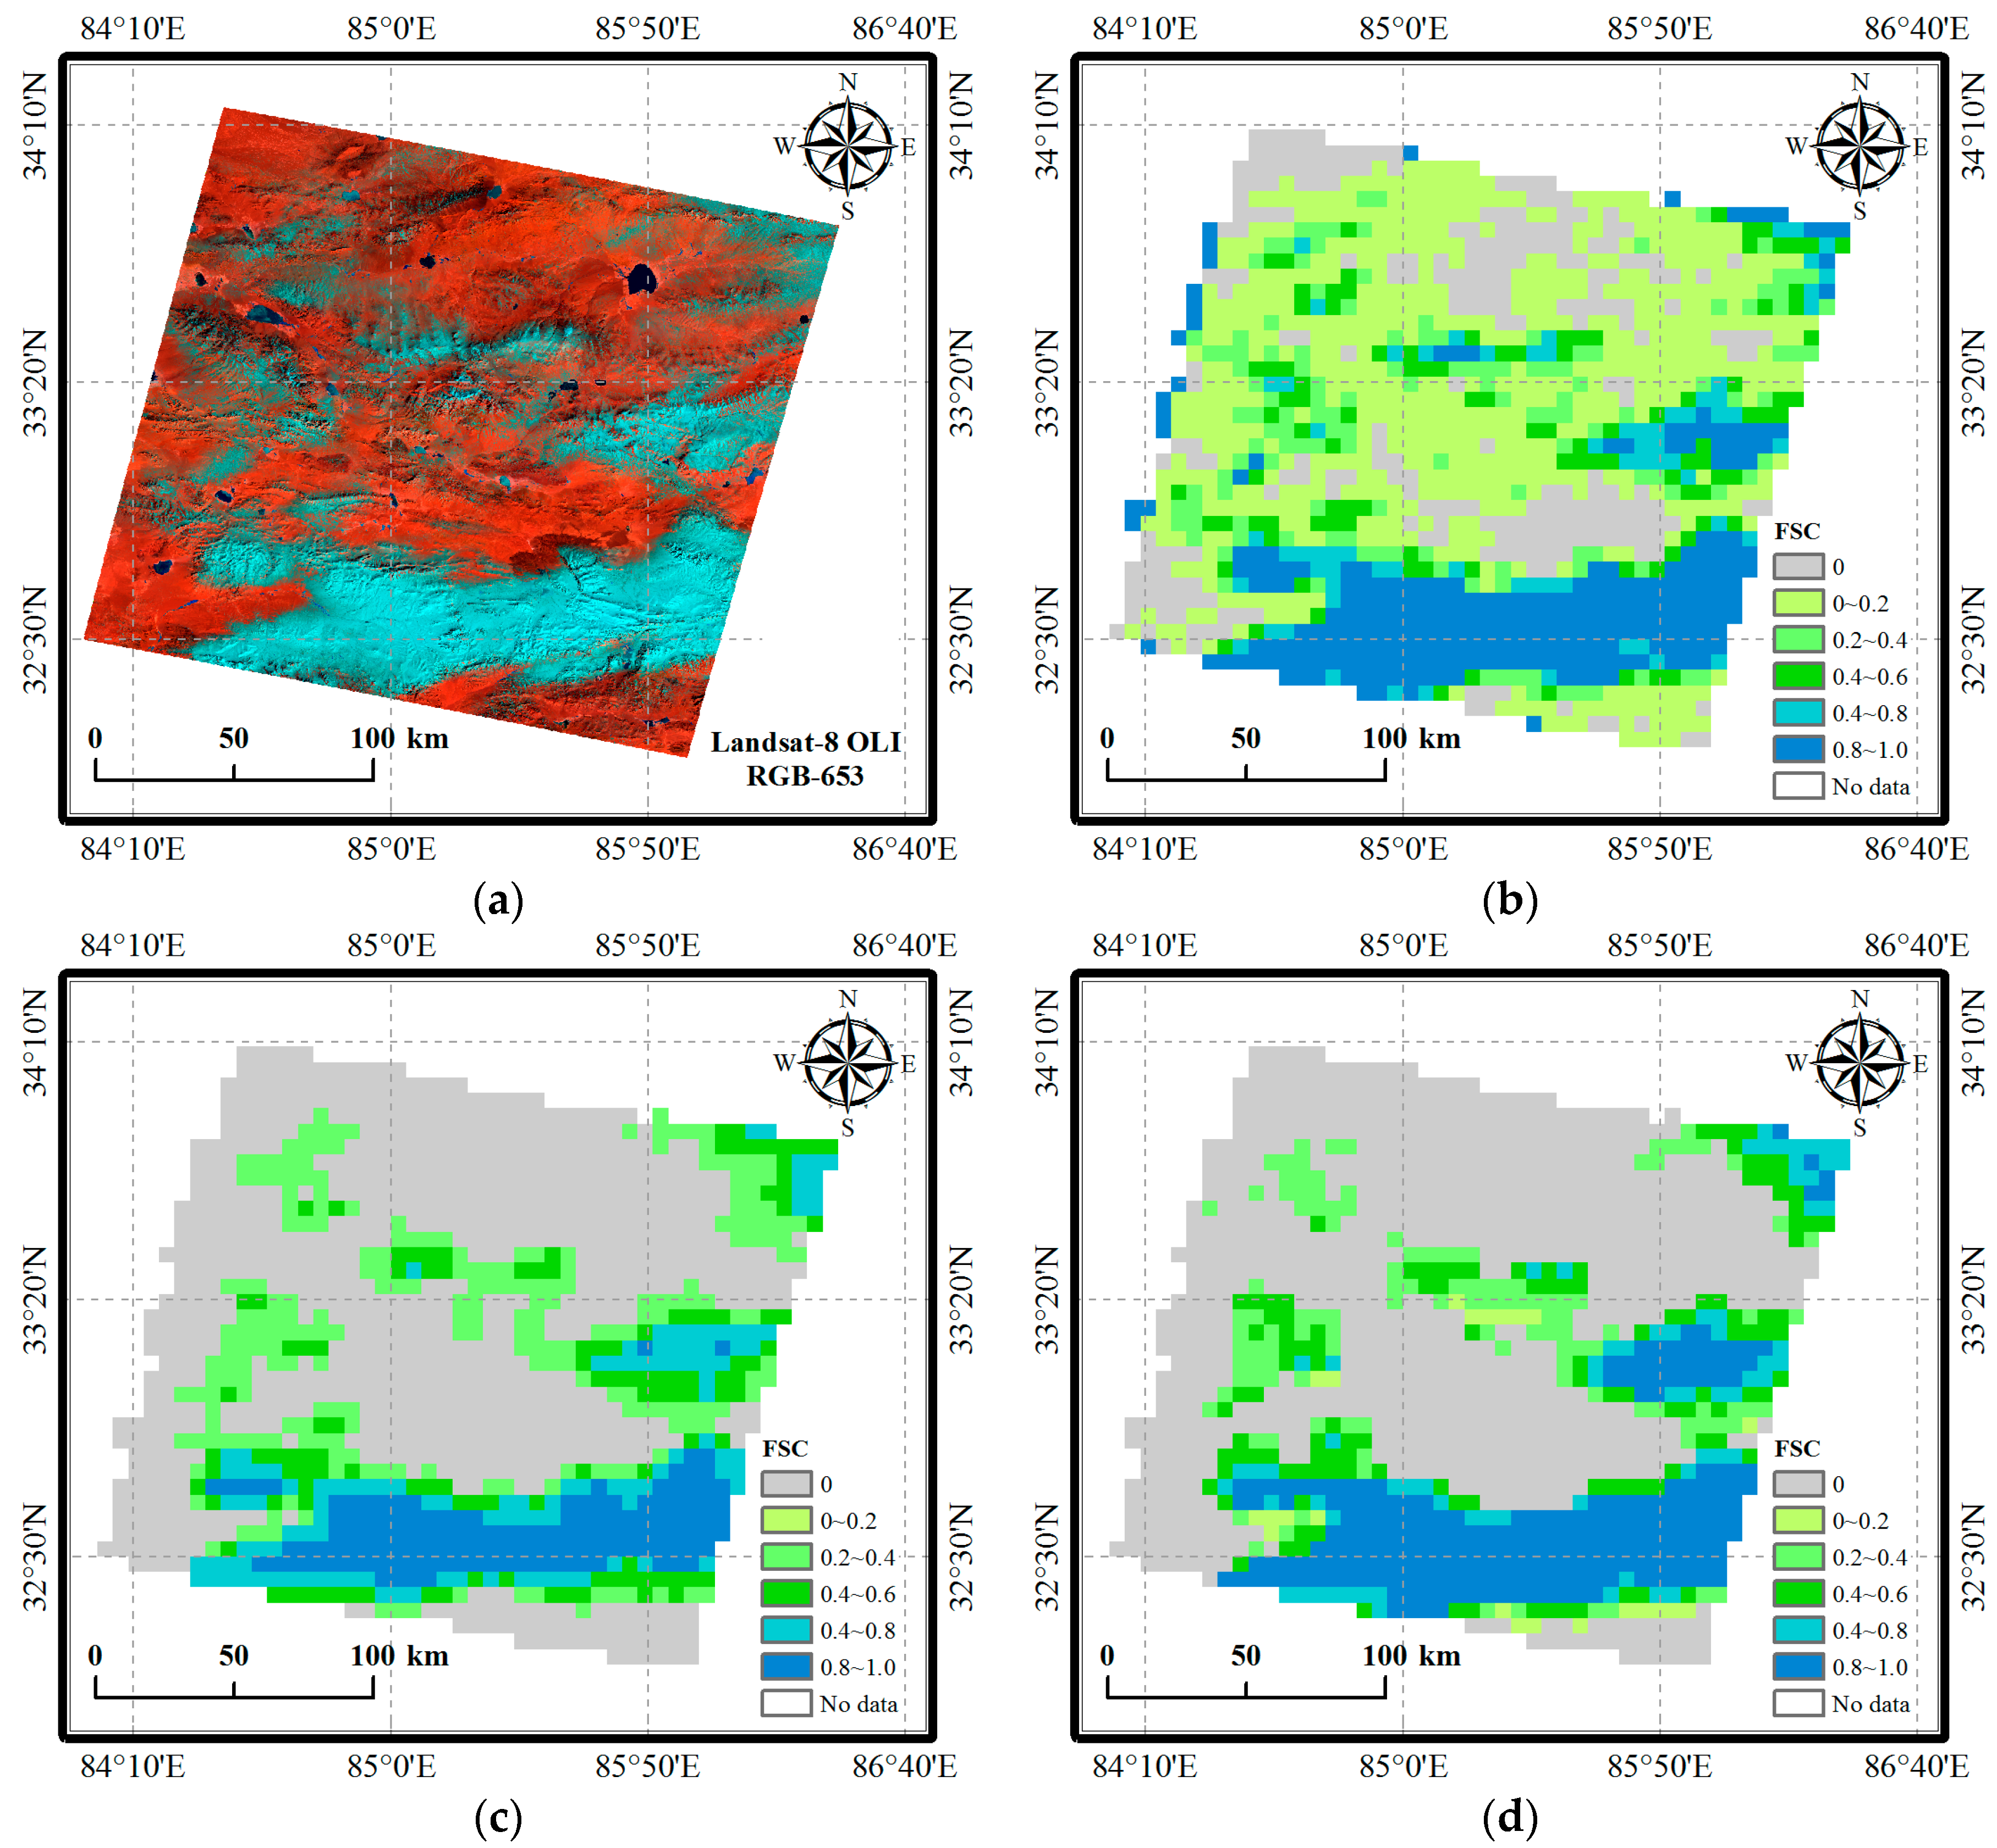
Figure 7.
Comparison of results from Landsat-8 OLI and FY-2E/F VISSR of the region L3 on 21 February 2014: (a) the false color composite of Landsat-8 OLI Band 6, 5, and 3 at Path 118/Row 30; (b) the 0.05° FSC map from Landsat-8 OLI; (c) the FY-2E VISSR FSC map at 02:00 UTC; and (d) the FY-2F VISSR FSC map at 02:30 UTC.
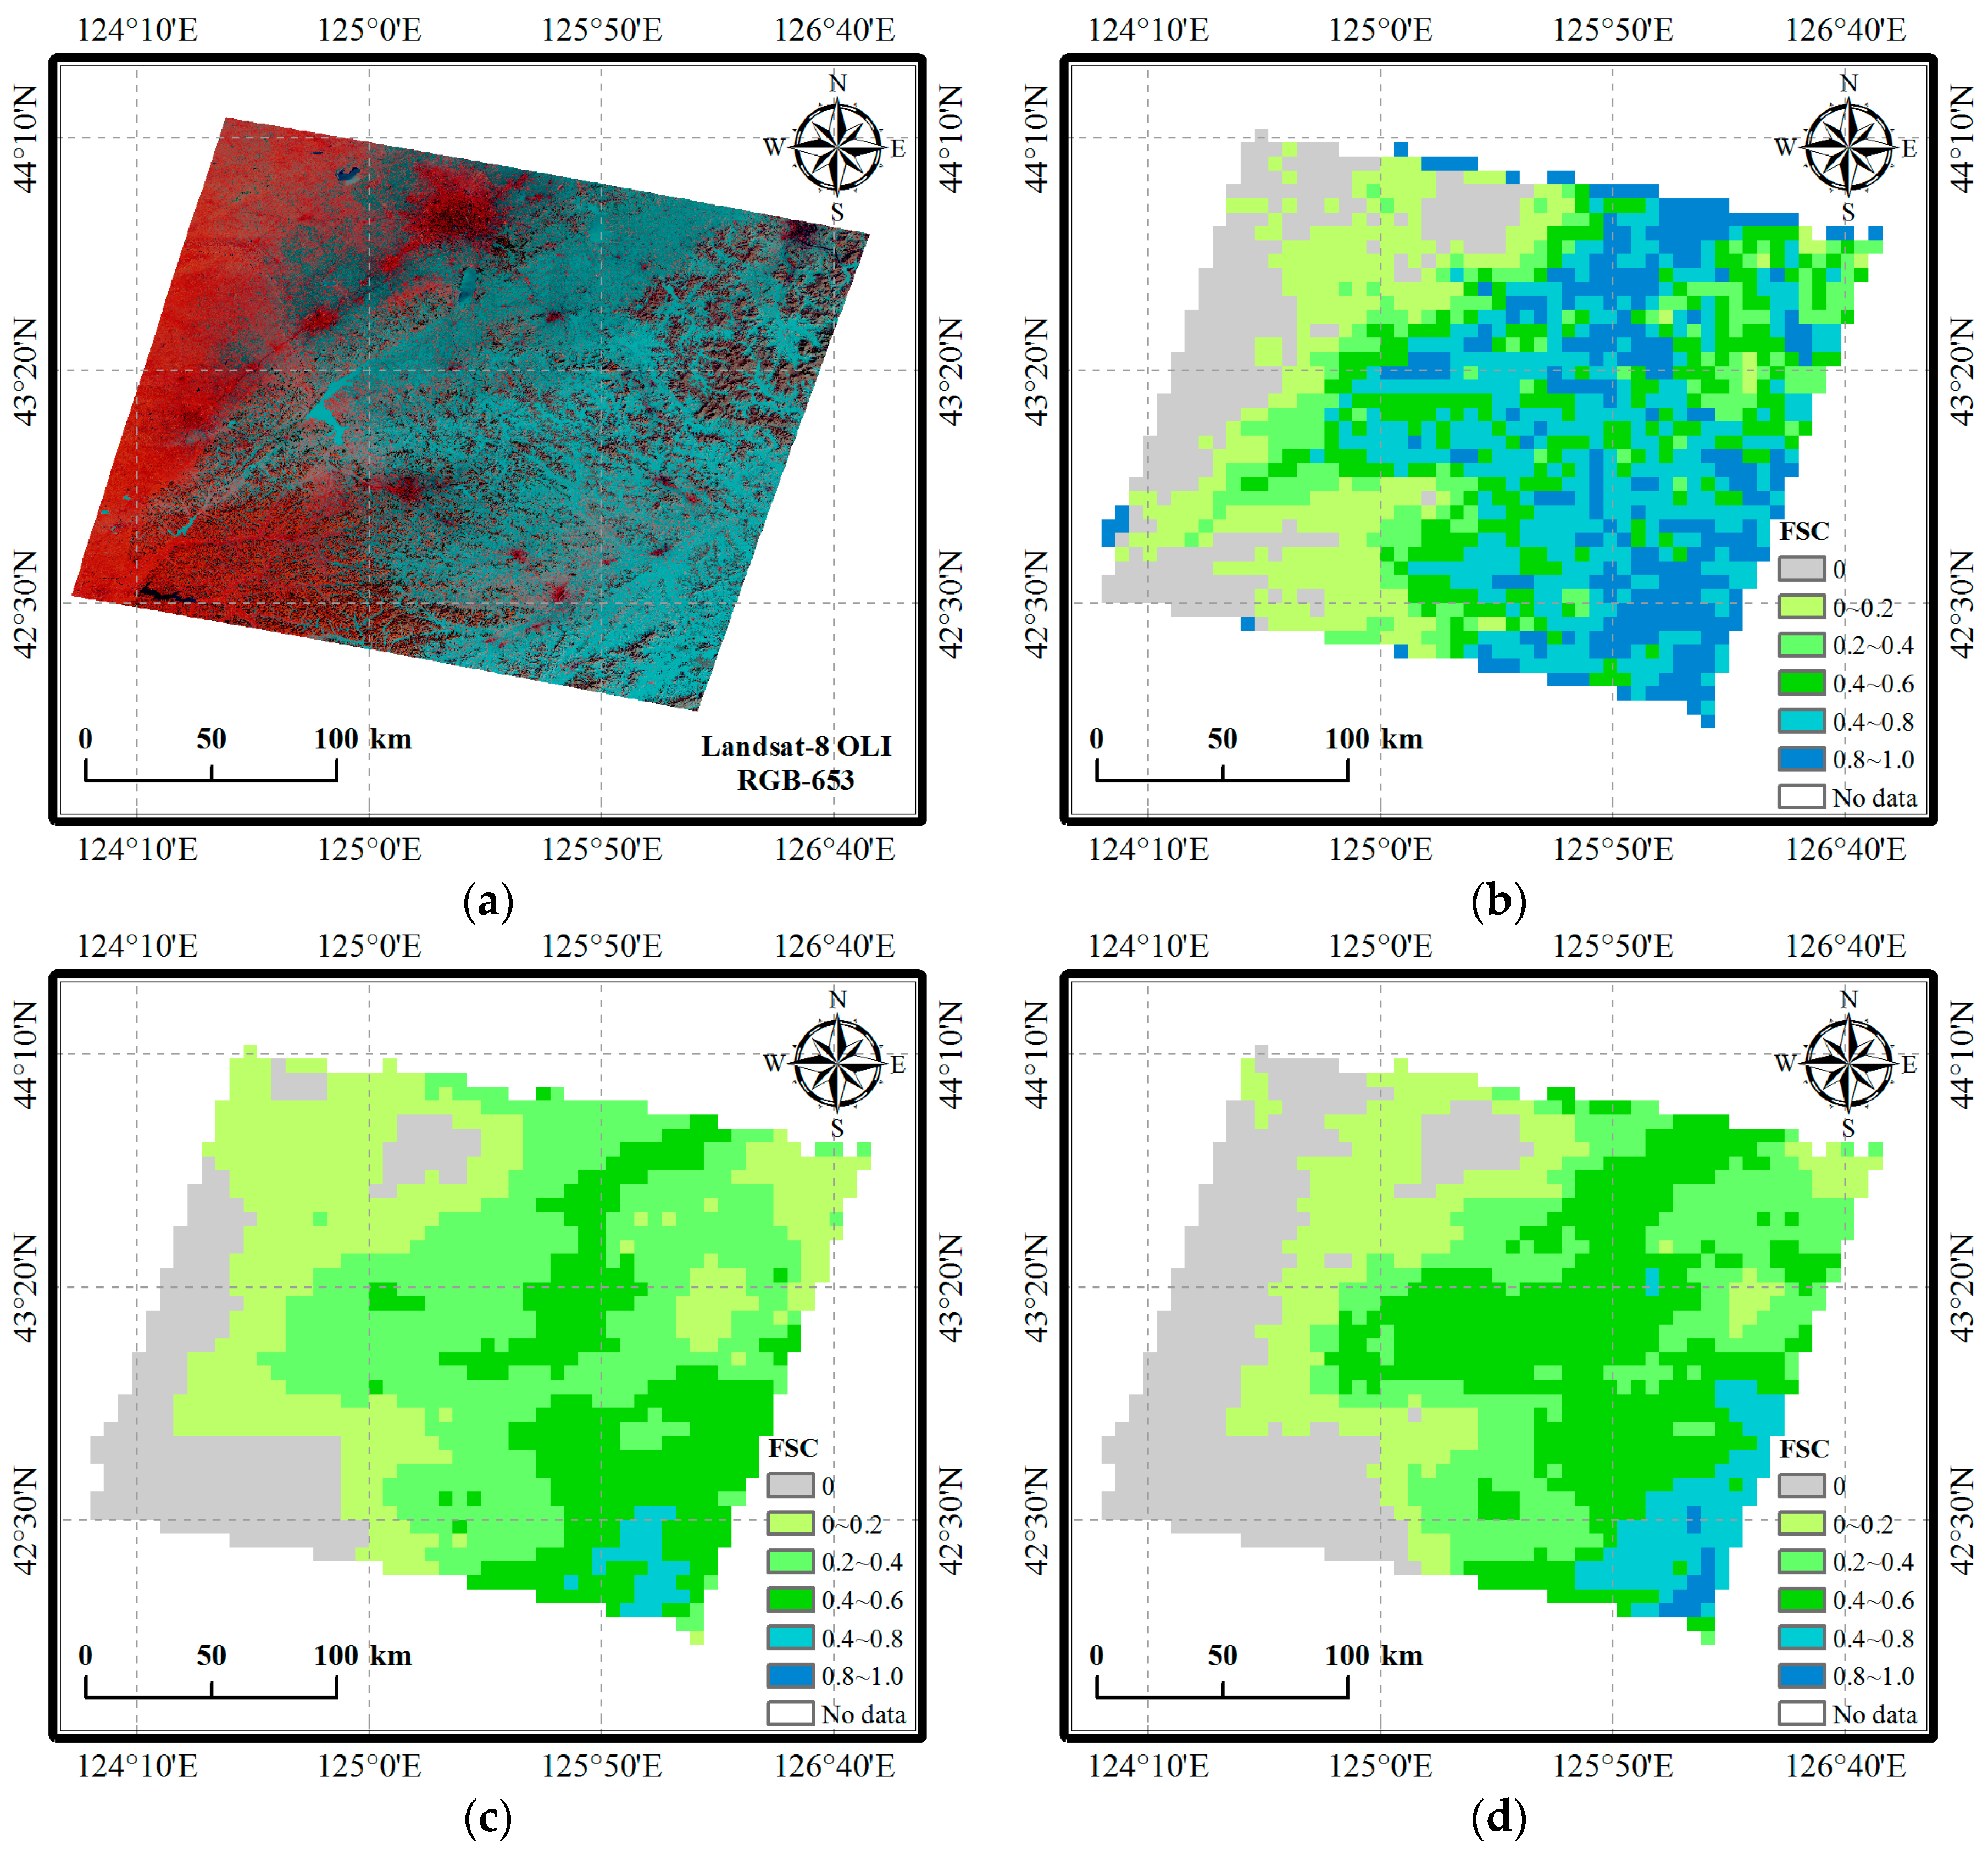
Figure 8.
Comparison of results from Landsat-8 OLI and FY-2E/F VISSR of the region L4 on 30 January 2014: (a) the false color composite of Landsat-8 OLI Band 6, 5, and 3 at 124/Row 29; (b) the 0.05° FSC map from Landsat-8 OLI; (c) the FY-2E VISSR FSC map at 02:00 UTC; and (d) the FY-2F VISSR FSC map at 02:30 UTC.

Figure 9.
Comparison of results from Landsat-8 OLI and FY-2E/F VISSR of the region L5 on 10 January 2014: (a) the false color composite of Landsat-8 OLI Band 6, 5, and 3 at 144/Row 30; (b) the 0.05° FSC map from Landsat-8 OLI; (c) the FY-2E VISSR FSC map at 05:00 UTC; and (d) the FY-2F VISSR FSC map at 05:30 UTC.

Table 1.
FengYun-2 (FY-2) Visible and Infrared Spin Scan Radiometer (VISSR) characteristics.
| Band | Wavelength (μm) | Spatial Resolution (km) | Radiometric Resolution (bit) |
|---|---|---|---|
| VIS | 0.55–0.99 | 1.25 | 6 |
| IR1 | 10.3–11.3 | 5 | 10 |
| IR2 | 11.5–12.5 | 5 | 10 |
| IR3 | 6.3–7.6 | 5 | 10 |
| IR4 | 3.5–4.0 | 5 | 10 |
VIS: visible.
Table 2.
FY-2 binary snow cover algorithm (phase 1).
| Classification Order | Classification Rule | Classification Result |
|---|---|---|
| 1 | TBIR1 ≥ 290 K | Snow-free |
| 2 | RVIS ≤ 0.2 and RIR4 ≥ 0.25 | Snow-free |
| 3 | RVIS ≤ 0.16 | Snow-free |
| 4 | TBIR2-TBIR4 ≤ −6 K and RVIS ≤ 0.2 | Snow-free |
| 5 | TBIR2-TBIR4 ≥ 3 K and RVIS ≤ 0.5 | Snow cover |
| 6 | TBIR2-TBIR4 ≥ 10 K and TBIR1 ≥ 250 K | Snow cover |
| 7 | TBIR2-TBIR4 ≤ −38 K | Cloud |
| 8 | TBIR1 ≤ 233 K | Cloud |
| 9 | TBIR2-TBIR4 ≤ −23 K and RSI 1 ≥ 4 | Cloud |
| 10 | RVIS ≥ 0.6 and RIR4 ≥ 0.18 | Cloud |
| 11 | TBIR2-TBIR4 ≤ −20 K and TBIR1 ≤ 232 K | Cloud |
| 12 | TBIR2-TBIR1 ≥ 12 K | Cloud |
1 Ratio snow index (RSI) is RVIS/RIR4 for the FY-2 VISSR.
Table 3.
Rules for extracting end-members from the FY-2 VISSR images.
| End-Member | Rule |
|---|---|
| Full snow cover | Snow identified in hourly image, NDSI 1 >0.90, RVIS > 0.35 for forest, RVIS > 0.45 for other land cover |
| Snow-free | Snow-free identified in hourly image, NDSI < 0.45, RVIS < 0.25 for grass and crop, RVIS < 0.35 for barren and forest |
1 Normalized difference snow index (NDSI) is (RVIS − RIR4)/ (RVIS + RIR4) for FY-2 VISSR here.
Table 4.
Evaluation results of the FY-2E/F VISSR FSC using Landsat-8 OLI data.
| Region | Scene | Date | Satellite | Overall Accuracy | RMSE | R2 |
|---|---|---|---|---|---|---|
| Tibetan Plateau | L1 | 20 January 2014 | FY-2E FY-2F | 0.86 0.87 | 0.18 0.20 | 0.76 0.72 |
| L2 | 28 January 2014 | FY-2E FY-2F | 0.85 0.85 | 0.21 0.21 | 0.71 0.72 | |
| Northeast China | L3 | 21 February 2014 | FY-2E FY-2F | 0.90 0.92 | 0.29 0.26 | 0.65 0.66 |
| L4 | 30 Januray 2014 | FY-2E FY-2F | 0.87 0.91 | 0.18 0.22 | 0.80 0.62 | |
| North Xinjiang | L5 | 10 January 2014 | FY-2E FY-2F | 0.68 0.65 | 0.28 0.25 | 0.46 0.49 |
RMSE: root mean square error.
© 2017 by the authors. Licensee MDPI, Basel, Switzerland. This article is an open access article distributed under the terms and conditions of the Creative Commons Attribution (CC BY) license (http://creativecommons.org/licenses/by/4.0/).
Share and Cite
MDPI and ACS Style
Wang, G.; Jiang, L.; Wu, S.; Shi, J.; Hao, S.; Liu, X. Fractional Snow Cover Mapping from FY-2 VISSR Imagery of China. Remote Sens. 2017, 9, 983. https://doi.org/10.3390/rs9100983
AMA Style
Wang G, Jiang L, Wu S, Shi J, Hao S, Liu X. Fractional Snow Cover Mapping from FY-2 VISSR Imagery of China. Remote Sensing. 2017; 9(10):983. https://doi.org/10.3390/rs9100983
Chicago/Turabian StyleWang, Gongxue, Lingmei Jiang, Shengli Wu, Jiancheng Shi, Shirui Hao, and Xiaojing Liu. 2017. "Fractional Snow Cover Mapping from FY-2 VISSR Imagery of China" Remote Sensing 9, no. 10: 983. https://doi.org/10.3390/rs9100983
Note that from the first issue of 2016, this journal uses article numbers instead of page numbers. See further details here.