Metrological Characterization for Vital Sign Detection by a Bioradar
by
 , and
, and
Giovanni Cerasuolo
1,* ,
,
Orsola Petrella
1,
Luigi Marciano
1,
Francesco Soldovieri
2 and
Gianluca Gennarelli
2 1
CIRA, Italian Aerospace Research Centre, via Maiorise, 81043 Capua (CE), Italy
2
IREA-CNR, Institute for Electromagnetic Sensing of the Environment, National Research Council of Italy, via Diocleziano 328, 80124 Napoli, Italy
*
Author to whom correspondence should be addressed.
Remote Sens. 2017, 9(10), 996; https://doi.org/10.3390/rs9100996
Submission received: 30 June 2017
/
Revised: 29 August 2017
/
Accepted: 22 September 2017
/
Published: 26 September 2017
(This article belongs to the Special Issue Radar Systems for the Societal Challenges)
Abstract
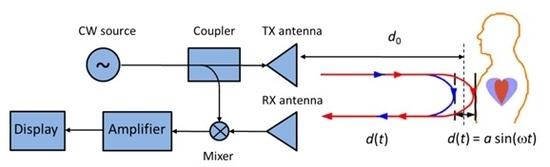
:In space missions, during the long isolation at extreme conditions for human health, it is of paramount importance to monitor vital parameters. One such parameter is the breathing rate. Indeed, several factors can induce some breathing anomalies during the sleep, which may cause apnea episodes. In order to act timely with the right therapy, an early diagnosis is required. Conventional devices are usually uncomfortable since they require electrodes or probes in contact with the subject. An alternative way to perform this kind of measurement in a remote sensing modality is provided by a continuous wave bioradar operating in the microwave frequency band. This is an effective contactless tool for monitoring the respiratory activity through the measurement of chest deformation due to inhalation and exhalation. The radar emits a low power electromagnetic wave at a single frequency, which is reflected by the human chest. By measuring of the phase shift between the incident and reflected wave, it is possible to detect and monitor the respiratory rate. The main contribution of this work is concerned with a metrological characterization of the continuous wave bioradar; which is a topic not thoroughly assessed in the relevant literature. In particular, the bioradar measurements are also compared with data recorded by a spirometer, which is a standard medical device that measures the air volume inhaled and exhaled by the subject. The purpose of this study is the characterization of the measurement standard uncertainty to enable the assessment of the bioradar system performance.
1. Introduction
The contactless measurement of vital signs with bioradar technique is valuable in several application fields such as security and surveillance, healthcare, and space medicine [1,2,3,4,5,6,7,8,9,10,11].
The working principle of this kind of device is based on the measurement of the phase shift of the radar signal caused by the contraction and expansion of the human chest during breathing. From this information and a suitable signal processing, it is possible to extract the breathing and heartbeat pattern of the subject under test [2,6,7,8].
Continuous wave bioradars for the monitoring of breathing and heartbeat activity constitute the simplest type of bioradar and have been known since the 1970s [1]. However, in recent years technological advances have triggered many studies aiming on one hand to the design and miniaturization of these systems and on the other hand to the enhancement of the signal processing techniques [2,6].
The monitoring of vital parameters via a bioradar is fundamental during search and rescue operations in crisis scenarios (e.g., earthquakes, avalanches, etc.) because it could be exploited to save human lives. Moreover, it can be exploited to detect stationary or moving subjects hidden behind building walls [4].
Recently non-contact microwave based transceivers have been also proposed in the biomedical field as diagnostic tools [5,7,9]. Indeed, the contactless monitoring of heartbeat and breathing parameters is crucial in the case of burnt patients or patients where on-body sensors cannot be applied. In sleep medicine, bioradars enable the monitoring of respiration and heartbeat patterns during night sleep in order to diagnose sleep apnea syndrome [9]. Some other application examples of bioradar in healthcare are the detection of sudden infant death syndrome [2], tumor tracking in radiation therapy [2], and imaging of cardiac motion [10]. Another important innovation regards the possibility to gain information about breathing signals by using multisensory information provided by the multistatic UWB radar, which takes the form of impulse radios and comprises one transmitting and four separated receiving antennas [11].
The main goal of this work is the evaluation of the metrological performance of a bioradar for breathing rate estimation. Despite the large body of work available in the literature on the topic of bioradar, the evaluation of the bioradar performance from the metrological viewpoint has received low attention. In this respect, the measurement uncertainty of breathing rates evaluated from bioradar signals is defined and analyzed. Furthermore, bioradar results are compared with data recorded by a spirometer, which is a standard medical device that measures the air volume inhaled and exhaled by the subject [12]. Additionally, the field levels emitted by the bioradar equipment are characterized in order to check their compliance with current regulations on the limits of human exposure to electromagnetic fields.
The paper is organized as follows. Section 2 describes the measurement system and the experimental tests. Section 3 deals with the measurement results related to the field levels radiated by the bioradar and the comparison between the bioradar and spirometer breathing rates. In Section 4, the standard measurement uncertainty of the bioradar breathing rate is defined and evaluated. Concluding remarks follow in Section 5.
2. Bioradar Prototype
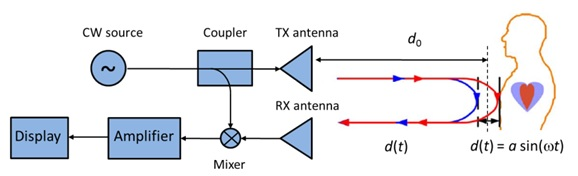
The bioradar system considered in this study is a continuous-wave Doppler radar with quadrature receiver, as shown in Figure 1. The radar has been developed at IREA-CNR by using commercial off-the-shelf radio-frequency components. The system has an approximate size of 284 × 184 × 252 mm3 and operates at discrete frequencies in the range between 1.8 and 3 GHz [13,14]. The radio signal emitted by the source is split into two equal parts: one part is radiated and the other part is used to generate two reference signals with 90 degrees phase offset, which are used to down convert the reflected signal at baseband. The outputs of the mixers are the in-phase (I) and quadrature (Q) components of signal reflected by the subject. The baseband I and Q signals are finally amplified and digitized for the later data processing. The system uses a single antenna (horn with 10 dB gain) thanks to a circulator that decouples the transmit and receive channels. The system is equipped with software and a graphical interface for managing the data acquisition and signal processing [13,14].
Several demodulation schemes have been proposed to exploit the information carried by the I and Q signals [2,6,15,16,17]. For sake of simplicity, in this work, we select one between the I or Q signal based on the highest peak-to-peak variation to get a satisfying sensitivity. After a band-pass filtering, the breathing rate is estimated from the Fourier spectrum of the signal (e.g., see [17]).
Figure 1b illustrates the measurement set-up considered for this study. During the experiments, an adult male subject sits in front of the radar breathing normally and, simultaneously to bioradar, a spirometer records the air volume inhaled and exhaled by the subject. It is noticed that the spirometer measures the magnitude of the airflow, which has a periodic behavior due to the inhalation and exhalation phases. A spectral analysis of the spirometer signal enables the defining of the reference breathing rate.
3. Measurement Results
3.1. Electromagnetic Field Levels
Before exposing the human subject to the electromagnetic radiation, it was necessary to monitor the electromagnetic field levels generated in the environment by the radar equipment. In this respect, it must be recalled that current Italian regulation on the limits of human exposure to the electromagnetic fields [18] establishes that the electric field amplitude should not exceed 6 volts per meter, as summarized in Table 1.
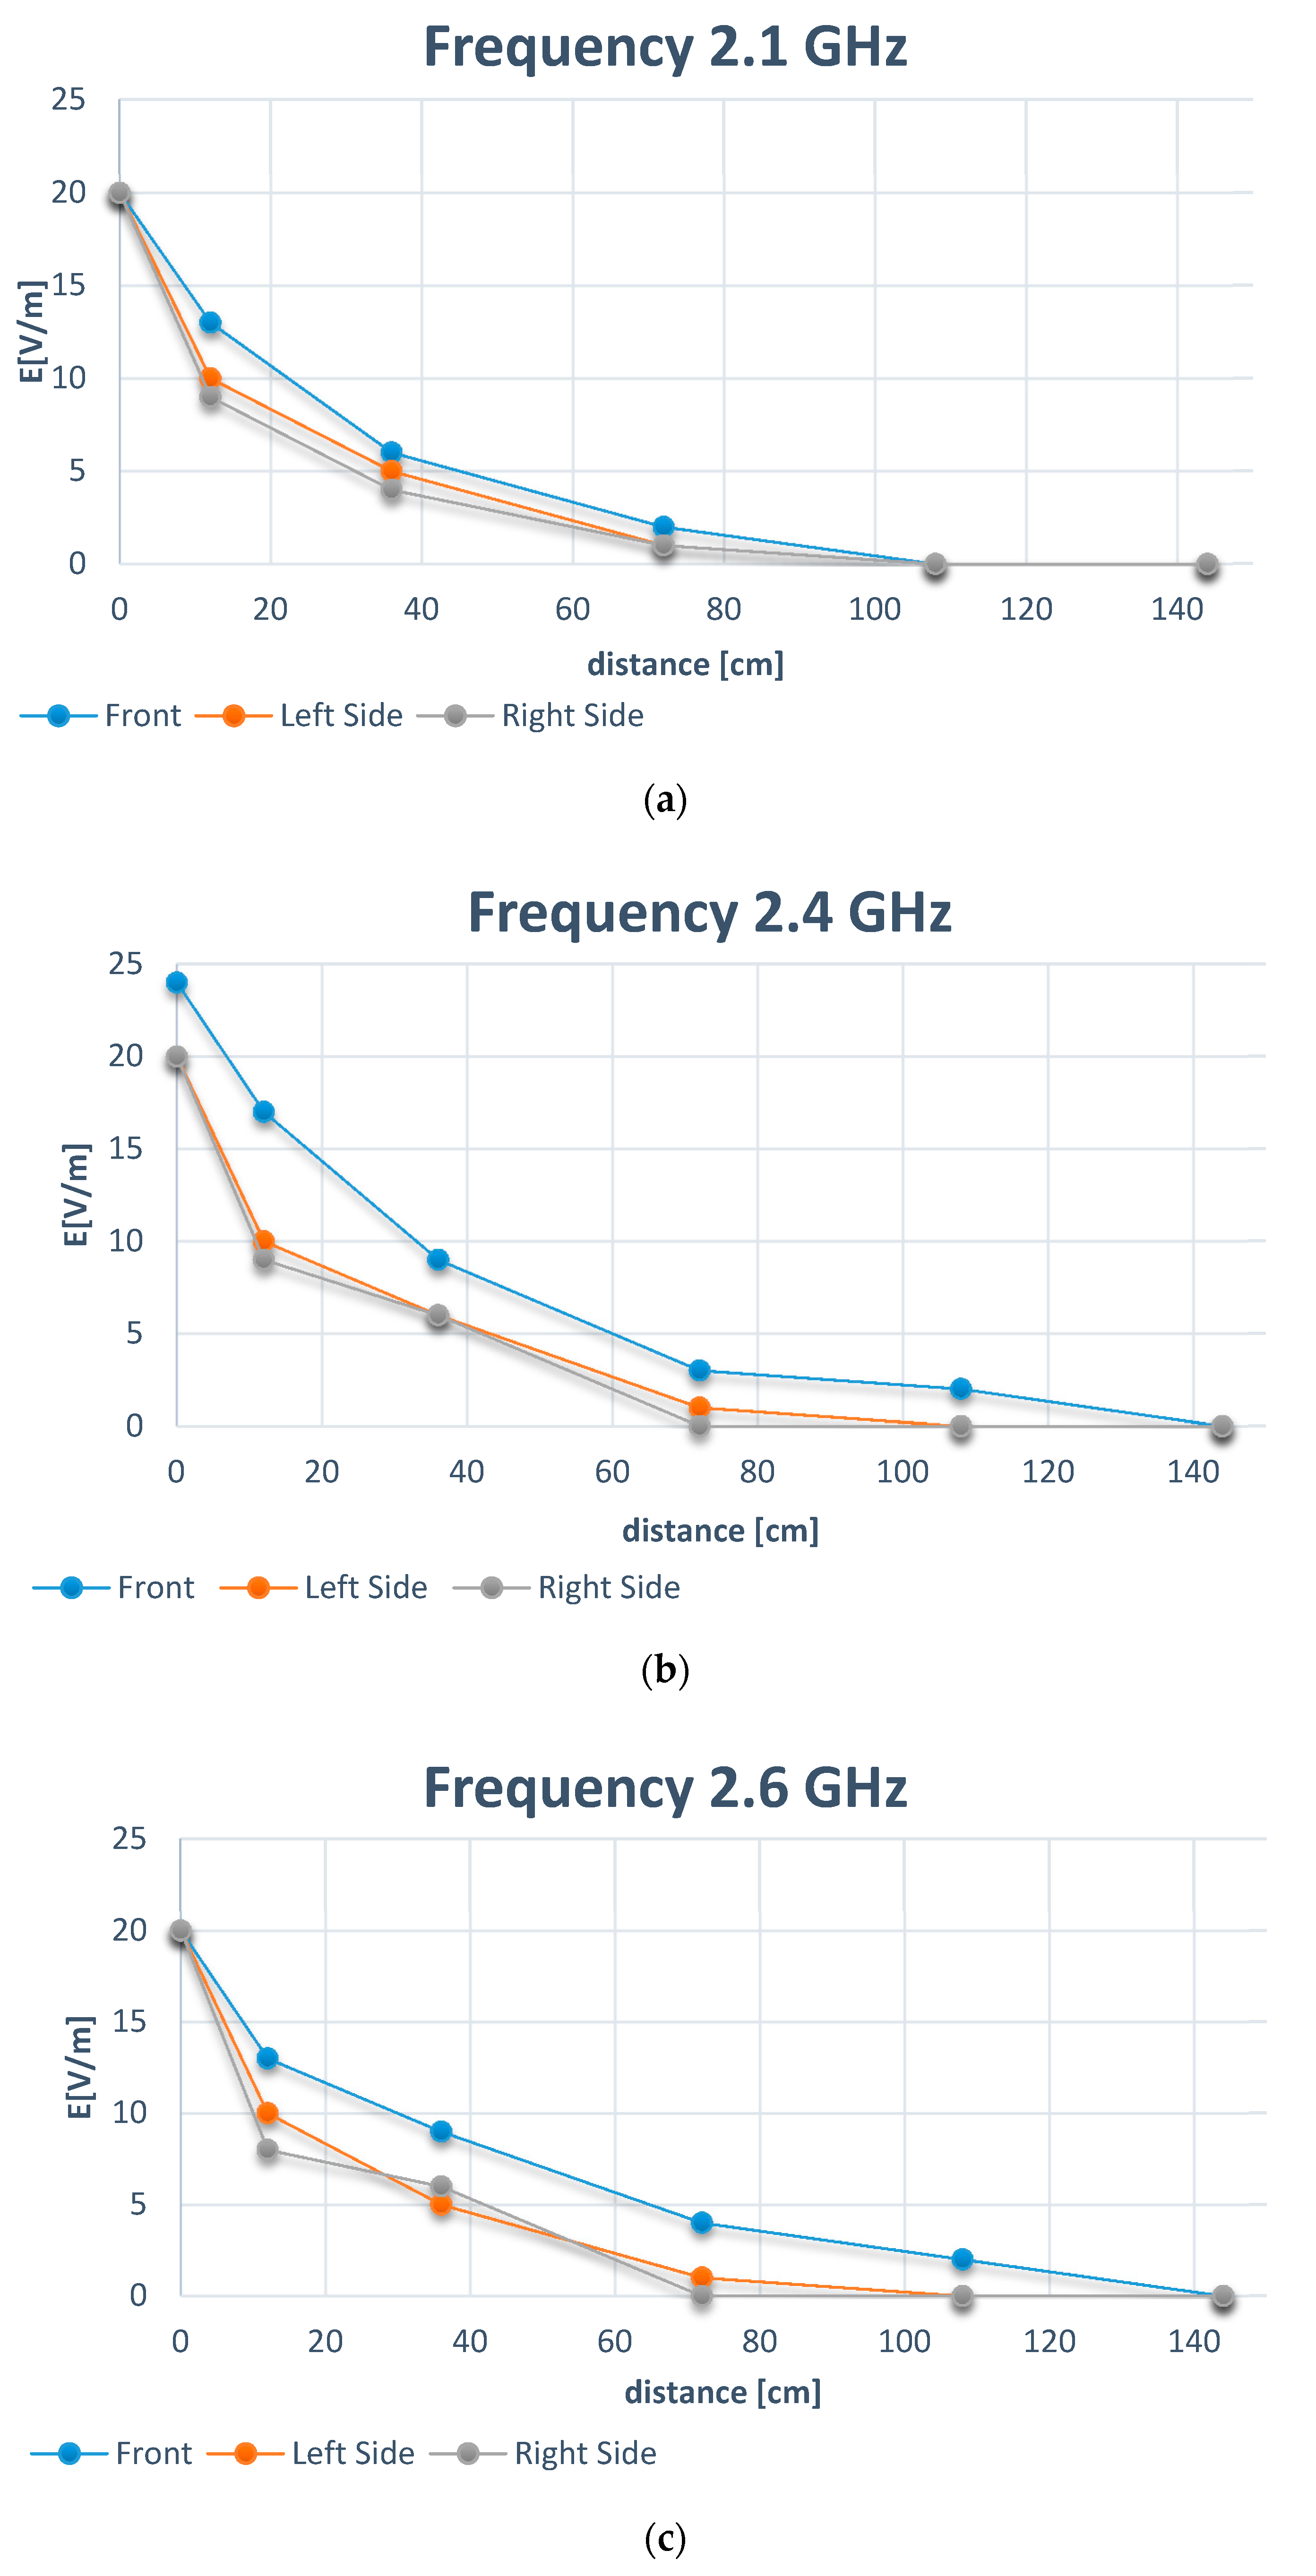
For the radar system under investigation, the field measurements were recorded in the horizontal plane on the main radiation lobe of the radar antenna. In particular, as shown in Figure 2a, the field levels were measured at three different points at progressively increasing distances from the aperture of the antenna: the center point corresponds to the radiation maximum in front the antenna and the left and right points correspond to the −3 dB (half-power) directions. In Figure 2a, we can see that the distances vary from 0 cm to 144 cm away from the horn aperture, at a fixed height of 84 cm that complies with the central symmetry axes of the horn (Figure 2b).
The measurements were collected with the electric, magnetic, and electromagnetic field meter, (PMM 8051 model) shown in Figure 2b.
As reported in Figure 3, for all the investigated frequencies equal to 2.1, 2.4, and 2.6 GHz, the electric field decreases versus distance and assumes values lower than 1 V/m for distances exceeding 1 m. Therefore, it was possible to proceed with the test campaign because the distance between the radar and the subject in the experimentation was greater than 1 m.
3.2. Experimental Results
The test campaign was performed with an adult male subject sitting in front of the radar at a stand-off distance of 1.5 m. Three distinct operating frequencies were selected, 2.1, 2.4, and 2.6 GHz, to assess the metrological performance of the bioradar system. Particularly, 10 independent datasets were recorded at each frequency. For each dataset, the bioradar and the spirometer signals were acquired simultaneously over a time window of 30 s.
The comparison between the bioradar and spirometer signals has demonstrated an excellent agreement at each operating frequency as confirmed by the sample dataset reported in Figure 4.
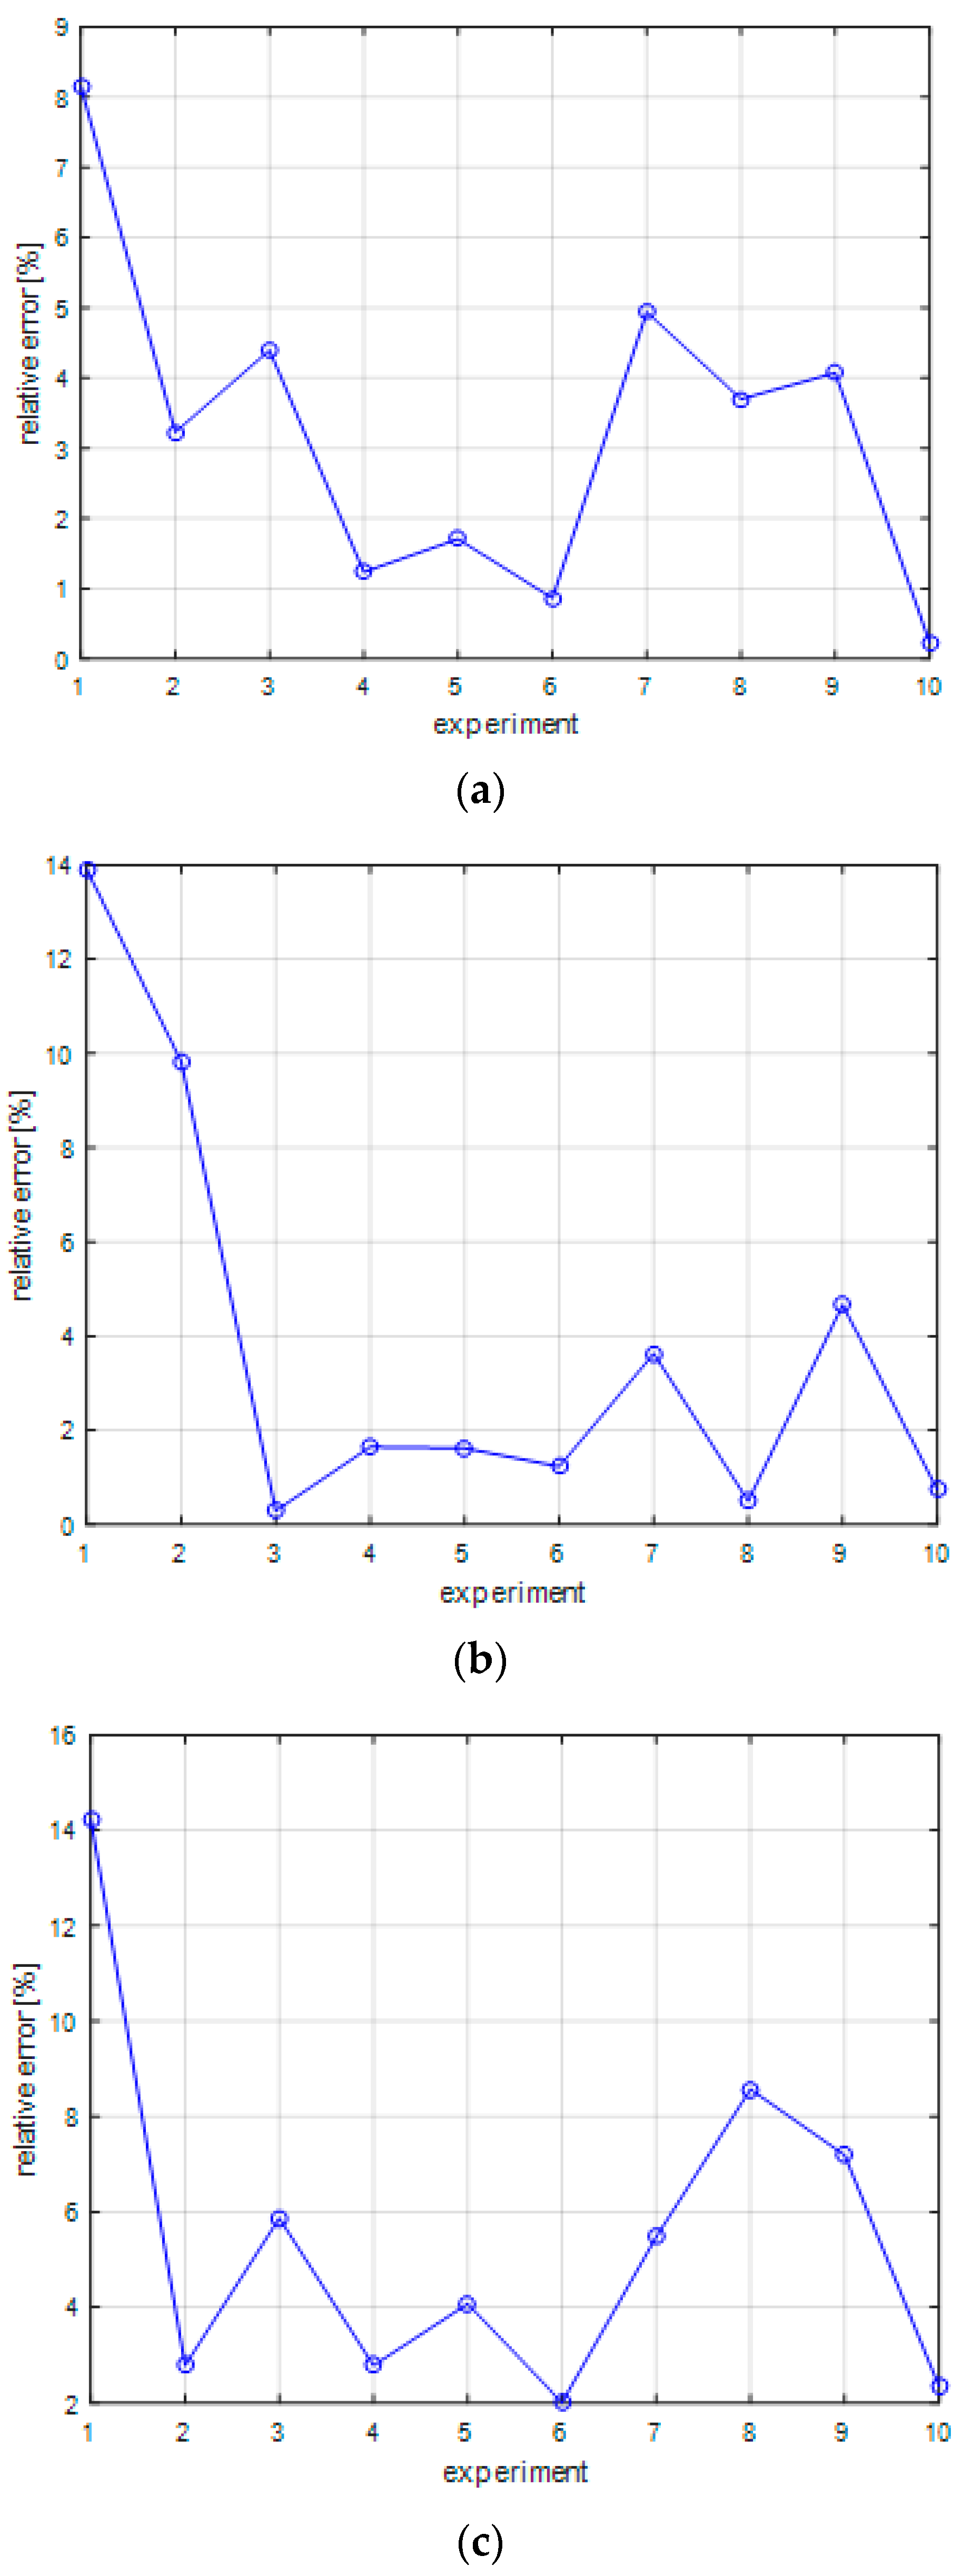
The breathing rates measured for each frequency are reported in Table 2. The data show a good match between two techniques, thus confirming that the bioradar is capable of detecting the breathing rate with good accuracy.
This assertion is also supported by the curves of the relative percentage error shown in Figure 5. In particular, it was found that the average error between bioradar and spirometer breathing rates is 3, 3.8, and 5%, for 2.1, 2.4, and 2.6 GHz frequencies, respectively.
4. Bioradar Measurement Uncertainty
After the test campaigns, we proceeded with the calculation of measurement uncertainty. More specifically, we were interested in defining and evaluating the uncertainty of bioradar estimates of breathing rates.
It is well-known that the measurement standard uncertainty is computed as the sum of two contributions [19]: the first one uA estimated by performing the statistical analysis of the set of performed measurements; the second one uB is based on scientific judgment using all of the relevant information available about the measurement. Finally, using a coverage factor of 2 which gives a level of confidence of approximately 95%, the expanded uncertainty is calculated as the double of the composed uncertainty, i.e.,
As regards the first contribution uA, it is evaluated as the arithmetic mean
where si is the experimental standard deviation
Let us assume that n statistically independent observations (n > 1), xiq is the measured value, the average value of the measured value.
The second contribution uB can be evaluated under some assumptions, considering an interval [ximin, ximax] where the uncertainty has the same value in each points. Thanks to this hypothesis, it is possible to consider a uniform distribution of probability in the interval of width ximax − ximin equal to
where ximax and ximin are the maximum and minimum of measured values for each frequency. These values are reported in the following table (Table 3).
In Table 4, the estimated values for the expanded uncertainty of the bioradar system are reported, for each frequency, together with the average breathing rates.
5. Conclusions
In this paper, an electromagnetic bioradar for measuring the human respiratory rate has been characterized and compared to a standard medical device. Both the devices allow monitoring the frequency of human breathing, which may suffer from disturbances, especially in the nocturne phase during long isolation as in a space mission.
Before proceeding with the experimentation, the field levels radiated by the bioradar have been measured in order to check their compliance with the limits of human exposure to electromagnetic fields imposed by current regulations. The analysis of recorded data has confirmed that the field levels, used to gain information about breathing activity, are lower than the threshold imposed by law for stand-off distances greater than one meter. This allows us to consider bioradar as a safe alternative solution to standard medical devices.
The quality of breathing rates obtained with the bioradar has been assessed from the metrological viewpoint. An interesting result has been achieved by the calculation of the measurement uncertainty. Specifically, the uncertainties are less than or equal to 20% of the reading value, in the worst case. Such uncertainty values account for the natural physiological variations of the respiratory rate. An uncertainty reduction is achieved by increasing the operation frequency of the radar. On the other hand, the average errors between bioradar and spirometer breathing rates are 3, 3.8, and 5% at 2.1, 2.4, and 2.6 GHz, respectively. Therefore, although increasing the frequency allows improving the bioradar sensitivity (i.e., the chest’s displacement becomes larger in terms of wavelength), this does not necessarily lead to more accurate results, most likely because the bioradar operation is quite sensitive to small and random body movements.
Author Contributions
The researchers involved in this study contributed the following: Giovanni Gennarelli and Francesco Soldovieri conceived and designed the experiments; Giovanni Gennarelli and Luigi Marciano performed the experiments; Orsola Petrella and Giovanni Cerasuolo analyzed data and wrote the paper.
Conflicts of Interest
The authors declare no conflict of interest.
References
- Lin, J.C. Non-invasive microwave measurement of respiration. Proc. IEEE 1975, 63, 557–565. [Google Scholar] [CrossRef]
- Li, C.; Lin, J. Microwave Non-Contact Motion Sensing and Analysis; Wiley: Hoboken, NJ, USA, 2014. [Google Scholar]
- Zhang, Y.; Chen, F.; Xue, H.; Li, Z.; An, Q.; Wang, J.; Zhang, Y. Detection and identification of multiple stationary human targets via bio-radar based on the cross-correlation method. Sensors 2016, 16, 1793. [Google Scholar] [CrossRef] [PubMed]
- Gennarelli, G.; Ludeno, G.; Soldovieri, F. Real-time through-wall situation awareness using a microwave Doppler radar sensor. Remote Sens. 2016, 8, 621. [Google Scholar] [CrossRef]
- Anishchenko, L.N.; Demendeev, A.A.; Ivashov, S.I. Use of Radiolocation for Non-contact Estimation of Patterns of Respiration and Motion Activity in Sleeping Humans. Biomed. Eng. 2013, 47, 7–11. [Google Scholar] [CrossRef]
- Li, C.; Lubecke, V.M.; Boric-Lubecke, O.; Lin, J. A review on recent advances in Doppler radar sensors for non-contact healthcare monitoring. IEEE Trans. Microw. Theory Tech. 2013, 61, 2046–2060. [Google Scholar] [CrossRef]
- Lee, Y.S.; Pathirana, P.N.; Steinfort, C.L.; Caelli, T. Monitoring and Analysis of Respiratory Patterns Using Microwave Doppler Radar. IEEE J. Transl. Eng. Health Med. 2014, 2, 1–12. [Google Scholar] [CrossRef] [PubMed]
- Dei, D.; Grazzini, G.; Luzi, G.; Pieraccini, M.; Atzeni, C.; Boncinelli, S.; Camiciottoli, G.; Castellani, W.; Marsili, M.; Dico, J.L. Non-contact detection of breathing using a microwave sensor. Sensors 2009, 9, 2574–2585. [Google Scholar] [CrossRef] [PubMed]
- Baboli, M.; Singh, A.; Soll, B.; Boric-Lubecke, O.; Lubecke, V.M. Good night: Sleep monitoring using a physiological radar monitoring system integrated with a polysomnography system. IEEE Microw. Mag. 2015, 16, 34–41. [Google Scholar] [CrossRef]
- Wang, J.; Wang, X.; Zhu, Z.; Huangfu, J.; Li, C.; Ran, L. 1D microwave imaging of human cardiac motion: An ab-initio investigation. IEEE Trans. Microw. Theory Tech. 2013, 61, 2101–2107. [Google Scholar] [CrossRef]
- Lv, H.; Qi, F.; Zhang, Y.; Jiao, T.; Liang, F.; Li, Z.; Wang, J. Improved Detection of Human Respiration Using Data Fusion Based on a Multistatic UWB Radar. Remote Sens. 2016, 8, 773. [Google Scholar] [CrossRef]
- Gennarelli, G.; Soldovieri, F.; Marciano, L.; Cerasuolo, G.; Petrella, O. Measurements Performance of a Bioradar for Human Respiration Monitoring. Procedia Eng. 2016, 168, 1200–1203. [Google Scholar] [CrossRef]
- Anishchenko, L.; Ivashov, S.; Soldovieri, F.; Catapano, I.; Crocco, L. Comparison study of two approaches for bioradar data processing. In Proceedings of the IET International Radar Conference, Xi’an, China, 14–16 April 2013. [Google Scholar]
- Catapano, I.; Crocco, L.; Gennarelli, G.; Soldovieri, F. Radar for vital signs characterization: A comparison between two different frequency bad systems. In Proceedings of the IEEE 7th International Workshop on Advanced Ground Penetrating Radar, Nantes, France, 2–5 July 2013. [Google Scholar]
- Girbau, D.; Lazaro, A.; Ramos, A.; Villarino, R. Remote sensing of vital signs using a Doppler radar and diversity to overcome null detection. IEEE Sens. J. 2012, 12, 512–518. [Google Scholar] [CrossRef]
- Jang, B.J.; Wi, S.-H.; Yook, J.-G.; Lee, M.-Q.; Lee, K.-J. Wireless bio-radar sensor for heartbeat and respiration detection. Prog. Electromagn. Res. C 2008, 5, 149–168. [Google Scholar]
- Anishchenko, L.; Gennarelli, G.; Tataraidze, A.; Gaysina, E.; Soldovieri, F. Evaluation of rodents’ respiratory activity using a bioradar. IET Radar Sonar Navig. 2015, 9, 1296–1302. [Google Scholar] [CrossRef]
- Art. 3 DPCM 8 July 2003, 1 of Italian Law n. 36. 2001. Available online: http://www.regione.piemonte.it/ambiente/elettromagnetismo/dwd/normativa/statale/dpcm_08_07_03_2.pdf (accessed on 26 September 2017).
- Evaluation of Measurement Data—Guide to the Expression of Uncertainty in Measurement, Joint Committee for Guides in Metrology. 2008. Available online: http://www.sci.utah.edu/~kpotter/Library/Papers/jcgm:2008:EMDG/index.html (accessed on 26 September 2017).
Figure 1.
Bioradar system. (a) The block diagram of the radar architecture; (b) Photo of the bioradar prototype.
Figure 1.
Bioradar system. (a) The block diagram of the radar architecture; (b) Photo of the bioradar prototype.
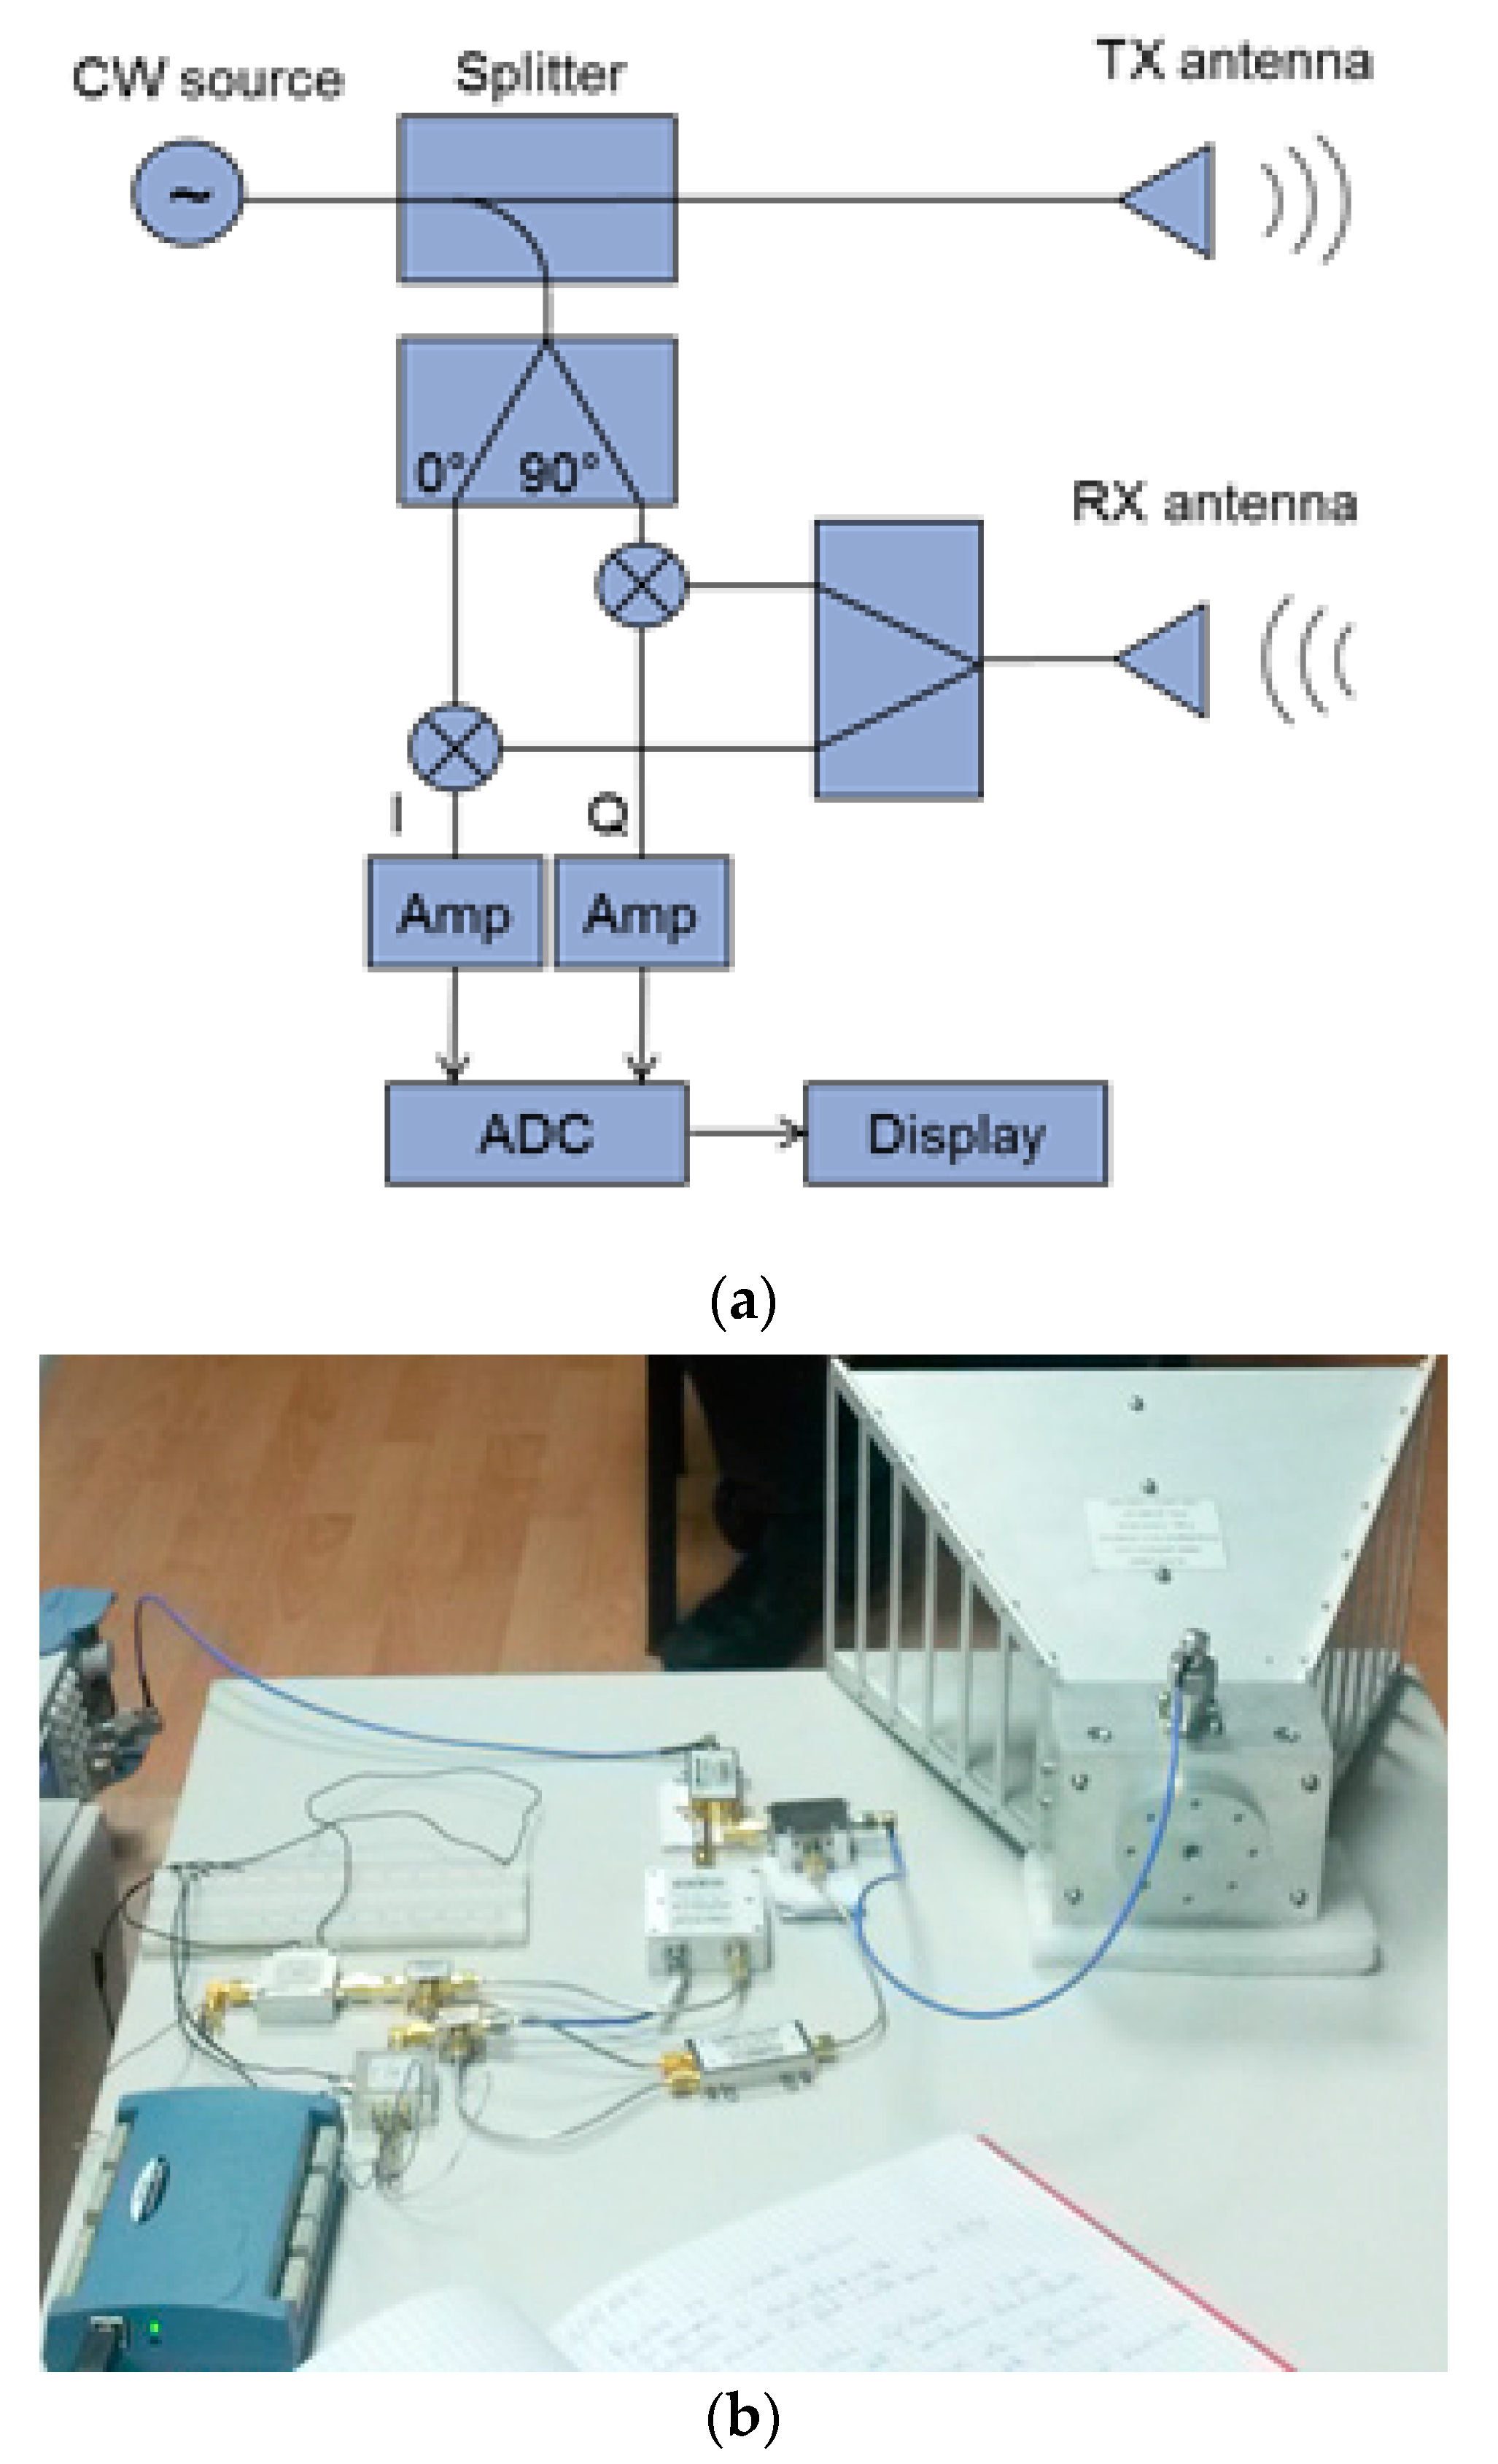
Figure 2.
Electromagnetic field measurement set-up. (a) Measurement points; (b) measurement probe.
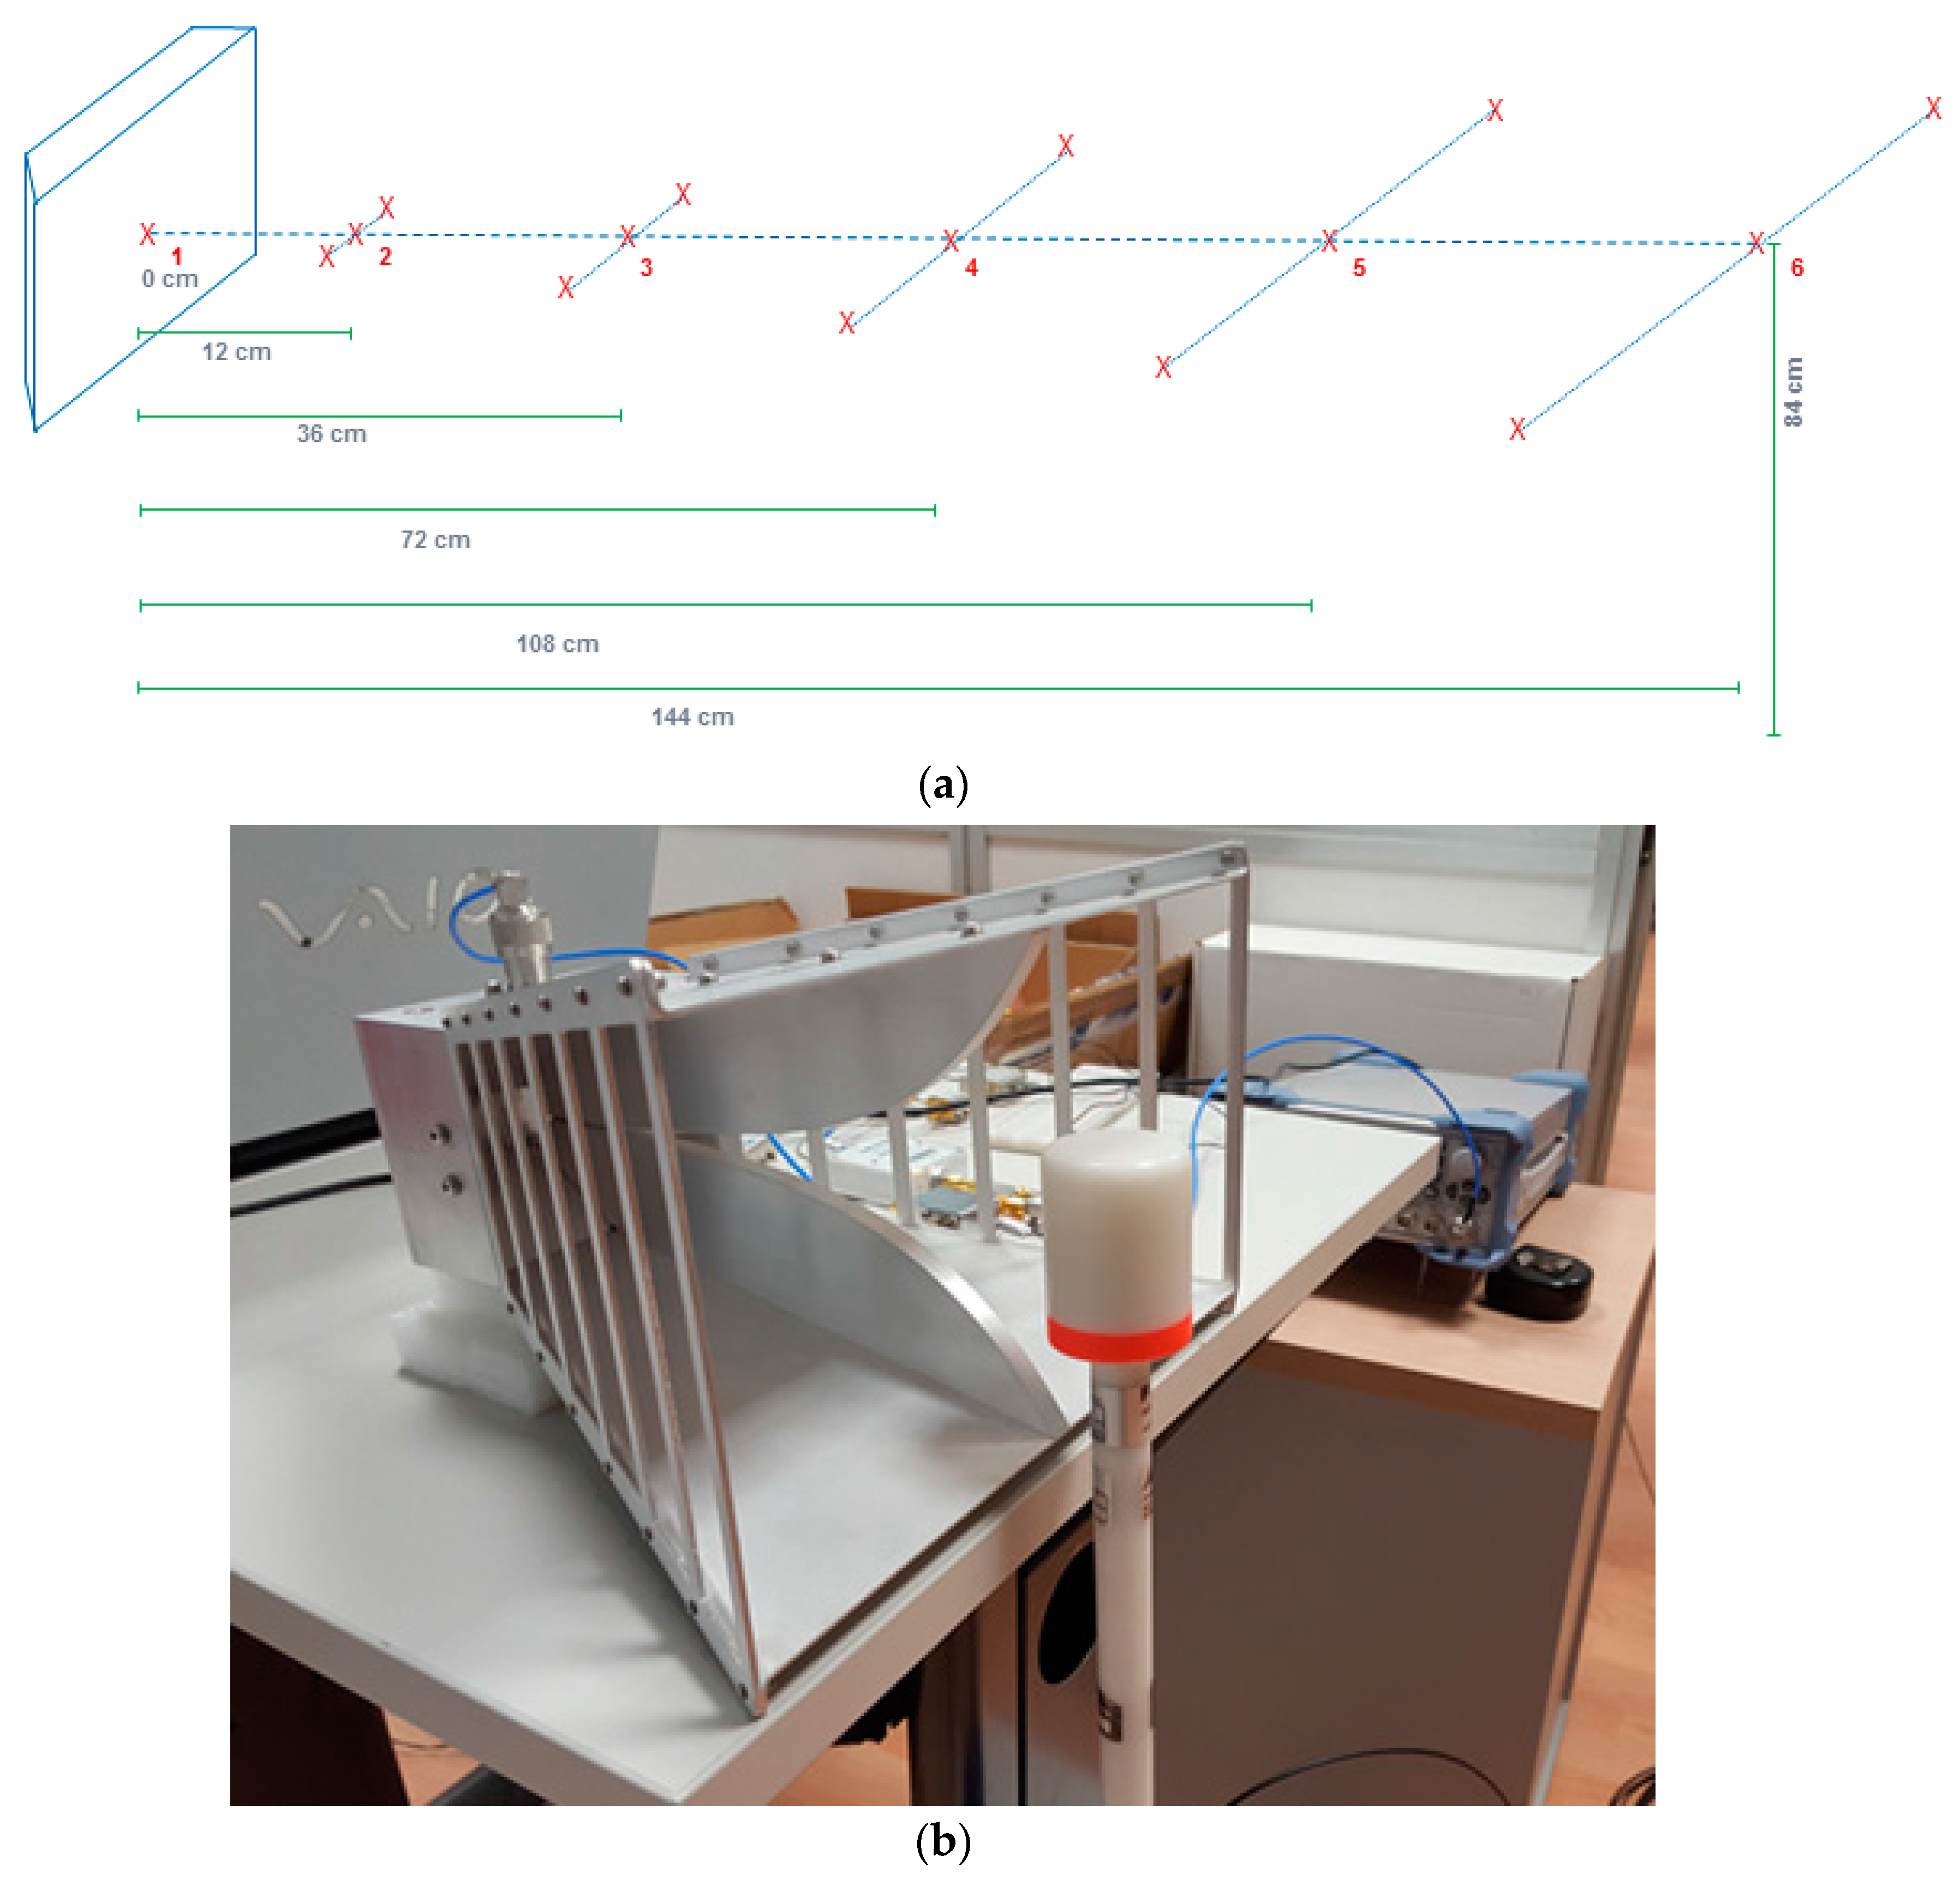
Figure 3.
Electric field profile. (a) Frequency of 2.1 GHz; (b) Frequency of 2.4 GHz; (c) Frequency of 2.6 GHz.
Figure 3.
Electric field profile. (a) Frequency of 2.1 GHz; (b) Frequency of 2.4 GHz; (c) Frequency of 2.6 GHz.

Figure 4.
Comparison between bioradar and spirometer data, a one sample of test campaign for each frequency. (a) Comparison at 2.1 GHz; (b) Comparison at 2.4 GHz; (c) Comparison at 2.6 GHz.
Figure 4.
Comparison between bioradar and spirometer data, a one sample of test campaign for each frequency. (a) Comparison at 2.1 GHz; (b) Comparison at 2.4 GHz; (c) Comparison at 2.6 GHz.
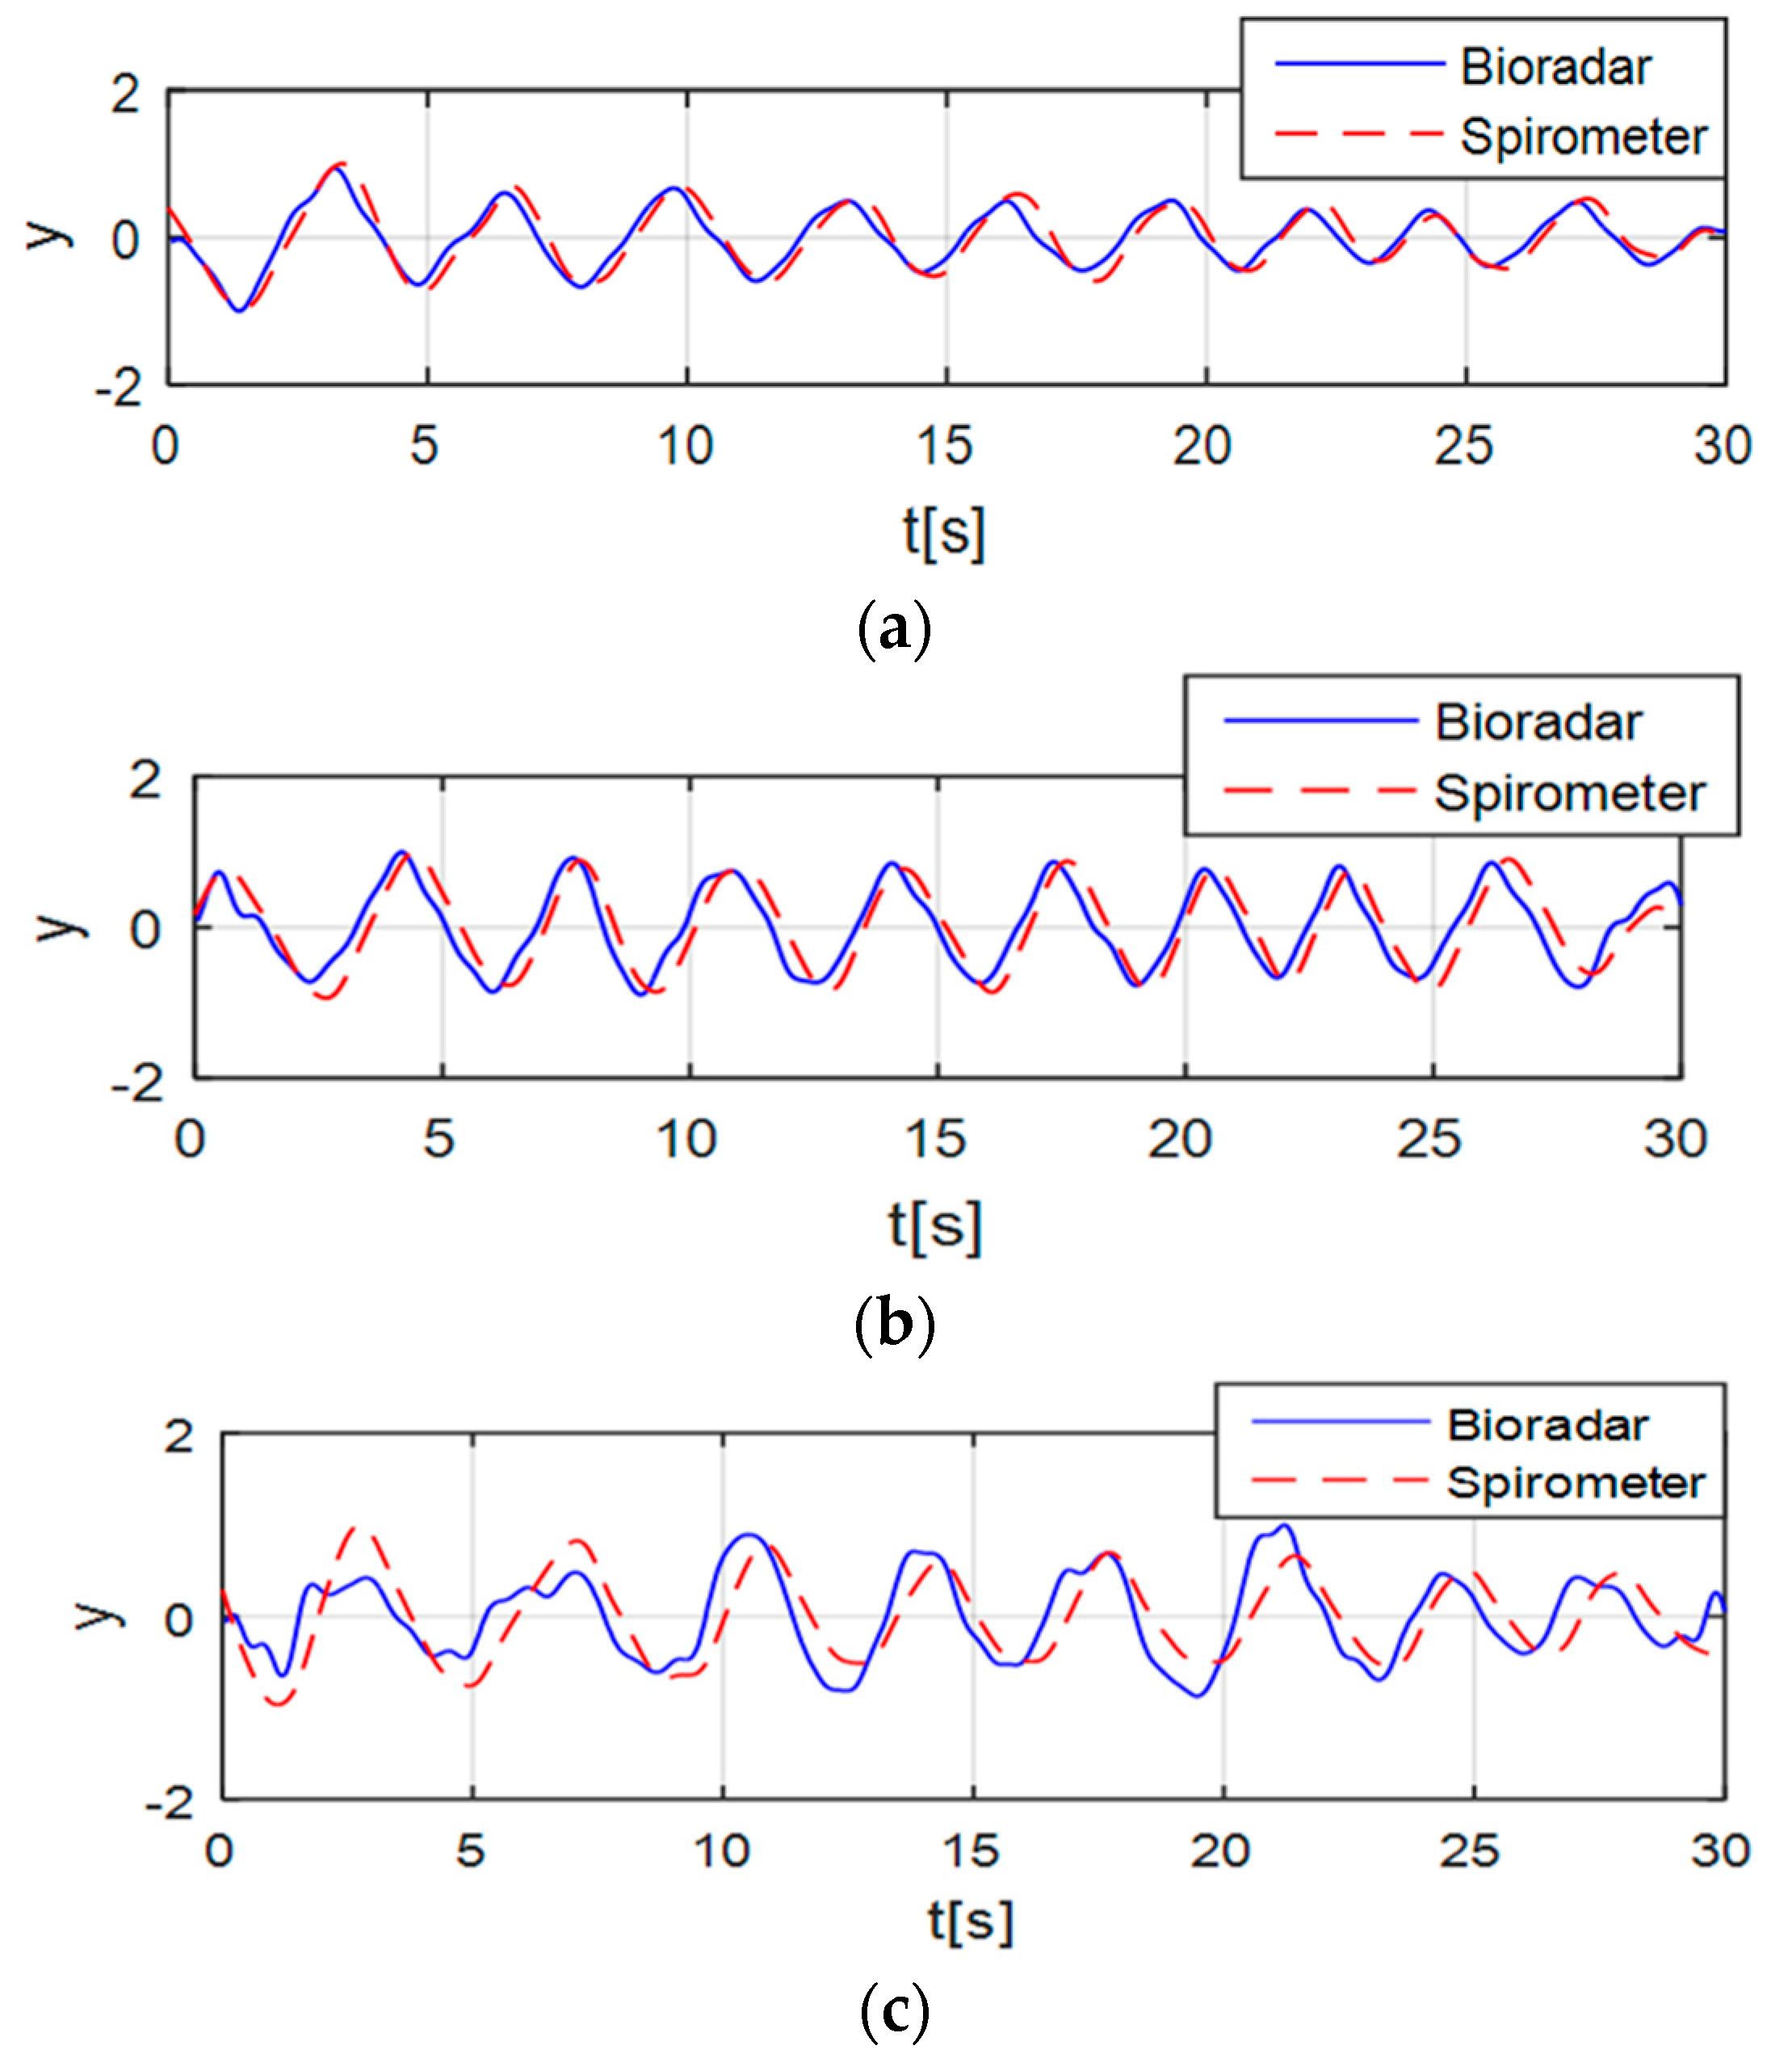
Figure 5.
Comparison between Bioradar and Spirometer data for one sample of campaign test and each frequency. (a) Comparison at 2.1 GHz; (b) comparison at 2.4 GHz; (c) comparison at 2.6 GHz.
Figure 5.
Comparison between Bioradar and Spirometer data for one sample of campaign test and each frequency. (a) Comparison at 2.1 GHz; (b) comparison at 2.4 GHz; (c) comparison at 2.6 GHz.

Table 1.
Limits of human exposure to electromagnetic fields [18].
Table 1.
Limits of human exposure to electromagnetic fields [18].
| Frequency Range | RMS Electric Field (V/m) | RMS Magnetic Field (A/m) | Irradiance (W/m2) |
|---|---|---|---|
| 0.1–300 GHz | 6 | 0.016 | 0.10 (3 MHz–300 GHz) |
Table 2.
Breathing rates provided by bioradar and spirometer.
| Test | 2.1 GHz | 2.4 GHz | 2.6 GHz | |||
|---|---|---|---|---|---|---|
| Bioradar [Hz] | Spirometer [Hz] | Bioradar [Hz] | Spirometer [Hz] | Bioradar [Hz] | Spirometer [Hz] | |
| 1 | 0.322 | 0.350 | 0.327 | 0.287 | 0.301 | 0.350 |
| 2 | 0.365 | 0.383 | 0.299 | 0.331 | 0.325 | 0.334 |
| 3 | 0.332 | 0.347 | 0.340 | 0.341 | 0.275 | 0.293 |
| 4 | 0.331 | 0.335 | 0.310 | 0.315 | 0.302 | 0.292 |
| 5 | 0.306 | 0.301 | 0.324 | 0.329 | 0.251 | 0.261 |
| 6 | 0.348 | 0.350 | 0.325 | 0.329 | 0.279 | 0.274 |
| 7 | 0.349 | 0.333 | 0.317 | 0.328 | 0.275 | 0.292 |
| 8 | 0.272 | 0.262 | 0.320 | 0.319 | 0.250 | 0.273 |
| 9 | 0.251 | 0.262 | 0.338 | 0.323 | 0.252 | 0.272 |
| 10 | 0.349 | 0.348 | 0.312 | 0.314 | 0.273 | 0.280 |
Table 3.
ximax and ximin values of bioradar system.
| Bioradar Frequency | 2.1 GHz | 2.4 GHz | 2.6 GHz |
|---|---|---|---|
| ximax | 0.365 Hz | 0.340 Hz | 0.325 Hz |
| ximin | 0.251 Hz | 0.299 Hz | 0.250 Hz |
Table 4.
Measurement results plus uncertainty value.
| Bioradar Frequency | 2.1 GHz | 2.4 GHz | 2.6 GHz |
|---|---|---|---|
| Measured value ± uncertainty | (0.320 ± 0.06) Hz | (0.321 ± 0.02) Hz | (0.270 ± 0.04) Hz |
© 2017 by the authors. Licensee MDPI, Basel, Switzerland. This article is an open access article distributed under the terms and conditions of the Creative Commons Attribution (CC BY) license (http://creativecommons.org/licenses/by/4.0/).
Share and Cite
MDPI and ACS Style
Cerasuolo, G.; Petrella, O.; Marciano, L.; Soldovieri, F.; Gennarelli, G. Metrological Characterization for Vital Sign Detection by a Bioradar. Remote Sens. 2017, 9, 996. https://doi.org/10.3390/rs9100996
AMA Style
Cerasuolo G, Petrella O, Marciano L, Soldovieri F, Gennarelli G. Metrological Characterization for Vital Sign Detection by a Bioradar. Remote Sensing. 2017; 9(10):996. https://doi.org/10.3390/rs9100996
Chicago/Turabian StyleCerasuolo, Giovanni, Orsola Petrella, Luigi Marciano, Francesco Soldovieri, and Gianluca Gennarelli. 2017. "Metrological Characterization for Vital Sign Detection by a Bioradar" Remote Sensing 9, no. 10: 996. https://doi.org/10.3390/rs9100996
Note that from the first issue of 2016, this journal uses article numbers instead of page numbers. See further details here.