Assessment of MODIS BRDF/Albedo Model Parameters (MCD43A1 Collection 6) for Directional Reflectance Retrieval
by

Xianghong Che
1,2,3, 
Min Feng
3,*, 
Joseph O. Sexton
3,
Saurabh Channan
3,
Yaping Yang
1,4 and
Qing Sun
5 1
State Key Laboratory of Resources and Environmental Information System, Institute of Geographic Sciences and Natural Resources Research, Chinese Academy of Sciences, Beijing 100101, China
2
University of Chinese Academy of Sciences, Beijing 100049, China
3
Global Land Cover Facility, Department of Geographical Sciences, University of Maryland, College Park, MD 20742, USA
4
Jiangsu Center for Collaborative Innovation in Geographical Information Resource Development and Application, Nanjing 210023, China
5
Collaborative Innovation Center on Forecast and Evaluation of Meteorological Disasters (CIC-FEMD), Nanjing University of Information Science & Technology, Nanjing 210044, China
*
Author to whom correspondence should be addressed.
Remote Sens. 2017, 9(11), 1123; https://doi.org/10.3390/rs9111123
Submission received: 6 September 2017
/
Revised: 29 October 2017
/
Accepted: 31 October 2017
/
Published: 4 November 2017
Abstract
:Measurements of solar radiation reflected from Earth’s surface are the basis for calculating albedo, vegetation indices, and other terrestrial attributes. However, the “bi-directional” geometry of illumination and viewing (i.e., the Bi-directional Reflectance Distribution Function (BRDF)) impacts reflectance and all variables derived or estimated based on these data. The recently released MODIS BRDF/Albedo Model Parameters (MCD43A1 Collection 6) dataset enables retrieval of directional reflectance at arbitrary solar and viewing angles, potentially increasing precision and comparability of data collected under different illumination and observation geometries. We quantified the ability of MCD43A1 Collection 6 for retrieving directional reflectance and compared the daily Collection 6 retrievals to those of MCD43A1 Collection 5, which are retrieved on an eight-day basis. Correcting MODIS-based estimates of surface reflectance from the illumination and viewing geometry of the Terra satellite (MOD09GA) to that of the MODIS Aqua (MYD09GA) overpass, as well as MCD43A4 Collection 6 and Landsat-5 TM images show that the BRDF correction of MCD43A1 Collection 6 results in greater consistency among datasets, with higher R2 (0.63–0.955), regression slopes closer to unity (0.718–0.955), lower root mean squared difference (RMSD) (0.422–3.142), and lower mean absolute error (MAE) (0.282–1.735) compared to the Collection 5 data. Smaller levels of noise (observed as high-frequency variability within the time series) in MCD43A1 Collection 6 in comparison to Collection 5 corroborates the improvement of BRDF parameters time series. These results corroborates that the daily MCD43A1 Collection 6 product represents the anisotropy of surface features and results in more precise directional reflectance derivation at any solar and viewing geometry than did the previous Collection 5.
1. Introduction
Reflection of solar radiation from complex surfaces varies with the directions of incoming and outgoing energy. Characterized by the bi-directional reflectance distribution function (BRDF) [1], this anisotropy effects the estimates of surface and top-of-atmosphere (TOA) reflectance, as well as all derived variables and their interpretation [2]. The effect is particularly severe for sensors with wide viewing swaths—including the MODIS sensor, which has a viewing swath of 2330 km.
A semi-empirical BRDF model is implemented in the standard MODIS BRDF/Albedo (MCD43) data product [3]. The model, originally proposed by Roujean, Leroy, and Deschamps [4] and later modified to account for the “hot spot” and other processes [3], is a linear model with two functions (i.e., kernels) and three parameters (i.e., kernel weights). The formulation of the kernels used to produce the MCD43 product were developed by Ross (1981) (i.e., “Ross—thick”) and by Li and Strahler (1992) (“Li—sparse”) [3,5].
The Ross-Li model estimates reflectance (ρ) as the sum of three terms [6]:
where F1 and F2 are analytical kernel functions of the solar or illumination angle (θs), relative azimuth (), and viewing angle (θv), and ki are kernel weights. The first, isotropic term k0 represents bidirectional reflectance for θs = θv = 0. The second k1 × F1 and the third terms k2 × F2 represent the volumetric and geometric scattering contributions to the surface reflectance, respectively.
The MODIS BRDF/Albedo Model Parameters (MCD43A1) data are estimates of the Ross—Thick/Li—Sparse-Reciprocal spectral model parameters (ki of Equation (1)) that best fit the cloud-free, atmospherically-corrected MODIS Terra and Aqua reflectance values observed at each pixel location over a 16-day period [7]. Operational since 2001, Collection 5 of the dataset is retrieved every eight days. Collection 6 of the MCD43A1 dataset, now being distributed, is retrieved daily and represents the best-fit BRDF based on a 16-day observation period [8]. Unlike MCD43A1 Collection 5, in which the nominal date represents the first day of the retrieval period, the date associated with daily Collection 6 retrieval is the center of the moving 16-day input window.
Collection 5 of the MODIS MCD43A1 dataset has been validated using ground measurements and images from the Enhanced Thematic Mapper Plus (ETM+) sensor aboard Landsat-7 [9]. Jin et al. examined the MODIS BRDF algorithm performance using the product quality assurance (QA) fields and compared retrieved albedos with those observed at ground stations [10]. Román et al. validated satellite retrievals from global land-surface albedo and reflectance anisotropy products against tower-based measurements and Enhanced Thematic Mapper Plus (ETM+) retrievals of surface albedo [11,12]. Wang et al. assessed the MODIS standard Bidirectional Reflectance Distribution Function (BRDF)/Albedo product over tundra, grassland, agriculture, and forest surface types using ground-based albedo measurements [13,14].
Confident use of the new Collection 6 MODIS BRDF parameters dataset for Earth-science investigation requires independent validation of the dataset and an assessment of its ability to serve retrieval of higher-level surface attributes. Although directional reflectance is difficult to measure at ground stations, evaluating MODIS BRDF parameters and their impact on estimation of directional reflectance will improve consistency of satellite measurements over time, over large areas, and between sensors, and information which is needed to precisely calculate vegetation and other indices affected by reflectance anisotropy [15].
This paper evaluates the quality of MCD43A1 Collection 6 by using it to generate BRDF-corrected MODIS directional reflectance and compares the resulting estimates to nearly coincident MODIS and Landsat TM observations compared to Collection 5. High-frequency noise in time-series directional of directional reflectance based on MCD431A1 Collection 6 and Collection 5 were compared to assess the improvement of MCD431A1 Collection 6 to represent land surface phenology.
2. Methods
2.1. Data
2.1.1. MODIS Data
The MODIS Daily Surface Reflectance data products from the Aqua satellite (MYD09GA) and Terra satellite (MOD09GA) are seven-band datasets computed from the MODIS Level 1B land bands, 1 through 7. Corrected for the effects of atmospheric gases and aerosols, each product is an estimate of the surface reflectance for each band as it would have been measured at ground level with no atmospheric scattering or absorption [16]. Terra and Aqua are in sun-synchronous orbits; the Terra (formally EOS AM) spacecraft crosses the equator at 10:30 a.m. local time (descending node), and Aqua (formally EOS PM) crosses at 1:30 p.m. local time (ascending node), thereby providing two views with different sun-target-sensor geometries of each location daily [17].
The MODIS Bidirectional Reflectance Distribution Function and Albedo (BRDF/Albedo) Model Parameters dataset (MCD43A1 Collection 6) is a 500-m, daily resolution dataset. The Julian date in the granule ID of each file represents the 9th day of its 16 day retrieval period, with the observations weighted to estimate the BRDF and albedo for that day. The MCD43A1 provides the three model weighting parameters (k0, k1 and k2 in Equation (1)) for each of the visible (VIS), near infrared (NIR), and shortwave bands—i.e., bands 1–7 [16]. Collection 5 of the MCD43A1 dataset is retrieved every eight days within a 16-day acquisition period, and Collection 6 is retrieved daily. The MODIS Nadir BRDF-Adjusted Reflectance (NBAR) data product (MCD43A4 Collection 6) provides estimates of surface reflectance corrected to nadir viewing angle for the seven MODIS “land” bands at 500-m spatial resolution [7,18]. The estimates are corrected to an illumination angle of local solar noon, which varies in space and time. Comparing surface reflectance throughout the year or over large spatial scales requires correcting the estimates to the same illumination and viewing geometries [19,20], which limits the application of MCD43A4 for the time series analysis and comparisons over large regions.
2.1.2. Landsat Data
A Landsat-5 Thematic Mapper (TM) image from WRS-2 Path25/Row34 and date 25 August 2010 was processed through the Landsat Ecosystem Disturbance Adaptive Processing System (LEDAPS, version 1.2.0) to compensate for atmospheric scattering and absorption effects [21] and then used to assess the utility of MCD43A1 BRDF parameters for estimating directional reflectance at its illumination and viewing angles. The respective MODIS bands have similar spectral response functions and are highly correlated with the six Landsat multispectral measurements [22] (Table 1). Terra and Landsat-7 are in the same orbit, with nadir observations by Terra MODIS occurring approximately 15 min after Landsat-7 ETM+ observations. However, the orbit of Landsat-5 differs from MODIS Terra [21]. Thus, whereas Landsat-7 ETM+ has similar solar and view geometry as coincident MODIS observations (e.g., MOD09GA), there is a larger difference in solar and view zenith angles between Terra MODIS and Landsat-5 TM.
2.2. Analysis
2.2.1. BRDF Correction
We normalized the MODIS surface reflectance (MOD09) bands (ρN) to the observation geometry derived from reference data (e.g., MYD09GA, Landsat-5, or MCD43A4) using the c-factor approach [23], by multiplying the observed reflectance (ρ) by the ratio between normalized reflectance based on the MCD43A1 parameters and reflectance modeled using observed viewing, illuminating and azimuthal angles. The normalized reflectance, ρΝ, was therefore computed as:
where ρ is the observed reflectance, and ρΝ is the normalized reflectance, i.e., after correction for directional effects. θso, θvo, and ϕo are the sun zenith, view zenith, and relative azimuth angles from the observed geometry, respectively; θsp, θvp, and ϕp are sun zenith, view zenith, and relative azimuth angles from the predicted geometry. The isotropic term k0, volumetric term k1 and geometric term k2 can be acquired from MCD43A1 product. Only the high-quality parameters (labeled as “Full BRDF inversion” (value: 0) in the BRDF_Albedo_Band_Mandatory_Quality_Band layer for each band [16]) were used in the correction. Following correction, we extracted the—band 1 through 7 surface reflectance, viewing, and illumination angles, and the quality index from the daily MOD09GA and discarded observations based on the threshold values for cloud state and aerosol quantity or acquisition geometry shown in Table 2 [24].
2.2.2. Assessment of Directional Reflectance Estimates
To compare the utility of the MCD43A1 Collection 5 versus Collection 6 datasets for estimating directional reflectance, Equation (4) was applied to MOD09GA using the viewing and illumination angles from nearly coincident MYDO9GA, MCD43A4 Collection 6, and Landsat-5 TM images. The coefficient of determination (R2), mean absolute error (MAE), and root mean squared difference (RMSD) [25] were then used to quantify the agreement between the corrected directional reflectance derived from MCD43A1 Collection 6 and Collection 5 and the coincident estimates from MYDO9GA and Landsat TM.
Equation (4) was applied to correct MODGA SR to the solar and view geometry of MYD09GA, using parameters from MCD43A1 Collection 6 and Collection 5, and the resulting estimates were compared. Only high-quality pixels from MOD09GA and MYD09GA were used, as identified by the QA layer (Table 3) from MOD09GA and MYD09GA. MOD09GA was also corrected to nadir viewing and solar zenith angle at local solar noon to evaluate the consistency of MCD43A1 Collection 6 with NBAR data (MCD43A4 Collection 6).
A Landsat-5 image acquired on the same date as MOD09GA data was used as standard to compare the performance of the two MCD43A1 collections. To maximize comparability, the Landsat image was aggregated with the MODIS projection and pixel footprint, and samples were taken from spatially-homogeneous regions of the overlapping images. The range of values was calculated as the difference within the 9 MODIS pixels in the 3 × 3 window centered in each MODIS pixel, and the same was done for each Landsat pixel within the neighborhood. The focal MODIS pixels with both ranges <0.03 were assumed to be homogeneous and fit for analysis [26]. To minimize the impact of cloud movement between Landsat and MODIS acquisitions, cloud and shadow pixels from either MODIS or Landsat were excluded from the sample.
MCD43A1 Collections 5 and 6 parameters were applied to time-series of MOD09GA to assess the performance of BRDF correction using high-frequency variation as a criterion. MOD09GA were corrected to a typical illumination and observation geometry for space-borne remote sensing: with the sun at 45° from zenith and nadir viewing. For daily MOD09GA, the contaminated pixels over 365 days were filtered as described in Section 2.2.1, and MOD09GA were corrected to the standard geometry. We quantified noise (the high-frequency variability within the time series) as the difference between the center observation from a triplet of successive observations (i, i + 1 and i + 2) and the estimated value assuming a linear interpolation between the two extremes [24,27]:
where yi represents the observed reflectance in a given day (i, i + 1, or i + 2). This index of noise increases with the mean of the observations; to compare noise among features with different average reflectance values, we also calculated a relative index of noise as:
Absolute and relative noise metrics were calculated for the year 2015 in four land cover types (evergreen forest, deciduous forest, farmland and grassland) in MODIS Tile h10v05, corrected to the standard geometry for MODIS bands 1 and 2 using MCD43A1 Collection 6 and Collection 5 parameters.
3. Results
3.1. Comparison of MODIS Directional Reflectance Estimates
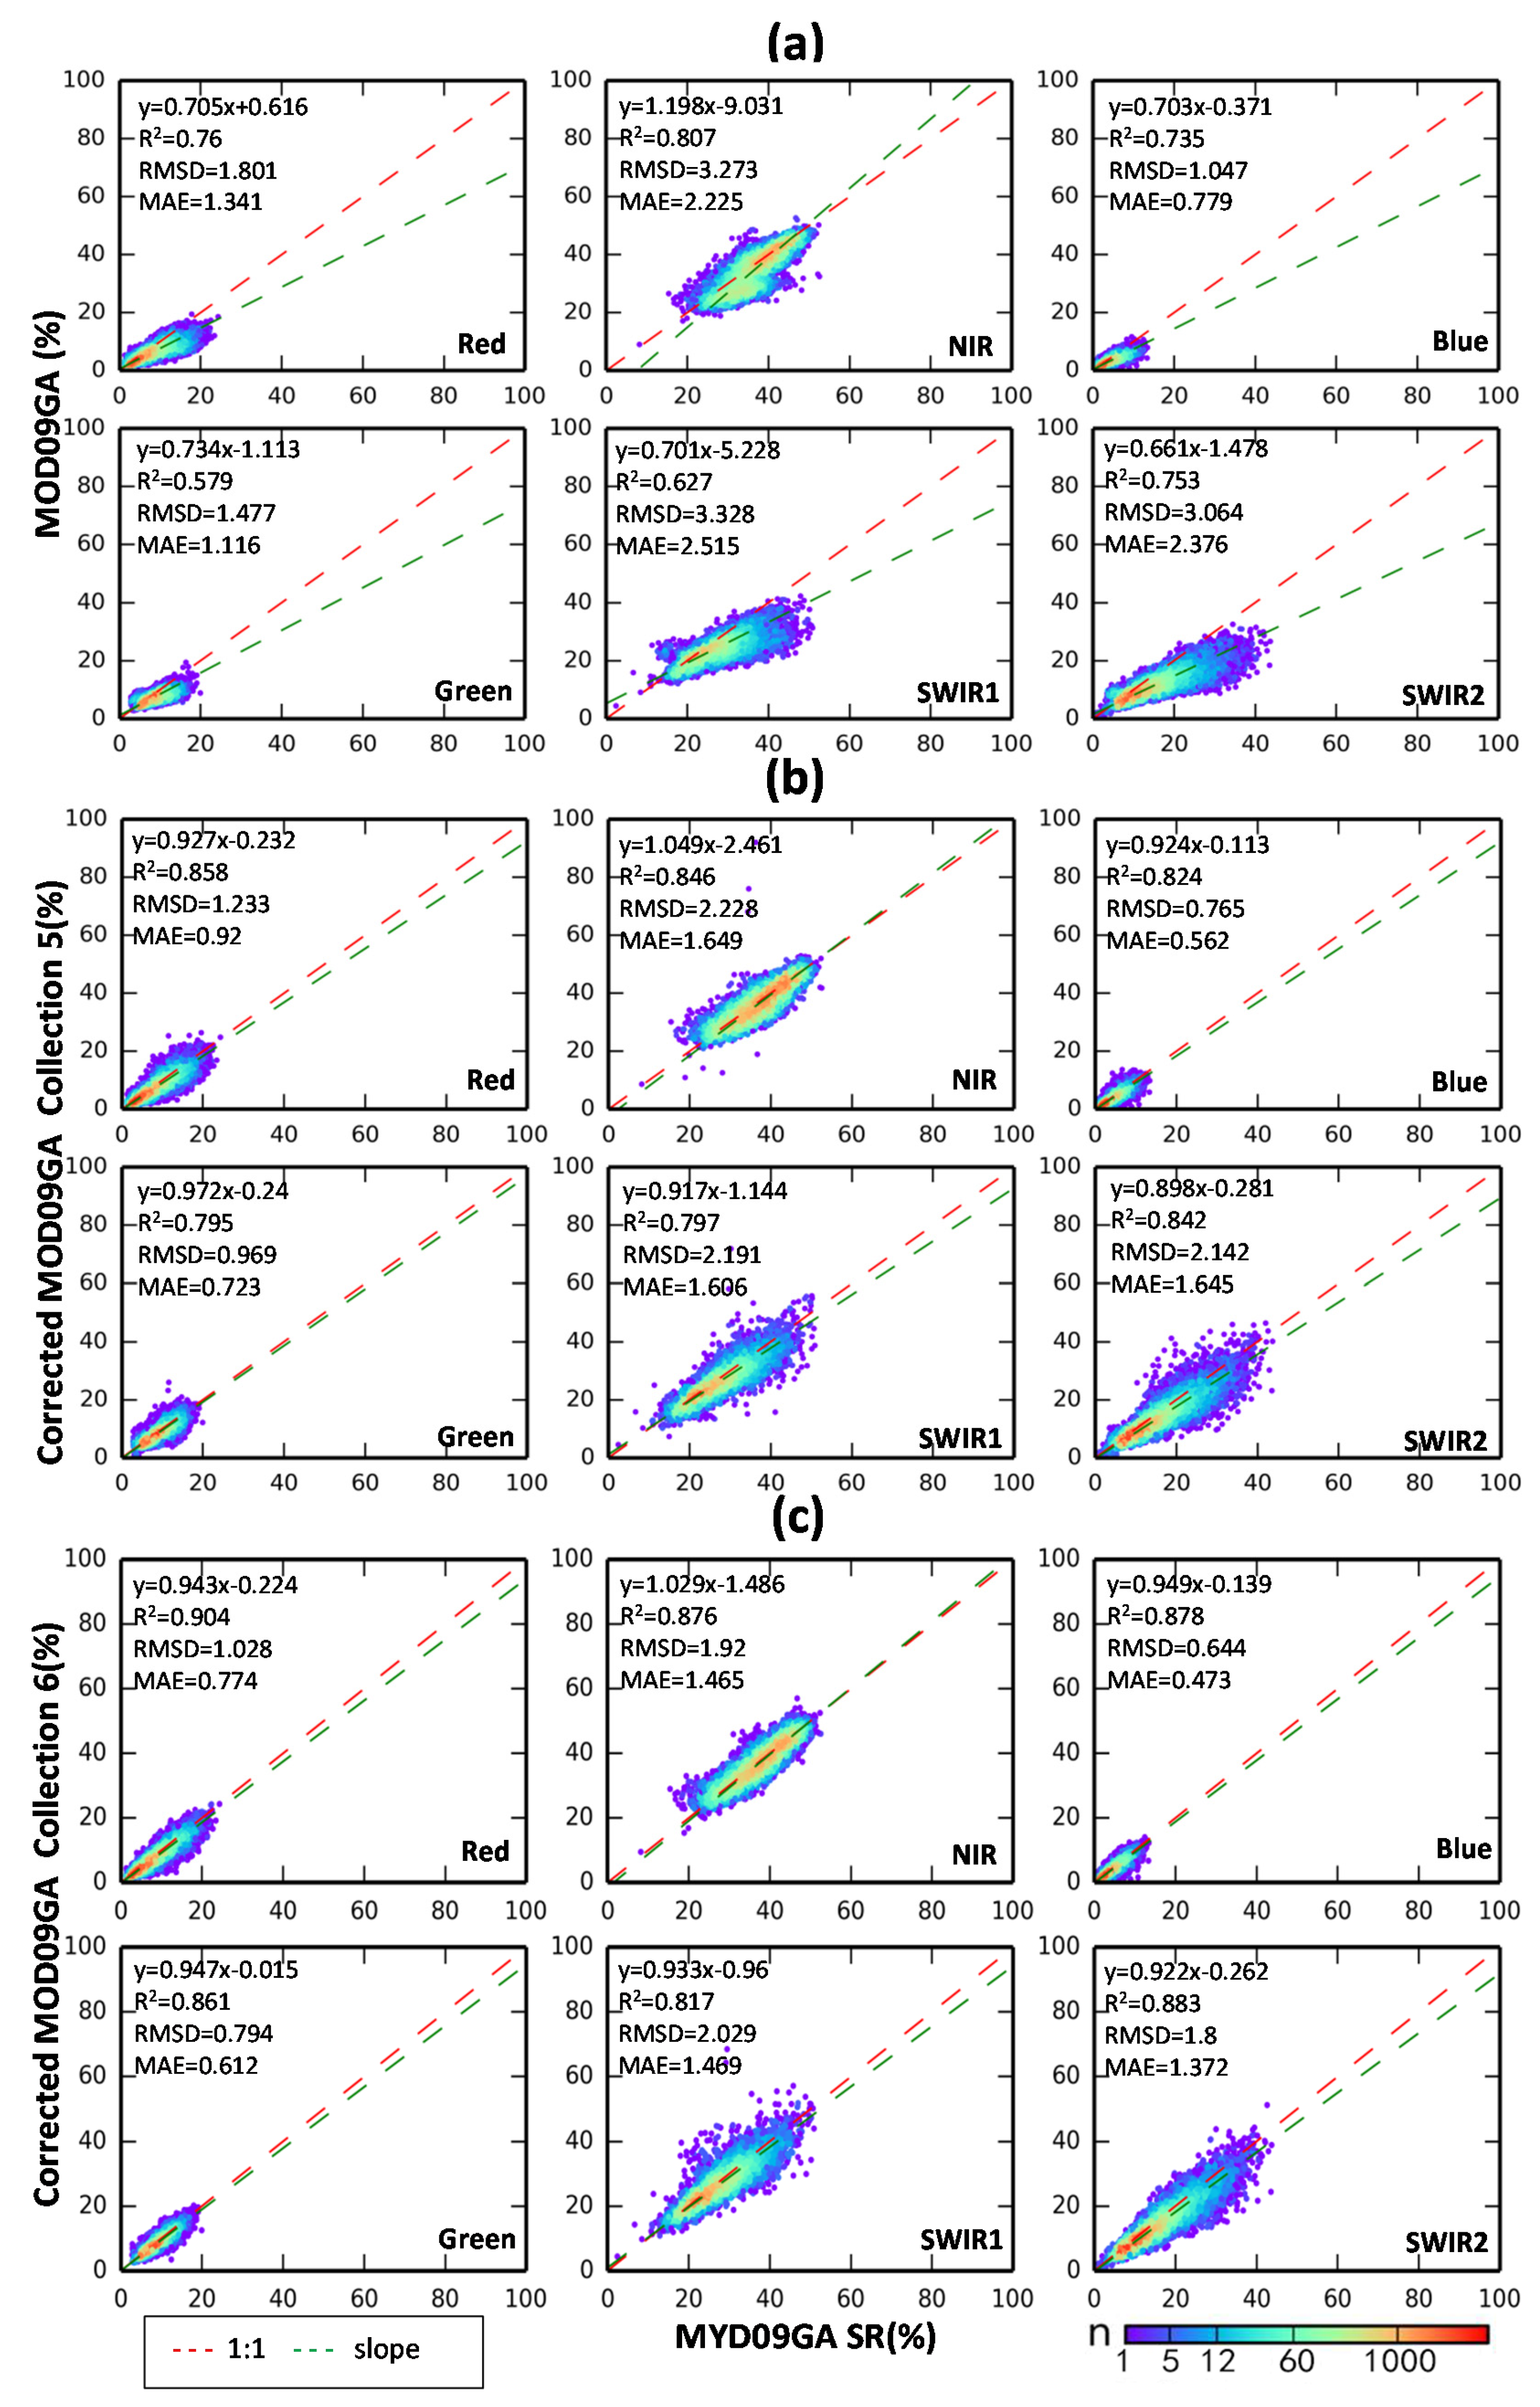
Correlation between the original estimates of directional reflectance from MODIS Terra and Aqua (MOD09GA and MYD09GA, respectively) (Figure 1a) was weak in every band. Regression slopes ranged from 0.661 and 1.198, and R2 < 0.8 in each band, except for NIR. MAE ranged from 1.341 to 2.515 and increased with wavelength.
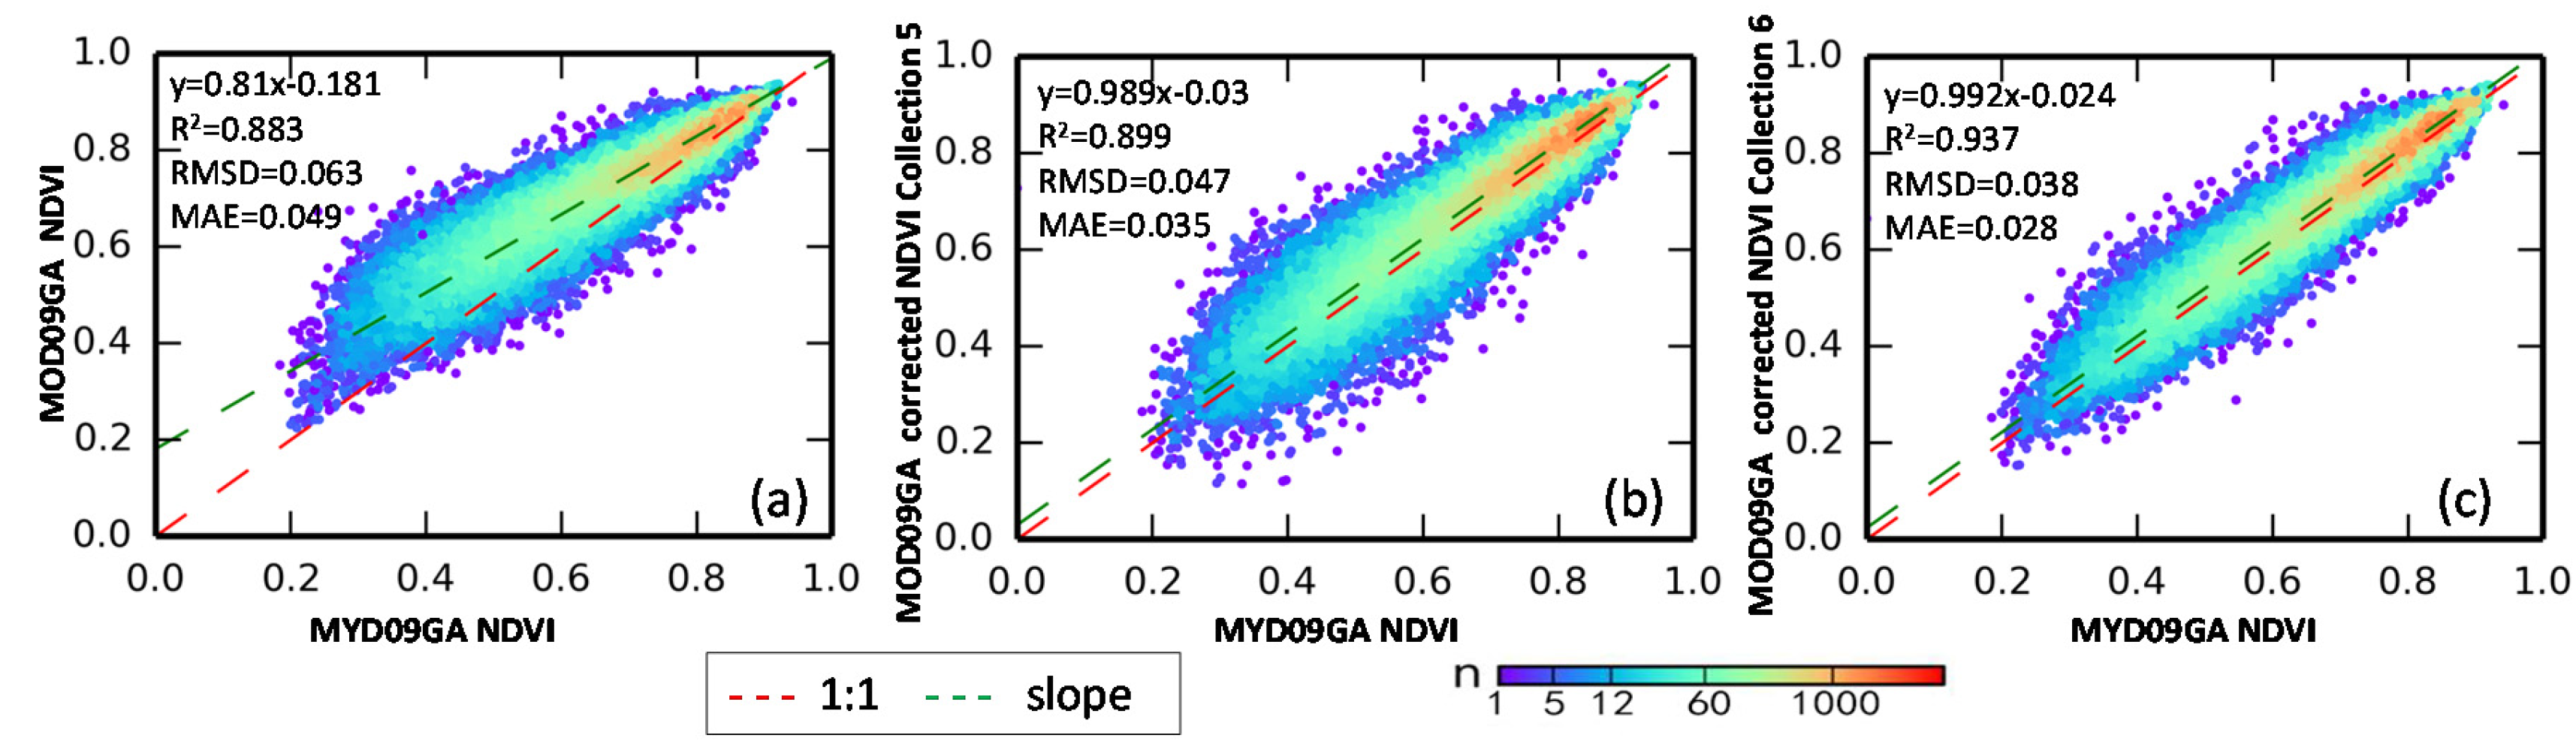
BRDF correction increased the correlation between Terra and Aqua estimates of directional reflectance, suggesting that this portion of the deviation was due to BRDF effects (Figure 2). MOD09GA estimates of surface reflectance had higher correlation with the MYD09GA (Figure 1c) after BRDF-correction based on MCD43A1 Collection 6 parameters, with regression slopes > 0.9 and R2 > 0.8 in all bands. RMSD and MAE were reduced by 42%. However, correction based on Collection 5 of the MCD43A1 parameters yielded weaker consistency between the sensors, with slopes further from unity, lower R2, and reductions of RMSD and MAE 31% lower than that of the result derived from of the Collection 6 parameters (Figure 1b).
The corrected MOD09GA and corresponding NBAR estimates of directional reflectance (MCD43A4 Collection 6) were highly correlated (Figure 3), with R2 > 0.9 for all six bands and slopes ≈ 1.0. RMSD between corrected MOD09GA and MCD43A4 ranged from 0.422 to 1.269 percentage points of reflectance, and MAE ranged from 0.282 to 0.921 percentage points. Additionally, the spread of this comparison was narrower than the result from MODIS Terra-Aqua data (Figure 1b,c), with the slopes of closer 1:1, higher R2 and lower RMSD and MAE. This is likely explained by the fact that MCD43A4 represented a 16-day average reflectance, and MCD43A1 parameters were fitted from the observed data during the 16-day period, while MOD09GA/MYD09GA directional reflectance is an instantaneous product.
3.2. Comparison of MODIS to Landsat Directional Reflectance
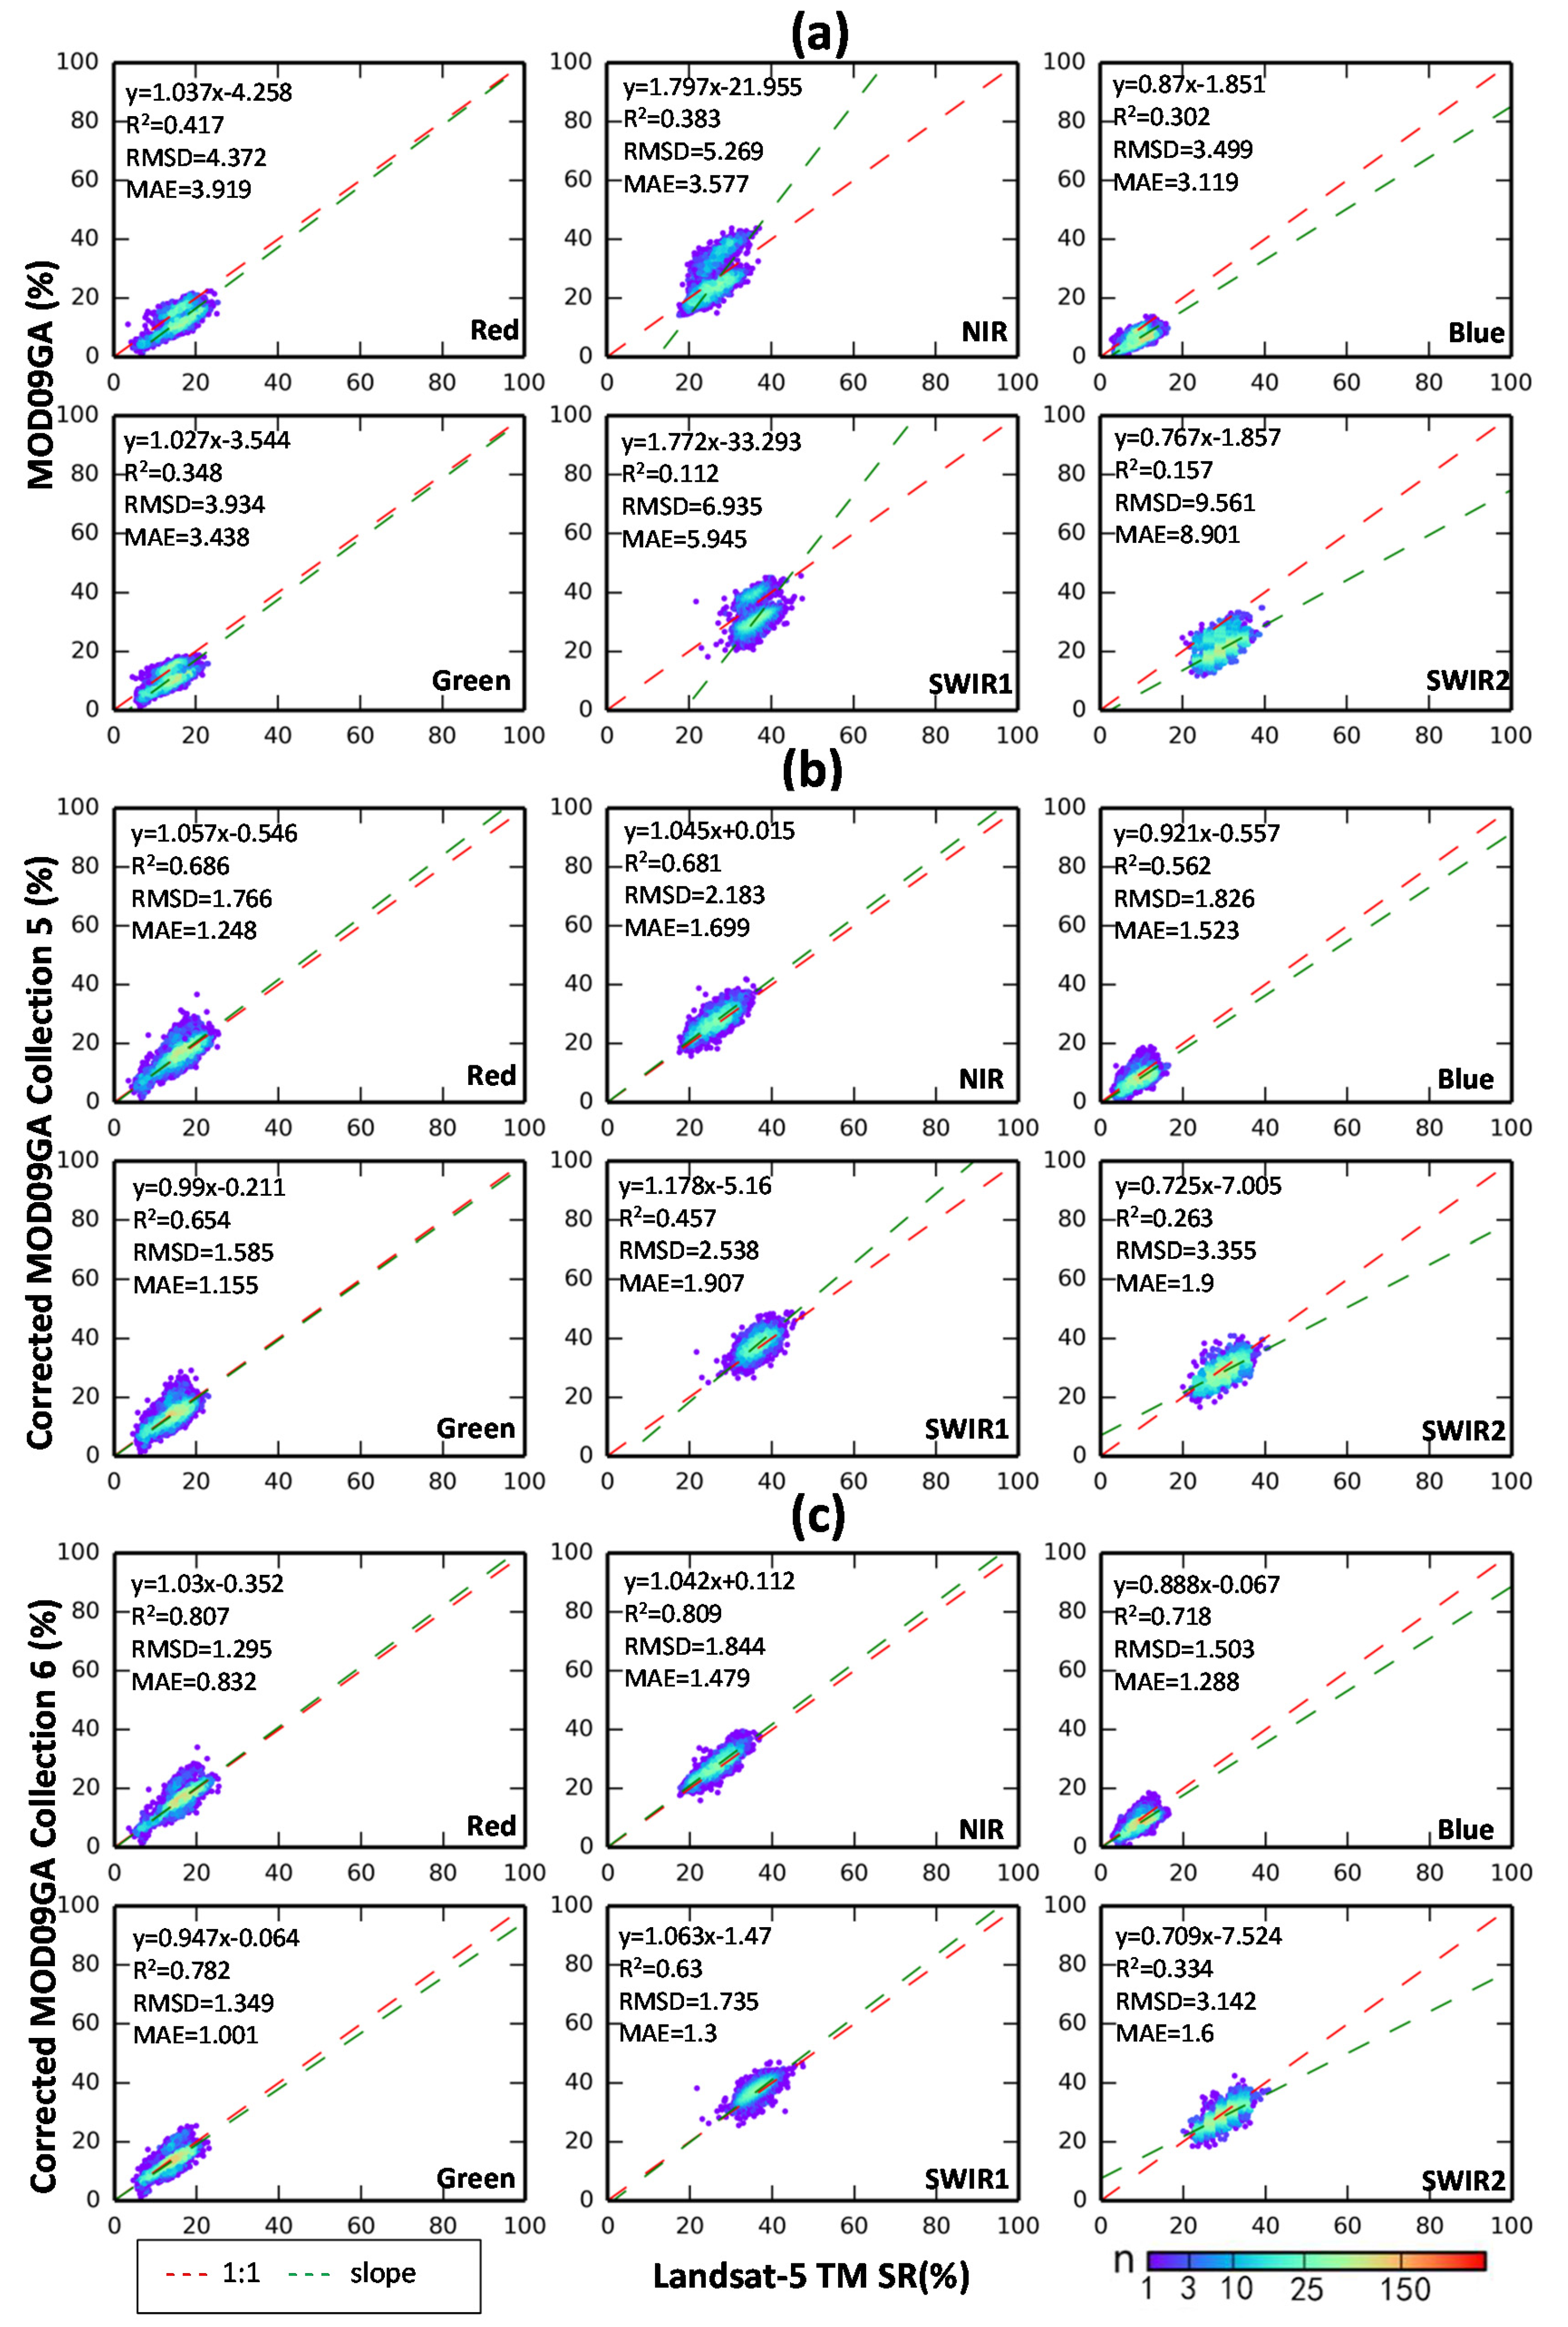
Large differences were evident between estimates of surface reflectance from Terra MODIS and coincident Landsat-5 TM measurements (Figure 4a). RMSD between the MOD09GA estimates and the aggregated Landsat-5 TM estimates ranged from 3.499 to 9.561. MAE ranged from 3.119 to 8.901, and R2 < 0.5 for each band. The differences between the two sets of estimates were likely due to differences in solar geometry: the solar zenith angle of the TM image was 34.69°, and the view zenith angle was ~0° across the narrow (~185-km) swath, while the corresponding solar zenith angles across the MODIS image varied between 27° and 37°, with view zenith angles > 50°.
After BRDF correction, consistency of Landsat-5 TM and MOD09GA was greatly increased (Figure 4b,c). Regression slopes were closer to unity in each band, except for SWIR2 (Figure 4c). Compared to the original MOD09GA result, RMSD and MAE values for each of the six bands were reduced by 67%, and the largest RMSD and MAE was 3.142 and 1.6. These were lower than the minimum values (3.499 RMSD and 3.119 MAE) found in the comparison of the original, uncorrected MOD09GA.
BRDF correction using MCD43A1 Collection 6 eliminated much of the observed differences. Although the corrected MOD09GA using MCD43A1 Collection 5 had similar linear correlations with lower R2 and greater RMSD and MAE decreased by 59% (Figure 4b), the relationship based on the MCD43A1 Collection 6 was more strongly linear in terms of slope, R2, RMSD, and MAE (Figure 4c). However, the difference between MODIS- and Landsat-based estimates of surface reflectance were larger compared to the MODIS Terra-Aqua comparison, in which R2 > 0.8 for each band (Figure 1b,c). This is likely due to differences between sensors’ spectral responses and different orbits [26]. Additionally, there were still some discrepancies in comparison to Landsat-5 TM SR, particularly for two MODIS SWIR bands (0.63 and 0.334 for R2 values, respectively). Due to the wavelength differences between Landsat-5 and MODIS bands (Table 1), MODIS and TM bands do not have the exact same spectral response functions, which are likely source of the SR differences [28]. There was also an large unexplained deviation for the MODIS SWIR2 band.
3.3. Analysis of Time-Serial MCD43A1
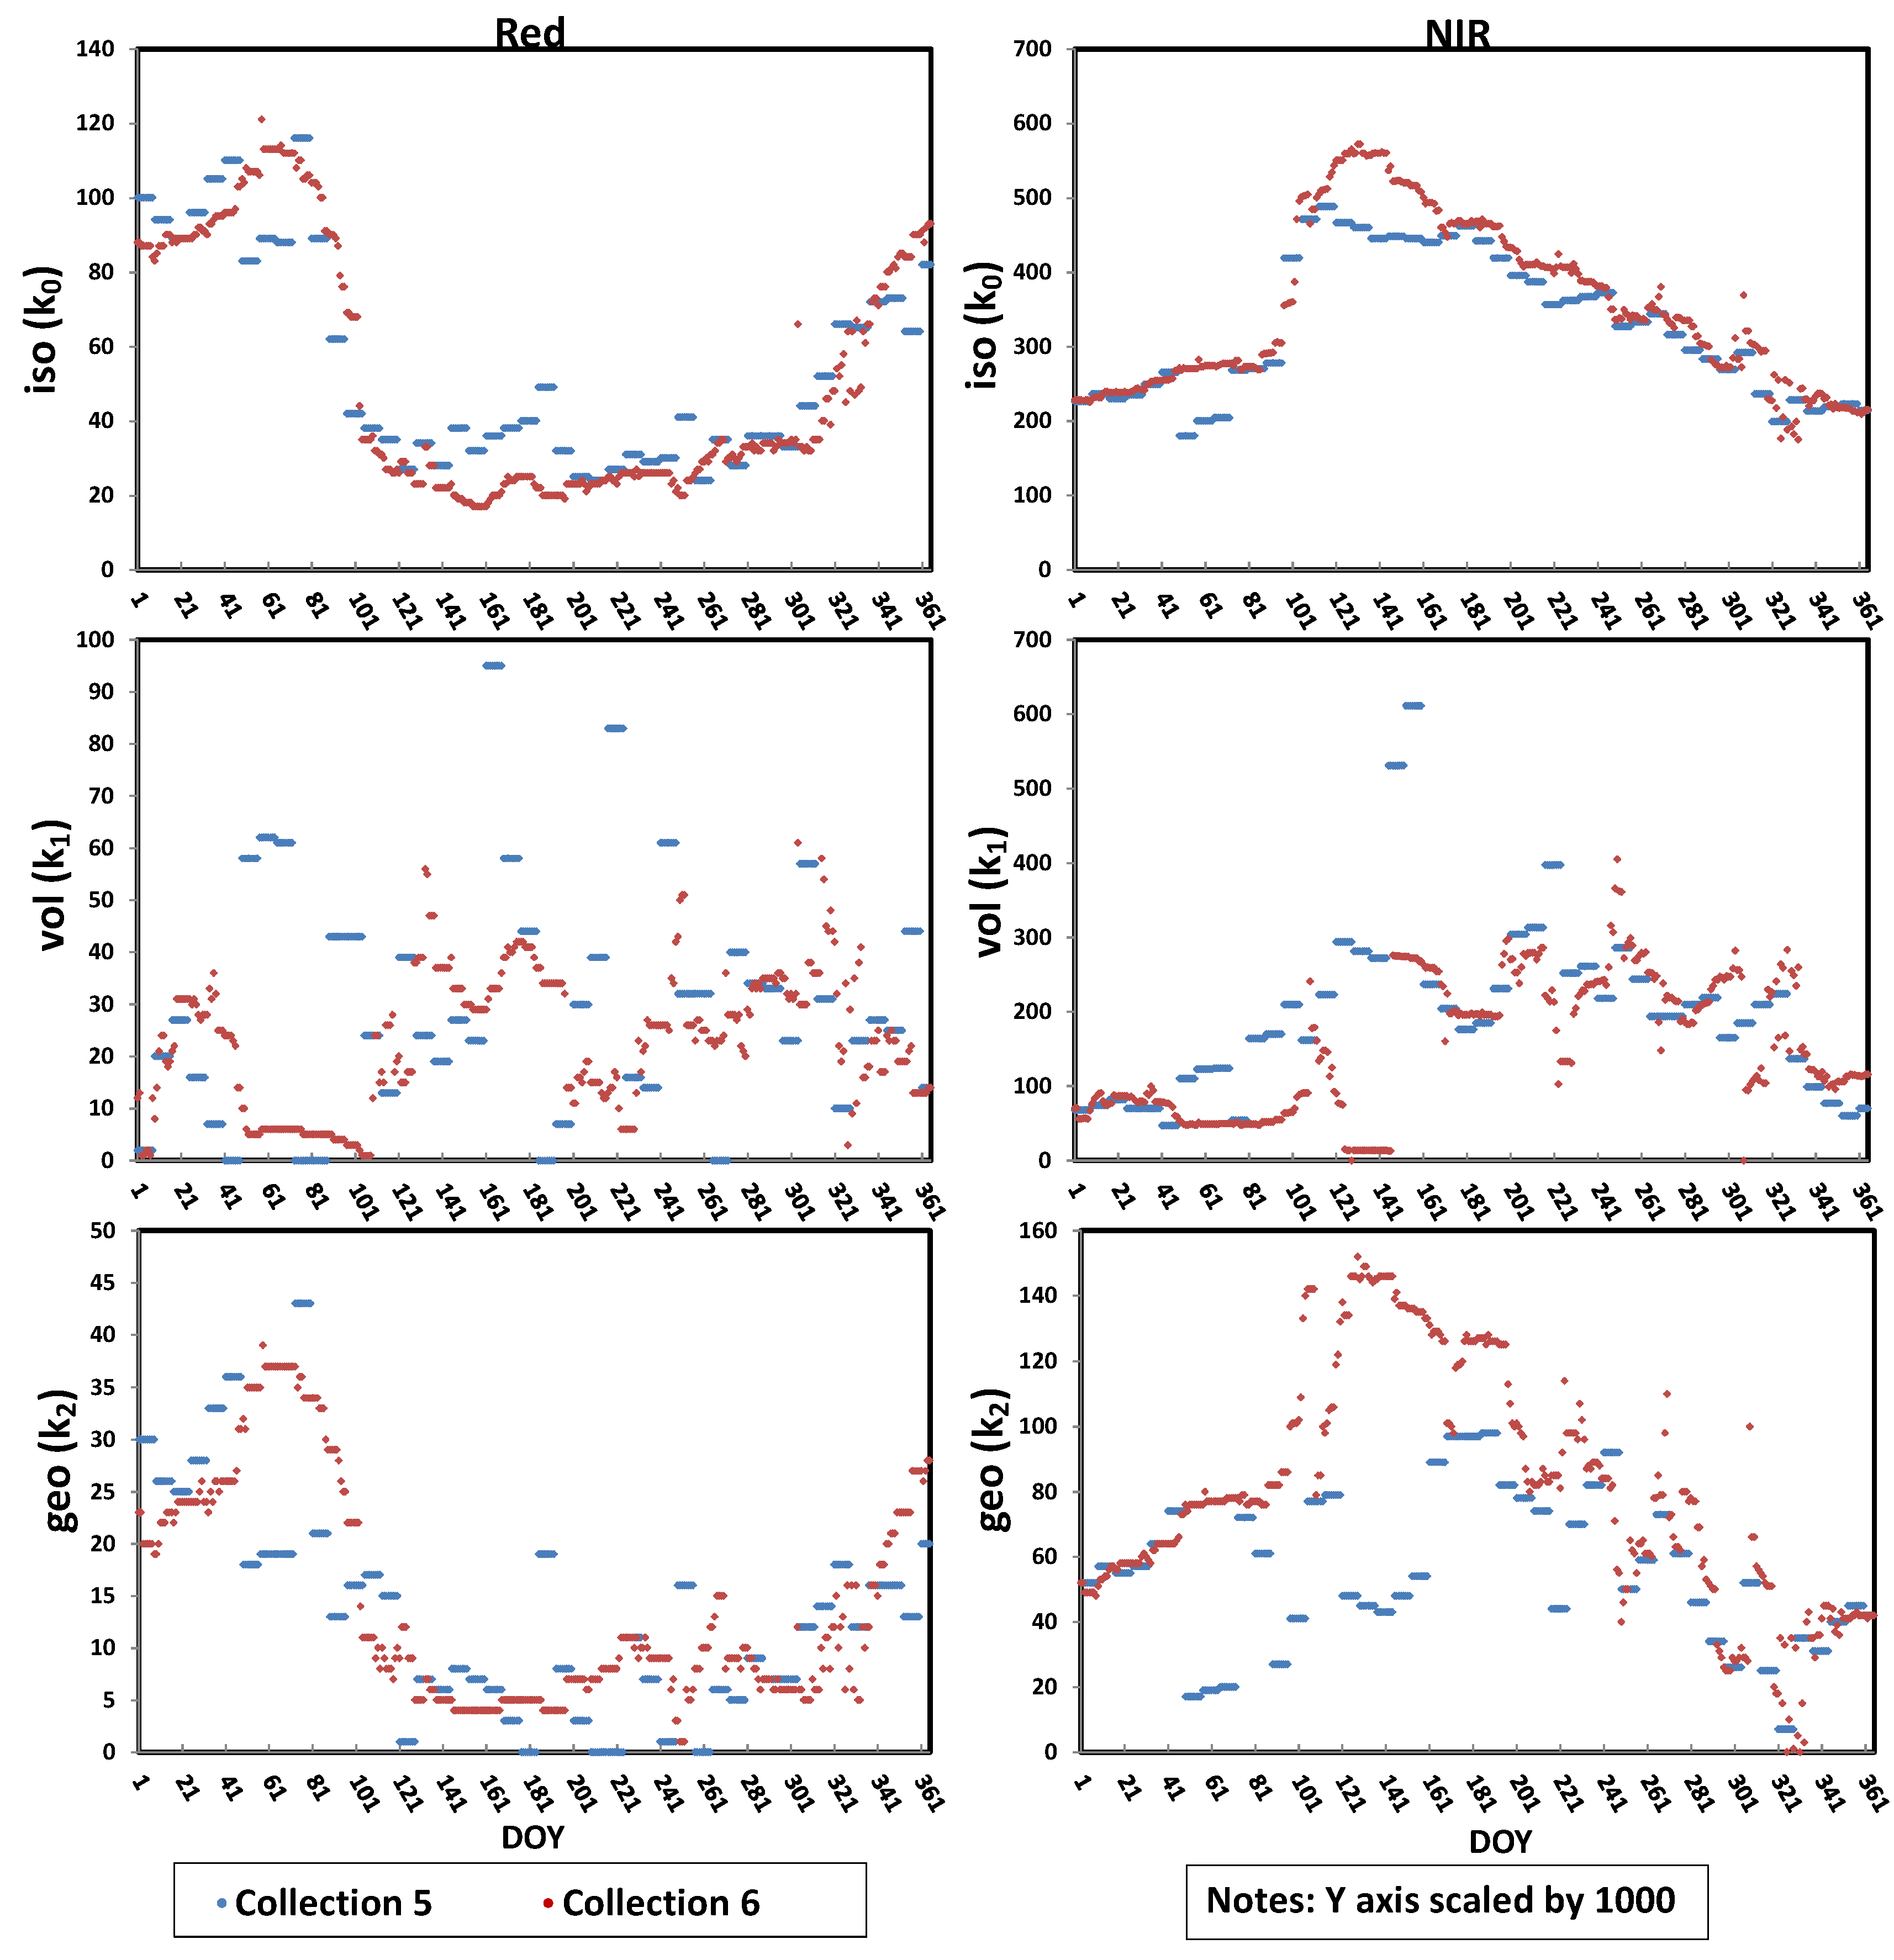
The MCD43A1 Collection 5 parameters showed significant high-frequency variability, beyond what would be expected within any 16-day period [29]. After calibration, MCD43A1 Collection 6 parameters were more continuous than either the uncalibrated time series or the Collection 5 MCD43A1 (Figure 5). The two versions of BRDF parameters significantly reduced the high-frequency noise in the estimates of directional reflectance (Figure 6). After BRDF correction, temporal signatures that were undistinguishable from noise in the original MOD09GA time series became discernible. When comparing estimates derived from MCD43A1 Collection 5, directional reflectance from MCD43A1 Collection 6 showed modest improvement, although there was a large improvement of BRDF parameters—indicating that variability in the MCD43A1 parameters do not have a discernable impact on the reflectance time series. These probably result from many factors, including undetected shadow or errors in atmospheric correction, measurement noise, or non-linear reflectance temporal variations [30].
Noise in time-series of directional reflectance derived from two corrections was significantly lower than original MODO09GA (Table 3). The directional reflectance from MCD43A1 Collection 6 changed more steadily (Figure 6), and the NoiseR decreased by nearly 63% for the red band and 73% for the NIR band, while the corresponding values for MCD43A1 Collection 5 correction were 56% and 65%, respectively.
4. Discussion
4.1. The Value of Directional Reflectance Correction
The ability to retrieve directional reflectance at arbitrary geometries has several potential applications [31,32,33,34,35]. BRDF-related spectral variations over time are often confused with land-cover change [7], with biases introduced by such inappropriate data fusion potentially exceeding minimum sensitivity levels of climate models [2,36]. These effects can be pronounced [37,38] in data based on measurements from wide-angle sensors, such as the NOAA Advanced Very High Resolution Radiometer (AVHRR), MODIS, the Multi-angle Imaging Spectroradiometer (MISR), the Polarization and Directionality of Earth Reflectance (POLDER) sensor, and the recent Visible Infrared Imaging Radiometer Suite (VIIRS). BRDF effects have even been found in imagery collected by narrower-swath, medium -resolution sensors such as Landsat and Systeme Probatoire d'Observation de la Terre (SPOT) [39]. After correcting multi-source and/or time-serial data to consistent illumination and viewing geometries, these effects could be minimized, and spectral variations can be better assumed to reflect real changes in surface properties [40]. Furthermore, if directional reflectance can be derived from coarse, medium- and higher-resolution sensors, their increased comparability could result in fusion of multi-temporal and multi-resolution data [23], further facilitating long-term monitoring of land-cover change [41,42].
4.2. Variability of the MCD43A1 Product
Even after the correction parameters were derived from the full BRDF inversions, some differences were still apparent between corrected MOD09GA and MYD09GA. A systematic under-estimation was visible as regression slopes < 1.0 in all bands except NIR (Figure 1c), and is likely to be caused by three factors. First, for some observation geometry configurations, F1 and F2 (Equation (1)) are highly uncorrelated, which make the inversion of their respective parameters poorly constrained [8]. Second, the MODIS BRDF parameters (MOD43A1 Collection 6) are fitted from the observed data during a 16-day period, whereas MYD09GA directional reflectance is an instantaneous product [9]. Third, the difference between the two estimates could have resulted from small changes in surface features during the time difference of satellite overpassing (10:30 a.m. and 1:30 p.m., respectively) [43]. Therefore, to thoroughly estimate the quality of the MCD43A1 product for directional surfaces, the factors that cause low-quality magnitude inversions [16] should be taken into account and validation on the larger continental and global scales is needed in the future validation research.
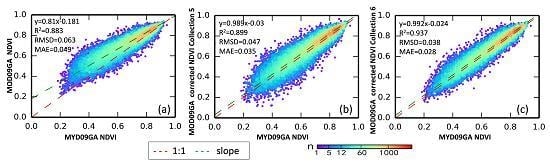
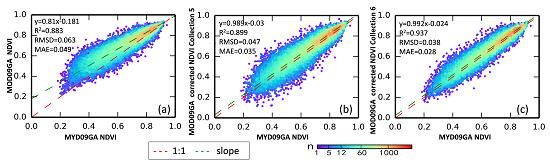
The scattering properties of electromagnetic radiation vary across wavelengths, and so the BRDF effect responds differently to the surface reflectance of every band. RMSD values varied from 0.644 to 2.029 among the six bands (Figure 1). If anisotropy is equal between bands, Normalized Difference Vegetation Index (NDVI, a ratio index between two bands) will not change regardless of BRDF correction. Yet, compared to the original NDVI (Figure 7a), the correlation of the corrected result using MCD43A1 Collection 6 (Figure 7c) increased from 0.883 to 0.937, and the slope (0.992) was closer to 1. The RMSD value was reduced by 40%, demonstrating the disproportional BRDF effects on different bands [44,45]. Compared to the corrected MOD09GA result with MCD43A1 Collection 5 (Figure 7b), the spread of the Collection 6 result was narrower, with higher R2 and lower RMSD and MAE, demonstrating the improvement of MCD43A1 Collection 6 over Collection 5. Moreover, it is important to note that BRDF correction improves the precision of even of ratio-based vegetation indices (VI) [46], due to its mitigation of the different anisotropies of different wavelengths.
5. Conclusions
The recently released Collection-6 of the MODIS BRDF/Albedo Parameters dataset (MCD43A1), enables estimation of direction directional surface reflectance at arbitrary illumination and viewing geometries and improves upon the utility of Collection 5 of the MCD43A1 dataset from two aspects. When corrected to the illumination and viewing geometries of nearly coincidental MYD09GA and Landsat-5 TM images using the Collection-6 MCD43A1 parameters, MOD09GA (MODIS Terra) estimates of surface reflectance yielded higher R2, regression slopes closer to 1:1, lower RMSD, and lower MAE compared to the same results yielded by the Collection-5 parameters. Additionally, comparisons of high-frequency noise in time-series of corrected surface reflectance suggests that MCD43A1 Collection 6 can more precisely discriminate real changes in the land surface better than was possible with the previous, Collection 5, dataset.
Acknowledgments
Support for this effort was provided by the National Science Foundation, Office of Polar Programs, Arctic System Science Program, proposal number 1604105. The authors are indebted to the National Aeronautics and Space Administration for providing the MODIS data (https://modis.gsfc.nasa.gov/), U.S. Geological Survey server (http://glovis.usgs.gov), and the Global Land Cover Facility server (http://www.landcover.org) that were used in this study. In addition, we would like to thank the anonymous reviewers for their helpful comments and suggestions in enhancing this manuscript.
Author Contributions
Xianghong Che drafted the manuscript and was responsible for the research design, experiments, and analysis. Min Feng, Joseph O. Sexton, and Saurabh Channan reviewed the manuscript and were responsible for the research design and analysis. Yaping Yang provided some of the data. Qing Sun supported the data preparation and the interpretation of the results. All of the authors contributed to editing and reviewing the manuscript.
Conflicts of Interest
The authors declare no conflict of interest.
References
- Maignan, F.; Bréon, F.-M.; Lacaze, R. Bidirectional reflectance of earth targets: Evaluation of analytical models using a large set of spaceborne measurements with emphasis on the hot spot. Remote Sens. Environ. 2004, 90, 210–220. [Google Scholar] [CrossRef]
- Schaepman-Strub, G.; Schaepman, M.; Painter, T.; Dangel, S.; Martonchik, J. Reflectance quantities in optical remote sensing—Definitions and case studies. Remote Sens. Environ. 2006, 103, 27–42. [Google Scholar] [CrossRef]
- Li, X.; Strahler, A.H. Geometric-optical bidirectional reflectance modeling of the discrete crown vegetation canopy: Effect of crown shape and mutual shadowing. IEEE Trans. Geosci. Remote Sens. 1992, 30, 276–292. [Google Scholar] [CrossRef]
- Roujean, J.L.; Leroy, M.; Deschamps, P.Y. A bidirectional reflectance model of the earth’s surface for the correction of remote sensing data. J. Geophys. Res. Atmos. 1992, 97, 20455–20468. [Google Scholar] [CrossRef]
- Ross, J. The Radiation Regime and Architecture of Plant Stands; Springer Science & Business Media: Berlin, Germany, 2012; Volume 3. [Google Scholar]
- Strahler, A.H.; Muller, J.; Lucht, W.; Schaaf, C.; Tsang, T.; Gao, F.; Li, X.; Lewis, P.; Barnsley, M.J. MODIS BRDF/Albedo product: Algorithm theoretical basis document version 5.0. MODIS Doc. 1999, 23, 42–47. [Google Scholar]
- Schaaf, C.B.; Gao, F.; Strahler, A.H.; Lucht, W.; Li, X.; Tsang, T.; Strugnell, N.C.; Zhang, X.; Jin, Y.; Muller, J.-P. First operational BRDF, Albedo nadir reflectance products from MODIS. Remote Sens. Environ. 2002, 83, 135–148. [Google Scholar] [CrossRef]
- Zhang, X.; Friedl, M.A.; Schaaf, C.B.; Strahler, A.H.; Hodges, J.C.; Gao, F.; Reed, B.C.; Huete, A. Monitoring vegetation phenology using MODIS. Remote Sens. Environ. 2003, 84, 471–475. [Google Scholar] [CrossRef]
- Liang, S.; Fang, H.; Chen, M.; Shuey, C.J.; Walthall, C.; Daughtry, C.; Morisette, J.; Schaaf, C.; Strahler, A. Validating MODIS land surface reflectance and Albedo products: Methods and preliminary results. Remote Sens. Environ. 2002, 83, 149–162. [Google Scholar] [CrossRef]
- Jin, Y.; Schaaf, C.B.; Gao, F.; Li, X.; Strahler, A.H.; Lucht, W.; Liang, S. Consistency of MODIS surface bidirectional reflectance distribution function and Albedo retrievals: 1. Algorithm performance. J. Geophys. Res. Atmos. 2003, 108, 4158. [Google Scholar] [CrossRef]
- Román, M.O.; Schaaf, C.B.; Woodcock, C.E.; Strahler, A.H.; Yang, X.; Braswell, R.H.; Curtis, P.S.; Davis, K.J.; Dragoni, D.; Goulden, M.L. The MODIS (collection v005) BRDF/Albedo product: Assessment of spatial representativeness over forested landscapes. Remote Sens. Environ. 2009, 113, 2476–2498. [Google Scholar] [CrossRef]
- Román, M.O.; Schaaf, C.B.; Lewis, P.; Gao, F.; Anderson, G.P.; Privette, J.L.; Strahler, A.H.; Woodcock, C.E.; Barnsley, M. Assessing the coupling between surface Albedo derived from MODIS and the fraction of diffuse skylight over spatially-characterized landscapes. Remote Sens. Environ. 2010, 114, 738–760. [Google Scholar] [CrossRef]
- Wang, Z.; Schaaf, C.B.; Chopping, M.J.; Strahler, A.H.; Wang, J.; Roman, M.O.; Rocha, A.V.; Woodcock, C.E.; Shuai, Y. Evaluation of moderate-resolution imaging spectroradiometer (MODIS) snow Albedo product (MCD43A) over tundra. Remote Sens. Environ. 2012, 117, 264–280. [Google Scholar] [CrossRef]
- Wang, Z.; Schaaf, C.B.; Strahler, A.H.; Chopping, M.J.; Román, M.O.; Shuai, Y.; Woodcock, C.E.; Hollinger, D.Y.; Fitzjarrald, D.R. Evaluation of MODIS Albedo product (MCD43A) over grassland, agriculture and forest surface types during dormant and snow-covered periods. Remote Sens. Environ. 2014, 140, 60–77. [Google Scholar] [CrossRef]
- Sims, D.A.; Rahman, A.F.; Vermote, E.F.; Jiang, Z. Seasonal and inter-annual variation in view angle effects on MODIS vegetation indices at three forest sites. Remote Sens. Environ. 2011, 115, 3112–3120. [Google Scholar] [CrossRef]
- MODIS BRDF/Albedo Product (MCD43) User Guide. 2012. Available online: https://www.umb.edu/spectralmass/terra_aqua_modis/modis_brdf_albedo_product_mcd43 (accessed on 6 April 2012).
- Ke, Y.; Im, J.; Lee, J.; Gong, H.; Ryu, Y. Characteristics of Landsat 8 oli-derived NDVI by comparison with multiple satellite sensors and in-situ observations. Remote Sens. Environ. 2015, 164, 298–313. [Google Scholar] [CrossRef]
- Lucht, W.; Schaaf, C.B.; Strahler, A.H. An algorithm for the retrieval of Albedo from space using semiempirical BRDF models. IEEE Trans. Geosci. Remote Sens. 2000, 38, 977–998. [Google Scholar] [CrossRef]
- Ju, J.; Roy, D.P.; Shuai, Y.; Schaaf, C. Development of an approach for generation of temporally complete daily nadir MODIS reflectance time series. Remote Sens. Environ. 2010, 114, 1–20. [Google Scholar] [CrossRef]
- Zhang, H.K.; Roy, D.P.; Kovalskyy, V. Optimal solar geometry definition for global long-term Landsat time-series bidirectional reflectance normalization. IEEE Trans. Geosci. Remote Sens. 2016, 54, 1410–1418. [Google Scholar] [CrossRef]
- Feng, M.; Sexton, J.O.; Huang, C.; Masek, J.G.; Vermote, E.F.; Gao, F.; Narasimhan, R.; Channan, S.; Wolfe, R.E.; Townshend, J.R. Global surface reflectance products from Landsat: Assessment using coincident MODIS observations. Remote Sens. Environ. 2013, 134, 276–293. [Google Scholar] [CrossRef]
- Masek, J.G.; Vermote, E.F.; Saleous, N.E.; Wolfe, R.; Hall, F.G.; Huemmrich, K.F.; Gao, F.; Kutler, J.; Lim, T.-K. A Landsat surface reflectance dataset for north america, 1990–2000. IEEE Geosci. Remote Sens. Lett. 2006, 3, 68–72. [Google Scholar] [CrossRef]
- Roy, D.P.; Ju, J.; Lewis, P.; Schaaf, C.; Gao, F.; Hansen, M.; Lindquist, E. Multi-temporal MODIS–Landsat data fusion for relative radiometric normalization, gap filling, and prediction of Landsat data. Remote Sens. Environ. 2008, 112, 3112–3130. [Google Scholar] [CrossRef]
- De Abelleyra, D.; Verón, S.R. Comparison of different BRDF correction methods to generate daily normalized MODIS 250 m time series. Remote Sens. Environ. 2014, 140, 46–59. [Google Scholar] [CrossRef]
- Willmott, C.J. Some comments on the evaluation of model performance. Bull. Am. Meteorol. Soc. 1982, 63, 1309–1313. [Google Scholar] [CrossRef]
- Feng, M.; Huang, C.; Channan, S.; Vermote, E.F.; Masek, J.G.; Townshend, J.R. Quality assessment of Landsat surface reflectance products using MODIS data. Comput. Geosci. 2012, 38, 9–22. [Google Scholar] [CrossRef]
- Vermote, E.; Justice, C.O.; Bréon, F.-M. Towards a generalized approach for correction of the BRDF effect in MODIS directional reflectances. IEEE Trans. Geosci. Remote Sens. 2009, 47, 898–908. [Google Scholar] [CrossRef]
- Liang, S. Narrowband to broadband conversions of land surface Albedo I: Algorithms. Remote Sens. Environ. 2001, 76, 213–238. [Google Scholar] [CrossRef]
- Quaife, T.; Lewis, P. Temporal constraints on linear BRDF model parameters. IEEE Trans. Geosci. Remote Sens. 2010, 48, 2445–2450. [Google Scholar] [CrossRef]
- Bréon, F.-M.; Vermote, E. Correction of MODIS surface reflectance time series for BRDF effects. Remote Sens. Environ. 2012, 125, 1–9. [Google Scholar] [CrossRef]
- Weiss, M.; Baret, F.; Myneni, R.; Pragnère, A.; Knyazikhin, Y. Investigation of a model inversion technique to estimate canopy biophysical variables from spectral and directional reflectance data. Agronomie 2000, 20, 3–22. [Google Scholar] [CrossRef]
- Suits, G.H. The calculation of the directional reflectance of a vegetative canopy. Remote Sens. Environ. 1971, 2, 117–125. [Google Scholar] [CrossRef]
- Maccioni, A.; Agati, G.; Mazzinghi, P. New vegetation indices for remote measurement of chlorophylls based on leaf directional reflectance spectra. J. Photochem. Photobiol. B Biol. 2001, 61, 52–61. [Google Scholar] [CrossRef]
- Lucht, W. Expected retrieval accuracies of bidirectional reflectance and Albedo from eos-MODIS and MISR angular sampling. J. Geophys. Res. Atmos. 1998, 103, 8763–8778. [Google Scholar] [CrossRef]
- D’Entremont, R.P.; Schaaf, C.B.; Lucht, W.; Strahler, A.H. Retrieval of red spectral Albedo and bidirectional reflectance using avhrr hrpt and goes satellite observations of the new england region. J. Geophys. Res. Atmos. 1999, 104, 6229–6239. [Google Scholar] [CrossRef]
- Sellers, P.; Meeson, B.; Hall, F.; Asrar, G.; Murphy, R.; Schiffer, R.; Bretherton, F.; Dickinson, R.; Ellingson, R.; Field, C. Remote sensing of the land surface for studies of global change: Models—algorithms—experiments. Remote Sens. Environ. 1995, 51, 3–26. [Google Scholar] [CrossRef]
- Hansen, M.C.; Loveland, T.R. A review of large area monitoring of land cover change using Landsat data. Remote Sens. Environ. 2012, 122, 66–74. [Google Scholar] [CrossRef]
- Liu, Y.; Wang, Z.; Sun, Q.; Erb, A.M.; Li, Z.; Schaaf, C.B.; Zhang, X.; Román, M.O.; Scott, R.L.; Zhang, Q. Evaluation of the viirs BRDF, Albedo and nbar products suite and an assessment of continuity with the long term MODIS record. Remote Sens. Environ. 2017, 201, 256–274. [Google Scholar] [CrossRef]
- Danaher, T.; Wu, X.; Campbell, N. Bi-directional reflectance distribution function approaches to radiometric calibration of Landsat etm+ imagery. In Proceedings of the 2001 IEEE International Geoscience and Remote Sensing Symposium, IGARSS’01, Sydney, Australia, 9–13 July 2001; IEEE: Piscataway, NJ, USA, 2001; pp. 2654–2657. [Google Scholar]
- Roy, D.; Zhang, H.; Ju, J.; Gomez-Dans, J.; Lewis, P.; Schaaf, C.; Sun, Q.; Li, J.; Huang, H.; Kovalskyy, V. A general method to normalize Landsat reflectance data to nadir BRDF adjusted reflectance. Remote Sens. Environ. 2016, 176, 255–271. [Google Scholar] [CrossRef]
- Petit, C.; Lambin, E. Integration of multi-source remote sensing data for land cover change detection. Int. J. Geogr. Inf. Sci. 2001, 15, 785–803. [Google Scholar] [CrossRef]
- Zhang, H.K.; Roy, D.P. Using the 500 m MODIS land cover product to derive a consistent continental scale 30 m Landsat land cover classification. Remote Sens. Environ. 2017, 197, 15–34. [Google Scholar] [CrossRef]
- Trishchenko, A.P.; Cihlar, J.; Li, Z. Effects of spectral response function on surface reflectance and NDVI measured with moderate resolution satellite sensors. Remote Sens. Environ. 2002, 81, 1–18. [Google Scholar] [CrossRef]
- Gao, F.; Jin, Y.; Schaaf, C.; Strahler, A.H. Bidirectional NDVI and atmospherically resistant BRDF inversion for vegetation canopy. IEEE Trans. Geosci. Remote Sens. 2002, 40, 1269–1278. [Google Scholar]
- Epiphanio, J.N.; Huete, A.R. Dependence of NDVI and SAVI on sun/sensor geometry and its effect on fapar relationships in alfalfa. Remote Sens. Environ. 1995, 51, 351–360. [Google Scholar] [CrossRef]
- Bannari, A.; Morin, D.; Bonn, F.; Huete, A. A review of vegetation indices. Remote Sens. Rev. 1995, 13, 95–120. [Google Scholar] [CrossRef]
Figure 1.
Density plots of MYD09GA SR relative to: (a) original MOD09GA SR; (b) corrected MOD09GA Collection 5 SR; and (c) corrected MOD09GA Collection 6 SR.
Figure 1.
Density plots of MYD09GA SR relative to: (a) original MOD09GA SR; (b) corrected MOD09GA Collection 5 SR; and (c) corrected MOD09GA Collection 6 SR.

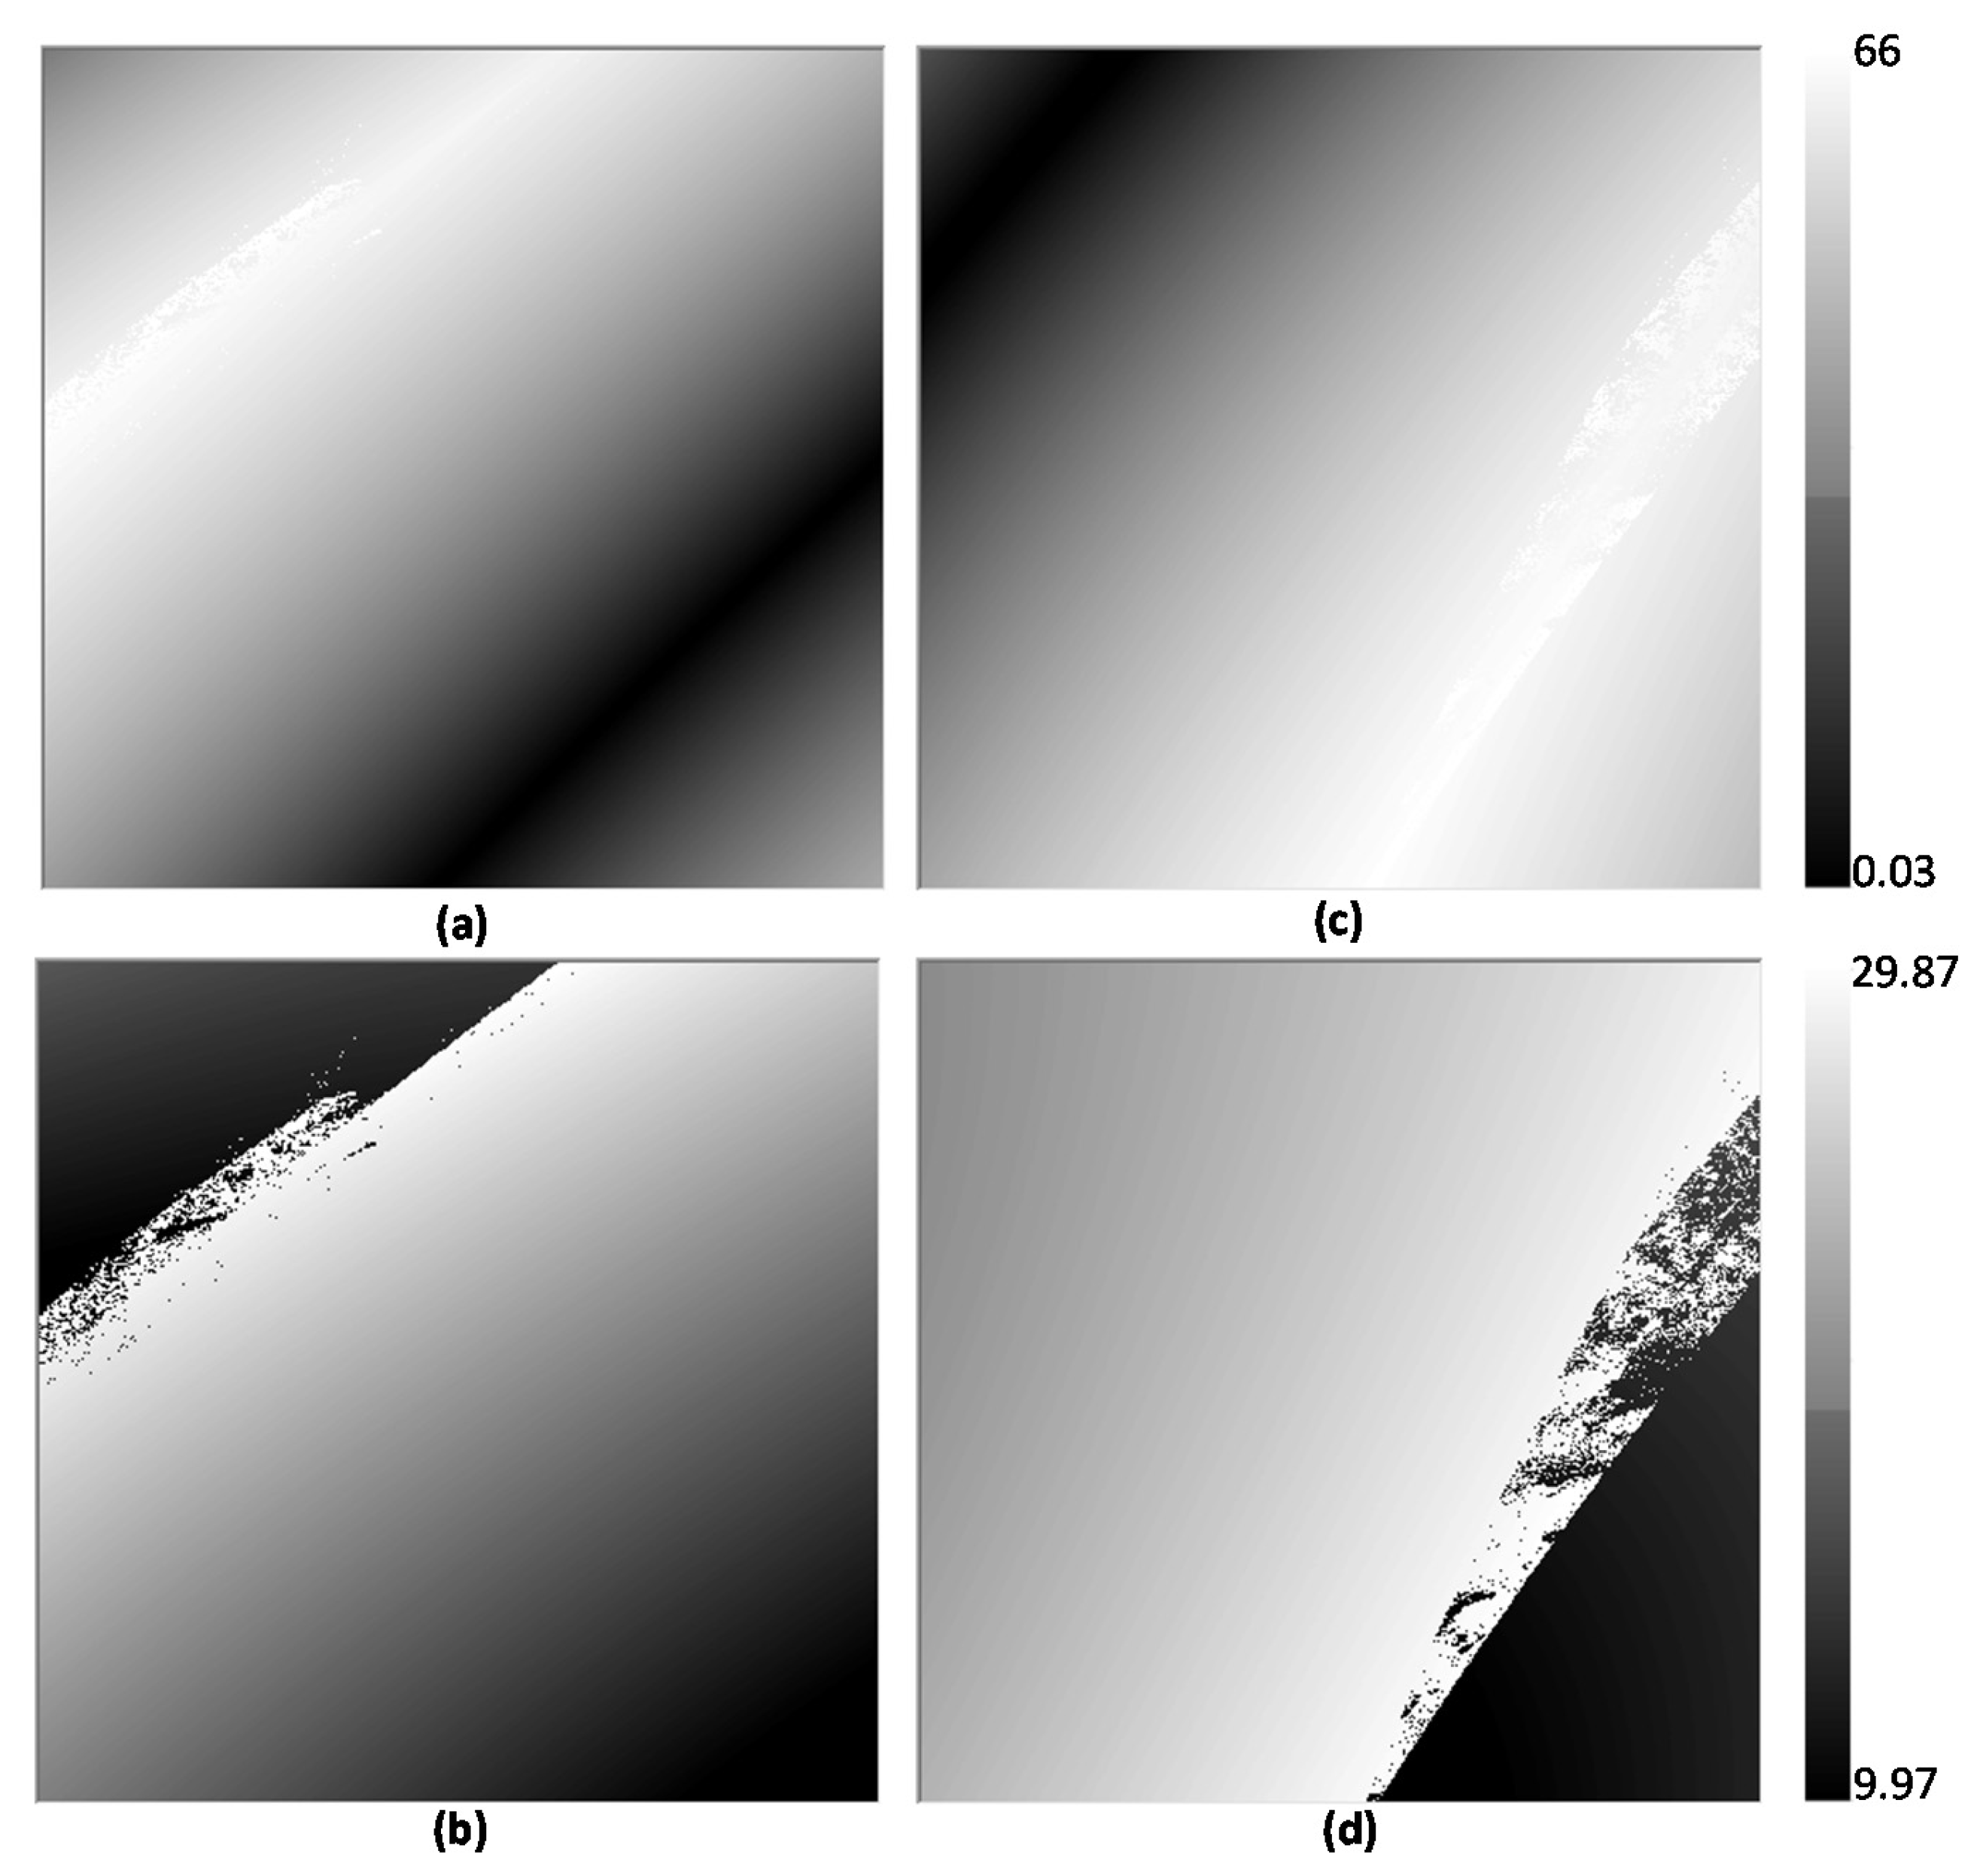
Figure 2.
(a–d) Solar and view zenith angle differences across MODIS Tile h10v05 on 9 June 2015. (a,b): solar and view zenith angle for MODIS Terra observation; (c,d): for MODIS Aqua observation.
Figure 2.
(a–d) Solar and view zenith angle differences across MODIS Tile h10v05 on 9 June 2015. (a,b): solar and view zenith angle for MODIS Terra observation; (c,d): for MODIS Aqua observation.

Figure 3.
Density plots comparing MCD43A4 Collection 6 and corrected MOD09GA using MCD43A1 Collection 6.
Figure 3.
Density plots comparing MCD43A4 Collection 6 and corrected MOD09GA using MCD43A1 Collection 6.
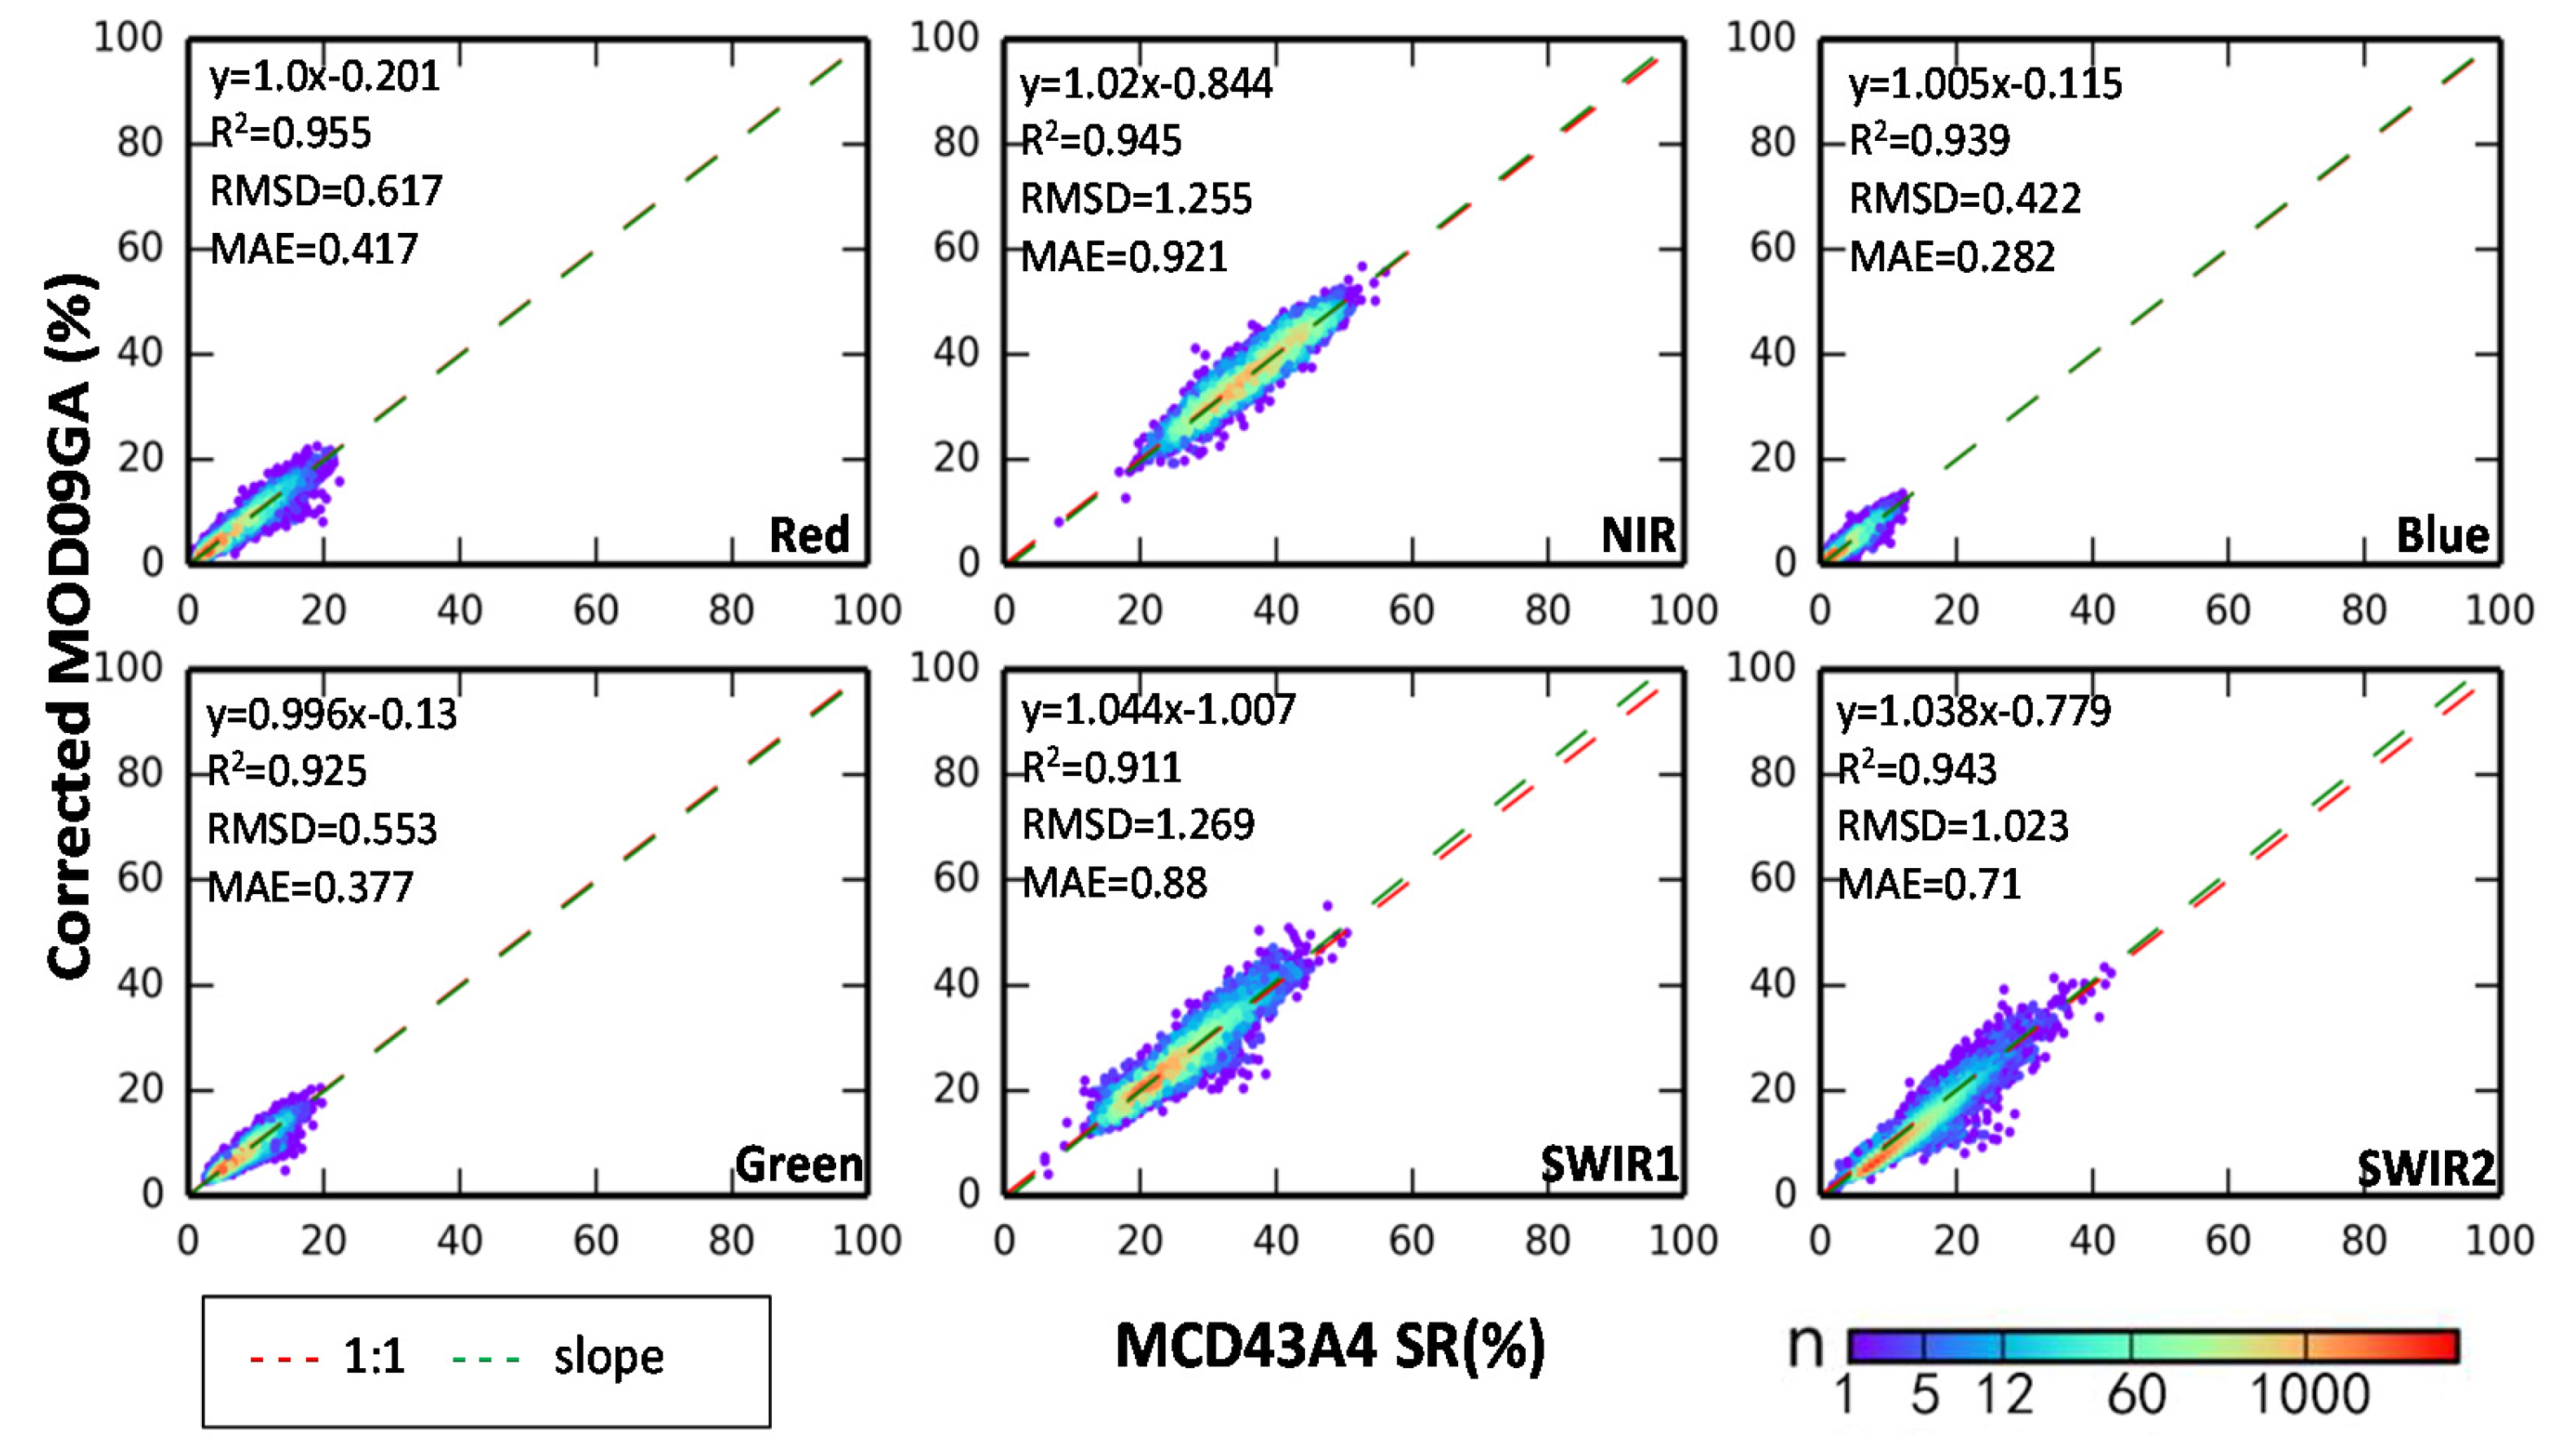
Figure 4.
Density plots of comparisons between coarsened Landsat-5 TM and original MOD09GA SR (a); corrected MOD09GA SR using MCD43A1 Collection 5 (b); and Collection 6 (c).
Figure 4.
Density plots of comparisons between coarsened Landsat-5 TM and original MOD09GA SR (a); corrected MOD09GA SR using MCD43A1 Collection 5 (b); and Collection 6 (c).

Figure 5.
The variation of isotropic (k0), volumetric (k1) and geometric (k2) BRDF parameters of red and NIR bands for a deciduous forest sample (Time: 2015; Location: 32.521°, −90.647°).
Figure 5.
The variation of isotropic (k0), volumetric (k1) and geometric (k2) BRDF parameters of red and NIR bands for a deciduous forest sample (Time: 2015; Location: 32.521°, −90.647°).

Figure 6.
Plot of time-series of MODIS SR change for MODIS red and NIR bands for the deciduous forest sample (correction 1 with MCD43A1 Collection 5; correction 2 with MCD43A1 Collection 6; and data information correspond to Figure 5).
Figure 6.
Plot of time-series of MODIS SR change for MODIS red and NIR bands for the deciduous forest sample (correction 1 with MCD43A1 Collection 5; correction 2 with MCD43A1 Collection 6; and data information correspond to Figure 5).
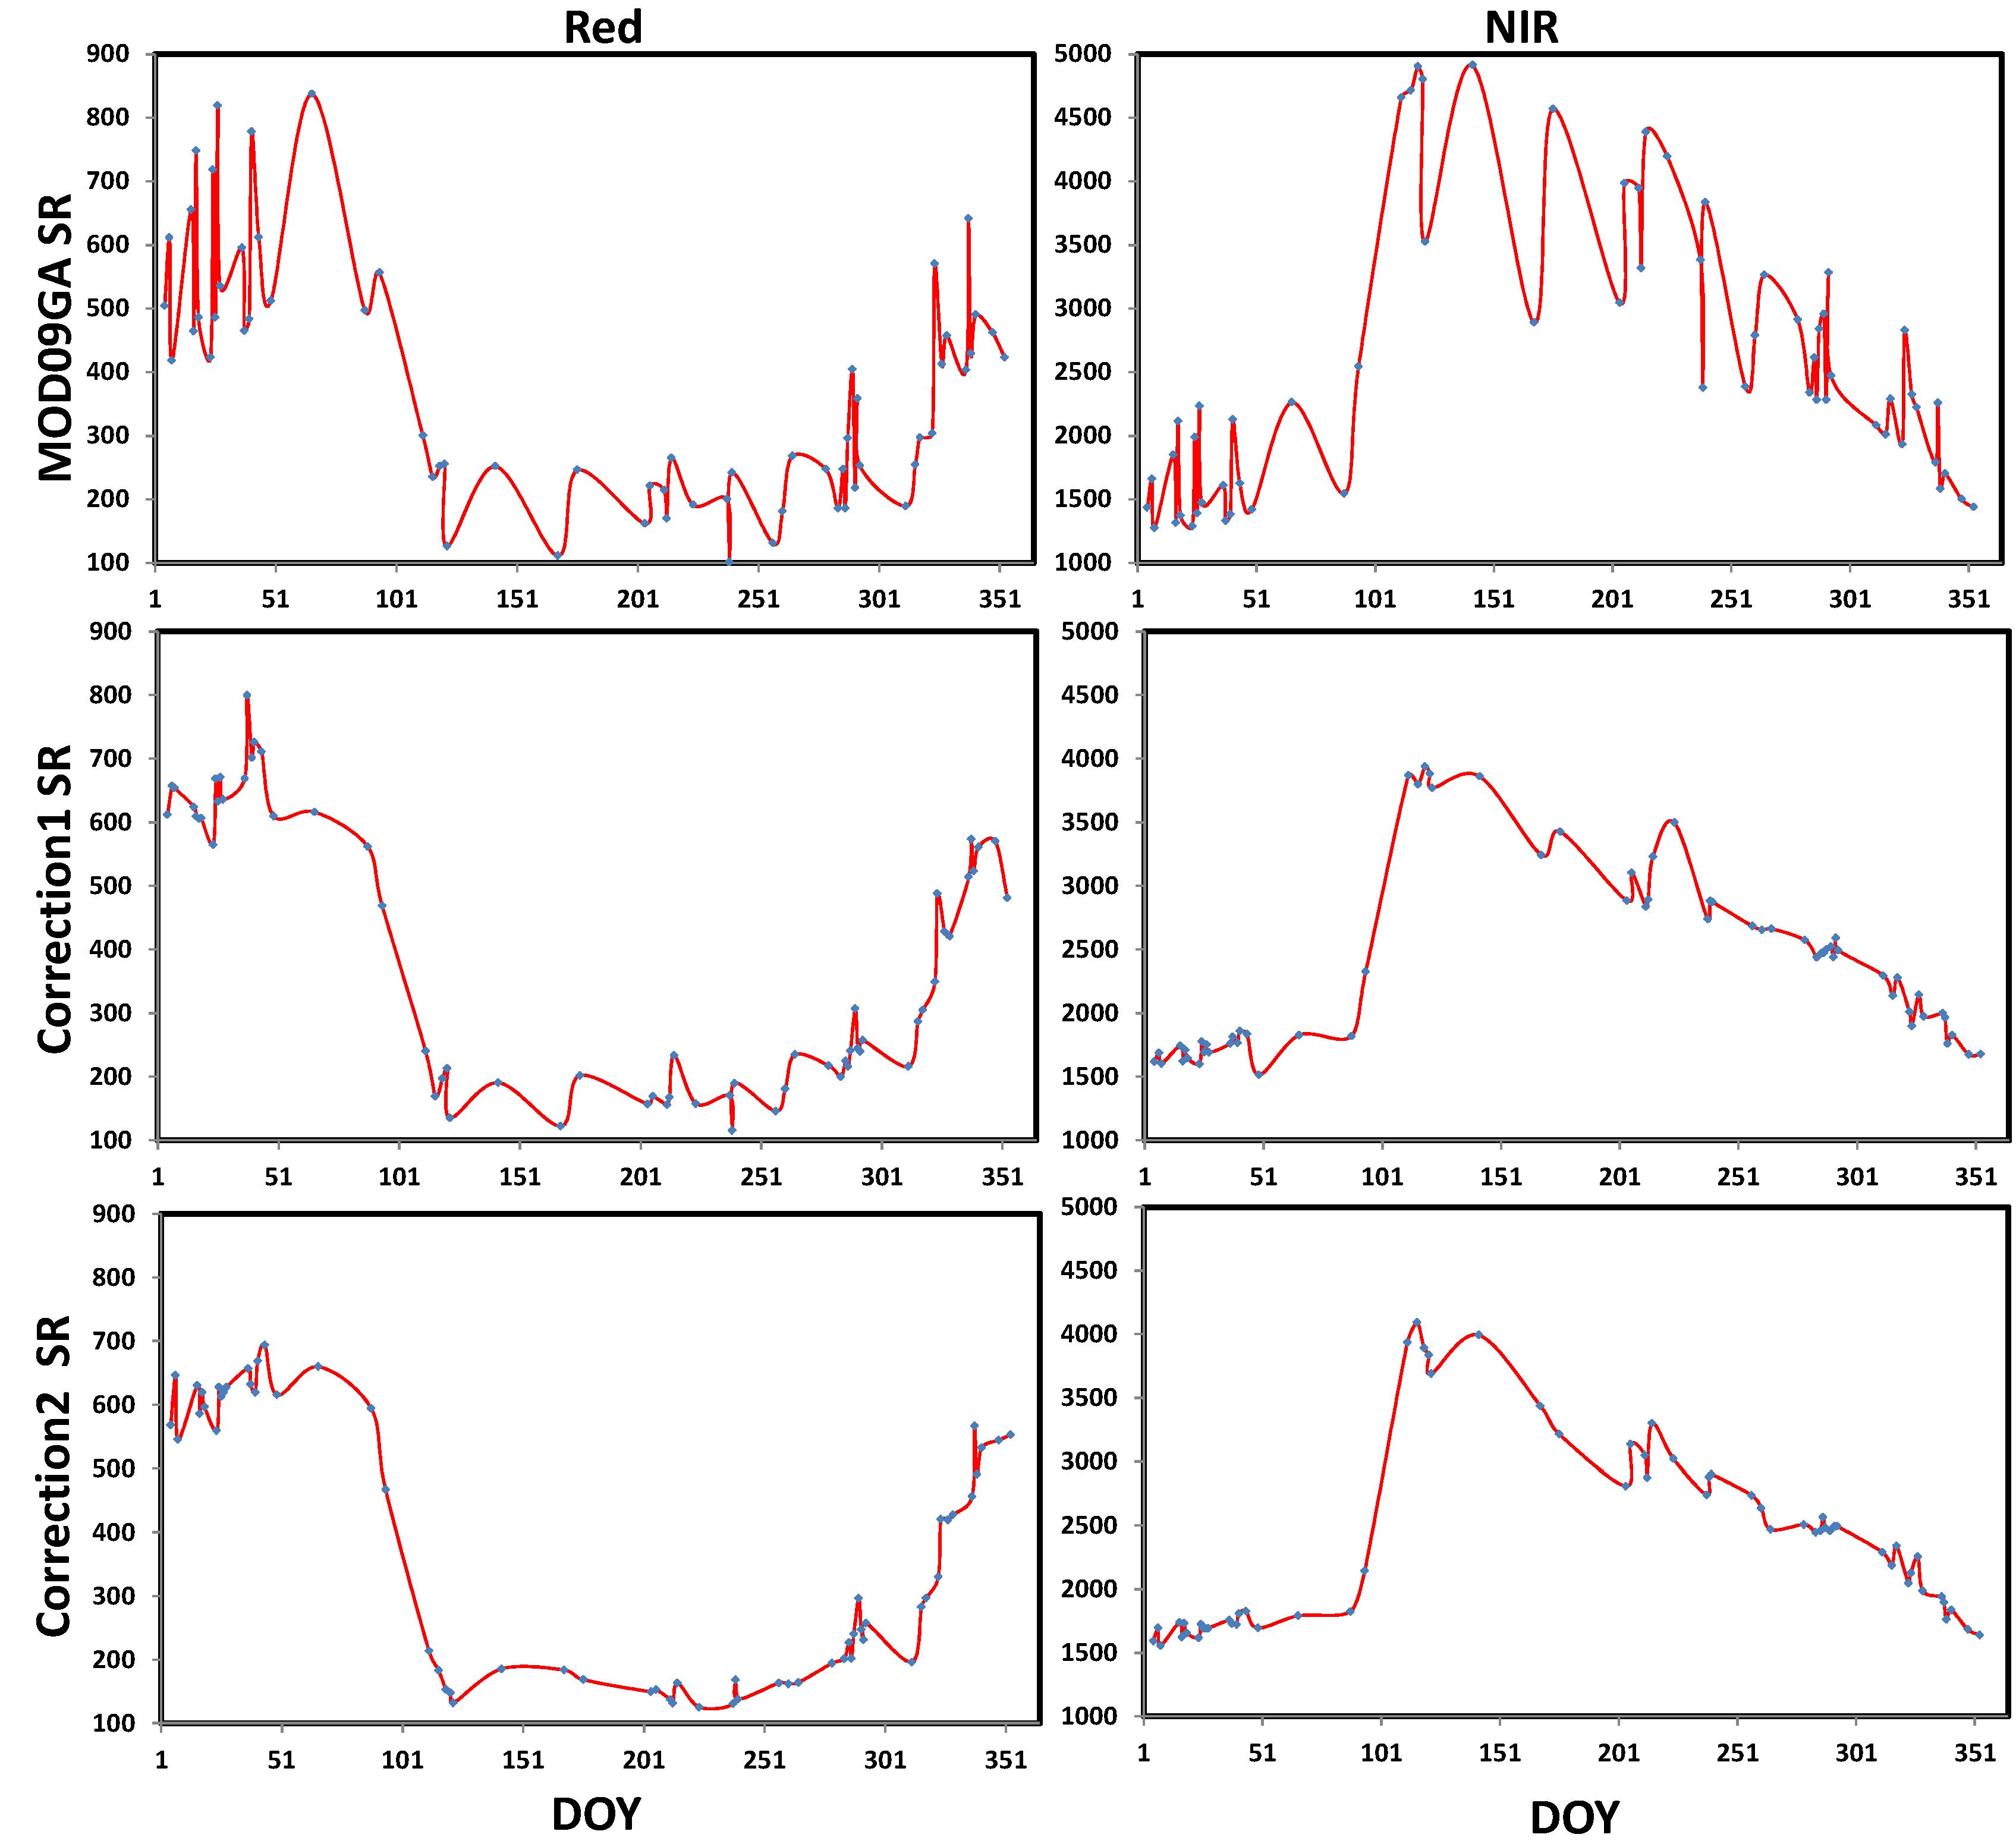
Figure 7.
Comparison of MYD09GA NDVI with MOD09GA NDVI (a) and corrected NDVI using MCD43A1 Collection 6 (c) and Collection 5 (b).
Figure 7.
Comparison of MYD09GA NDVI with MOD09GA NDVI (a) and corrected NDVI using MCD43A1 Collection 6 (c) and Collection 5 (b).

Table 1.
Bands information comparison of MODIS and Landsat.
| Band | MODIS Band | MODIS Bandwidth | Landsat-5 TM | TM Bandwidth | Landsat-7 ETM+ | ETM+ Bandwidth |
|---|---|---|---|---|---|---|
| R | 1(B1) | 620–670 | 3 | 630–690 | 3 | 630–690 |
| NIR | 2(B2) | 841–876 | 4 | 760–900 | 4 | 780–900 |
| B | 3(B3) | 459–479 | 1 | 450–520 | 1 | 450–520 |
| G | 4(B4) | 545–565 | 2 | 520–600 | 2 | 530–610 |
| SWIR1 | 6(B6) | 1628–1652 | 5 | 1550–1750 | 5 | 1550–1750 |
| SWIR2 | 7(B7) | 2105–2155 | 7 | 2080–2350 | 7 | 2090–2350 |
Table 2.
Threshold values used to filter the input data.
| Quality Index | Threshold |
|---|---|
| Land/water flag | land |
| View angle (°) | <70 |
| Sun zenith angle | <70 |
| Aerosol quantity | low |
| Observation coverage (%) | >5 |
| Pixel adjacent to cloud | No |
| Internal cloud algorithm | No cloud |
| Cirrus detected | None |
| Cloud shadow | No |
| Cloud state | Clear |
Table 3.
The results of corrected reflectance noises of the typical illumination and observation geometry for four different types of land cover samples (correction 1 based on MCD43A1 Collection 5, and correction 2 based on MCD43A1 Collection 6).
Table 3.
The results of corrected reflectance noises of the typical illumination and observation geometry for four different types of land cover samples (correction 1 based on MCD43A1 Collection 5, and correction 2 based on MCD43A1 Collection 6).
| Land Type | Location (Lat/Lon) | Google Map | Data | Band 1 | Band 2 | ||
|---|---|---|---|---|---|---|---|
| Noise | NoiseR (%) | Noise | NoiseR (%) | ||||
| Evergreen forest | 30.309°N/−83.972°W |  | MOD09GA | 135.669 | 42.33 | 522.016 | 24.19 |
| Correction1 | 69.082 | 20.05 | 170.065 | 7.93 | |||
| Correction2 | 47.484 | 18.48 | 134.952 | 7.44 | |||
| Deciduous forest | 32.521°N/−90.647°W |  | MOD09GA | 151.703 | 43.34 | 727.333 | 29.54 |
| Correction1 | 47.629 | 20.04 | 152.969 | 6.71 | |||
| Correction2 | 38.955 | 13.01 | 137.455 | 5.46 | |||
| Farmland | 38.895°N/−99.949°W |  | MOD09GA | 304.480 | 22.88 | 529.426 | 20.27 |
| Correction1 | 133.383 | 11.14 | 210.133 | 8.59 | |||
| Correction2 | 132.603 | 11.07 | 203.796 | 8.46 | |||
| Grassland | 39.821°N/−102.27°W |  | MOD09GA | 299.887 | 26.29 | 469.396 | 21.49 |
| Correction1 | 79.168 | 6.8 | 112.152 | 5.47 | |||
| Correction2 | 64.347 | 6.26 | 97.115 | 4.85 | |||
© 2017 by the authors. Licensee MDPI, Basel, Switzerland. This article is an open access article distributed under the terms and conditions of the Creative Commons Attribution (CC BY) license (http://creativecommons.org/licenses/by/4.0/).
Share and Cite
MDPI and ACS Style
Che, X.; Feng, M.; Sexton, J.O.; Channan, S.; Yang, Y.; Sun, Q. Assessment of MODIS BRDF/Albedo Model Parameters (MCD43A1 Collection 6) for Directional Reflectance Retrieval. Remote Sens. 2017, 9, 1123. https://doi.org/10.3390/rs9111123
AMA Style
Che X, Feng M, Sexton JO, Channan S, Yang Y, Sun Q. Assessment of MODIS BRDF/Albedo Model Parameters (MCD43A1 Collection 6) for Directional Reflectance Retrieval. Remote Sensing. 2017; 9(11):1123. https://doi.org/10.3390/rs9111123
Chicago/Turabian StyleChe, Xianghong, Min Feng, Joseph O. Sexton, Saurabh Channan, Yaping Yang, and Qing Sun. 2017. "Assessment of MODIS BRDF/Albedo Model Parameters (MCD43A1 Collection 6) for Directional Reflectance Retrieval" Remote Sensing 9, no. 11: 1123. https://doi.org/10.3390/rs9111123
Note that from the first issue of 2016, this journal uses article numbers instead of page numbers. See further details here.