Disaggregation of SMOS Soil Moisture to 100 m Resolution Using MODIS Optical/Thermal and Sentinel-1 Radar Data: Evaluation over a Bare Soil Site in Morocco

 , ,
, ,  ,
, 
 and
and
Abstract
:1. Introduction
2. Study Area and Data Sets
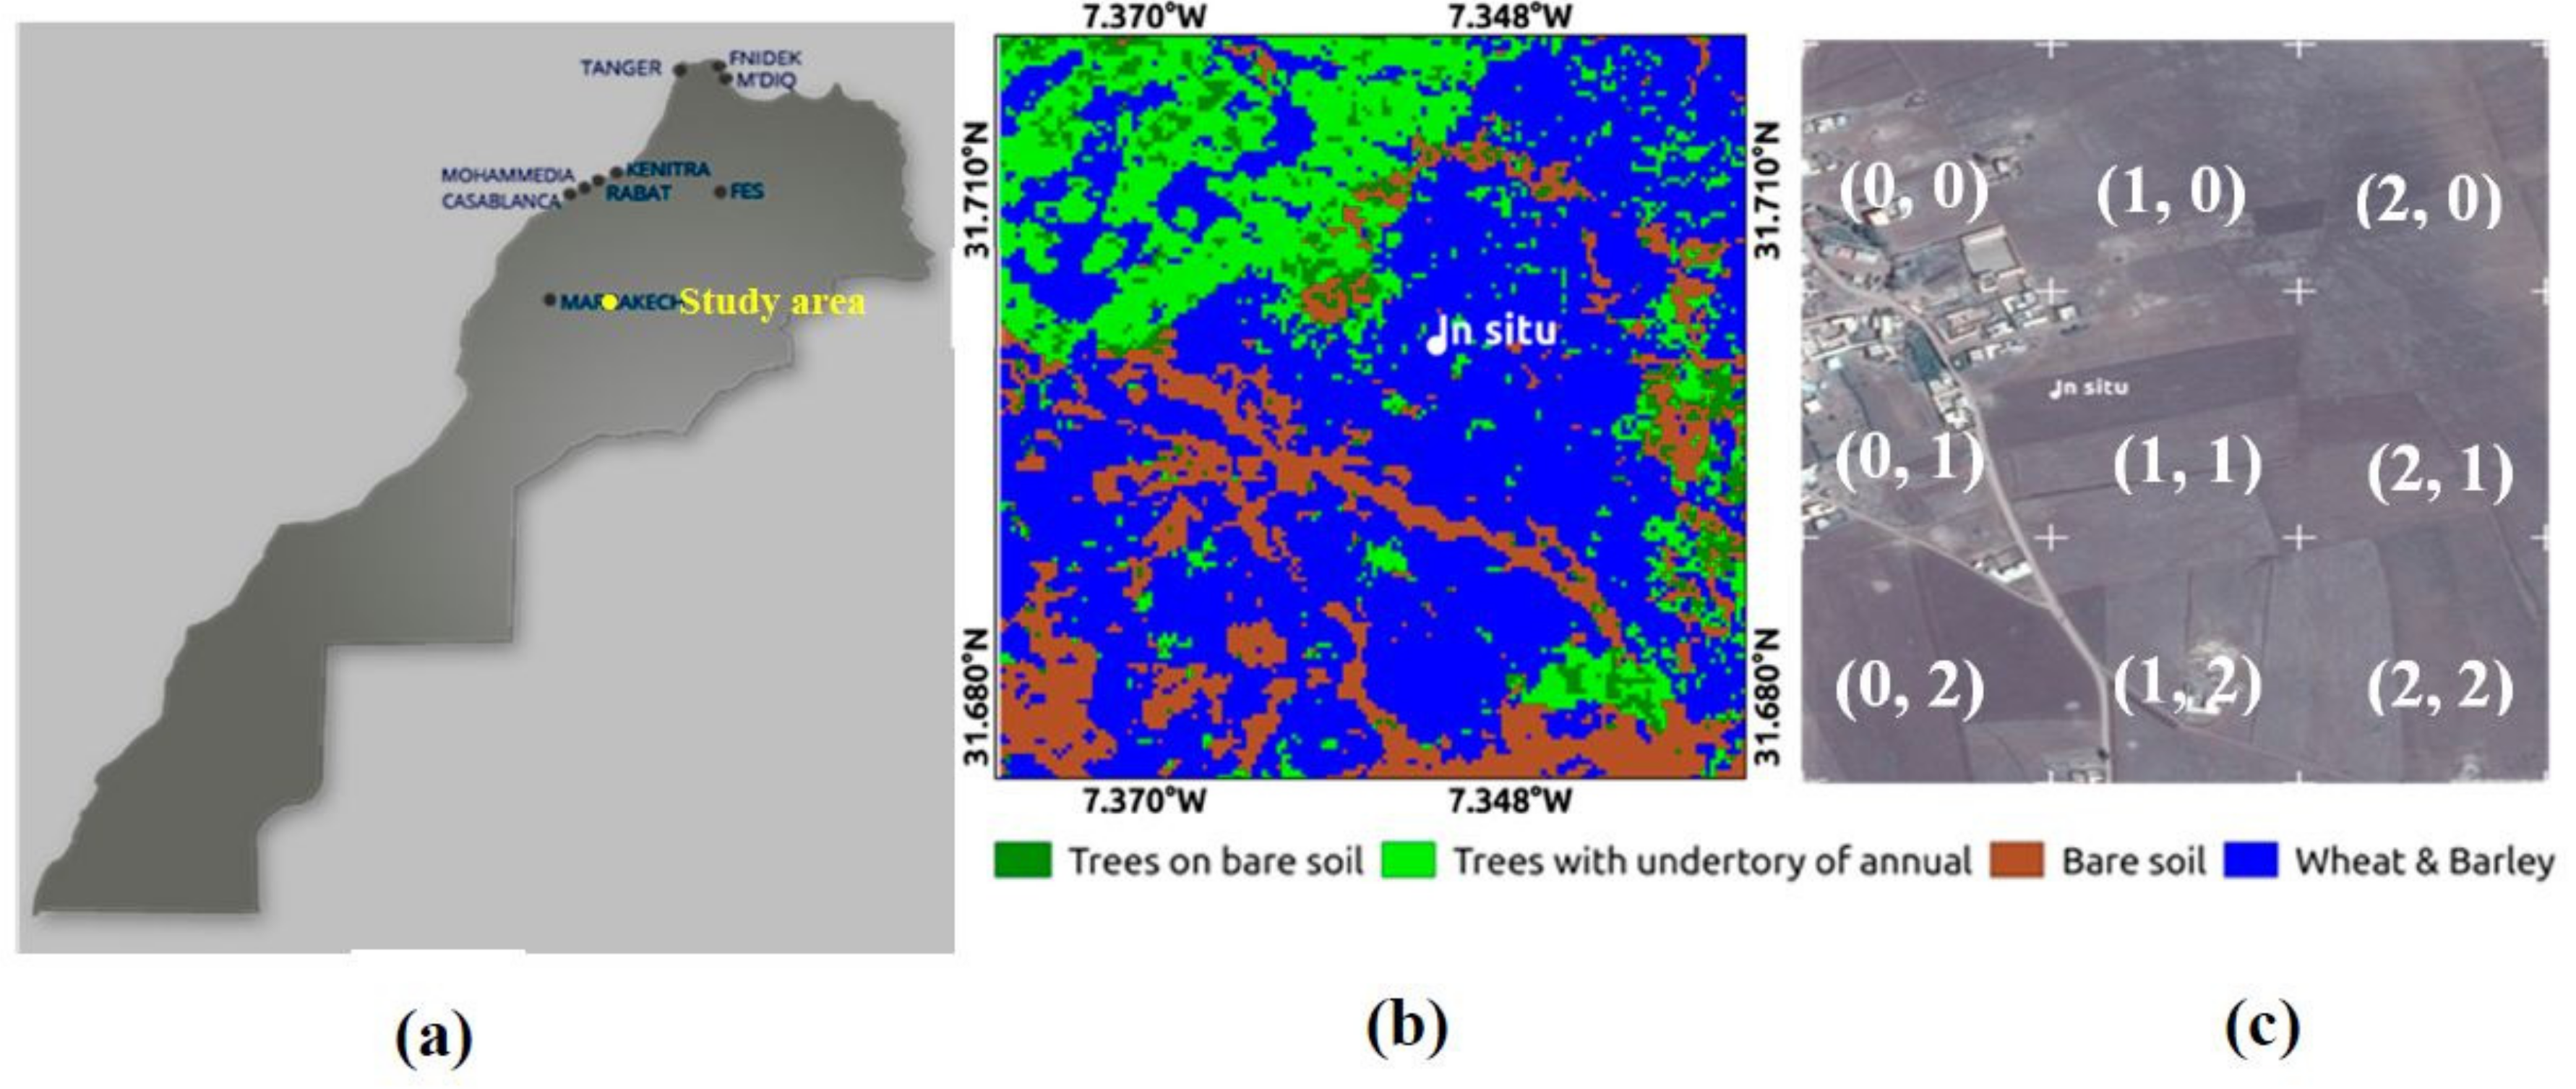
2.1. Study Area
2.2. DISPATCH Soil Moisture Product
2.3. SAR Data
2.4. In Situ Measurements
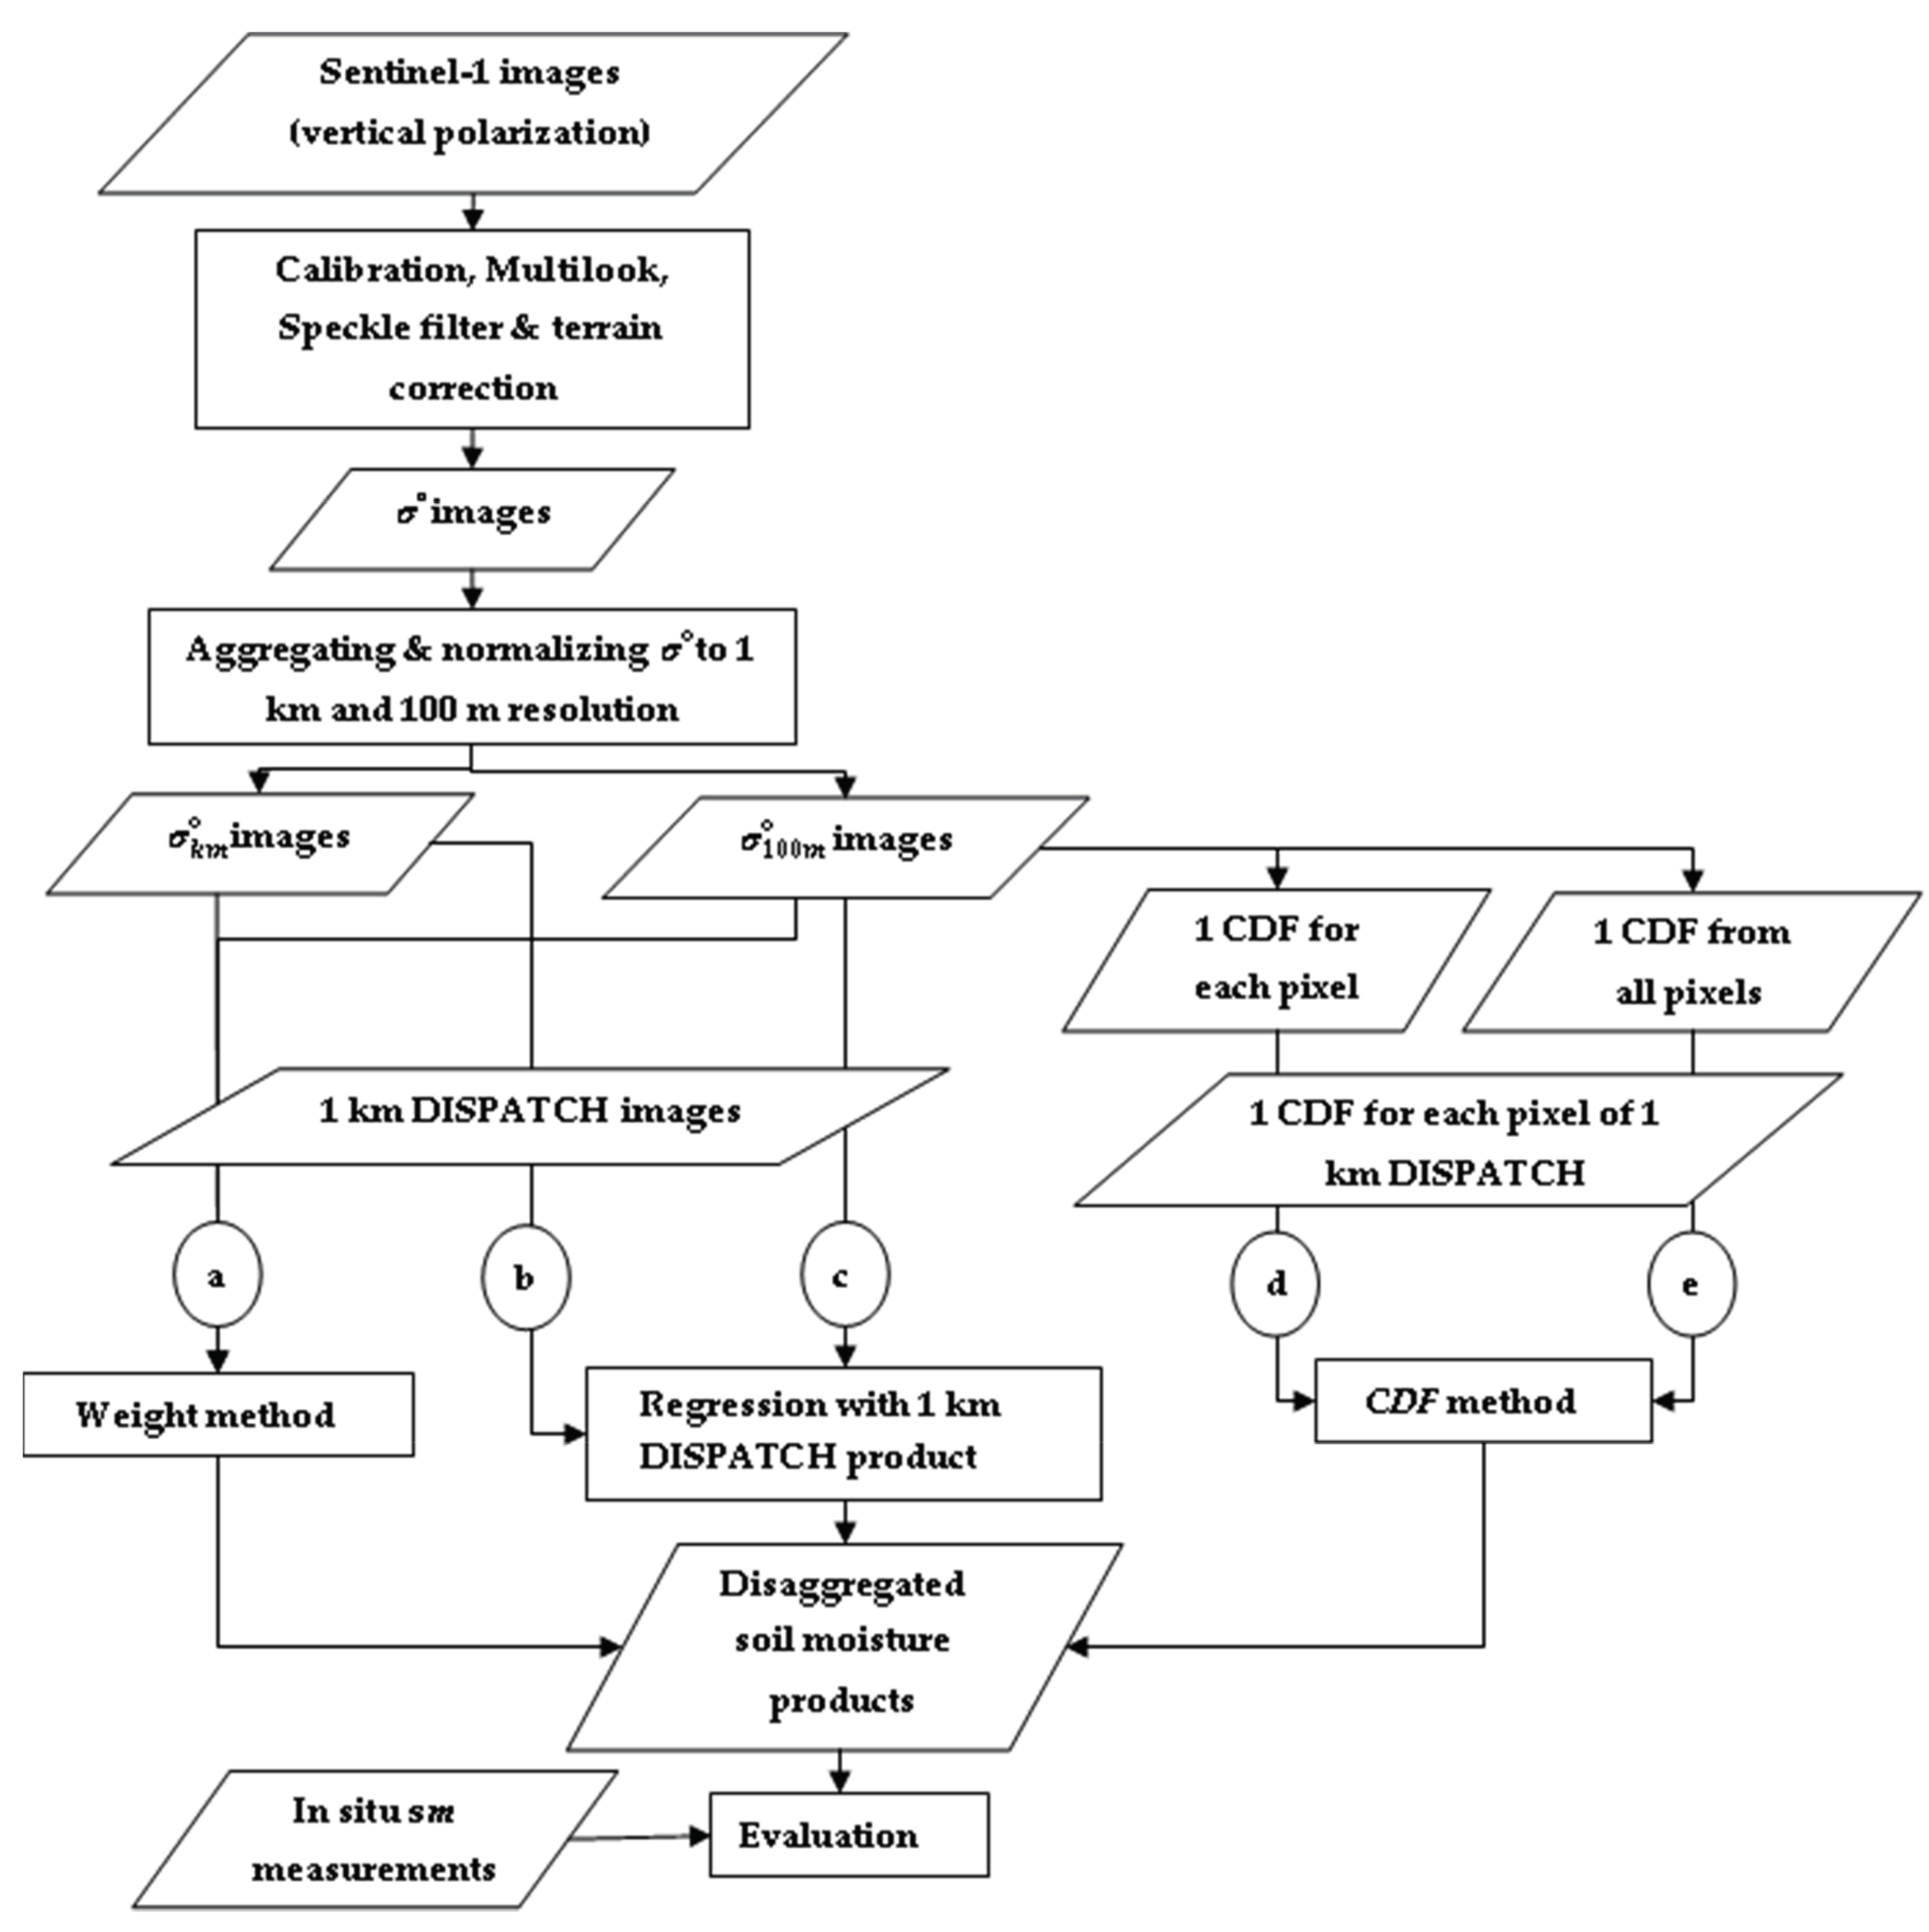
3. Methodology
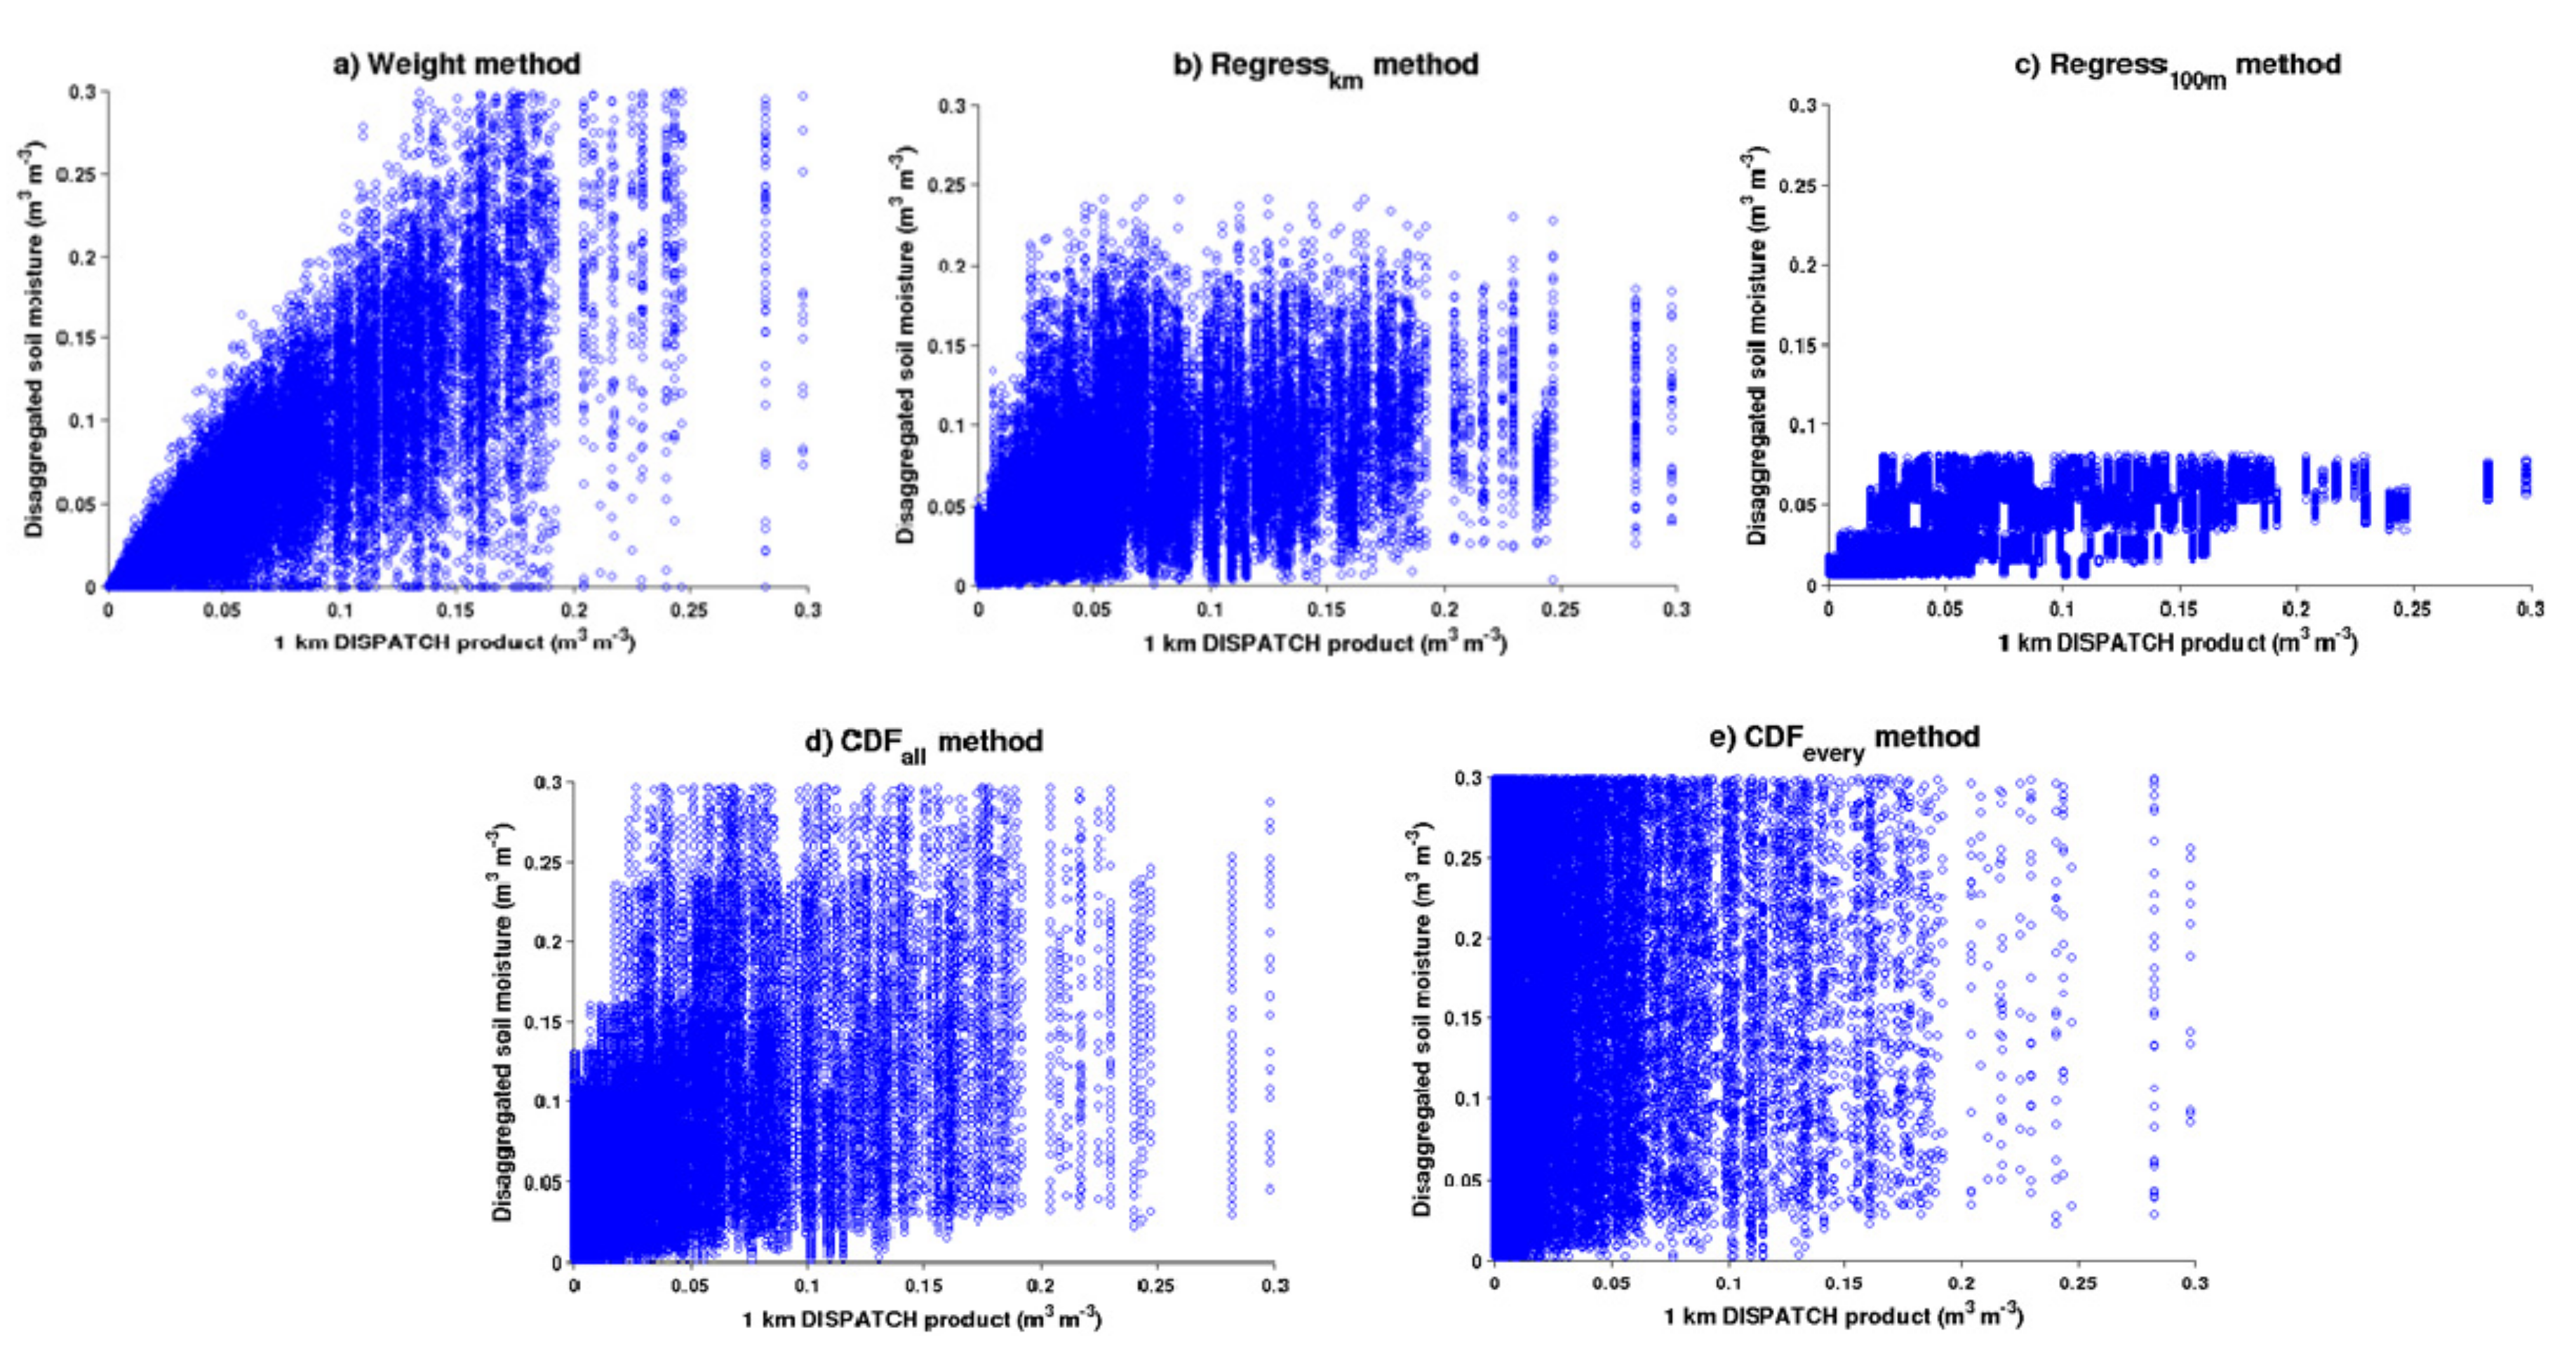
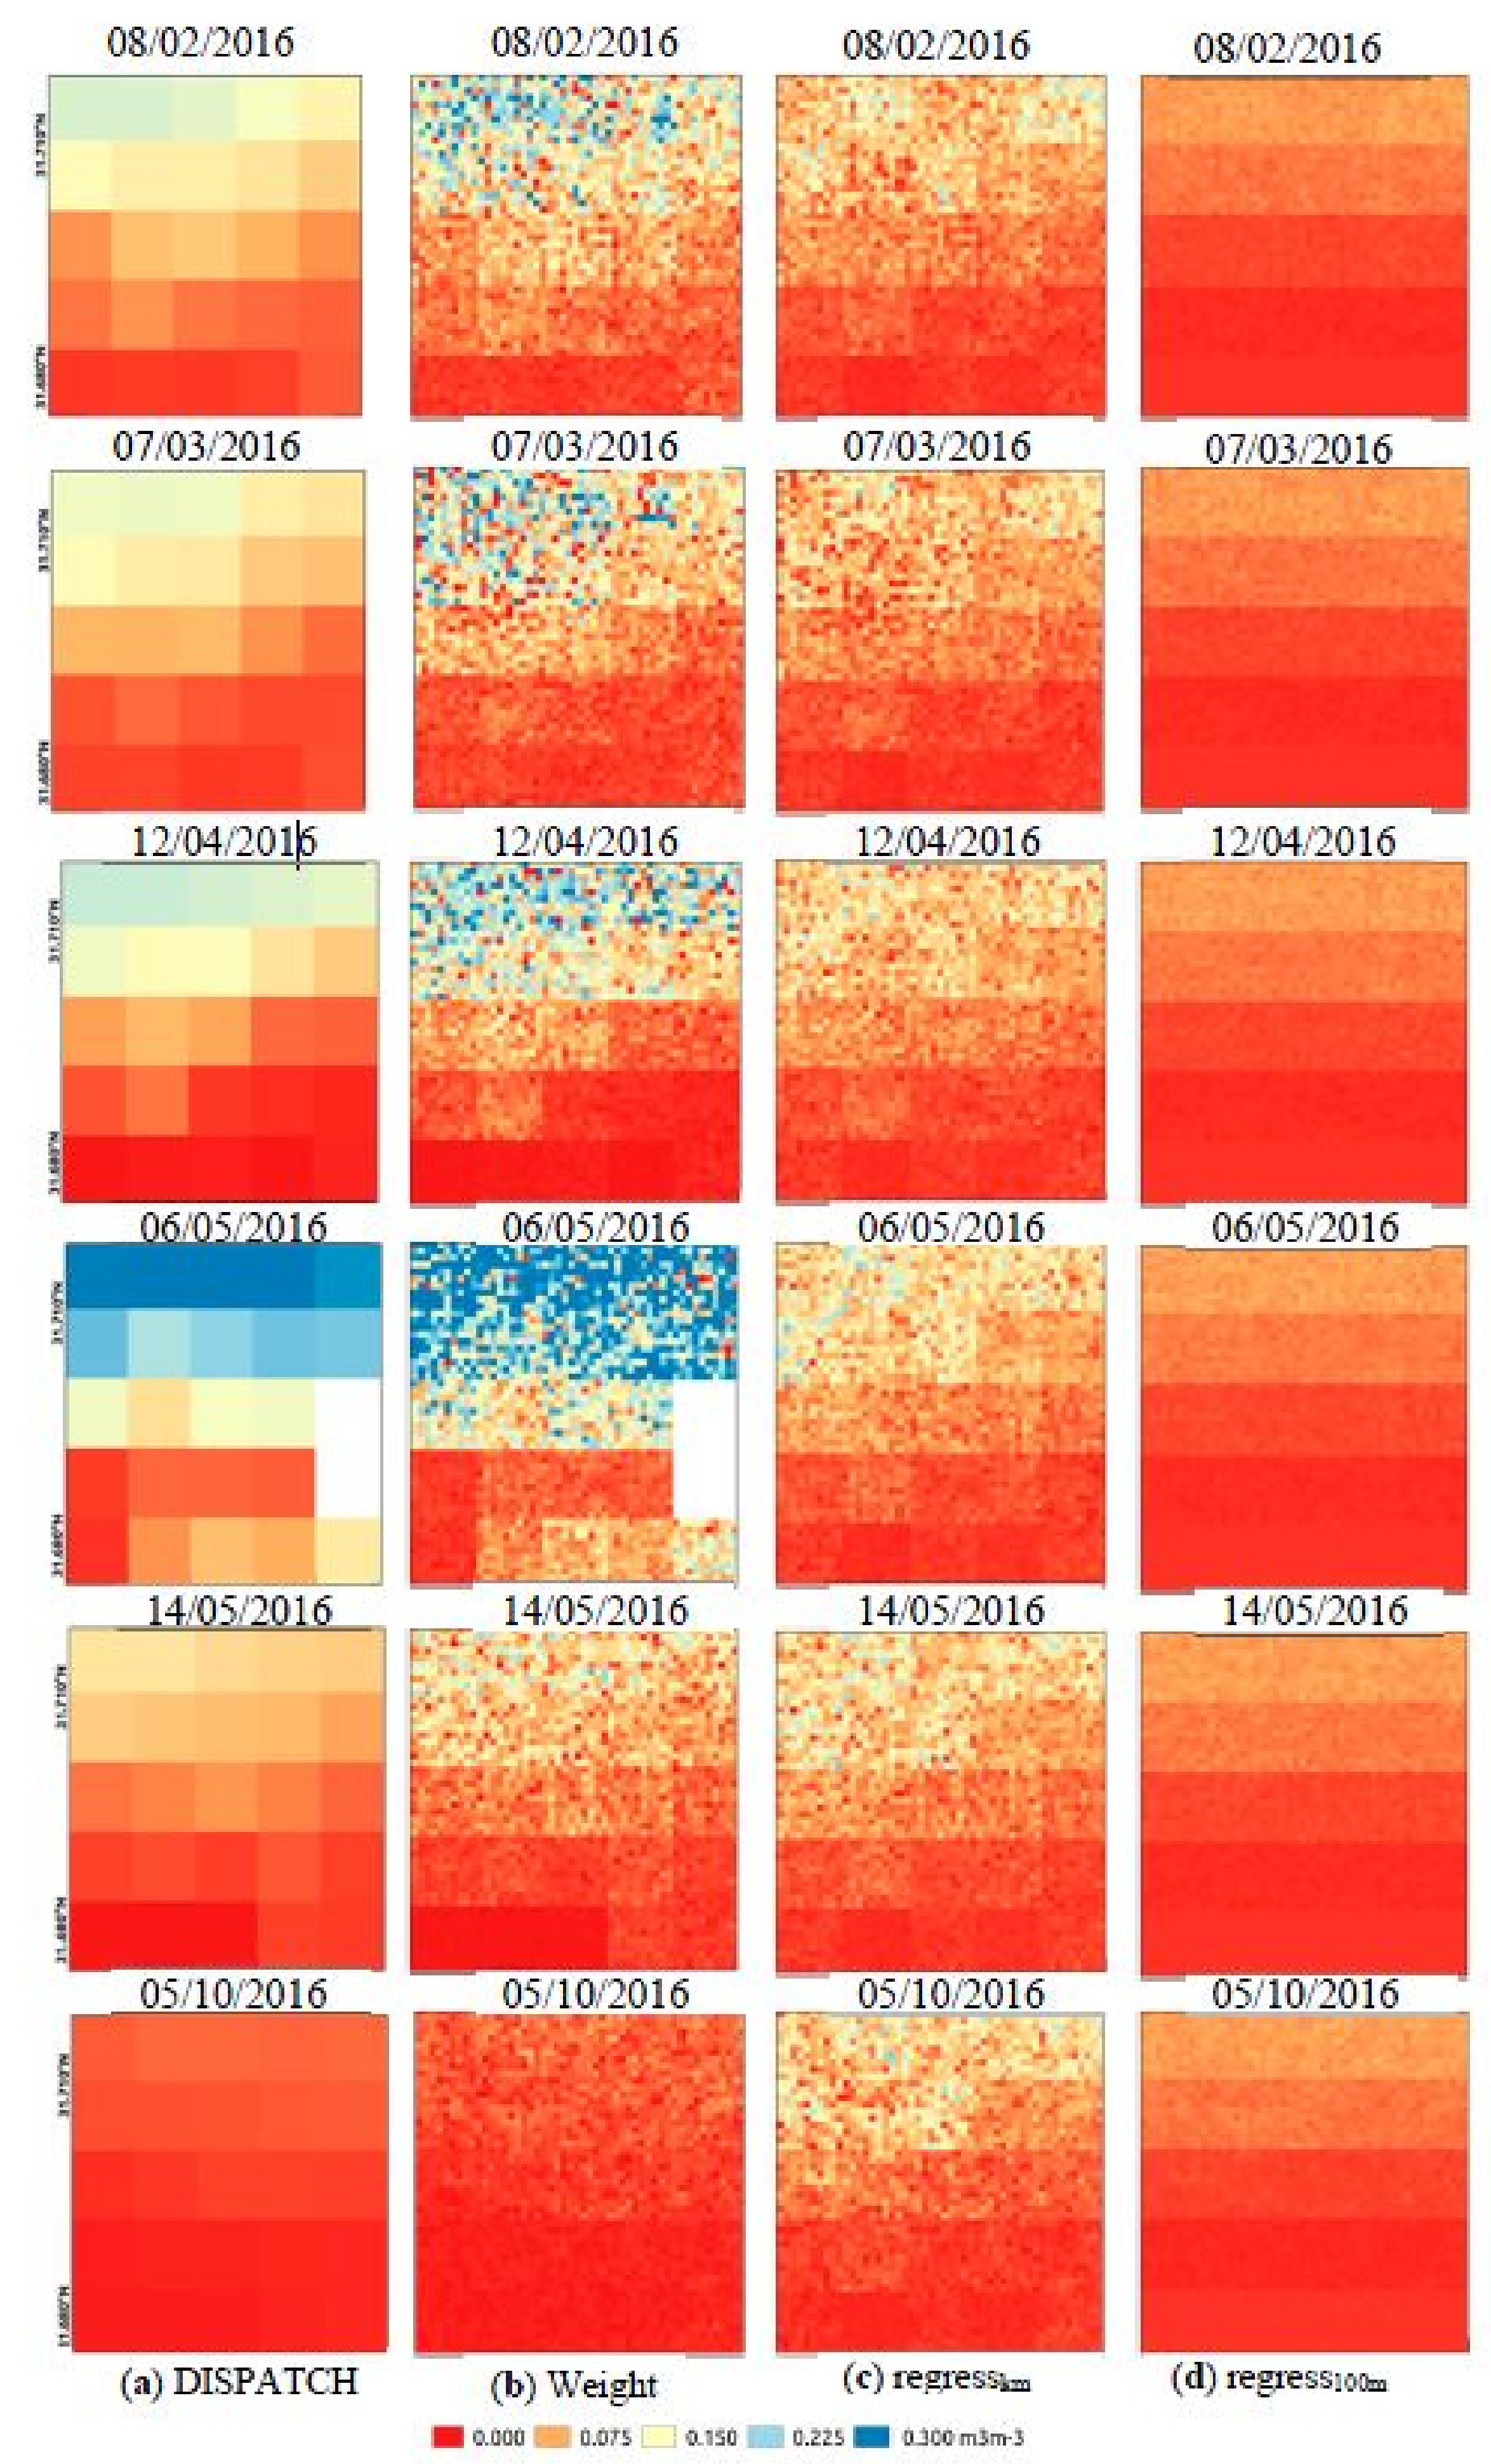
3.1. Weight Method
3.2. Regression Method
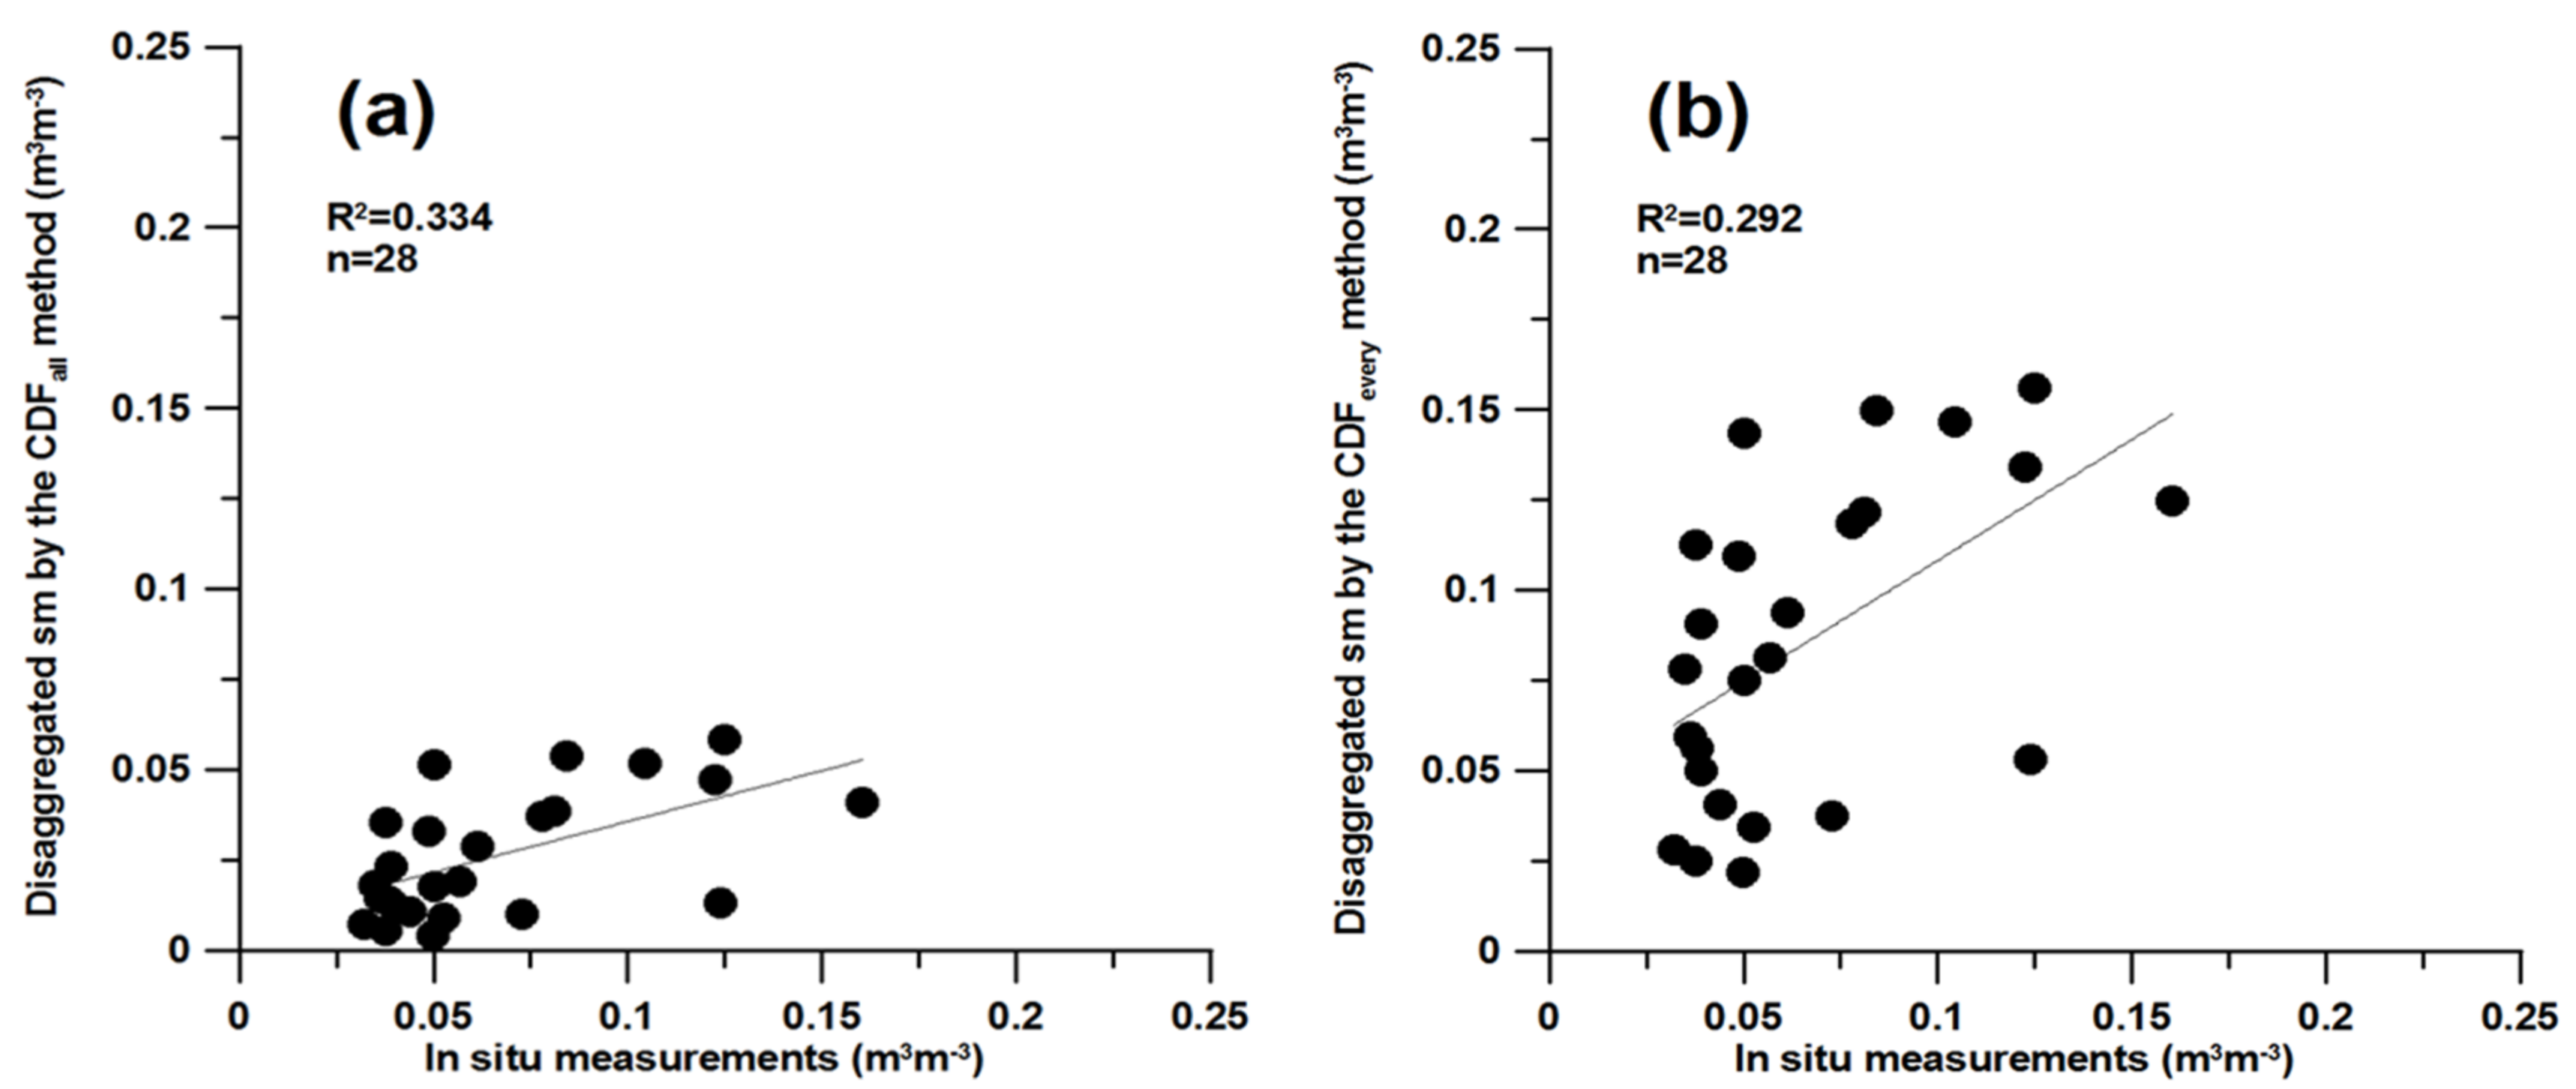
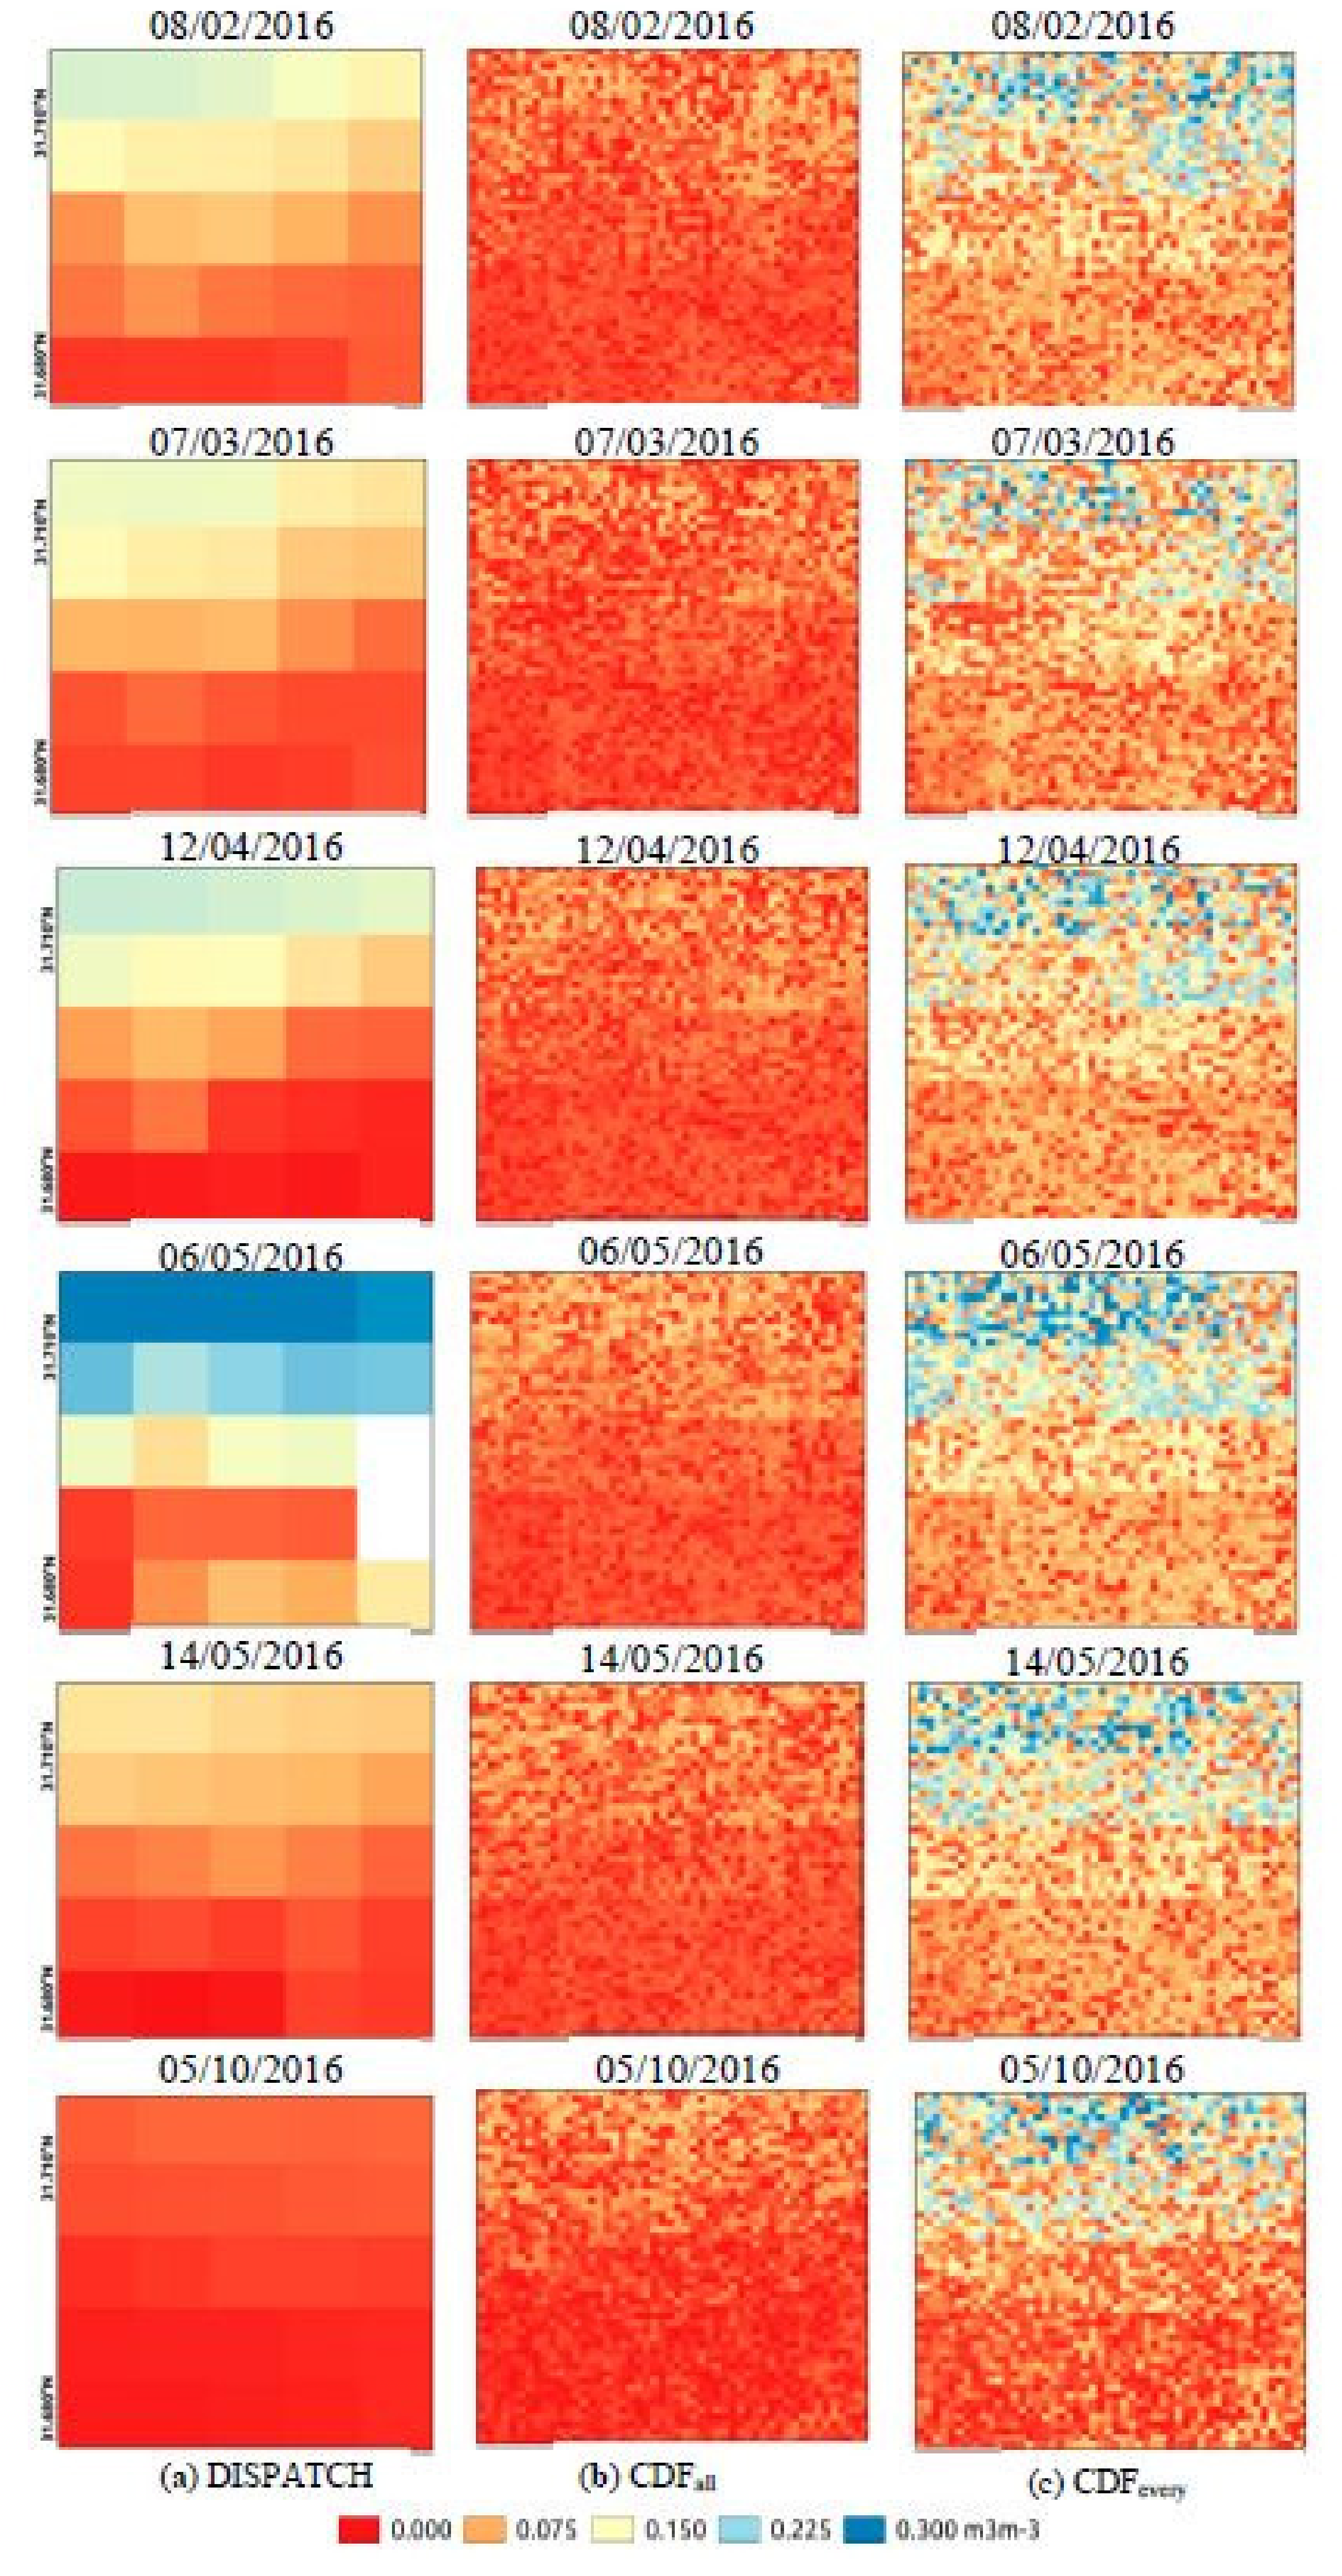
3.3. Cumulative Distribution Function (CDF) Method
4. Results
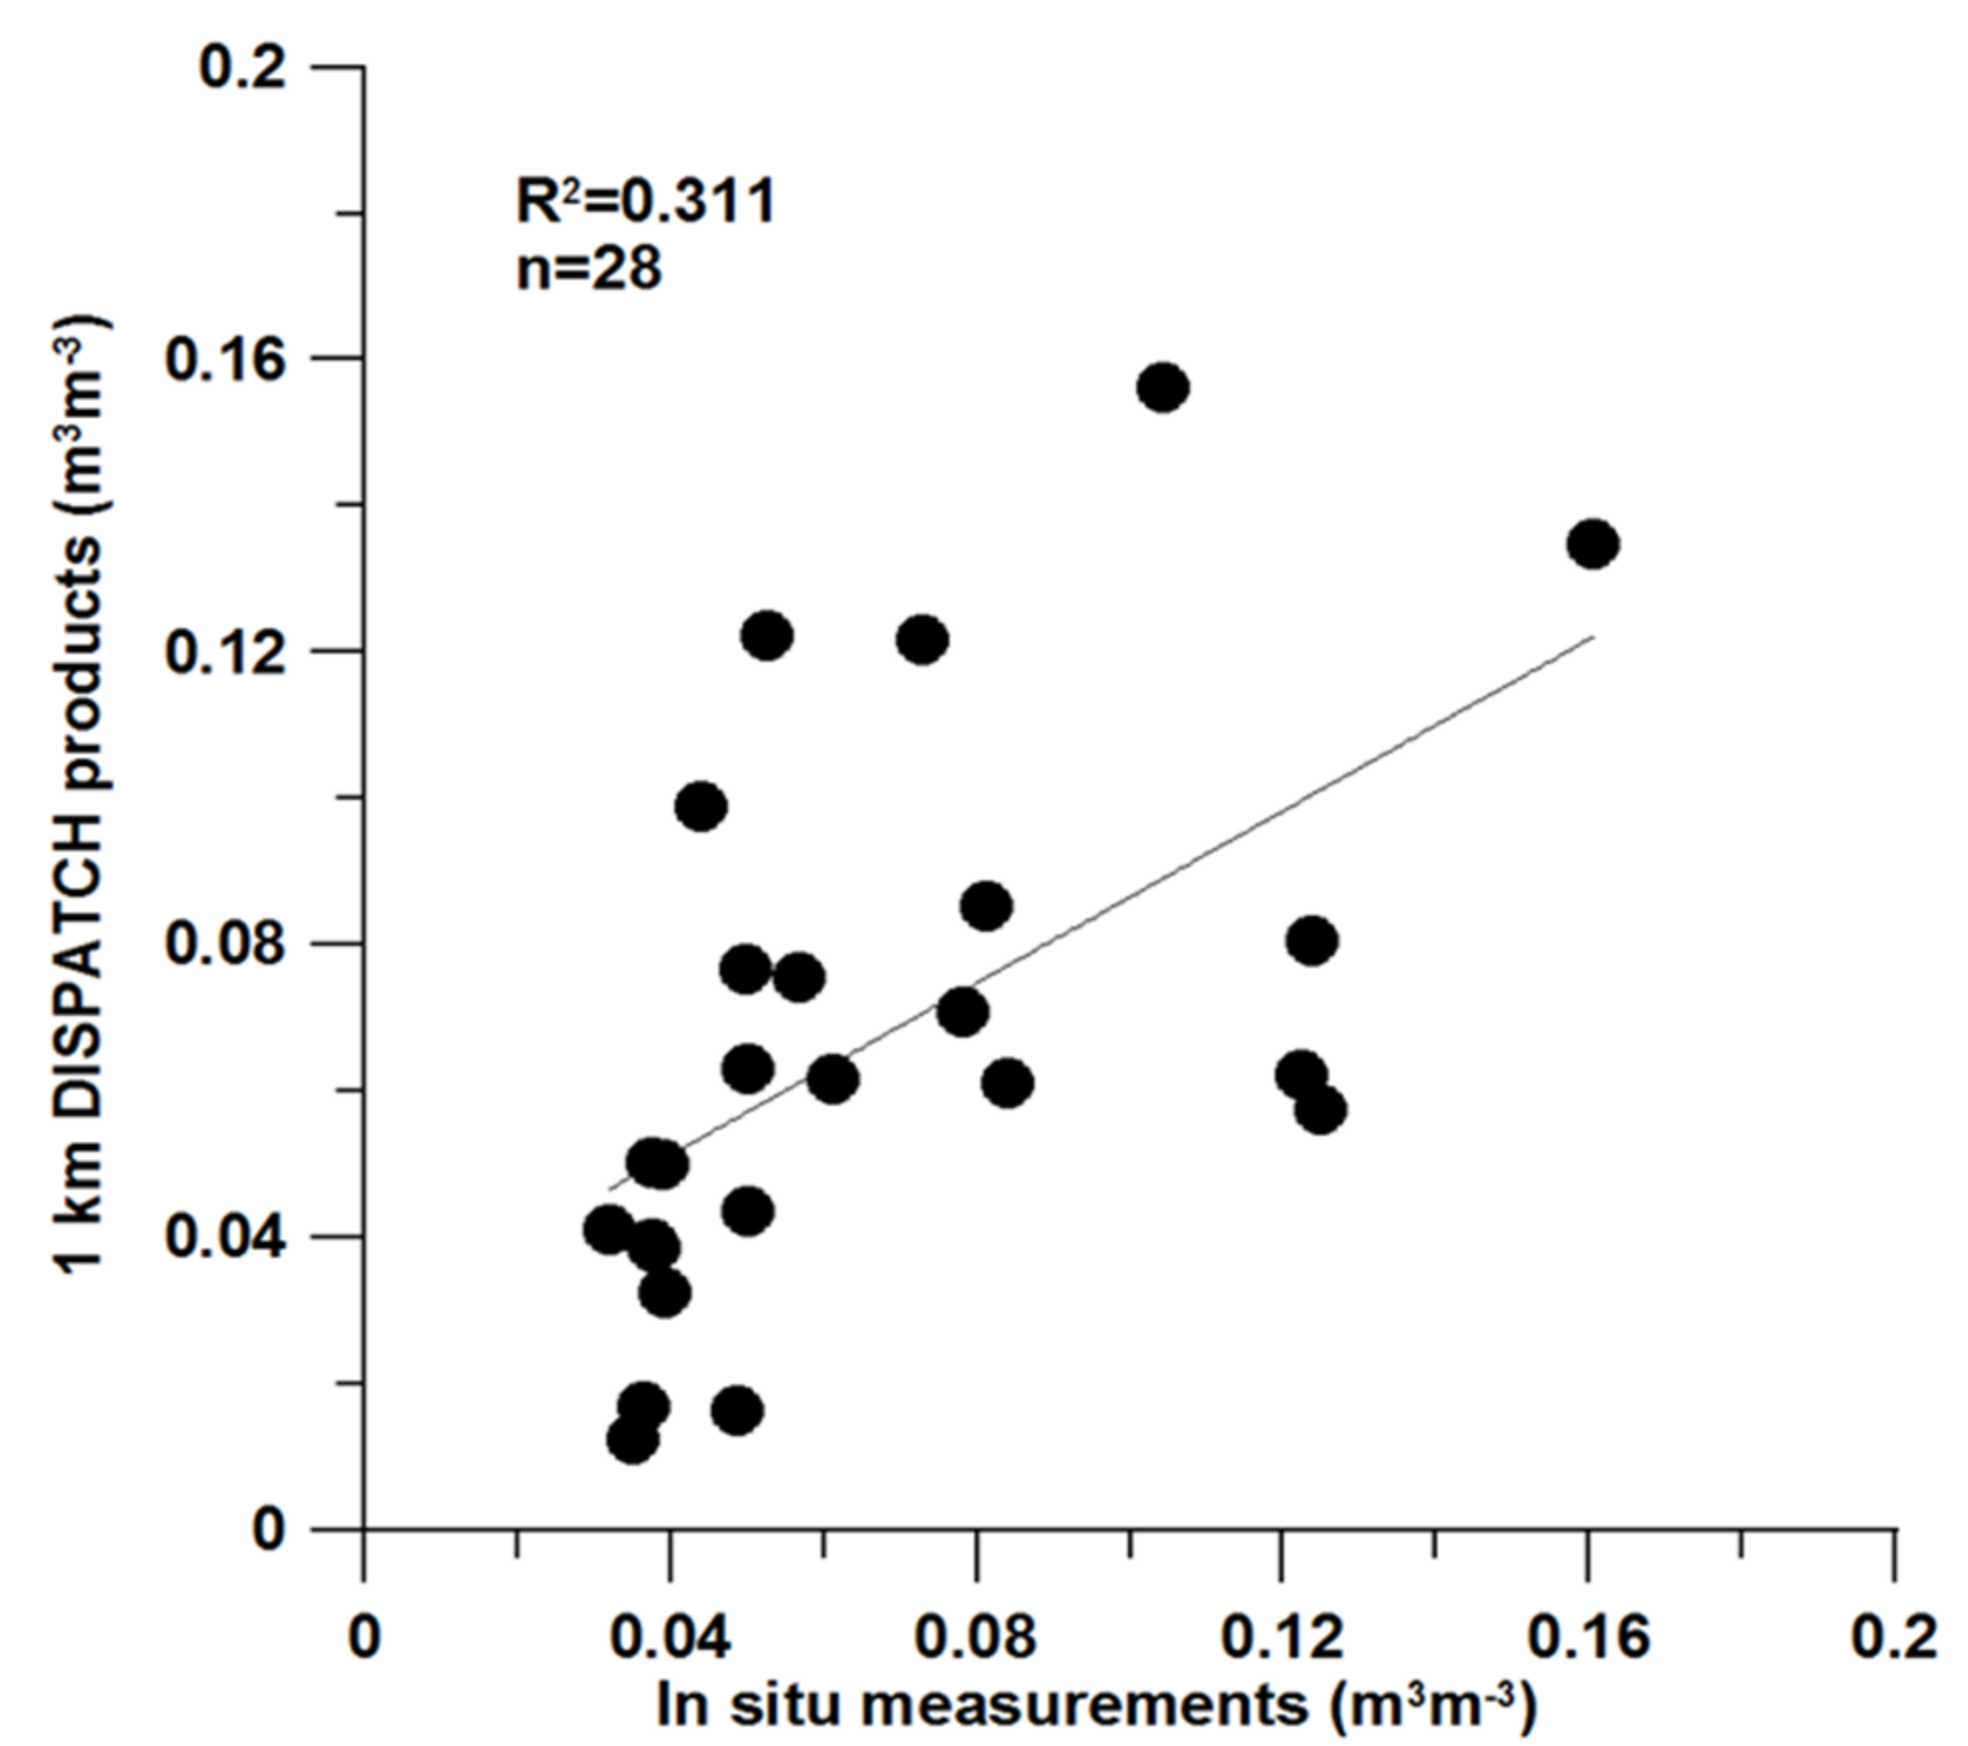
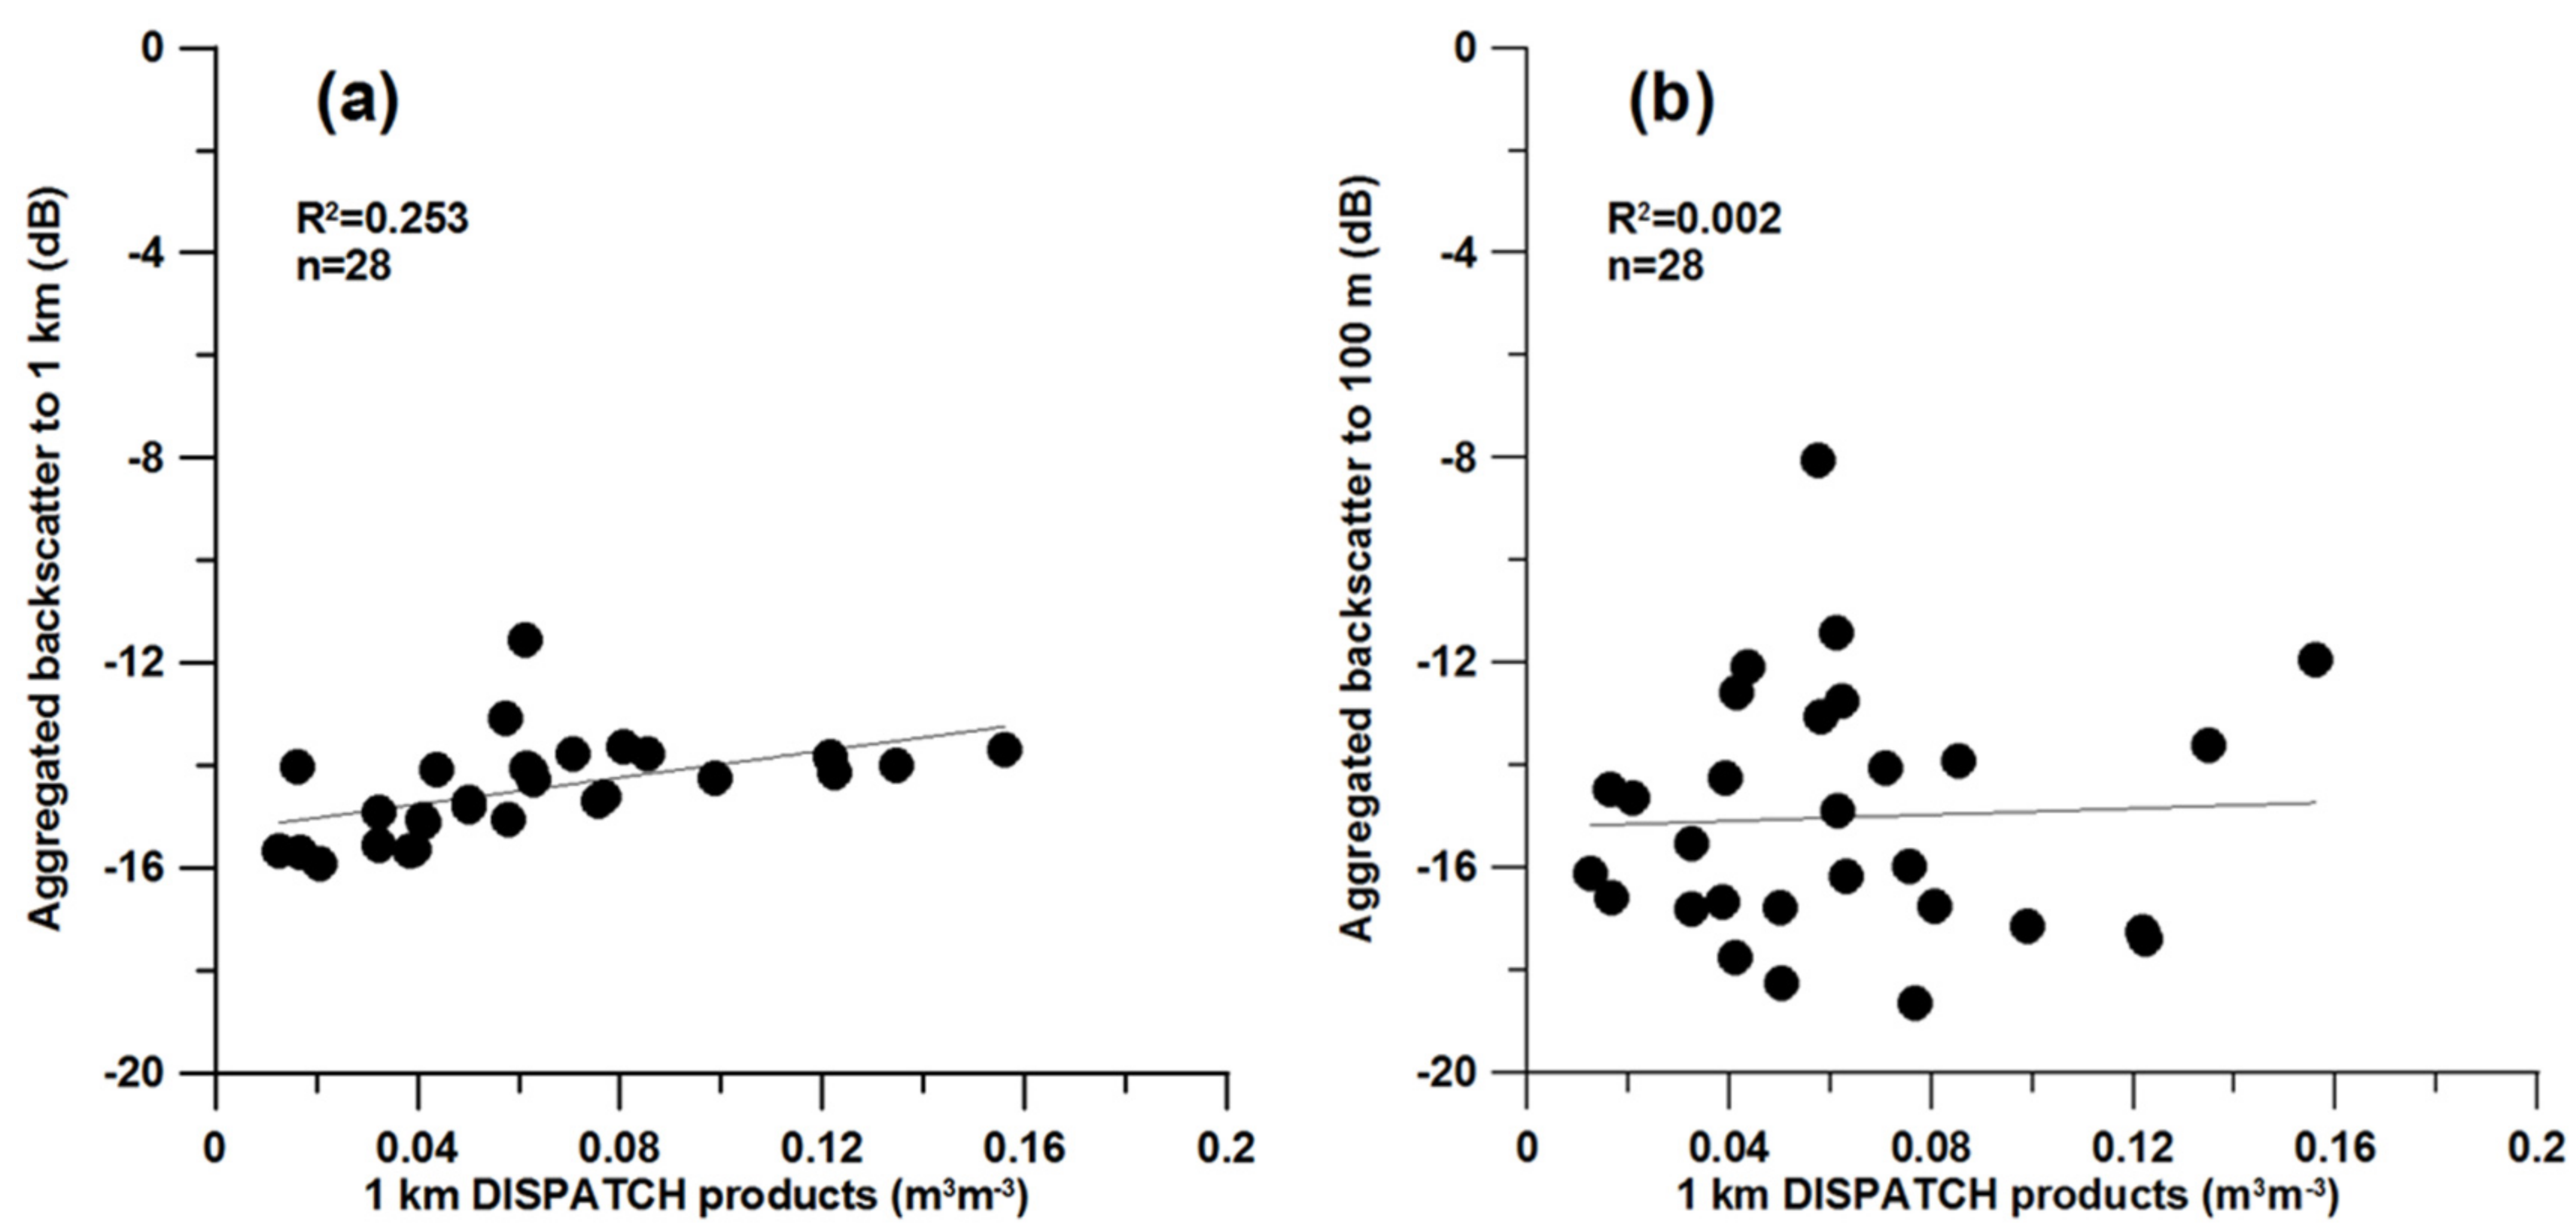
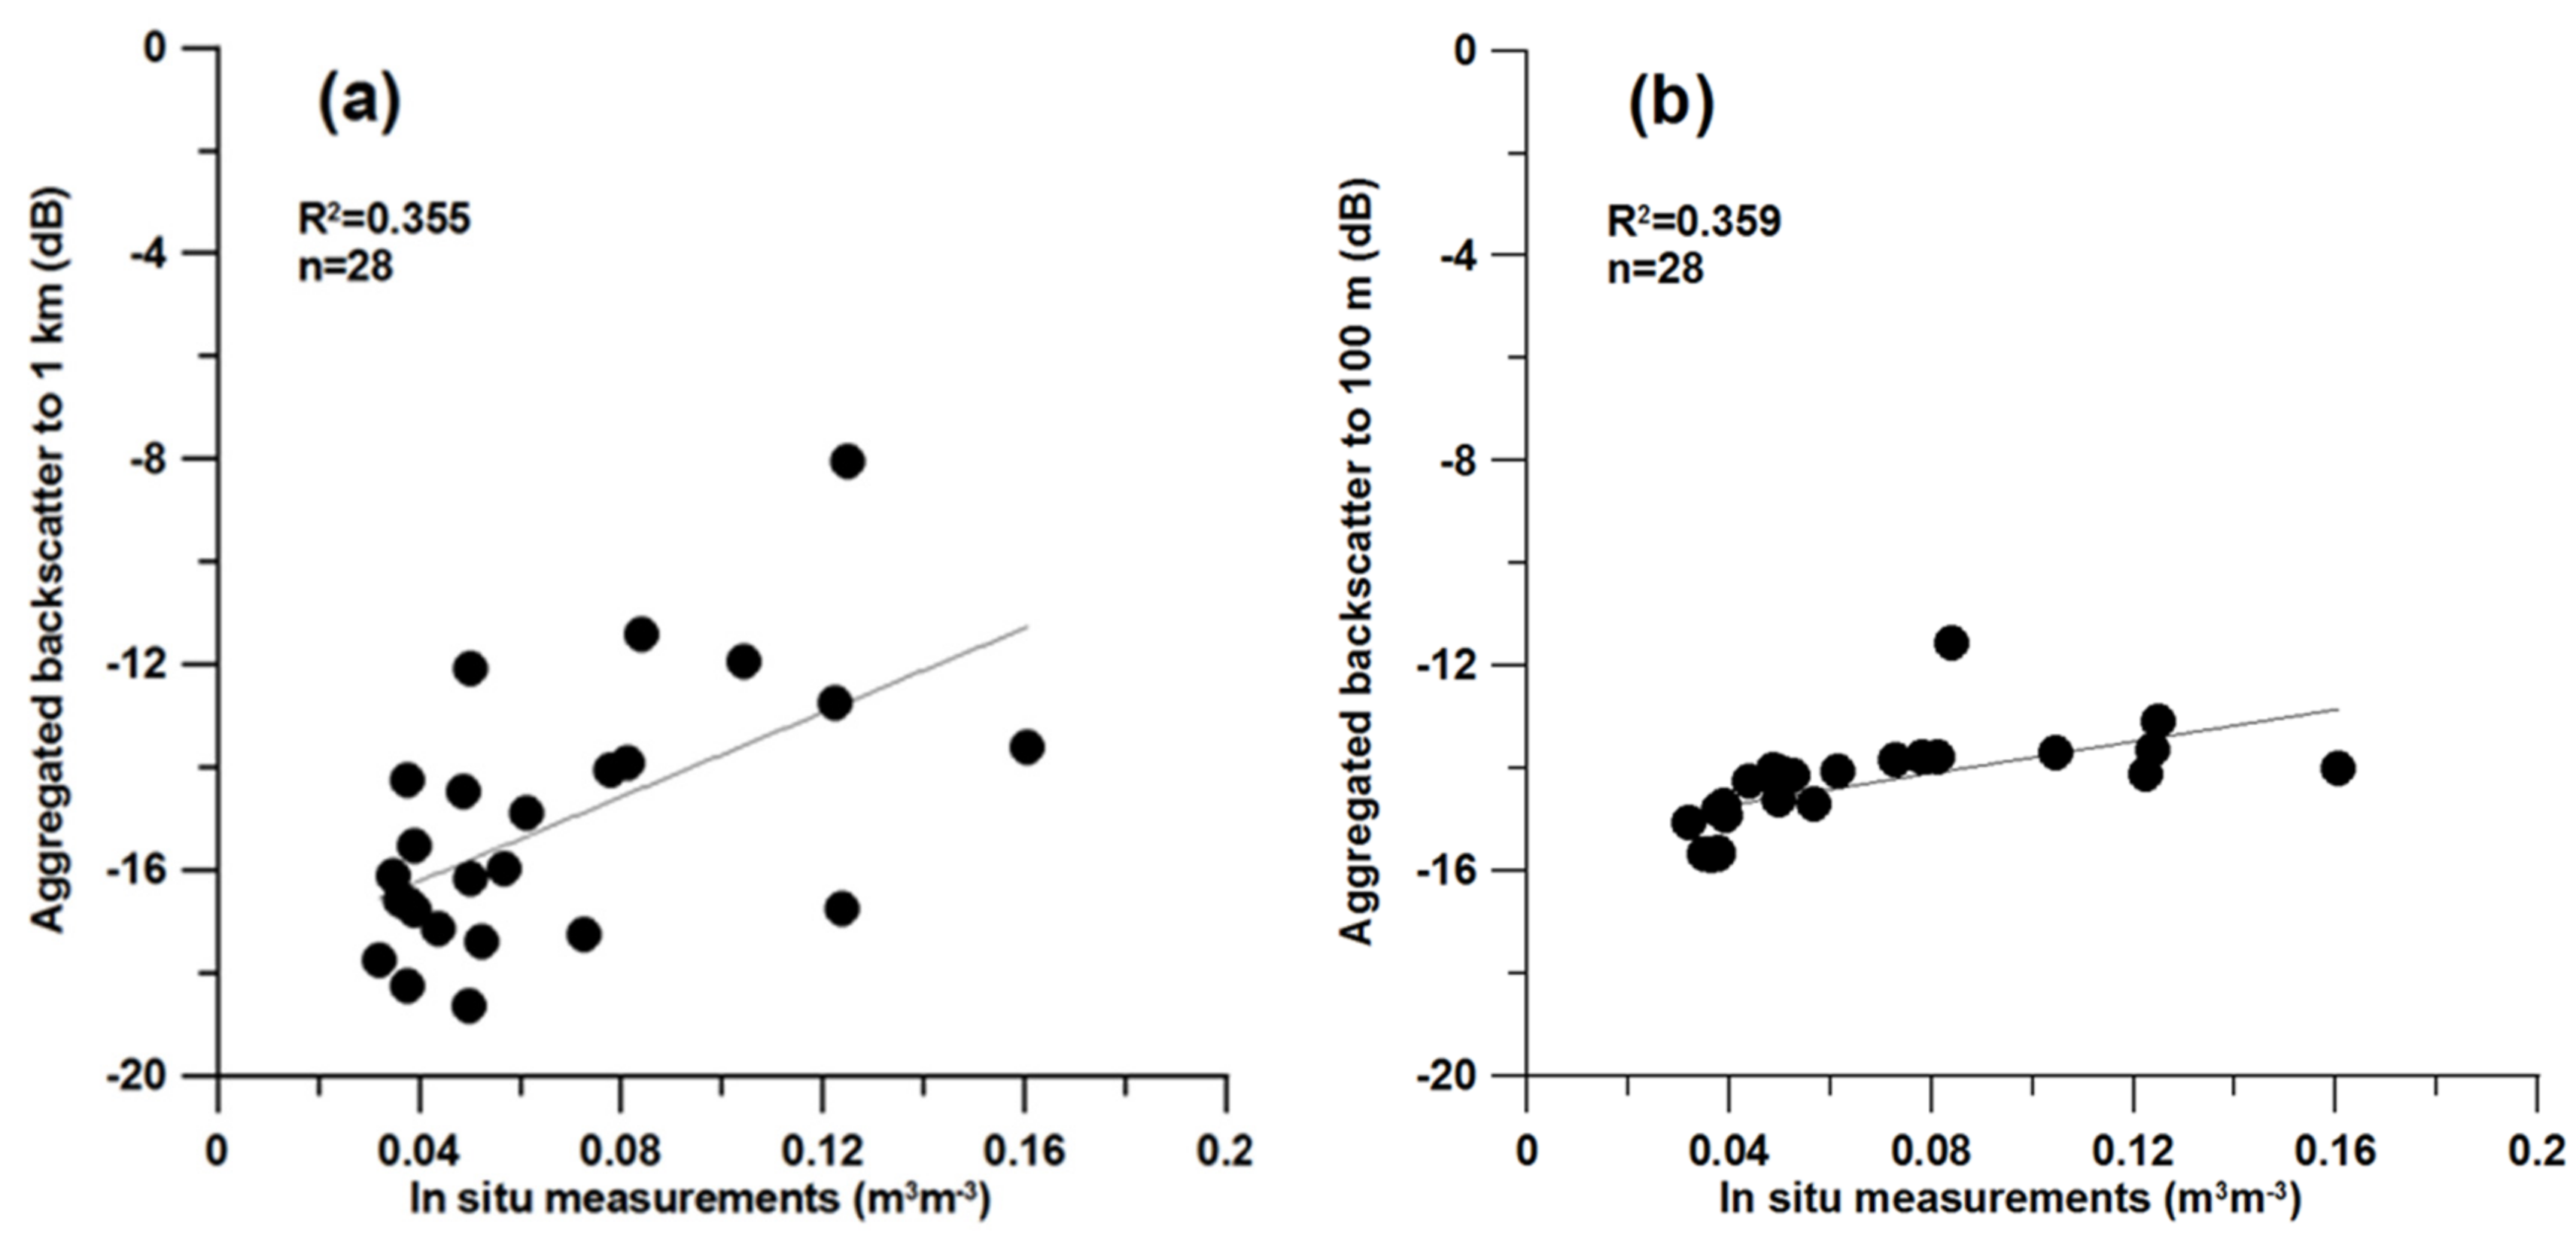
4.1. Data Analysis
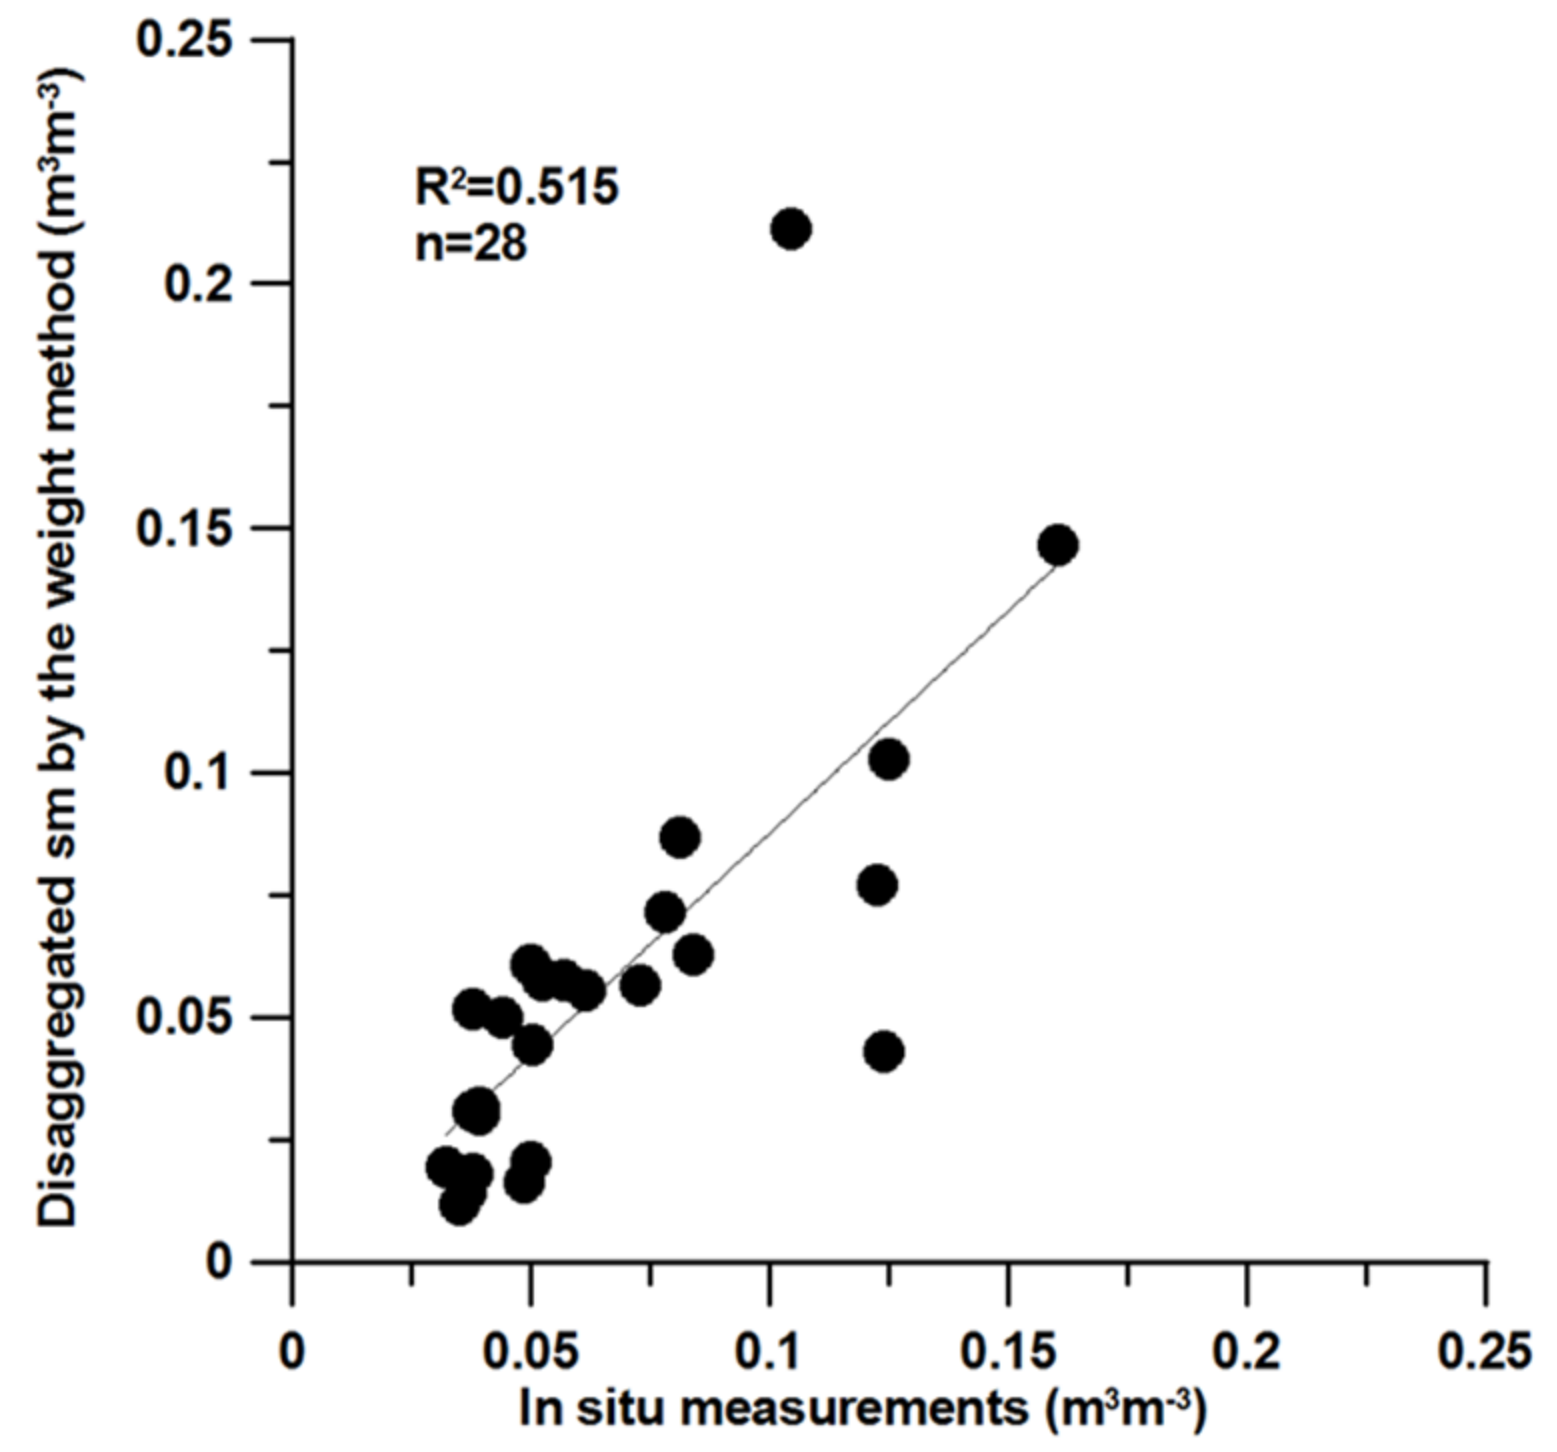
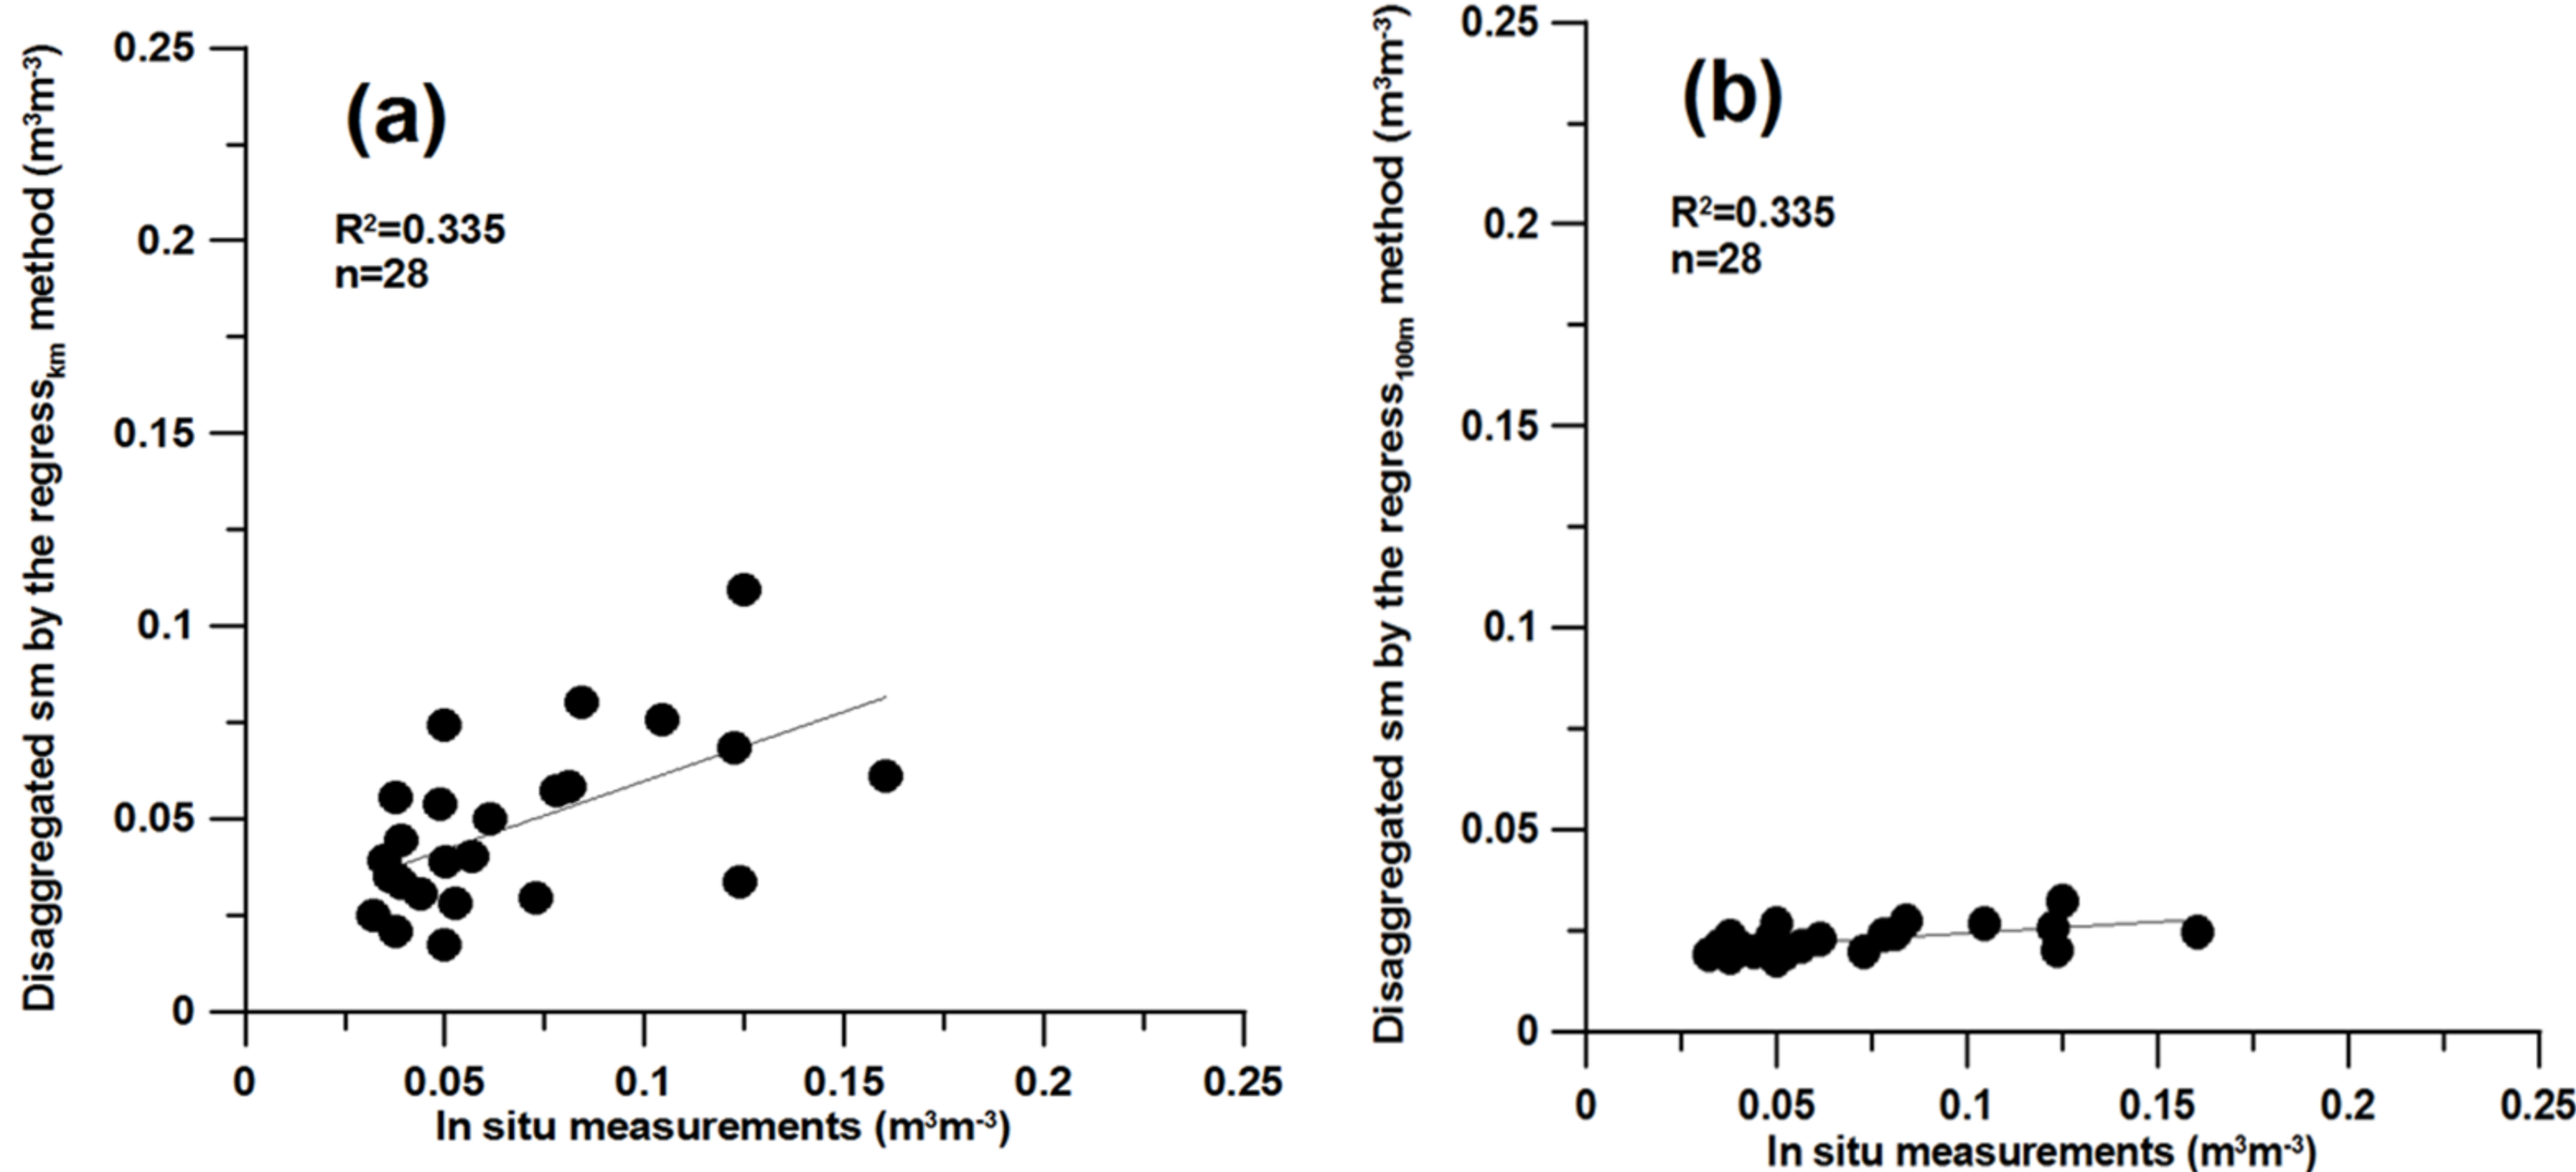
4.2. Evaluation of Disaggregated Soil Moisture Data Sets
4.3. Temporal and Spatial Pattern
4.4. Consistency with DISPATCH Data at the 1 km Resolution
4.5. Spatial Relevancy of Disaggregated Soil Moisture by the Weight Method
5. Discussion
6. Conclusions
Acknowledgments
Author Contributions
Conflicts of Interest
References
- Njoku, E.G.; Wilson, W.J.; Yueh, S.H.; Dinardo, S.J.; Li, F.K.; Jackson, T.J.; Lakshmi, V.; Bolten, J. Observations of soil moisture using a passive and active low-frequency microwave airborne sensor during SGP99. IEEE Trans. Geosci. Remote Sens. 2002. [Google Scholar] [CrossRef]
- Ulaby, F.T.; Moore, R.K.; Fung, A.K. Microwave remote sensing: Active and passive. In Radar Remote Sensing and Surface Scattering and Emission Theory; Addison-Wesley: Reading, MA, USA, 1982; Volume 2. [Google Scholar]
- Calvet, J.C.; Wigneron, J.P.; Walker, J.; Karbou, F.; Chanzy, A.; Albergel, C. Sensitivity of Passive Microwave Observations to Soil Moisture and Vegetation Water Content: L-Band to W-Band. IEEE Trans. Geosci. Remote Sens. 2011. [Google Scholar] [CrossRef]
- Njoku, E.G.; Entekhabi, D. Passive microwave remote sensing of soil moisture. J. Hydrol. 1996, 184, 101–129. [Google Scholar] [CrossRef]
- Kerr, Y.H.; Waldteufel, P.; Wigneron, J.P.; Delwart, S.; Cabot, F.; Boutin, J.; Escorihuela, M.J.; Font, J.; Reul, N.; Gruhier, C.; et al. The SMOS Mission: New Tool for Monitoring Key Elements ofthe Global Water Cycle. Proc. IEEE. 2010. [Google Scholar] [CrossRef] [Green Version]
- Kerr, Y.H.; Waldteufel, P.; Wigneron, J.P.; Martinuzzi, J.; Font, J.; Berger, M. Soil moisture retrieval from space: the Soil Moisture and Ocean Salinity (SMOS) mission. IEEE Trans. Geosci. Remote Sens. 2001. [Google Scholar] [CrossRef]
- Bitar, A.A.; Leroux, D.; Kerr, Y.H.; Merlin, O.; Richaume, P.; Sahoo, A.; Wood, E.F. Evaluation of SMOS Soil Moisture Products Over Continental U.S. Using the SCAN/SNOTEL Network. IEEE Trans. Geosci. Remote Sens. 2012, 50, 1572–1586. [Google Scholar] [CrossRef] [Green Version]
- Delwart, S.; Bouzinac, C.; Wursteisen, P.; Berger, M.; Drinkwater, M.; Martin-Neira, M.; Kerr, Y.H. SMOS Validation and the COSMOS Campaigns. IEEE Trans. Geosci. Remote Sens. 2008, 46, 695–704. [Google Scholar] [CrossRef]
- Lievens, H.; Tomer, S.K.; Al Bitar, A.; De Lannoy, G.J.M.; Drusch, M.; Dumedah, G.; Hendricks Franssen, H.-J.; Kerr, Y.H.; Martens, B.; Pan, M.; et al. SMOS soil moisture assimilation for improved hydrologic simulation in the Murray Darling Basin, Australia. Remote Sens. Environ. 2015, 168, 146–162. [Google Scholar] [CrossRef] [Green Version]
- Peng, J.; Loew, A.; Merlin, O.; Verhoest, N.E.C. A review of spatial downscaling of satellite remotely sensed soil moisture. Rev. Geophys. 2017. [Google Scholar] [CrossRef]
- Chauhan, N.S.; Le Vine, D.M.; Lang, R.H. Discrete scatter model for microwave radar and radiometer response to corn: Comparison of theory and data. IEEE Trans. Geosci. Remote Sens. 1994. [Google Scholar] [CrossRef]
- O’Neill, P.E.; Chauhan, N.S.; Jackson, T.J. Use of active and passive microwave remote sensing for soil moisture estimation through corn. Int. J. Remote Sens. 1996, 17, 1851–1865. [Google Scholar] [CrossRef]
- Famiglietti, J.S.; Devereaux, J.A.; Laymon, C.A.; Tsegaye, T.; Houser, P.R.; Jackson, T.J.; Graham, S.T.; Rodell, M.; Van Oevelen, P.J. Ground-based investigation of soil moisture variability within remote sensing footprints during the Southern Great Plains 1997 (SGP97) Hydrology Experiment. Water Resour. Res. 1999, 35, 1839–1851. [Google Scholar] [CrossRef]
- Grayson, R.B.; Western, A.W. Towards areal estimation of soil water content from point measurements: Time and space stability of mean response. J. Hydrol. 1998, 207, 68–82. [Google Scholar] [CrossRef]
- Famiglietti, J.S.; Ryu, D.; Berg, A.A.; Rodell, M.; Jackson, T.J. Field observations of soil moisture variability across scales. Water Resour. Res. 2008, 44. [Google Scholar] [CrossRef]
- Rodriguez-Iturbe, I.; Vogel, G.K.; Rigon, R.; Entekhabi, D.; Castelli, F.; Rinaldo, A. On the spatial organization of soil moisture fields. Geophys. Res. Lett. 1995, 22, 2757–2760. [Google Scholar] [CrossRef]
- Piles, M.; Entekhabi, D.; Camps, A. A Change Detection Algorithm for Retrieving High-Resolution Soil Moisture From SMAP Radar and Radiometer Observations. IEEE Trans. Geosci. Remote Sens. 2009. [Google Scholar] [CrossRef]
- Das, N.N.; Entekhabi, D.; Njoku, E.G. An algorithm for merging SMAP radiometer and radar data for high-resolution soil-moisture retrieval. IEEE Trans. Geosci. Remote Sens. 2011, 49, 1504–1512. [Google Scholar] [CrossRef]
- Das, N.N.; Entekhabi, D.; Njoku, E.G.; Shi, J.J.C.; Johnson, J.T.; Colliander, A. Tests of the SMAP combined radar and radiometer algorithm using airborne field campaign observations and simulated data. IEEE Trans. Geosci. Remote Sens. 2014, 52, 2018–2028. [Google Scholar] [CrossRef]
- Carlson, T. An Overview of the Triangle Method for Estimating Surface Evapotranspiration and Soil Moisture from Satellite Imagery. Sensors 2007, 7, 1612–1629. [Google Scholar] [CrossRef]
- Carlson, T.N.; Gillies, R.R.; Perry, E.M. A method to make use of thermal infrared temperature and NDVI measurements to infer surface soil water content and fractional vegetation cover. Remote Sens. Rev. 1994, 9, 161–173. [Google Scholar] [CrossRef]
- Moran, M.S.; Clarke, T.R.; Inoue, Y.; Vidal, A. Estimating crop water deficit using the relation between surface-air temperature and spectral vegetation index. Remote Sens. Environ. 1994, 49, 246–263. [Google Scholar] [CrossRef]
- Merlin, O.; Escorihuela, M.J.; Mayoral, M.A.; Hagolle, O.; Al Bitar, A.; Kerr, Y. Self-calibrated evaporation-based disaggregation of SMOS soil moisture: An evaluation study at 3 km and 100 m resolution in Catalunya, Spain. Remote Sens. Environ. 2013, 130, 25–38. [Google Scholar] [CrossRef] [Green Version]
- Merlin, O.; Rudiger, C.; Bitar, A.A.; Richaume, P.; Walker, J.P.; Kerr, Y.H. Disaggregation of SMOS Soil Moisture in Southeastern Australia. IEEE Trans. Geosci. Remote Sens. 2012. [Google Scholar] [CrossRef] [Green Version]
- Merlin, O.; Al Bitar, A.; Walker, J.P.; Kerr, Y. A sequential model for disaggregating near-surface soil moisture observations using multi-resolution thermal sensors. Remote Sens. Environ. 2009, 113, 2275–2284. [Google Scholar] [CrossRef] [Green Version]
- Lagouarde, J.-P.; Bach, M.; Sobrino, J.A.; Boulet, G.; Briottet, X.; Cherchali, S.; Coudert, B.; Dadou, I.; Dedieu, G.; Gamet, P.; et al. The MISTIGRI thermal infrared project: Scientific objectives and mission specifications. Int. J. Remote Sens. 2013, 34, 3437–3466. [Google Scholar] [CrossRef]
- Köppen Climate Classification. Available online: https://en.wikipedia.org/wiki/K%C3%B6ppen_climate_classification (accessed on 30 October 2017).
- Merlin, O.; Olivera, L.; Hssaine, B.A.; Amazirh, A.; Rafi, Z.; Ezzahar, J.; Gentine, P.; Khabba, S.; Gascoin, S.; Er-Raki, S. A phenomenological model of soil evaporative efficiency using soil moisture and radiometric temperature data. Agric. For. Meteorol. in review.
- Molero, B.; Merlin, O.; Malbéteau, Y.; Al Bitar, A.; Cabot, F.; Stefan, V.; Kerr, Y.; Bacon, S.; Cosh, M.H.; Bindlish, R.; et al. SMOS disaggregated soil moisture product at 1 km resolution: Processor overview and first validation results. Remote Sens. Environ. 2016, 180, 361–376. [Google Scholar] [CrossRef]
- Merlin, O.; Walker, J.P.; Chehbouni, A.; Kerr, Y. Towards deterministic downscaling of SMOS soil moisture using MODIS derived soil evaporative efficiency. Remote Sens. Environ. 2008, 112, 3935–3946. [Google Scholar] [CrossRef] [Green Version]
- Eweys, O.A.; Elwan, A.A.; Borham, T.I. Retrieving topsoil moisture using RADARSAT-2 data, a novel approach applied at the east of The Netherlands. J. Hydrol. 2017, 555, 670–682. [Google Scholar] [CrossRef]
- Jarlan, L.; Khabba, S.; Er-Raki, S.; Le Page, M.; Hanich, L.; Fakir, Y.; Merlin, O.; Mangiarotti, S.; Gascoin, S.; Ezzahar, J.; et al. Remote Sensing of Water Resources in Semi-Arid Mediterranean Areas: The joint international laboratory TREMA. Int. J. Remote Sens. 2015, 36, 4879–4917. [Google Scholar] [CrossRef]
- International Joint Laboratory. Remote Sensing and Water Resources in the Semi-Arid Mediterranean. Available online: http://trema.ucam.ac.ma (accessed on 30 October 2017).
- Sentinel Application Platform. Available online: http://step.esa.int/main/toolboxes/snap/ (accessed on 30 October 2017).
- Wagner, W.; Pathe, C.; Doubkova, M.; Sabel, D.; Bartsch, A.; Hasenauer, S.; Blöschl, G.; Scipal, K.; Martínez-Fernández, J.; Löw, A. Temporal Stability of Soil Moisture and Radar Backscatter Observed by the Advanced Synthetic Aperture Radar (ASAR). Sensors 2008, 8, 1174–1197. [Google Scholar] [CrossRef] [PubMed] [Green Version]
- Alvarez-Mozos, J.; Casali, J.; Gonzalez-Audicana, M.; Verhoest, N.E.C. Assessment of the operational applicability of RADARSAT-1 data for surface soil moisture estimation. IEEE Trans. Geosci. Remote Sens. 2006. [Google Scholar] [CrossRef]
- Baghdadi, N.; Gherboudj, I.; Zribi, M.; Sahebi, M.; King, C.; Bonn, F. Semi-empirical calibration of the IEM backscattering model using radar images and moisture and roughness field measurements. Int. J. Remote Sens. 2004, 25, 3593–3623. [Google Scholar] [CrossRef]
- Ulaby, F.T.; Moore, R.K.; Fung, A.K. Microwave remote sensing: Active and passive. Volume III: from theory to applications. In Microwave Remote Sensing: Active and Passive. Volume III: From Theory to Applications; Remote Sensing Series 4; Artech House: Norwood, MA, USA, 1986. [Google Scholar]
- Zribi, M.; Gorrab, A.; Baghdadi, N.; Lili-Chabaane, Z.; Mougenot, B. Influence of radar frequency on the relationship between bare surface soil moisture vertical profile and radar backscatter. IEEE Geosci. Remote Sens. Lett. 2014, 11, 848–852. [Google Scholar] [CrossRef] [Green Version]
- Tomer, S.; Al Bitar, A.; Sekhar, M.; Zribi, M.; Bandyopadhyay, S.; Sreelash, K.; Sharma, A.K.; Corgne, S.; Kerr, Y. Retrieval and Multi-scale Validation of Soil Moisture from Multi-temporal SAR Data in a Semi-Arid Tropical Region. Remote Sens. 2015, 7, 8128–8153. [Google Scholar] [CrossRef]
- Fang, B.; Lakshmi, V. Passive/active microwave soil moisture retrieval disaggregation using SMAPVEX12 data. In Proceedings of the 11th SPIE Asia-Pacific Remote Sensing Symposium, Honolulu, HI, USA, 24–27 September 2018. [Google Scholar] [CrossRef]
- Raes, D. Frequency Analysis of Rainfall Data; K.U. Leuven Inter-University Programme in Water Resources Engineering (IUPWARE): Leuven, Belgium, 2004; p. 42. [Google Scholar]
- Thomsen, L.M.; Baartman, J.E.M.; Barneveld, R.J.; Starkloff, T.; Stolte, J. Soil surface roughness: Comparing old and new measuring methods and application in a soil erosion model. SOIL 2015, 1, 399–410. [Google Scholar] [CrossRef]
- Crow, W.T.; Berg, A.A.; Cosh, M.H.; Loew, A.; Mohanty, B.P.; Panciera, R.; De Rosnay, P.; Ryu, D.; Walker, J.P. Upscaling sparse ground-based soil moisture observations for the validation of coarse-resolution satellite soil moisture products. Rev. Geophys. 2012, 50. [Google Scholar] [CrossRef]
- Velde, R.; Van der Salama, M.S.; Eweys, O.A.; Wen, J.; Wang, Q. Soil Moisture Mapping Using Combined Active/Passive Microwave Observations Over the East of the Netherlands. IEEE J. Sel. Top. Appl. Earth Obs. Remote Sens. 2015. [Google Scholar] [CrossRef]


| Method | Assumption |
|---|---|
| Weight | 100 m resolution radar backscatter and soil moisture are related within a 1 km pixel and for a given date. |
| Regression | Parameters (e.g., intercept and slope) controlling the temporal relationship between radar backscatter and soil moisture are variable in space only (not in time). |
| CDF | The cumulative distribution function controls the temporal relationship between radar backscatter and soil moisture and varies in space only. |
| R2 | MAD(m3 m−3) | RMSD(m3 m−3) | Bias(m3 m−3) | |
|---|---|---|---|---|
| DISPATCH | 0.311 | 0.025 | 0.033 | 0.0003 |
| weight | 0.515 | 0.021 | 0.032 | −0.009 |
| regresskm | 0.335 | 0.023 | 0.034 | −0.019 |
| regress100m | 0.335 | 0.044 | 0.055 | −0.044 |
| CDFall | 0.334 | 0.040 | 0.049 | −0.040 |
| CDFevery | 0.292 | 0.036 | 0.042 | 0.019 |
| R2 | MAD (m3 m−3) | RMSD (m3 m−3) | Bias (m3 m−3) | |
|---|---|---|---|---|
| weight | 0.740 | 0.017 | 0.030 | −0.0001 |
| regresskm | 0.442 | 0.030 | 0.047 | −0.0235 |
| regress100m | 0.337 | 0.029 | 0.043 | −0.0008 |
| CDFall | 0.218 | 0.054 | 0.069 | 0.0368 |
| CDFevery | 0.159 | 0.267 | 0.337 | −0.2634 |
| (0, 0) | (0, 1) | (0, 2) | (1, 0) | (1, 1) | (1, 2) | (2, 0) | (2, 1) | (2, 2) | |
|---|---|---|---|---|---|---|---|---|---|
| Bare soil % | 40–50 | 20–30 | 90–95 | >95 | 100 | 90–95 | >95 | 100 | >95 |
| R2 | 0.161 | 0.045 | 0.255 | 0.368 | 1 | 0.320 | 0.484 | 0.650 | 0.388 |
| RMSD | 0.041 | 0.062 | 0.047 | 0.050 | 0 | 0.057 | 0.044 | 0.028 | 0.034 |
| MAD | 0.030 | 0.035 | 0.032 | 0.039 | 0 | 0.041 | 0.031 | 0.020 | 0.025 |
| Bias | −0.004 | 0.004 | 0.001 | 0.015 | 0 | 0.026 | 0.023 | −0.014 | −0.001 |
© 2017 by the authors. Licensee MDPI, Basel, Switzerland. This article is an open access article distributed under the terms and conditions of the Creative Commons Attribution (CC BY) license (http://creativecommons.org/licenses/by/4.0/).
Share and Cite
Eweys, O.A.; Escorihuela, M.J.; Villar, J.M.; Er-Raki, S.; Amazirh, A.; Olivera, L.; Jarlan, L.; Khabba, S.; Merlin, O. Disaggregation of SMOS Soil Moisture to 100 m Resolution Using MODIS Optical/Thermal and Sentinel-1 Radar Data: Evaluation over a Bare Soil Site in Morocco. Remote Sens. 2017, 9, 1155. https://doi.org/10.3390/rs9111155
Eweys OA, Escorihuela MJ, Villar JM, Er-Raki S, Amazirh A, Olivera L, Jarlan L, Khabba S, Merlin O. Disaggregation of SMOS Soil Moisture to 100 m Resolution Using MODIS Optical/Thermal and Sentinel-1 Radar Data: Evaluation over a Bare Soil Site in Morocco. Remote Sensing. 2017; 9(11):1155. https://doi.org/10.3390/rs9111155
Chicago/Turabian StyleEweys, Omar Ali, Maria José Escorihuela, Josep M. Villar, Salah Er-Raki, Abdelhakim Amazirh, Luis Olivera, Lionel Jarlan, Saïd Khabba, and Olivier Merlin. 2017. "Disaggregation of SMOS Soil Moisture to 100 m Resolution Using MODIS Optical/Thermal and Sentinel-1 Radar Data: Evaluation over a Bare Soil Site in Morocco" Remote Sensing 9, no. 11: 1155. https://doi.org/10.3390/rs9111155