Article

The Cross-Calibration of Spectral Radiances and Cross-Validation of CO2 Estimates from GOSAT and OCO-2

1
Remote Sensing Technology Center of Japan, 2-1-1 Sengen, Tsukuba 305-8505, Japan
2
Jet Propulsion Laboratory, 4800 Oak Grove Drive, Pasadena, CA 91109, USA
3
Cooperative Institute for Research in the Atmosphere, Colorado State University, Fort Collins, CO 80523, USA
4
Japan Aerospace Exploration Agency, 2-1-1 Sengen, Tsukuba 305-8505, Japan
5
Joint Institute for Regional Earth System Science and Engineering (JIFRESSE), University of California, Los Angeles (UCLA), Los Angeles, CA 90095, USA
*
Author to whom correspondence should be addressed.
Remote Sens. 2017, 9(11), 1158; https://doi.org/10.3390/rs9111158
Submission received: 30 August 2017 / Revised: 23 October 2017 / Accepted: 8 November 2017 / Published: 11 November 2017
(This article belongs to the Special Issue Remote Sensing of Greenhouse Gases)

Abstract

:
The Greenhouse gases Observing SATellite (GOSAT) launched in January 2009 has provided radiance spectra with a Fourier Transform Spectrometer for more than eight years. The Orbiting Carbon Observatory 2 (OCO-2) launched in July 2014, collects radiance spectra using an imaging grating spectrometer. Both sensors observe sunlight reflected from Earth’s surface and retrieve atmospheric carbon dioxide (CO2) concentrations, but use different spectrometer technologies, observing geometries, and ground track repeat cycles. To demonstrate the effectiveness of satellite remote sensing for CO2 monitoring, the GOSAT and OCO-2 teams have worked together pre- and post-launch to cross-calibrate the instruments and cross-validate their retrieval algorithms and products. In this work, we first compare observed radiance spectra within three narrow bands centered at 0.76, 1.60 and 2.06 µm, at temporally coincident and spatially collocated points from September 2014 to March 2017. We reconciled the differences in observation footprints size, viewing geometry and associated differences in surface bidirectional reflectance distribution function (BRDF). We conclude that the spectral radiances measured by the two instruments agree within 5% for all bands. Second, we estimated mean bias and standard deviation of column-averaged CO2 dry air mole fraction (XCO2) retrieved from GOSAT and OCO-2 from September 2014 to May 2016. GOSAT retrievals used Build 7.3 (V7.3) of the Atmospheric CO2 Observations from Space (ACOS) algorithm while OCO-2 retrievals used Version 7 of the OCO-2 retrieval algorithm. The mean biases and standard deviations are −0.57 ± 3.33 ppm over land with high gain, −0.17 ± 1.48 ppm over ocean with high gain and −0.19 ± 2.79 ppm over land with medium gain. Finally, our study is complemented with an analysis of error sources: retrieved surface pressure (Psurf), aerosol optical depth (AOD), BRDF and surface albedo inhomogeneity. We found no change in XCO2 bias or standard deviation with time, demonstrating that both instruments are well calibrated.

1. Introduction

1.1. CO2 Monitoring from Space

The Greenhouse gases Observing SATellite (GOSAT) was the first instrument with high spectral resolution and wide spectral coverage designed for measuring greenhouse gases from space. GOSAT was launched on 23 January 2009 and has been returning data for more than eight years. The Orbiting Carbon Observatory 2 (OCO-2) was launched on 2 July 2014 and has been returning data since September 2014. Both instruments are designed to measure the global distribution of atmospheric carbon dioxide (CO2) from space.
The column-averaged dry air mole fraction of CO2 (XCO2) in the atmosphere can be measured remotely using differential optical absorption spectroscopy. Both GOSAT and OCO-2 measure sunlight reflected by the Earth, including contributions from the surface, clouds and aerosols, at 0.76, 1.60 and 2.06 µm. To estimate the surface and atmospheric geophysical state, absolute instrument radiometric accuracy must be maintained to within 10% [1]. To investigate the uncertainties and biases between the respective data products, the OCO-2 and GOSAT teams have executed a number of cross-comparison studies both prior to launch and on-orbit. These exercises have facilitated the interpretation of the data from both missions.
In December 2016, the Chinese TanSat was launched [2], adding a third greenhouse gas observing satellite to the international fleet. The Copernicus Sentinel-5 Precursor (S5p) carrying the TROPOspheric Monitoring Instrument (TROPOMI) [3], GOSAT-2 [4] and OCO-3 [5] are also scheduled to be launched in the near future. As the number of distinct greenhouse gas monitoring satellites increases, each with a unique instrument design, the inter-comparison of spectral radiances and cross-validation of atmospheric composition are crucial to confirm post-launch mission success.
Buchwitz et al. [6] compared retrieved XCO2 from the GOSAT spectra radiance product with several different algorithms. The single measurement precision requirement has been met for GOSAT XCO2 (<3 ppm) among several retrieval algorithms, but the uncertainties of the individual algorithms were presented. Heymann et al. [7] applied the same Bremen Optimal Estimation DOAS (BESD) algorithm to different satellite instruments and compared XCO2 from the SCanning Imaging Absorption spectroMeter for Atmospheric CHartographY (SCIAMACHY) on-board the European Space Agency’s (ESA) Environmental Satellite (ENVISAT) and GOSAT. They presented long-term consistency between SCIAMACHY, GOSAT and ground based Total Carbon Column Observing Network (TCCON) data.
This paper describes the inter-comparison of both spectral radiance and retrieved XCO2 with the two independent spectrometers aboard the GOSAT and OCO-2 satellites within temporally coincident and spatially collocated points using the same XCO2 retrieval algorithm. The latter part of Section 1 shows instrument specifications and observation methods of GOSAT and OCO-2, and the results of the pre-launch cross-calibration. Section 2 gives a brief summary of the GOSAT and OCO-2 spectral radiance and retrieved XCO2 products, and the selection methodology used in this inter-comparison. Section 3 presents the spectral radiance comparison, and Section 4 describes the retrieved XCO2 comparison together with retrieved parameters with the same algorithm. The comparison results are discussed in Section 5.

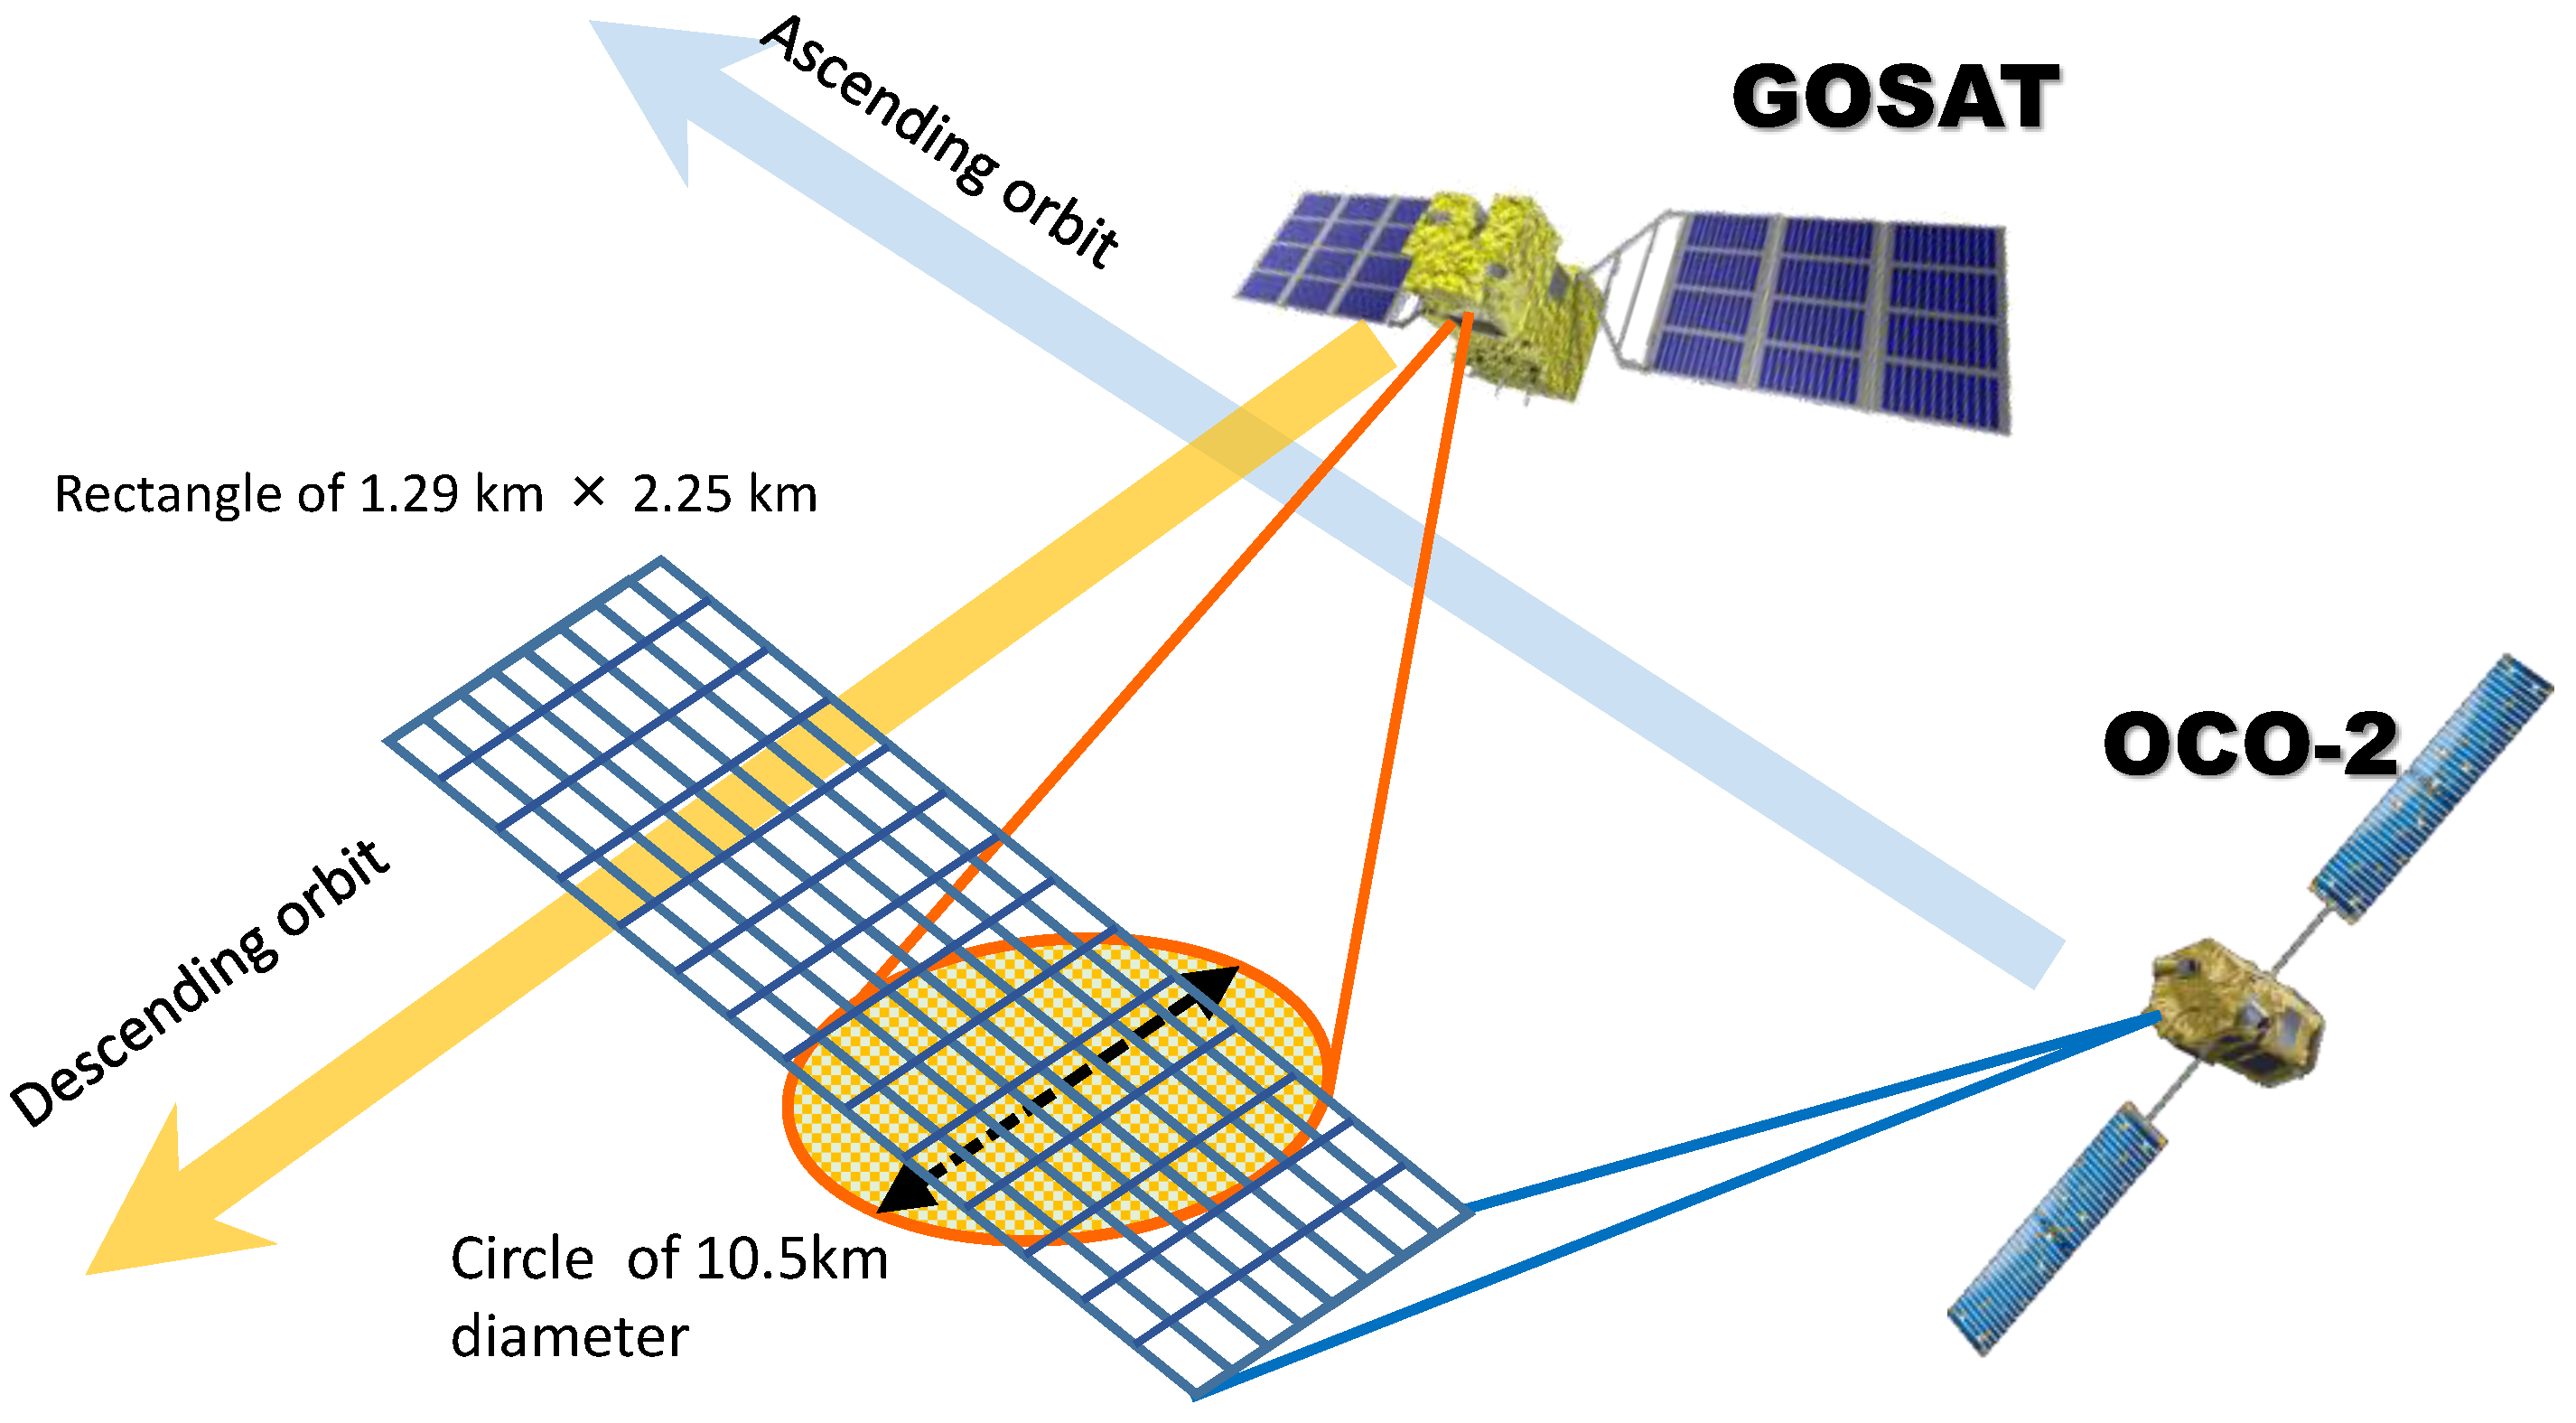
1.2. Outline of Instrument Specifications and Observation Methods

Table 1 shows the type of spectrometer, spectral range, sampling interval and full-width-at-half-maximum (FWHM) of GOSAT and OCO-2 [8,9]. GOSAT was launched into a 666 km orbit with a ground track repeat cycle of three days. The GOSAT Thermal and Near infrared Sensor for carbon Observation Fourier-Transform Spectrometer (TANSO-FTS) observes solar radiation reflected by the Earth’s surface and atmosphere, and thermal infrared radiation (TIR) emitted from the surface and the atmosphere. It has three narrow bands: Band 1 at 0.76 µm, Band 2 at 1.60 µm and Band 3 at 2.06 µm, and one wide TIR band spanning 5.5–14.3 µm. The Michelson interferometer modulates and divides the scene flux into three bands with two linear polarizations (P and S) and into the TIR band, and acquires interferograms every 4 s. The spectral sampling interval is 0.2 cm−1, which is determined by a maximum optical path difference of 2.5 cm. The TANSO-FTS instantaneous field of view (IFOV) is 15.8 mrad, which corresponds to about a 10.5 km diameter footprint on the ground at nadir observation. A two-axis pointing mechanism directs the IFOV in the cross-track (CT: ±35 degrees) and the along track (AT: ±20 degrees) directions. The footprint of the single point FTS observation can be monitored by a two-dimensional (1280 by 1024 pixel) CMOS (Complementary Metal Oxide Semiconductor Image Sensor) camera (CAM) which is aligned with the FTS optical axis. Each TANSO-FTS scene has at least one camera image with better than 100 m spatial resolution. Cloud-contaminated footprints can be filtered out using data from this camera.
The OCO-2 satellite was launched into the 705 km Afternoon Constellation (A-train). The orbit is near-polar, sun-synchronous and a 16-day ground track repeat cycle. OCO-2 uses a common telescope that illuminates three long-slit imaging grating spectrometers, with diffraction gratings to disperse the incoming light. The three grating spectrometers cover the O2A band at 0.765 µm, a weak CO2 band at 1.60 µm and a strong CO2 band at 2.06 µm. These three channels are designated ABO2, WCO2, and SCO2, respectively. The footprint dimensions are determined by the cross-track IFOV of 0.1 degree and the integration time (0.333 s). For nadir observations, this yields eight cross-track footprints along the spectrometer slit with dimensions of <1.29 km by 2.25 km [10].

1.3. Objectives of On-Orbit Cross-Comparisons

Following the OCO-2 launch, two independent measurements of CO2 are now being made from space. GOSAT TANSO-FTS provides wide spectral coverage, extending from 0.75 to 14.3 µm, and a simple, uniform instrument line-shape function that can be monitored on-orbit. It has an agile pointing system, but routinely collects data in isolated footprints with no spatial context. The OCO-2 imaging-grating spectrometers can measure CO2 with higher spatial resolution in contiguous samples, providing spatial context, but the instrument has more numerous and complicated instrument line-shape functions that are more challenging to calibrate [11,12]. In spite of these differences, CO2 can be derived from the measurements collected by both instruments using a common retrieval algorithm.
During the integration and final prelaunch test, GOSAT and OCO-2 were independently calibrated with individual radiometric calibration standards. We have confirmed that GOSAT and OCO-2 calibration standards agree well, within 5%, in two prelaunch cross-calibration campaigns at TKSC (Tsukuba Space Center) and JPL (Jet Propulsion Laboratory) [13]. After launch, GOSAT and OCO-2 were radiometrically calibrated using their own onboard calibration sources. The stability of these on-board calibration systems has been validated by annual vicarious calibration campaigns. As reported in Kuze et al. [14], the vicarious calibration error is less than 7%. However, the dynamic range of the input light level using these solar diffuser and bright desert sources is limited. Furthermore, the geometries of the onboard and vicarious calibrations are always the same, as the satellites pass over the calibration targets in predetermined orbits, and the campaigns are always conducted near the summer solstice.
While these calibration campaigns provide a valuable check on instrument performance, other calibration activities are needed with different input levels and geometries to confirm the spectral radiance linearity through the wide dynamic range that spans both dark ocean and bright desert. It is also useful to compare XCO2 estimates retrieved from the two instruments since this provides an end-to-end validation of the instrument and data processing systems. In this paper, we describe an effective method for performing an on-orbit inter-comparison of spectral radiances from September 2014 to March 2017 and XCO2 estimates from September 2014 to May 2016, which are currently available. This dataset includes a large number of scene match-ups compiled over more than two years of simultaneous GOSAT and OCO-2 operations.

2. Analytical Method

2.1. Spectral Radiance Data and Retrieved XCO2 for the Inter-Comparison

We use the most recent version of the GOSAT Level 1B V201.201 (L1B V201) spectral radiance. The GOSAT Level 1A (L1A V201.201: raw interferogram) and the Level 1B V201 products are processed by JAXA and distributed from the National Institute for Environmental Studies (NIES) GOSAT Data Archive Service (GDAS) [15]. The XCO2 from both GOSAT and OCO-2 products, as well as the OCO-2 Level 1B radiances, are downloadable from the NASA Goddard Earth Sciences Data and Information Services Center (GES DISC) [16].
The GOSAT L1B V201 product contains the raw and best estimated radiance spectra, observation geometry, and related parameters [17]. It also contains the context camera image within the FTS field-of-view, used to identify the pointing location and check cloud contamination. Spectral radiances are created by taking an inverse Fourier transform of the raw interferograms, using the radiance conversion table prepared from the GOSAT pre-launch calibration data shown in Kuze et al. [8], and radiance degradation factors (RDF) described in detail in Kuze et al. [1,17]. The RDFs are estimated from annul vicarious calibration campaigns in Railroad Valley (RRV), Nevada, USA by the joint GOSAT and OCO-2 teams, and monthly on-orbit solar diffuser calibrations. GOSAT sensitivity experienced rapid degradation in the first two years on-orbit, especially at shorter wavelengths [18]. The degradation has slowed in subsequent years. Kuze et al. [14], also note that the degradation rate is slightly higher for the S polarization than for the P polarization in Band 1, because of the FTS beam splitter efficiency. There are two remaining issues concerning the L1B V201 product. The first is spectral response within the short-wavelength infrared (SWIR) bands. Spectral radiances from the GOSAT integrating sphere were calibrated with 5 nm steps for Band 1, and 20 nm steps for Bands 2 and 3. This was done under ambient laboratory conditions. The coarse spectral step, combined with absorption by oxygen (O2), CO2, and water vapor (H2O) during the prelaunch calibration, creates an uncertainty on the sphere spectral output, and thus the preflight radiometric calibration. The other issue is Band 1 nonlinearity. GOSAT has both high and medium gain signal chains for the detectors, which can be selected by command to provide the dynamic range needed to measure both dark ocean and bright desert scenes. The FTS Band 1, with its high spectral resolution, needs a large gain, potentially resulting in nonlinearity [17,19]. Correction parameters, selected by minimizing out-of-band artifacts, still have not fully corrected this issue. In this paper, we filtered out the bright Band 1 scenes that were collected in high gain when the spectral radiance was greater than 140 W/m2/µm/str at a baseline wavelength of 0.759 µm. About 22% of matched-up spectral radiance data were screened out with this criterion. For the XCO2 comparison, we filtered out scenes with retrieved albedo greater than 0.3 in GOSAT Band 1, as they might contain imperfect nonlinearity correction. About 30% of matched-up XCO2 data were screened out with this criterion. Crisp et al. [10] and Eldering et al. [20] describe the OCO-2 instrument performance and radiometrically calibrated products and retrieved XCO2. In general, the OCO-2 instrument performed as expected during its first 18 months. Its absolute radiometric uncertainty was about 4% at 18 months into the mission. Since launch, the OCO-2 instrument has proven to have two degradation contributions: “fast” and “slow” degradation. The former is thought to be due to ice crystals forming on the ABO2 focal plane assembly (FPA) that degrade the performance of its anti-reflection coating. The FPA has periodically been warmed, and thus decontaminated, as shown in Crisp et al. [10]. The slow degradation term is caused by a reduction in the throughput of the solar diffuser, perhaps associated with degradation of the gold coatings on its active inner surfaces. The current V7 L1B product (OCO2_L1B_Science.7) has an ABO2 band-degradation correction term applied, without discrimination between the fast and slow degradation. In total, the radiometric performance is determined using the solar diffuser, lamp diffuser, the Moon, and well-characterized vicarious calibration targets. OCO-2 produces two sets of L1B and Level2 (L2) products. The “forward” products (OCO2_L1B_Science.7) are distributed within one week of acquisition. This product uses calibration information based on extrapolations of calibration data that were collected in the recent past. The “retrospective” products, (OCO2_L1B_Science.7r) use interpolated calibration data, which is expected to be more reliable, and is distributed approximately one month later after data acquisition.
Basically, the retrieval algorithms of GOSAT and OCO-2 used here are the same [21,22,23,24]. XCO2 is retrieved with the full physics algorithm. GOSAT retrievals used Build 7.3 (V7.3) of the Atmospheric CO2 Observations from Space (ACOS) algorithm while OCO-2 retrievals used Version 7 of the OCO-2 retrieval algorithm. The solution of inverse method is the state vector with maximum a posteriori probability, given the measurement. The inverse method employs the Levenberg-Marquardt modification of the Gauss-Newton method. The solar spectrum used in the forward model is comprised of a pseudo-transmittance spectrum, which was developed by G. Toon and colleagues [25], and a solar continuum spectrum, which is based on polynomial fits to the low-resolution extra-terrestrial solar spectrum acquired by the Solar Spectrum (SOLSPEC) instrument [26]. The algorithm adopted absorption coefficient (ABSCO) tables, which consider line mixing, speed dependent line shape, and collision induced absorption (CIA). The CO2 a priori profiles are from a climatology based on the GLOBALVIEW dataset at the time of year and the latitude of the site. A single CO2 covariance matrix is used for all retrievals. This covariance has been constructed by assuming a root-mean-square variability of XCO2 of 12 ppm. For the XCO2 comparison analysis, we mainly use the GOSAT/ACOS_L2_Lite_FP.7.3 (GOSAT/ACOS Lite V7.3) product and GOSAT/ACOS_L2S.7.3 (GOSAT/ACOS Full V7.3) product from GOSAT L1B V201 and OCO2_L2_Lite_FP.7r (OCO-2 Lite V7r) product from OCO2_L1B_Science.7r. Both GOSAT/ACOS V7.3 and OCO-2 V7 algorithms were developed by the JPL/OCO-2 team, and are identical except for use of specific instrument-dependent parameters and individual bias correction. This allows the comparison of GOSAT/ACOS and OCO-2 data without consideration of algorithm differences. The retrieved state vector contains the CO2 mole fraction at 20 layers, surface pressure, aerosol profile, two aerosol types, cloud water, cloud ice, albedo, albedo slope and wind speed over ocean. The details are described in Table 2 of O’Dell et al. [21]. Because the O2 dry air mole fraction is well known, measurements from the GOSAT Band 1 and OCO-2 ABO2 band are used to retrieve surface pressure, Psurf, and to estimate light attenuation and scattering by thin clouds and aerosols. The GOSAT/ACOS product was validated with TCCON [27,28,29]. GOSAT has taken measurements in the vicinity of all TCCON sites with high gain, except for Armstrong Flight Research Center (AFRC) TCCON, where medium gain is used. We used the GOSAT/ACOS V7.3 Full Product without bias correction and with the recommended filtering, only for medium gain data, and GOSAT/ACOS V7.3 Lite, with bias correction and recommended filtering for high gain data. The XCO2 bias level of the medium gain data has not been evaluated yet. The OCO-2 Lite product corrected three key types of biases: footprint-dependent biases, spurious correlations of the retrieved XCO2 with other retrieval parameters, and a multiplicative factor to scale to the World Meteorological Organization (WMO) trace-gas standard scale. Wunch et al. [30] show the comparison results between the OCO2_L2_Lite_FP.7r and TCCON data. This product agrees well when aggregating soundings coincident with TCCON data, with global median differences less than 0.4 ppm and RMS differences less than 1.5 ppm.

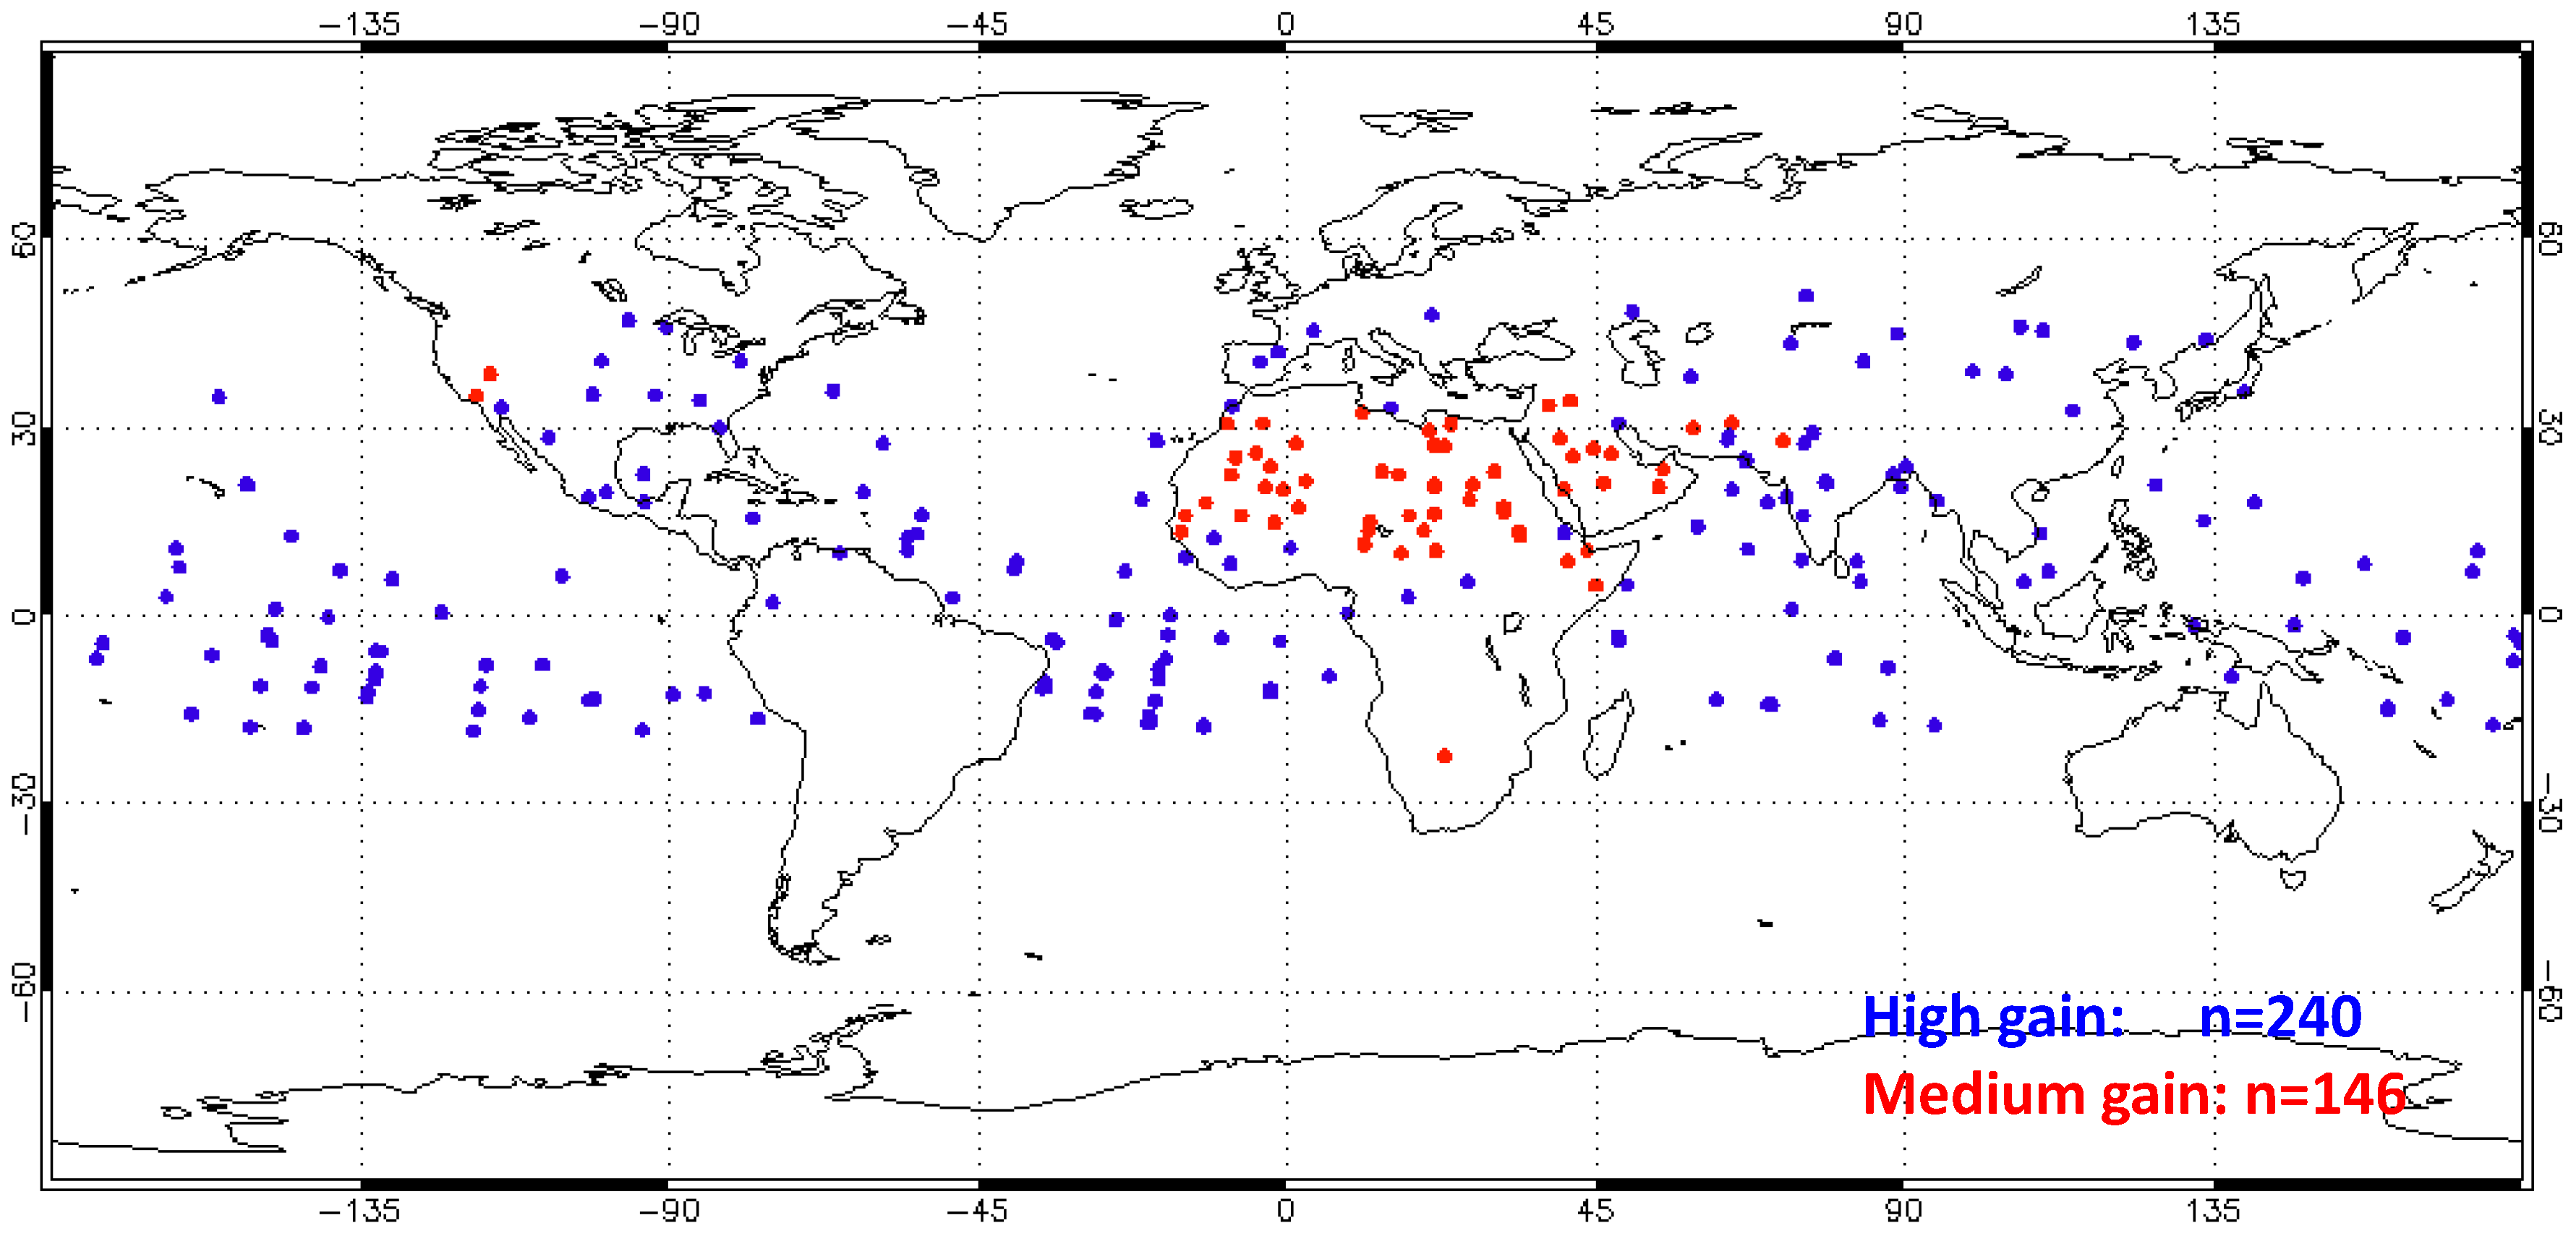
2.2. Selection of Geometrically Matched-Up Data

The GOSAT spacecraft is in a sun-synchronous orbit at an altitude of 666 km, with a descending node local time between 12:46 p.m. and 12:55 p.m., and a revisit cycle of three days. OCO-2 flies at the head of the 705 km A-train, in an ascending orbit with a nodal crossing time between 13:35:30 and 13:36:20. Table 2 summarizes geometric information of GOSAT and OCO-2. The local time of the descending GOSAT sun-synchronous orbit and the ascending OCO-2 differ by between about 40 and 50 min.
Since August 2010, the GOSAT 2-axis pointing mechanism has executed a nominal 3-point cross-track scan mode over land. GOSAT uses a target mode to acquire observations over large emission sources and calibration/validation sites, and uses a glint mode over ocean. OCO-2 has four Earth-surface observation modes: Nadir, Glint, Transition and Target. For nominal science operations, the spacecraft points the instrument at the local nadir, which provides more useful, cloud-free samples over land, or near the glint spot, which provides much higher signal-to-noise ratios (SNR) over the ocean. In addition to the nadir and glint observing modes, OCO-2 has a target mode that points the instrument’s boresight at a specified surface target, such as a vicarious calibration site or TCCON validation site to acquire thousands of observations near that target as the spacecraft flies over. When OCO-2 is near the southern terminator, where the slit is oriented almost perpendicular to the ground track, each of the eight cross-track footprints has dimensions of 1.29 km × 2.25 km across a 10.6 km swath at nadir. However, the orientation of the slit rotates along the orbit track to maintain a constant orientation with respect to the principal plane, defined by the sun, the surface footprint, and the spacecraft aperture, such that the swath has a minimum width <0.3 km about 30 degrees north of the sub-solar latitude.
The much larger GOSAT circular footprint covers dozens of OCO-2 footprints, as illustrated in Figure 1. A single GOSAT pixel includes a maximum of 40 OCO-2 pixels with nadir or glint mode, and more than one thousand in target mode. These OCO-2 pixels were averaged to yield one OCO-2 sample. We compared spectral radiances and retrieved XCO2 for a single GOSAT footprint with this averaged OCO-2 sample as one match-up point. The broad spectral coverage of the GOSAT TANSO-FTS covers all the OCO-2 narrow spectral bands. GOSAT has slightly better spectral resolution as shown in Table 1, but OCO-2 has higher spectral contrast, such that both GOSAT and OCO-2 have enough spectral resolution to distinguish each absorption line from the continuum.
In this work, we compared spectral radiance and retrieved XCO2 at temporally coincident and spatially collocated points. We selected ±1 h match-up time and made a correction for solar zenith angle (SZA) differences by dividing by cosine of the local solar zenith angle.

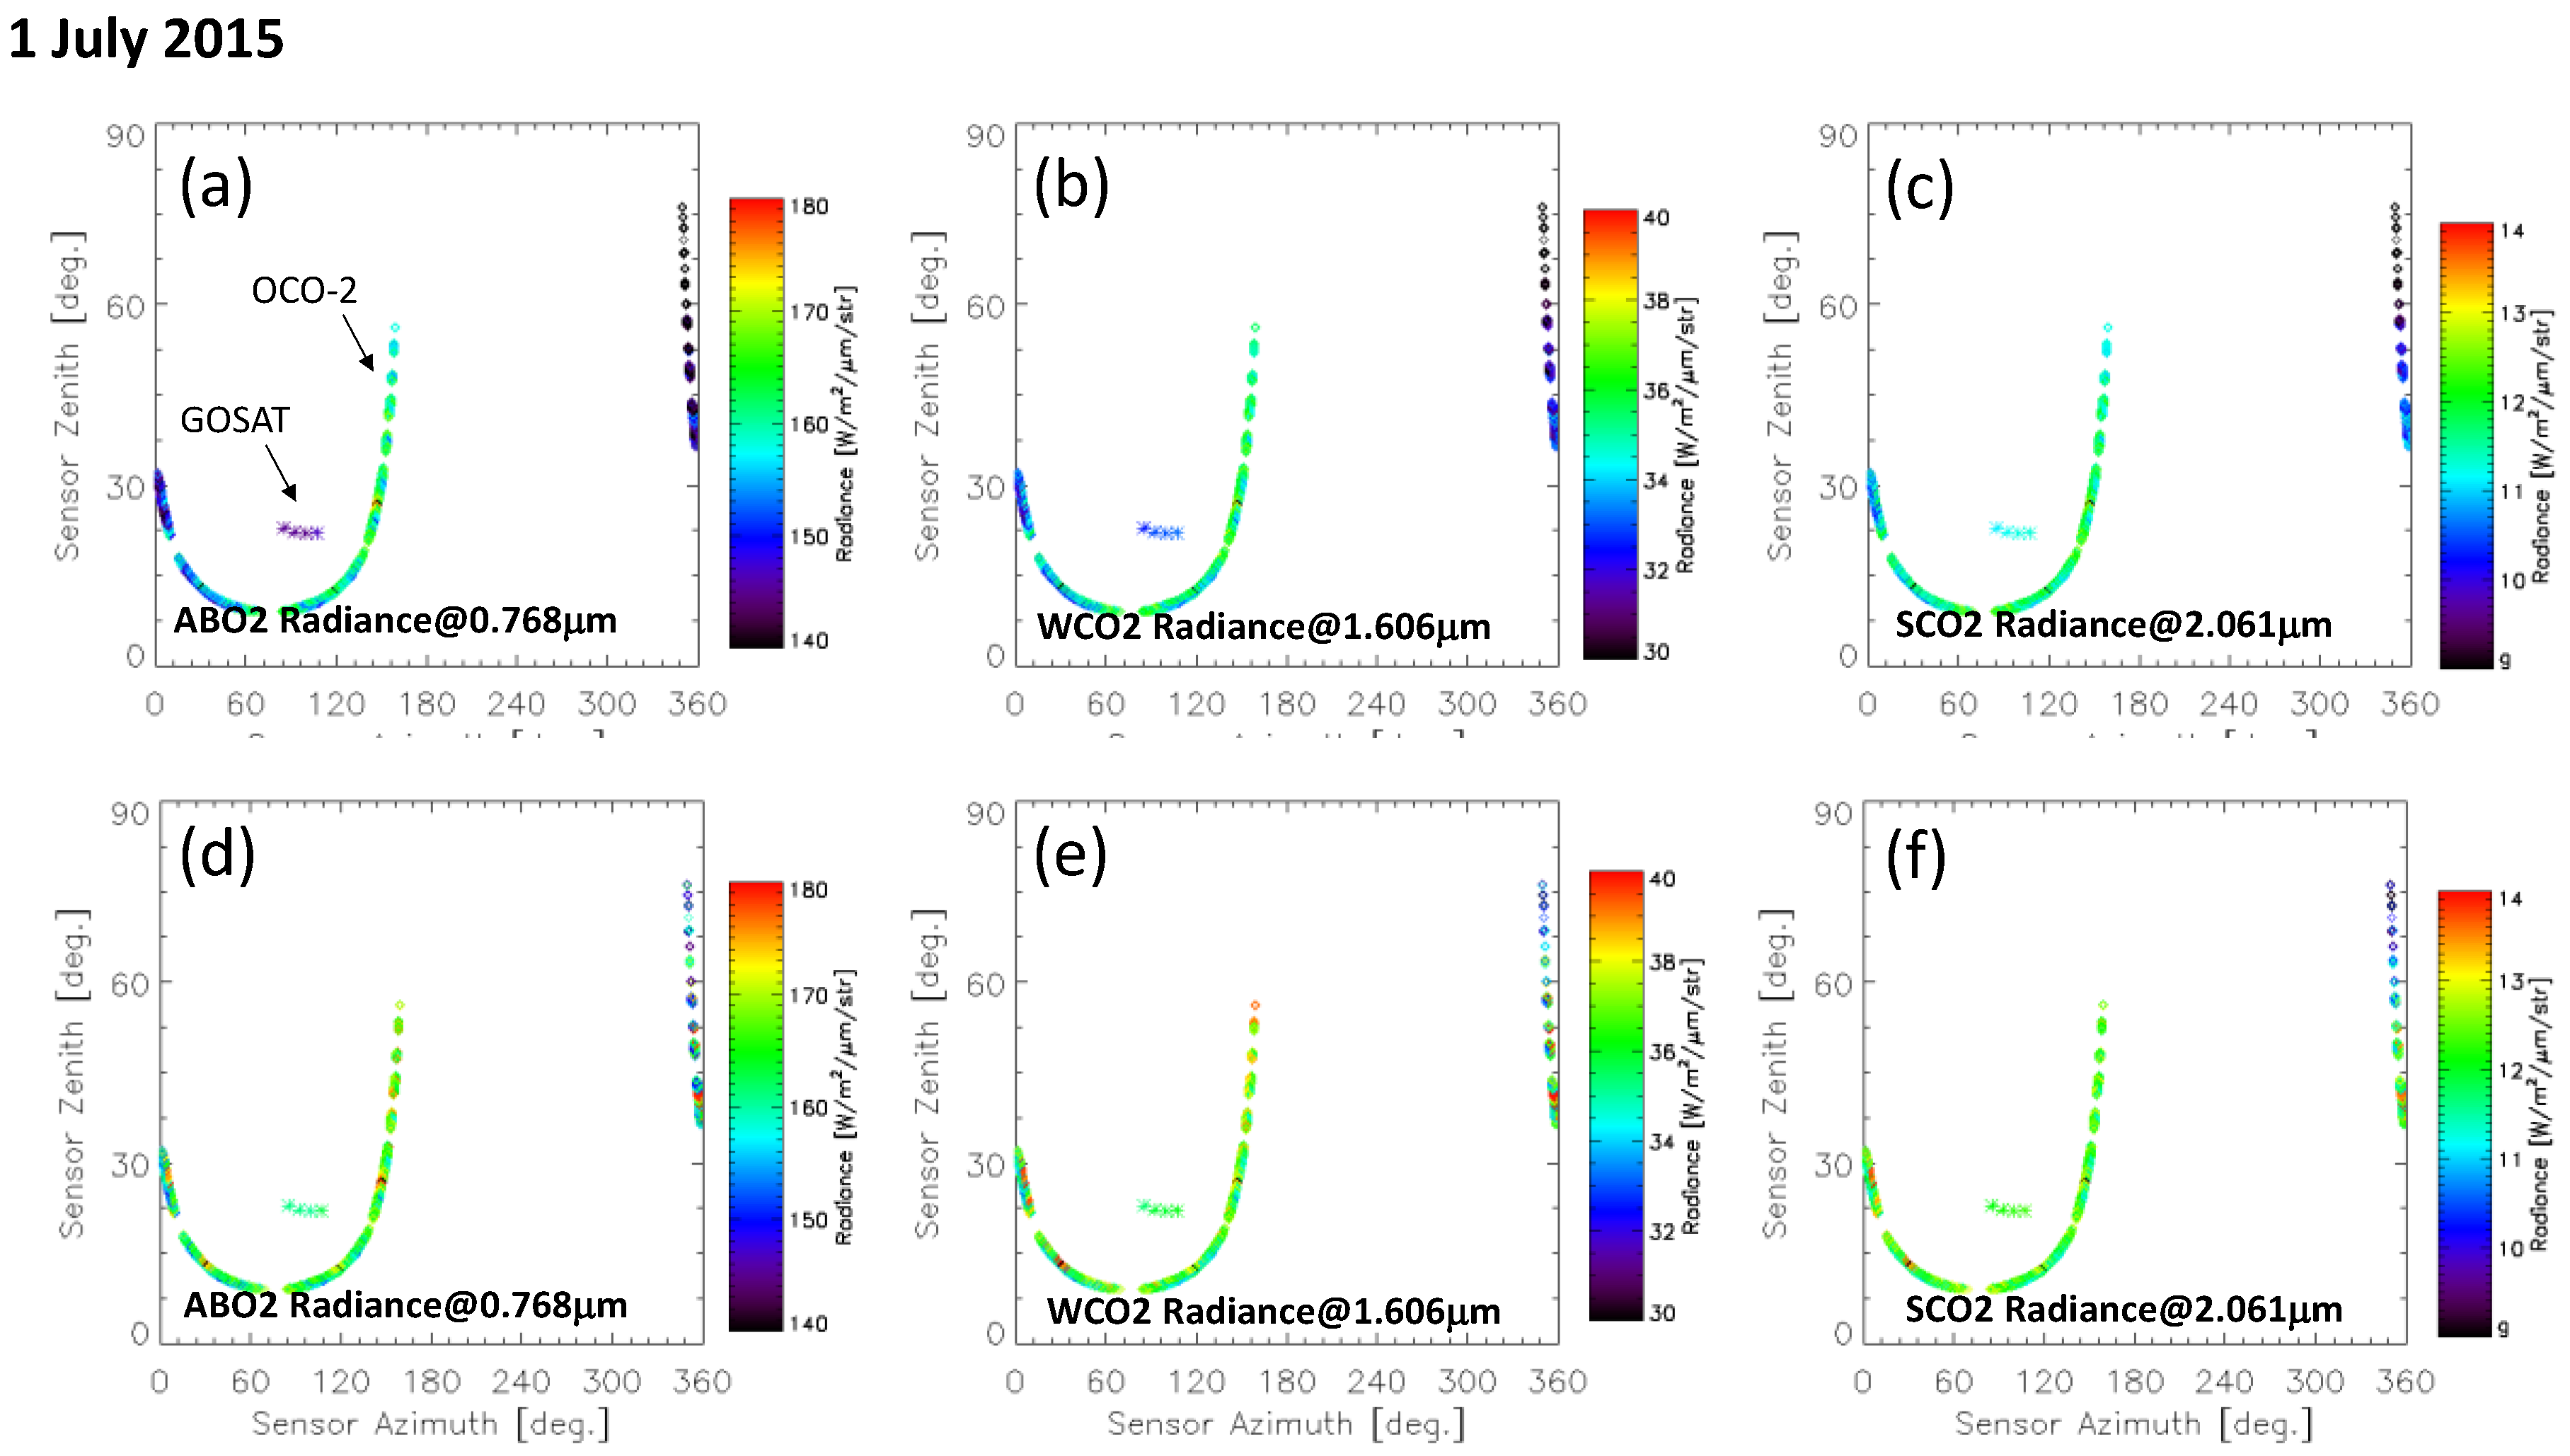
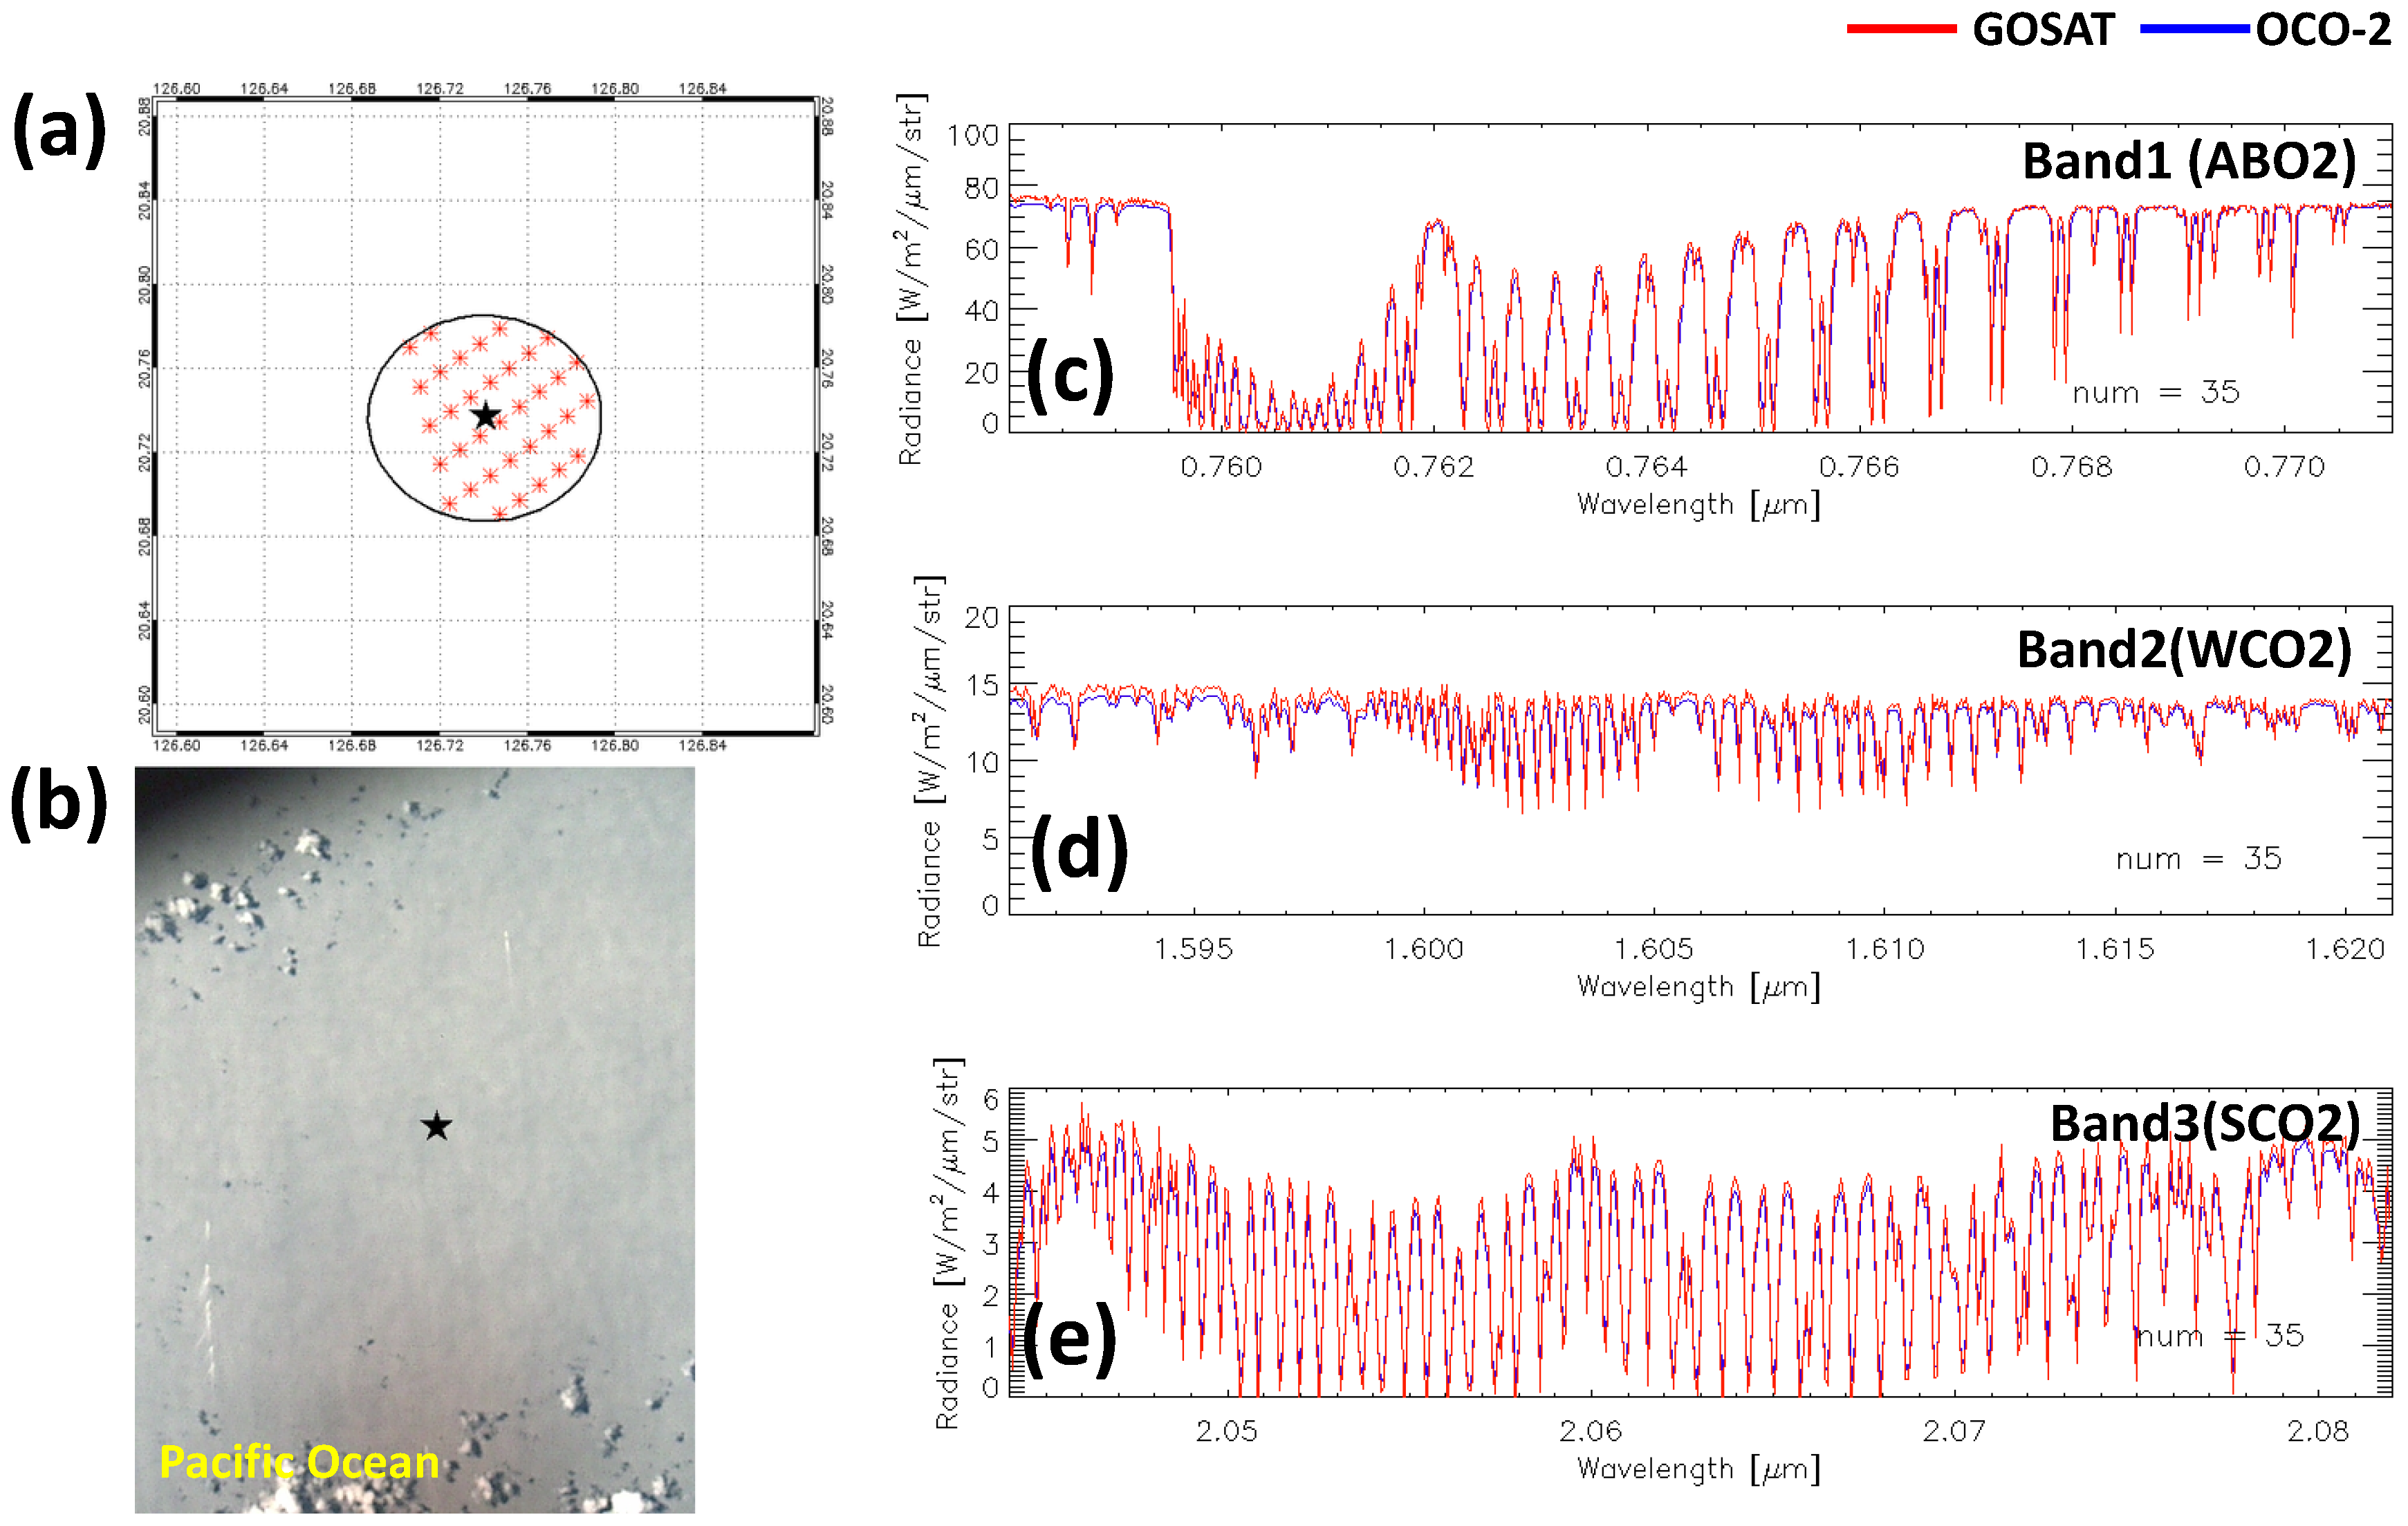
3. Spectral Radiance Inter-Comparison

3.1. Methodology of Spectral Radiance Inter-Comparison

For statistical and trend analysis, we used the global dataset from September 2014 to March 2017. We selected five continuum points in each band as illustrated in Figure 2, each with very weak spectral absorption. We filtered out cloud contamination, ice or snow-covered surfaces, as well as the inhomogeneity of surface reflectance and terrain by visually checking all the CAM images for color contrast. This step was necessary because the cloud filter using the ABO2 band sometimes passes partially cloud contaminated scenes [31]. Besides, ice and snow surfaces have high reflectance in the ABO2 band but are almost black in the WCO2 and SCO2 bands.
As noted above, GOSAT and OCO-2 have different observation geometries and most of the land surface scenes are not perfect Lambertian reflectors. We corrected off-nadir viewing over land to nadir viewing spectra using the 1 km resolution MODerate resolution Imaging Spectroradiometer (MODIS) BRDF-Albedo Model Parameters product (MCD43B1) [32]. This product is made using cloud-free data measured by MODIS instruments on the Terra and Aqua satellites over 16-day periods [33]. The BRDF product applied MODIS Band 2 (841–876 nm), Band 6 (1628–1652 nm) and Band 7 (2105–2155 nm) to ABO2, WCO2 and SCO2 bands, respectively. Figure 3 shows BRDF plots of the ABO2 band, WCO2 band and SCO2 band for a non-Lambertian desert surface. Using these BRDF parameters, we corrected to nadir equivalent spectral radiance. The BRDF correction was applied to OCO-2 footprints individually using the nearest neighbor pixel of MODIS BRDF product. The BRDF corrected OCO-2 radiance averaged within the GOSAT IFOV. For GOSAT, the MODIS BRDF products were averaged within the GOSAT IFOV and applied for the GOSAT radiance. The BRDF corrected spectral radiances of GOSAT and OCO-2 were calculated as follows,
L GOSAT _ nadir = i I F O V ( BRDF nadir ( i ) ) i I F O V ( BRDF offnadir ( i ) ) L GOSAT _ offnadir
L OCO 2 _ nadir = j I F O V ( ( BRDF nadir ( j ) ) ( BRDF offnadir ( j ) ) ) L OCO 2 _ offnadir ( j )
where LGOSAT_offnadir and LOCO-2_offnadir are the off-nadir spectral radiances of GOSAT and OCO-2, respectively. BRDFnadir and BRDFoffnadir are the nadir and off-nadir BRDF parameters calculated from the MODIS BRDF product. LGOSAT_nadir and LOCO-2_nadir are the corrected nadir equivalent spectral radiances. IFOV indicates summation within the GOSAT IFOV. The index i specifies the number of MODIS pixels within the GOSAT IFOV. The index j specifies the number of OCO-2 pixels within the GOSAT IFOV. Because of the cross-track viewing used for the GOSAT grid observations and nadir viewing for OCO-2, the BRDF difference can often exceed 10%. The correction errors remain due to the imperfect MODIS model. Details will be discussed in Section 5.1. We also adjusted the OCO-2 spectral dispersion to the GOSAT data by shifting and stretching the OCO-2 spectra.
GOSAT measures two linear polarizations (P and S) with perpendicular directions, whereas OCO-2 measures one linear polarization. GOSAT used the FTS technology with polarization sensitivity lower than grating spectrometers and most of the observed scenes are not polarized. We averaged GOSAT P and S polarization vectors to produce an approximation of the total radiance which should be equal to the total unpolarized radiance. The OCO-2 polarization direction is tilted by 30° from the principal plane of solar reflection. Generally, land surfaces are not highly polarized, and the ocean observation geometries of GOSAT and OCO-2 are similar, constrained by the change in the specular reflection point of the sun within the 1 h collocation window. Therefore, we assume that the polarization effect on the inter-comparison is small [34,35].

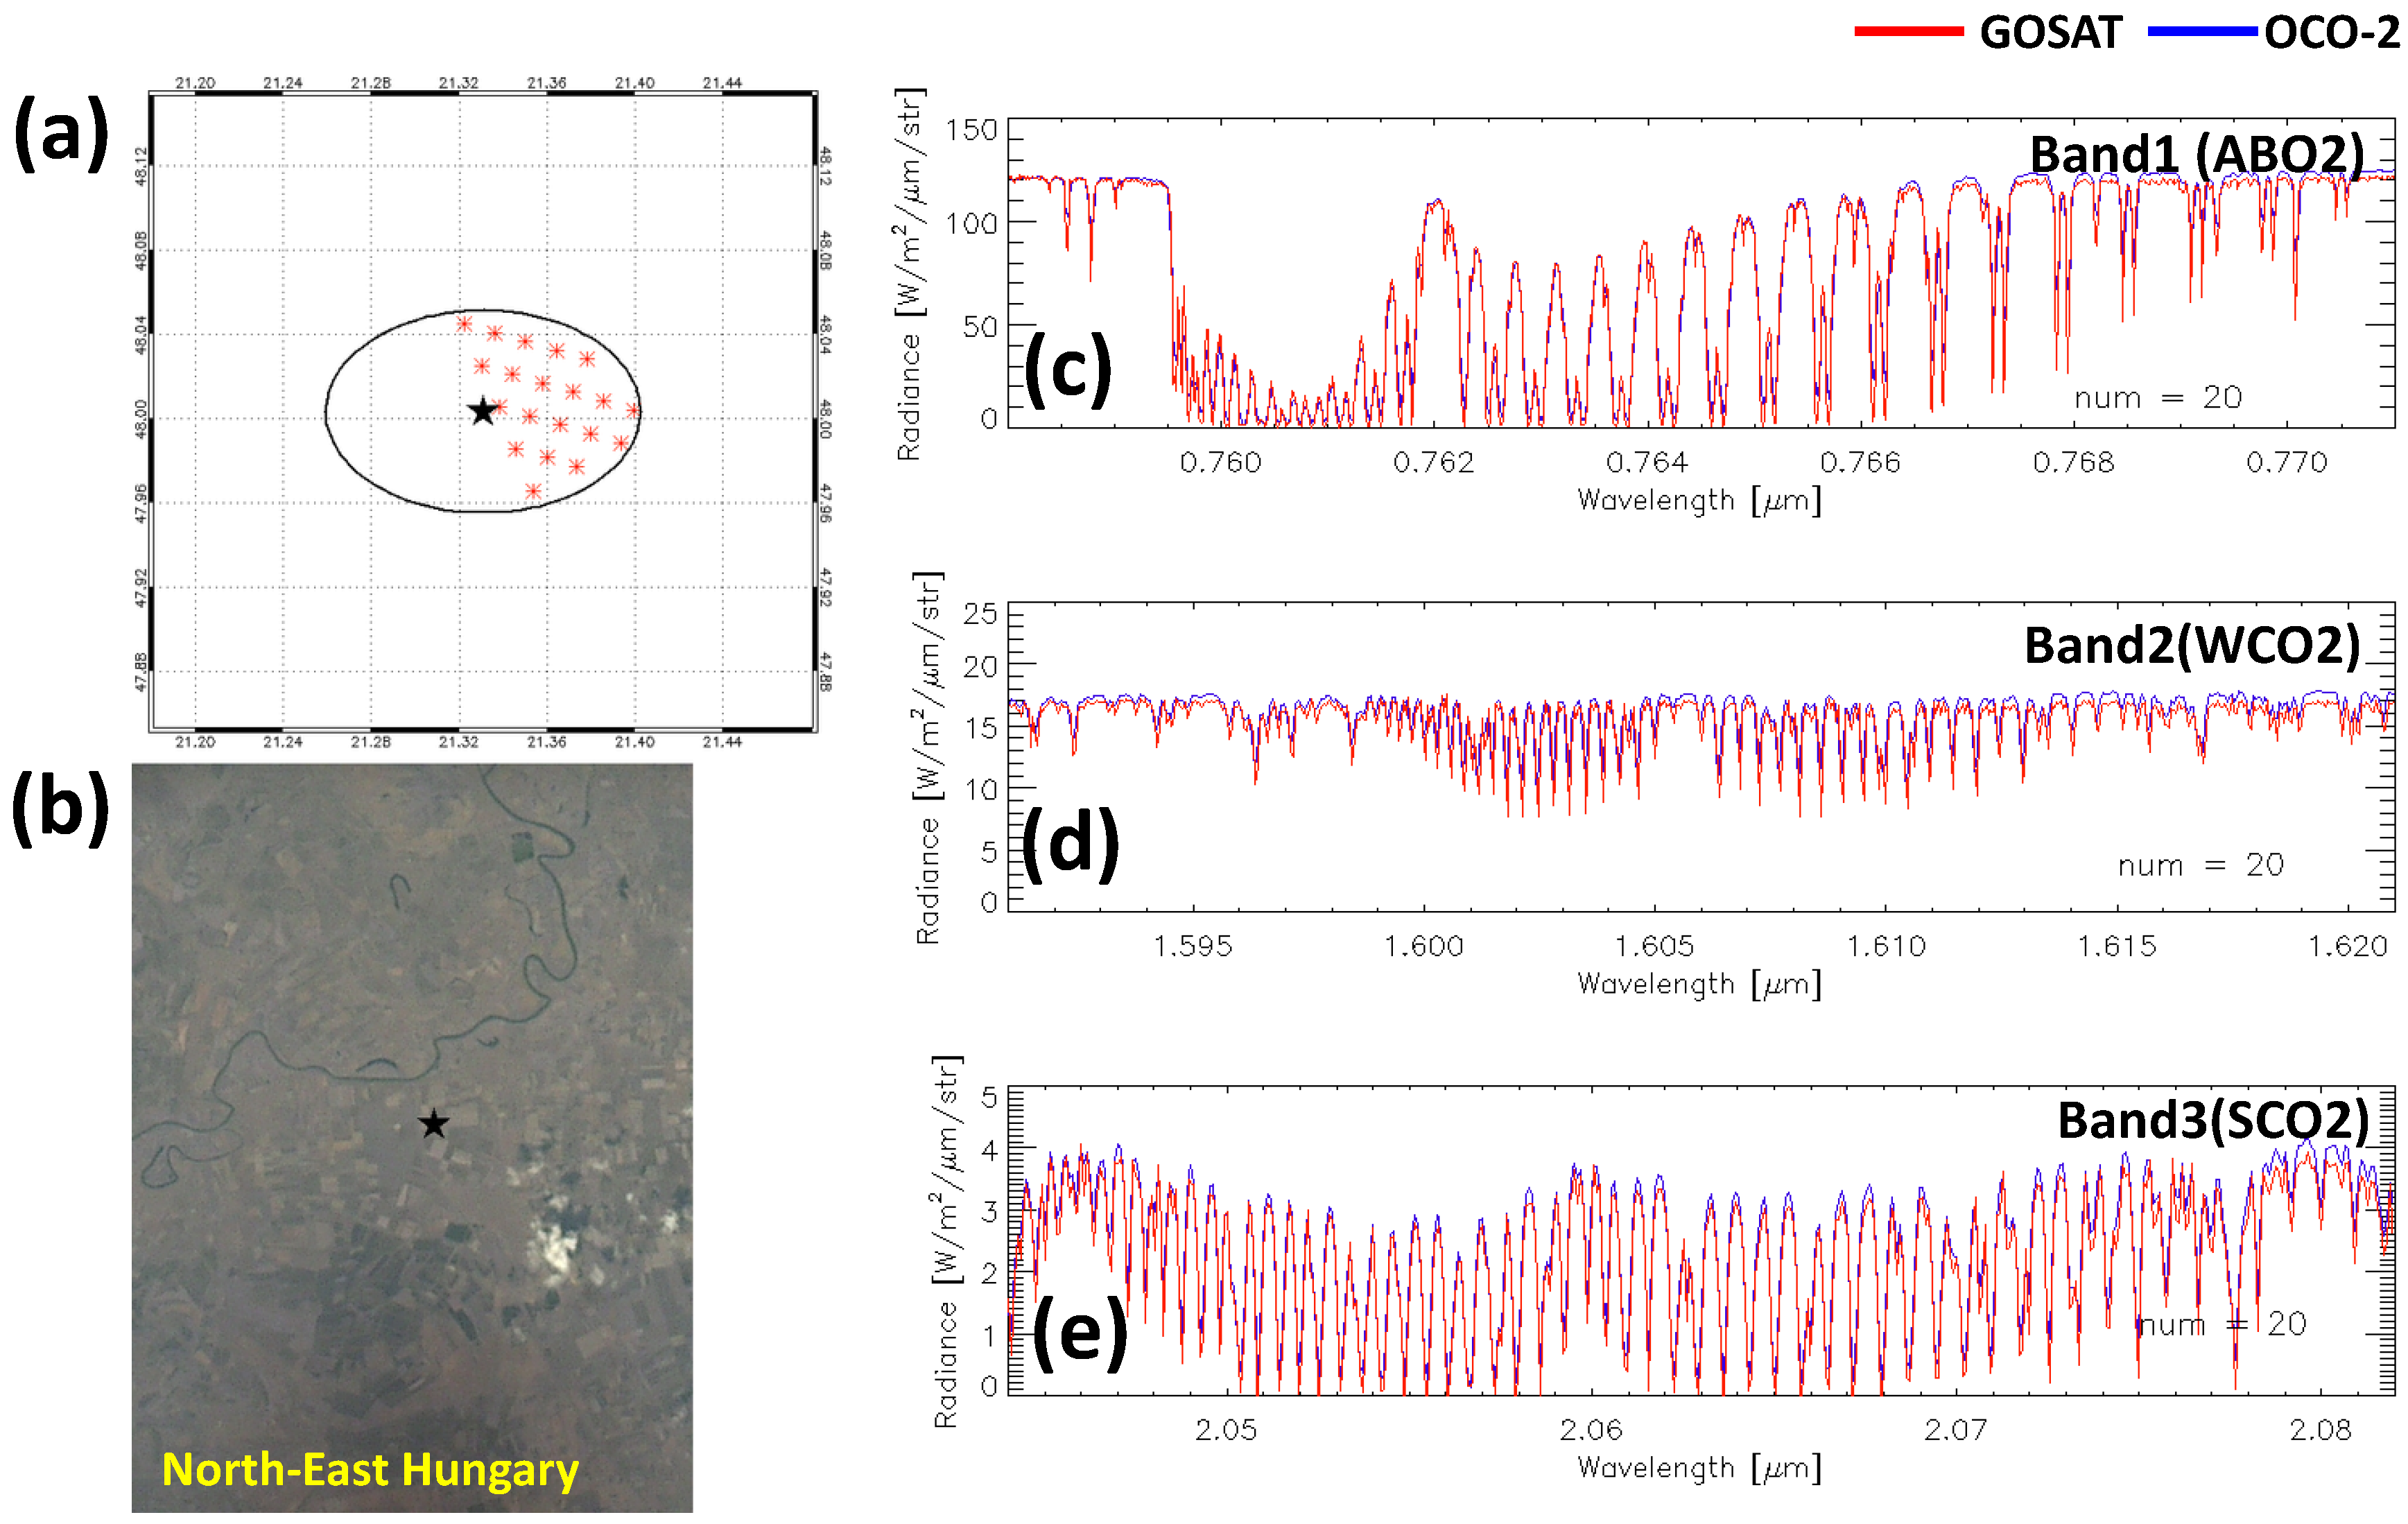
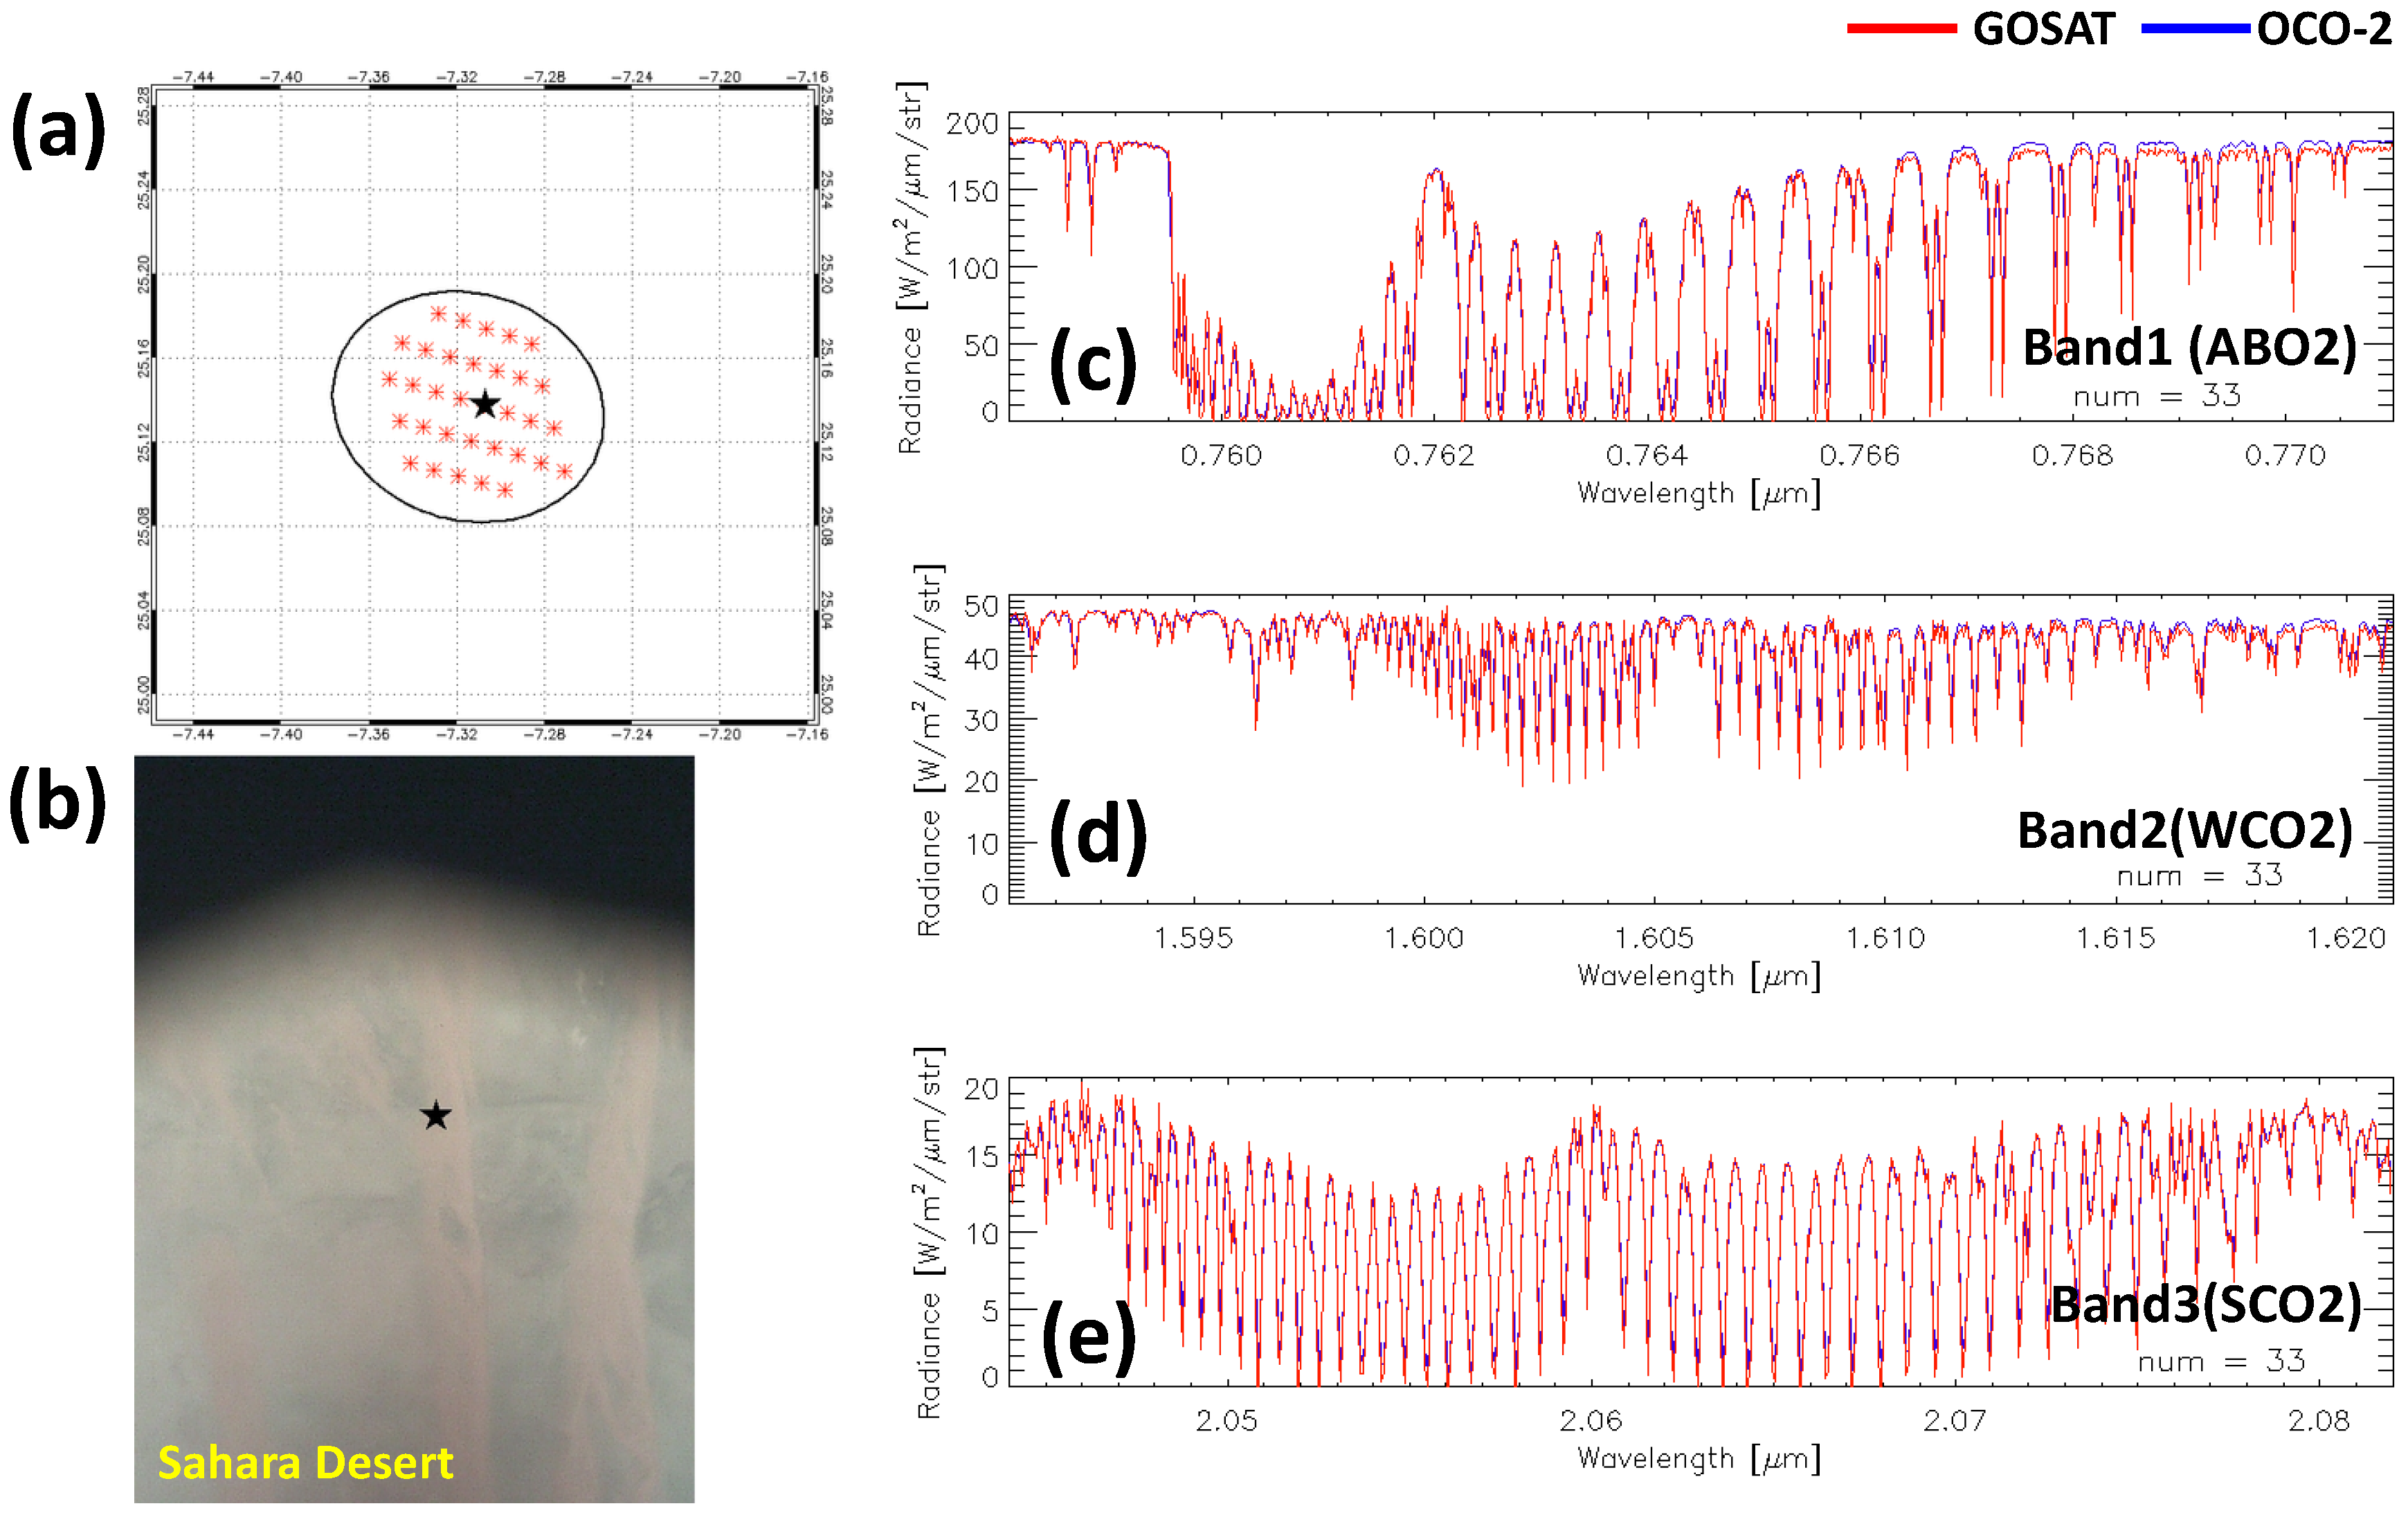
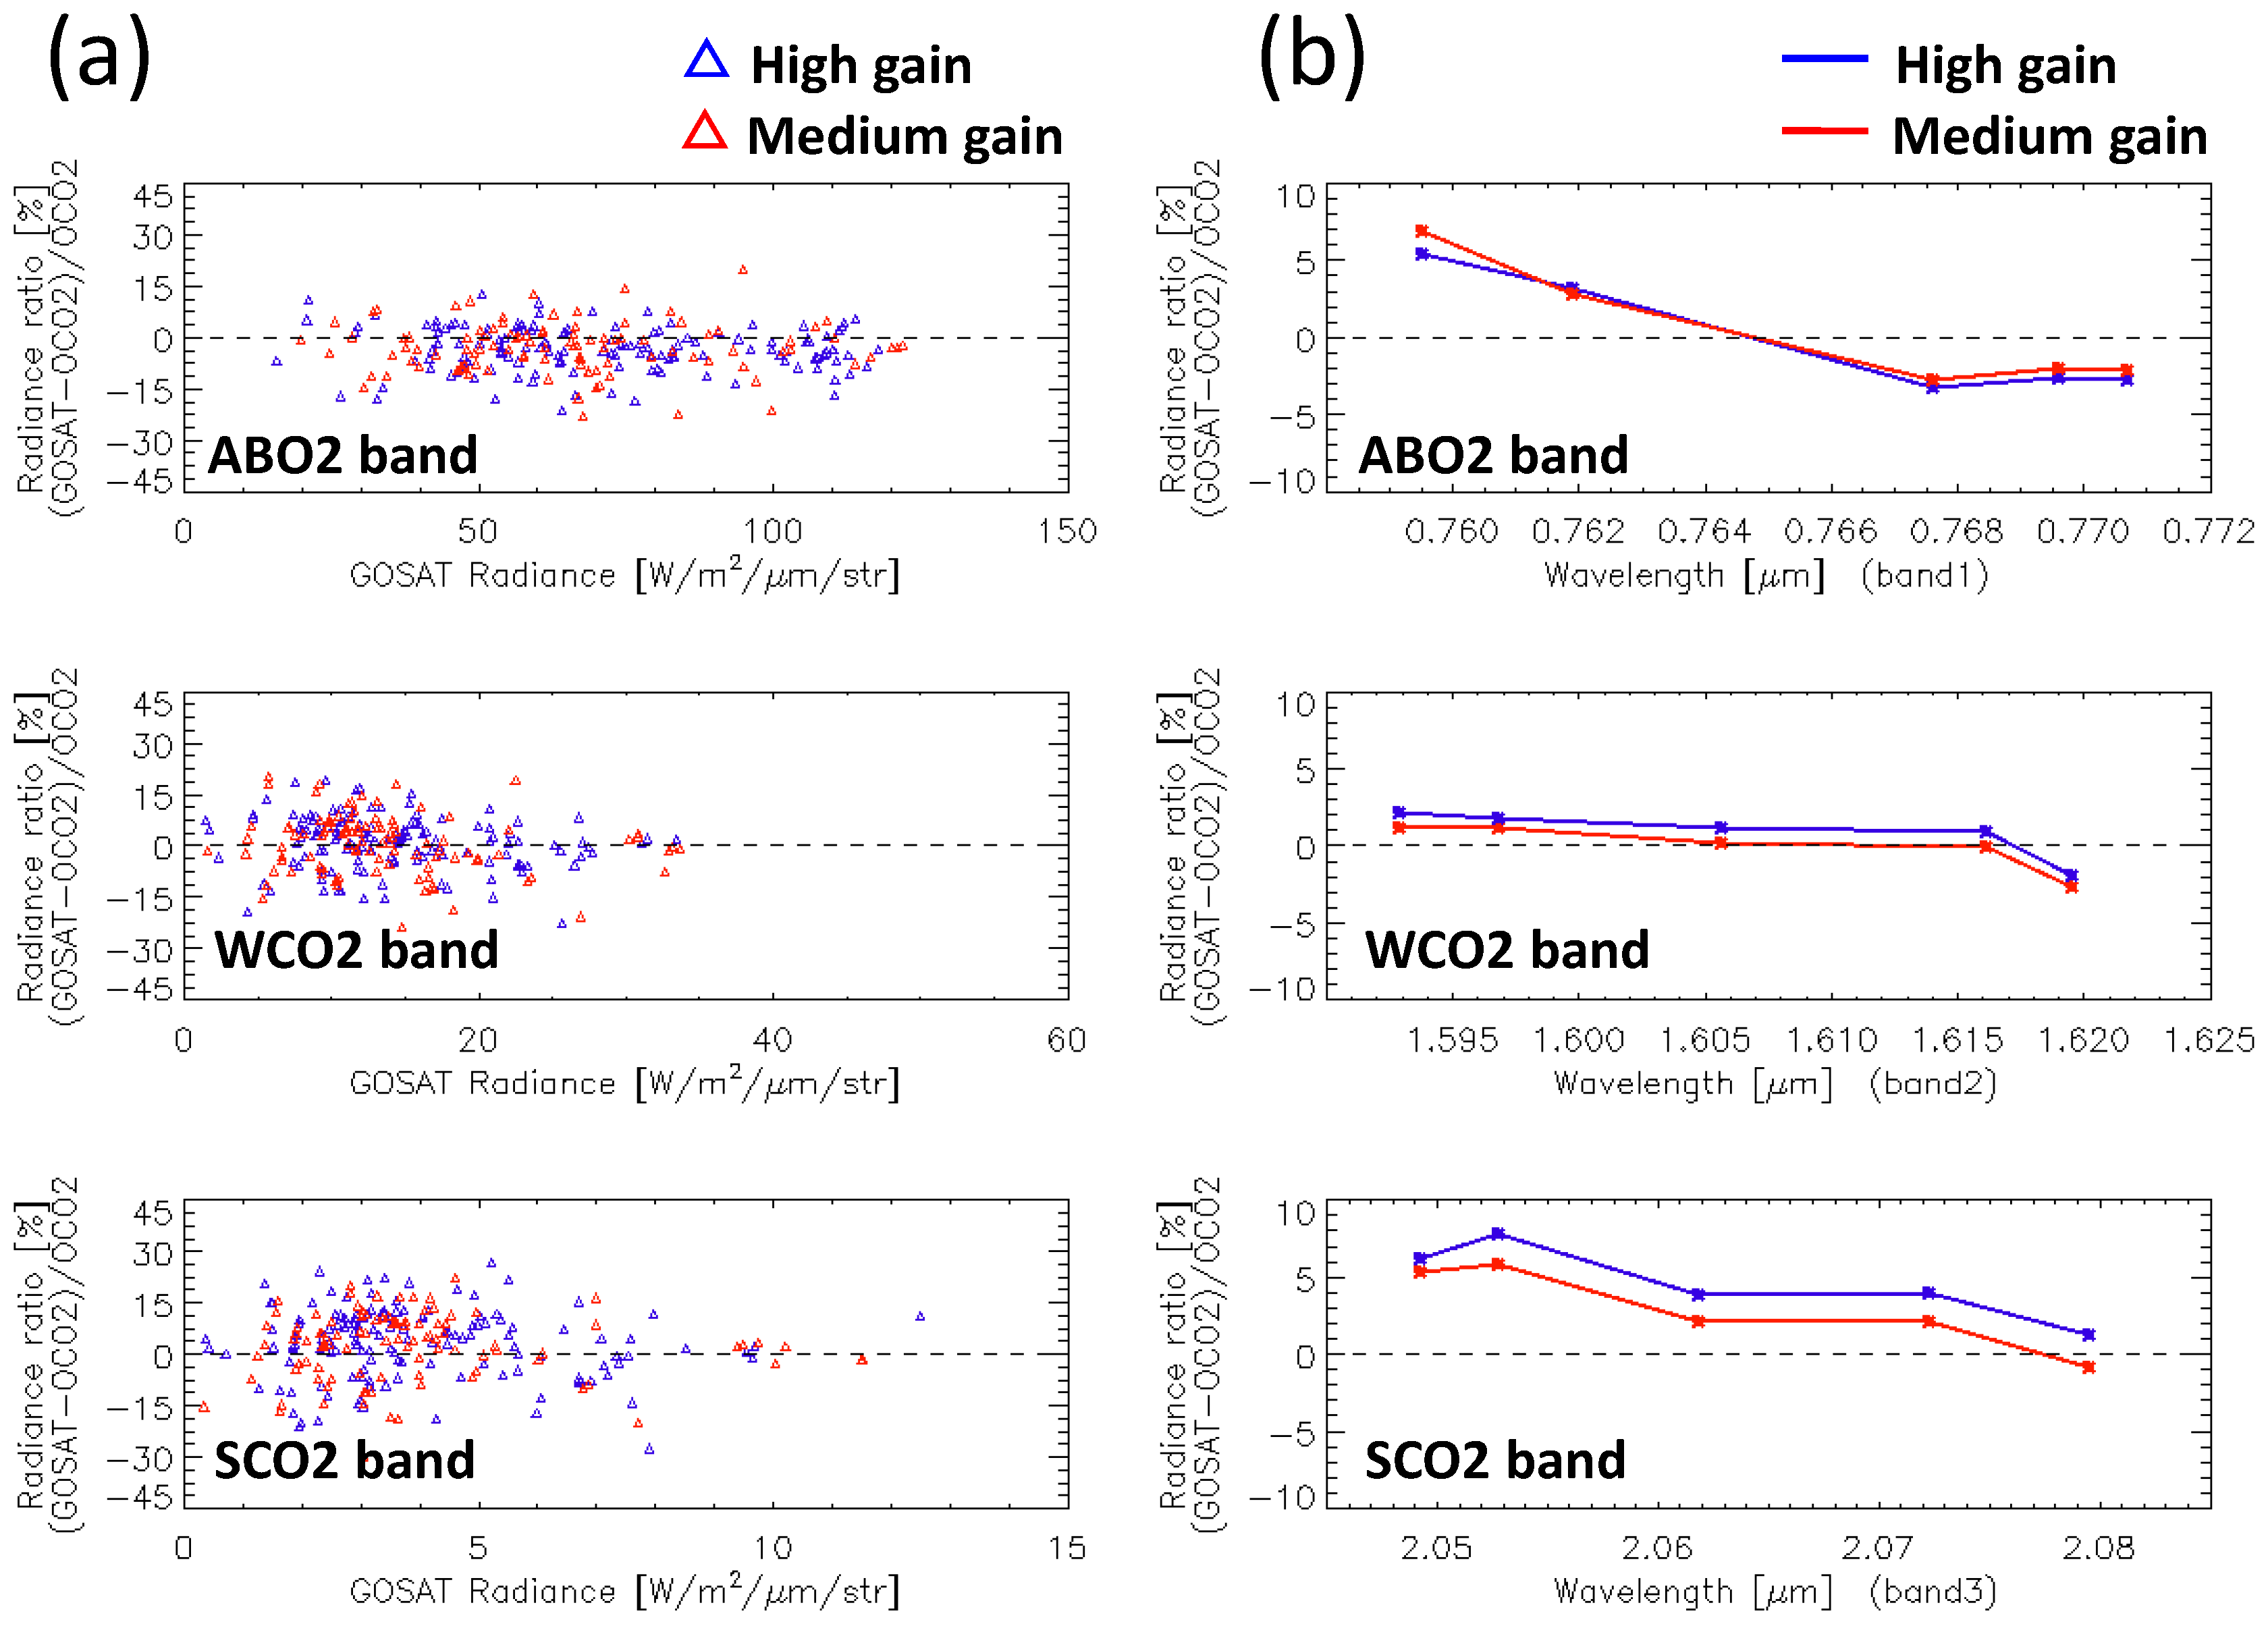
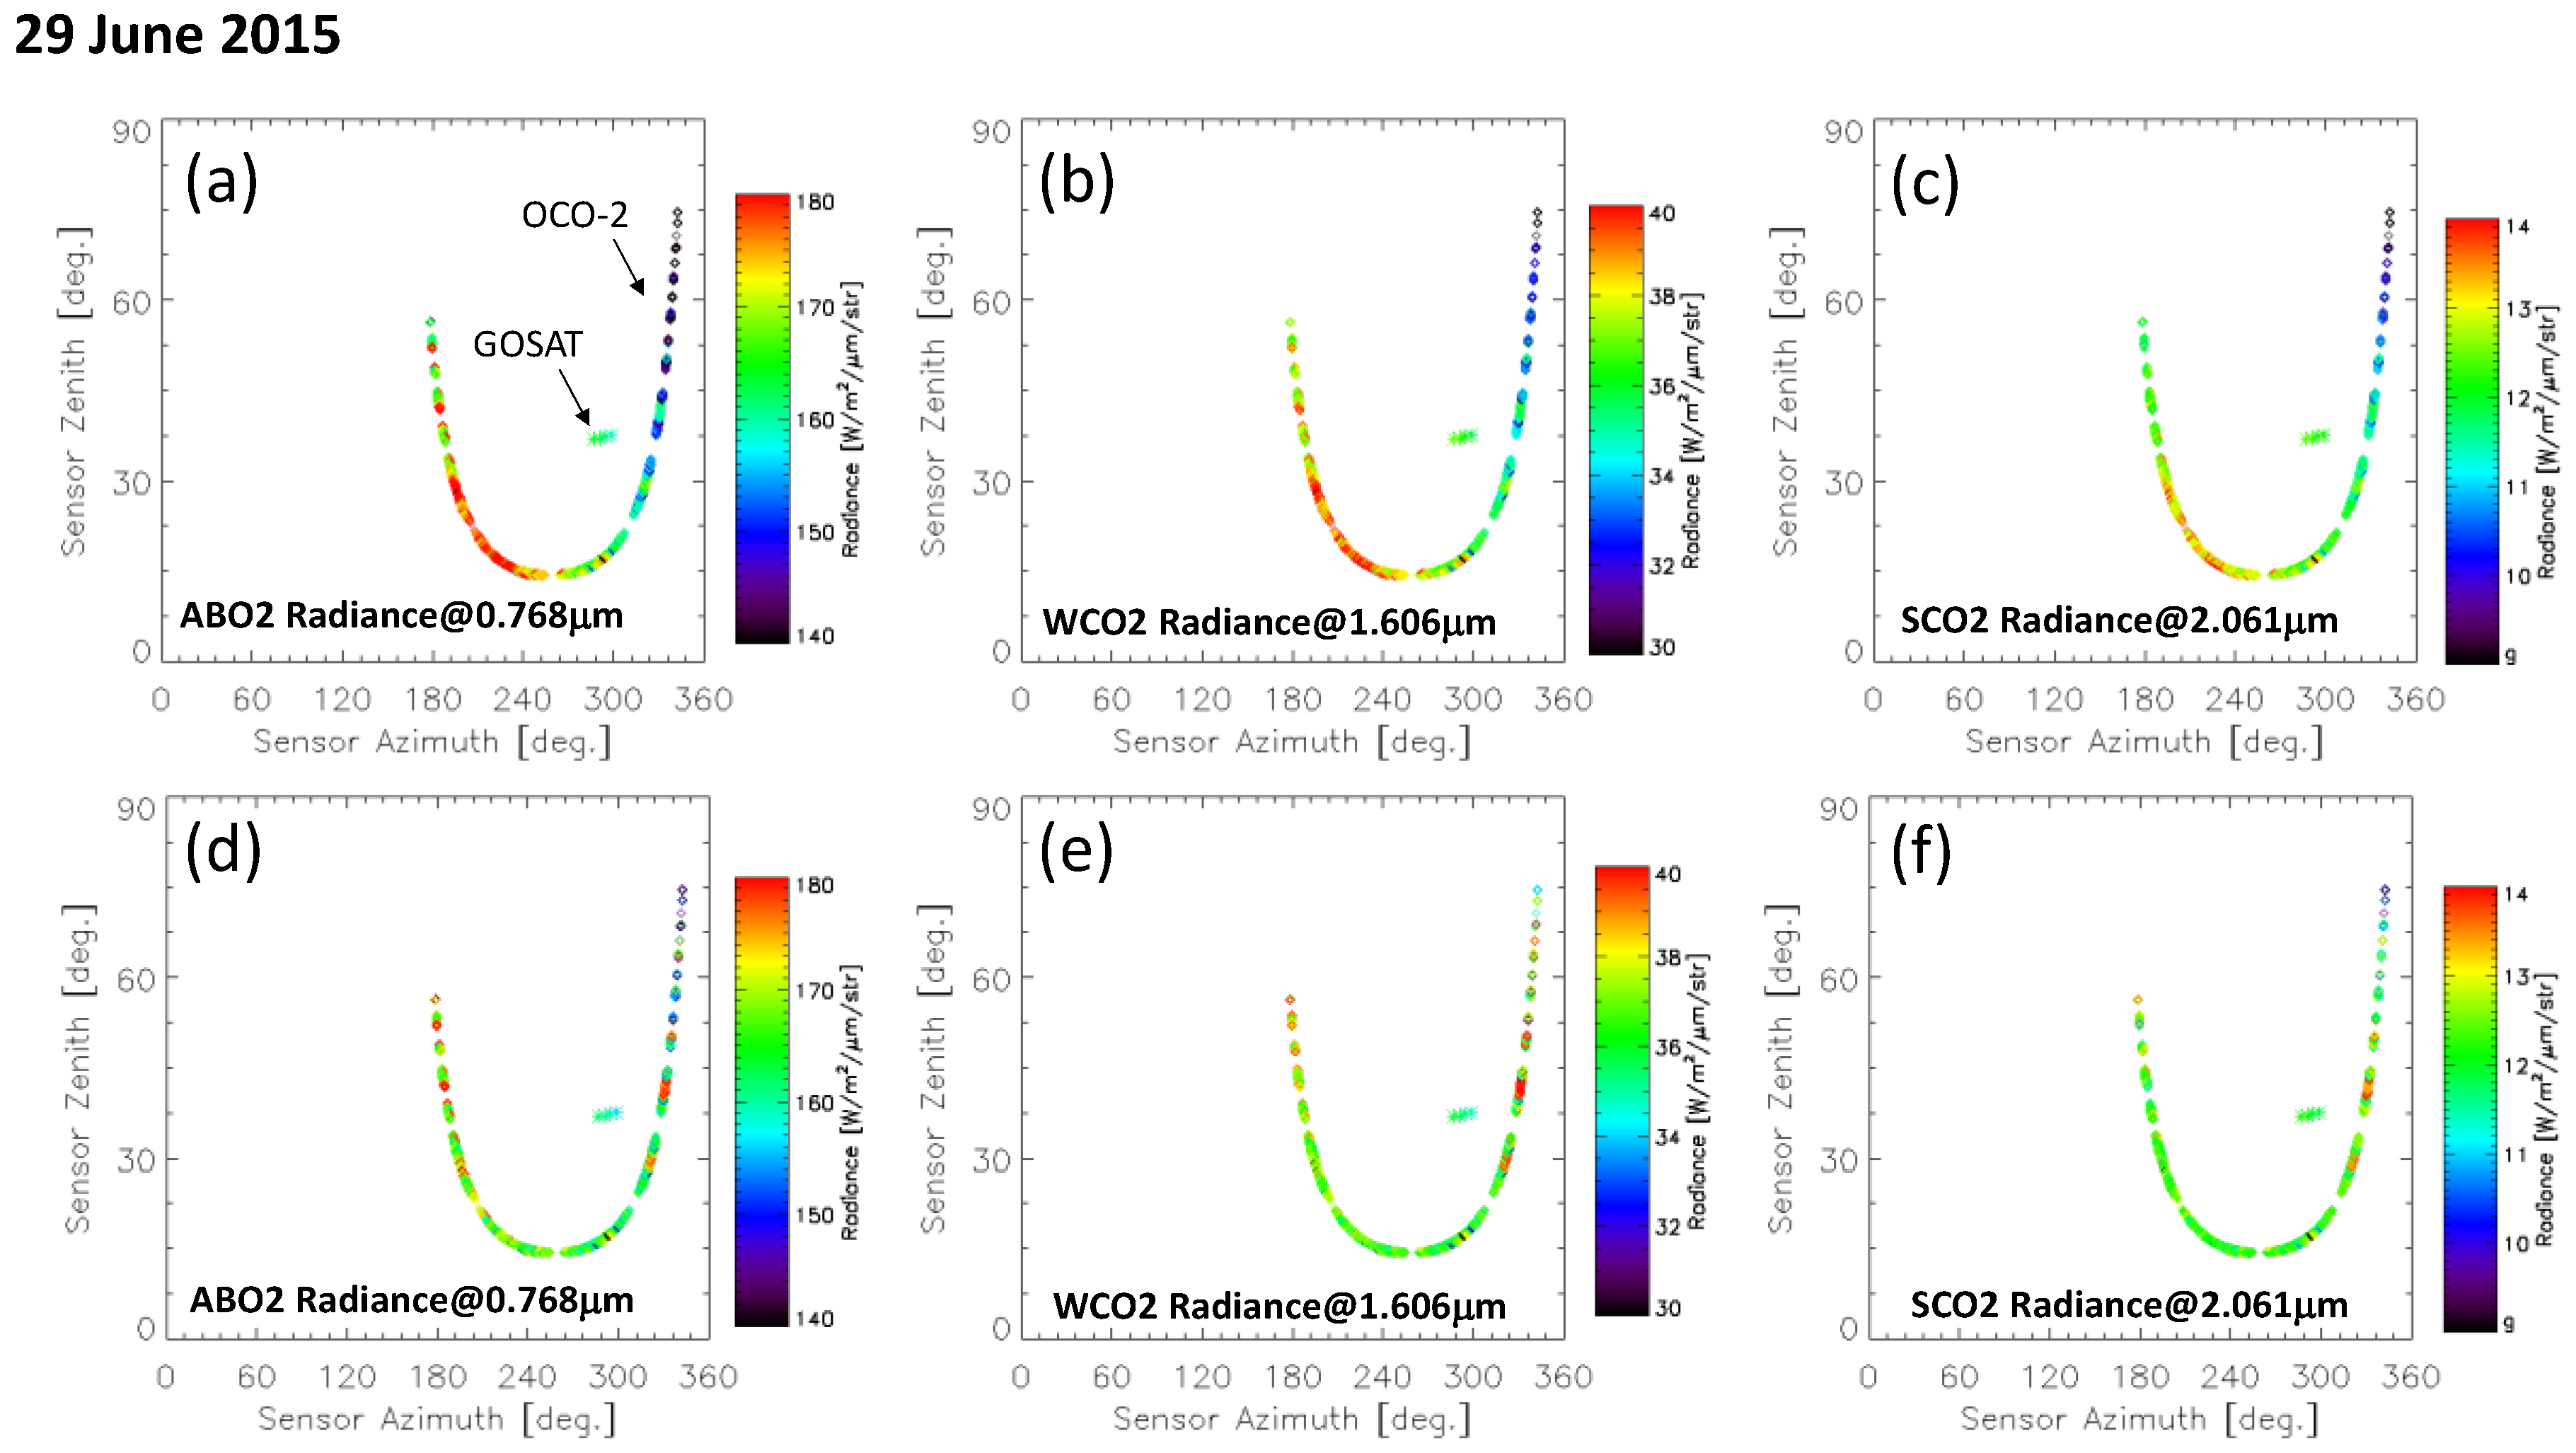
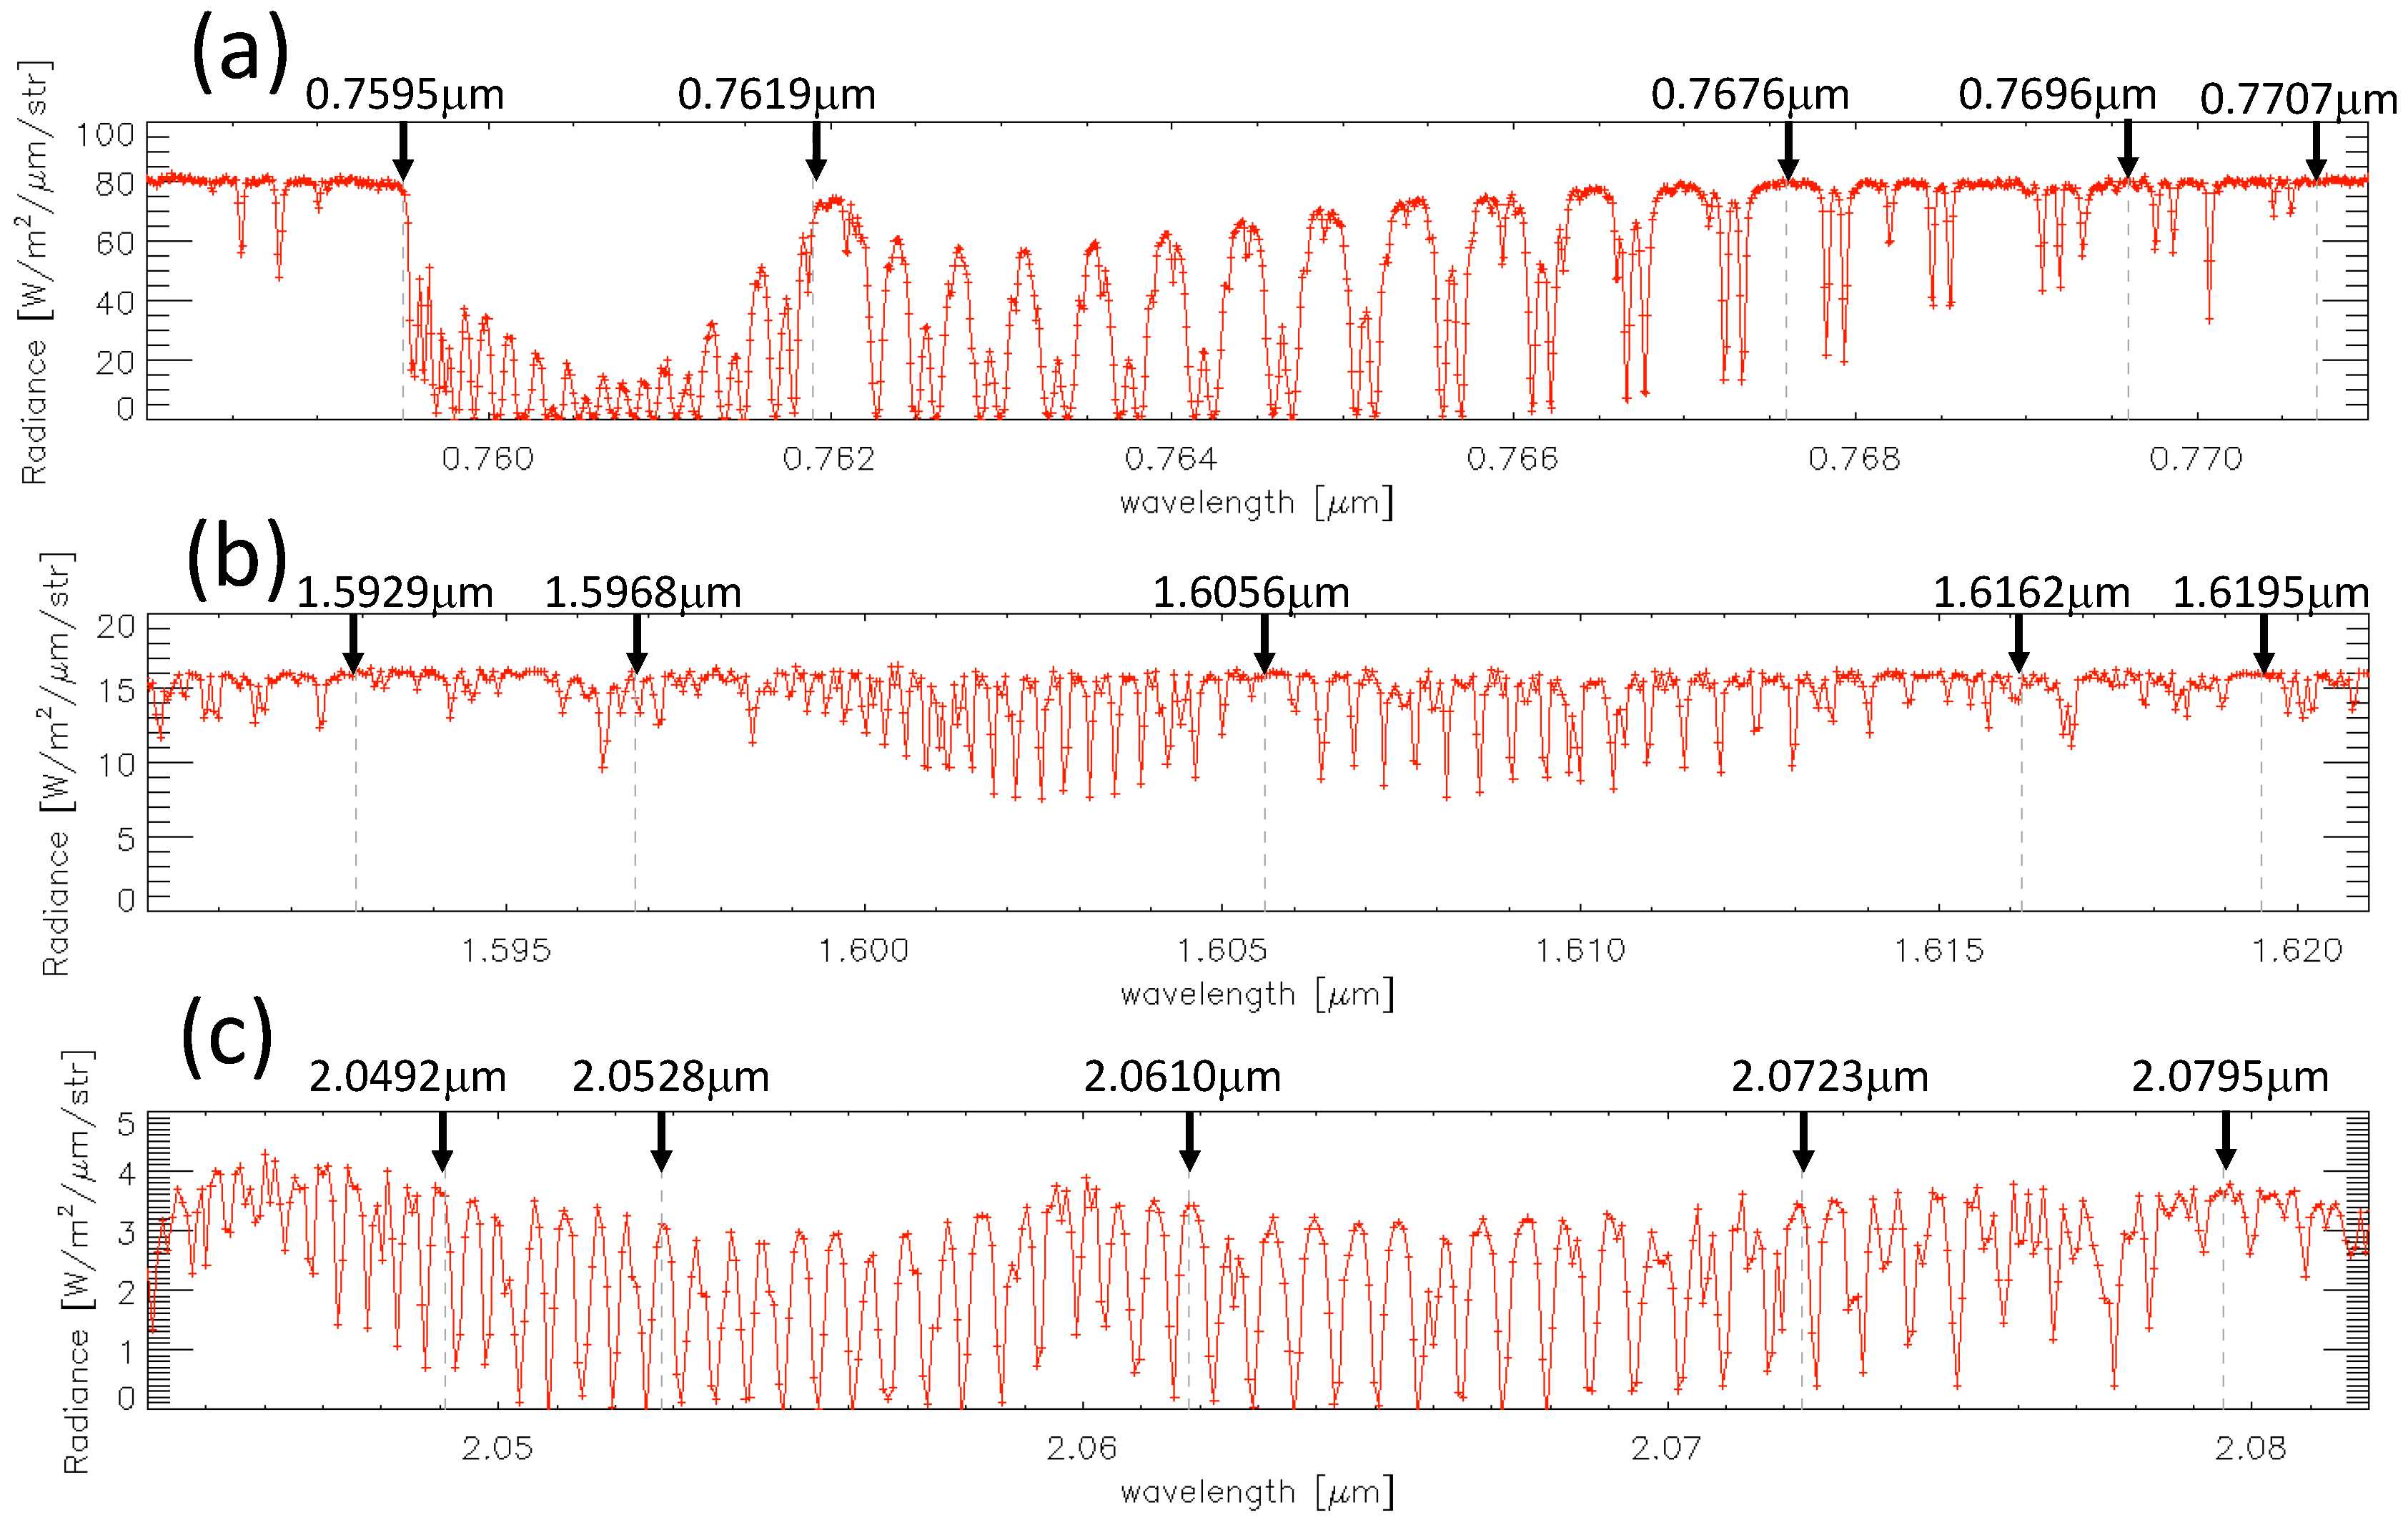
3.2. Spectral Radiance Inter-Comparison Result

Figure 4 shows the match-up points for GOSAT and OCO-2 from September 2014 to March 2017, after screening with CAM images. The number of match-up points are 240 for high gain and 146 for medium gain. Pre-launch cross-calibration was performed using single transfer radiometers, with an optical band pass filter for each band. The radiometric response within each band was not compared.
We present typical spectral radiance comparisons in the Appendix: Figure A1 shows the comparison (a) over the Pacific Ocean with glint high gain, (b) over a farm area in North-East Hungary with high gain, and (c) over the Sahara Desert with medium gain. Figure 5a shows the spectral radiances differences between GOSAT and OCO-2 for all five points within each band shown in Figure 2. They agree well within 5% for all input radiance levels, showing no significant evidence of nonlinearity, except for slightly larger deviations in the ABO2 band. Low illumination input data show larger scattering due to the lower SNR of the observed spectra. Figure 5b shows the radiance bias derived from the average of the difference. All five points of the WCO2 band fall within ~3%. The larger bias at shorter wavelengths in the ABO2 band result from shortcomings in the correction for O2 absorption in the prelaunch GOSAT calibration. Kuze et al. [14] presented initial larger and faster degradation in the sensors compared to the prelaunch values. Strong H2O absorption in the SCO2 band caused large errors in the GOSAT pre-launch in ambient conditions and caused a bias in cross-calibration. The GOSAT integrating sphere was used in a clean room for satellite integration but was not nitrogen-purged. Alternately, these differences may indicate spectrally-dependent errors in the post-launch GOSAT or OCO-2 degradation corrections. Overall the agreement for all three bands is well within 5% when the five spectral points per band are averaged.

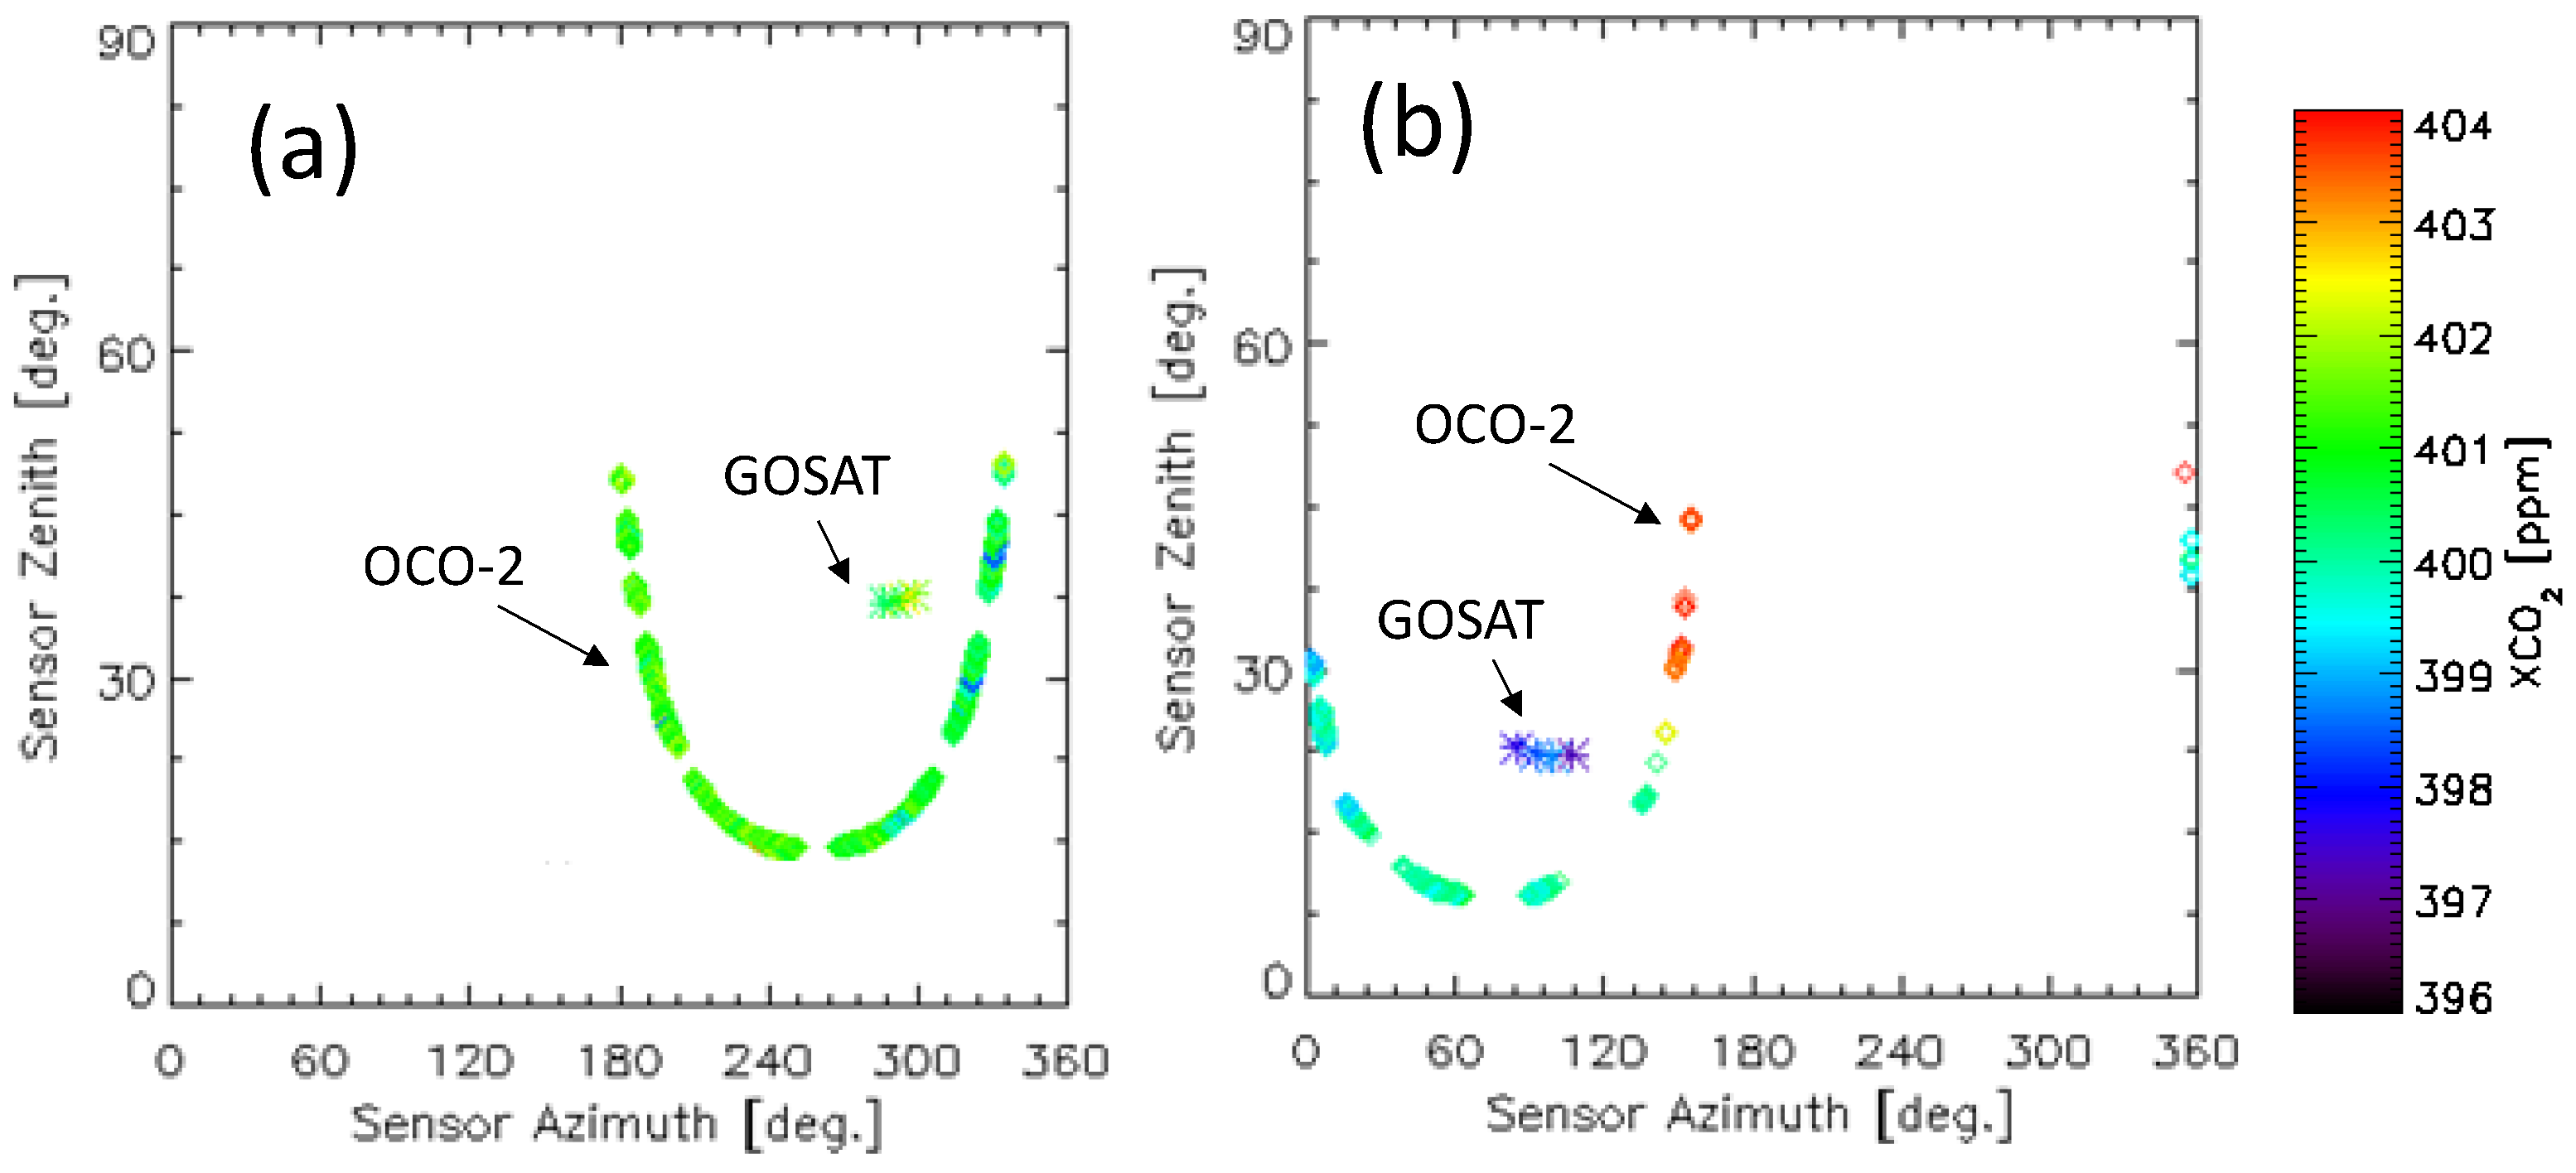
4. Retrieved XCO2 Product Inter-Comparison

4.1. Methodology of Retrievals Inter-Comparison

The retrieved XCO2 and Psurf from the OCO-2 V7r Lite product, paired to the GOSAT/ACOS V7.3 Lite data is used for high gain scenes, for which a bias correction has been applied to XCO2 [36]. The XCO2 bias correction has the following three steps; (1) Remove footprint bias (only OCO-2); (2) Identify unphysical XCO2 variability and (3) Determine global offset from TCCON. The first bias correction uses the median XCO2, which is calculated with eight co-located OCO-2 footprint averages, as the “ground truth” value and subtracts this from the observed XCO2 for each footprint. On a second step, the spurious XCO2 variability is corrected using a multivariate linear regression. Finally, the TCCON adjustment was determined relative to the land target observations. For medium gain scenes, for which the GOSAT/ACOS V7.3 bias correction has not yet been developed, the GOSAT/ACOS V7.3 “Full” product was used, since these soundings are not included in the “Lite” files. Psurf is retrieved mainly from the ABO2 band together with aerosol related parameters. The XCO2 is retrieved using all three bands. We used data between September 2014 and May 2016, which is the currently available GOSAT/ACOS product. The CAM context image data was not used for additional cloud and aerosol filtering as the pre-screeners had already been applied prior to running the XCO2 retrieval. The XCO2 data quality flag was not used in this work to use as many matched-up data and investigate the observation conditions that create biases and fluctuation.

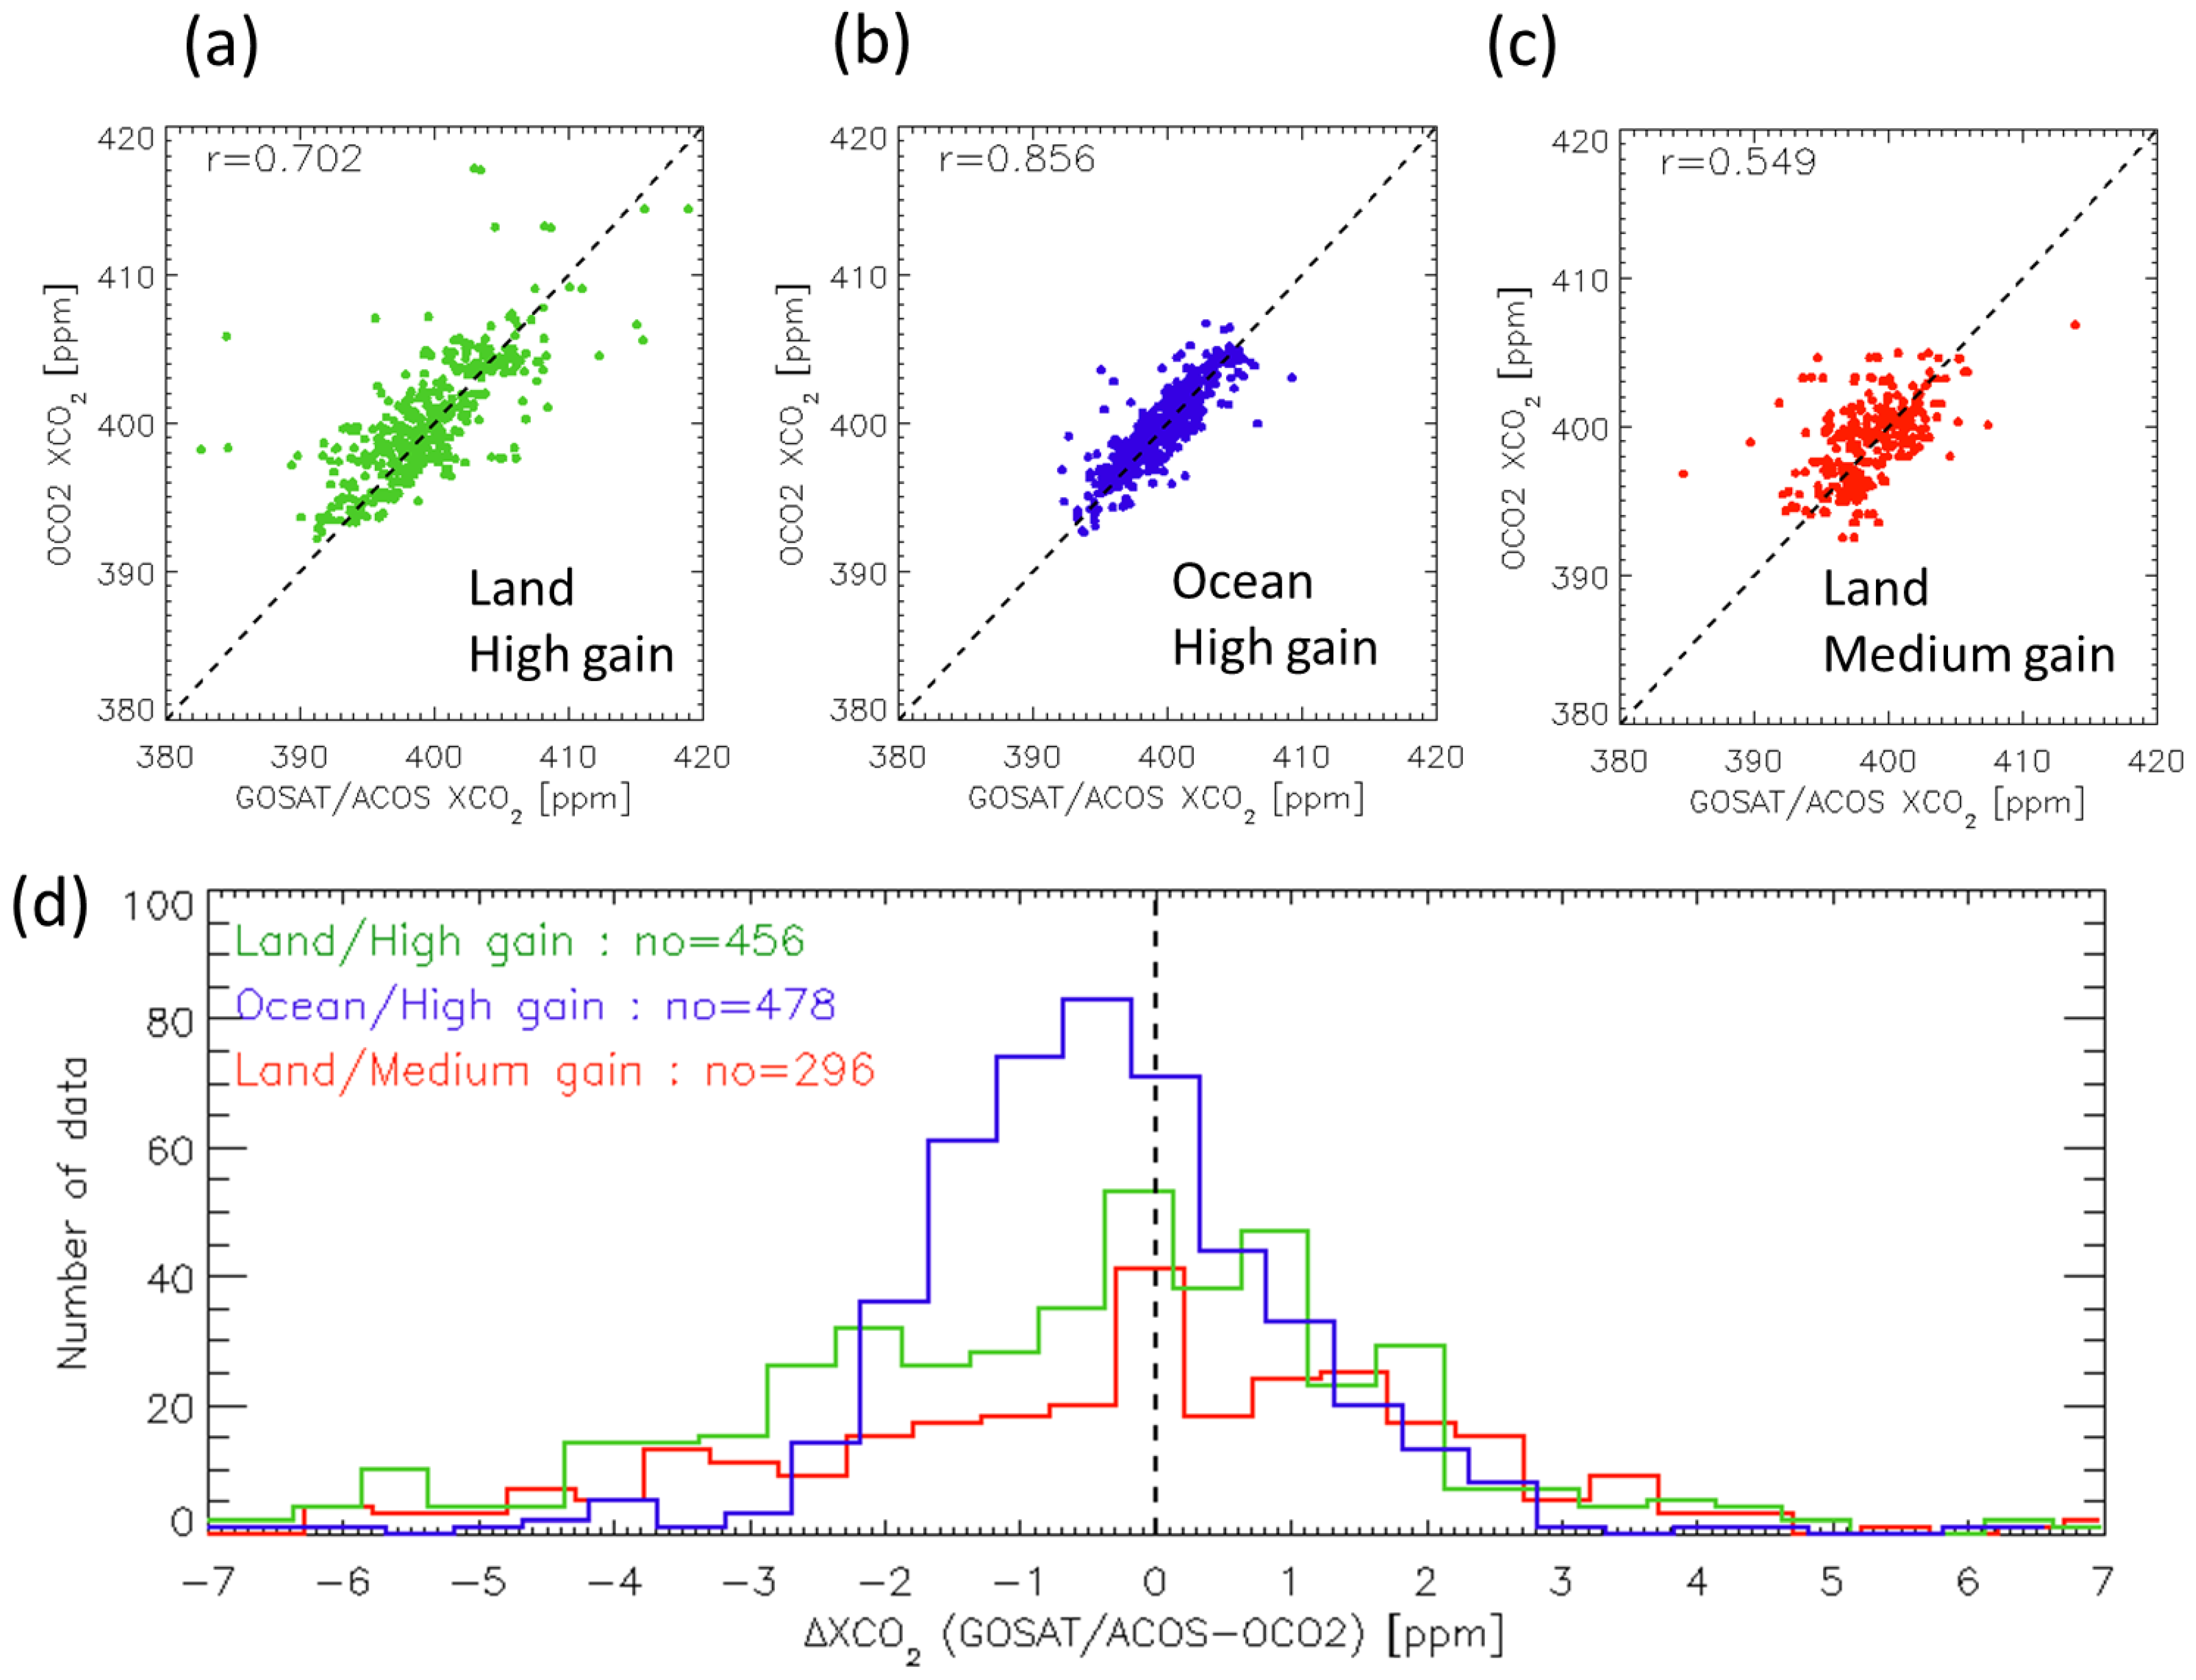
4.2. Retrieved XCO2 Inter-Comparison Result

Figure 6 shows the global map of retrieved XCO2 differences between GOSAT/ACOS and OCO-2 at matched-up points with (a) high gain and (b) medium gain. The number of match-up points is 934 for high gain and 296 for medium gain. We define ∆Psurf and ∆XCO2 as follows to analyze the difference in retrieved parameters:
Δ P surf = P surf GOSAT / ACOS P surf OCO 2
Δ XCO 2 = XCO 2 GOSAT / ACOS XCO 2 OCO 2
There are some large differences (>5 ppm), especially over land. Figure 7 shows the correlation between GOSAT/ACOS XCO2 and OCO-2 XCO2 for matched observations (a) over land with high gain, (b) over ocean with high gain, and (c) over land with medium gain, respectively. Figure 7d shows the histogram of the above three cases. The mean biases and standard deviations are (a) −0.57 ± 3.33 ppm, (b) −0.17 ± 1.48 ppm and (c) −0.19 ± 2.79 ppm. Both bias and standard deviation are lower over ocean than over land. The GOSAT FTS analog circuits all have flat frequency-dependent responses, with the exception of high gain Band 1 [1]. The GOSAT FTS medium gain does not require nonlinearity correction, which may cause biases in ∆Psurf and ∆XCO2. Even though the bias corrected GOSAT/ACOS V7.3 Lite products are not available for medium gain, we expect much lower bias in the non-bias corrected GOSAT/ACOS V7.3 Full product over the bright desert target.
Figure 8 shows the time series of ∆XCO2 and ∆Psurf for high gain over land, high gain over ocean and medium gain over land. There is no significant time dependent variation of ∆XCO2 for either high or medium gain. However, there are small quasi-periodic structures in ∆Psurf below the uncertainty level. The time dependent structures suggest the possibility of an estimation error in the “fast” degradation of the OCO-2 ABO2 band, imperfect radiance degradation correction of GOSAT and or OCO-2, seasonal cycle, zero-level offset in the GOSAT Band 1 or the effect of solar induced chlorophyll fluorescence [37]. To investigate the root cause of the ∆XCO2 bias, Figure 9 shows ∆XCO2 plotted as a function of GOSAT/ACOS retrieved Aerosol Optical Depth (AOD) at 0.755 µm, GOSAT/ACOS retrieved surface pressure and the standard deviation of OCO-2 retrieved ABO2 albedo within the GOSAT IFOV over land with both high gain and medium gain. We compared the GOSAT/ACOS retrieved AOD with AERONET data at optically thick sites such as Beijing, Paris and Pasadena [38]. The AERONET AOD does not have AOD at 0.755 µm, therefore we converted the value using Angstrom index between 0.870 µm and 0.675 µm. The slope with linear regression of GOSAT/ACOS and AERONET AOD at three sites are 0.818, 0.547 and 0.606, respectively. The squares of the Person correlation coefficient, R2, are 0.470, 0.568, and 0.243, respectively. The trend of both products agrees well. The standard deviation of OCO-2 retrieved ABO2 albedo σ a l b e d o within the GOSAT IFOV can be defined as follows:
σ albedo = STDV ( α OCO 2   IFOV ) N IFOV ( α OCO 2   IFOV ) / N
where αoco-2IFOV and N are the retrieved OCO-2 albedo within the GOSAT IFOV and the number of OCO-2 footprints within the GOSAT IFOV. There is no strong correlation between ∆XCO2 and AOD, whereas ∆XCO2 standard deviation becomes larger with lower retrieved Psurf and larger   σ a l b e d o . The largest disagreements in ∆XCO2 occur predominately at high altitude and in regions of large surface inhomogeneity, as evidenced by the lower retrieved Psurf and larger   σ a l b e d o values. To investigate this, we checked individual match-up points. The areas with lower bias and fluctuation near 600 hPa correspond to in North Tibet in China. The areas with higher biases at 700 hPa are the Andean Range in South America and Tian Shan Range in North China. South Tibet in North-east India and forest in British-Colombia in Canada have larger bias and fluctuation, with retrieved ABO2 albedo deviation greater than 0.25. These complicated surface conditions prompt the surface flatness and BRDF uncertainty and a possible cause of the difference in the retrievals. The above results can explain why land data has a larger ∆XCO2 deviation than ocean glint data even if these are not the only causes.
If we filter out GOSAT/ACOS and OCO-2 Lite products with lower XCO2 quality flags, the number of match-up data and the ∆XCO2 are significantly reduced. The mean biases, standard deviations and the number of match-up data are −0.05 ± 1.47 ppm and 158 over land with high gain, −0.27 ± 1.06 ppm and 283 over ocean with high gain and −0.03 ± 2.93 ppm and 193 over land with medium gain.

5. Discussion

5.1. Error in BRDF Correction

One possible reason why GOSAT high gain observations have larger bias and standard deviation in radiance spectra over land than over ocean is BRDF variability. Over land match-up observations do not always have similar geometry, whereas over ocean both GOSAT and OCO-2 target the glint point with similar geometry. For coincident observations over RRV, while GOSAT has only four scenes per orbit, OCO-2 acquires thousands of observations by maneuvering the satellite. The RRV site is located between GOSAT paths 36 and 37 and OCO-2 paths 137 and 139. We can analyze the effect of the BRDF correction by comparing the data targeted from the east and west. We selected two cases; 29 June 2015, when both GOSAT and OCO-2 viewed the RRV target from the sun direction (West), and 1 July 2015, when both GOSAT and OCO-2 viewed RRV from the direction opposite to the sun (East). The former case has a backward scattering geometry and BRDF changes rapidly with viewing angle. Figure 10 and Figure 11 show the OCO-2 and GOSAT spectra radiance plotted against sensor azimuth and zenith angles during RRV target observations on 29 June 2015 and 1 July 2015, respectively. As shown in these figures, OCO-2 targeted RRV with sensor zenith angles from 10 to 75 degrees. The spectral radiances are plotted at wavelengths of (a) 0.768 µm in the ABO2 band, (b) 1.606 µm in the WCO2 band and (c) 2.061 µm in the SCO2 band. The lower figures (d–f) represent BRDF corrected spectral radiances at the same wavelengths as the upper figures. The BRDF correction was applied to both GOSAT and OCO-2 using the MODIS BRDF product [32]. The spectral radiance variation of OCO-2 spectral radiance within the GOSAT IFOV is larger than forward scattering. After the BRDF correction, the variation of spectral radiance within the GOSAT IFOV becomes small but still is not constant. As the MODIS BRDF model is more accurate between 0 to 55 degrees, we selected the data with the sensor zenith angle of less than 55 degrees [39]. In addition, we selected the GOSAT sensor zenith angles of 38 degrees and 28 degrees on 29 June 2015 and on 1 July 2015, respectively. Table 3 summarizes the spectral radiance of GOSAT and averaged OCO-2 with and without BRDF correction and selected data with the truncated sensor zenith angles. Table 4 shows the standard deviation of spectral radiance divided by the average. The deviation becomes smaller than 5% after applying the BRDF correction and the truncated sensor zenith angle. Figure 12 shows the OCO-2 and GOSAT retrieved XCO2 on (a) 29 June 2015 and (b) 1 July 2015. The current retrieval algorithm has yet to take account of the BRDF correction, but it can help to minimize the uncertainties of XCO2 retrieval, especially in large off-nadir viewing geometry scenes.

5.2. Remaining Issues and Possible Solutions

The current GOSAT and OCO-2 spectral radiances agree within 5% for all bands, except for slightly larger deviations at shorter wavelengths in the ABO2 band. Even though XCO2 is retrieved by using differential absorption spectra, a radiometric accuracy of better than 10% in the entire mission is needed to distinguish the reflection from the surface and scattering from the atmosphere for accurate light propagation estimation. Scattering by aerosol and thin clouds in the real atmosphere is not negligible when attempting to detect small spatial and temporal variation of atmospheric XCO2. The present GOSAT V201 products have a nonlinearity over-correction issue in the Band 1 bright data. Regarding these spectral issues, a new GOSAT radiometric conversion table will be created based on the pre-launch data but processed with the new V210 algorithm, improved atmospheric absorption corrections for pre-launch data acquired in the ambient laboratory. This table shall remove the spectral artifacts within the GOSAT Band 1 and Band 3. Fast degradation of the OCO-2 ABO2 band has become predictable and the interval of decontamination activity has increased. Much improved radiometric corrections have been developed and implemented in the Version 8 product.
The mean biases of retrieved XCO2 between GOSAT and OCO-2 with the Version 7 retrieval algorithm are −0.57, −0.17 and −0.19 ppm over land with high gain, over ocean with high gain, and over land with medium gain, respectively. Miller et al. [40] describes how the XCO2 precision requirements were determined by evaluating the variability of spatial and temporal gradients in XCO2, the relationship between XCO2 precision and inferred surface CO2 flux uncertainties, and the sampling strategy. XCO2 precisions of 1–2 ppm are needed on regional scales to improve our knowledge of carbon cycle phenomena, but the geographic XCO2 biases at regional to continental scales will have the largest impact on the inferred CO2 surface fluxes. Buchwitz et al. [6] mentioned that the satellite–TCCON differences may exceed the systematic error requirements of less than 0.5 ppm for XCO2. It has been identified that more research is needed for understanding, such as regional CO2 surface flux (source/sink) applications. A number of efforts are underway to further improve the XCO2 products. The Version 8 retrieval algorithm also employs a non-Lambertian BRDF over land. This change is expected to yield more consistent retrievals over land. Finally, there are good prospects for validating the GOSAT medium gain products over bright surfaces. For example, the Moderate spectral resolution EM27 open path FTS with a sun tracker demonstrated accurate and precise XCO2 retrievals on the ground [41], and the EM27 is also portable and traceable with TCCON. We installed one at the bright desert site at Railroad Valley, Nevada temporarily and XCO2 data with medium gain were validated. By collecting a set of bright surface data at more sites, we can determine and apply a bias correction valued for GOSAT medium gain.

6. Conclusions

GOSAT and OCO-2 are the first two satellite programs dedicated to monitoring the global CO2 distribution. In this paper, we demonstrated the reliability of CO2 remote sensing from space by comparing radiances and retrieved XCO2 and Psurf values from different types of spectrometers.
The most recent versions of GOSAT and OCO-2 spectral radiance and retrieved XCO2 products from temporally coincident and spatially collocated points were compared. The measured spectral radiances from both instruments agree reasonably well; within 5% for all bands, only larger bias at shorter wavelengths in the ABO2 band. Some possible causes are imperfect GOSAT prelaunch calibration in ambient conditions and faster degradation at shorter wavelengths within a band. The high gain SCO2 radiance difference presents at shorter wavelengths in the SCO2 band, while the WCO2 systematically is below 3%. These biases are small, but may still be large enough to affect the XCO2 retrieval. The XCO2 retrievals over ocean agree very well, with a bias and standard deviation of −0.17 ± 1.48 ppm. Over land, the mean biases and standard deviations are −0.57 ± 3.33 ppm with high gain and −0.19 ± 2.79 ppm with medium gain. The land data with high gain have larger deviation, probably due to BRDF uncertainty. Trend analysis of ∆Psurf comparison also suggests the necessity of fine radiometric correction, but most of the root causes of large bias and deviation were identified. By improving individual data processing and calibration, GOSAT and OCO-2 can provide long-term uniform quality data and consistent retrieval accuracy from dark ocean to bright desert targets.
At present, satellite observation is the only method to monitor XCO2 globally and periodically. However, coverage and frequency of a single instrument are still limited. Improvement of cross-calibration on-orbit will contribute to the future satellite observation network of greenhouse gases with multiple instruments.

Acknowledgments

The data used in this analysis were produced by the JAXA GOSAT team at Tsukuba Space Center and the ACOS/OCO-2 project at the Jet Propulsion Laboratory, California Institute of Technology. Part of the research described in this paper was carried out at the Jet Propulsion Laboratory, California Institute of Technology, under a contract with the National Aeronautics and Space Administration. The CSU/CIRA contribution to this work was supported by JPL subcontract 1439002. Government sponsorship is acknowledged.

Author Contributions

Fumie Kataoka contributed to data analyses and preparation of the manuscript. David Crisp, Thomas E. Taylor and Chris W. O’Dell are part of the ACOS and OCO-2 retrieval algorithm team. Akihiko Kuze, Kei Shiomi and Hiroshi Suto guided the GOSAT Level1 algorithm and calibration. Carol Bruegge, Florian M. Schwandner, Robert Rosenberg, Lars Chapsky and Richard A. M. Lee worked on the OCO-2 Level1 algorithm and calibration. All authors read and approved the final manuscript.

Conflicts of Interest

The authors declare no conflict of interest.

Appendix A

Figure A1. The spectral comparison between glint GOSAT and glint OCO-2 over the Pacific Ocean at 20.74°N, 126.74°E on 25 June 2015 with the GOSAT high gain. (a) The GOSAT footprint and OCO-2 matched-up pixels; the black line, the black star and the red dots represent the GOSAT IFOV, the center of the GOSAT IFOV and the OCO-2 observation points within GOSAT IFOV, respectively; (b) The GOSAT camera image from CAM bore sighted with TANSO-FTS. The spectral comparison of (c) ABO2; (d) WCO2 and (e) SCO2 bands. Red and blue lines represent the GOSAT and OCO-2 spectral radiances, respectively.
Remotesensing 09 01158 g0a1
Figure A2. The spectral comparison between glint GOSAT and glint OCO-2 over a farm area in North-East Hungary at 48.0°N, 21.33°E on 9 June 2015 with GOSAT high gain. The plots are same as Figure A1.
Remotesensing 09 01158 g0a2
Figure A3. The spectral comparison between glint GOSAT and glint OCO-2 over the Sahara desert at 25.14°N, 7.13°W on 18 February 2015 with the GOSAT medium gain. The plots are same as Figure A1.
Remotesensing 09 01158 g0a3

References

  1. Kuze, A.; Suto, H.; Shiomi, K.; Urabe, T.; Nakajima, M.; Yoshida, J.; Kawashima, T.; Yamamoto, Y.; Kataoka, F. Level 1 algorithms for TANSO on GOSAT: Processing and on-orbit calibration. Atmos. Meas. Tech. 2012, 5, 2447–2467. [Google Scholar] [CrossRef] [Green Version]
  2. Zhang, L.L.; Yue, T.X.; Wilson, J.P.; Wang, D.Y.; Zhao, N.; Liu, Y.; Liu, D.D.; Du, Z.P.; Wang, Y.F.; Lin, C.; et al. Modelling of XCO2 Surfaces Based on Flight Tests of TanSat. Sensors 2016, 16, 1818. [Google Scholar] [CrossRef] [PubMed]
  3. Veefkind, J.; Aben, I.; McMullan, K.; Förster, H.; de Vries, J.; Otter, G.; Claas, J.; Eskes, H.; de Haan, J.; Kleipool, Q.; et al. TROPOMI on the ESA Sentinel-5 precursor: A GMES mission for global observations of the atmospheric composition for climate, air quality and ozone layer applications, the Sentinel missions – new opportunities for science. Remote Sens. Environ. 2012, 120, 70–83. [Google Scholar] [CrossRef]
  4. Suto, H.; Kuze, A.; Shiomi, K.; Nakajima, M. Space-based carbon monitoring by GOSAT and GOSAT-2: Lessons learned from GOSAT in-orbit operation and towards better accuracy of XCO2 observation. In Proceedings of the AGU fall meeting, San Francisco, CA, USA, 9–13 December 2013. [Google Scholar]
  5. Orbiting Carbon Observatory-3 (OCO-3) Project Web Site. Available online: https://oco3.jpl.nasa.gov/ (accessed on 22 August 2017).
  6. Buchwitz, M.; Reuter, M.; Schneising, O.; Boesch, H.; Guerlet, S.; Dils, B.; Aben, I.; Armante, R.; Bergamaschi, P.; Blumenstock, T.; et al. The Greenhouse Gas Climate Change Initiative (GHG-CCI): Comparison and quality assessment of near-surface-sensitive satellite-derived CO2 and CH4 global data sets. Remote Sens. Environ. 2015, 162, 344–362. [Google Scholar] [CrossRef]
  7. Heymann, J.; Reuter, M.; Hilker, M.; Buchwitz, M.; Schneising, O.; Bovensmann, H.; Burrows, J.P.; Kuze, A.; Suto, H.; Deutscher, N.M.; et al. Consistent satellite XCO2 retrievals for SCIAMACHY and GOSAT using the BESD algorithm. Atmos. Meas. Tech. 2015, 8, 2961–2980. [Google Scholar] [CrossRef]
  8. Kuze, A.; Suto, H.; Nakajima, M.; Hamazaki, T. Thermal and near infrared sensor for carbon observation Fourier-transform spectrometer on the Greenhouse Gases Observing Satellite for greenhouse gases monitoring. Appl. Opt. 2009, 48, 6716–6733. [Google Scholar] [CrossRef] [PubMed]
  9. Sun, K.; Liu, X.; Nowlan, R.C.; Cai1, Z.; Chance, K.; Frankenberg, C.; Lee, A.M.R.; Pollock, R.; Rosenberg, R.; Crisp, D. Characterization of the OCO-2 instrument line shape functions using on-orbit solar measurements. Atmos. Meas. Tech. 2017, 10, 939–953. [Google Scholar] [CrossRef]
  10. Crisp, D.; Pollock, H.R.; Rosenberg, R.; Chapsky, L.; Lee, R.A.M.; Oyafuso, F.A.; Frankenberg, C.; O’Dell, C.W.; Bruegge, C.J.; Doran, G.B.; et al. The on-orbit performance of the Orbiting Carbon Observatory-2 (OCO-2) instrument and its radiometrically calibrated products. Atmos. Meas. Tech. 2017, 10, 59–81. [Google Scholar] [CrossRef]
  11. Rosenberg, R.; Maxwell, E.S.; Johnson, C.B.; Chapsky, L.; Lee, A.R.; Pollock, R. Preflight Radiometric Calibration of Orbiting Carbon Observatory 2. IEEE Trans. Geosci. Remote Sens. 2017, 5, 1994–2006. [Google Scholar] [CrossRef]
  12. Lee, A.R.; O’Dell, C.W.; Wunch, D.; Roehl, M.C.; Osterman, B.G.; Blavier, J.; Rosenberg, R.; Chapsky, L.; Frankenberg, C.; Hunyadi-Lay, L.S.; et al. Preflight Spectral Calibration of Orbiting Carbon Observatory 2. IEEE Trans. Geosci. Remote Sens. 2017, 5, 2499–2508. [Google Scholar] [CrossRef]
  13. Sakuma, F.; Bruegge, C.; Rider, D.; Brown, D.; Geier, S.; Kawakami, S.; Kuze, A. OCO-GOSAT preflight cross calibration experiment. IEEE Trans. Geosci. Remote Sens. 2010, 48, 585–599. [Google Scholar] [CrossRef]
  14. Kuze, A.; Taylor, T.E.; Kataoka, F.; Bruegge, C.J.; Crisp, D.; Harada, M.; Helmlinger, M.; Inoue, M.; Kawakami, S.; Kikuchi, N.; et al. Long-term vicarious calibration of GOSAT short-wave sensors: Techniques for error reduction and new estimates of radiometric degradation factors. IEEE Trans. Geosci. Remote Sens. 2014, 52, 3991–4004. [Google Scholar] [CrossRef]
  15. Institute for Environmental Studies (NIES) GOSAT Data Archive Service (GDAS). Available online: https://data2.gosat.nies.go.jp/ (accessed on 4 August 2017).
  16. NASA Goddard Earth Sciences Data and Information Services Center (GES DISC) Web Site. Available online: https://oco2.gesdisc.eosdis.nasa.gov/data/ (accessed on 14 August 2017).
  17. Kuze, A.; Suto, H.; Shiomi, K.; Kawakami, S.; Tanaka, M.; Ueda, Y.; Deguchi, A.; Yoshida, J.; Yamamoto, Y.; Kataoka, F.; et al. Update on GOSAT TANSO-FTS performance, operations, and data products after more than six years in space. Atmos. Meas. Tech. 2016, 9, 2445–2461. [Google Scholar] [CrossRef]
  18. Kuze, A.; O’Brien, D.M.; Taylor, T.E.; Day, J.O.; O’Dell, C.W.; Kataoka, F.; Yoshida, M.; Mitomi, Y.; Bruegge, C.J.; Pollock, H.; et al. Vicarious Calibration of the GOSAT Sensors Using the Railroad Valley Desert Playa. IEEE Trans. Geosci. Remote Sens. 2011, 49, 1781–1795. [Google Scholar] [CrossRef]
  19. Suto, H.; Yoshida, J.; Desbiens, R.; Kawashima, T.; Kuze, A. Characterization and correction of spectral distortions induced by microvibrations onboard the GOSAT Fourier transform spectrometer. Appl. Opt. 2013, 52, 4969–4980. [Google Scholar] [CrossRef] [PubMed]
  20. Eldering, A.; O’Dell, C.W.; Wennberg, P.O.; Crisp, D.; Gunson, M.R.; Viatte, C.; Avis, C.; Braverman, A.; Castano, R.; Chang, A.; et al. The Orbiting Carbon Observatory-2: First 18 months of science data products. Atmos. Meas. Tech. 2017, 10, 549–563. [Google Scholar] [CrossRef]
  21. O’Dell, C.W.; Connor, B.; Bösch, H.; O’Brien, D.; Frankenberg, C.; Castano, R.; Christi, M.; Eldering, D.; Fisher, B.; Gunson, M.; et al. The ACOS CO2 retrieval algorithm—Part 1: Description and validation against synthetic observations. Atmos. Meas. Tech. 2012, 5, 99–121. [Google Scholar] [CrossRef]
  22. Crisp, D.; Fisher, B.M.; O’Dell, C.W.; Frankenberg, C.; Basilio, R.; Bösch, H.; Brown, L.R.; Castano, R.; Connor, B.; Deutscher, N.M.; et al. The ACOS XCO2 retrieval algorithm, Part 2: Global XCO2 data characterization. Atmos. Meas. Tech. 2012, 5, 687–707. [Google Scholar] [CrossRef]
  23. Osterman, G.; Eldering, A.; Cheng, C.; O’Dell, C.; Crisp, D.; Frankenberg, C.; Fisher, B. ACOS Level 2 Standard Product and Lite Data Product Data User’s Guide, v7.3. Available online: https://docserver.gesdisc.eosdis.nasa.gov/public/project/OCO/ACOS%20v7.3_DataUsersGuide-RevE.pdf (accessed on 3 August 2017).
  24. Bösch, H.; Brown, L.; Castano, R.; Christi, M.; Connor, B.; Crisp, D.; Eldering, A.; Fisher, B.; Frankenberg, C.; Gunson, M.; et al. Orbiting Carbon Observatory (OCO)-2 Level 2 Full Physics Retrieval Algorithm Theoretical Basis Document. Available online: https://docserver.gesdisc.eosdis.nasa.gov/public/project/OCO/OCO2_L2_ATBD.V6.pdf (accessed on 6 October 2017).
  25. Toon, G.C.; Blavier, J.-F.; Sen, B.; Salawitch, R.J.; Osterman, G.B.; Notholt, J.; Rex, M.; McElroy, C.T.; Russell, J.M., III. Ground-based observations of Arctic O3 loss during spring and summer 1997. J. Geophys. Res. 1999, 104, 26497–26510. [Google Scholar] [CrossRef]
  26. Thuillier, G.; Hers´e, M.; Labs, D.; Foujols, T.; Peetermans, W.; Gillotay, D.; Simon, P.C.; Mandel, H. The Solar Spectral Irradiance from 200 to 2400 nm as Measured by the SOLSPEC Spectrometer from the Atlas and Eureca Missions. Solar Phys. 2003, 214, 1–22. [Google Scholar] [CrossRef]
  27. Wunch, D.; Wennberg, P.O.; Toon, G.C.; Connor, B.J.; Fisher, B.; Osterman, G.B.; Frankenberg, C.; Mandrake, L.; O’Dell, C.; Ahonen, P.; et al. A method for evaluating bias in global measurements of CO2 total columns from space. Atmos. Chem. Phys. 2011, 11, 12317–12337. [Google Scholar] [CrossRef]
  28. Lindqvist, H.; O’Dell, C.W.; Basu, S.; Boesch, H.; Chevallier, F.; Deutscher, N.; Feng, L.; Fisher, B.; Hase, F.; Inoue, M.; et al. Does GOSAT capture the true seasonal cycle of carbon dioxide? Atmos. Chem. Phys. 2015, 15, 13023–13040. [Google Scholar] [CrossRef]
  29. Kulawik, S.; Wunch, D.; O’Dell, C.; Frankenberg, C.; Reuter, M.; Oda, T.; Chevallier, F.; Sherlock, V.; Buchwitz, M.; Osterman, G.; et al. Consistent evaluation of ACOS-GOSAT, BESD-SCIAMACHY, CarbonTracker, and MACC through comparisons to TCCON. Atmos. Meas. Tech. 2016, 9, 683–709. [Google Scholar] [CrossRef]
  30. Wunch, D.; Wennberg, P.O.; Osterman, G.; Fisher, B.; Naylor, B.; Roehl, C.M.; O’Dell, C.; Mandrake, L.; Viatte, C.; Kiel, M.; et al. Comparisons of the Orbiting Carbon Observatory-2 (OCO-2) XCO2 measurements with TCCON. Atmos. Meas. Tech. 2017, 10, 2209–2238. [Google Scholar] [CrossRef]
  31. Taylor1, E.T.; O’Dell1, W.C.; Frankenberg, C.; Partain, T.P.; Cronk, Q.H.; Savtchenko, A.; Nelson, N.R.; Rosenthal, J.E.; Chang, Y.A.; Fisher, B.; et al. Orbiting Carbon Observatory-2 (OCO-2) cloud screening algorithms: Validation against collocated MODIS and CALIOP data. Atmos. Meas. Tech. 2016, 9, 973–989. [Google Scholar]
  32. MODIS BRDF-Albedo Model Parameters 16-Day L3 Global 1km (MCD43B1). Available online: https://lpdaac.usgs.gov/dataset_discovery/modis/modis_products_table/mcd43b1 (accessed on 14 August 2017).
  33. Strahler, A.H.; Muller, J.-P. MODIS BRDF/Albedo Product: Algorithm Theoretical Basis Document Version 5.0. 1999. Available online: http://citeseerx.ist.psu.edu/viewdoc/download?doi=10.1.1.133.7683&rep=rep1&type=pdf (accessed on 10 November 2017).
  34. O’Brien, D.; Polonsky, I.; O’Dell, C.W.; Kuze, A.; Kikuchi, N.; Yoshida, Y.; Natraj, V. Testing the polarization model for TANSO-FTS on GOSAT against clear-sky observations of sun-glint over ocean. IEEE Trans. Geosci. Remote Sens. 2013, 51, 5199–5209. [Google Scholar] [CrossRef]
  35. Kikuchi, N.; Yoshida, Y.; Uchino, O.; Morino, I.; Yokota, T. An advanced retrieval algorithm for greenhouse gases using polarization information measured by GOSAT TANSO-FTS SWIR I: Simulation study. J. Geophys. Res. 2016, 121, 13129–13157. [Google Scholar] [CrossRef]
  36. OCO-2 Warn Level, Bias Correction, and Lite File Product Description; Version 1.1; 30 June 2016. Available online: https://co2.jpl.nasa.gov/static/docs/OCO2_XCO2_Lite_Files_and_Bias_Correction_0716.docx (accessed on 10 November 2017).
  37. Frankenberg, C.; Butz, A.; Toon, G.C. Disentangling chlorophyll fluorescence from atmospheric scattering effects in O2 A-band spectra of reflected sun-light. Geophys. Res. Lett. 2011, 38, L03801. [Google Scholar] [CrossRef]
  38. NASA AERONET (AErosol RObotic NETwork) Program Web Site. Available online: https://aeronet.gsfc.nasa.gov/ (accessed on 14 August 2017).
  39. Jicheng, L.; Crystal, S.; Alan, S.; Ziti, J.; Yanmin, S.; Qingling, Z.; Miguel, R.; John, A.A.; Ellsworth, G.D. Validation of Moderate Resolution Imaging Spectroradiometer (MODIS) albedo retrieval algorithm: Dependence of albedo on solar zenith angle. J. Geophys. Res. 2009, 114, D01106. [Google Scholar] [CrossRef]
  40. Miller, C.E.; Crisp, D.; DeCola, P.L.; Olsen, S.C.; Randerson, J.T.; Michalak, A.M.; Alkhaled, A.; Rayner, P.; Jacob, D.J.; Suntharalingam, P.; et al. Precision requirements for space-based XCO2 data. J. Geophys. Res. 2007, 112, D10314. [Google Scholar] [CrossRef]
  41. Shiomi, K.; Kuze, A.; Hashimoto, M.; Suto, H.; Kataoka, F.; Igarashi, T.; Kawakami, S. Calibration and validation activities for GOSAT collaborated with OCO-2. In Proceedings of the 31st International Symposium on Space Technology and Science, Matsuyama, Japan, 3–9 June 2017. [Google Scholar]
Figure 1. GOSAT and OCO-2 orbit direction and observation strategy.
Remotesensing 09 01158 g001
Figure 2. The wavelengths evaluated in each band; (a) ABO2; (b) WCO2 (c) SCO2 bands.
Remotesensing 09 01158 g002
Figure 3. Example of BRDF polar plots at the RRV desert surface on 30 July 2015 created from the MODIS MCD43B1 product. Latitude, longitude and solar zenith angle are 38.471 degrees, −115.653 degrees and 25 degrees, respectively. The radial direction is the viewing zenith angle where the center is for a nadir view angle (viewing zenith = 0 degrees). The outer edge is a view to the horizon (view zenith angle = 90 degree). The azimuth is represented as the direction from North. An azimuth of 90 degree would be looking from the east. The BRDF plots correspond to MODIS (a) Band 2 (841–876 nm) (b) Band 6 (1628–1652 nm) and (c) Band 7 (2105–2155 nm), respectively.
Remotesensing 09 01158 g003
Figure 4. The match-up points between GOSAT and OCO-2 used in the spectral radiance comparison. Blue and red dots represent the GOSAT high and medium gain observations, respectively. Numbers of match-up points are 240 for high gain and 146 for medium gain.
Remotesensing 09 01158 g004
Figure 5. (a) The fractional difference in spectral radiance for GOSAT and OCO-2 is shown as a function of the GOSAT radiance amplitude. Blue and red dots represent high and medium gains, respectively; (b) Spectral radiance ratio at the center of wavelengths shown in Figure 2. For both panels (a,b), the upper, middle and lower figures represent the ABO2, WCO2 and SCO2 bands, respectively.
Remotesensing 09 01158 g005
Figure 6. The plots show ∆XCO2 between GOSAT/ACOS and OCO-2 with (a) high gain and (b) medium gain observations.
Remotesensing 09 01158 g006
Figure 7. Correlation plots of GOSAT/ACOS XCO2 and OCO-2 XCO2 (a) over land with high gain; (b) over ocean with high gain and (c) over land with medium gain. The Pearson correlation coefficients, r, are in the upper left of each figure; (d) Histogram of ∆XCO2 for each observation mode. The bin size of the histogram is 0.5 ppm. The mean biases and standard deviations are (a) −0.57 ± 3.33 ppm, (b) −0.17 ± 1.48 ppm and (c) −0.19 ± 2.79 ppm.
Remotesensing 09 01158 g007
Figure 8. The upper three panels show the time series of ∆XCO2 (a) over land with high gain; (b) over ocean with high gain and (c) over land with medium gain. The lower panels (df) show the time series of ∆Psurf with the same conditions as the above panels. The error bars indicate the standard deviation of ∆XCO2 and ∆Psurf within GOSAT IFOV.
Remotesensing 09 01158 g008
Figure 9. ∆XCO2 as a function of (a) GOSAT/ACOS retrieved AOD at 0.755 µm; (b) GOSAT/ACOS retrieved surface pressure and (c) OCO-2 ABO2 σ a l b e d o over land with high gain. The lower panels (df) show same parameters as the above panels over land with medium gain. All match-up data were plotted with gray marks. The green and red plots and bars are the average value and standard deviation within each bin. The bin sizes are (a) 0.05; (b) 20 hPa and (c) 0.02. The upper panel shows over land with high gain and the lower panel shows medium gain.
Remotesensing 09 01158 g009
Figure 10. The OCO-2 and GOSAT spectra radiance against satellite azimuth and zenith angles during RRV target observations on 29 June 2015 at the wavelengths of (a) 0.768 µm in the ABO2 band; (b) 1.606 µm in the WCO2 band and (c) 2.061 µm on SCO2 band. The lower figures (df) represent BRDF corrected spectral radiance at the same wavelengths as the upper figures.
Remotesensing 09 01158 g010
Figure 11. The OCO-2 and GOSAT spectra radiance against satellite azimuth and zenith angles during RRV target observations on 1 July 2015. The plots are same as the Figure 10.
Remotesensing 09 01158 g011
Figure 12. The OCO-2 and GOSAT retrieved XCO2 against satellite azimuth and zenith angles during RRV target observations on (a) 29 June 2015 and (b) 1 July 2015.
Remotesensing 09 01158 g012
Table 1. The spectral information of GOSAT and OCO-2.
Satellite GOSATOCO-2
Spectrometer Type Michelson Fourier transformGrating
Band 1 (ABO2)Spectral Range758–775 nm758–772 nm
Sampling Interval0.2 cm−1/0.011–0.012 nm0.015 nm
FWHM0.02 nm0.04 nm
Band 2 (WCO2)Spectral Range1560–1720 nm1594–1619 nm
Sampling Interval0.2 cm−1/0.045–0.064 nm0.031 nm
FWHM0.06 nm0.08 nm
Band 3 (SCO2)Spectral Range1920–2080 nm2042–2082 nm
Sampling Interval0.2 cm−1/0.069–0.090 nm0.04 nm
FWHM0.10 nm0.10 nm
Polarization Two linear (P and S)One linear
Table 2. Orbit and observation geometry of GOSAT and OCO-2.
SatelliteGOSATOCO-2
Orbit Height666 km705 km
Inclination98.1 degrees98.2 degrees
Local Time12:46–12:55 LT13:35:30–13:36:20 LT
Recurrent Period3 day16 day
Repeat Orbits44233
Swath ± 35 degrees10.6 km (nadir)
PointingMultiple targets with a 2-axis pointing mechanismNadir, Glint, Transition or Target
Footprint (Nadir, Nominal)Circle of 10.5 km diameterParallelogram of 1.29 km × 2.25 km
Table 3. The averaged GOSAT and OCO-2 spectral radiance during the RRV target observation on 29 June 2015 and 1 July 2015 at wavelengths of (a) 0.768 µm; (b) 1.606 µm and (c) 2.061 µm with the selected sensor zenith angles (55 degree and GOSAT satellite zenith angle). The GOSAT satellite zenith angles are 38 degrees on 29 June 2015 and 28 degrees on 1 July 2015. In this Table, ZN and non-BRDF, BRDF-corr are sensor zenith angle, radiance with BRDF correction and without BRDF correction, respectively.
Raw and BRDF Corrected Radiance (W/m2/µm/str)
29 June 20151 July 2015
0.768 µm1.606 µm2.061 µm0.768 µm1.606 µm2.061 µm
OCO-2 (Averaged)non-BRDF164.0236.4112.07151.9933.6011.03
BRDF-corr164.8936.6412.20161.8535.7811.93
BRDF-corr +
ZN < 55 deg
165.8036.7012.27162.5735.9112.04
BRDF-corr +
ZN < GOSAT_ZN
165.5836.5212.23162.3335.7112.01
GOSATnon-BRDF161.3836.3212.25145.4332.9511.22
BRDF-corr159.3635.3512.04161.3135.8212.21
Table 4. The same as Table 3 but with the coefficient of variation of radiance instead of averaged spectral radiance. The coefficient of variation of radiance is the sample standard deviation over the sample mean.
Raw and BRDF Corrected Radiance std/ave (%)
29 June 20151 July 2015
0.768 µm1.606 µm2.061 µm0.768 µm1.606 µm2.061 µm
OCO-2 (Averaged)non-BRDF8.76 6.94 8.88 6.77 6.03 8.45
BRDF-corr5.03 3.96 5.08 4.89 5.26 6.75
BRDF-corr +
ZN < 55 deg
4.49 3.75 4.27 4.46 4.89 5.61
BRDF-corr +
ZN < GOSAT_ZN
3.55 3.66 3.66 3.63 4.31 4.99
GOSATnon-BRDF1.49 1.43 1.07 0.62 0.78 0.72
BRDF-corr1.49 1.43 1.07 0.62 0.78 0.72

