The 2015–2016 Ground Displacements of the Shanghai Coastal Area Inferred from a Combined COSMO-SkyMed/Sentinel-1 DInSAR Analysis
by

Lei Yu
1,2,3,4,5,6, 
Tianliang Yang
2,7,8,
Qing Zhao
1,2,3,4,5,6,*,
Min Liu
1,3,6 and
Antonio Pepe
9 1
Key Laboratory of Geographic Information Science, Ministry of Education, East China Normal University, Shanghai 200241, China
2
Key Laboratory of Land Subsidence Monitoring and Prevention, Ministry of Land and Resources, Shanghai 200072, China
3
School of Geographic Sciences, East China Normal University, Shanghai 200241, China
4
Laboratory for Environmental Remote Sensing and Data Assimilation, East China Normal University, Shanghai 200062, China
5
ECNU-CSU Joint Research Institute for New Energy and the Environment, East China Normal University, Shanghai 200062, China
6
Chongming ECO Institute, East China Normal University, Shanghai 200241, China
7
Shanghai Engineering Research Center of Land Subsidence, Shanghai 200072, China
8
Shanghai Institute of Geological Survey, Shanghai 200072, China
9
Institute for Electromagnetic Sensing of the Environment (IREA), Italian National Research Council, 328Diocleziano, Napoli 80124, Italy
*
Author to whom correspondence should be addressed.
Remote Sens. 2017, 9(11), 1194; https://doi.org/10.3390/rs9111194
Submission received: 21 September 2017
/
Revised: 10 November 2017
/
Accepted: 15 November 2017
/
Published: 21 November 2017
(This article belongs to the Special Issue Radar Interferometry for Geohazards)
Abstract
:In this work, ground deformation of the Shanghai coastal area is inferred by using the multiple-satellite Differential Synthetic Aperture Radar interferometry (DInSAR) approach, also known as the minimum acceleration (MinA) combination algorithm. The MinA technique allows discrimination and time-evolution monitoring of the inherent two-dimensional components (i.e., with respect to east-west and up-down directions) of the ongoing deformation processes. It represents an effective post-processing tool that allows an easy combination of preliminarily-retrieved multiple-satellite Line-Of-Sight-projected displacement time-series, obtained by using one (or more) of the currently available multi-pass DInSAR toolboxes. Specifically, in our work, the well-known small baseline subset (SBAS) algorithm has been exploited to recover LOS deformation time-series from two sets of Synthetic Aperture Radar (SAR) data relevant to the coast of Shanghai, collected from 2014 to 2017 by the COSMO-SkyMed (CSK) and the Sentinel-1A (S1-A) sensors. The achieved results evidence that the Shanghai ocean-reclaimed areas were still subject to residual deformations in 2016, with maximum subsidence rates of about 30 mm/year. Moreover, the investigation has revealed that the detected deformations are predominantly vertical, whereas the east-west deformations are less significant.
1. Introduction
Differential interferometric synthetic aperture radar (DInSAR) [1,2,3] plays a significant role for the monitoring of Earth’s surface ground deformation, being able to retrieve accurate and timely information on the sensor’s line-of-sight-projected components of the terrain displacements. Over recent years, the availability of large archives of Synthetic Aperture Radar (SAR) images collected from complementary viewing angles and the exploitation of multi-pass DInSAR techniques [4,5,6,7] have made possible the discrimination of the three-dimensional (3D) components of the deformation which has occurred [8,9,10,11,12,13,14,15,16,17,18,19,20]. Theoretically, 3D deformation components can be recovered based on the combination of data produced by (at least) three complementary observation angles. Nevertheless, commonly-used radar sensors are mounted onboard platforms that fly near-polar orbits (i.e., satellite azimuth direction is approximately parallel to north-south direction), and this, unfortunately, makes the detection of the north-south surface displacement components unreliable. Furthermore, SAR data are not typically acquired in the same dates. Thus, an assumption as to the temporal evolution model for the observed deformation has to be made in order to effectively combine Line-of-Sight (LOS) deformation measurements collected from different orbital positions and acquisition times [17,18]. Some technical solutions for combining multiple-satellite LOS measurements, as well as for merging DInSAR data products with other external information (such as that derived from GPS stations), have been found [15,16,17,18,19,20]. Among these solutions, the approach known as Minimum Acceleration (MinA) combination technique, originally presented in [19], implements a straightforward combination of independently-produced multiple-satellite LOS displacement time-series, so as to retrieve the time-series of the 3D components of the terrain displacement.
In this work, a simplified version of the MinA technique is applied to two sets of SAR data collected respectively by the COSMO-SkyMed (X-band) and the Sentinel-1A (C-band) sensors, over the coastal area of the Shanghai metropolis. The megacity is characterized by high urban density and ground subsidence phenomena due to groundwater extraction and consolidation of high-tall buildings, as revealed by several analyses [21,22,23,24,25,26,27,28]. Most of these investigations, however, have in the last decade focused on the highly-urbanized downtown area, using both persistent scatters [4,7] and small baseline (SB)-oriented DInSAR methods [6]. In particular, the mentioned analyses have been conducted using, at most, ERS-1/2 [21], ENVISAT [22,23], ALOS-1 [22,24], TerraSAR-X [25,26,28], and COSMO-SkyMed [23,27,28] synthetic aperture radar (SAR) images. In particular, a multiple-sensor least squares (LS) combination approach, based on the implementation of the Temporarily Coherent Point SAR interferometry processing, has been proposed in [28]. Conversely, the study of the displacement signals affecting the alongshore ocean-reclaimed platforms through DInSAR-based approaches has been revealed to be more challenging. This is because the ocean-reclaimed areas are subject to broad temporal modifications associated with the consolidation phase of soils used for land-reclamation procedures [29], thus leading to severe temporal decorrelation noise effects [30,31] in the generated interferograms. Nonetheless, a few DInSAR investigations focused on the coastal district of the Shanghai megacity have been recently performed. For instance, an analysis of spatial and temporal behavior of deformation at Shanghai ocean-reclaimed platforms, with a focus on the Pudong International Airport area, has been proposed [32] by applying a modified persistent scatterers (PS) method to a high-resolution TerraSAR-X satellite image stack, collected for the period from 2011 to 2012. In order to partially circumvent the limitations due to the scarcity of high-stable PSs in ocean-reclaimed lands, small baseline approaches, which are able to investigate the deformation of distributed scatterers (DS) on the ground, have also been applied [29,33]. These latter investigations relied on the joint use of DInSAR-derived deformation measurements, derived by processing long-lasting sequences of ENVISAT and COSMO-SkyMed differential SAR interferograms, and empirical geotechnical models [29,33,34,35,36]. As a result, some insights on the future evolution of the deformations in the coastal area of Shanghai have been determined [29,33]. It is worth emphasizing that the analyses provided in [29,33] rely on the principal assumption that ocean-reclaimed areas of Shanghai are mostly affected by vertical deformations (i.e., along the up-down direction) that are ascribable to soil compaction mechanisms [34]. On the one hand, the lack of a wide network of Global Positioning Systems (GPSs) over the entire zone of reclamation has prevented, until now, the direct validation/refutation of some deformation models [29,33]. In particular, the hypotheses made in [29,33] are about the direction of surface deformations, which were assumed to be mostly vertical as testified by the results of some geological surveys [37]. On the other hand, a unique opportunity for quantifying the extent, shape, and direction of ground deformation in the ocean-reclaimed areas of Shanghai is offered nowadays by the exploitation of new-generation SAR data collected through the Sentinel-1 mission [38]. Sentinel-1 provides SAR data for land and ocean monitoring applications, and it is composed of a constellation of two satellites, Sentinel-1A and Sentinel-1B, which were launched on 3 April 2014 and 25 April 2016, respectively. The family of two satellites has been developed within the European environmental monitoring program Copernicus. It is worth noting that the repeat cycle of the Sentinel1A-B twin-sensors constellation is reduced to six days, thus permitting suitable and continuously-updated DInSAR analyses.
In this work, the LOS deformation time-series of the Shanghai coastal area, recovered by applying the small baseline subset (SBAS) algorithm to the two sets of COSMO-SkyMed (descending passages) and Sentinel-1A (ascending passages) data, have been combined to retrieve the up-down and the east-west components of deformation from 26 February 2015 to 4 March 2016. To this aim, the MinA technique [19] is applied. The main objectives of our investigation are: (i) to confirm, with experimental data, that the deformation of ocean-reclaimed platforms is mostly vertical; (ii) to corroborate the validity of some of the forecasting deformation models in [29,33], which are useful for the evaluation of the risk due to possible inundations of the highly-urbanized coastal area; (iii) to investigate the displacement signals that affect the public facilities of the Pudong International Airport. The presented results demonstrate the ocean-reclaimed land is actually subject to prevalent up-down movements (with a maximum subsidence rate of 30 mm/year), with the exception of some isolated areas, just in the proximity of the coastline, characterized by maximum lateral east-west deformation rates of 10 mm/year during the 2015–2016 observation period.
2. Study Area
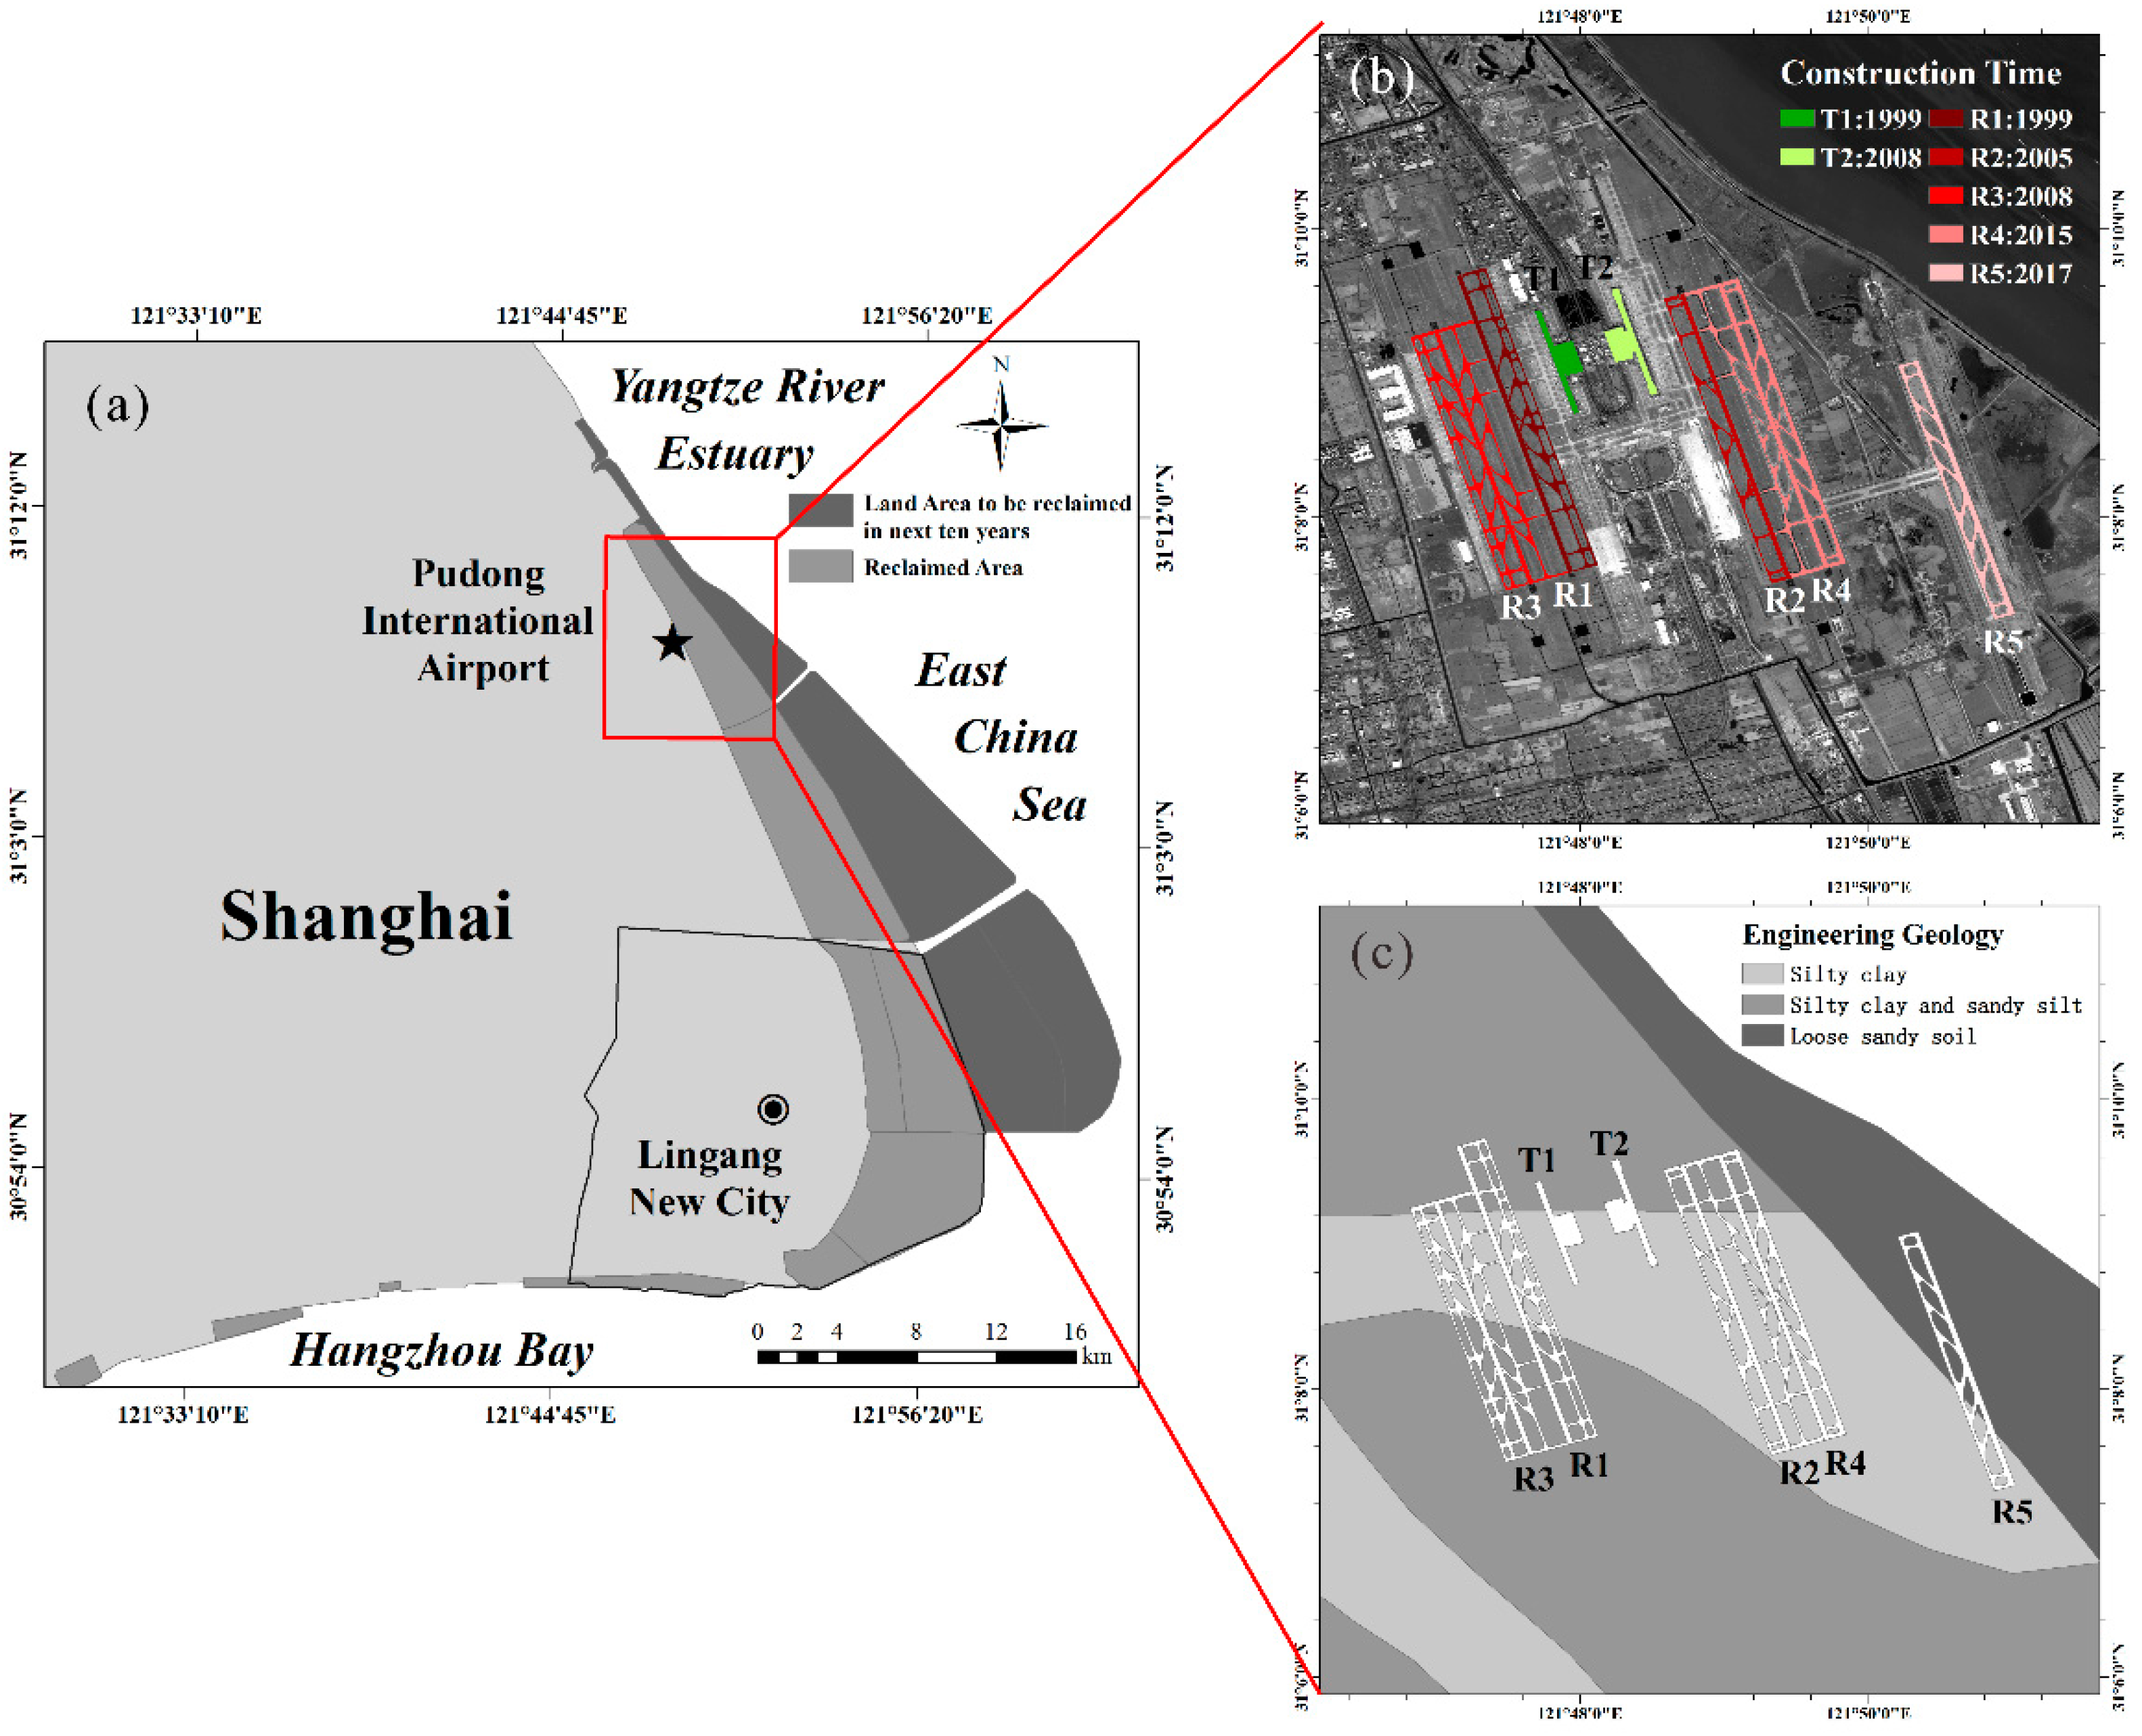
Shanghai is located at the midpoint of the north-south coastline of China on the alluvial plain of the Yangtze River Delta. The megacity is bound in the north by the Yangtze River estuary, to the east by the East China Sea, and to the south by Hangzhou Bay, see Figure 1a. The land area covers about 6000 km2 and is mostly flat, with altitudes ranging between 2 and 6 m above sea level. Under the combined influences of the Yangtze River runoff and tidal currents, large amounts of sediments have been deposited in this region, forming a large intertidal area. In order to alleviate the shortage of land resources caused by urban development, a large area has been reclaimed since 1950. Up to now, the new land formed by the reclamation project has reached up to 175 km2, mainly including Lingang New City and Pudong International Airport, see Figure 1a,b. Furthermore, in the near future, more new land will be reclaimed in the eastern coastal area to make room for new buildings and public infrastructures.
Of particular interest for our study is the area of the Pudong International Airport, which is one of the most important airports in China. It is located in the eastern sector of the metropolitan area of Shanghai. More than 60 million passengers traveled through the airport in 2016 and it is expected the airport will handle 80 million passengers in 2025. The first phase of the airport construction began in 1997. It was opened to the public in 1999, replacing Shanghai Hongqiao International Airport as Shanghai's international airport. The first runway, located in the western half of the airport, was part of the first construction phase and has been in use since 1999. In 2005, the second runway was constructed and opened. The second round of expansion, including a second terminal and the third runway, also began in 2005 and started operation in 2008 for the Bejing 2008 Summer Olympics. A new round of expansion—including land reclamation, the fourth runway, and the fifth runway—was approved in 2011, and the fourth and fifth runways were completed in 2015 and 2017, respectively. The location of the five runways, which are represented with different colors representing their different construction times, are shown in Figure 1b. In terms of traffic, the new expansion will make the airport become one of the world's top three, after its completion in 2019. The airport is built on the tidal flats of the south bank of the Yangtze River estuary. The western region of the airport is composed of natural sediments, distributed sandy silt, and silty clay [39,40]. The eastern part of the airport is an artificial foundation, which is filled with loose sandy soil (see Figure 1c). Affected by land reclamation and the filling soil properties, obvious ground deformation phenomenon will inevitably occur. Previous studies [38,39] have shown that there are paleo-rivers within the airport region, and the foundation of the area around these paleo-rivers is more unstable than the other regions, which could intensify ground deformations.
3. Data and Methods
3.1. SAR Data
Our investigation relies on the use of two independent SAR datasets collected over the coast of Shanghai by the COSMO-SkyMed (CSK) and Sentinel-1A (S1-A) sensors constellations, respectively. The CSK dataset consists of 61 SAR scenes (descending passes, HH polarization, with a side-looking angle of about 29° and a satellite heading angle of about 198°) collected from 7 December 2013 to 18 March 2016. The second dataset, acquired through the Sentinel-1A mission from 26 February 2015 to 4 April 2017, consists of 33 SAR scenes (ascending passes, VV polarization, with a side-looking angle of about 39° and a satellite heading angle of about 348°). Sentinel-1A data were available in the single-look-complex (SLC) format and acquired through the interferometric wide swath (IW) mode by employing the terrain observation by progressive scans (TOPS) acquisition mode [41], which provides large swath widths of 250 km at ground resolutions of 5 m × 20 m. The full lists of CSK and S1-A SAR data used are included in Table S1 and Table S2 of the Supplementary Material.
3.2. SAR Data Processing
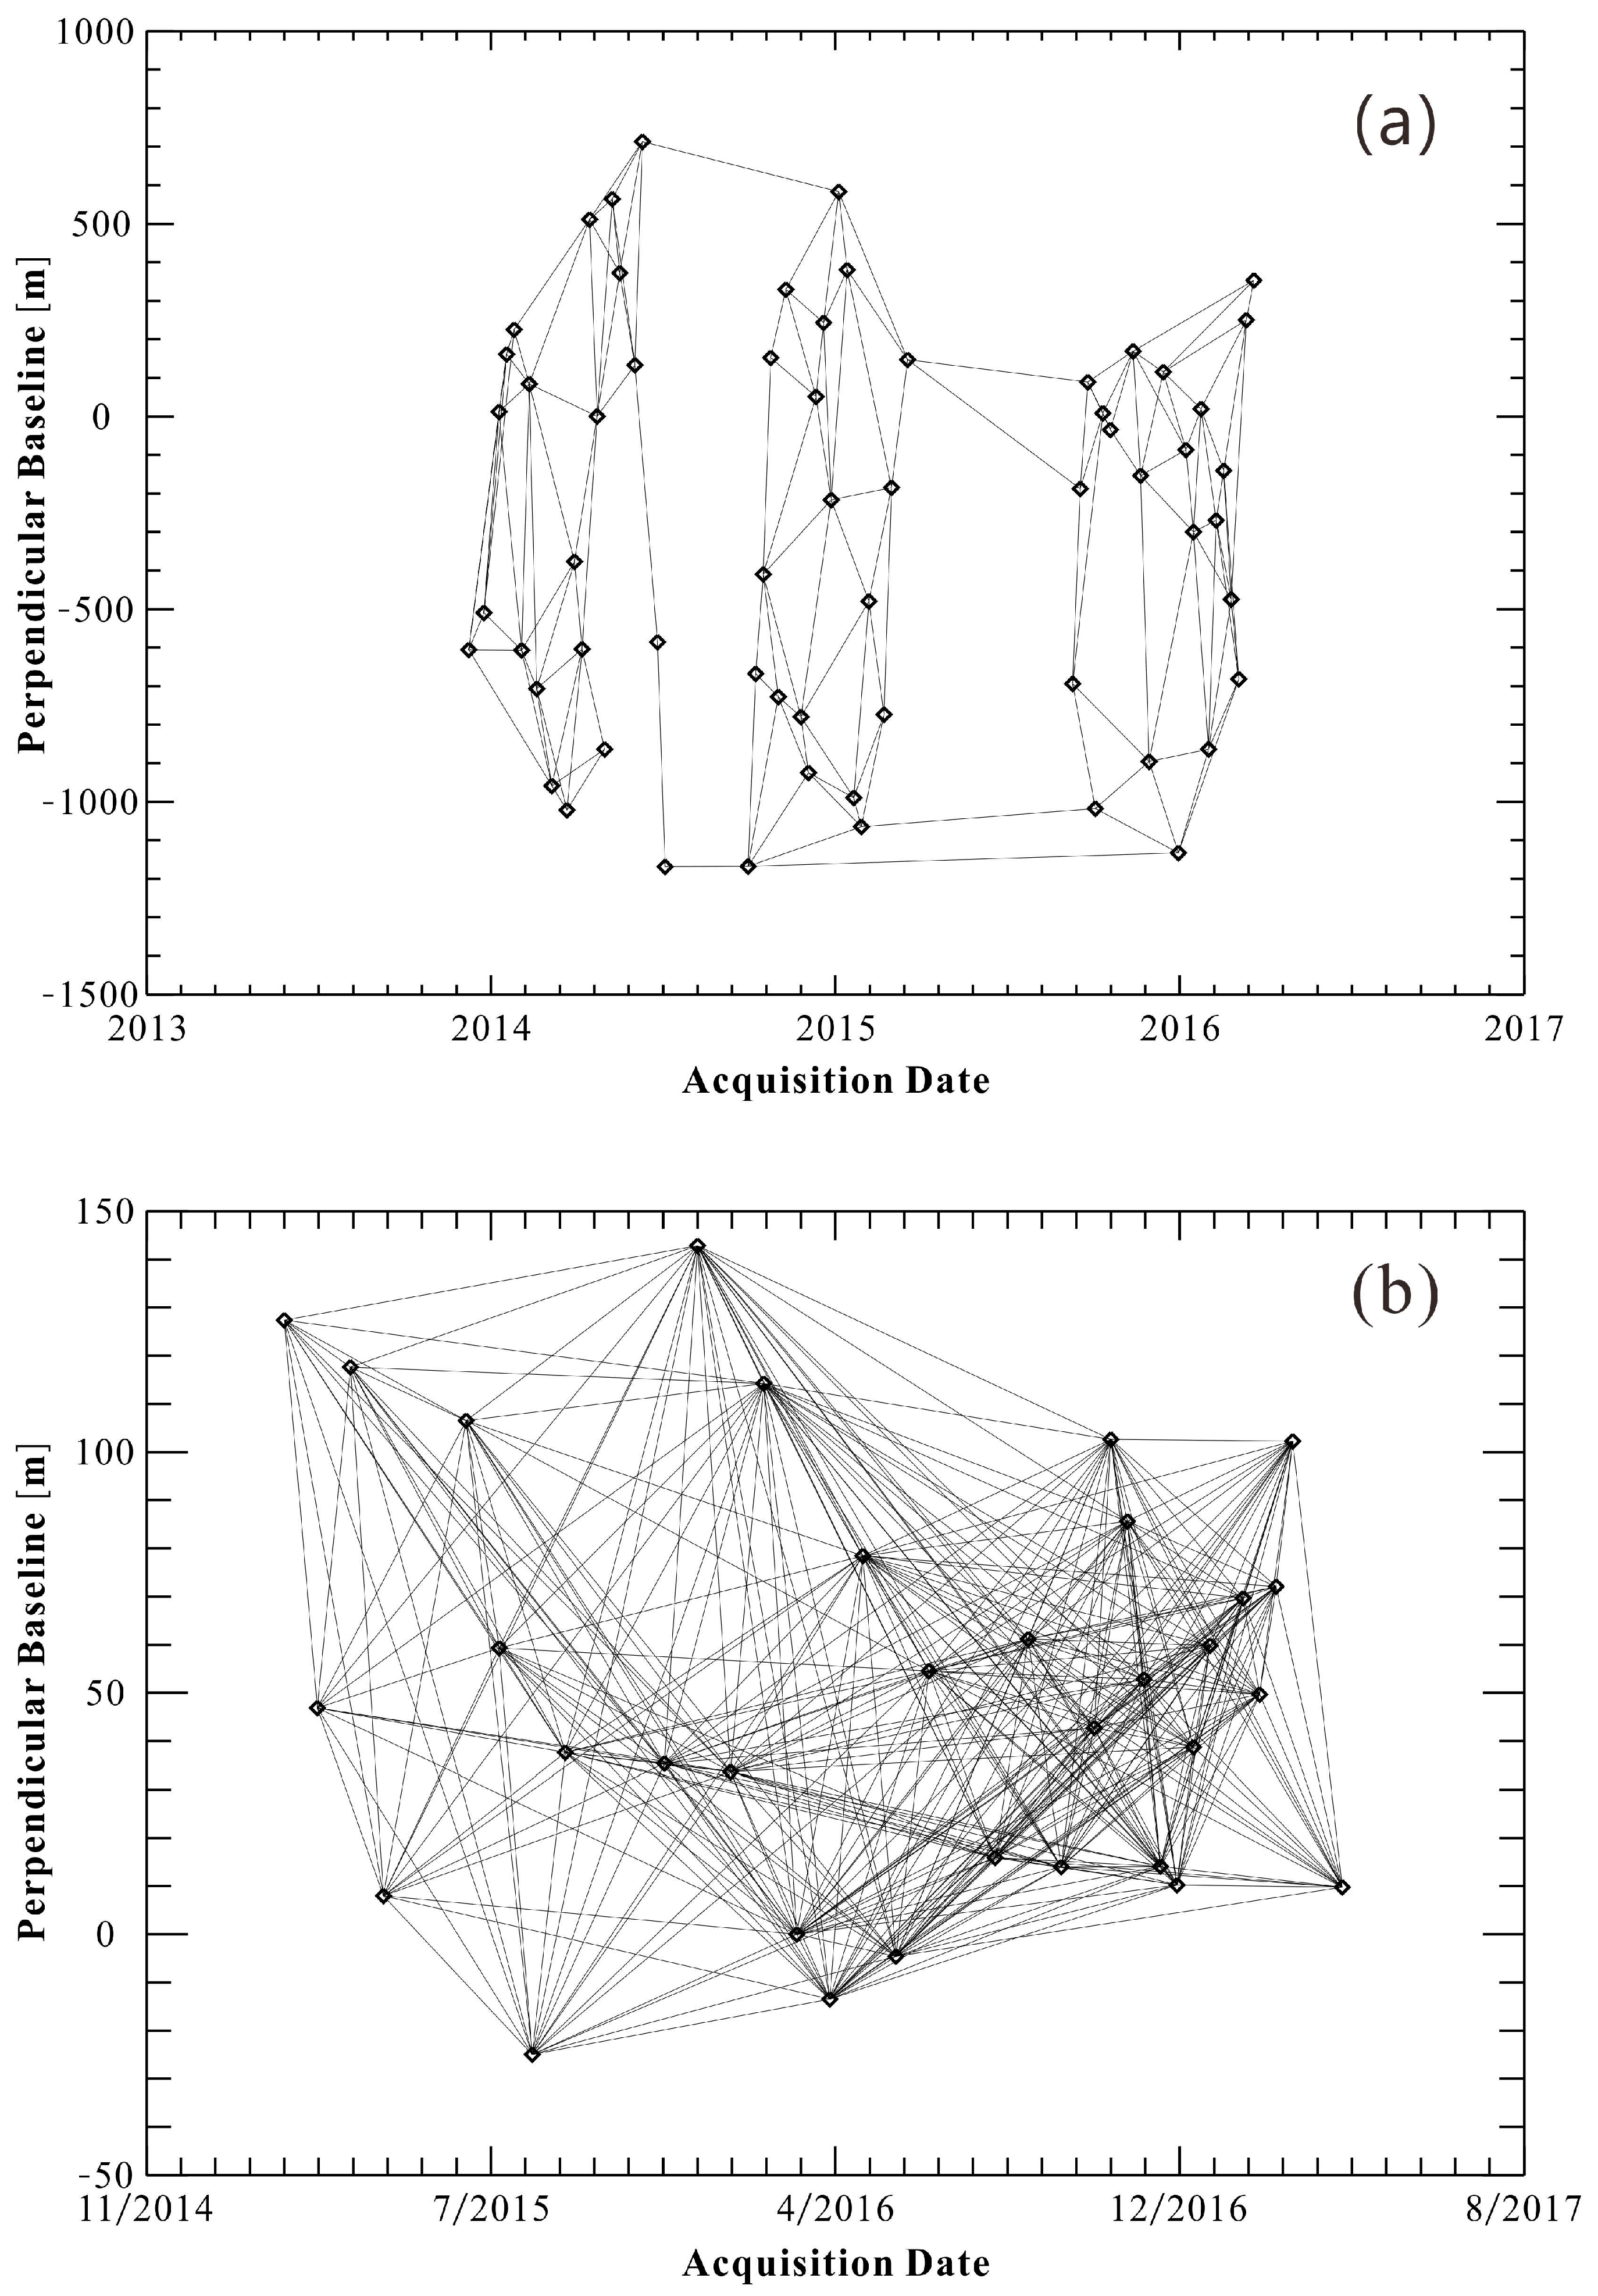
The two SAR datasets were independently processed by employing the multi-pass small baseline subset algorithm (SBAS) [6]. More precisely, CSK data were elaborated using the in-house SBAS processing chain developed at the Italian National Council Research laboratory [42], and the Sentinel-1A data were processed by the SBAS toolbox implemented within the commercial ENVI’s SARScape modules from EXELIS VIS Information Solutions [43]. It is worth noting that the potential use of different DInSAR tools for the retrieval of LOS deformation measurements represents a key issue of the applied MinA technique. SBAS is a well-established technique that allows the detection of the temporal evolution of Earth’s surface deformation by generating mean LOS velocity maps as well as LOS displacement time-series. In particular, SBAS is based on the use of multiple-master multilook interferograms [44] generated after a proper selection of Small Baseline (SB) SAR data pairs. LOS displacement time-series are computed by solving a least-squares (LS) minimization problem, based on the application of the singular value decomposition (SVD) method [45], to the sequence of unwrapped multilook interferograms. The SBAS approach also includes a filtering operation for the atmospheric phase components [4,6]. Interested readers can find additional details on SBAS and its inherent implementation within InSAR processing tools in [6,46]. Starting with available CSK and S1-A SAR data, two groups of small baseline (SB) interferometric SAR data pairs were first selected, and the relevant sequences of SB interferograms were subsequently generated. The distribution of available SAR acquisitions in the temporal/perpendicular baseline plane as well as the selected SB interferometric SAR data pairs are depicted in Figure 2.
Therefore, for each detected coherent pixel, the sensor line-of-sight (LOS) displacement time-series were recovered in correspondence to detected coherent pixels (in radar coordinates) for the CSK and S1-A datasets, separately. Obtained LOS displacement time-series were then combined as described in Section 3.3 to recover the east-west and up-down time-series of deformation relevant to coherent distributed scatterers (DS) on the ground.
3.3. Multiple-Satellite Combination Technique for the Retrieval of 2D Displacement Time-Series
In this subsection, we summarize the basic rationale of the MinA multiple-satellite DInSAR combination technique [19]. As described earlier, after the application of the SBAS technique, the LOS-projected deformation time-series are recovered. LOS measurement products are originally provided in the native radar coordinate grids of both datasets. Accordingly, in order to properly combine the LOS displacement products, so as to discriminate the 2D components of deformation (with respect to the up-down and east-west directions, respectively), the measurements have to be preliminarily referred to a common geocoded grid by applying geocoding operations [47]. Since the sensitivity of LOS measurement to north-south projection is very weak, hereinafter, we present a modified version of the MinA algorithm, which focuses exclusively on the discrimination of the 2D (i.e., up-down and east-west) components of deformation, by completely neglecting the presence of a deformation component along the north-south direction.
To introduce the right mathematical framework, let us refer to the simple case that only two independent sets of multi-orbits SAR data (i.e., in our case the CSK and the S1-A one) are available (this is the case in the Shanghai case study). Let us assume that SAR data are collected at the ordered times and , respectively. Let be the whole set of ordered time acquisitions, and assume that a suitable time overlap between the two SAR datasets is present. Notice that time-overlap between the two datasets is a fundamental requirement of any multiple-orbit combination algorithm. To accomplish this issue, a preliminary operation step that identifies the overlapping time-period and extracts the LOS time-series over the overlapped time is required (see the experimental Section 4). To describe how the algorithm works, let us suppose for the sake of simplicity, that only two different SAR sensors are available and and are properly time-overlapped. Moreover, for the sake of simplicity, let us also assume that the first dataset is acquired through ascending passes and the second through descending passes. Henceforth, let and be the geocoded LOS time-series computed in correspondence to the generic homologous pixel P.
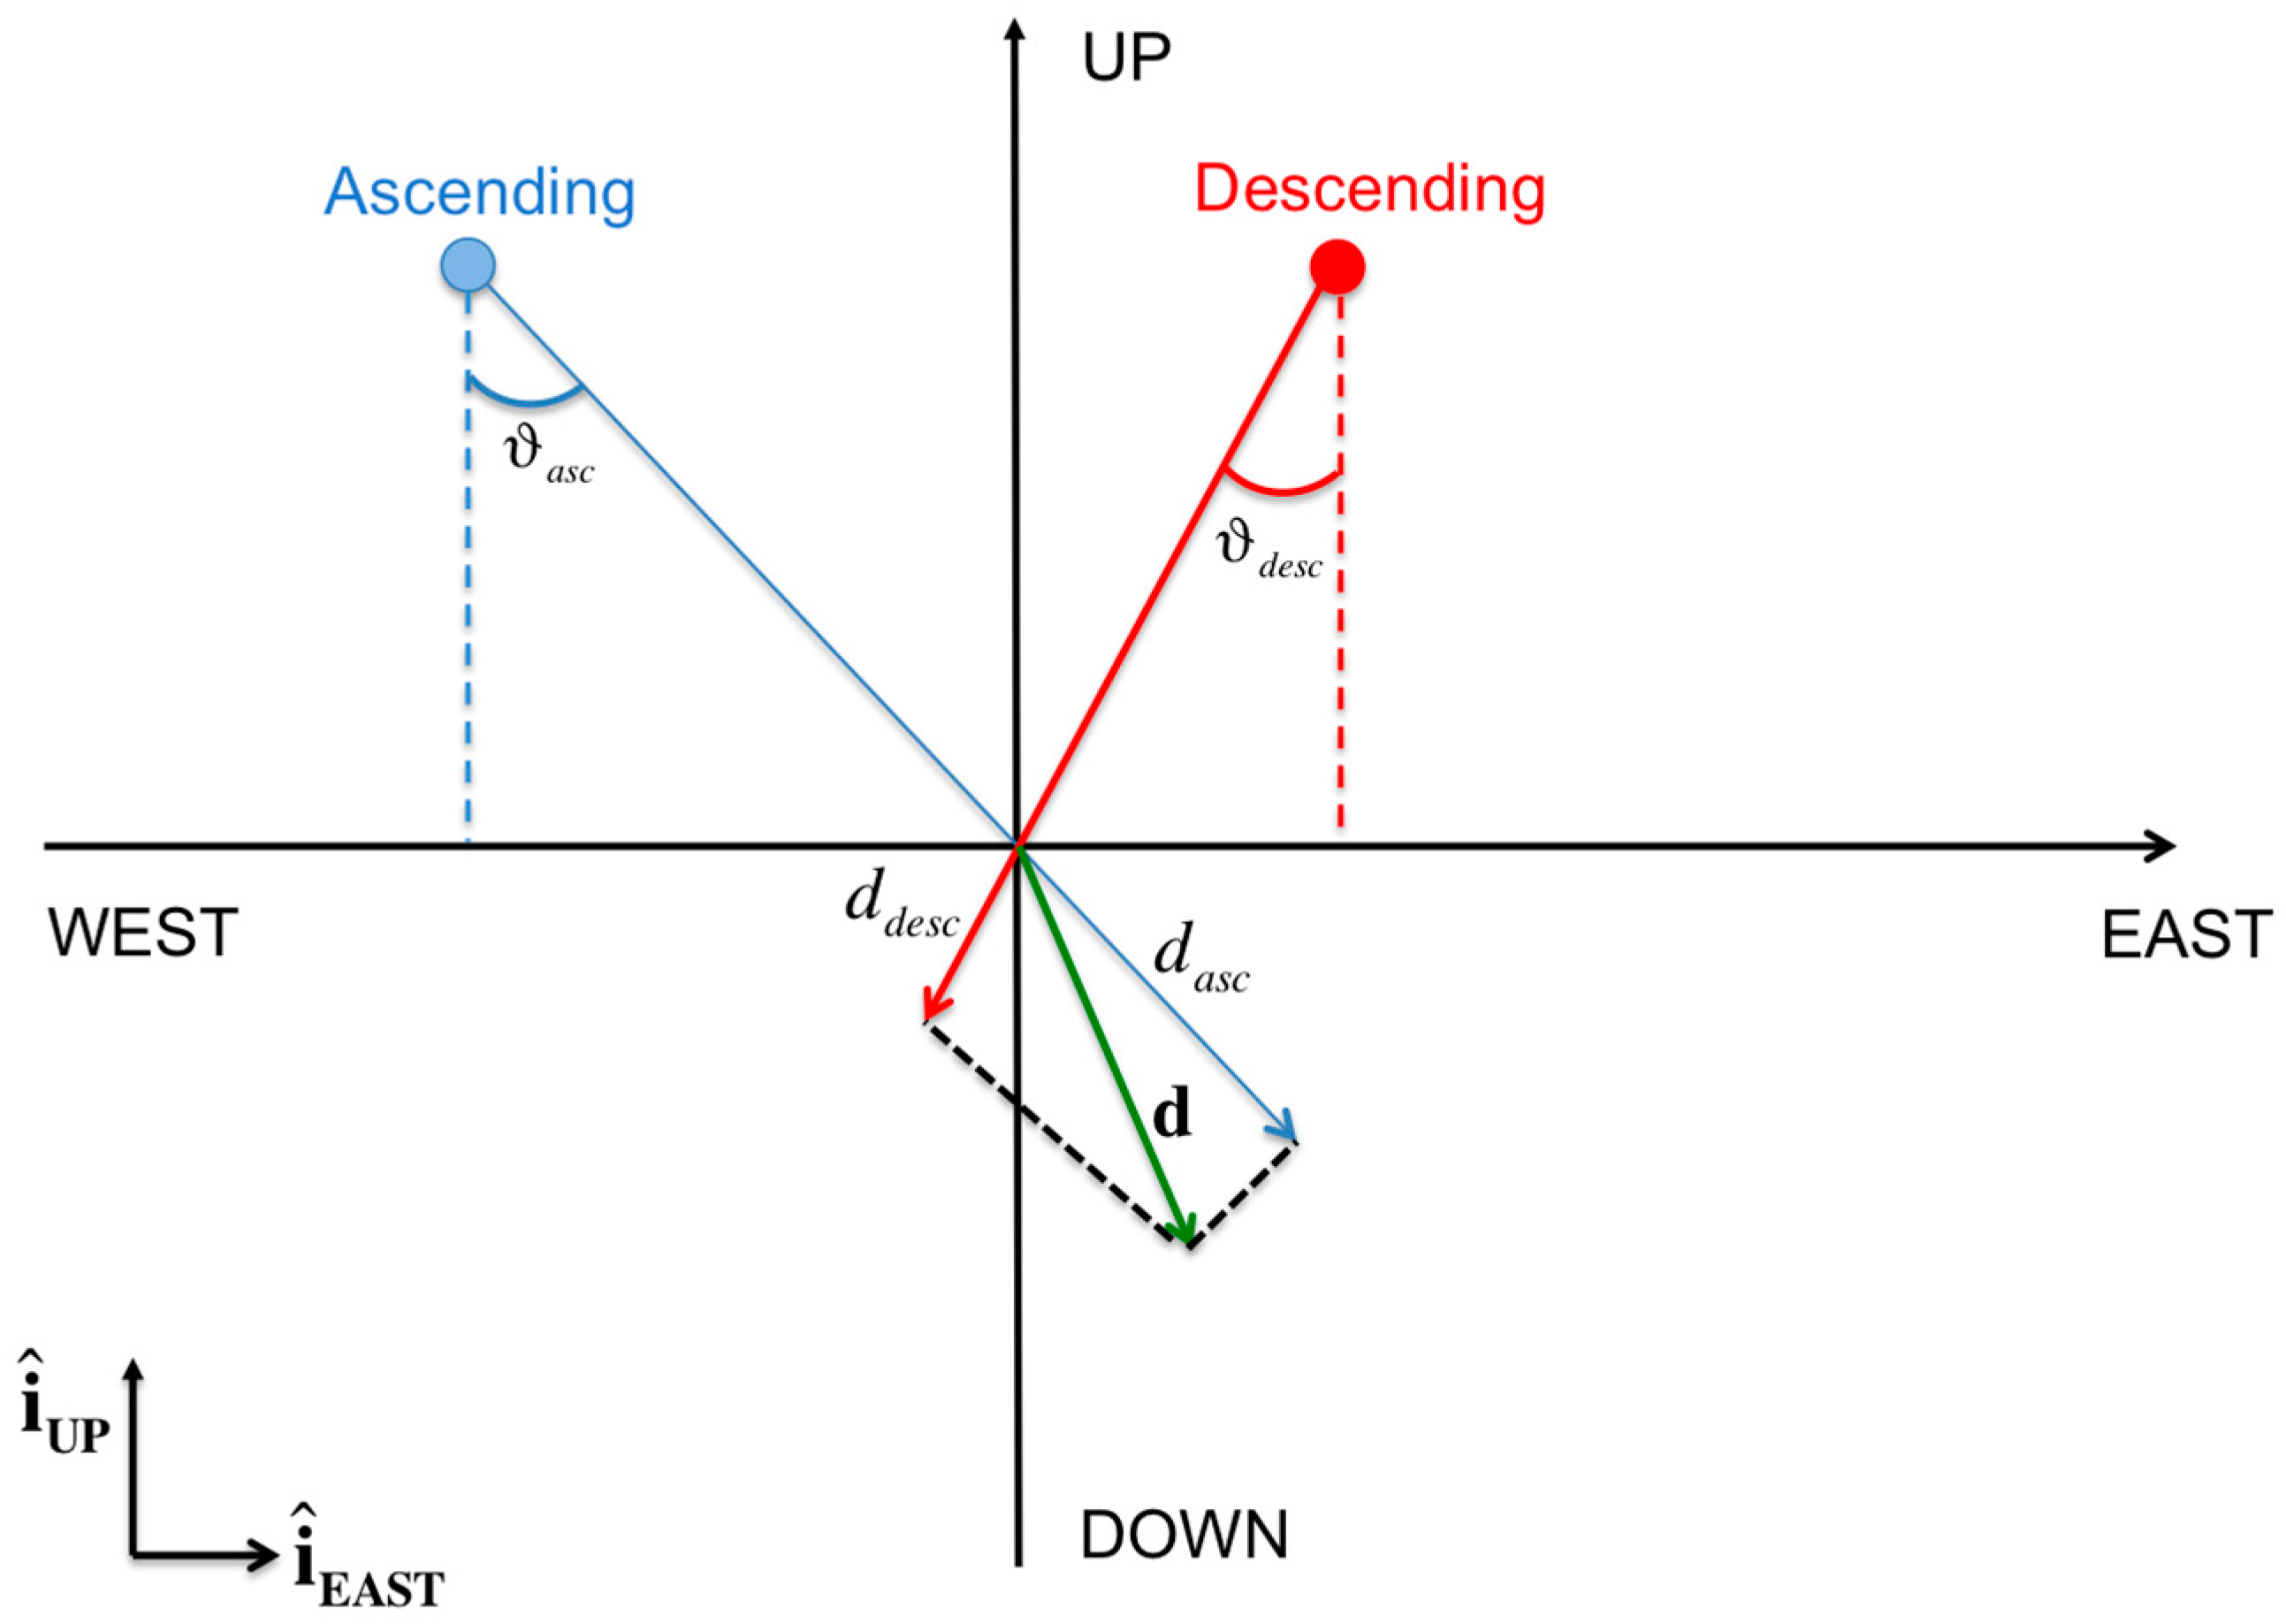
Let us start by relating the LOS measurements collected over ascending and descending orbits, namely and , to the inherent 2D displacement components with respect to up-down and east-west directions. Taking into account the acquisition geometry [19,28] of the ascending and descending passes depicted in Figure 3, it is easy to prove the validity of the following equations:
with and being the incidence angles of the electromagnetic waves on the ground for the ascending and descending data tracks, respectively. Note that and are the versors for the ascending and descending line-of-sight directions. In order to retrieve the time-series of the east-west and up-down components, the available LOS time-series through ascending and descending passes are hence jointly exploited. In particular, the relative LOS displacement at the generic time calculated with respect to the first acquisition time of the relevant SAR dataset , that is , is first extracted from the available ascending and descending LOS time-series. Subsequently, it is related to the unknown east-west and up-down velocity components, namely and , between the available adjacent acquisition times (related to the whole set ), following the lines described in [19]. As a result, a system of linear equations with respect to unknowns is obtained, which can be expressed using matrix formalism as:
where B is the incidence-like matrix of the adopted linear transformation, which is defined taking into account Equation (1) as follows:
with being the matrixes related to the linear transformation from LOS displacements to velocity deformation rates (see [6,7,8,9,10,11,12,13,14,15,16,17,18,19] for additional details).
The system of Equation (2) is undetermined; thus it does not admit a unique solution. The strategy adopted by the MinA technique is to introduce additional equations imposing that the (combined) East-West and Up-Down deformation components are with minimum acceleration. That is to say that the difference of velocity between consecutive time intervals of the whole set of ordered times T is minimal.
This can be mathematically expressed as follows:
where is a regularization factor used to balance the relative weight of the minimum acceleration constraints with respect to the minimization of the residual norm of the system in Equation (3).
Accordingly, the regularized system of equations becomes:
where C is the incidence-like matrix related to the linear transformation in Equation (4). The solution of the regularized problem in Equation (5) is, thus, eventually obtained in the least-squares (LS) sense. Once obtained, the Up-Down and East-West velocity vectors are integrated with respect to the time T by assuming deformation signals related to the overall first SAR acquisition at time are zero. As a quality index of the reconstruction, which takes mostly into account the congruence between obtained 2D displacement time-series and the original LOS measurements, the root mean square error (RMSE) of the residuals of the subsystem in Equation (3), namely , is calculated (see the experiments shown in Section 4), with and . Once the velocity estimates are obtained, the relevant 2D displacement time-series are simply recovered by time-integration. A comprehensive description of the MinA algorithm, also including its extension for the retrieval of the north-south displacement components, as well as for the integration of additional measurements (e.g., pixel-offset-driven measurements recovered from sequences of amplitude SAR images [48]), can be found in [19].
4. Experimental Results
In this section, we present the experiments performed for detecting and characterizing the deformation phenomena that occur in the coastal area of Shanghai by combining CSK and S1-A displacement time-series.
4.1. SBAS Analysis
We applied the SBAS algorithm to the available CSK and S1-A SAR datasets shown in Section 3.1. For the CSK datasets, a group of 155 InSAR data pairs were selected by imposing constraints on the maximum spatial and temporal baseline separation between orbits, which have been set, in this case, to 800 m and 1000 days, respectively. Concerning the S1-A dataset, a group of 368 InSAR data pairs were selected. As evidenced by the distribution of S1-A SAR images in the temporal/perpendicular baseline plane, which is shown in Figure 2, the S1-A system is characterized by a very short orbital tube, with a nominal diameter of about 200 m, i.e., much smaller than the relevant critical baseline value [44]. Therefore, S1-A InSAR data pairs were selected by simply imposing a temporal baseline less than one year. Differential interferograms were generated by computing the phase difference between the co-registered SAR image pairs, and by subtracting the relevant topographic phase contributions, as synthesized using the Shuttle Radar Topography Mission (SRTM) digital elevation model (DEM) (with a spatial sampling of 90 × 90 m) and the Advanced Spaceborne Thermal Emission and Reflection Radiometer (ASTER) DEM (30 × 30 m) of the area, for the CSK and the S1-A SAR datasets, respectively. To mitigate the effects of decorrelation noise into the generated interferograms, we also conducted a complex multi-look operation (with 30 looks in the azimuth and 30 looks in the range direction for the CSK dataset, and five looks in the azimuth and 20 looks in the range direction for the S1-A dataset) [41], so as to end up with a radar pixel spacing for both SAR datasets of about 100 × 100 m. The differential interferograms were noise-filtered [45,49], and the relevant spatial coherence maps were generated.
By inspecting the generated maps of spatial coherence, the group of coherent pixels common to all interferograms was identified, and the subsequent phase unwrapping steps [50] were eventually performed on this sparse grid of coherent pixels. By applying the SBAS technique, the relevant CSK and S1-A LOS-projected displacement time-series were recovered.
Since the LOS measurements related to each SAR dataset correspond to different radar pixel coordinates, the CSK and S1-A data products were resampled to a common geocoded grid, so that the subsequent InSAR combination technique could be applied to the CSK and S1-A SBAS displacement time-series relevant to homologous ground targets. Maps showing the LOS-projected mean displacement velocities for both datasets, superimposed on a Landsat image of the investigated area, are shown in Figure 4. LOS displacement values are calibrated with respect to a common reference point (its location is identified by the red star shown in Figure 4), whose deformation is assumed zero. To ensure reliable results, we only displayed the deformation values relevant to highly-coherent targets on the ground, which have been selected for the CSK dataset by identifying the points characterized by a temporal coherence value [51] greater than 0.65, and for the S1-A dataset by showing only the pixels with an average spatial coherence greater than 0.55.
4.2. Two-Dimensional (2D) Deformation Time-Series Extraction
To retrieve the time-series of the two-dimensional (2D) surface displacement components, we firstly extracted from the achieved SBAS time-series the CSK and S1-A LOS displacement time-series related to the overlapped time periods (i.e., from 28 February 2015 to 18 March 2016 for the CSK dataset, and from 26 February 2015 to 4 March 2016 for the S1-A dataset). Then, we re-calculated the LOS mean deformation velocity and the corresponding time-series over the 2015–2016 overlapped time-periods (i.e., from 26 February 2015 to 4 March 2016). Maps of the 2015–2016 SBAS LOS mean deformation velocities as detected by processing the CSK and S1-A datasets are shown in Figure 5a,b, respectively. Extracted LOS displacement time-series were then combined by employing the MinA algorithm [19]. In particular, a regularization factor was used.
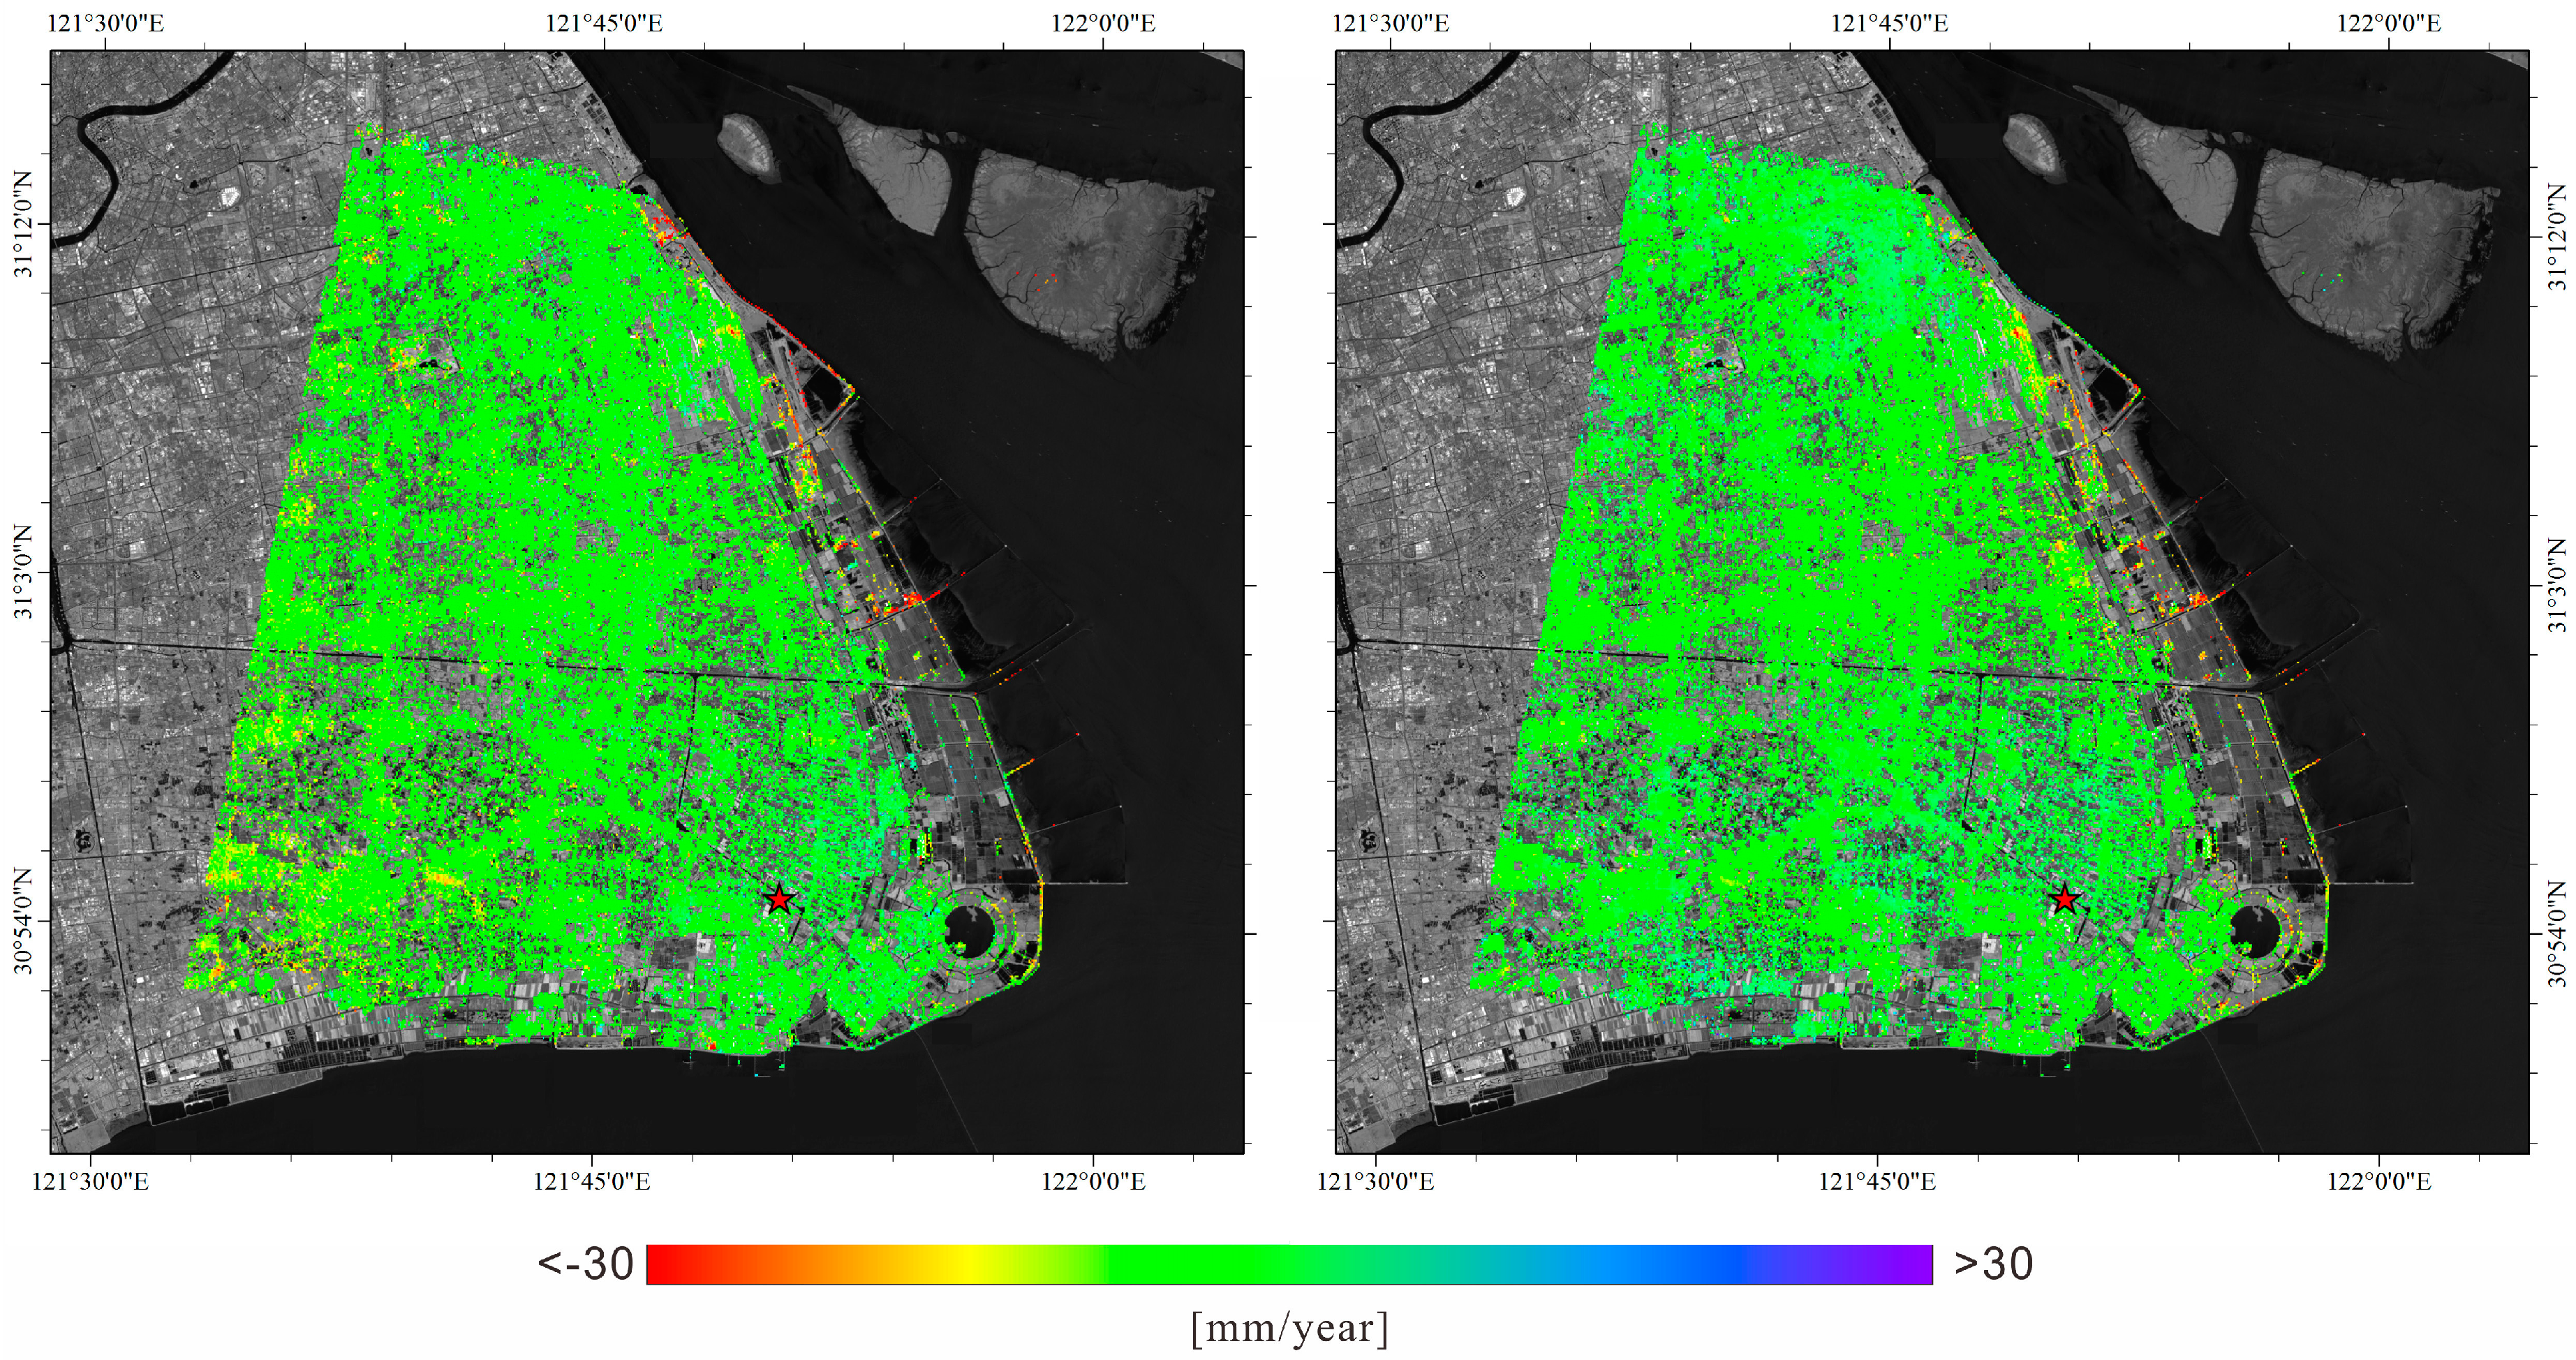
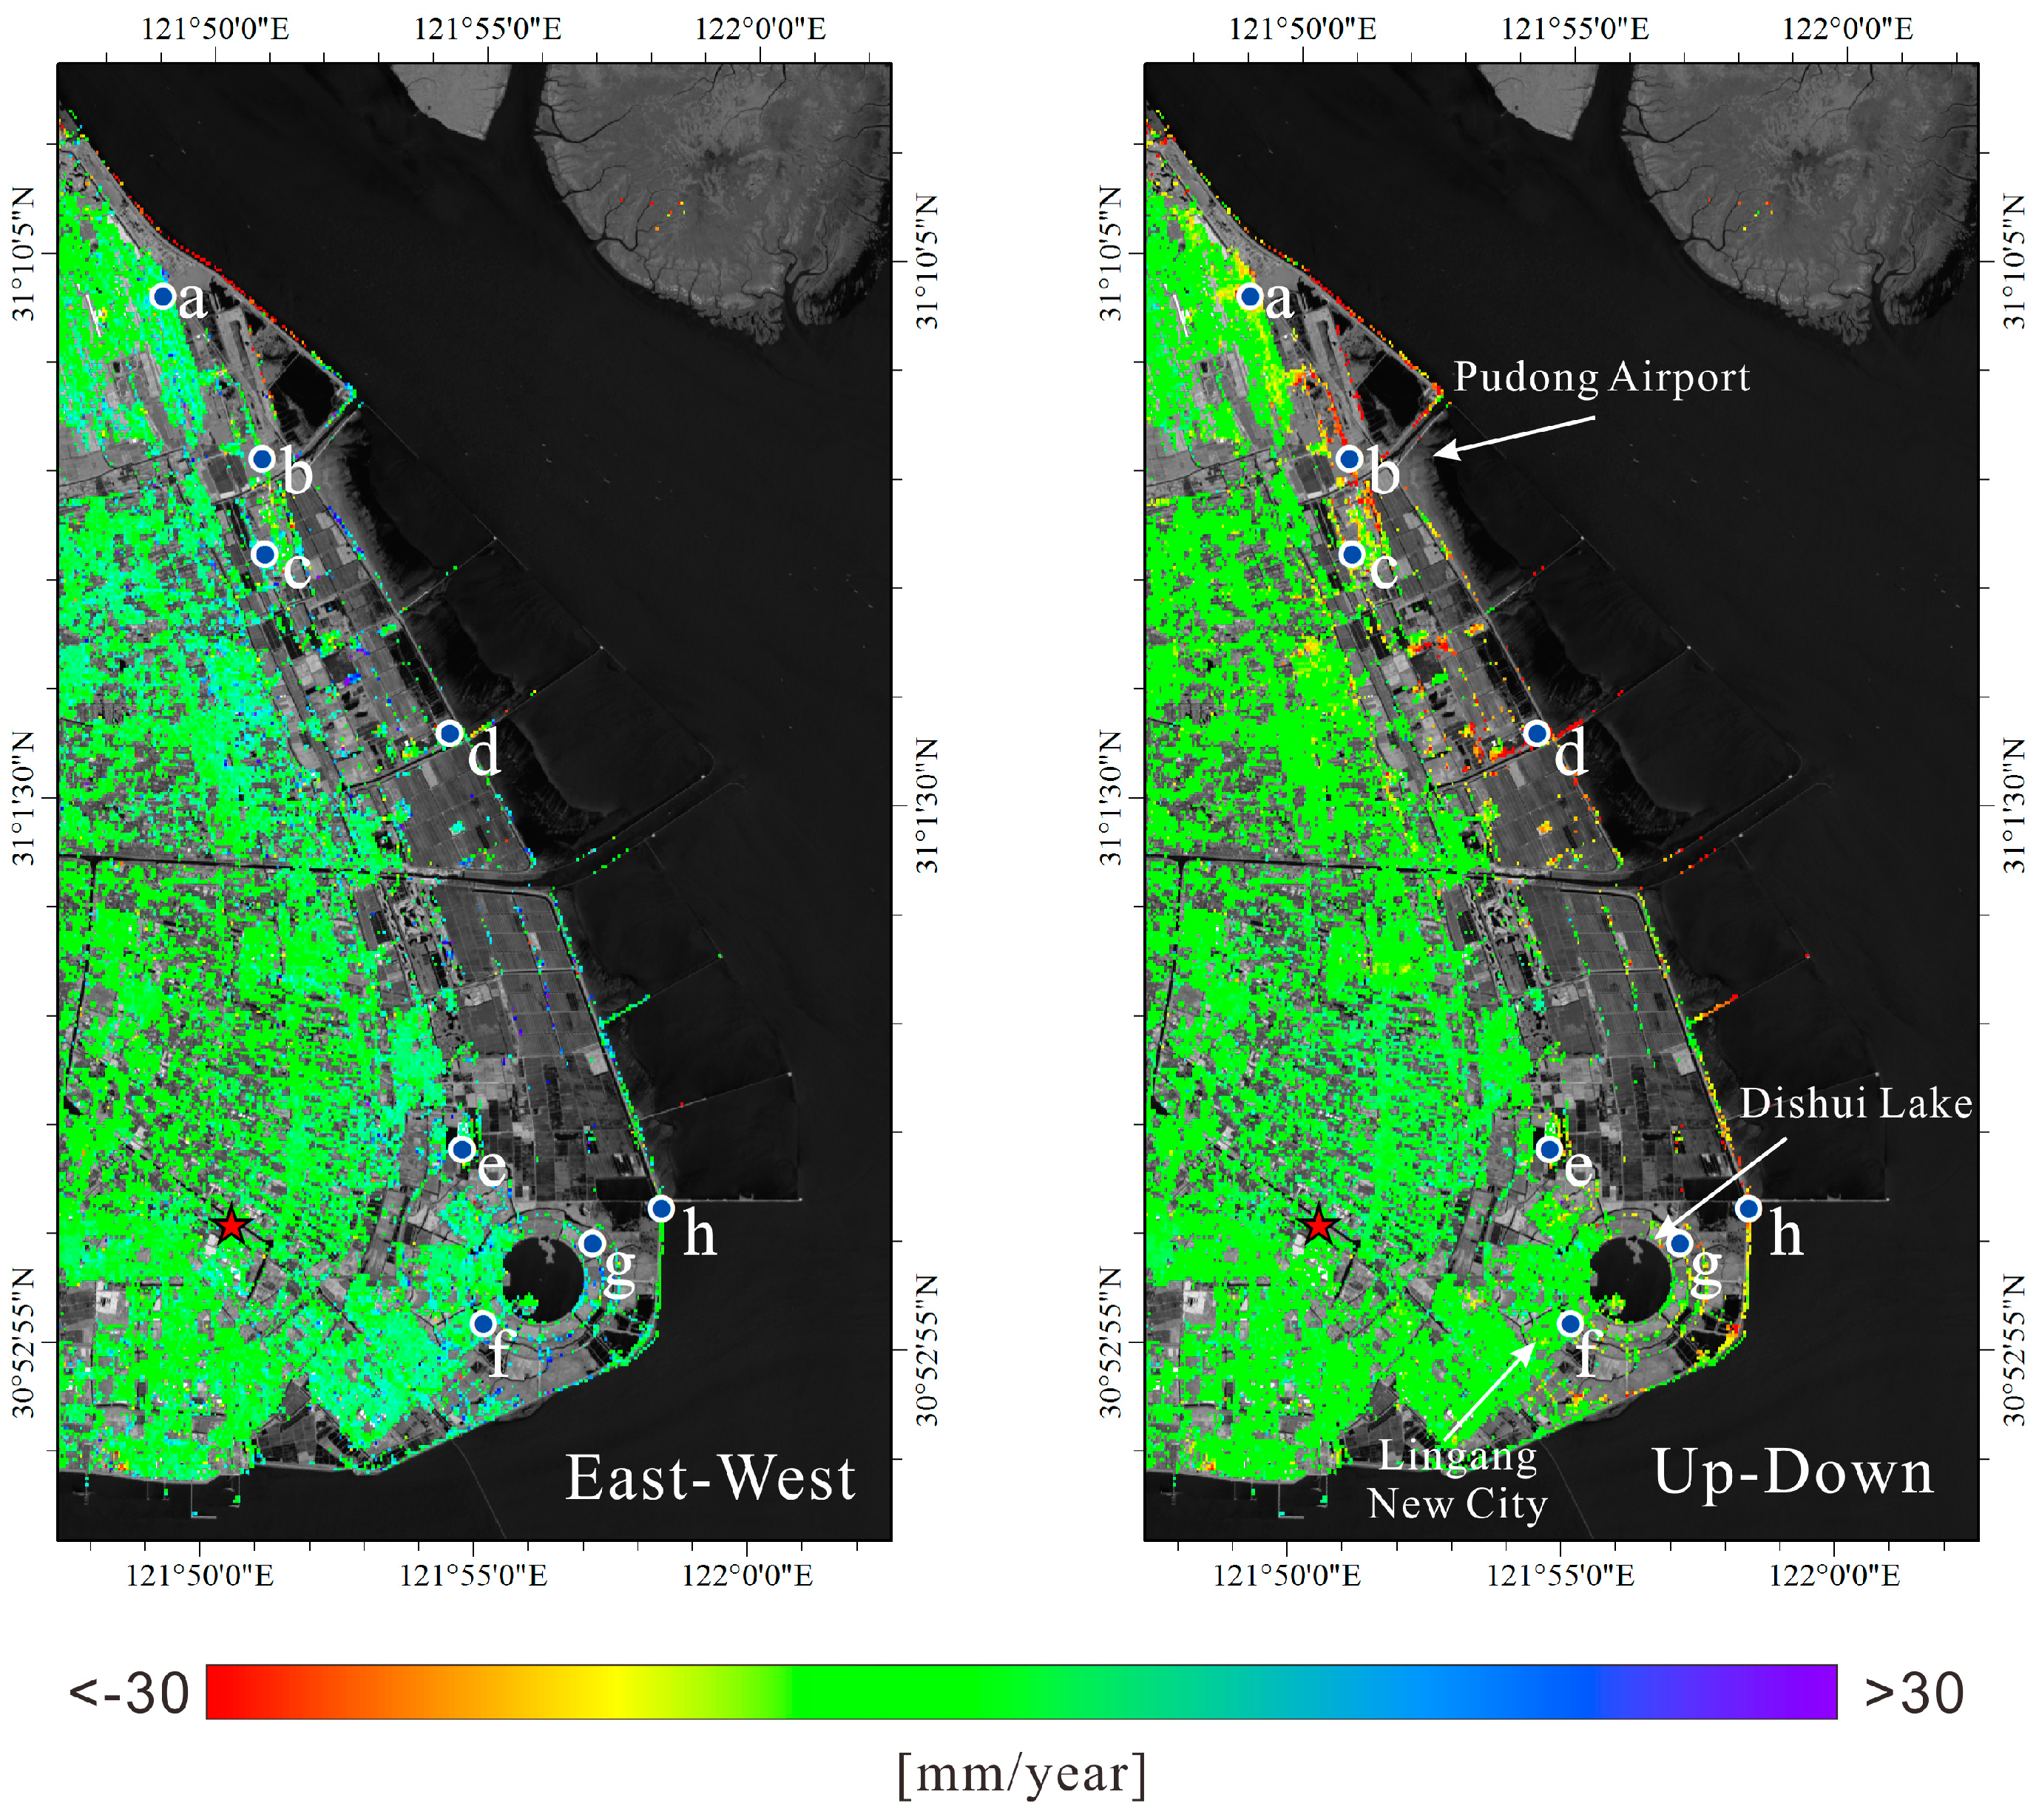
As a result, the east-west and up-down displacement time-series were recovered. Figure 6 portrays the maps of the 2D displacement velocity components. As evidenced, most of the Shanghai area was almost stable, with the only exception of the ocean-reclaimed platforms down the coast. This finding represents one the main achievements of our study, and, to the best of our knowledge, it represents the first direct evidence of the actual vertical movements of the ocean-reclaimed platforms documented through DInSAR-based approaches. Furthermore, in order to quantify the correctness of the achieved 2D InSAR products, we also produced, for each point of the common CSK/S1-A geocoded grid, the Root Mean Square Error (RMSE) of the residuals between the original LOS-projected displacement time-series and the ones reconstructed from the retrieved east-west and up-down time-series. The map of the RMSE is portrayed in Figure 7. A zoomed view of the east-west and up-down mean displacement maps over the reclaimed areas is shown in Figure 8.
5. Discussion
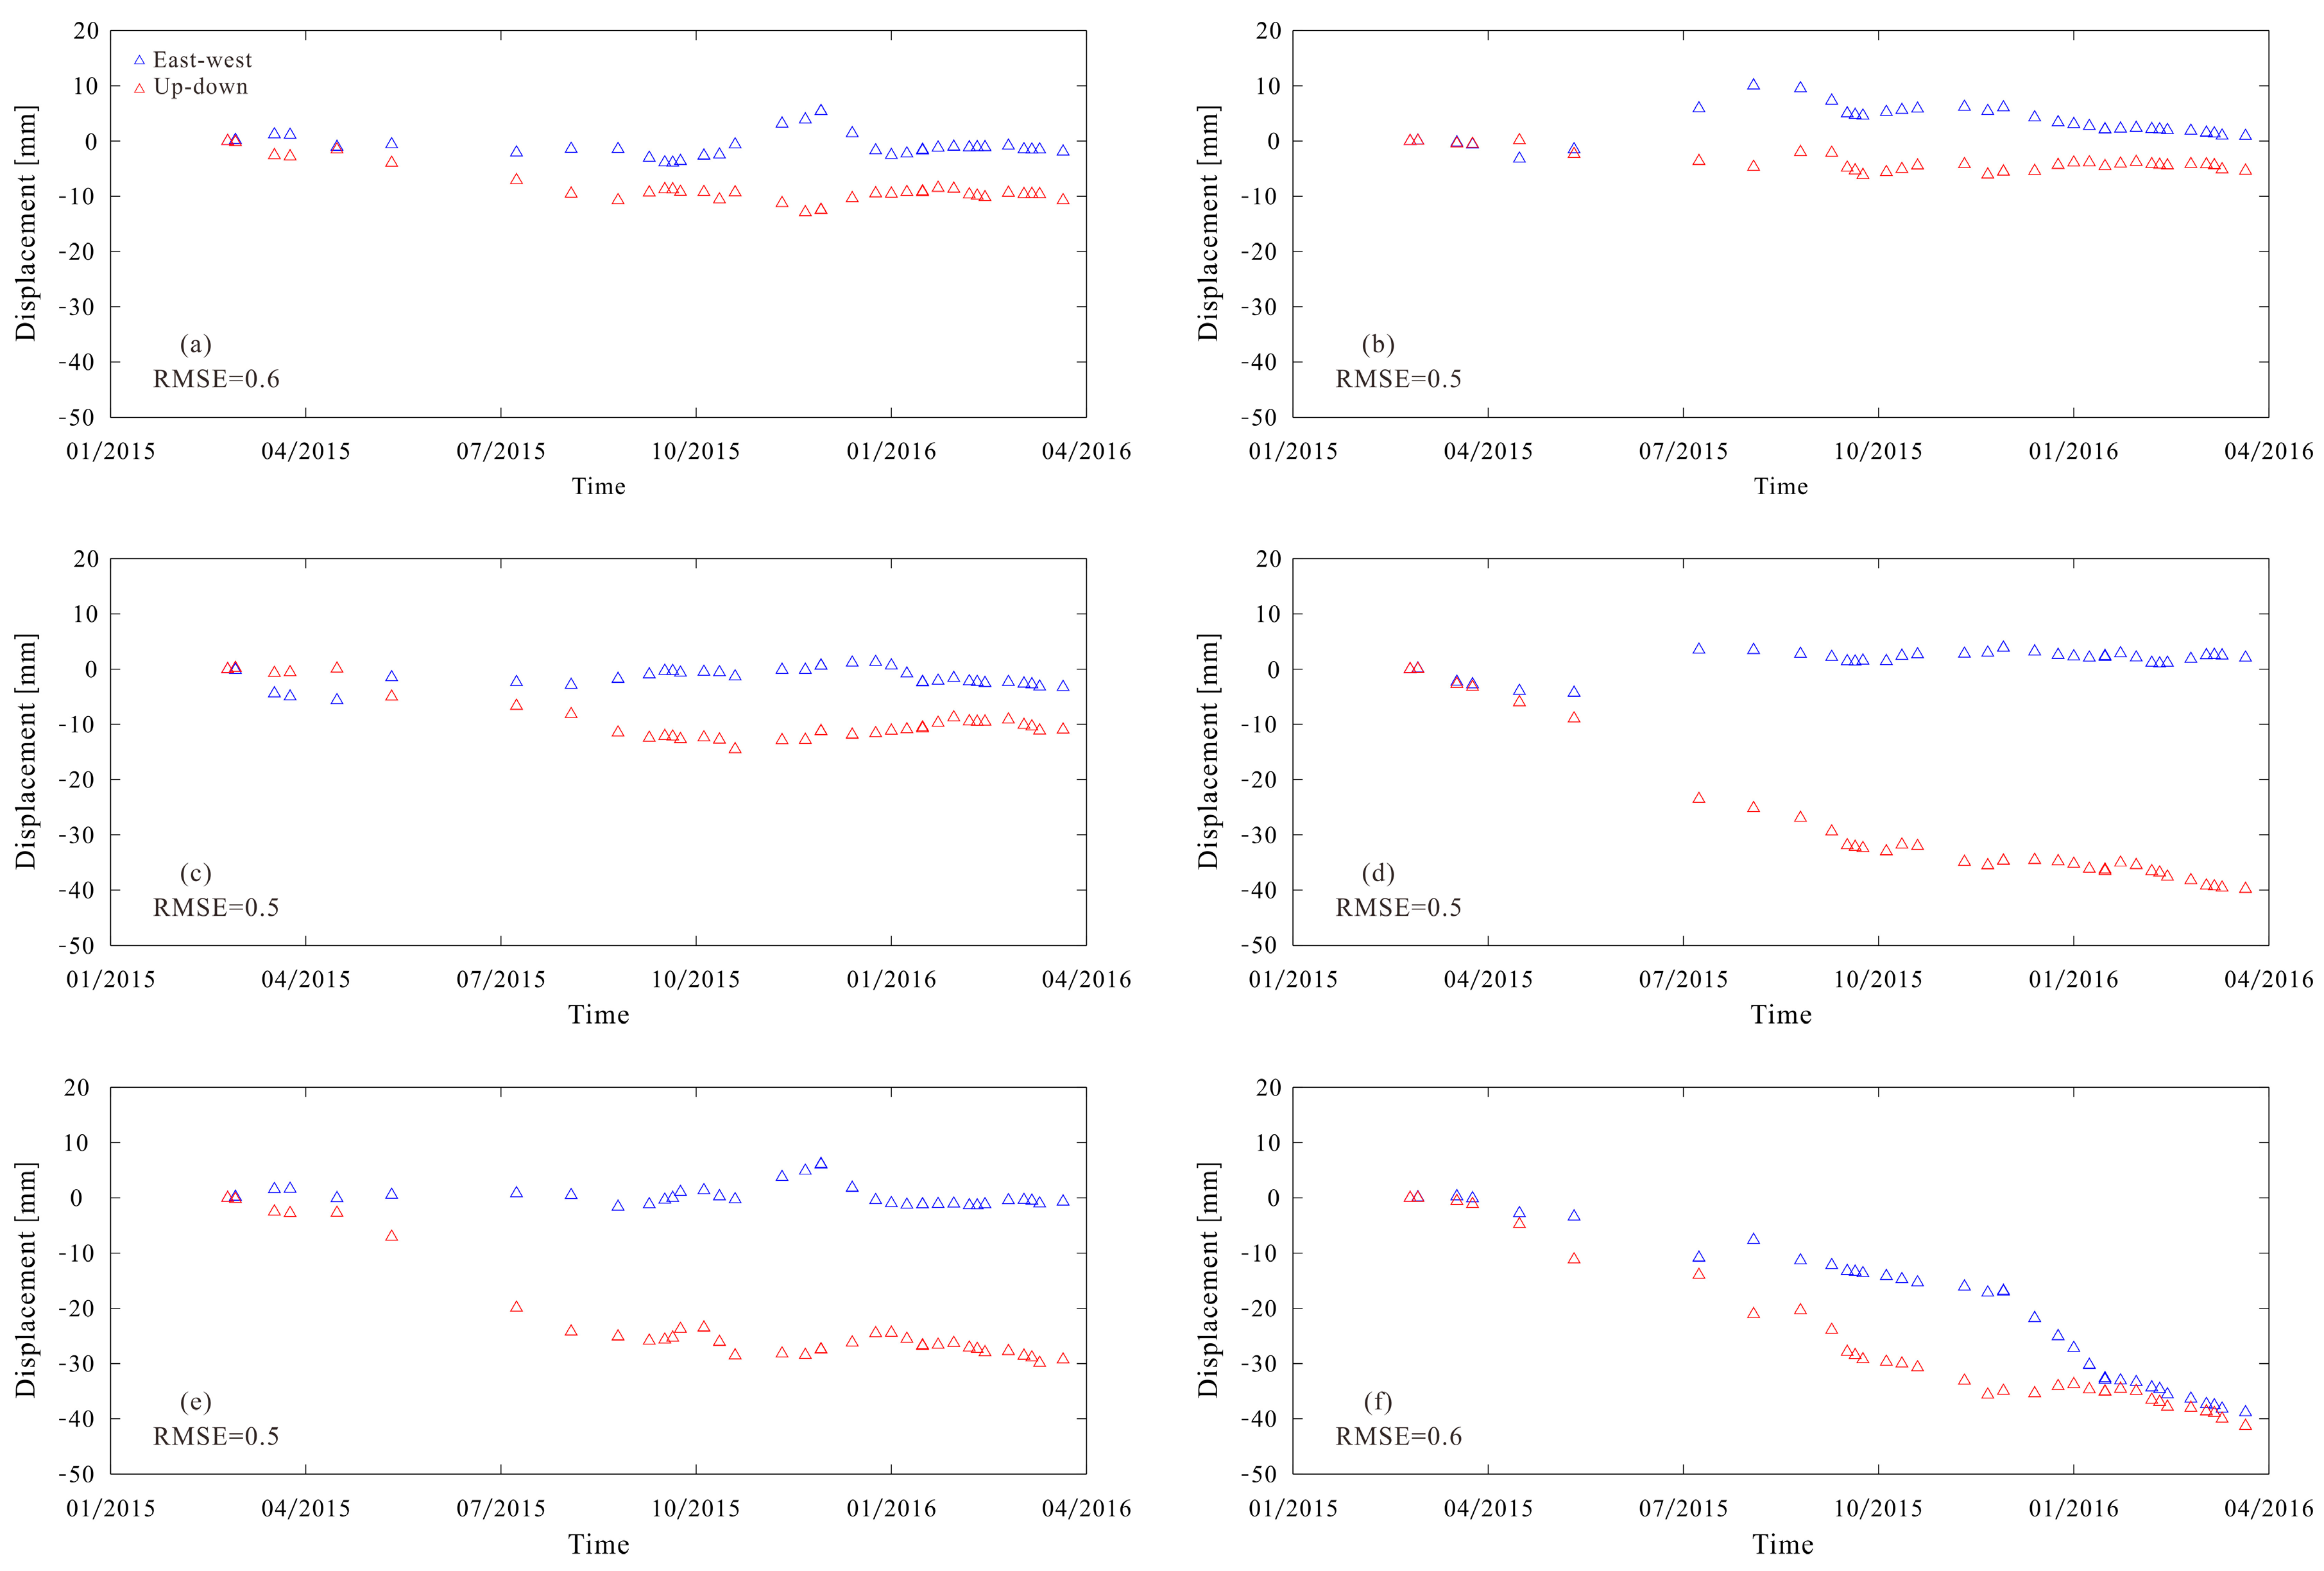
Let us now focus on the analysis of the achieved 2D displacement time-series. Figure 9 shows the plots of the east-west and up-down time-series of deformation relevant to eight selected pixels located along the coast. Pixels were selected among those with a low value of RMSE of the residuals between the original and the reconstructed LOS time-series (see Figure 7). The analysis of Figure 9 reveals that reconstructed east-west deformation signals over the ocean-reclaimed land are (on average) less prevalent with respect to the up-down deformation signals recorded in homologous locations. The detected vertical movements are the effects on the ground of the consolidation mechanisms of the soils used for the reclamation of land from the ocean, and have also been investigated in previous studies [28,32]. This outcome is in general agreement with the results of studies [27,31], based upon considerations of the geology of the area and on the mechanisms of soil consolidation in reclaiming land. A discussion on the deformation signals detected over the Lingang New City and the Pudong International Airport is provided in the following subsections.
5.1. Lingang New City
Lingang New City, near the Dishui Lake, is characterized by a quite unique deformation scenario. Its western sector, as already anticipated by previous studies [28,32], based on the use of ASAR/ENVISAT SAR data (from 2007 to 2010) and COSMO-SkyMed data (from 2014 to 2016), was almost stable from 2015 to 2016 with maximum up-down and east-west deformation rates of a few millimeters per year (see for instance the plots relevant to points (e) and (f) shown in Figure 9).
Conversely, the eastern sector of the city was still affected during the 2015–2016 period by significant up-down residual deformations, reaching along the coast values up to 25–30 mm/year (see the plots relevant to pixels (g) and (h) shown in Figure 9). This finding is in general agreement with the investigations performed in [28,32].
5.2. Pudong International Airport
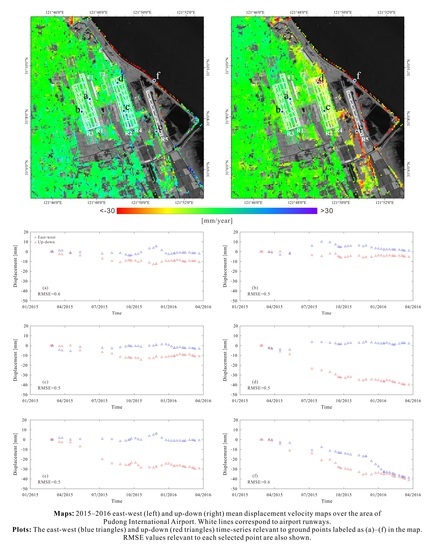
The achieved results, which are portrayed in Figure 10, reveal that actually most of the deformation affecting the airport is vertical (i.e., it is a subsiding area, as expected). In Figure 10, six points labeled (a–f) have also been selected as representative of the deformations of the zones where they are located. Relevant two-dimensional east-west and up-down deformation time-series are plotted in Figure 11. Our results complement and update the analyses presented in [31], based on processing—with a modified persistent scatters interferometry (PSI) technique—a set of high-resolution TerraSAR-X data satellite acquired from September 2011 to October 2012. With respect to [31] our updated results reveal that the soil consolidation process in correspondence to runway lines R1–R3 were still active in 2016, but with rates less than 10 mm/year, while the runway line R4, built over an area that was later reclaimed (starting from 2006), was severely affected by vertical residual subsidence deformations with rates up to 30 mm/year. In general agreement with [31], the present investigation shows that the deformation of the first runway foundations was almost completed by March 2016, and only a very tiny deformation subsidence (with a maximum rate of 5 mm/year) was still visible (with respect to the maximum rate of 15 mm/year measured in [31]) in 2016. See, for instance, the plots of east-west and up-down time-series related to point (a) shown in Figure 11. These results are in accordance with the geological setting of the zone reported in [31], considering that the first runway is built on a typical soft soil foundation with complete soil layers from top to bottom, and is the most stable of the five runways. The deformation related to the foundations of the first and third runways is quite similar. The foundations of the third runway were completed nine years later than the first runway. However, point (b) is located in the southern area of the third runway, where the foundation is mainly composed of silty clay and sandy silt, and point (a) is located in the middle of the first runway, where the foundation mainly consists of silty clay. Previous research shows that the water content, void ratio, and coefficient of compressibility of the silty clay in this area are 29.3%, 0.84, and 0.18 MPa−1 respectively, while the parameters of the sandy silt are 24.2%, 0.72, and 0.25 MPa−1, implying that the silty clay is softer and weaker than sandy silt [52]. Hence, the third runway is characterized by moderate-to-low deformation signals, which, from 2015 to 2016, were mostly vertical with a maximum subsidence rate of about 10 mm/year. See the plots related to point (b) shown in Figure 11. Conversely, the second runway, which has been in operation since 2005 and whose foundations reclamation project started later, only in 2001 [38], was still subject from 2015 to 2016 to residual deformations, but with maximum subsidence deformation rates less than those observed in [31] on the order of 10 mm/year. See the time-series of east-west and up-down deformation component related to point (c) shown in Figure 11. This outcome was rather expected due to the more reduced consolidation time of the second runway, as well as to its softer geology [31], formed by blown sand and backfill, with the addition of partial backfilled fine-silty sand [39]. The fourth runway, which was only completed in 2015, was markedly affected by vertical deformation signals with rates on the order of −25 to −35 mm/year and no appreciable east-west displacements, as documented by the plots of east-west and up-down displacement time-series related to point (d) that are shown in Figure 11. Concerning the fifth runway, which is the most proximal to the coast and the last runway built over reclaimed lands, its deformations were unfortunately not fully detectable. This is probably due to the temporal decorrelation noise artifacts that corrupt the interferograms, as certified by the reduced average spatial coherence of its nearby area, and it represents indirect proof of the circumstance that on-going deformation phenomena are very active.
However, in the near proximity of R5 detected pixels evidenced high deformation rates greater than –25 mm/year (see the up-down deformation time-series related to point (e) of Figure 11). The availability of additional data in the next years will help in better quantifying the entity of deformation near the fifth runway. Nonetheless, other structures (see the area marked with red points in Figure 10) were coherent, and the relevant deformations have been well detected. In this case, the measured deformation is predominantly vertical (i.e., a subsidence signal) with rates also larger than 40 mm/year, with the exception of the points located just along the coastline, which exhibit a more complex behavior and are also characterized by a residual movement towards the west in the northern sector and towards east in the southern sector. This behavior can be explained taking into account that the land-reclamation procedures for expanding the Pudong Airport facilities were in progress at the time of our investigation, and the soil was not compacted. For example, see the east-west and up-down deformation time-series relevant to the point labeled as (f) in Figure 11.
5.3. Additional Remarks
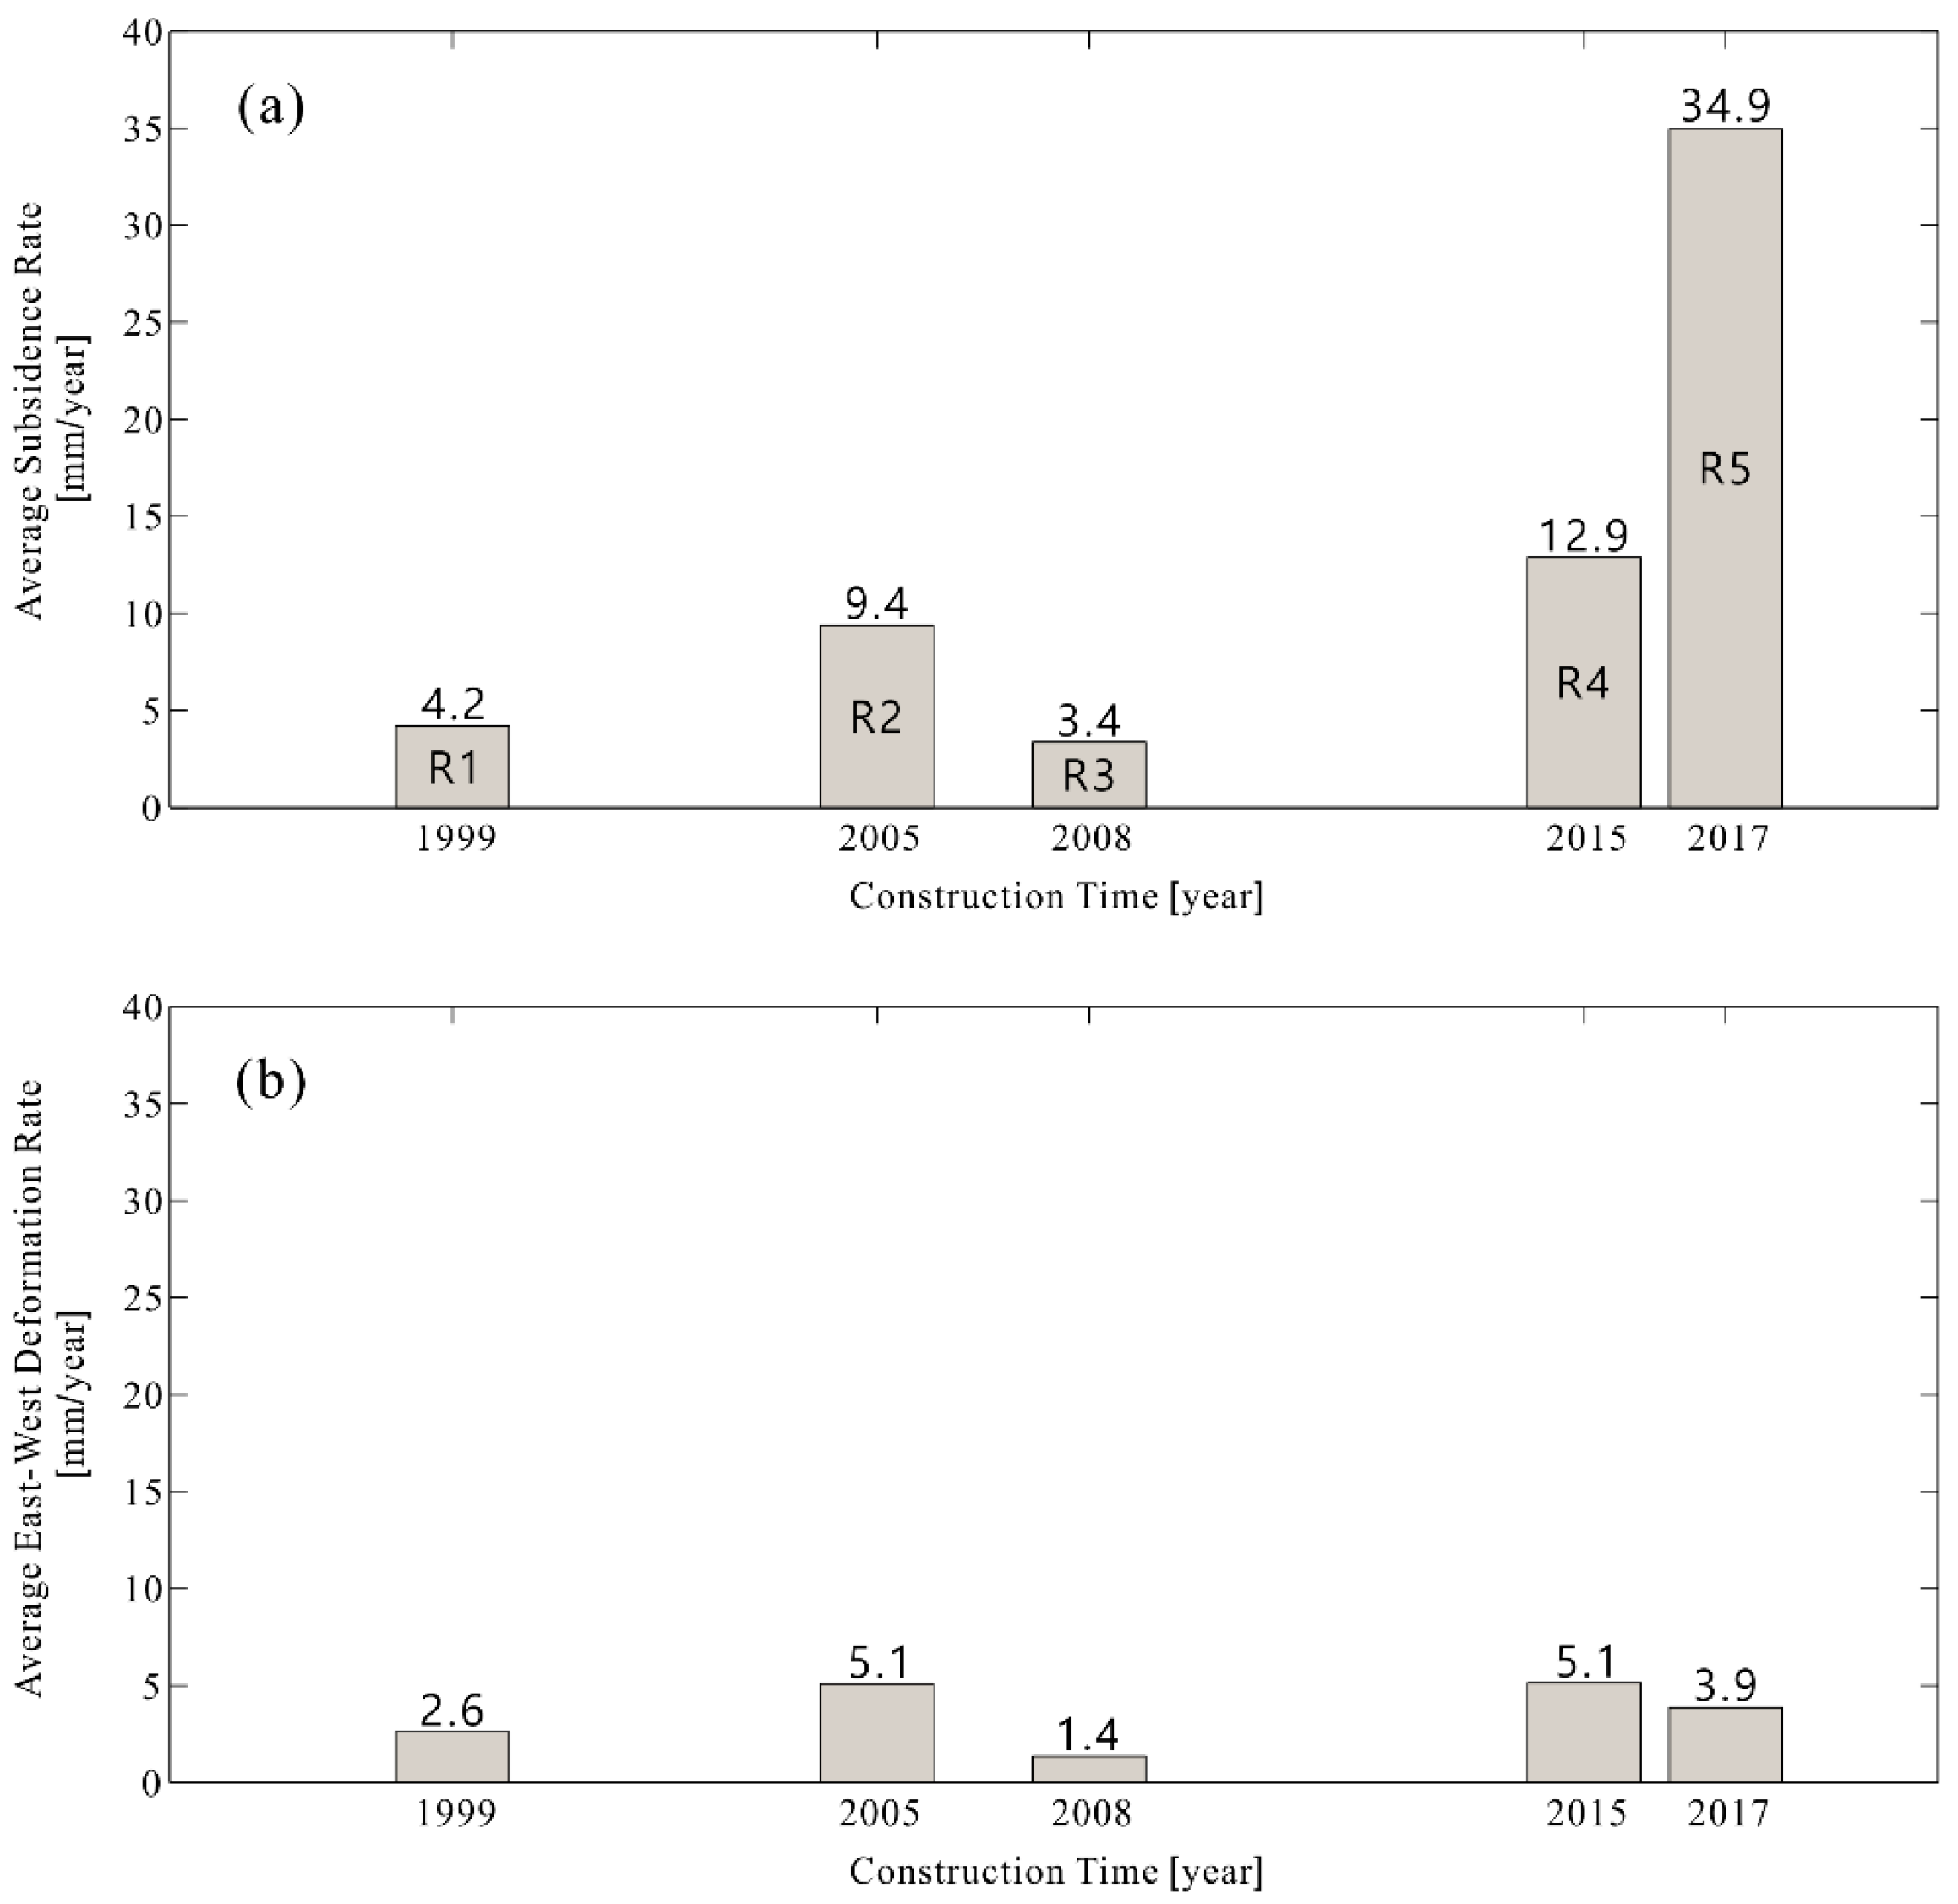
To better emphasize the relationships between the measured displacement rates and the construction time of the airport runways, we have performed this additional analysis, the results of which are shown in Figure 12. In particular, by identifying the well-detected, coherent points around each runway, we have calculated and displayed the average values of the east-west and up-down mean displacement velocity over the different runways. Note that although the third runway was put into use nine years after the first runway, the first and third runways both have smaller values of average east-west displacement and subsidence rate, of about 2 mm/year and 3.85 mm/year, respectively as shown in Figure 12a,b. This is because the foundations of the first and third runways are composed of similar natural sediments. Moreover, the foundation of the two runways (R1 and R3) was completed for the runway operation in 1999. After more than a decade of sediment consolidation, the residual deformations from 2015 to 2016 are small, and the foundation is almost consolidated and stable. Conversely, residual ground deformation is more significant in correspondence to facilities built on ocean-reclaimed land. This is, in particular, the case of the second (R2) and fourth (R4) runways, which were built on reclaimed-land platforms and completed at a later time (in 2005 and 2015, respectively). Indeed, they are characterized by larger measured displacement velocity values. This finding was somewhat expected as the soil consolidation phase was responsible for large deformation signals during the first stages after the end of the reclamation procedures [28]. With regard to the fifth runway (R5), the reclaiming process and the construction time of this runway occurred at the latest point, and (as expected) the measured deformation velocity values are the largest ones, reaching average subsidence rates and average east-west displacement rates of about 35 mm/year and 4 mm/year as shown in Figure 12a,b, respectively.
6. Conclusions and Future Perspectives
In this work, we have performed an up-to-date investigation of deformations of Shanghai coastal areas, and in particular of Lingang New City and of the infrastructures of the Pudong International Airport. The multi-angle/multi-sensor DInSAR approach, known as Minimum Acceleration (MinA) combination and based on the joint exploitation of LOS-projected deformation time-series obtained by applying the SBAS technique [6], has been used. The presented results have permitted the retrieval of the time-evolution of the on-going deformation phenomena by discriminating the east-west and the up-down displacement time-series, with a particular focus on the area of Pudong International Airport. The main outcome of our investigation is that ocean-reclaimed land is subject mostly to subsidence, while lateral (east-west) movements are less significant. In general, over ocean-reclaimed land east-west deformation rates are one-tenth of the up-down deformation rates. To the best of our knowledge, this represents the first direct evidence of the negligibility of lateral movements in reclaimed land documented through DInSAR-based approaches. As a future perspective, we plan to extend the presented analyses in the next few years to corroborate the validity of the foreseen deformation models discussed in [28,32]. An important point of criticism, however, needs to be raised: the European Space Agency acquisition plan of Sentinel-1A SAR data over the Shanghai area through descending orbits (which combined with the ascending data could allow a continuous mapping of the 2D displacements of the imaged areas) is not regular as in the ascending S1-A dataset. In fact, at the time this investigation was performed (i.e., in the second half of the year 2017), only a few isolated Interferometric Wide Swath (IW) descending SAR data (six images) were available in the ESA Hub catalogue. This circumstance evidently represents a critical issue to be taken seriously into account in the perspective of future investigations. This problem can be partially overcome by using SAR data acquired through other multiple-orbits SAR platforms (e.g., COSMO-SkyMed, TerraSAR-X, ALOS-2), but at the expense of a worse temporal resolution of achievable results and higher costs.
Supplementary Materials
The following are available online at www.mdpi.com/2072-4292/9/11/1194/s1, Table S1: CSK DataSet, Table S2: S1-ADataSet.
Acknowledgments
The authors would like to thank S. Guarino, G. Zeni, F. Parisi, and M. C. Rasulo, for their help and support, which have made possible the accomplishment of this study. This work was supported by The National Key Research and Development Program of China, entitled “Studies of geographical big data applied to urban public safety in BRICS NATIONS” (No. 2017YFE0100700), by the Key Laboratory of Land Subsidence Monitoring and Prevention, Ministry of Land and Resources through Project KLLSMP201503, by the Fund of the Director of the Key Laboratory of Geographic Information Science (Ministry of Education), East China Normal University (grant no. KLGIS2017C03), by the Research Grants of Science and Technology Commission of Shanghai Municipality through Project 13ZR1453900 and 13231203804, and by the I-AMICA project of structural improvement financed under the National Operational Programme (PON) for “Research and Competitiveness 2007–2013”, co-funded with the European Regional Development Fund (ERDF) and National Resources. This work has been performed within the Dragon 4 ESA project ID 32294, entitled “Integrated analysis of the combined risk of ground subsidence, sea level rise, and natural hazards in coastal delta regions”. Cosmo-SkyMed SAR data were provided to us by the Italian Space Agency in the framework of the Dragon III project ID 10644, whereas Sentinel-1A data were freely downloaded from the ESA Sentinel Hub.
Author Contributions
Antonio Pepe developed the two-dimensional MinA algorithm and supervised the research and the algorithm development. Lei Yu computed the CSK and S1-A SBAS time-series of deformation and prepared the manuscript. Tianliang Yang and Qing Zhao contributed to the draft of the manuscript, and provided information for the geophysical assessment of the area. Min Liu revised the manuscript and searched for the recent literature related to the area under investigation.
Conflicts of Interest
The authors declare no conflict of interest.
References
- Bürgmann, R.; Rosen, P.A.; Fielding, E.J. Synthetic aperture radar interferometry to measure Earth’s surface topography and its deformation. Annu. Rev. Earth Planet. Sci. 2000, 28, 169–209. [Google Scholar] [CrossRef]
- Massonnet, D.; Feigl, K.L. Radar interferometry and its application to changes in the Earth’s surface. Rev. Geophys. 1998, 36, 441–500. [Google Scholar] [CrossRef]
- Massonnet, D. The displacement field of the Landers earthquake mapped by radar interferometry. Nature 1993, 364, 138–142. [Google Scholar] [CrossRef]
- Ferretti, A.; Prati, C.; Rocca, F. Permanent scatterers in SAR interferometry. IEEE Trans. Geosci. Remote Sens. 2001, 39, 8–20. [Google Scholar] [CrossRef]
- Kampes, B.M. Radar Interferometry: Springer Persistent Scatterer Technique; Springer: New York, NY, USA, 2006. [Google Scholar]
- Berardino, P.; Fornaro, G.; Lanari, R.; Sansosti, E. A new algorithm for surface deformation monitoring based on small baseline differential SAR interferograms. IEEE Trans. Geosci. Remote Sens. 2004, 40, 2375–2383. [Google Scholar] [CrossRef]
- Werner, C.; Wegmuller, U.; Strozzi, T.; Wiesmann, A. Interferometric Point Target Analysis forDeformation Mapping. In Proceedings of the 2003 IEEE Geoscience and Remote Sensing Symposium, Toulouse, France, 21–25 July 2003; Volume 7, pp. 4362–4364. [Google Scholar]
- Wright, T.J.; Parsons, B.E.; Lu, Z. Toward mapping surface deformation in three dimensions using InSAR. Geophys. Res. Lett. 2004, 31. [Google Scholar] [CrossRef]
- Gray, L. Using multiple RADARSAT InSAR pairs to estimate a full three-dimensional solution for glacial ice movement. Geophys. Res. Lett. 2011, 38. [Google Scholar] [CrossRef]
- Gudmundsson, S.; Sigmundsson, F.; Carstensen, J. Three-dimensional surface motion maps estimated from combined interferometric synthetic aperture radar and GPS data. J. Geophys. Res. 2002, 107, 2250–2264. [Google Scholar] [CrossRef]
- Fialko, Y.; Simons, M.; Agnew, D. The complete (3-D) surface dis-placement field in the epicentral area of the 1999 M(w)7.1 Hector Mine earthquake, California, from space geodetic observations. Geophys. Res. Lett. 2001, 28, 3063–3066. [Google Scholar] [CrossRef]
- Fialko, Y.; Sandwell, D.; Simons, M.; Rosen, P. Three-dimensional deformation caused by the Bam, Iran, earthquake and the origin of shallow slip deficit. Nature 2005, 435, 295–299. [Google Scholar] [CrossRef] [PubMed]
- Hu, J.; Li, Z.W.; Ding, X.L.; Zhu, J.J.; Zhang, L.; Sun, Q. 3D coseismic displacement of 2010 Darfield, New Zealand earthquake estimated from multi-aperture InSAR and D-InSAR measurements. J. Geod. 2012, 86, 1029–1041. [Google Scholar] [CrossRef]
- Jun, H.; Wei, L.Z.; Jun, Z.J.; Chong, R.X.; Li, X.D. Inferring three-dimensional surface displacement field by combining SAR interferometric phase and amplitude information of ascending and descending orbits. Sci. China Earth Sci. 2010, 53, 53550–53560. [Google Scholar]
- Solari, L.; Ciampalini, A.; Raspini, F.; Bianchini, S.; Zinno, I.; Bonano, M.; Manunta, M.; Moretti, S.; Casagli, N. Combined use of C-and X-Band SAR data for subsidence monitoring in an urban area. Geosciences 2017, 7, 21. [Google Scholar] [CrossRef]
- Hu, J.; Ding, X.; Li, Z.; Zhu, J.; Sun, Q.; Zhang, L. Kalman-filter based approach for multisensor, multitrack, and multitemporal InSAR. IEEE Trans. Geosci. Remote Sens. 2013, 51, 4226–4239. [Google Scholar] [CrossRef]
- Samsonov, S.; d’Oreye, N. Multidimensional time-series analysis of ground deformation from multiple InSAR data sets applied to Virunga Volcanic Province. Geophys. J. Int. 2012, 191, 1095–1108. [Google Scholar]
- Ozawa, T.; Ueda, H. Advanced interferometric synthetic aperture radar (InSAR) time series analysis using interferograms of multiple-orbit tracks: A case study on Miyake-jima. J. Geophys. Res. 2011, 116, B12407. [Google Scholar] [CrossRef]
- Pepe, A.; Solaro, G.; Calò, F.; Dema, C. A Minimum Acceleration Approach for the Retrieval of Multi-Platform InSAR Deformation Time-Series. IEEE J. Sel. Appl. Earth Obs. 2016, 9, 3883–3898. [Google Scholar] [CrossRef]
- Casu, F.; Manconi, A. Four-dimensional surface evolution of active rifting from spaceborne SAR data. Geosphere 2016, 12. [Google Scholar] [CrossRef]
- Liu, G.X.; Luo, X.J.; Chen, Q.; Huang, J.F.; Ding, X.L. Detecting land subsidence in Shanghai by PS-networking SAR interferometry. Sensors 2008, 8, 4725–4741. [Google Scholar] [CrossRef] [PubMed]
- Wu, J.; Zhang, L.; Chen, J.; Li, T. Monitoring ground subsidence in shanghai maglev area using two kinds of SAR data. J. Appl. Geod. 2012, 6, 209–213. [Google Scholar] [CrossRef]
- Chen, J.; Wu, J.C.; Zhang, L.N.; Zou, J.P.; Liu, G.X.; Zhang, R.; Yu, B. Deformation Trend Extraction Based on Multi-Temporal InSAR in Shanghai. Remote Sens. 2013, 5, 1774–1786. [Google Scholar] [CrossRef]
- Dong, S.C.; Samsonov, S.; Yin, H.W.; Ye, S.J.; Cao, Y.R. Time-series analysis of subsidence associated with rapid urbanization in Shanghai, China measured with SBAS InSAR method. Environ. Earth Sci. 2014, 72, 677–691. [Google Scholar] [CrossRef]
- Zhang, L.; Wu, J.; Li, T.; Chen, J. Monitoring ground deformation based on small baseline approach in Shanghai. J. Tongji Univ. 2012, 40, 1564–1568. [Google Scholar]
- Wu, J.C.; Hu, F.M. Monitoring Ground Subsidence along the Shanghai Maglev Zone Using TerraSAR-X Images. IEEE Geosci. Remote Sens. 2017, 14, 117–121. [Google Scholar] [CrossRef]
- Perissin, D.; Wang, Z.; Lin, H. Shanghai subway tunnels and highways monitoring through Cosmo-SkyMed Persistent Scatterers. ISPRS J. Photogramm. 2012, 73, 58–67. [Google Scholar] [CrossRef]
- Dai, K.; Liu, G.X.; Li, Z.H.; Li, T.; Yu, B.; Wang, X.W.; Singleton, A. Extracting Vertical Displacement Rates in Shanghai (China) with Multi-Platform SAR Images. Remote Sens. 2015, 7, 9542–9562. [Google Scholar] [CrossRef]
- Zhao, Q.; Pepe, A.; Gao, W.; Lu, Z.; Bonano, M.; He, M.; Tang, X. A DInSAR Investigation of the Ground Settlement Time Evolution of Ocean-Reclaimed Lands in Shanghai. IEEE J. Sel. Top. Appl. Earth Obs. Remote Sens. 2015, 8, 1763–1781. [Google Scholar] [CrossRef]
- Zebker, H.A.; Villasenor, J. Decorrelation in interferometric radar echoes. IEEE Trans. Geosci. Remote Sens. 1992, 30, 950–959. [Google Scholar] [CrossRef]
- Agram, P.S.; Simons, M. A noise model for InSAR time-series. J. Geophys. Res. Solid Earth 2015, 120, 2752–2771. [Google Scholar] [CrossRef]
- Jiang, Y.N.; Liao, M.S.; Wang, H.M.; Zhang, L.; Balz, T. Deformation Monitoring and Analysis of the Geological Environment of Pudong International Airport with Persistent Scatterer SAR Interferometry. Remote Sens. 2016, 8, 1021. [Google Scholar] [CrossRef]
- Pepe, A.; Bonano, M.; Zhao, Q.; Yang, T.; Wang, H. The Use of C-/X-Band Time-Gapped SAR Data and Geotechnical Models for the Study of Shanghai’s Ocean-Reclaimed Lands through the SBAS-DInSAR Technique. Remote Sens. 2016, 8, 911. [Google Scholar] [CrossRef]
- Yang, P.; Tang, Y.Q.; Zhou, N.Q.; Wang, J.X. Consolidation settlement of Shanghai dredger fill under self-weight using centrifuge modeling test. J. Cent. South Univ. Technol. 2008, 39, 862–866. [Google Scholar]
- Taylor, R.N. Geothecnical Centrifuge Technology; Blackie Academic and Professional: Glasgow, UK, 1995. [Google Scholar]
- Cui, Z.D.; Tang, Y.Q. Land subsidence and pore structure of soils caused by the high-rise building group through centrifuge model test. Eng. Geol. 2010, 113, 44–52. [Google Scholar] [CrossRef]
- Cai, J.; Wang, J.; Wu, J.; Hu, C.; Grafaren, E.; Chen, J. Horizontal deformation rate analysis based on multiepoch GPS measurements in Shanghai. J. Surv. Eng. 2008, 134, 132–137. [Google Scholar] [CrossRef]
- Torres, R. GMES Sentinel-1 mission. Remote Sens. Environ. 2012, 120, 9–24. [Google Scholar] [CrossRef]
- Wang, G.D.; Han, L.M.; Chai, Z.L. Subgrade settlement rules of first runway of Pudong airport in Shanghai. J. Eng. Geol. 2012, 20, 131–137. [Google Scholar]
- Wang, X.H.; Yin, C.L.; Si, B.F.; Li, J.S.; Liu, S.; Su, E.H. Foundation bed treatment for high-grade taking-off and landing runway-study on construction proposal for the third runway of Shanghai Pudong international airport building construction. Build. Constr. 2007, 29, 275–277. [Google Scholar]
- Zan, D.; Guarnieri, F.; Monti, A. TOPSAR: Terrain observation by progressive scans. IEEE Trans. Geosci. Remote Sens. 2006, 44, 2352–2360. [Google Scholar] [CrossRef]
- Small Baseline Subset Algorithm (SBAS). Available online: http://www.irea.cnr.it (accessed on 1 January 2017).
- ENVI’s SARScape Modules from EXELIS VIS Information Solutions. Available online: http://www.sarmap.ch/page.php?page=sarscape (accessed on 1 January 2017).
- Rosen, P.A. Synthetic aperture radar interferometry. Proc. IEEE 2000, 88, 333–382. [Google Scholar] [CrossRef]
- Strang, G. Linear Algebra and Its Applications; Harcourt Brace Jovanovich: Orlando, FL, USA, 1988. [Google Scholar]
- Pepe, A.; Yang, Y.; Manzo, M.; Lanari, R. Improved EMCF-SBAS Processing Chain Based on Advanced Techniques for the Noise-Filtering and Selection of Small Baseline Multi-look DInSAR Interferograms. IEEE Trans. Geosci. Remote Sens. 2015, 53, 4394–4417. [Google Scholar] [CrossRef]
- Franceschetti, G.; Lanari, R. Synthetic Aperture Radar Processing; CRC Press: Boca Raton, FL, USA, 1999. [Google Scholar]
- Casu, F.; Manconi, A.; Pepe, A.; Lanari, R. Deformation time-series generation in areas characterized by large displacement dynamics: The SAR amplitude Pixel-Offset SBAS technique. IEEE Trans. Geosci. Remote Sens. 2011, 49, 2752–2763. [Google Scholar] [CrossRef]
- Goldstein, R.M.; Werner, C.L. Radar interferogram filtering for geophysical applications. Geophys. Res. Lett. 1998, 25, 4035–4038. [Google Scholar] [CrossRef]
- Costantini, M. A novel phase unwrapping method based on network programming. IEEE Trans. Geosci. Remote Sens. 1998, 36, 813–821. [Google Scholar] [CrossRef]
- Pepe, A.; Lanari, R. On the extension of the minimum cost flow algorithm for phase unwrapping of multi-temporal differential SAR interferograms. IEEE Trans. Geosci. Remote Sens. 2006, 44, 2374–2383. [Google Scholar] [CrossRef]
- Shanghai Institute of Geological Survey (SIGS). The Geological Hazard Risk Assessment Report of Pudong International Airport (PD4); Shanghai Institute Geologocal Survey: Shanghai, China, 2006. [Google Scholar]
Figure 1.
(a) Location of the Shanghai reclaimed area, (b) the distribution of the runways at the Pudong International Airport, and (c) the engineering geology condition of the Pudong International Airport area.
Figure 1.
(a) Location of the Shanghai reclaimed area, (b) the distribution of the runways at the Pudong International Airport, and (c) the engineering geology condition of the Pudong International Airport area.

Figure 2.
Distribution of the SB interferometric SARdata pair in the temporal/perpendicular baseline plane for the CSK (a) and S1-A (b) datasets. SAR images are presented with diamonds, while connecting arcs correspond to selected interferometric SAR data pairs.
Figure 2.
Distribution of the SB interferometric SARdata pair in the temporal/perpendicular baseline plane for the CSK (a) and S1-A (b) datasets. SAR images are presented with diamonds, while connecting arcs correspond to selected interferometric SAR data pairs.

Figure 3.
Imaging geometries of SAR observations over ascending (in blue) and descending (in red) orbits.
Figure 3.
Imaging geometries of SAR observations over ascending (in blue) and descending (in red) orbits.

Figure 4.
LOS-projected mean displacement velocity map retrieved by processing the CSK dataset (left) and the S1-A dataset (right).
Figure 4.
LOS-projected mean displacement velocity map retrieved by processing the CSK dataset (left) and the S1-A dataset (right).
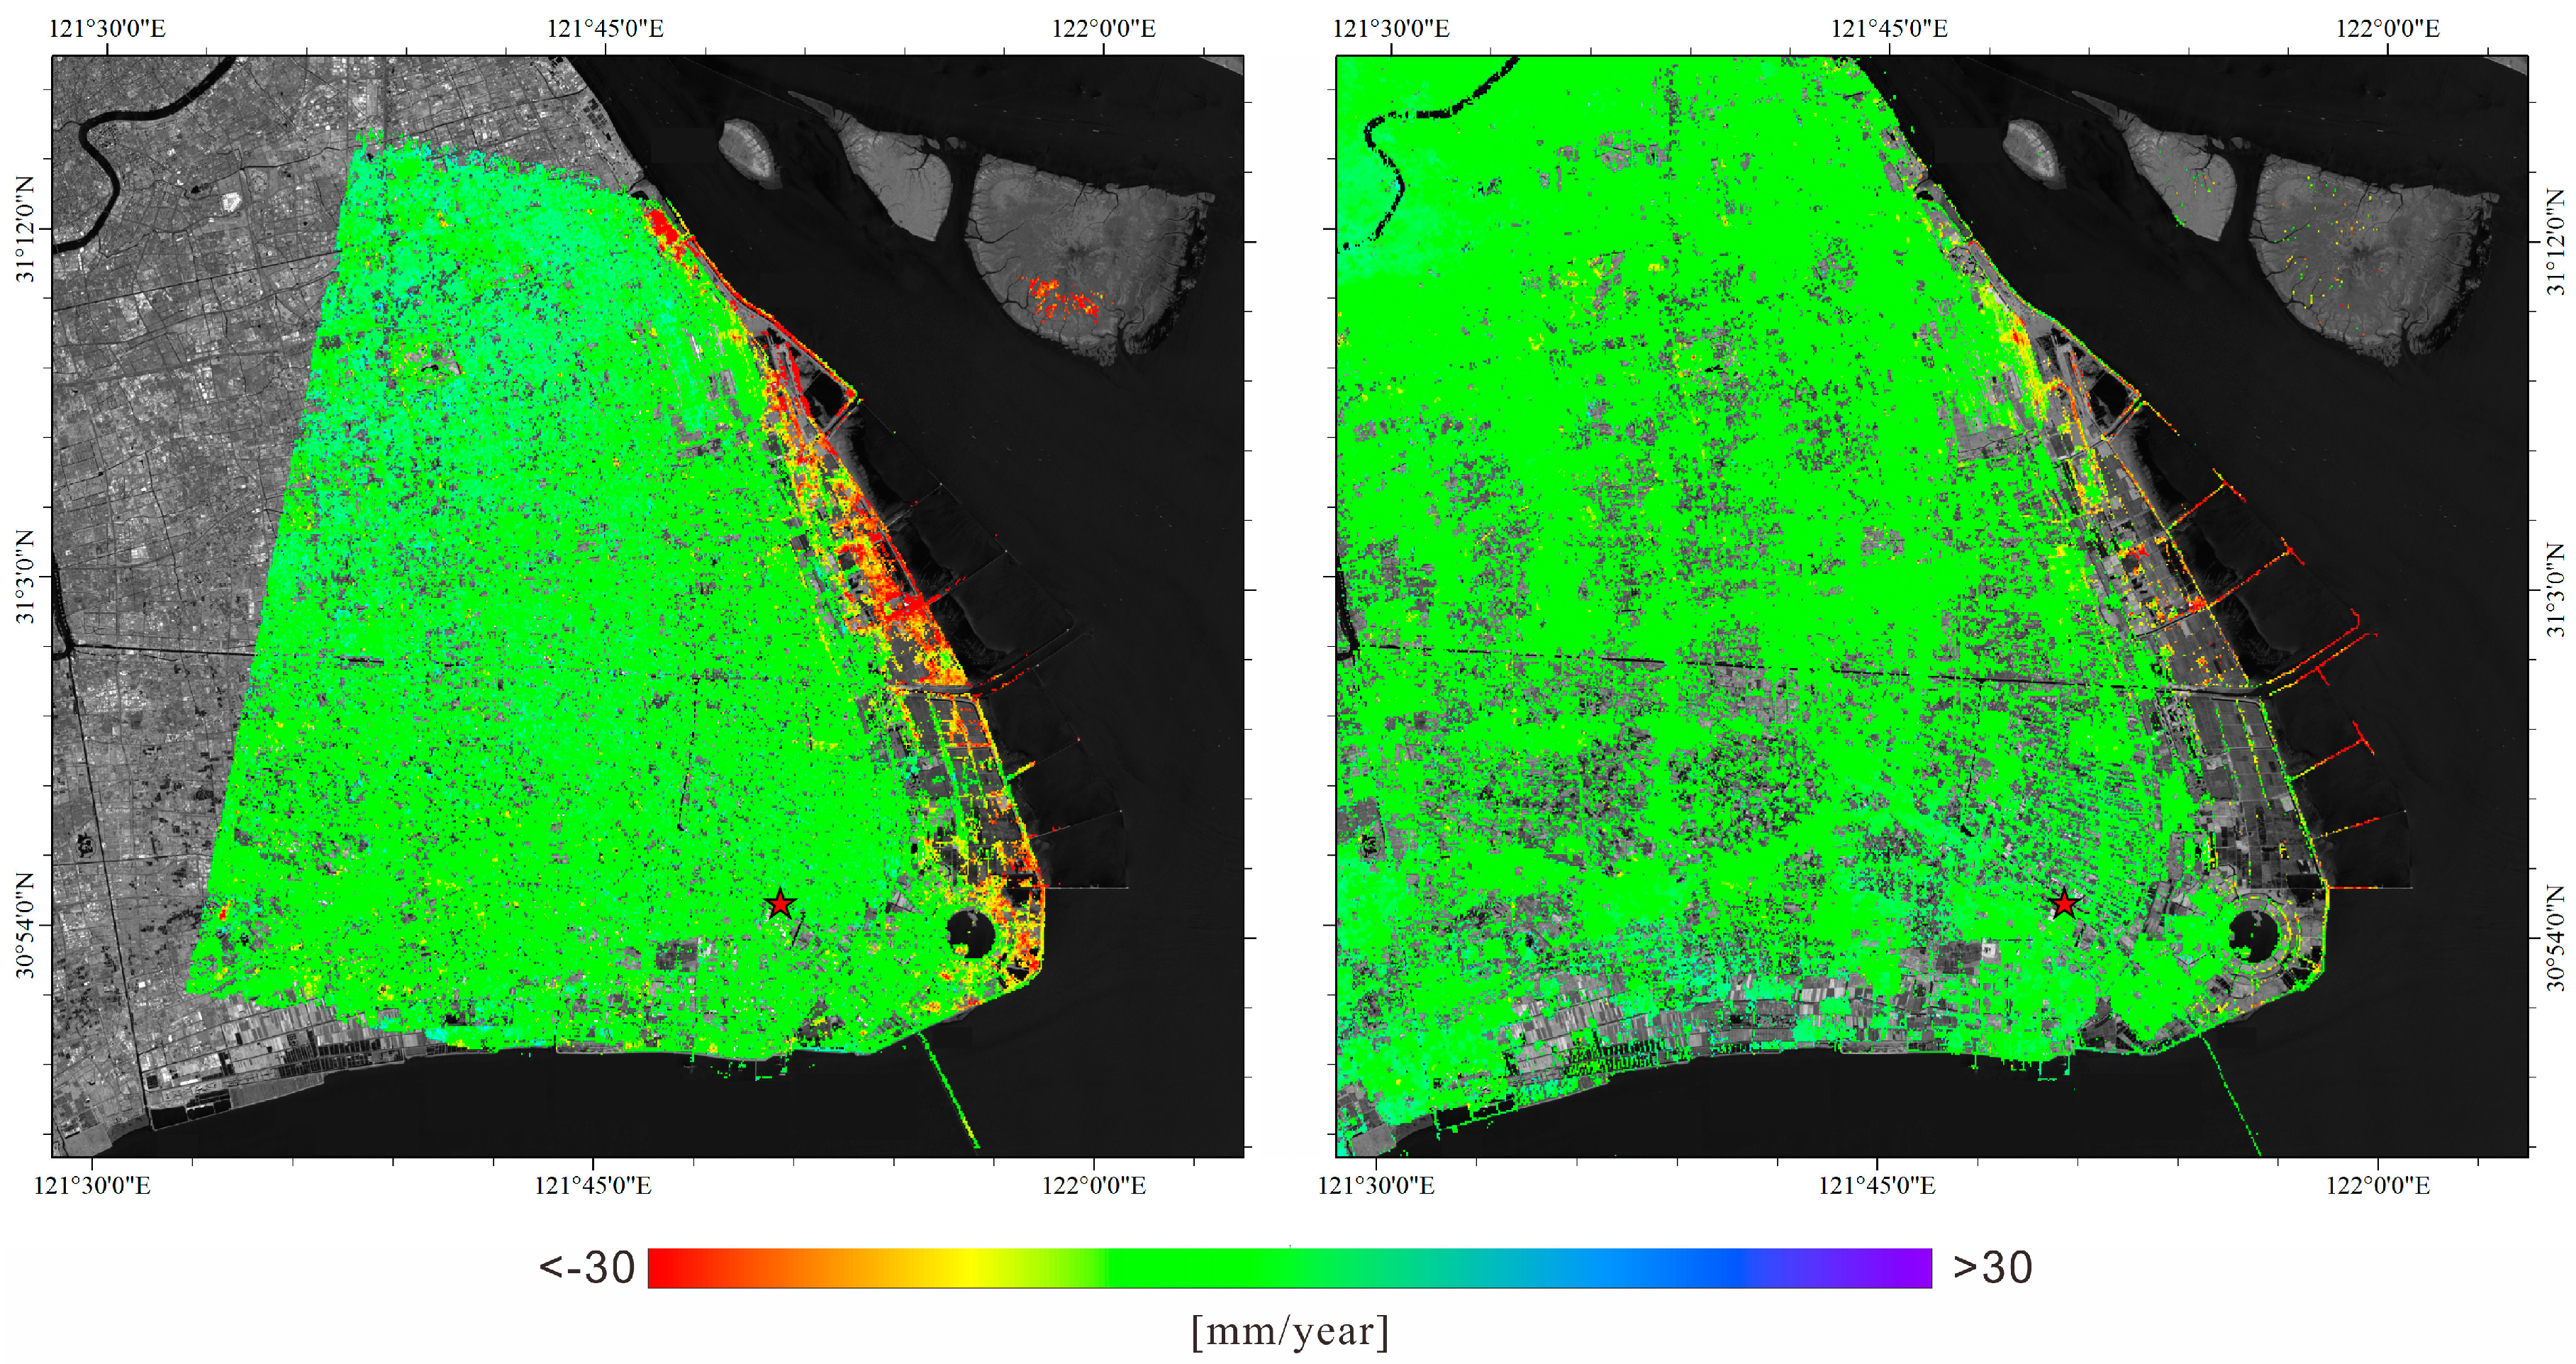
Figure 5.
Same as Figure 4, but relevant to the overlapping time period between 26 February 2015 and 4 March 2016. Only coherent SAR pixels common to both CSK and S1-A datasets are displayed. The red star identifies the location of the reference pixel, which is assumed stable.
Figure 5.
Same as Figure 4, but relevant to the overlapping time period between 26 February 2015 and 4 March 2016. Only coherent SAR pixels common to both CSK and S1-A datasets are displayed. The red star identifies the location of the reference pixel, which is assumed stable.

Figure 6.
2015–2016 two-dimensional mean displacement velocity maps: east-west map (left) and up-down map S1-A (right).
Figure 6.
2015–2016 two-dimensional mean displacement velocity maps: east-west map (left) and up-down map S1-A (right).
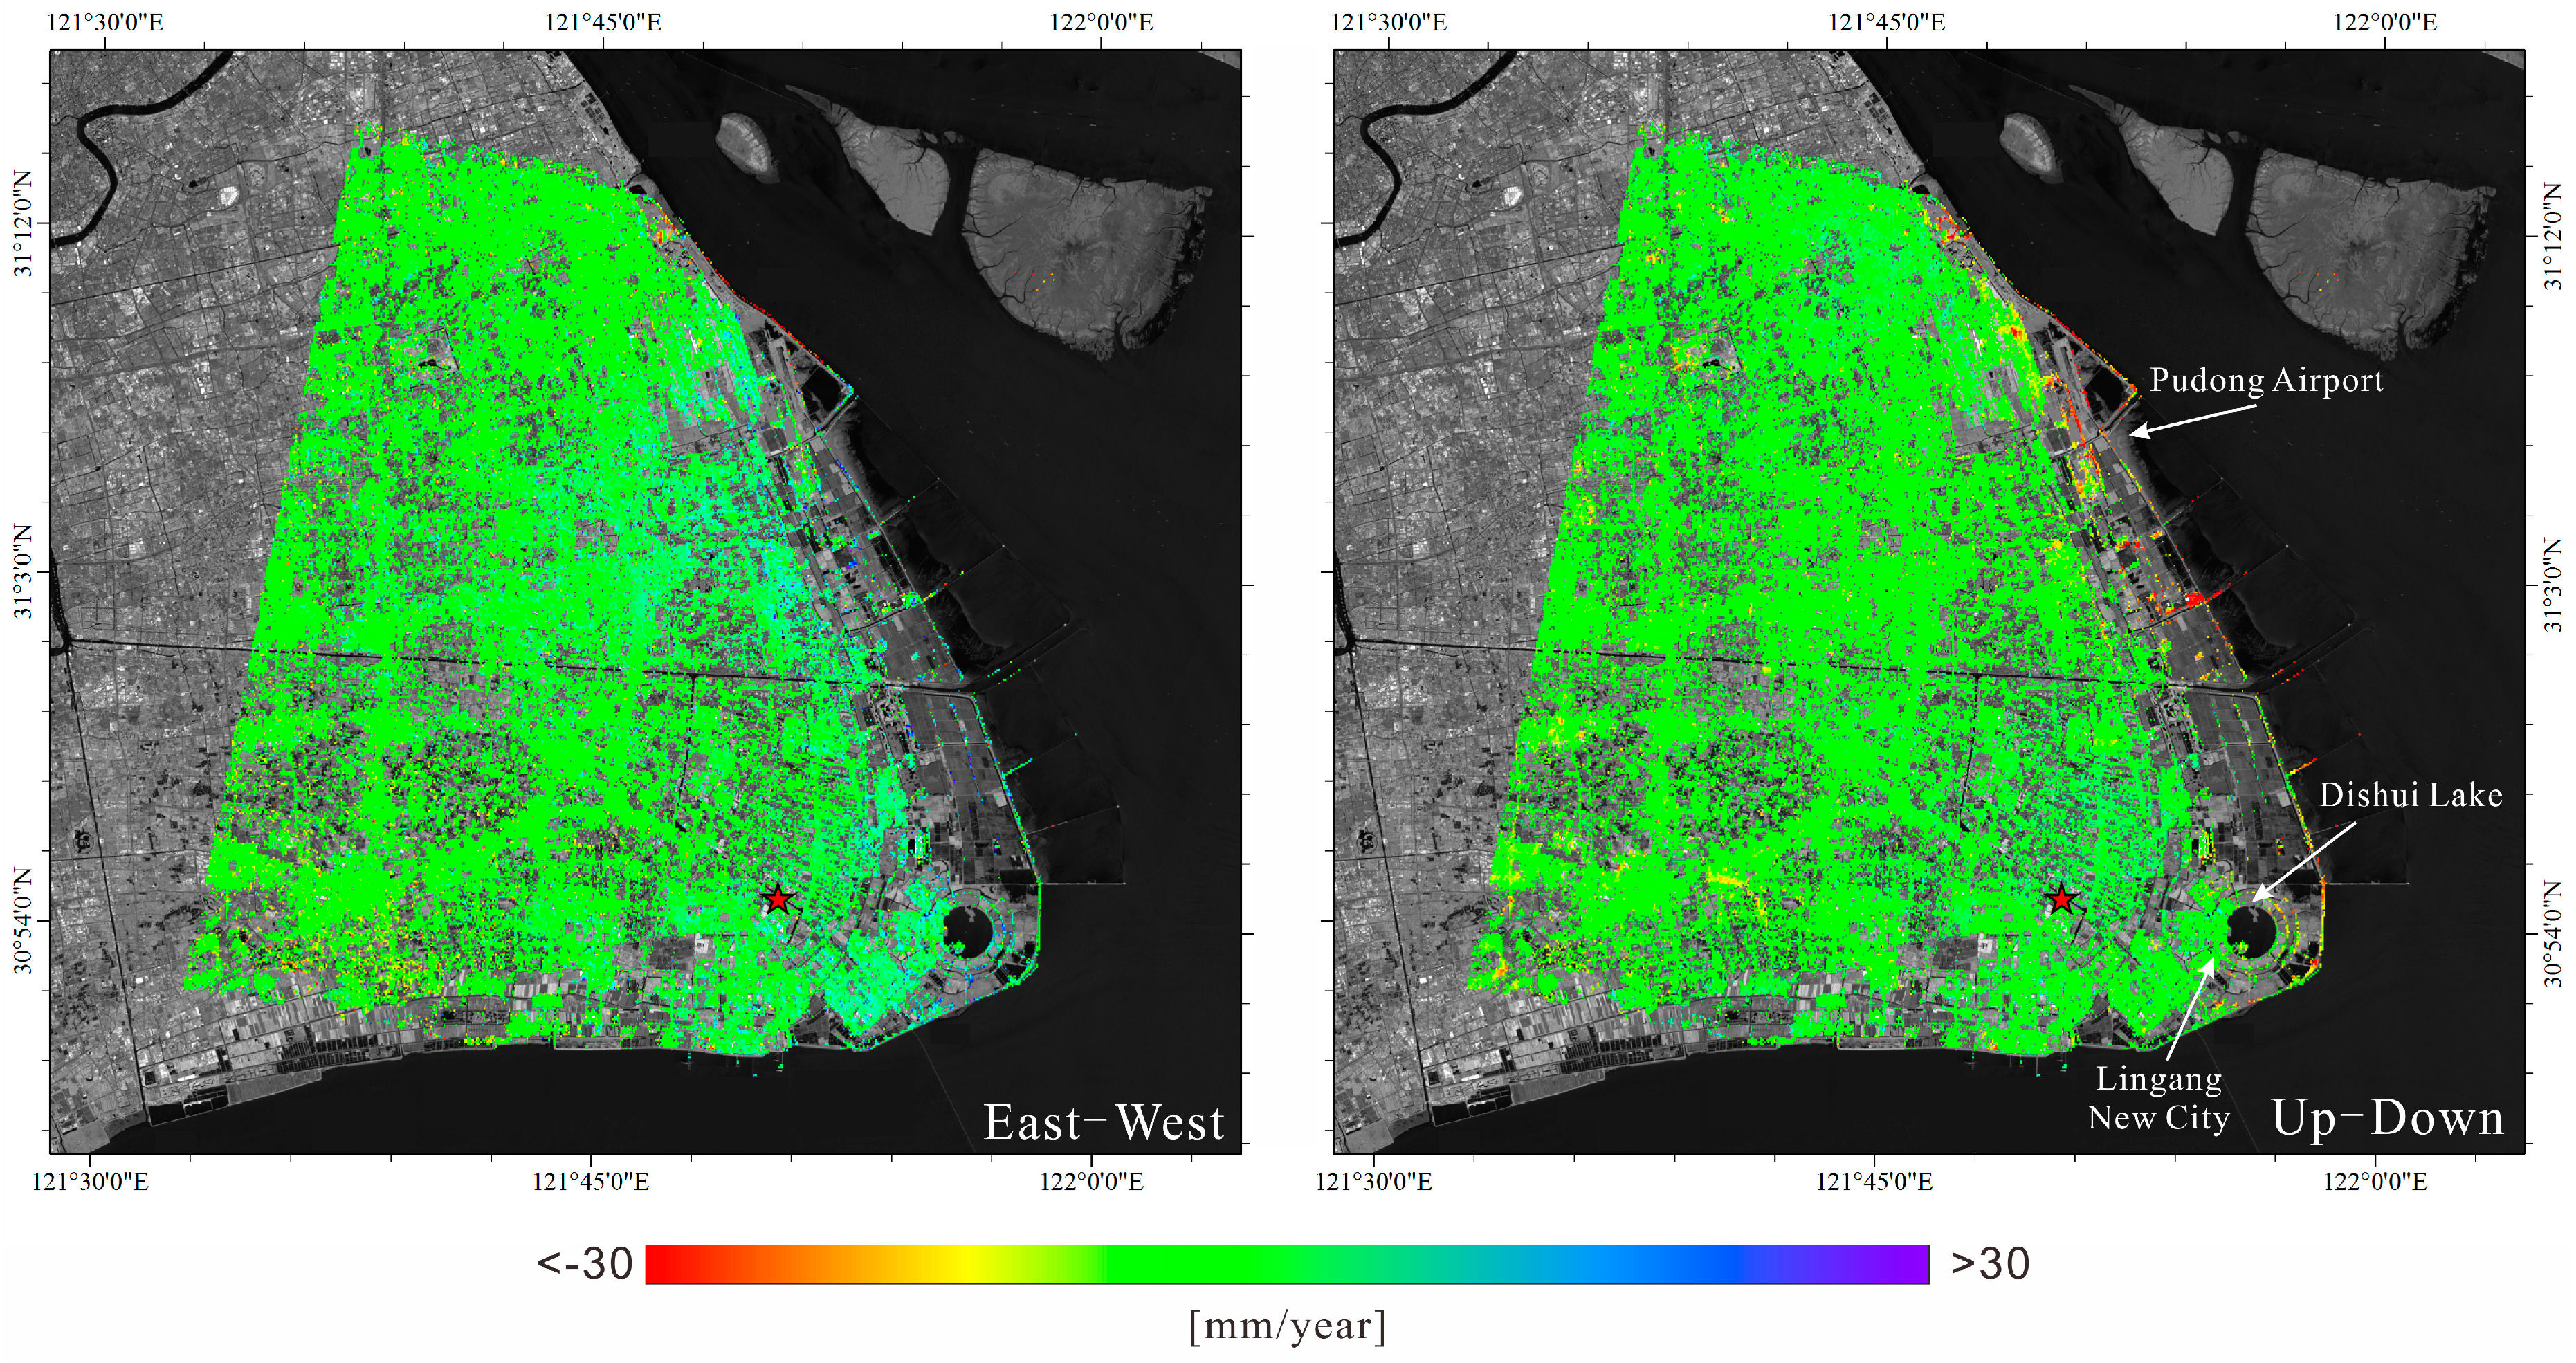
Figure 7.
Map of the root mean square error (RMSE) of the difference between the original LOS measurements and the corresponding LOS values reconstructed by Equation (5) from the retrieved east-west and up-down time-series.
Figure 7.
Map of the root mean square error (RMSE) of the difference between the original LOS measurements and the corresponding LOS values reconstructed by Equation (5) from the retrieved east-west and up-down time-series.
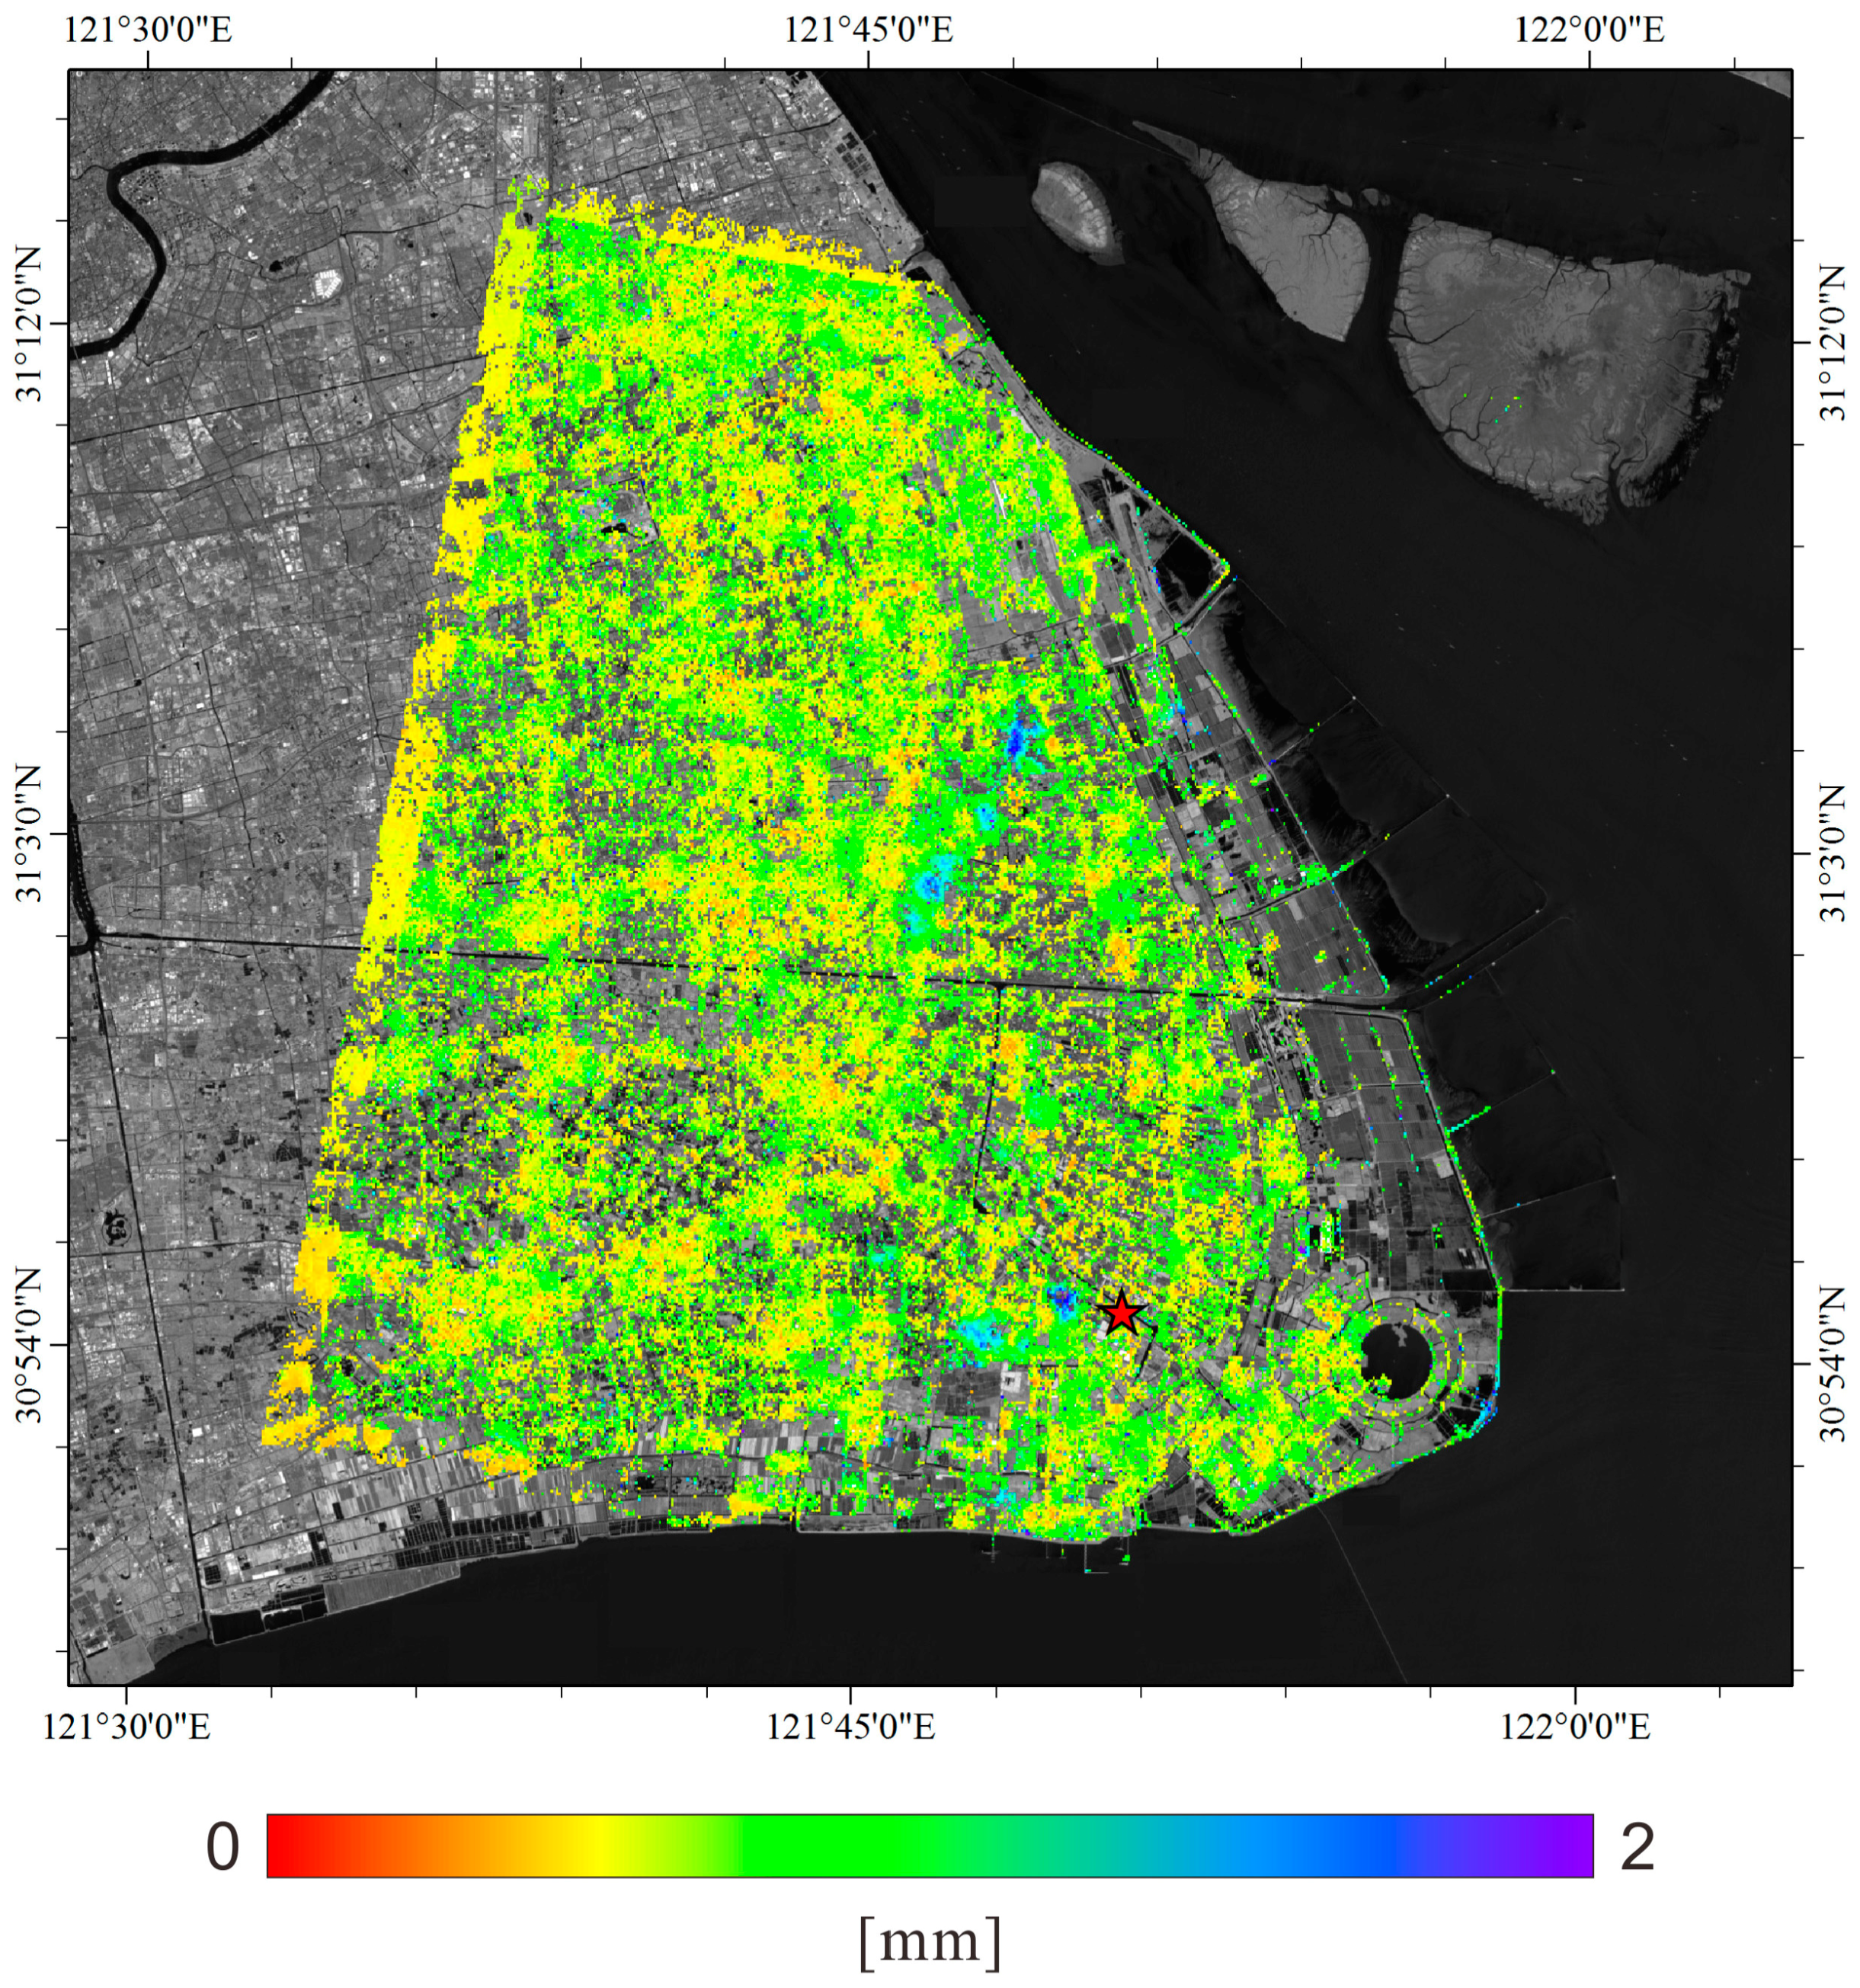
Figure 8.
Zoomed view of the maps of East-West and up-down mean displacement velocities in the area of Shanghai ocean-reclaimed platforms.
Figure 8.
Zoomed view of the maps of East-West and up-down mean displacement velocities in the area of Shanghai ocean-reclaimed platforms.

Figure 9.
Plots of the east-west (blue triangles) and up-down (red triangles) time-series relevant to ground points labeled as (a–h) in Figure 8. Root Mean Square Error (RMSE) values relevant to each selected point are also shown.
Figure 9.
Plots of the east-west (blue triangles) and up-down (red triangles) time-series relevant to ground points labeled as (a–h) in Figure 8. Root Mean Square Error (RMSE) values relevant to each selected point are also shown.
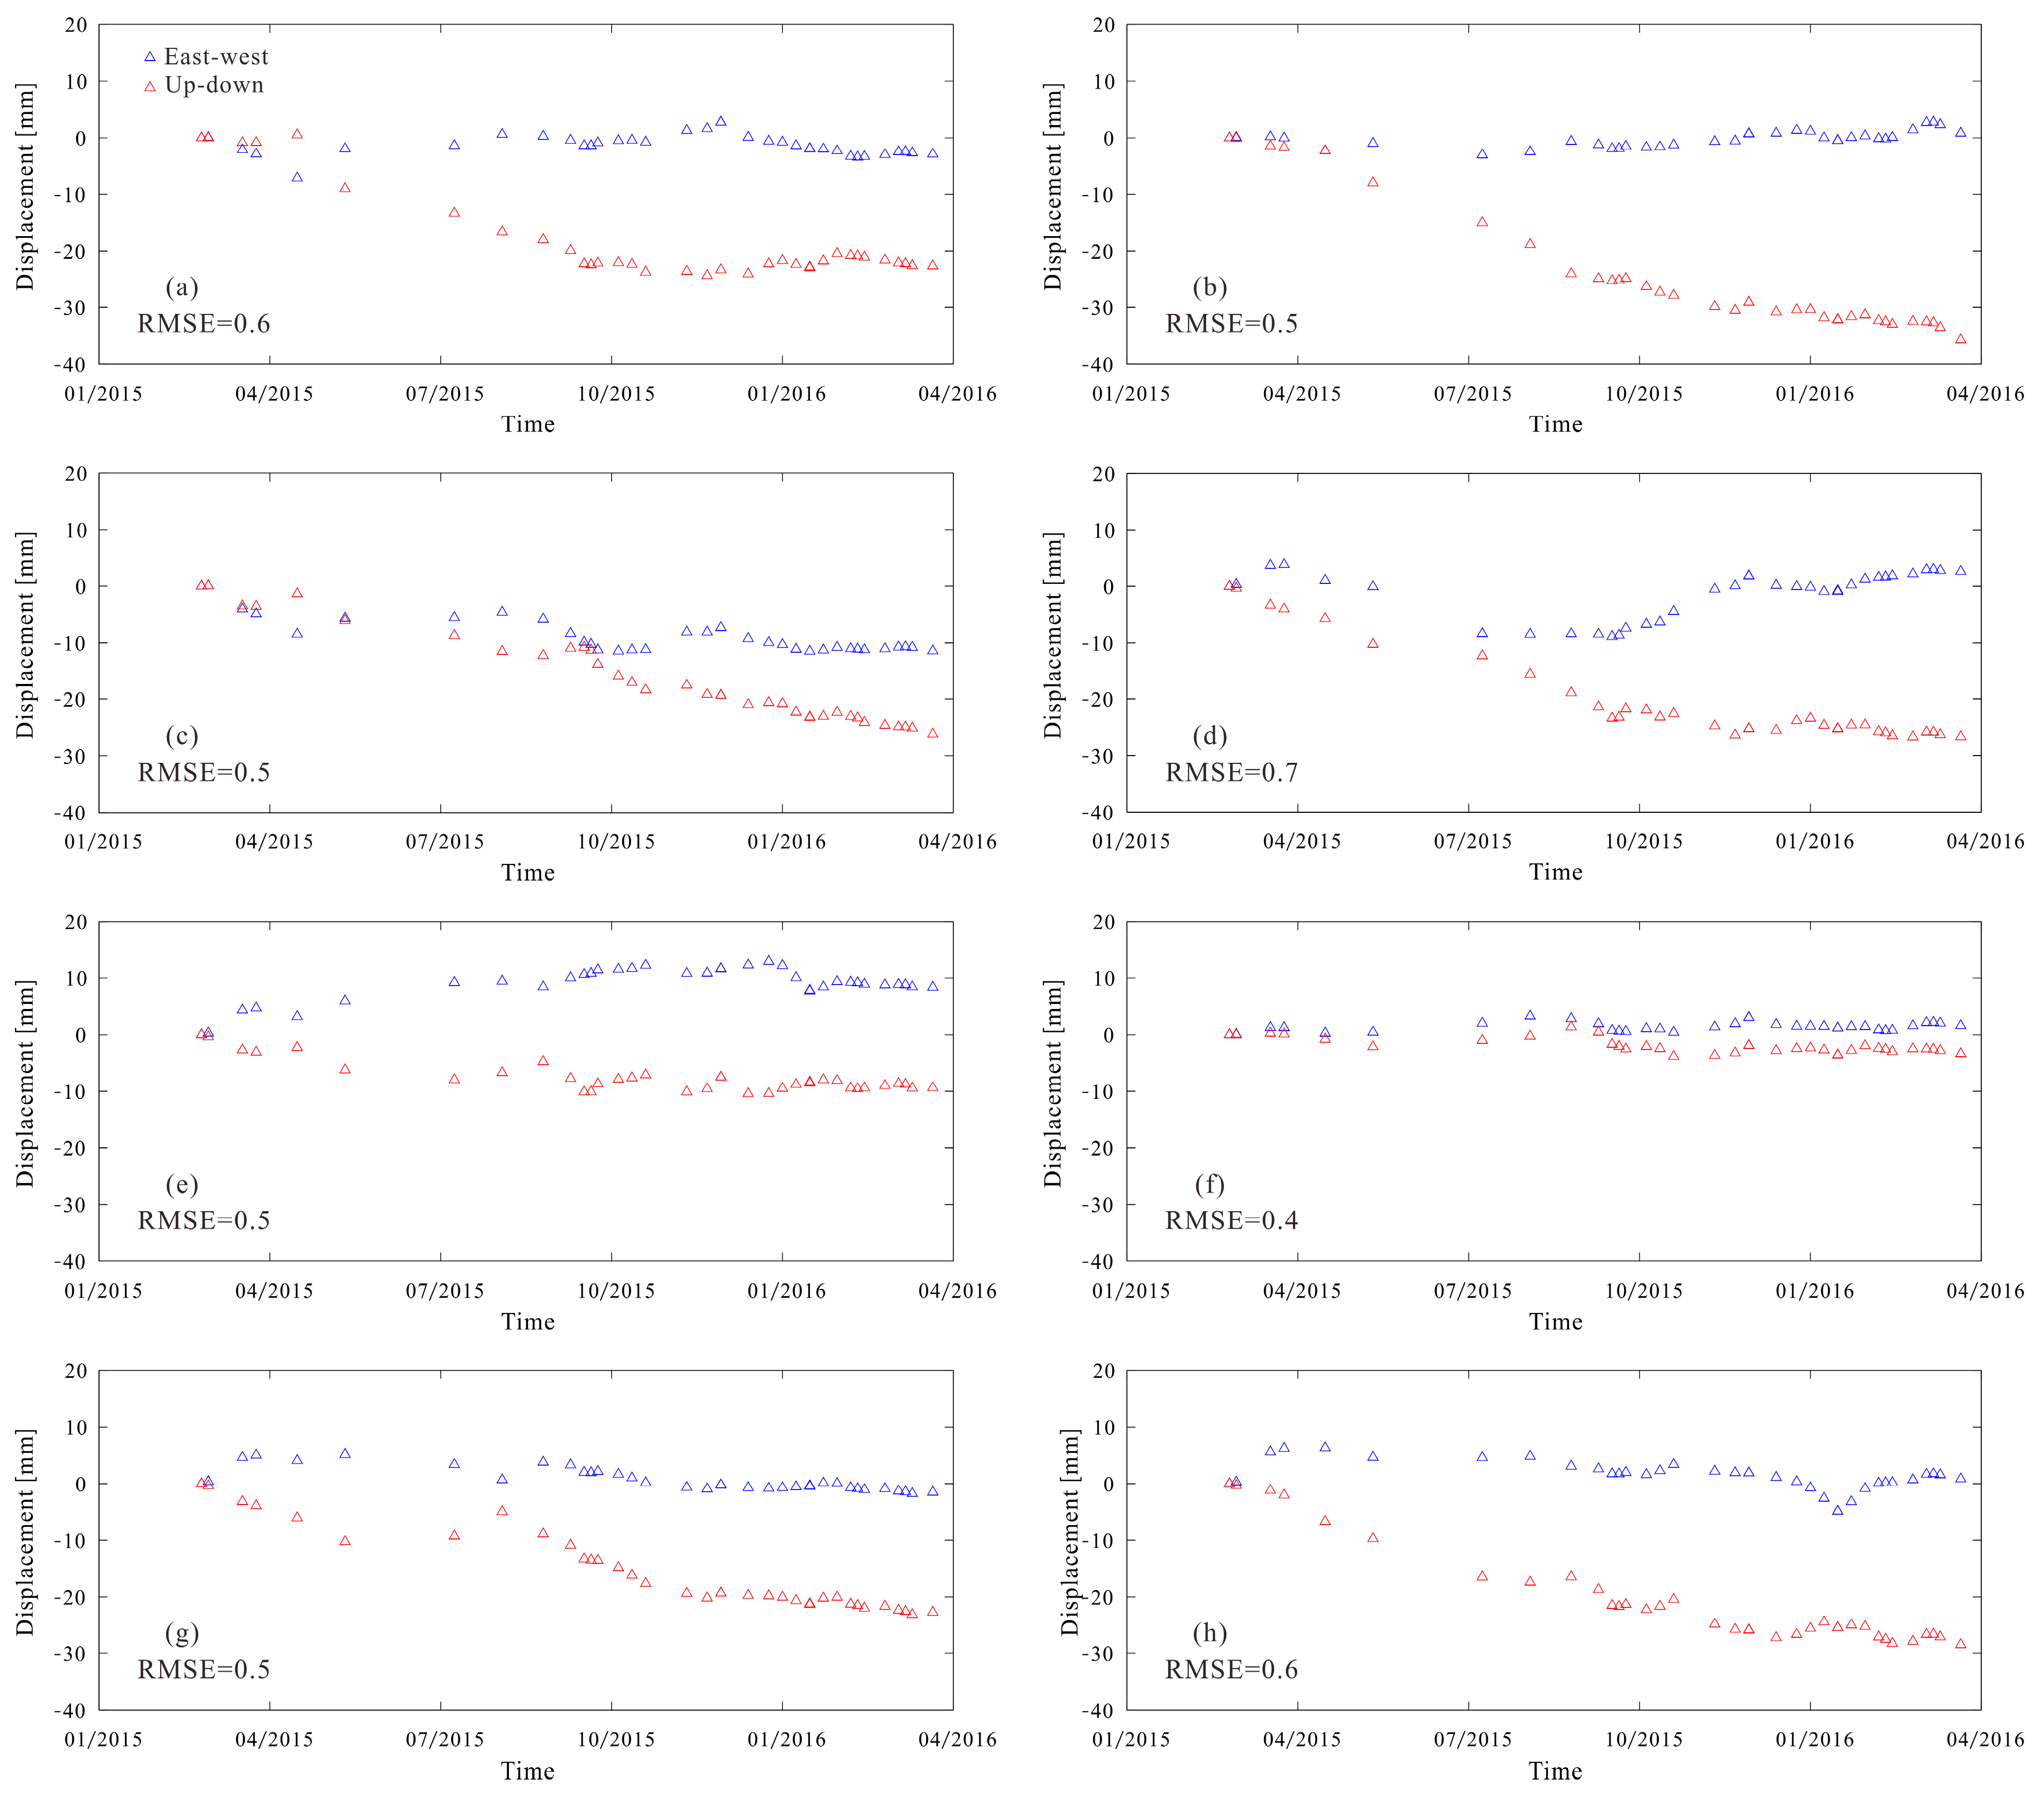
Figure 10.
2015–2016 east-west (left) and up-down (right) mean displacement velocity maps over the area of Pudong International Airport. White lines correspond to airport runways.
Figure 10.
2015–2016 east-west (left) and up-down (right) mean displacement velocity maps over the area of Pudong International Airport. White lines correspond to airport runways.
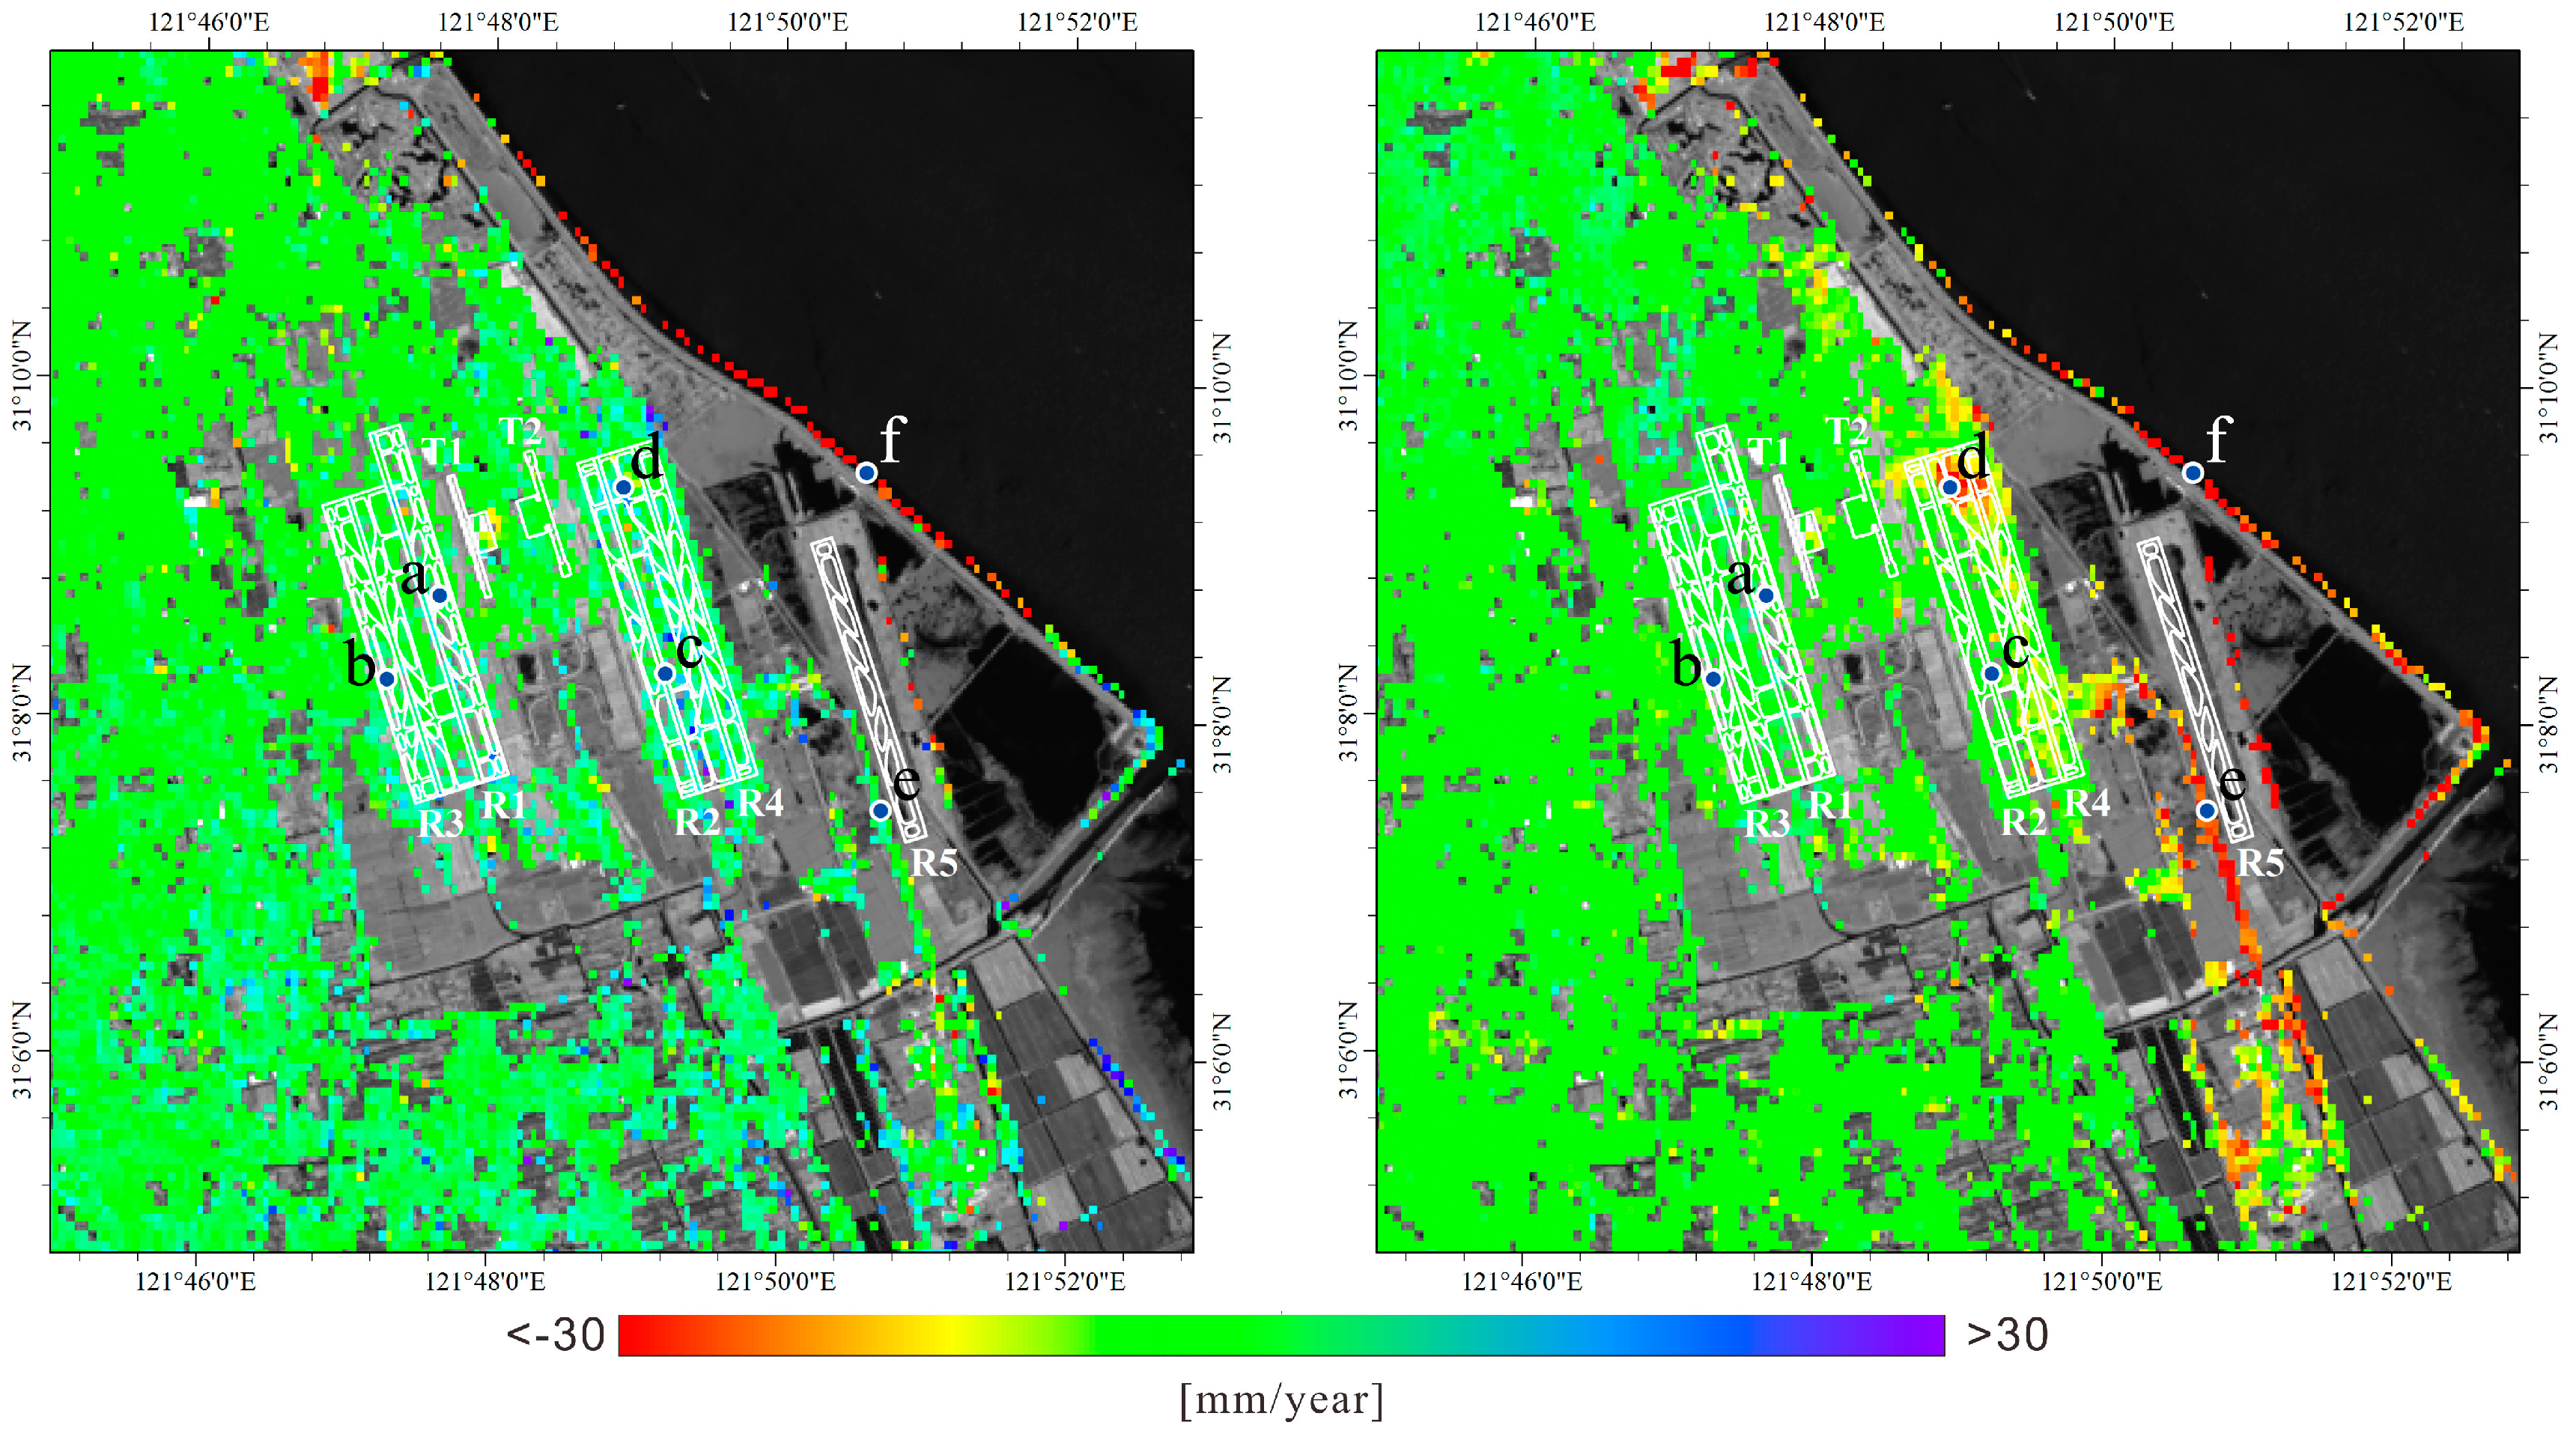
Figure 11.
Plots of the east-west (blue triangles) and up-down (red triangles) time-series relevant to ground points labeled as (a–f) in Figure 10. RMSE values relevant to each selected point are also shown.
Figure 11.
Plots of the east-west (blue triangles) and up-down (red triangles) time-series relevant to ground points labeled as (a–f) in Figure 10. RMSE values relevant to each selected point are also shown.

Figure 12.
The mean displacement velocity of each runway in up-down direction (a) and east-west direction (b) in Pudong International Airport. R1–R5 correspond to the first to fifth runway.
Figure 12.
The mean displacement velocity of each runway in up-down direction (a) and east-west direction (b) in Pudong International Airport. R1–R5 correspond to the first to fifth runway.
© 2017 by the authors. Licensee MDPI, Basel, Switzerland. This article is an open access article distributed under the terms and conditions of the Creative Commons Attribution (CC BY) license (http://creativecommons.org/licenses/by/4.0/).
Share and Cite
MDPI and ACS Style
Yu, L.; Yang, T.; Zhao, Q.; Liu, M.; Pepe, A. The 2015–2016 Ground Displacements of the Shanghai Coastal Area Inferred from a Combined COSMO-SkyMed/Sentinel-1 DInSAR Analysis. Remote Sens. 2017, 9, 1194. https://doi.org/10.3390/rs9111194
AMA Style
Yu L, Yang T, Zhao Q, Liu M, Pepe A. The 2015–2016 Ground Displacements of the Shanghai Coastal Area Inferred from a Combined COSMO-SkyMed/Sentinel-1 DInSAR Analysis. Remote Sensing. 2017; 9(11):1194. https://doi.org/10.3390/rs9111194
Chicago/Turabian StyleYu, Lei, Tianliang Yang, Qing Zhao, Min Liu, and Antonio Pepe. 2017. "The 2015–2016 Ground Displacements of the Shanghai Coastal Area Inferred from a Combined COSMO-SkyMed/Sentinel-1 DInSAR Analysis" Remote Sensing 9, no. 11: 1194. https://doi.org/10.3390/rs9111194
Note that from the first issue of 2016, this journal uses article numbers instead of page numbers. See further details here.