Satellite and Ground Observations of Snow Cover in Tibet during 2001–2015

1
Geophysical Institute, University of Bergen, Allégaten 70, N-5007 Bergen, Norway
2
Institute of Tibetan Plateau Atmospheric and Environmental Scientific Research, Lhasa 850000, China
3
Lhasa Division of the Institute of Plateau Meteorology, China Meteorological Administration, Chengdu 610072, China
*
Author to whom correspondence should be addressed.
Remote Sens. 2017, 9(11), 1201; https://doi.org/10.3390/rs9111201
Submission received: 24 September 2017
/
Revised: 28 October 2017
/
Accepted: 20 November 2017
/
Published: 22 November 2017
(This article belongs to the Special Issue Cryospheric Remote Sensing II)
Abstract
:The seasonal snow cover of the Tibetan Plateau exerts a profound environmental influence both regionally and globally. Daily observations of snow depth at 37 meteorological stations in Tibet and MODIS eight-day snow products (MOD10A2) during the period 2001–2015 are analyzed with respect to the frequency and spatial distribution of snow cover for each season and for various altitude ranges. The results show that the average snow cover percentage was 16%. Snow cover frequency was less than 21% for 70% of the Tibetan area, while it was more than 40% in eastern Tibet and in the Himalayas. We also estimated the variations in the starting times of snow accumulation and ablation. During the 15 years, both datasets revealed a significant trend of earlier onset of ablation, but no evident trend for the start of accumulation. The two datasets differed slightly with respect to the seasonal variation of snow cover. MODIS data showed more snow in winter than in other seasons, but the ground data showed most snow in early spring. For the station locations, the correlation between ground and MODIS snow cover percentage (number of snow-covered stations/number of cloud-free stations) is 0.77. Combining the advantages of remote sensing data and ground observation data is the best way to investigate snow in Tibet.

1. Introduction
Seasonal snow cover accounts for 30% of the Earth’s land surface [1] and plays an important role in global climate, hydrology and ecosystems through the snow-albedo feedback effect and the snow-hydrological effects. As the highest plateau on the Earth and with the largest existing glaciated area in the lower latitudes [2], the Tibetan Plateau (TP) exerts a profound influence on regional and global climate through thermal and mechanical forcing mechanisms [3,4,5,6,7,8]. The seasonal melting of the snowpack and mountain glaciers feeds the seven major rivers of Asia and provides fresh water to a large portion of the population of Asia [9,10]. In addition, through the snow-albedo feedback and the snow-hydrological effects, the snow cover of TP also affects the strength of the monsoon and the summer rainfall over Asia [11,12,13,14]. Therefore, monitoring and studying the distribution and variation of snow over TP have great significance.
Numerous studies have been conducted on snow cover over TP based on ground observation data, reanalysis data and remote sensing data [5,9,11,13,14,15,16,17,18,19,20,21,22,23,24,25,26,27]. Some research was based on Moderate-resolution Imaging Spectroradiometer (MODIS) data [28,29,30,31,32,33,34]. These studies described the characteristics of snow cover over TP and its relationship with atmospheric circulation and water cycle systems and responses to climate change. However, to the authors’ knowledge, few papers are related to the Tibet Autonomous Region (Tibet). Tibet is located in the southern part of the TP. Due to the warm and humid air of the Indian Ocean and Tibet’s unique surface properties, the snow in Tibet is different from that of the whole TP. With the Earth’s population growing rapidly and human activities continuing to expand and strengthen, the Earth is extensively experiencing the effects of climate change. Higher temperatures and increasing amounts of pollutants in the atmosphere not only directly cause the melt of permanent snow and glaciers, but also indirectly change the amount of snowfall and the length of the snow season. This has a great impact on the ecological environment and economic society in Tibet and surrounding areas. Hence, extensive research on the snow cover distribution and variation in Tibet is necessary.
Because of the harsh climate and complex terrain of Tibet, as well as its vast sparsely-populated areas, meteorological stations are few in number, especially in the western part. The limited ground observation data do not meet the standard of complete operational snow monitoring. Satellite remote sensing data have greatly mitigated this shortcoming, as they make daily observations for the entirety of Tibet possible. Especially the MODIS data with its high spatial and temporal resolution play an important role in snow monitoring and scientific research. However, the MODIS snow data products do not record snow depth. Although microwave remote sensing can obtain snow depth information, a precise retrieval of snow depth is difficult in Tibet due to the complex terrain [35]. Compared with remote sensing data, ground observed snow data are usually considered more accurate, especially in TP [24]. Hence, the combined use of data from meteorological stations and remote sensing is a feasible way to investigate the distribution and variation in snow cover in Tibet.
In this paper, we use the daily observations of snow depth at 37 meteorological stations in Tibet and the MODIS eight-day snow products (MOD10A2) with 500-m resolution to investigate the snow cover in Tibet during the period 2001–2015. The frequency and spatial distribution of snow cover for the various seasons and different altitude ranges are analyzed. In addition, we study variations in the starting time of snow accumulation and ablation in Tibet. In the Discussion section, we compare the results from the two datasets. However, the trends described in this paper do not represent long-term trends since the study period is only 15 years.
2. Study Area and Data
2.1. Study Area
Tibet is located in southwestern China and is the second-largest province-level division of China by area, spanning over 1.2 × 10⁶ km2. Figure 1 shows the topography of the study area and the location of the 37 stations used in this study. Tibet has a very complex topography that is divided into four parts: the Himalayan high mountains, the northern plateau, the southern valleys and the eastern canyons. The complex terrain largely shapes the weather and climate of Tibet. From southeast to northwest, the climate zones of Tibet are composed by tropical mountain humid monsoon climate, plateau temperate monsoon climate, frigid plateau monsoon climate and sub-frigid monsoon climate. In such complex geographical and climatic conditions, representative ground measurements of snow cover are difficult and must be supplemented by remotely-sensed data. Therefore, the combined use of remote sensing and ground observation data is undoubtedly the best way to conduct snow research in Tibet.
2.2. MODIS Eight-Day Snow Products
The National Snow and Ice Data Center of the U.S. (NSIDC) has offered MODIS snow cover products since March 2000. The snow-mapping algorithm is based on a Normalized Difference Snow Index (NDSI) and other criteria tests. The eight-day Snow Cover data (MOD10A2) is a Level 3 product with 500-m spatial resolution. The “Maximum-Snow-Extent” (MSE) is one of the datasets of MOD10A2. The algorithm of the MSE first checks MODIS Daily Snow Product files (MOD10A1) from the same eight-day period and then orders them chronologically. The multiple days of observations for a cell are examined. If snow cover is identified for any day, the cell in the “MSE” is labeled as snow. If no snow is found, but a single value occurs more than once, that value is given for the cell. Otherwise, if mixed observations occur, e.g., land and cloud over multiple days, the algorithm is biased to clear views in the period and will label a cell with what was observable. The logic minimizes cloud cover extent in that a cell would need to be cloud obscured for all eight days to be labeled as cloud. The intent of the MOD10A2 is to maximize the number of snow pixels while minimizing the number of cloud pixels [36]. The comparison between daily MODIS snow products (MOD10A1) and MODIS eight-day maximum snow products (MOD10A2) has been conducted in previous research, which showed that generally, the MOD10A2 products agree better with ground observations [37,38,39,40]. Pu et al [28] and Wang et al [16] found that the accuracy of MOD10A2 in detecting snow on TP was 90% and 85%, respectively. Therefore, the MOD10A2 comprises reliable data for the investigation of the spatial and temporal variation of the snow cover over Tibet.
Fifteen years of MOD10A2 datasets were obtained for this study, ranging from 1 January 2001–31 December 2015. Each eight-day dataset is called one period; hence, there are 46 annual periods (Since this makes 368 days, the first couple of days in each year are represented twice in the eight-day dataset. However, this artifact does not have any distinguishable effect in our results.). Because the probability of cloud cover is much higher in the afternoon than in the morning over Tibet [41], we used only the data from the morning satellite Terra, which passes the study area at about 10 a.m. (Beijing time). This is also convenient because the ground observations are made in the morning (8 a.m.). Three MOD10A2/Terra datasets (18–25 June 2001, 26 June–3 July 2001, 22–29 March 2002) are lacking in the portal of NSIDC. Therefore, 687 8-day periods make up these 15 years.
We used the MODIS Reprojection Tool (MRT) [41], the Geographic Information System (GIS), and MATLAB to process the MODIS data. Native MOD10A2 data stored in Hierarchical Data Format of Earth Observing System (HDF-EOS) format with the sinusoidal projection include the categories of snow-covered ground, snow-covered lake ice, ground that is not snow covered, water and cloud [36]. The data are supplied as tile data, and five tiles cover Tibet. The MODIS data are processed in three steps: (1) mosaicking the five individual tiles into one map and re-projecting it to geographic latitude/longitude projection for each period by using MRT, (2) extracting the data of Tibet Autonomous Region from the merged five tiles’ data using GIS, and (3) extracting the snow and cloud information for all periods in GIS. In order to compare with the snow observations at the ground stations, two further steps were taken: (4) The MODIS snow parameter for each location of the 37 stations is extracted by using ‘The Maximum Neighborhood Analysis’ tool in GIS [42,43]. The procedure is to extract the values of the station pixel and its eight surrounding neighbor pixels from the MOD10A2 data. These nine pixel values are then examined, and if any of these nine pixels appears to have snow, this station is identified as having snow. If there are no snow pixels, the no-snow value is given for all other cases. Through this processing, the following binary output remained for each station: snow or no-snow. (5) To remove cloud-covered stations, we also extracted the cloud parameter by using the ‘The Sum Neighborhood Analysis’ tool in GIS. Similarly to Step (4), we examined the nine pixels around the station site. If all nine pixels are cloud covered, then this station is judged as a cloud-covered station and is not included in the calculation of the snow cover percentage.
2.3. Ground Observed Daily Snow Data
We used the daily data of snow depth at the 37 meteorological stations (see Appendix A and Figure 1 for their positions) to infer the stations’ snow cover.
According to the snow observation convention of China Meteorological Administration (CMA), snow depth is measured in integer centimeters with a minimum value of 1 cm [43]. The daily snow depth is measured at 8 a.m. Beijing time (0 GMT). In this study, a day with snow depth ≥1 cm is registered as a snow-covered station.
2.4. Ground Observed Monthly Precipitation and Air Temperature
We used monthly average precipitation and air temperature from the 37 stations in the Discussion section to explain the differences in snow variation between the MODIS snow product and station data during the transition seasons.
2.5. DEM Data
Combined with ArcMap software (Environmental Systems Research Institute, Inc. (Esri), Published in New York, the USA), we used the Shuttle Radar Topography Mission (SRTM) Digital Elevation Model (DEM) data with 90-m resolution downloaded from NASA/USGS (https://earthexplorer.usgs.gov/). We needed these topography data to investigate how MODIS snow cover varies with altitude. For that purpose, we divided the topography into five altitude ranges: below 3000 m, 3000–4000 m, 4000–5000 m, 5000–6000 m and above 6000 m (According to previous work [44,45], the SRTM DEM is better than the Advanced Spaceborne Thermal Emission and Reflection Radiometer (ASTER) Global Digital Elevation Model (GDEM) in plain areas, but their accuracies on the plateau are similar. However, Singh et al. [46] found that the accuracy of ASTER GDEM is better than SRTM DEM in Himalayan regions. To roughly judge the quality of these two DEM data in Tibet, we compared the ASTER GDEM and SRTM DEM altitude estimates at 181 control points spread over TAR. The average error was 22 m for both, and the standard deviation of the error was nearly equal; 139 and 141 m for DEM and GDEM, respectively.).
3. Results
3.1. Snow Cover Characteristics and Variations over Tibet Based on MOD10A2 Data
3.1.1. Annual Snow Cover Frequency and Spatial Distribution
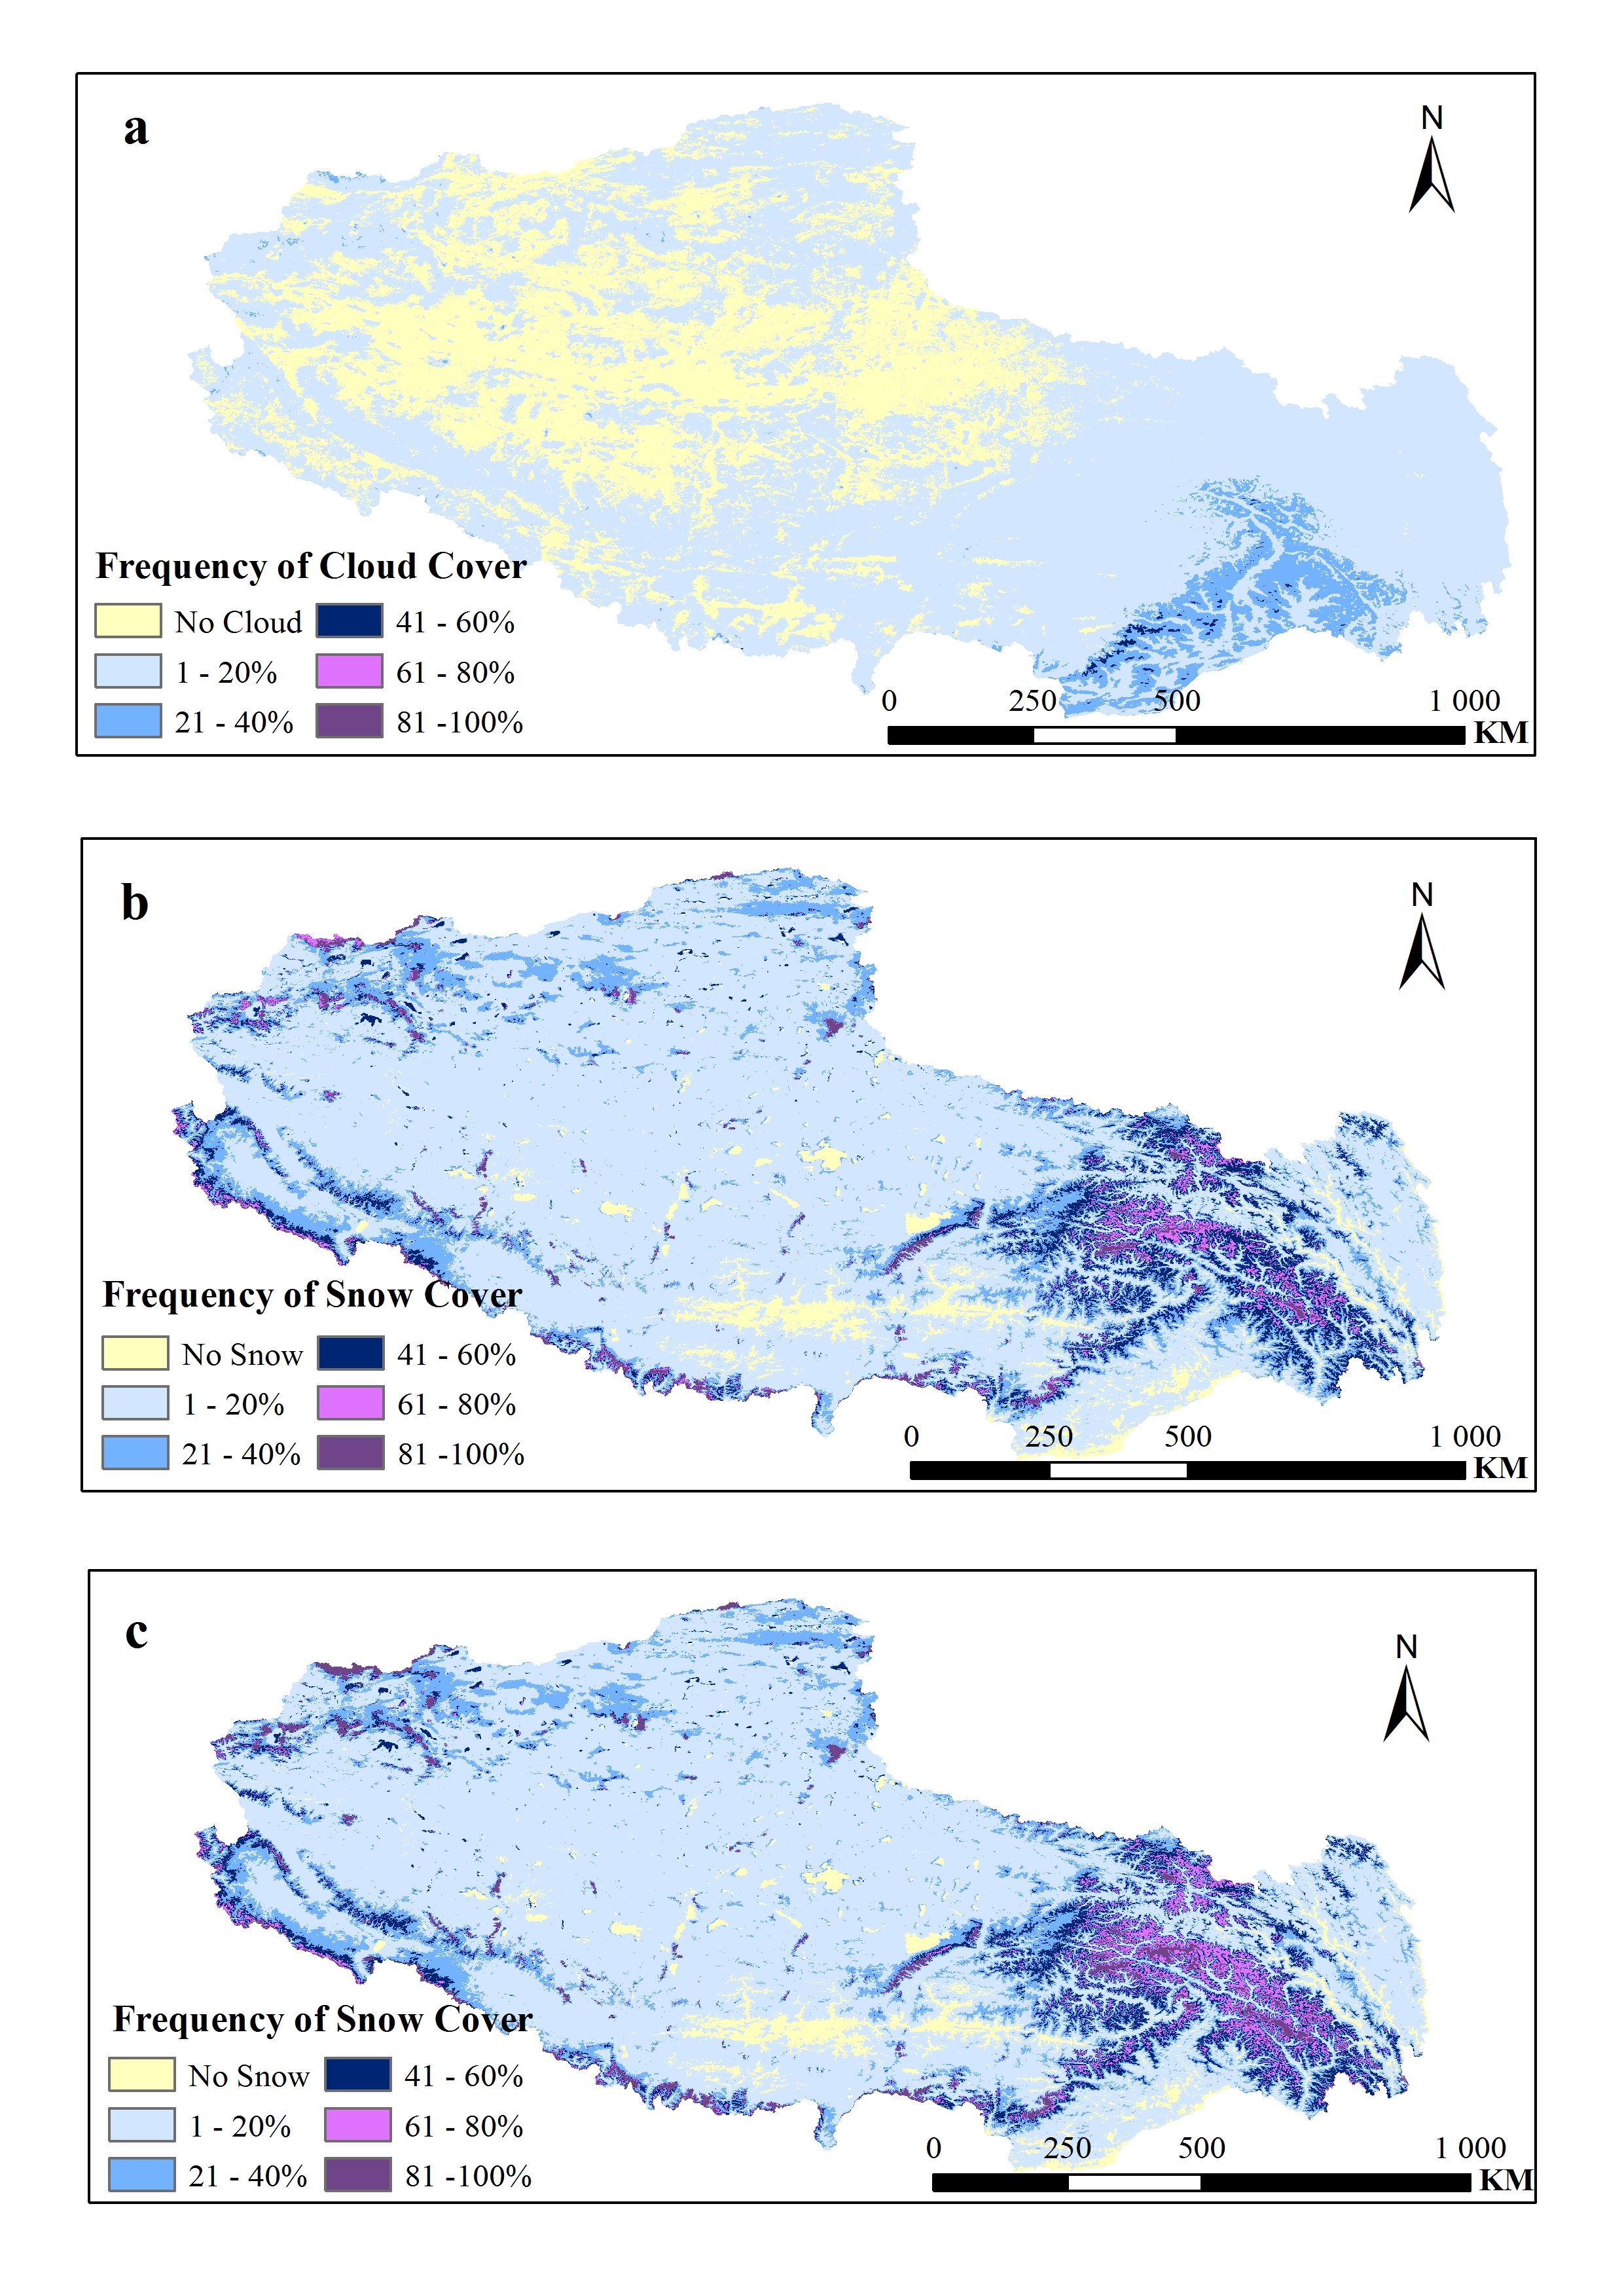
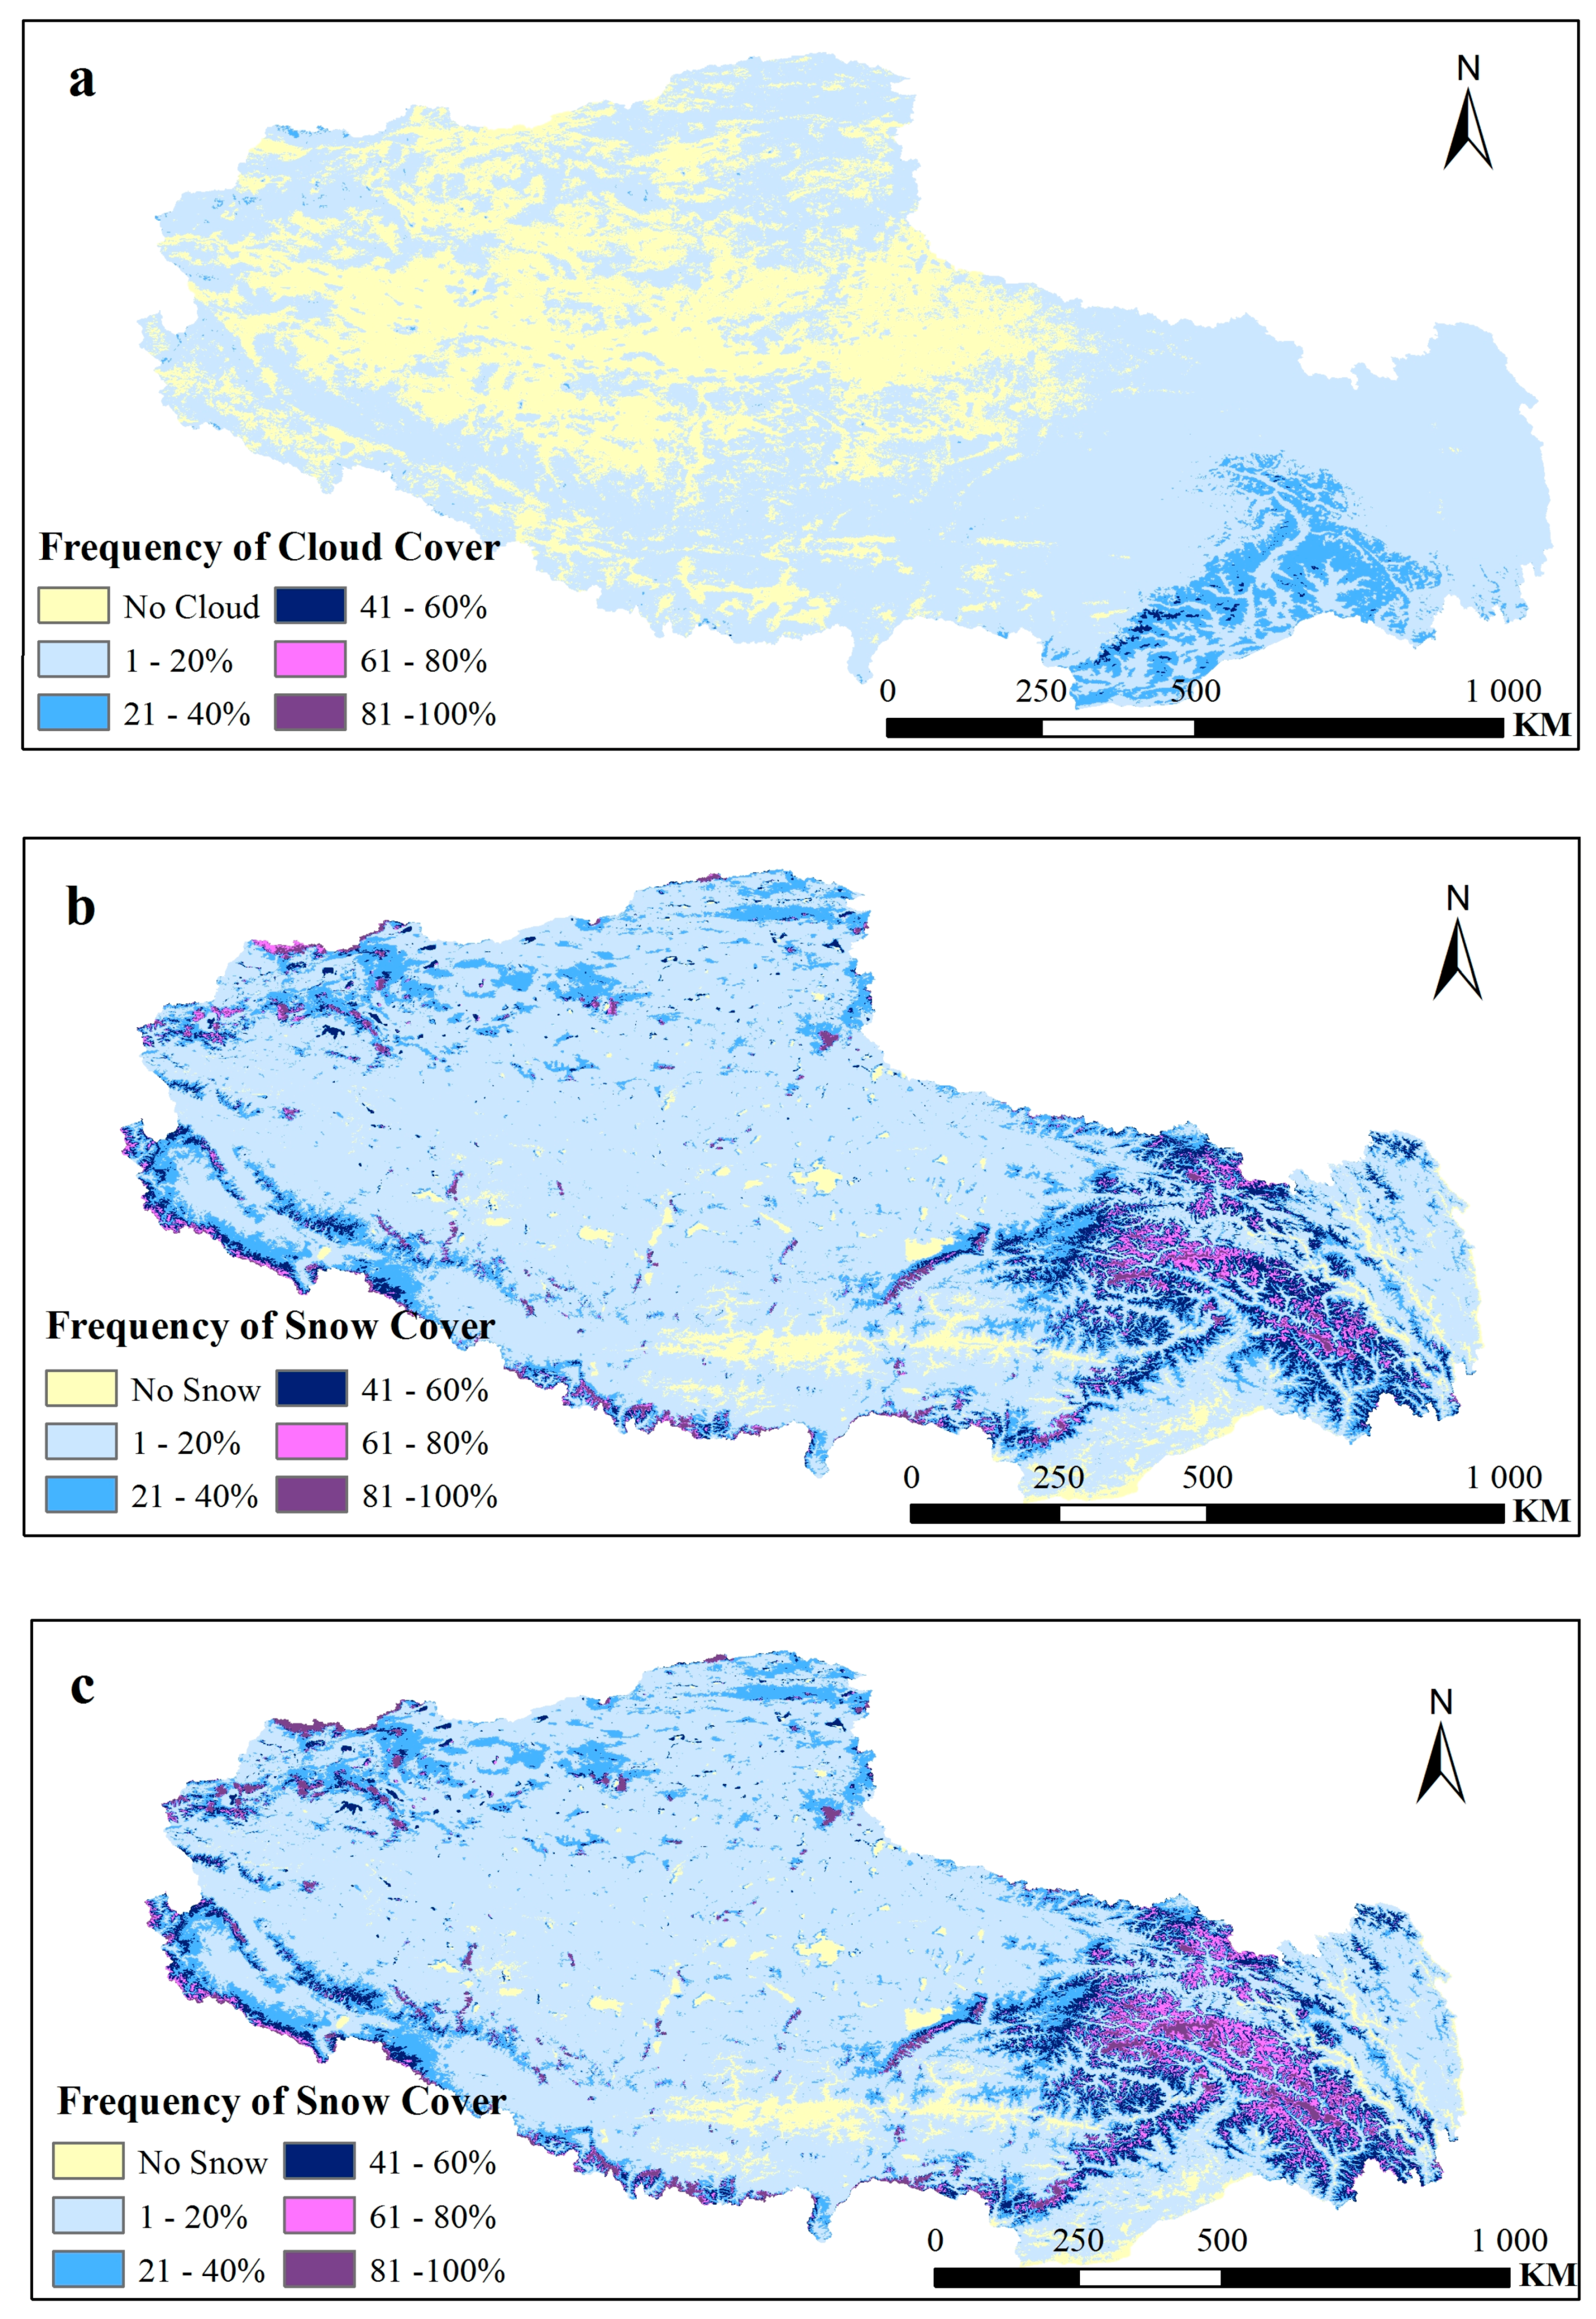
Frequency is an important feature of snow cover distribution and variation. Using the multi-period snow cover images, we can calculate the annual and seasonal snow cover temporal frequency of each pixel. If we let SP be the number of periods with snow cover at a given pixel, the snow cover frequency for that pixel is simply . The geographical distribution is shown in Figure 2b. However, due to the impact of clouds in remote sensing data, snow cover frequency is usually underestimated. In spite of the fact that MODIS eight-day snow products have minimized the number of cloud pixels, cloud influence is not completely eliminated. Hall and Riggs [47] pointed out that “A limitation of the MOD10A2 is that persistent cloud cover over consecutive days or all days of the period can hide snow cover that may have existed during some or all of the period”. The seasonal snow is relatively thin in Tibet and melts easily because of the dry air and strong radiation. If clouds cover snow for an entire eight-day period or snow falls and melts during the sequential cloud cover days, the snow cover will not be mapped for this period. Let CP be the number of periods with persistent cloud cover at a given pixel (‘persistent’ means that the pixel is cloud covered for the entire eight-day period). Figure 2a shows the geographical distribution of persistent cloud frequency . When a pixel is cloud covered for the whole eight-day period, it is as if the MODIS instrument for detecting snow cover is turned off. Thus, MODIS will register fewer snow cover periods, and we have to subtract the number of persistent cloud periods (CP) from the total number of periods to estimate correctly the frequency of snow cover. With this correctly the frequency of snow cover. With this correction, F, is given by:
where both the snow and cloud information is extracted from MODIS 8-day snow products. This correction is based on the assumption that the cloud-covered pixels have the same frequency of snow cover as the cloud-free pixels. Figure 2c shows the snow frequency in Tibet during the 15 years after correction. Especially, the correction is evident for the eastern parts of Tibet, where persistent cloud cover is mainly found. However, the higher the CP, the lower is the accuracy of the frequency estimate because of the reduced sample size.
The spatial distribution of snow cover is very uneven and corresponds well with the topography. High mountain regions such as the Himalaya Mountains in the south and the Nyainqentanglha Mountains in the east are frequently snow covered. In these areas, frequencies of snow cover reached more than 60% during 2001–2015. However, the vast interior area seldom had snow cover. More than 70% of Tibet’s area had a snow cover frequency of less than 21%. The yellow regions in Figure 2c, an area of 4% of Tibet, had no snow cover during the 15 years. The snow-free areas are dominated by lakes and rivers that are labeled as water or lake ice in winter in MODIS snow products. For the remaining yellow areas, it does not necessarily mean that they had no snowfall during the 15 years, but the MODIS instrument may not have captured the rare event because clouds hid the snow cover. Table 1 details the areas of snow cover at different frequency ranges and the percentage of the total area of Tibet.
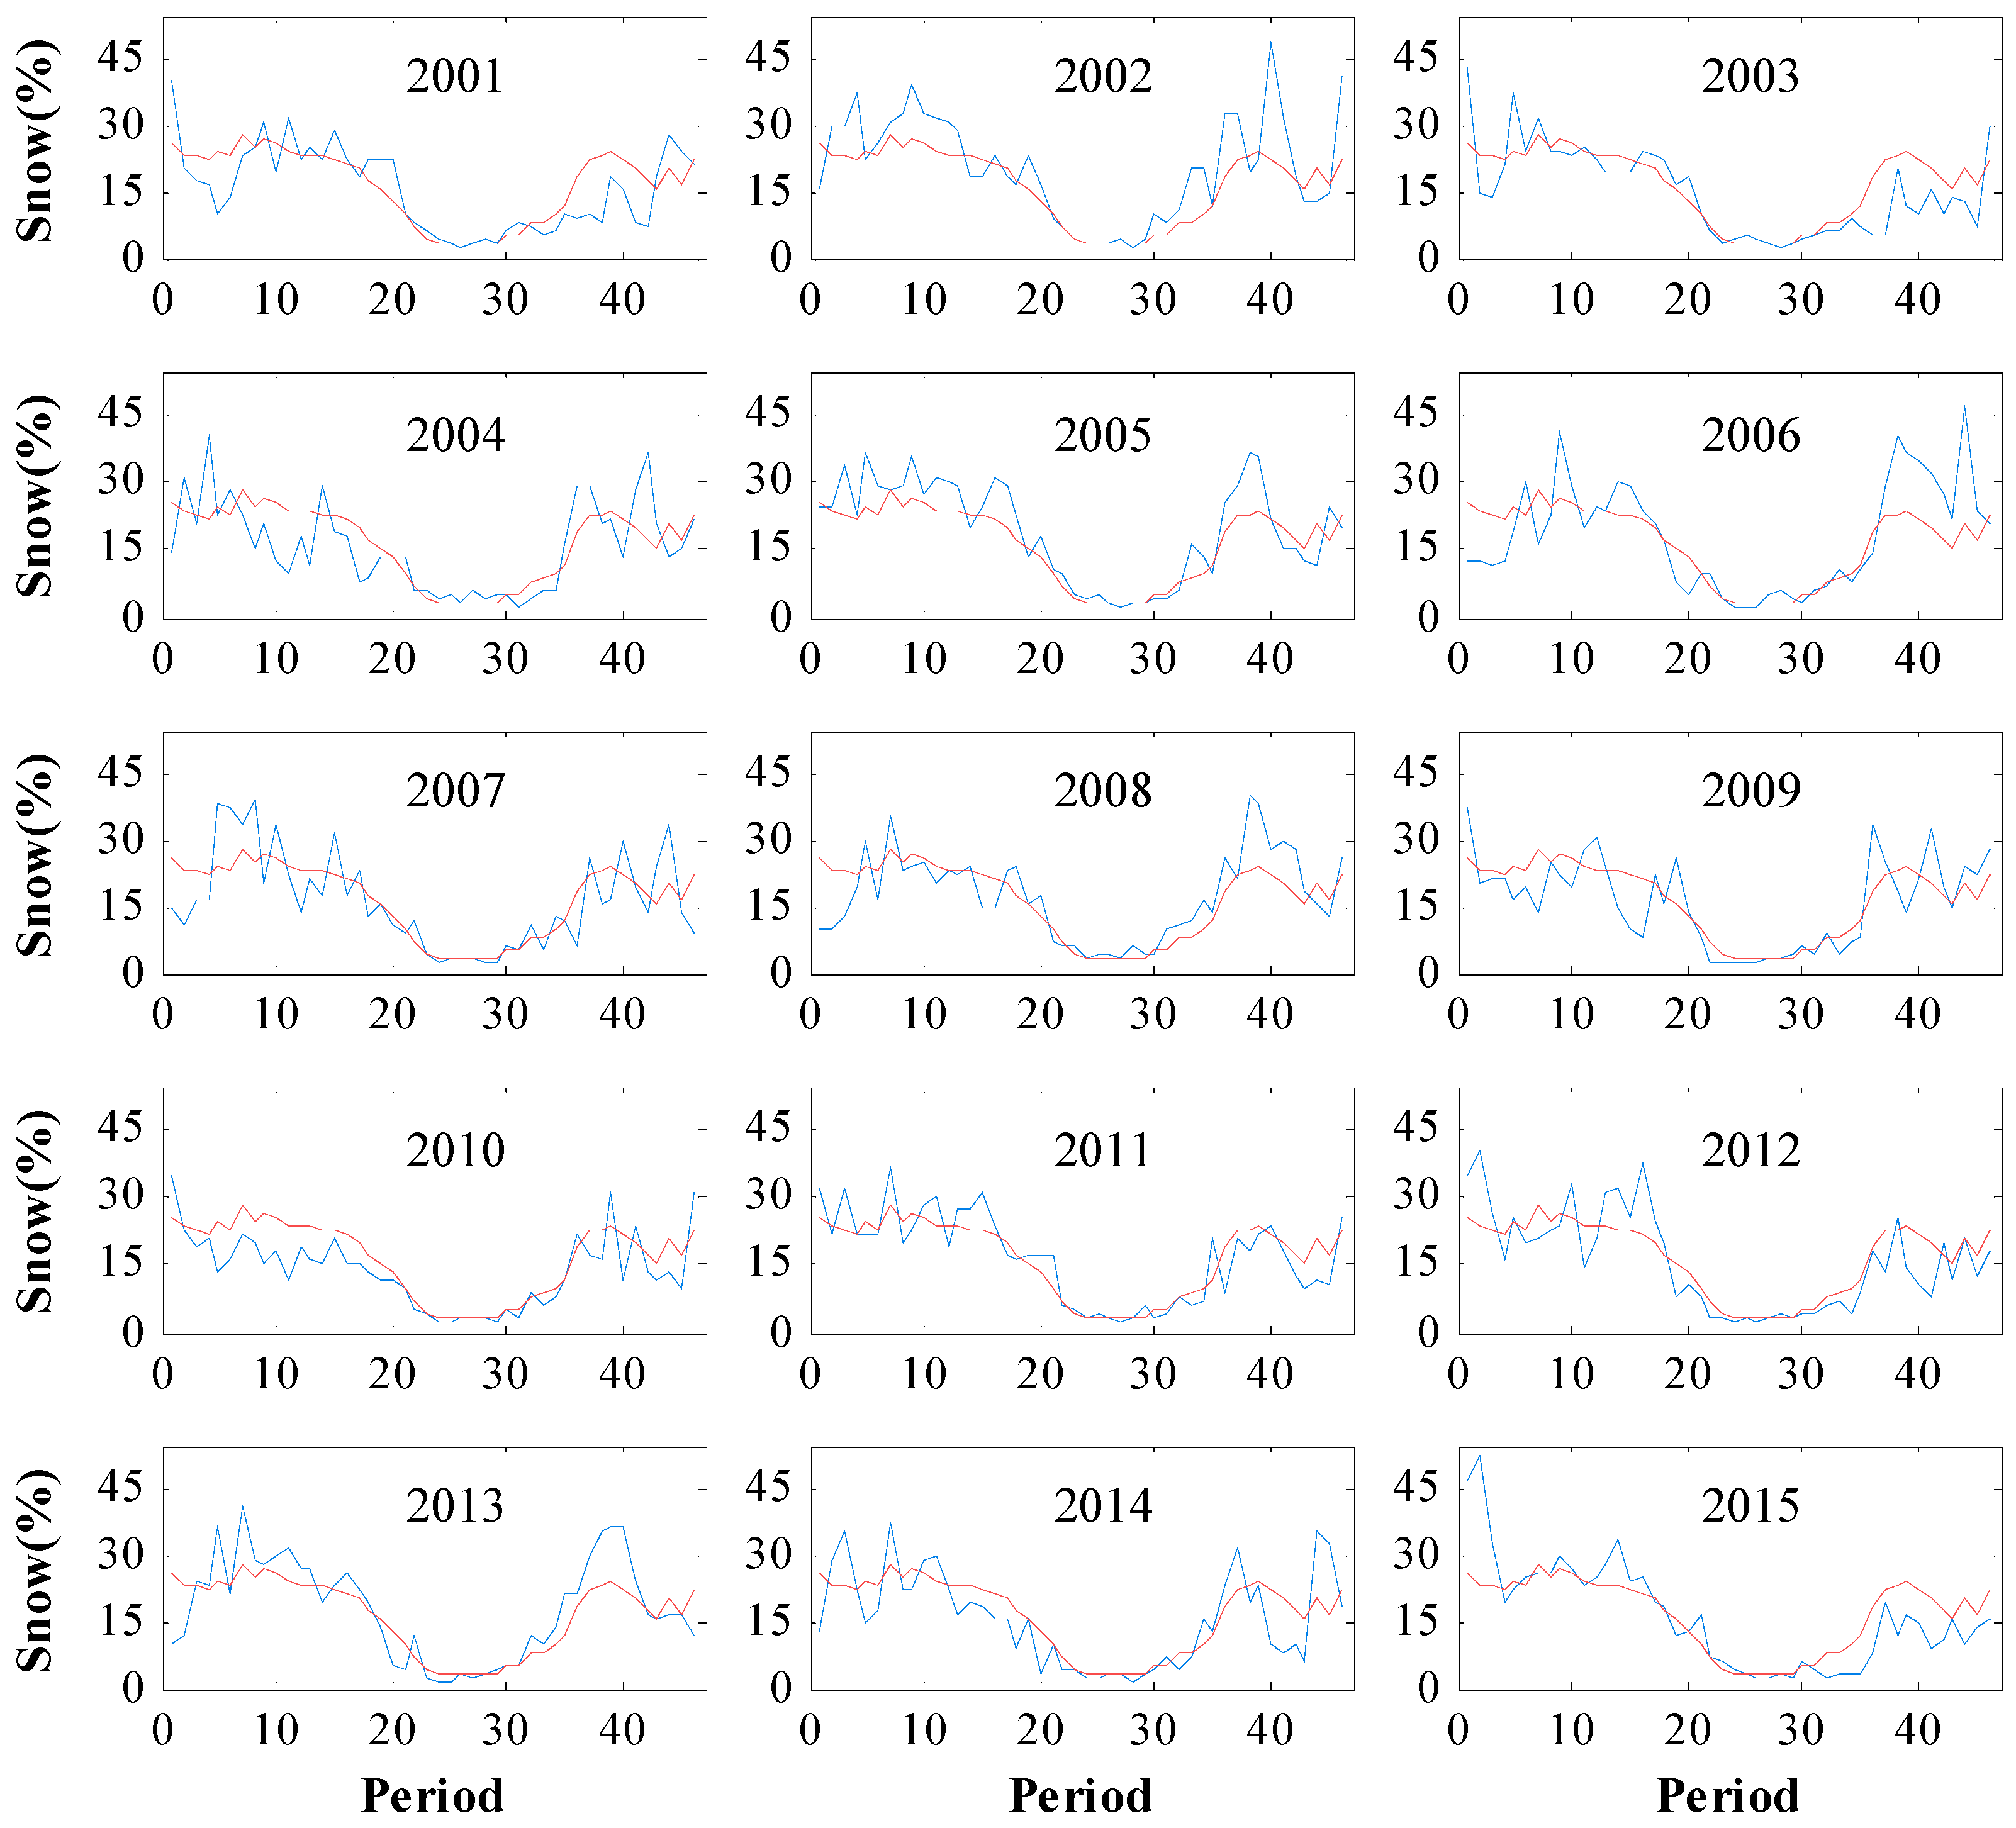
The annual cycle of snow cover for each of the 15 years is plotted in Figure 3. Due to the snow cover being highly related to the local climate and the weather systems, the curves show large annual and snow season variability. The snow cover in Tibet varies between a minimum of about 2% in summer and near 30% in winter with a secondary peak in autumn and a smaller dip in early winter. The latter is due to relatively mild temperatures and little precipitation as snow. The average percentage of the 15 years is 16.7%. The maximum snow cover of the 687 periods took place in January of 2015 with 52%, which was mainly distributed in middle and western Tibet. The largest average annual snow cover was in 2002 with 20.3%. In the autumn, there was a large snow extent that was followed by a second large extent after the early winter dip. However, the rest of that winter was normal (see the panel for 2003). On the other hand, the snow cover in 2010 (13.8%) was less than in other years.
3.1.2. Spatial Distributions of Snow Cover Frequency for Different Seasons
In the MODIS eight-day snow products, a year is covered by 46 periods, which cannot be split equally into four parts. Hence, the 46 periods are divided into four seasons as shown in Table 2: summer and spring consist of 11 periods and autumn and winter of 12 periods. The dates of the four seasons roughly correspond to the traditional classification December, January, February (DJF), March, April, May (MAM), June, July, August (JJA) and September, October, November (SON).
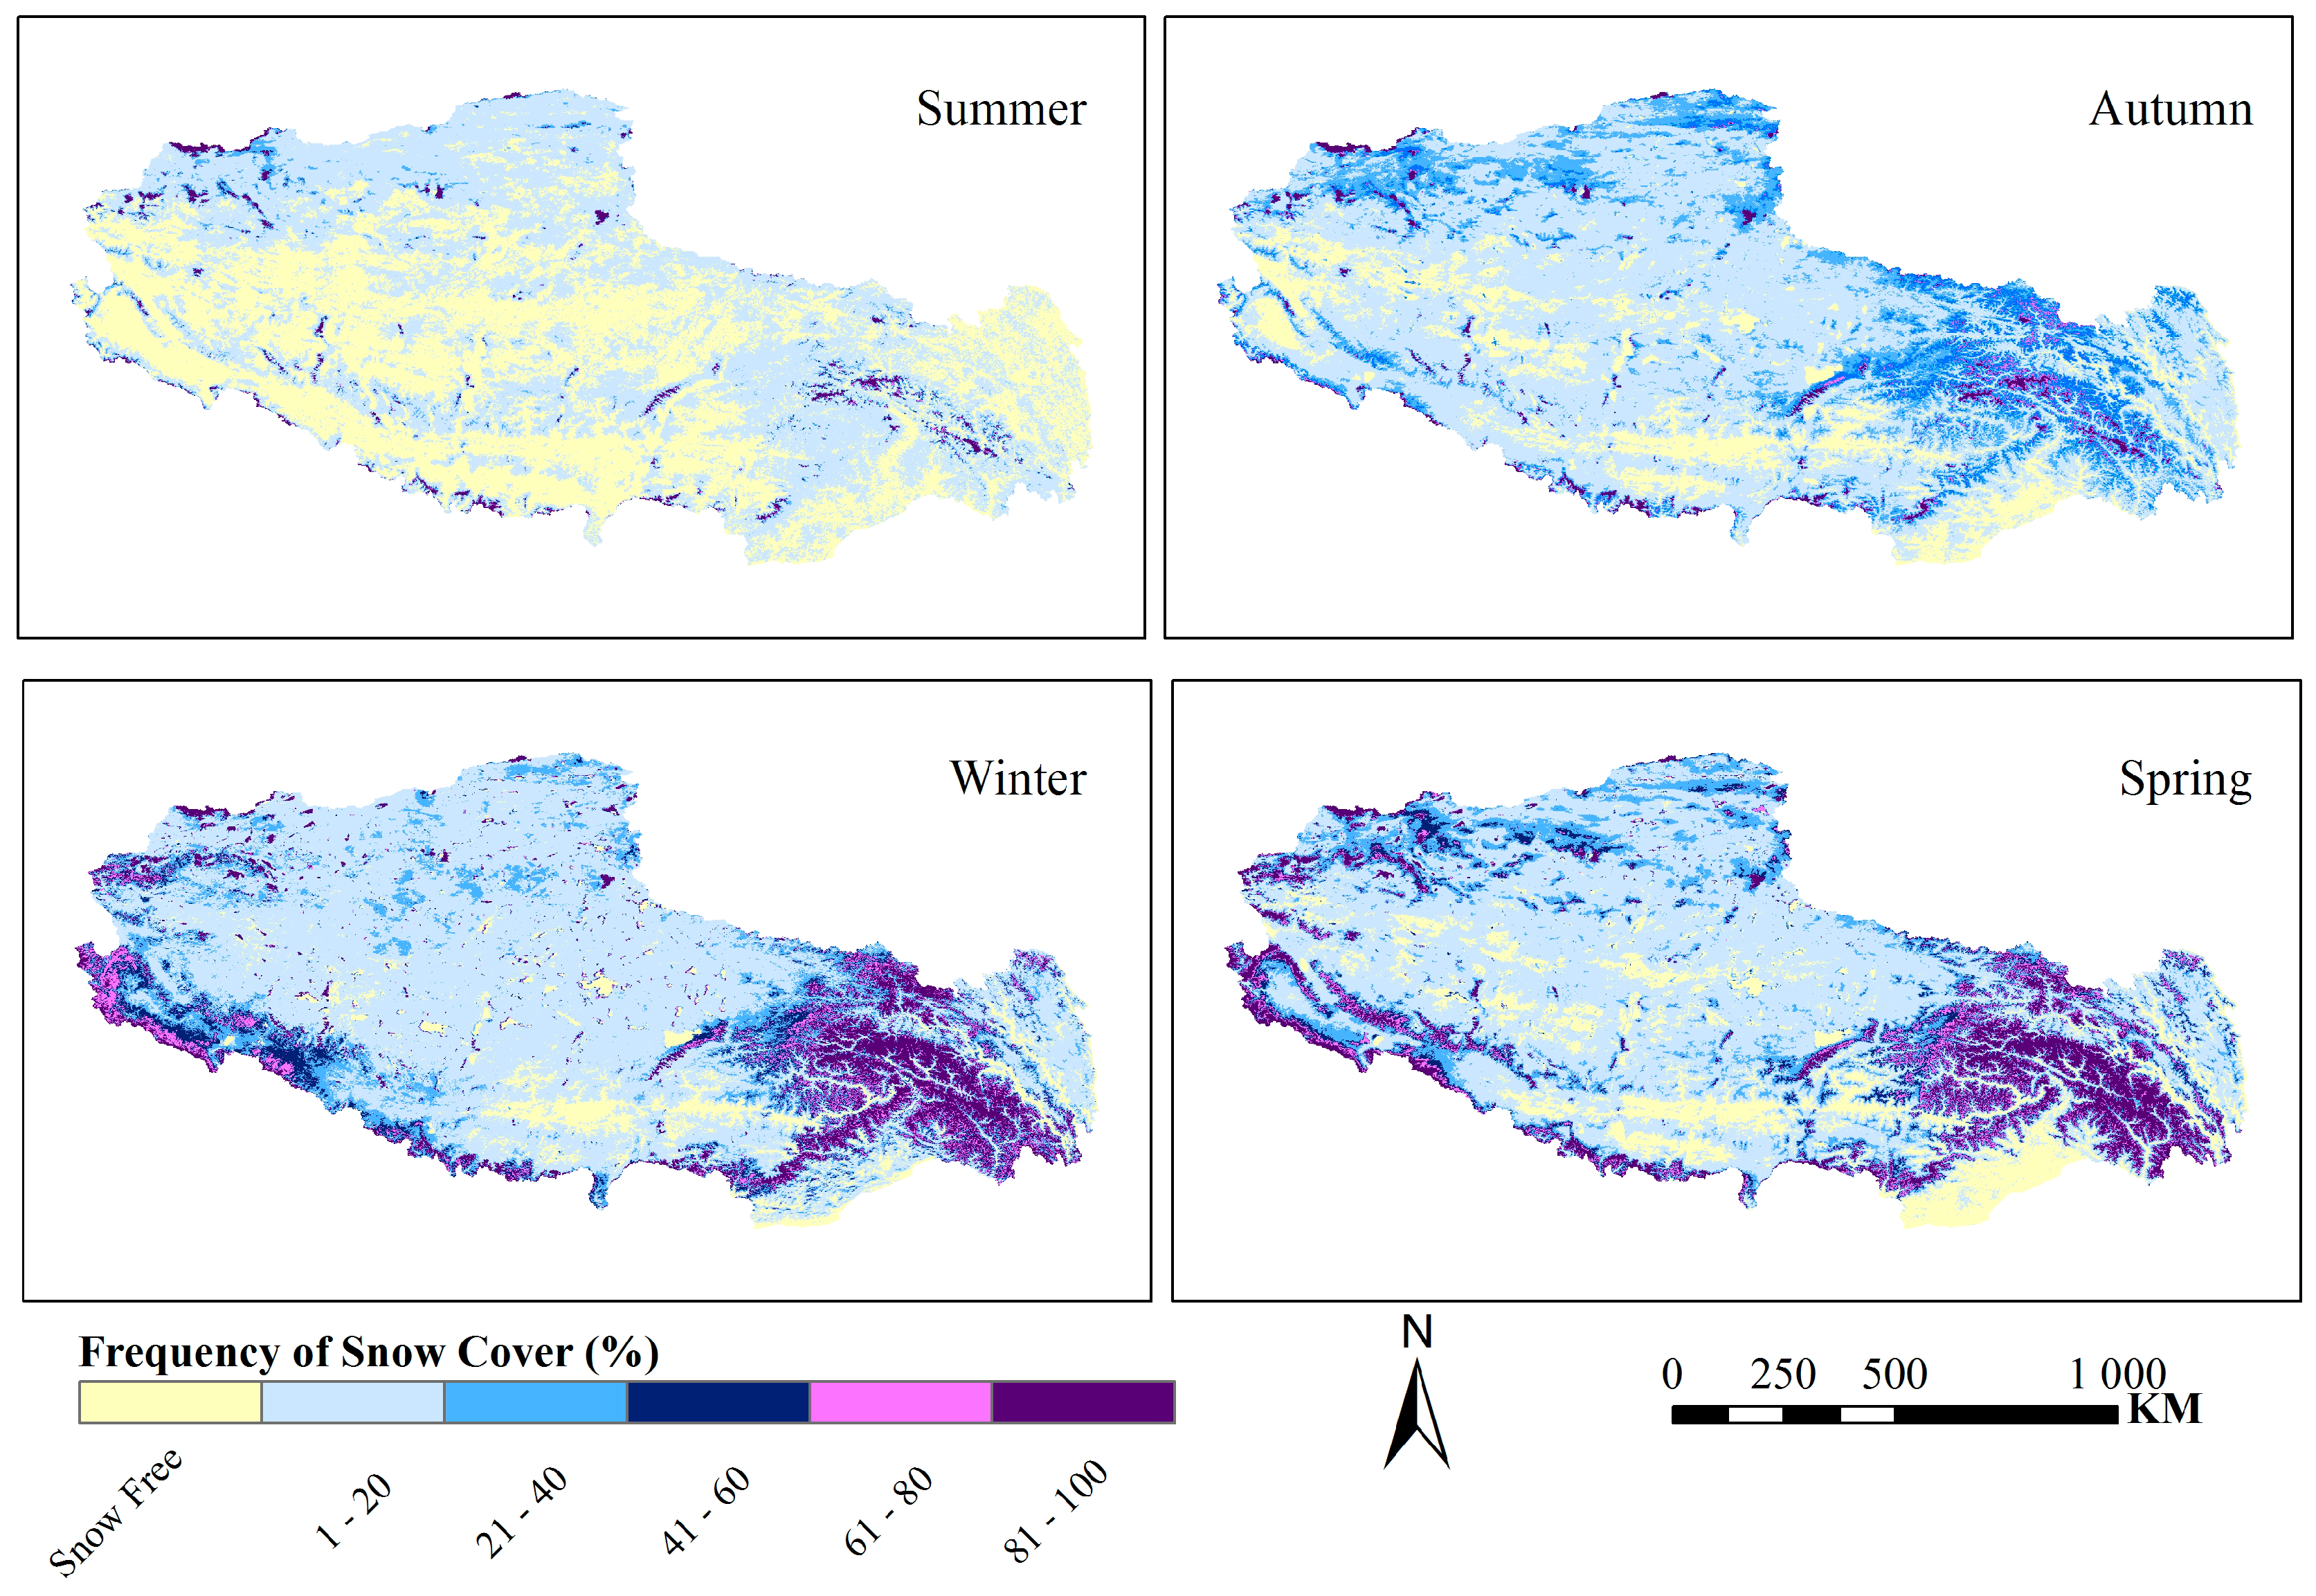
As for the annual snow cover, the seasonal snow cover frequency is corrected for persistent cloud cover. Table 3 lists the frequency of persistent cloud cover for each season. In winter, 65% of Tibet’s area experienced persistent cloud cover in the frequency range of 1–20%. Figure 4 gives the spatial distribution of snow cover frequency after correction for the four seasons. Overall, the snow cover frequencies are mainly below 21% for all seasons. The snow-covered area is most extensive in winter, followed by spring and then autumn. The snow cover frequency over the Nyainqentanglha Mountain region is higher than elsewhere through all seasons. In this area, the extent of the high frequency range (>80%) is similar during winter and spring, but the extent of the medium frequency range (40–80%) is larger in winter than in spring. The extent of the snow-free area is larger in spring than in winter. Over the regions along the Himalayas and the Gangdise Mountains in southern Tibet, the extent of the high frequency range is larger in spring than in winter. In the northwestern part of Tibet, the extent of snow cover in autumn is larger than in other seasons, but the frequency is less than 60% for most areas. The seasonal characteristics of snow cover are not so clear in the relatively flat areas in central and westernmost Tibet due to the frequencies being less than 21% for most areas.
3.1.3. Spatial Distributions of Snow Cover Frequency for Different Altitudes
The topography of Tibet is here divided into five altitude intervals (see Table 4). The geographic distribution of the five altitude intervals are shown in Figure 1, and Table 4 gives the percentage of Tibet that each interval composes. Based on the spatial frequency distribution of snow cover during the period 2001–2015 (Figure 2), the area (in percentage of the total Tibetan area) of each altitude interval which has been snow covered is also listed in Table 4. Thus, the area can be permanently snow covered or just snow covered once. Almost all regions above 5000 m have been snow covered. The 3000–3999-m interval has the highest fraction of area (nearly 1/5) that has not been snow covered.
The snow cover frequency distribution of the five altitude intervals is presented in Figure 5. For areas with altitudes below 6000 m, snow cover frequencies are mainly below 21%. The areas are decreasing with increasing snow cover frequency. However, the snow frequency in regions above 6000 m is mostly above 80%, since these areas are dominated by permanent snow.
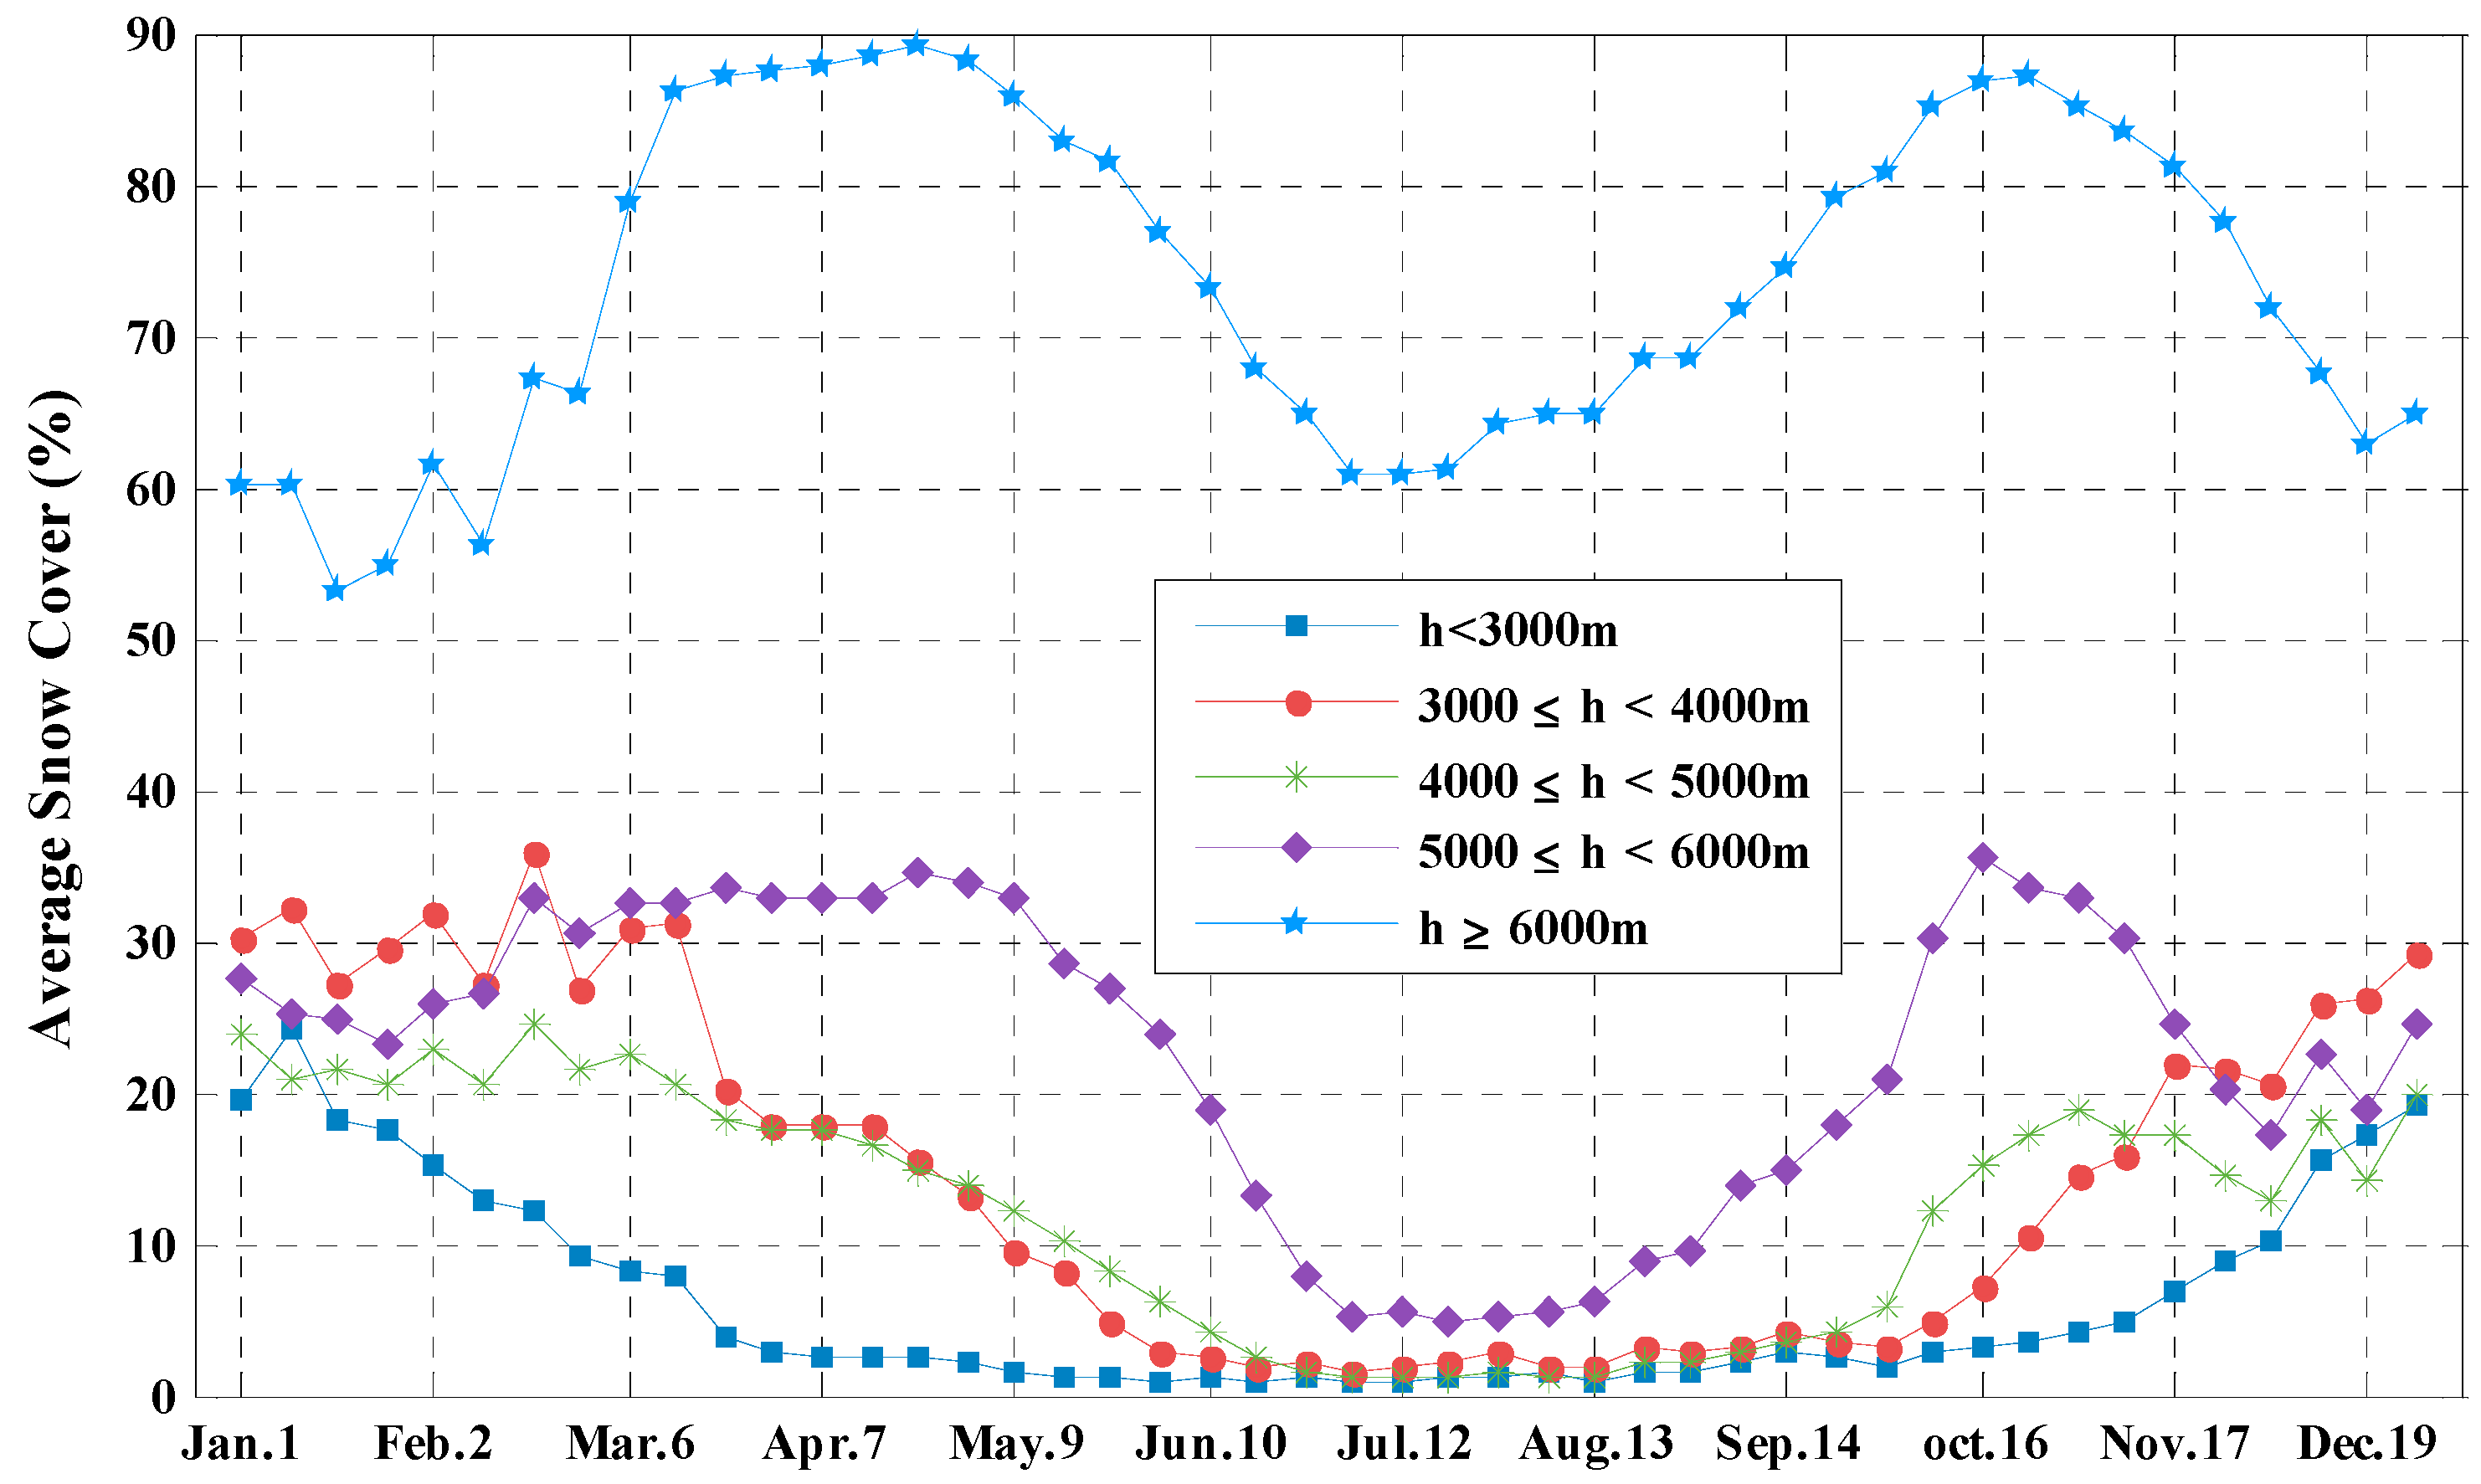
The 2001–2015 average snow cover extent of each eight-day period is plotted in Figure 6. The seasonal characteristics of snow cover at the various altitudes are quite different. According to the figure, the percentages of summer snow cover are different. In regions above 6000 m, the summer minimum value is about 60%, while only 1–2% for regions below 5000 m. Besides, the duration of the low summer snow cover values is longer for the lower regions. For areas above 6000 m, low summer snow cover values appear only in July, but for areas below 5000 m, they last from early June to the end of September. Thus, the periods of accumulation and ablation are different. Accumulation starts from the end of August or earlier for areas above 5000 m and about one month later for lower regions. In addition, the snow melting starts later at higher altitudes. Figure 6 also shows that the seasons of the high snow cover extent differ. For areas above 5000 m, the snow cover extent is larger in spring and autumn than in winter. In regions below 5000 m, the largest snow extent occurs in winter. These variations are closely connected to local topography and climate.
3.1.4. The Variation of the Starting Times of Snow Accumulation and Ablation
Changes in climate conditions influence the onset of snow accumulation and ablation. As one of the greatest impact regions of global warming, the temperature of TP has increased at a rate of 0.36 °C per decade during 1960–2007 [4]. In this section, we investigate potential changes in the length of the snow season during the period 2001–2015.
Due to the great temporal fluctuations in snow cover in Tibet, it is difficult to distinguish a clear onset of accumulation or ablation. In order to assess the starting time of the snow ablation, we first smoothed the snow cover curve of each year by using a three-point moving average filter with the relative weights [0.5, 1.0, 0.5]. Secondly, the starting time of snow melting was determined for each year by examining the tendency of snow cover variation from period to period. This tendency is given by:
where SC(t) represents the smoothed time series of snow cover and SCT(t) the snow cover tendency. The time step Δt equals eight days. The start period of snow melting is when the SCT changes from positive to negative in spring and continually stays negative until it reaches minimum snow cover. During July and August when the snow cover is at its minimum, the SCT fluctuates between positive and negative values due to the cloud effect in the MODIS snow product. It is difficult to use the SCT to assess the start time of snow accumulation in autumn. Therefore, the time when the average snow cover surmounts 5% is set as the start of snow accumulation.
Following these two criteria, we obtained the starting times of snow ablation and accumulation for each year (Figure 7). The earliest start of snow accumulation is in Period 29 (13–20 August) of 2002, and the latest is in Period 36 (8–15 October) of 2015. The earliest start of snow ablation is in Period 12 (30 March–6 April) of 2014, and the latest start is in Period 21 (2–9 June) of 2004. From this figure, we also see that the starting time of snow ablation in Tibet has shifted significantly (at the confidence level of 99%, p < 0.01) to earlier in the year during the recent 15 years (trend = −0.35 period per year). The starting time of snow accumulation shifts slightly to later in the year (trend = 0.16 period per year), but this is not significant.
3.2. Snow Cover Variations during 2001–2015 Based on Data from 37 Meteorological Stations
3.2.1. Annual Snow Cover Distribution
Some studies have shown that the snowfall in Tibet has drastically decreased since the start of the Twenty-First Century [15,19,26]. The reduction may be caused by a decrease in winter precipitation or by a shortening of the snow season due to global warming. Figure 8 shows the daily number of snow-covered stations for each year (blue) together with the average year (red).
Except from a few extreme events, snowfall at most of the 37 stations in Tibet is quite rare. During the 15 years (5478 days), there was no snow at any of the stations for nearly 56% of the time (3048 days). During 14% of the time, only one station had snow. The annual average number of daily snow stations (excluding summer days) did not show great variation from year to year (Table 5). The average number of the 15 years was 1.9 snow stations with the largest average number of 2.4 in 2008. The maximum number of snow-covered stations occurred in the autumn of 2008 with 21 stations. The year 2008 had abnormal snowfall in Tibet. It snowed mainly in autumn, but heavy snowfall occurred occasionally even in summer, which led to extensive snow disasters in Tibet. The lowest numbers of snow stations appeared in 2010. Furthermore, the MODIS data showed that 2010 was a year of less snow. The year was a transition period from EI Nino to La Nina events [48].
Due to El Niño, there was anomalously large snowfall in North America and in northwestern Europe in the winter of 2009/2010. La Niña in 2010/2011 caused many disasters around the world, such as heat waves, floods and droughts. In this transitional year, Tibet had the least snowfall since records began [49]. Anomalous snow events are clearly related to El Niño and La Niña. Most of the current research is about how snow cover in Tibet affects the summer-monsoon, particularly during ENSO years [13,21,50]. How ENSO affects snow cover in Tibet is also discussed [51]. Tropical storm events in the Bay of Bengal or in the Arabian Sea may also contribute to heavy snowfall in Tibet [52,53].
3.2.2. Snow Cover Distribution at the Stations at Different Altitudes
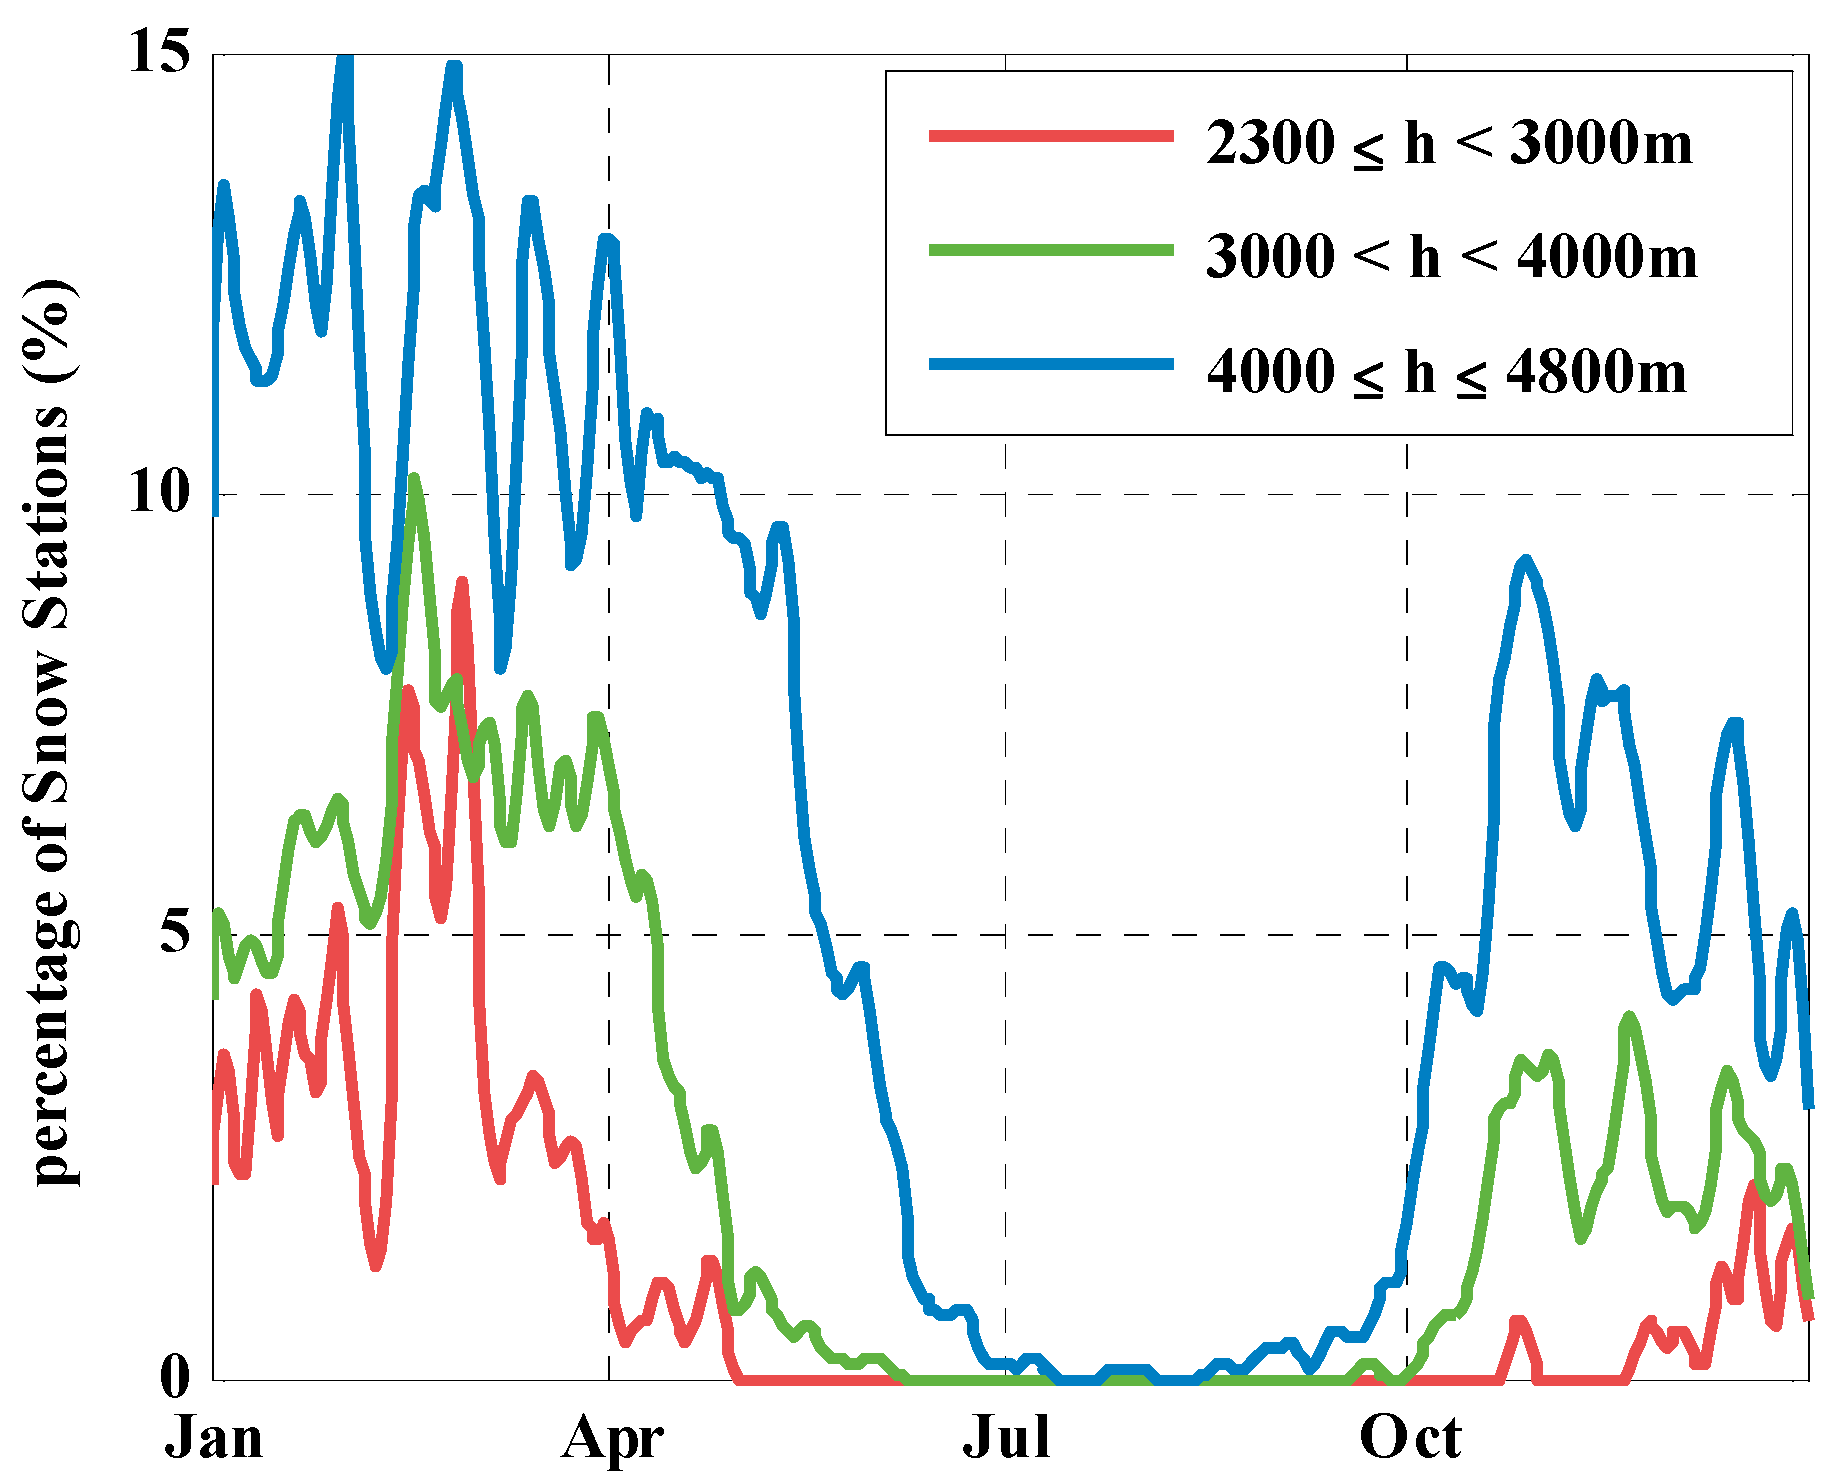
The altitudes of the 37 stations in Tibet range between 2328 and 4800 m (see Appendix A), and they are divided into three intervals in this study. Table 6 lists the altitude intervals and the number of stations, as well as their latitude and longitude ranges at each altitude interval. Since the numbers of stations in the three altitude intervals differ from each other, percentages of snow-covered stations are used to describe snow cover characteristics at the different altitudes. Figure 9 shows the daily percentages of snow-covered stations of the average year for the three altitude ranges. Because of the great day-to-day variation, these curves are smoothed by using an eight-point moving average filter with the relative weights [0.25, 0.5, 0.75, 1, 1, 0.75, 0.5, 0.25].
The snow cover percentage increases with altitude. The maximum percentage occurs in February for all three altitude ranges when it reaches 15% for the high stations, 10% for the middle range and about 9% for the low stations. The length of the snow season is about 6 months for the low stations, 8 for the middle range and 10 months for the high stations.
3.2.3. Changes in the Start and End Times of the Snow Season in Tibet
Most of the snow cover in Tibet is seasonal; only about 2% is permanent. Snow cover at the weather stations in Tibet mainly depends on weather systems that bring snow, and the snow is usually prone to rapid thawing because of the strong incoming solar radiation and dry air condition. The many snow spells throughout the snow season cause difficulties in assessing the onset of snowmelt and of snow accumulation for the whole of Tibet. To reasonably examine the start and end times of the snow season in Tibet, we used two criteria based on the eight-day moving average data of the numbers of daily snow stations. The start of the snow season is when the number of snow stations changes from zero to non-zero and retains a non-zero value for several days in autumn. The criterion for the end of the snow season is when the number of snow-covered stations shifted from more than one to one and does not return to more than one by the end of the spring (the reason why we did not use the day when the number of snow-covered stations first changed from non-zero to zero as the criterion for the end of the snow season is that at some high-altitude weather stations. snowfall occasionally occurs in summer).
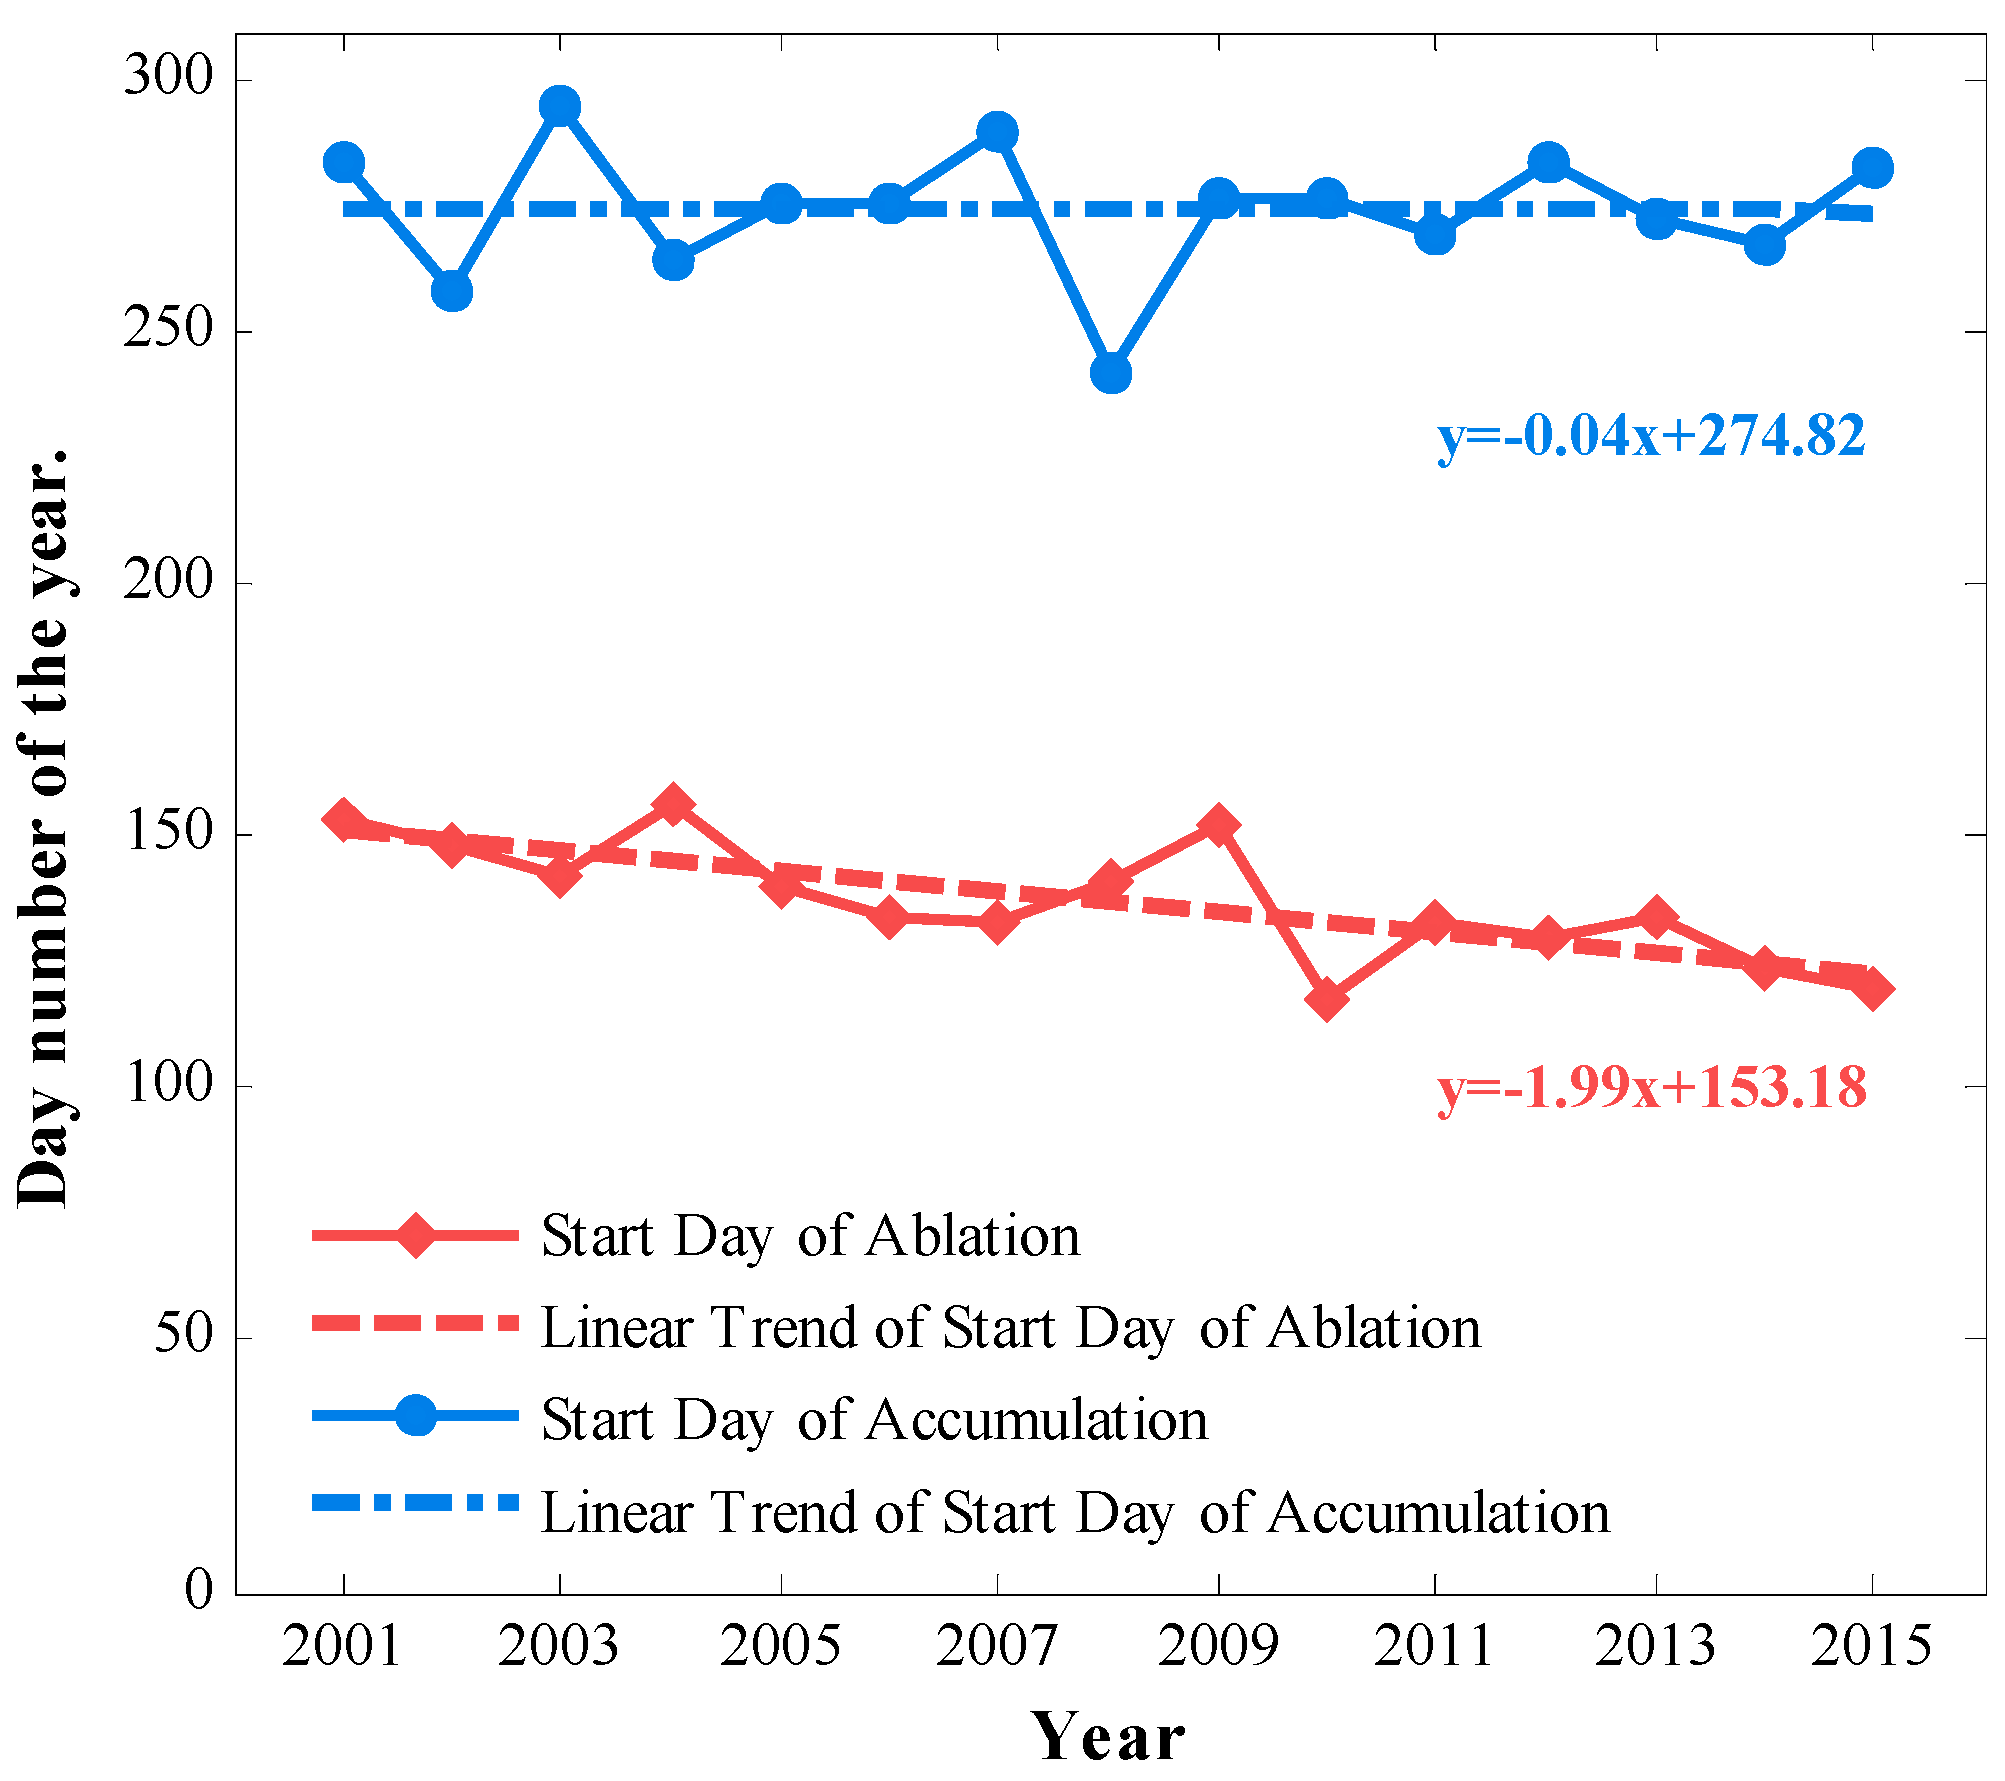
The start days of snow accumulation and ablation based on these two criteria are plotted in Figure 10. For snow accumulation, the earliest year was 2008 with the start day assessed to be 30 August (Day No. 243). The latest year was 2012 with the start day assessed to be 22 October (Day No. 296). No significant trend of the onset of snow accumulation was found during the 15 years.
The earliest start of ablation was in 2010 on 29 April (Day No. 119) and the latest in 2004 on 6 June (Day No. 158). There is a tendency of earlier ablation (trend= −1.99 days per year, p < 0.0001), which is quite similar to what the MODIS data reveal (−0.35 eight-day period per year ~−2.8 days per year).
4. Discussion
The MODIS data used in this study cover the entire area of Tibet with 500-m spatial resolution during 15 years at roughly weekly temporal resolution (eight days). Hence, the spatial distribution and frequency of snow cover can be investigated with respect to, e.g., altitude ranges and seasons. MODIS data thus compensate for the shortcomings of the sparse and uneven distribution of ground observations in Tibet. However, cloud effects are problematic for the MODIS snow assessment. As snow usually precipitates from clouds, one limitation of MODIS is difficulty in detecting new snow. To obtain the complementary advantages of MODIS data and ground observed data, we used both data in this study. Because the time span covered by MODIS data is only 15 years, the time series is too short for analysis of long-term trends of snow cover. Therefore, this study focused on the spatial and temporal snow cover distribution during 2001–2015. In order to see similarities and differences, we also compare the results from MODIS and the ground stations. The ground stations are mainly clustered in the eastern part of Tibet at altitudes below 4800 m (Figure 1). Much of the differences in the results of the two datasets may be explained by these circumstances.
4.1. Relationships between MODIS and Station Snow Cover
Prior to analyzing the relationship between the MODIS snow data and ground observed snow data, we converted the daily station snow data to an eight-day scale. The conversion algorithm corresponds to the manner NSIDC converts MODIS daily snow products into eight-day snow products. We grouped the daily station data into eight-day period data with the last period of each year consisting of three days from the consecutive year (or two days for a leap year). If a station was snow covered for any day during an eight-day period, we considered the station to have been snow covered during that period.
Further, the pixels corresponding to the station locations were extracted from the MODIS data. The extracted cloud data from MOD10A2 show that the total of persistent cloud periods at the stations during the 15 years is 416. A fraction of 66% of these cloud periods is during summer, while spring and autumn make up 17% and 14%, respectively. The characteristic of the seasonal distribution of cloud cover is consistent with the conclusions drawn by Li et al. [54] that a great amount of high clouds exists over the TP, and its seasonal cycle is evident with the largest amount and highest frequency in spring and summer. Then, we calculated the percentage of ground observed snow-covered stations defined as the proportion of the number of snow-covered cloud-free stations to the number of cloud-free stations for the same period. Figure 11a is a scatter plot of the MODIS and ground observed snow cover percentages. The correlation between MODIS and ground observed snow cover is 0.77 (p < 0.0001). Figure 11b displays the difference between MODIS and ground snow cover as a function of the ground snow cover. The differences change from positive to negative with increasing ground snow cover. This means that MODIS overestimated snow when there was little snow on the ground and underestimated when there was more snow. The main reason for the errors in MODIS data is the misclassification between cloud and snow. Several previous works about the validation of MODIS snow products discovered that some types of clouds are erroneously misclassified as snow [55,56,57]. Misclassified cloud as snow can lead to an overestimation of snow cover. Basang et al. [55] found that the MODIS snow product is less accurate in spring than in winter and autumn due to large underestimation errors (summer was excluded from the analysis in that study). In the present comparison, the extracted MODIS data also show noticeable underestimation of the snow cover in spring, but overestimation in other seasons, especially in summer. One of the reasons for the underestimation is that the MODIS snow products misclassify snow or ice as clouds in cold areas.
Non-synchronicity between ground and MODIS observations is another source of underestimation. Daily snow depth is measured at 8 a.m. Beijing time (0 GMT) on the TP, while the MODIS Terra data are typically captured two to four hours later. Thus, some of the discrepancies between MODIS and ground observed snow cover may not be an inaccuracy of MODIS, but rather because snow has melted or fragmented before the satellite passed over due to the relatively thin snow and stronger solar radiation in spring. In addition, the process of the eight-day composition of the two datasets may introduce some errors. On certain occasions, both MODIS and ground stations have a high percentage of snow cover during an eight-day period, for example if the sky quickly clears up after snowfall. The rightmost point in Figure 11a (the period of 24–31 October 2008) represents such a case. Ground observation data show that a heavy snowfall occurred in eastern and central Tibet from 27–28 October, and 24 stations reported snow during the two days. Since the weather cleared soon after the snowfall, MODIS also captured that snowfall event. However, the MODIS snow cover percentage was only 43%, thus 22% lower than the station value (65%).
4.2. Comparison of the Interannual Snow Cover Variation Based on Eight-Day Snow Cover
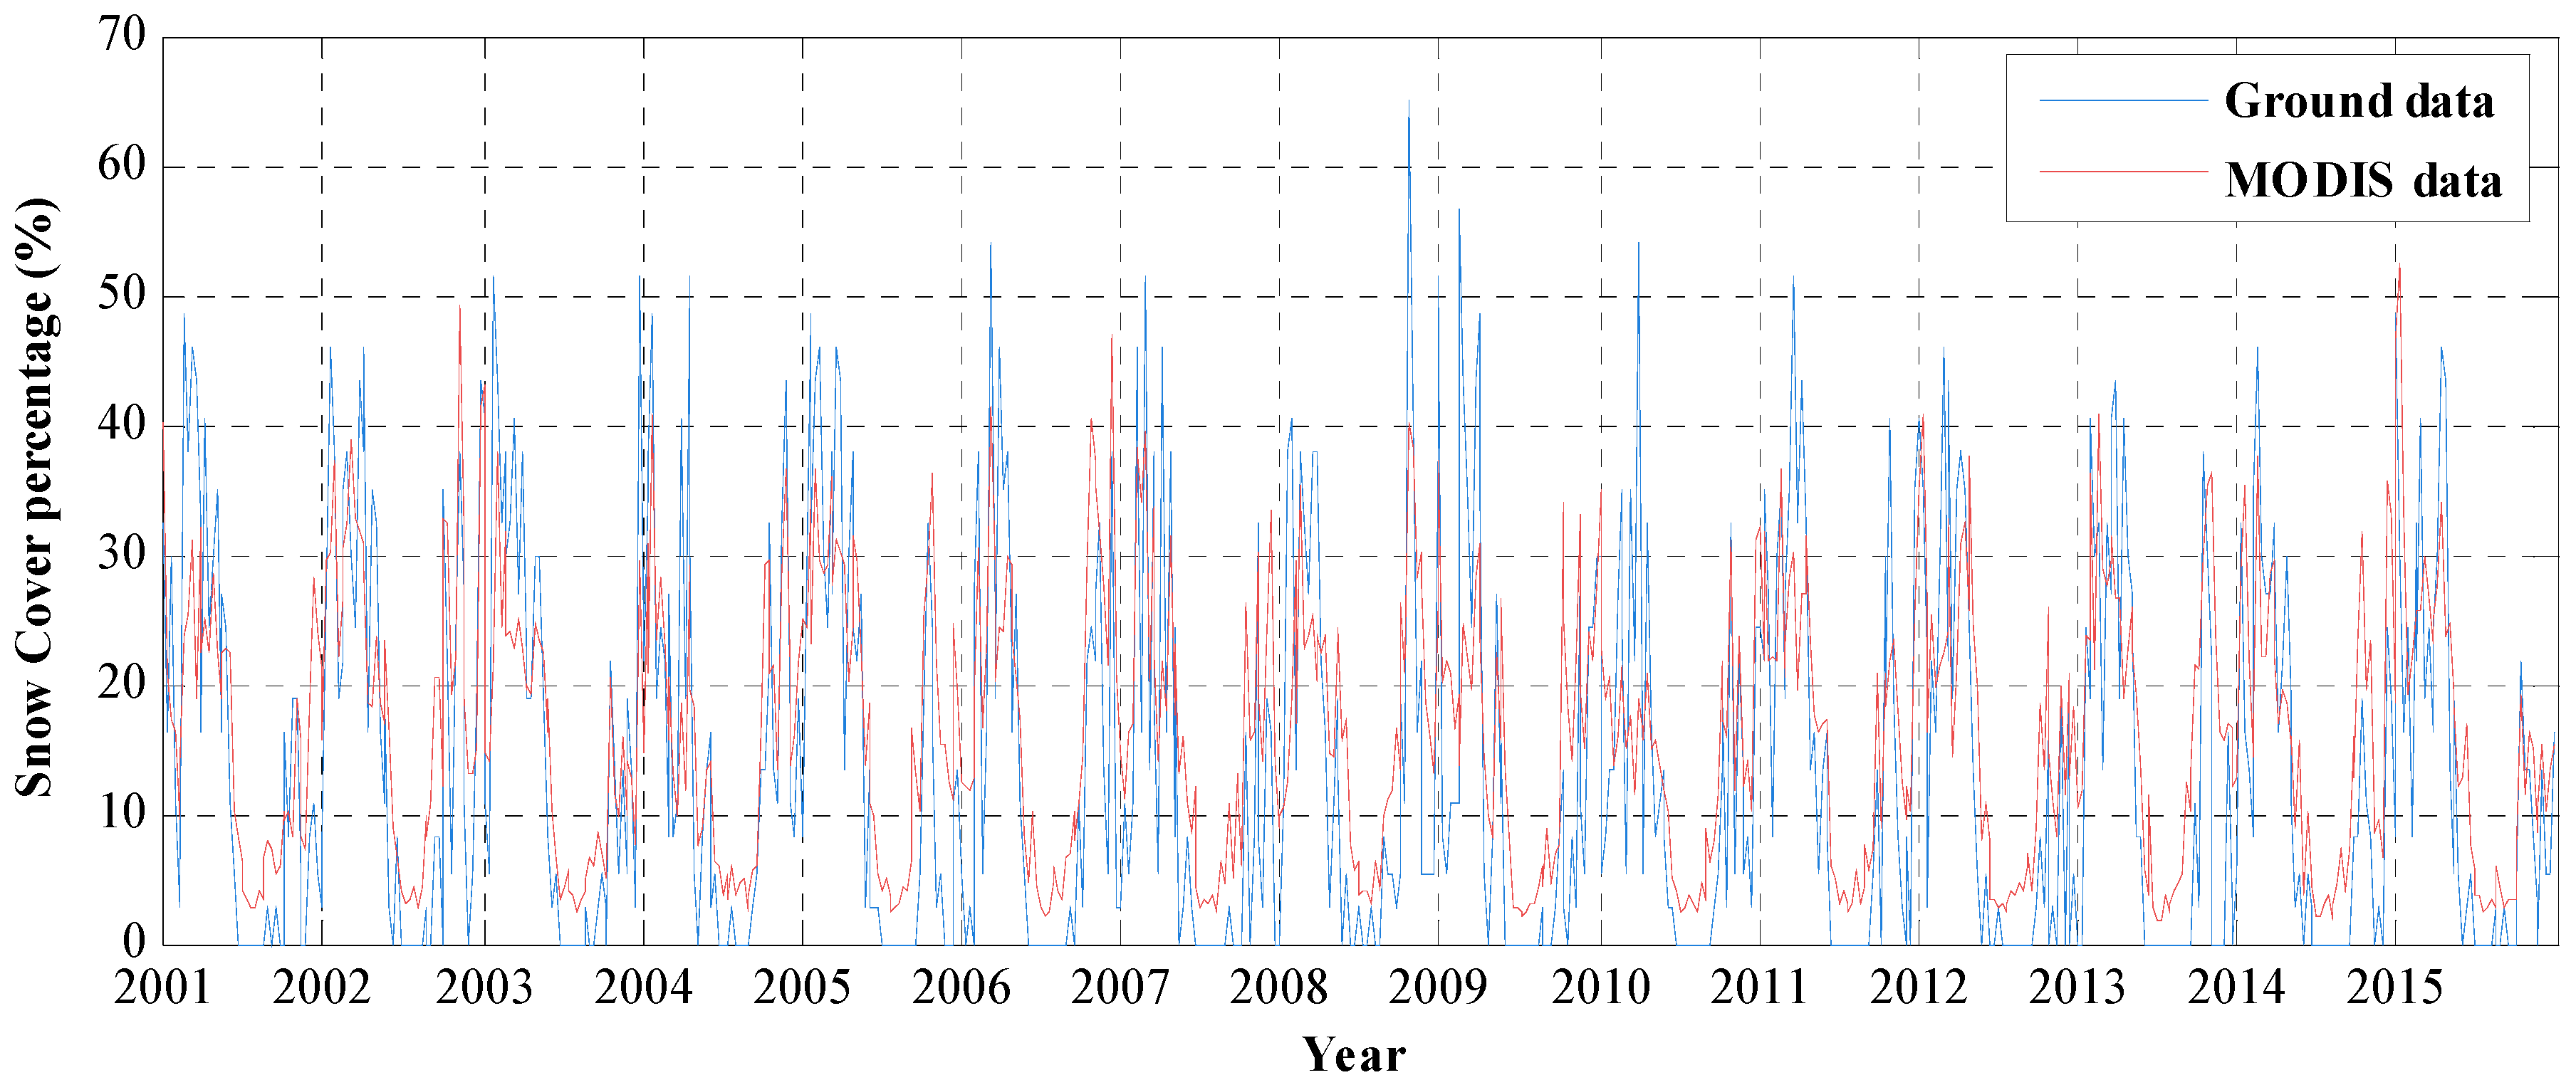
The time series of the eight-day ground observed snow cover datasets and the MODIS datasets for the whole TAR are displayed in Figure 12, which shows the interannual snow cover variation. Thus, the Y-axis is the percentage of snow-covered stations and the percentage of snow-covered area of the total area of Tibet given by the MODIS data. Except for 2003, the annual average snow cover percentage was larger for MODIS than for station data (Table 7). The two datasets agree in 2002, being the year with largest snow cover. In general, the interannual variations of snow cover over Tibet revealed by the MODIS data were similar to those by the ground stations; if snow appeared mainly in the eastern area, then the snow cover percentage was higher for the station data than for MODIS data since the majority of stations are located in eastern Tibet. For instance, the ground station data show that the winter of 2008–2009 was the most severe, as the 50%-level was exceeded three times. However, this was not revealed by MODIS. If snow covered mostly the western or entirety of Tibet, the MODIS data show a higher percentage than the station data. The winter of 2014–2015 was the only one where the percentage exceeded the 50%-level for MODIS data.
Although 15 years of data is not long enough for trend analysis, the tendency of snow cover was analyzed in order to compare the two datasets. The results showed that the percentage of snow in both MODIS and ground data has decreased slightly and that the descending trend of the ground stations (trend = −1% per year) was stronger than MODIS (trend = −0.06% per year). The declining trend of snow cover was mainly related to the increasing temperature in Tibet in recent years. On the one hand, it accelerated snow melting [58], and on the other hand, it caused less solid precipitation [27].
4.3. Comparison of the Average Annual Cycle of Snow Cover from the Two Datasets
The average annual cycle of snow cover does not only reflect the general situation of the snow distribution, but also the seasonal variation of snow cover in Tibet. Figure 13 displays the average annual cycles of the percentage of daily snow-covered stations and the percentage of the MODIS eight-day data. Note that the snow cover percentage in the MODIS data is much higher than in the station data in this figure because the station data are daily, while MODIS are eight-day composites. Generally, the annual cycle of the two datasets is similar. Both datasets show fluctuating snow cover during the snow season and more snow in early spring than in winter and autumn. There is a dip in both curves in early winter. The large-scale circulation pattern over Tibet gives similar seasonal variations of snow cover revealed by the MODIS data as by the ground stations. However, the length of summer revealed by station data is much longer than by the MODIS data. In addition, the minimum percentage in MODIS data is about 2%, while zero in the station data. Some of the differences between the two datasets may be attributed to the geographically uneven distribution of the stations. Another reason for the difference is that all stations lie below 4800 m, while most regions covered by MODIS are above 4000 m. Regarding the snow extent in Tibet, the MODIS data should be more realistic. However, the cloud effect and the lack of snow depth information in MODIS data limit its application in quantitative computation, such as avalanche prediction and water equivalence calculation.
4.4. Comparison of the Average Annual Snow Cover at Different Altitude Ranges
As the highest meteorological station is at 4800 m and the MODIS data contain information of all altitude ranges in Tibet, we divided the ground data into only three altitude ranges and the MODIS data into five ranges. By comparing how the average snow cover at the different altitude ranges of the two datasets varies during the year (Figure 6 and Figure 9), we found similar characteristics such as more snow in high than lower regions; shorter duration of low summer snow cover in high than lower regions. The main difference between the two datasets was the seasonal variation of snow cover. For example, at altitudes below 4000 m, the percentage of daily snow-covered stations greatly increases in late winter and early spring, while the MODIS data display a slightly declining feature. This difference is probably related to the different spatial and temporal resolutions of the two datasets. The MODIS data cover the entirety of Tibet, and since 90% of Tibet’s altitude is above 4000 m (Table 4), the data mainly represent the snow information of these high areas. According to the records from the 37 stations in Tibet, the monthly average precipitation gradually increases from winter to spring (Table 8). Spring snow mostly occurs in southeastern Tibet where the altitude is relatively low. However, these areas are relatively small and therefore contribute little to the average MODIS snow cover in spring. On the other hand, without new snowfall, the snow areas would shrink due to the increasing spring temperatures. Furthermore, the eight-day snow cover of MODIS may also smooth the real percentage of snow cover so that the snow variation curves seem steadier. Similarly, for the transition from autumn to winter, the ground data oscillated much more than the MODIS data. As shown in Table 8, the average monthly precipitation in Tibet declines from autumn to winter, but the precipitation changes from rain to snow with decreasing temperature, leading to snow accumulation in autumn. Except for in the lowest regions, both datasets show more snow cover in October and then some slow melt in November when precipitation is very small and the temperature not so low. However, in December, MODIS snow cover slightly inclines, but it continually declines at the ground stations. One reason is that the snow may cease to melt in the high-altitude regions in winter when the temperature gets below the freezing point. Another reason is that MODIS snow products sometimes misclassify lake ice as snow cover. There are many lakes in the high altitudes of northern Tibet, which account for approximately 1.3% of the Tibet area. Most of this region freezes in winter. The optical properties of snow and lake ice are very similar and not easy to discriminate in remote sensing; thus, misclassification of lake ice as snow may lead to an increase in snow area and could partly explain the increase in winter. From these analyses, we conclude that MODIS data contain more snow information of high altitude areas, while the data from meteorological stations represent snow cover in lower areas.
4.5. Comparison of the Starting Times of Snow Accumulation and Ablation from the Two Datasets
As shown in Figure 7 and Figure 10, a significant negative trend (earlier) of the starting time of ablation was found from both MODIS and station data. MODIS data show that the starting time of snow ablation has a trend of −2.8 days per year compared to −2.0 days per year for the station data. This result agrees with previous work by Han et al. [59] of the trend of the starting time of ablation on the western TP during 1988–2010. Their study area lies between latitudes 31°N and 55°N, excluding the southern regions of Tibet with more snow cover. They also observed a significant trend of later accumulation of snow cover. However, we found no significant trend for the beginning of accumulation in this study (only a tendency of a slightly later start). This discrepancy may be caused by the differences of study areas and data sources, although the most important reason could be the differences of the study period. Due to the MODIS data having been available only since 2000, the period of this study is not long enough to reveal the trend.
Both datasets also agree that 2004 was the latest year for snow ablation, but the earliest year for snow ablation was in 2014 for MODIS data and in 2010 for the station data. MODIS and station data also differ with respect to the years of the earliest and the latest start of snow accumulation. Table 9 lists the differences between MODIS and station data for the starting days of snow accumulation and ablation of each year. Statistical analysis shows good agreement between the start days of ablation with the correlation coefficient (R) of 0.9. There is less agreement between the two datasets regarding accumulation (R = 0.24).
Several factors could have led to the different results. Firstly, the snow information contained in the two datasets is different because of the differences in observation method and resolution. This difference is enhanced by MODIS eight-day composite data. Secondly, the two datasets represent different areas. MODIS data include information from the whole of Tibet where most of the area is above 4000 m, but the ground stations are mainly located in lower areas. The temperature differences caused by altitude have a significant effect on snow cover. Thirdly, the criterion used for finding these starting days is different for the two datasets. The criterion for MODIS data is related to the increase or reduction of snow areas, while for the station data, the assessment is based on the time snow occurred at a minimum number of stations. One purpose of analyzing the onset of snow accumulation and ablation is to investigate trends related to climate warming in Tibet. As trend analyses were conducted separately for MODIS data and station data, the differences of single years do not pose problems for this purpose.
5. Conclusions
We analyzed the characteristic of snow cover distribution and variation in Tibet during the years 2001–2015 based on MODIS data and daily ground observations. The results show:
- The spatial distribution of snow cover was very uneven. The snow cover frequency was less than 21% for 70% of the Tibetan area. In eastern Tibet and in the Himalayas, snow cover frequencies reached more than 40%. Approximately 2% of Tibet is permanently snow covered.
- The snow cover fluctuated greatly from day to day (or between periods, MODIS). The average snow cover percentage of the 687 MODIS eight-day periods was 16%. The maximum snow cover percentage was 52%, which took place in January of 2015.
- The snow cover and duration of the snow season increased with altitude. For altitudes above 6000 m, the low snow cover season is only July, but for the lowest altitudes, it lasts from May to the end of August.
- During the 15 years, both datasets revealed a significant trend of earlier onset of ablation, but no evident trend for the beginning of accumulation.
- The two datasets differed slightly with respect to the seasonal variation of snow cover. MODIS data showed more snow in winter than in other seasons, but the ground stations observed most snow in early spring. This is mainly due to the differences in the altitude ranges and geographical regions that the two datasets cover. The majority (57%) of the ground stations are below 4000 m and cover primarily the southeastern region of Tibet where precipitation increases and falls as snow in early spring. As 90% of the region covered by MODIS data is above 4000 m, the size of the snow-covered area is minimally affected by the increased snowfall in lower regions in early spring.
- By comparing the results from the two datasets, we found that although the meteorological stations in Tibet are sparse and unevenly distributed, the station snow data reflect to some degree the extent of the Tibetan snow cover. In addition, the station data contain snow depth information also for earlier years, and the long-term series data can be used to investigate long-term trends of snow cover in the context of global warming effects on hydrology, agriculture, ecology and climate.
- The correlation between ground and MODIS snow cover at the ground station locations is 0.77.
- MODIS data have high spatial and temporal resolution and are therefore viable data for the spatial distribution and snow cover frequency for the entirety of Tibet. However, these time series are too limited for a long-term trend analysis. In addition, the lack of snow depth information limits the use of these data in quantitative snow research. Therefore, combining the advantages of each dataset is the best way to study snow distribution and variation in Tibet.
Acknowledgments
First of all, I would like to express my deep gratitude to the MODIS Science team for the development of the Science Algorithms, the processing team for producing MODIS data and the GES DAAC MODIS Data Support Team for making MODIS data available to the user community. Without the tool of the MODIS data, my thesis would not have been written. I am thankful to the Network for University Cooperation Tibet-Norway for the financial support of this study. A special thanks goes to Ragnhild Schea for improving the English writing. I also thank the leadership of the Tibetan Meteorological Bureau for allowing the long leave for my PhD program in Bergen. Thanks also to my many colleagues and friends for valuable suggestions regarding the manuscript and for providing useful meteorological data.
Author Contributions
Droma Basang designed the research, collected and analyzed the data, performed the image processing and statistical analysis and wrote the first draft. Knut Barthel and Jan Asle Olseth contributed to the interpretation and discussion of the results, reviewing the analysis methods and the manuscript.
Conflicts of Interest
The authors declare no conflict of interest.
Appendix A

Table A1.
Information about the 37 meteorological stations in the Tibet Autonomous Region.
| No. | Station Name | ID | Latitude (°N) | Longitude (°E) | Altitude (m) |
|---|---|---|---|---|---|
| 1 | Gar | 55228 | 32.5 | 80.08 | 4279 |
| 2 | Gertse | 55248 | 32.15 | 84.42 | 4415 |
| 3 | Pango | 55279 | 31.37 | 90.02 | 4700 |
| 4 | Amdo | 55294 | 32.35 | 91.1 | 4800 |
| 5 | Nagqu | 55299 | 31.48 | 92.07 | 4507 |
| 6 | Purang | 55437 | 30.28 | 81.25 | 3900 |
| 7 | Shantsa | 55472 | 30.95 | 88.63 | 4672 |
| 8 | Damshung | 55493 | 30.48 | 91.1 | 4200 |
| 9 | Lhatse | 55569 | 29.08 | 87.63 | 4000 |
| 10 | Namling | 55572 | 29.68 | 89.1 | 4000 |
| 11 | Xigaze | 55578 | 29.25 | 88.88 | 3834 |
| 12 | Nyemo | 55585 | 29.43 | 90.17 | 3809 |
| 13 | Konggar | 55589 | 29.3 | 90.98 | 3556 |
| 14 | Lhasa | 55591 | 29.67 | 91.13 | 3648 |
| 15 | Maizhokunggar | 55593 | 29.85 | 91.73 | 3804 |
| 16 | Tsetang | 55598 | 29.25 | 91.77 | 3551 |
| 17 | Dingri | 55664 | 28.63 | 87.08 | 4300 |
| 18 | Gyangtse | 55680 | 28.92 | 89.6 | 4040 |
| 19 | Nakartse | 55681 | 28.97 | 90.4 | 4431 |
| 20 | Tsona | 55690 | 27.98 | 91.95 | 4280 |
| 21 | Lhuntse | 55696 | 28.42 | 92.47 | 3860 |
| 22 | Pagri | 55773 | 27.73 | 89.08 | 4300 |
| 23 | Sog | 56106 | 31.88 | 93.78 | 4022 |
| 24 | Biru | 56109 | 31.48 | 93.68 | 3940 |
| 25 | Dengqen | 56116 | 31.42 | 95.6 | 3873 |
| 26 | Riwoqe | 56128 | 31.22 | 96.6 | 3810 |
| 27 | Chamdo | 56137 | 31.15 | 97.17 | 3306 |
| 28 | Lhari | 56202 | 30.67 | 93.28 | 4488 |
| 29 | Lhorong | 56223 | 30.75 | 95.83 | 3640 |
| 30 | Bome | 56227 | 29.87 | 95.77 | 2737 |
| 31 | Baxoi | 56228 | 30.05 | 96.92 | 3261 |
| 32 | Gyatsa | 56307 | 29.15 | 92.58 | 3260 |
| 33 | Ningtri | 56312 | 29.67 | 94.33 | 2991 |
| 34 | Menling | 56317 | 29.22 | 94.22 | 2950 |
| 35 | Zogong | 56331 | 29.67 | 97.83 | 3780 |
| 36 | Markam | 56342 | 29.68 | 98.6 | 3870 |
| 37 | Zayu | 56434 | 28.65 | 97.47 | 2327 |
References
- Dozier, J. Prospects and Concerns for Satellite Remote Sensing of Snow and Ice; National Academies: Washington, DC, USA, 1989; p. 3. [Google Scholar]
- Liu, Z.X.; Su, Z.; Yao, T.D.; Wang, W.T.; Shao, W.Z. Resources and distribution of glaciers on the Tibetan Plateau. Resour. Sci. 2000, 22, 49–52. [Google Scholar]
- Yanai, M.; Li, C.; Song, Z. Seasonal heating of the Tibetan Plateau and its effects on the evolution of the Asian summer monsoon. J. Meteorol. Soc. Jpn. 1992, 70, 319–351. [Google Scholar] [CrossRef]
- Wang, B.; Bao, Q.; Hoskins, B.; Wu, G.; Liu, Y. Tibetan Plateau warming and precipitation changes in East Asia. Geophys. Res. Lett. 2008, 35. [Google Scholar] [CrossRef]
- Qian, Y.F.; Zheng, Y.Q.; Zhang, Y.; Miao, M.Q. Responses of China’s summer monsoon climate to snow anomaly over the Tibetan Plateau. Int. J. Climatol. 2003, 23, 593–613. [Google Scholar] [CrossRef]
- Kang, S.; Qin, D.; Ren, J.; Zhang, Y.; Kaspari, S.; Mayewski, P.A.; Hou, S. Annual accumulation in the Mt. Nyainqentanglha ice core, Southern Tibetan Plateau, China: Relationships to atmospheric circulation over Asia. Arct. Antarct. Alp. Res. 2007, 39, 663–670. [Google Scholar] [CrossRef]
- Harris, N. The elevation history of the Tibetan Plateau and its implications for the Asian monsoon. Palaeogeogr. Palaeoclimatol. Palaeoecol. 2006, 241, 4–15. [Google Scholar] [CrossRef]
- Wu, G.; Liu, Y.; Zhang, Q.; Duan, A.; Wang, T.; Wan, R.; Liu, X.; Li, W.; Wang, Z.; Liang, X. The influence of mechanical and thermal forcing by the Tibetan Plateau on Asian climate. J. Hydrometeorol. 2007, 8, 770–789. [Google Scholar] [CrossRef]
- Lau, W.K.; Kim, M.-K.; Kim, K.-M.; Lee, W.-S. Enhanced surface warming and accelerated snow melt in the Himalayas and Tibetan Plateau induced by absorbing aerosols. Environm. Res. Lett. 2010, 5. [Google Scholar] [CrossRef]
- Immerzeel, W.W.; Van Beek, L.P.; Bierkens, M.F. Climate change will affect the Asian water towers. Science 2010, 328, 1382–1385. [Google Scholar] [CrossRef] [PubMed]
- Wu, T.-W.; Qian, Z.-A. The relation between the Tibetan winter snow and the Asian summer monsoon and rainfall: An observational investigation. J. Clim. 2003, 16, 2038–2051. [Google Scholar] [CrossRef]
- Brun, E.; Vionnet, V.; Boone, A.; Decharme, B.; Peings, Y.; Valette, R.; Karbou, F.; Morin, S. Simulation of northern eurasian local snow depth, mass, and density using a detailed snowpack model and meteorological reanalyses. J. Hydrometeorol. 2013, 14, 203–219. [Google Scholar] [CrossRef]
- Zhao, P.; Zhou, Z.; Liu, J. Variability of Tibetan spring snow and its associations with the hemispheric extratropical circulation and east Asian summer monsoon rainfall: An observational investigation. J. Clim. 2007, 20, 3942–3955. [Google Scholar] [CrossRef]
- Shaman, J.; Cane, M.; Kaplan, A. The relationship between Tibetan snow depth, enso, river discharge and the monsoons of bangladesh. Int. J. Remote Sens. 2005, 26, 3735–3748. [Google Scholar] [CrossRef]
- You, Q.; Kang, S.; Ren, G.; Fraedrich, K.; Pepin, N.; Yan, Y.; Ma, L. Observed changes in snow depth and number of snow days in the eastern and central Tibetan Plateau. Clim. Res. 2011, 46, 171–183. [Google Scholar] [CrossRef]
- Wang, W.; Huang, X.; Deng, J.; Xie, H.; Liang, T. Spatio-temporal change of snow cover and its response to climate over the Tibetan Plateau based on an improved daily cloud-free snow cover product. Remote Sens. 2014, 7, 169–194. [Google Scholar] [CrossRef]
- Singh, S.; Rathore, B.; Bahuguna, I. Snow cover variability in the Himalayan–Tibetan region. Int. J. Climatol. 2014, 34, 446–452. [Google Scholar] [CrossRef]
- Shen, S.S.; Yao, R.; Ngo, J.; Basist, A.M.; Thomas, N.; Yao, T. Characteristics of the Tibetan Plateau snow cover variations based on daily data during 1997–2011. Theor. Appl. Climatol. 2015, 120, 445–453. [Google Scholar] [CrossRef]
- Basang; Yang, X.; Lazhen; Zheng, Z.; Kuang, D.; Laba. Variation of snow cover over the Tibet autonomous region based on multi-source data. J. Glaciol. Geocryol. 2012, 34, 1023–1030. [Google Scholar]
- Li, P. Response of Tibetan snow cover to global warming. Acta Geogr. Sin. 1996, 3, 260–265. [Google Scholar]
- Zhang, Y.; Li, T.; Wang, B. Decadal change of the spring snow depth over the Tibetan Plateau: The associated circulation and influence on the east asian summer monsoon. J. Clim. 2004, 17, 2780–2793. [Google Scholar] [CrossRef]
- Flanner, M.G. Snowpack radiative heating: Influence on Tibetan Plateau climate. Geophys. Res. Lett. 2005, 32. [Google Scholar] [CrossRef]
- Rangwala, I.; Miller, J.R.; Russell, G.L.; Xu, M. Using a global climate model to evaluate the influences of water vapor, snow cover and atmospheric aerosol on warming in the Tibetan Plateau during the twenty-first century. Clim. Dynam. 2009, 34, 859–872. [Google Scholar] [CrossRef]
- Ma, L.; Qin, D.; Bian, L.; Xiao, C.; Luo, Y. Sensitivity of the number of snow cover days to surface air temperature over the Qinghai-Tibetan Plateau. Adv. Clim. Chang. Res. 2010, 1, 76–83. [Google Scholar] [CrossRef]
- Ma, L.; Qin, D.; Bian, L.; Xiao, C.; Luo, Y. Assessment of snow cover vulnerability over the Qinghai-Tibetan Plateau. Adv. Clim. Chang. Res. 2011, 2, 93–100. [Google Scholar] [CrossRef]
- Bai, S.; Shi, J.; Shen, W.; Gao, J.; Wang, G. Spatial temporal variation of snow depth in Tibet and its response to climatic change in the past 30 years. Remote Sens. Land Resour. 2014, 26, 144–151. [Google Scholar]
- Zhu, X.; Wu, T.; Li, R.; Wang, S.; Hu, G.; Wang, W.; Qin, Y.; Yang, S. Characteristics of the ratios of snow, rain and sleet to precipitation on the Qinghai-Tibet Plateau during 1961–2014. Quat. Int. 2016, 444, 137–150. [Google Scholar] [CrossRef]
- Pu, Z.; Xu, L.; Salomonson, V.V. MODIS/terra observed seasonal variations of snow cover over the Tibetan Plateau. Geophys. Res. Lett. 2007, 34. [Google Scholar] [CrossRef]
- Wang, Y.; He, Y.; Hou, S. Analysis of the temporal and spatial variations of snow cover over the Tibetan Plateau based on MODIS. J. Glaciol. Geocryol. 2007, 29, 855–861. [Google Scholar]
- Lei, L.; Zeng, Z.; Zhang, B. Method for detecting snow lines from MODIS data and assessment of changes in the Nianqingtanglha mountains of the Tibet Plateau. IEEE J. Sel. Top. Appl. Earth Obs. Remote Sens. 2012, 5, 769–776. [Google Scholar] [CrossRef]
- Tang, B.-H.; Shrestha, B.; Li, Z.-L.; Liu, G.; Ouyang, H.; Gurung, D.R.; Giriraj, A.; Aung, K.S. Determination of snow cover from MODIS data for the Tibetan Plateau region. Int. J. Appl. Earth Obs. Geoinform. 2013, 21, 356–365. [Google Scholar] [CrossRef]
- Yang, J.; Jiang, L.; Shi, J.; Wu, F.; Wang, S.; Kou, X. Evaluation and comparison of FY-2E vissr, MODIS and ims snow cover over the Tibetan Plateau. In Proceedings of the IEEE International Geoscience and Remote Sensing Symposium, Melbourne, Australia, 21–26 July 2013; pp. 1182–1185. [Google Scholar]
- Chu, D.; Xie, H.; Wang, P.; Guo, J.; La, J.; Qiu, Y.; Zheng, Z. Snow cover variation over the Tibetan Plateau from MODIS and comparison with ground observations. J. Appl. Remote Sens. 2014, 8. [Google Scholar] [CrossRef]
- Tang, Z.; Wang, J.; Li, H.; Yan, L. Spatiotemporal changes of snow cover over the Tibetan Plateau based on cloud-removed moderate resolution imaging spectroradiometer fractional snow cover product from 2001 to 2011. J. Appl. Remote Sens. 2013, 7. [Google Scholar] [CrossRef]
- Che, T.; Li, X.; Gao, F. Estimation of snow water equivalent in the Tibetan Plateau using passive microwave remote sensing data (SSM/I). J. Glaciol. Geocryol. 2004, 26, 363–368. [Google Scholar]
- Riggs, G.A.; Hall, D.K.; Salomonson, V.V. MODIS Snow Products User Guide to Collection 5. National Snow and Ice Data Center. 2006. Available online: www.nsidc.org/data/docs/daac/MODIS_v5/dorothy_snow_doc.pdf (accessed on 1 December 2016).
- Klein, A.G.; Barnett, A.C. Validation of daily MODIS snow cover maps of the upper rio grande river basin for the 2000–2001 snow year. Remote Sens. Environ. 2003, 86, 162–176. [Google Scholar] [CrossRef]
- Wang, X.; Xie, H.; Liang, T. Evaluation of MODIS snow cover and cloud mask and its application in northern Xinjiang, China. Remote Sens. Environ. 2008, 112, 1497–1513. [Google Scholar] [CrossRef]
- Zhou, X.; Xie, H.; Hendrickx, J.M.H. Statistical evaluation of remotely sensed snow-cover products with constraints from streamflow and snotel measurements. Remote Sens. Environ. 2005, 94, 214–231. [Google Scholar] [CrossRef]
- Huang, X.-D.; Zhang, X.-T.; Li, X.; Liang, T.-G. Accuracy analysis for MODIS snow products of MOD10A1 and MOD10A2 in northern Xinjiang area. J. Glaciol. Geocryol. 2007, 5, 722–729. [Google Scholar]
- Huang, X.; Hao, X.; Feng, Q.; Wang, W.; Liang, T. A new MODIS daily cloud free snow cover mapping algorithm on the Tibetan Plateau. Sci. Cold Arid Reg. 2014, 6, 116–123. [Google Scholar]
- Ault, T.W.; Czajkowski, K.P.; Benko, T.; Coss, J.; Struble, J.; Spongberg, A.; Templin, M.; Gross, C. Validation of the MODIS snow product and cloud mask using student and nws cooperative station observations in the lower great lakes region. Remote Sens. Environ. 2006, 105, 341–353. [Google Scholar] [CrossRef]
- Liang, T.; Huang, X.; Wu, C.; Liu, X.; Li, W.; Guo, Z.; Ren, J. An application of MODIS data to snow cover monitoring in a pastoral area: A case study in northern Xinjiang, china. Remote Sens. Environ. 2008, 112, 1514–1526. [Google Scholar] [CrossRef]
- Fujita, K.; Suzuki, R.; Nuimura, T.; Sakai, A. Performance of ASTER and SRTM DEMs, and their potential for assessing glacial lakes in the Lunana region, Bhutan Himalaya. J. Glaciol. 2008, 54, 220–228. [Google Scholar] [CrossRef]
- Zhao, S.; Cheng, W.; Zhou, C.; Chen, X.; Zhang, S.; Zhou, Z.; Liu, H.; Chai, H. Accuracy assessment of the ASTER GDEM and SRTM3 DEM: An example in the loess Plateau and north China plain of China. Int. J. Remote Sens. 2011, 32, 8081–8093. [Google Scholar] [CrossRef]
- Singh, M.K.; Gupta, R.; Bhardwaj, A.; Ganju, A. Scenario-based validation of moderate resolution DEMs freely available for complex Himalayan terrain. Pure Appl. Geophys. 2016, 173, 463–485. [Google Scholar] [CrossRef]
- Hall, D.K.; Riggs, G.A. Accuracy assessment of the MODIS snow products. Hydrol. Process. 2007, 21, 1534–1547. [Google Scholar] [CrossRef]
- Kim, W.; Yeh, S.W.; Kim, J.H.; Kug, J.S.; Kwon, M. The unique 2009–2010 el niño event: A fast phase transition of warm pool el niño to la niña. Geophys. Res. Lett. 2011, 38. [Google Scholar] [CrossRef]
- Basang; Barthel, K.; Olseth, J.A. Characteristics and trends of snow cover in Tibet During 1980–2015. 2018; in press. [Google Scholar]
- Wu, Z.; Li, J.; Jiang, Z.; Ma, T. Modulation of the Tibetan Plateau snow cover on the enso teleconnections: From the east Asian summer monsoon perspective. J. Clim. 2012, 25, 2481–2489. [Google Scholar] [CrossRef]
- Shaman, J.; Tziperman, E. The effect of enso on Tibetan Plateau snow depth: A stationary wave teleconnection mechanism and implications for the south Asian monsoons. J. Clim. 2005, 18, 2067–2079. [Google Scholar] [CrossRef]
- Duan, X.; Duan, W. Impact of bay of bengal storms on precipitation over Plateau area. Plateau Meteorol. 2015, 34, 1–10. (In Chinese) [Google Scholar]
- Wei, Z.; Huang, R.; Chen, W. The causes of the interannual variation of snow cover over the Tibetan Plateau. J. Glaciol. Geocryol. 2005, 4, 491–497. [Google Scholar]
- Li, Y.; Liu, X.; Chen, B. Cloud type climatology over the Tibetan Plateau: A comparison of ISCCP and MODIS/TERRA measurements with surface observations. Geophys. Res. Lett. 2006, 33. [Google Scholar] [CrossRef]
- Basang, D.; Liu, Z.; Barthel, K.; Olseth, J.A. Accuracy assessment of the MODIS10A1 over the Tibetan Plateau and analysis of the potential sources of misclassification. Int. J. Remote Sens. 2017. Submitted. [Google Scholar]
- Parajka, J.; Bloschl, G. Validation of MODIS snow cover images over austria. Hydrol. Earth Syst. Sci. 2006, 10, 679–689. [Google Scholar] [CrossRef]
- Wang, X.; Xie, H.; Liang, T.; Huang, X. Comparison and validation of MODIS standard and new combination of terra and aqua snow cover products in northern Xinjiang, China. Hydrol. Process. 2009, 23, 419–429. [Google Scholar] [CrossRef]
- Kang, S.; Xu, Y.; You, Q.; Flügel, W.-A.; Pepin, N.; Yao, T. Review of climate and cryospheric change in the Tibetan Plateau. Environ. Res. Lett. 2010, 5. [Google Scholar] [CrossRef] [Green Version]
- Han, L.; Tsunekawa, A.; Tsubo, M.; He, C.; Shen, M. Spatial variations in snow cover and seasonally frozen ground over northern China and Mongolia, 1988–2010. Glob. Planet. Chang. 2014, 116, 139–148. [Google Scholar] [CrossRef]
Figure 1.
Map of the study area with altitude intervals and the location of the 37 stations indicated. The black curves indicate mountain ridges that are mentioned in the text. Upper right corner: the map of China with Tibet Autonomous Region (TAR) in red.
Figure 1.
Map of the study area with altitude intervals and the location of the 37 stations indicated. The black curves indicate mountain ridges that are mentioned in the text. Upper right corner: the map of China with Tibet Autonomous Region (TAR) in red.
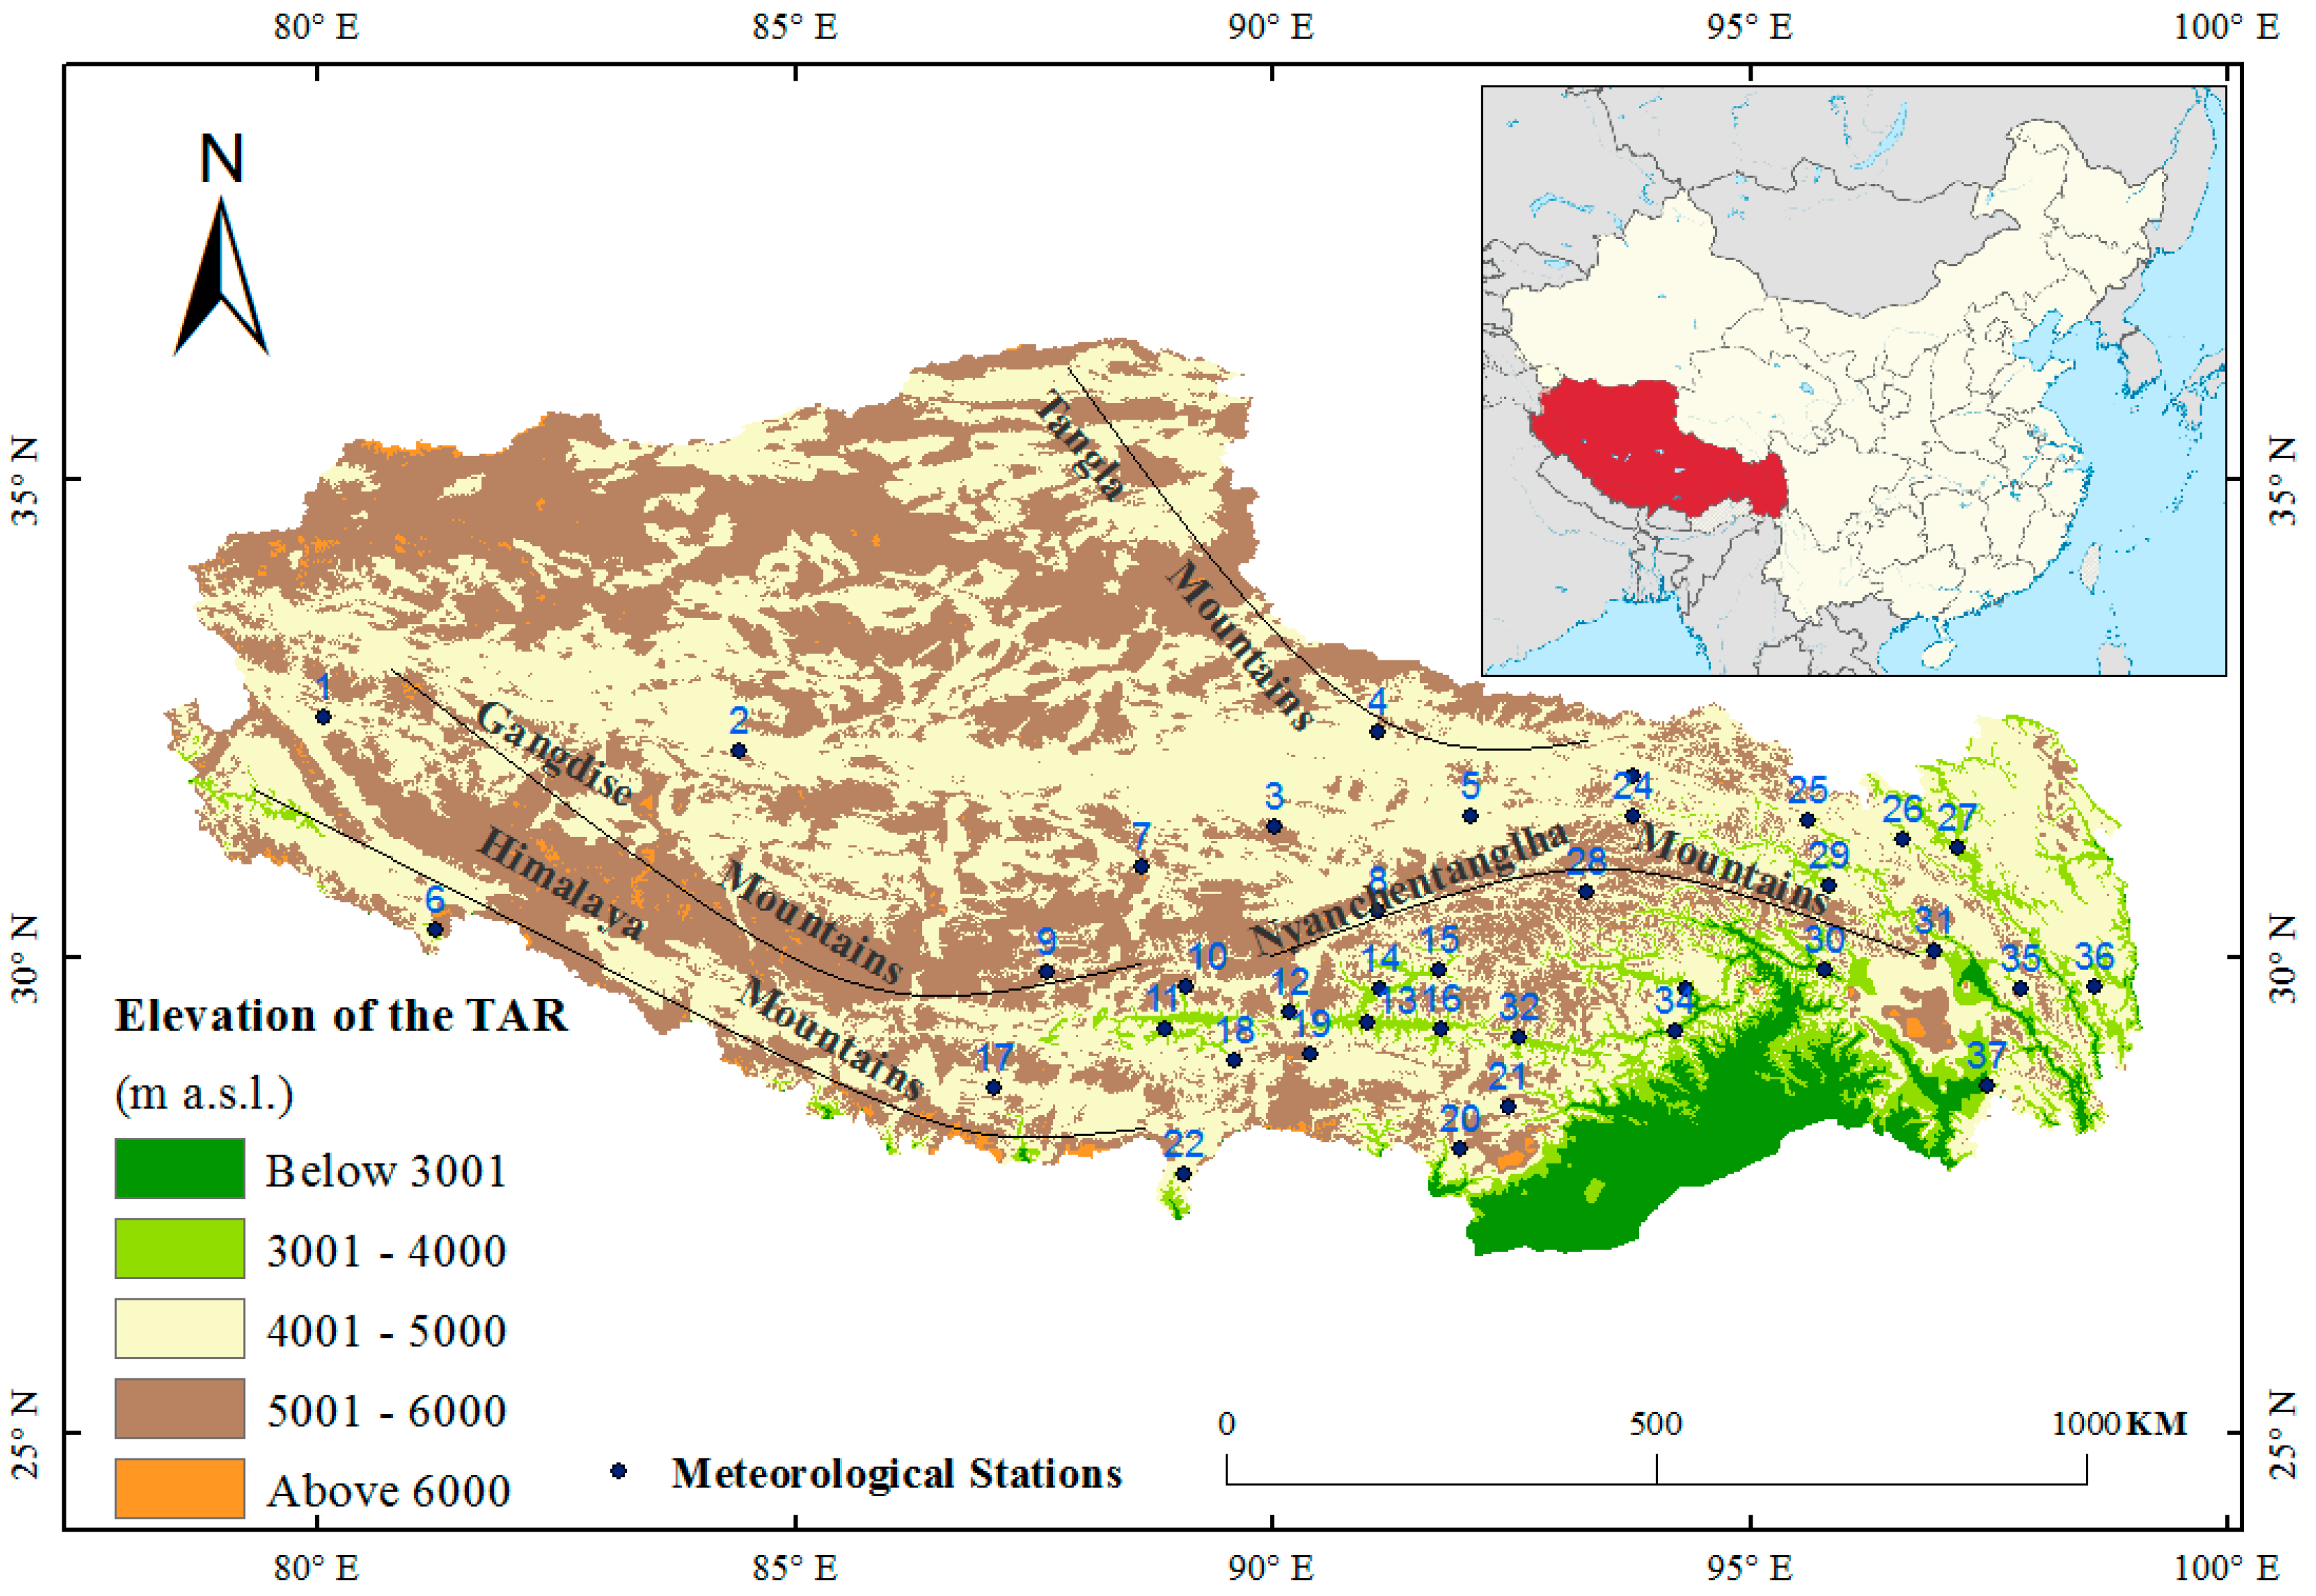
Figure 2.
Spatial distribution of frequency ranges during the years 2001–2015 for (a) persistent cloud cover, (b) snow cover and (c) corrected snow cover.
Figure 2.
Spatial distribution of frequency ranges during the years 2001–2015 for (a) persistent cloud cover, (b) snow cover and (c) corrected snow cover.

Figure 3.
Seasonal variation of snow cover derived from MODIS eight-day snow products during 2001–2015. X-axis: serial number of the eight-day period of the year. Y-axis: percentage of Tibetan area covered by snow. Curves represent each individual year (blue) and the average year (red).
Figure 3.
Seasonal variation of snow cover derived from MODIS eight-day snow products during 2001–2015. X-axis: serial number of the eight-day period of the year. Y-axis: percentage of Tibetan area covered by snow. Curves represent each individual year (blue) and the average year (red).

Figure 4.
Spatial distributions of snow cover frequency after persistent cloudiness correction for each season.
Figure 4.
Spatial distributions of snow cover frequency after persistent cloudiness correction for each season.

Figure 5.
Frequency distributions of snow cover of five altitude intervals during 2001–2015.
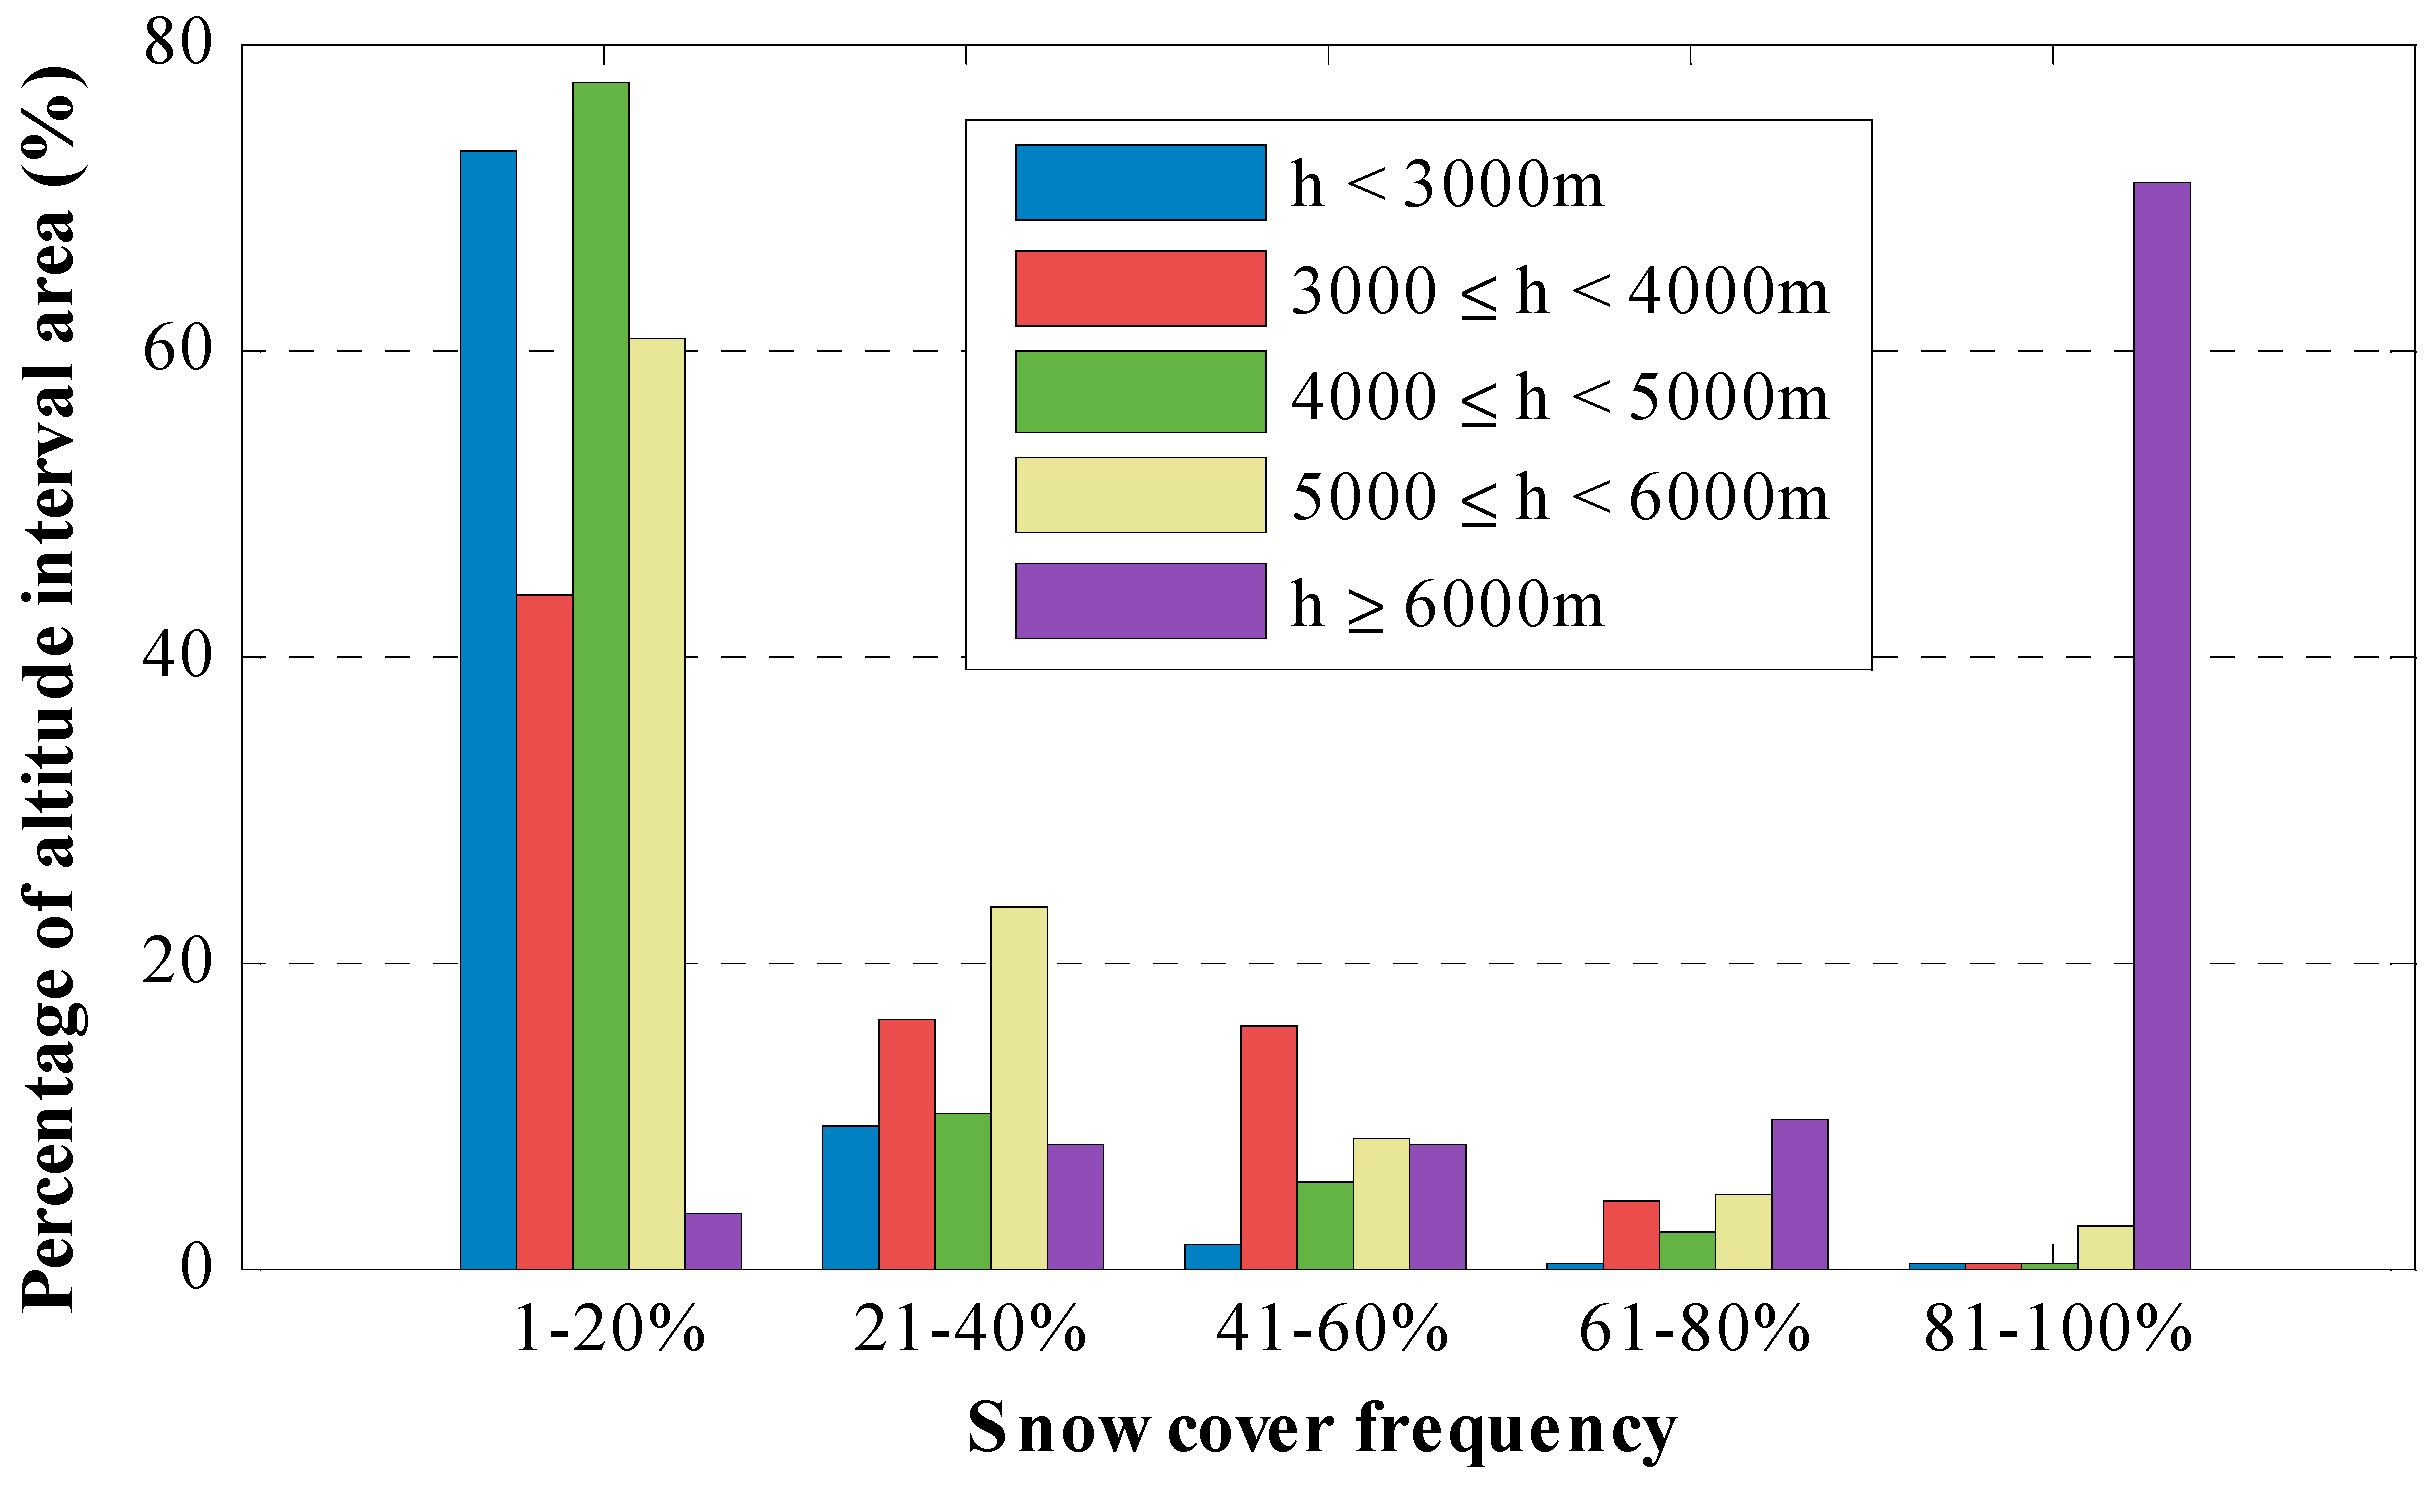
Figure 6.
Seasonal variation of the 2001–2015 average snow cover in percentage of the snow-covered area with respect to the total area of each altitude range.
Figure 6.
Seasonal variation of the 2001–2015 average snow cover in percentage of the snow-covered area with respect to the total area of each altitude range.

Figure 7.
The starting periods of snow accumulation and ablation.
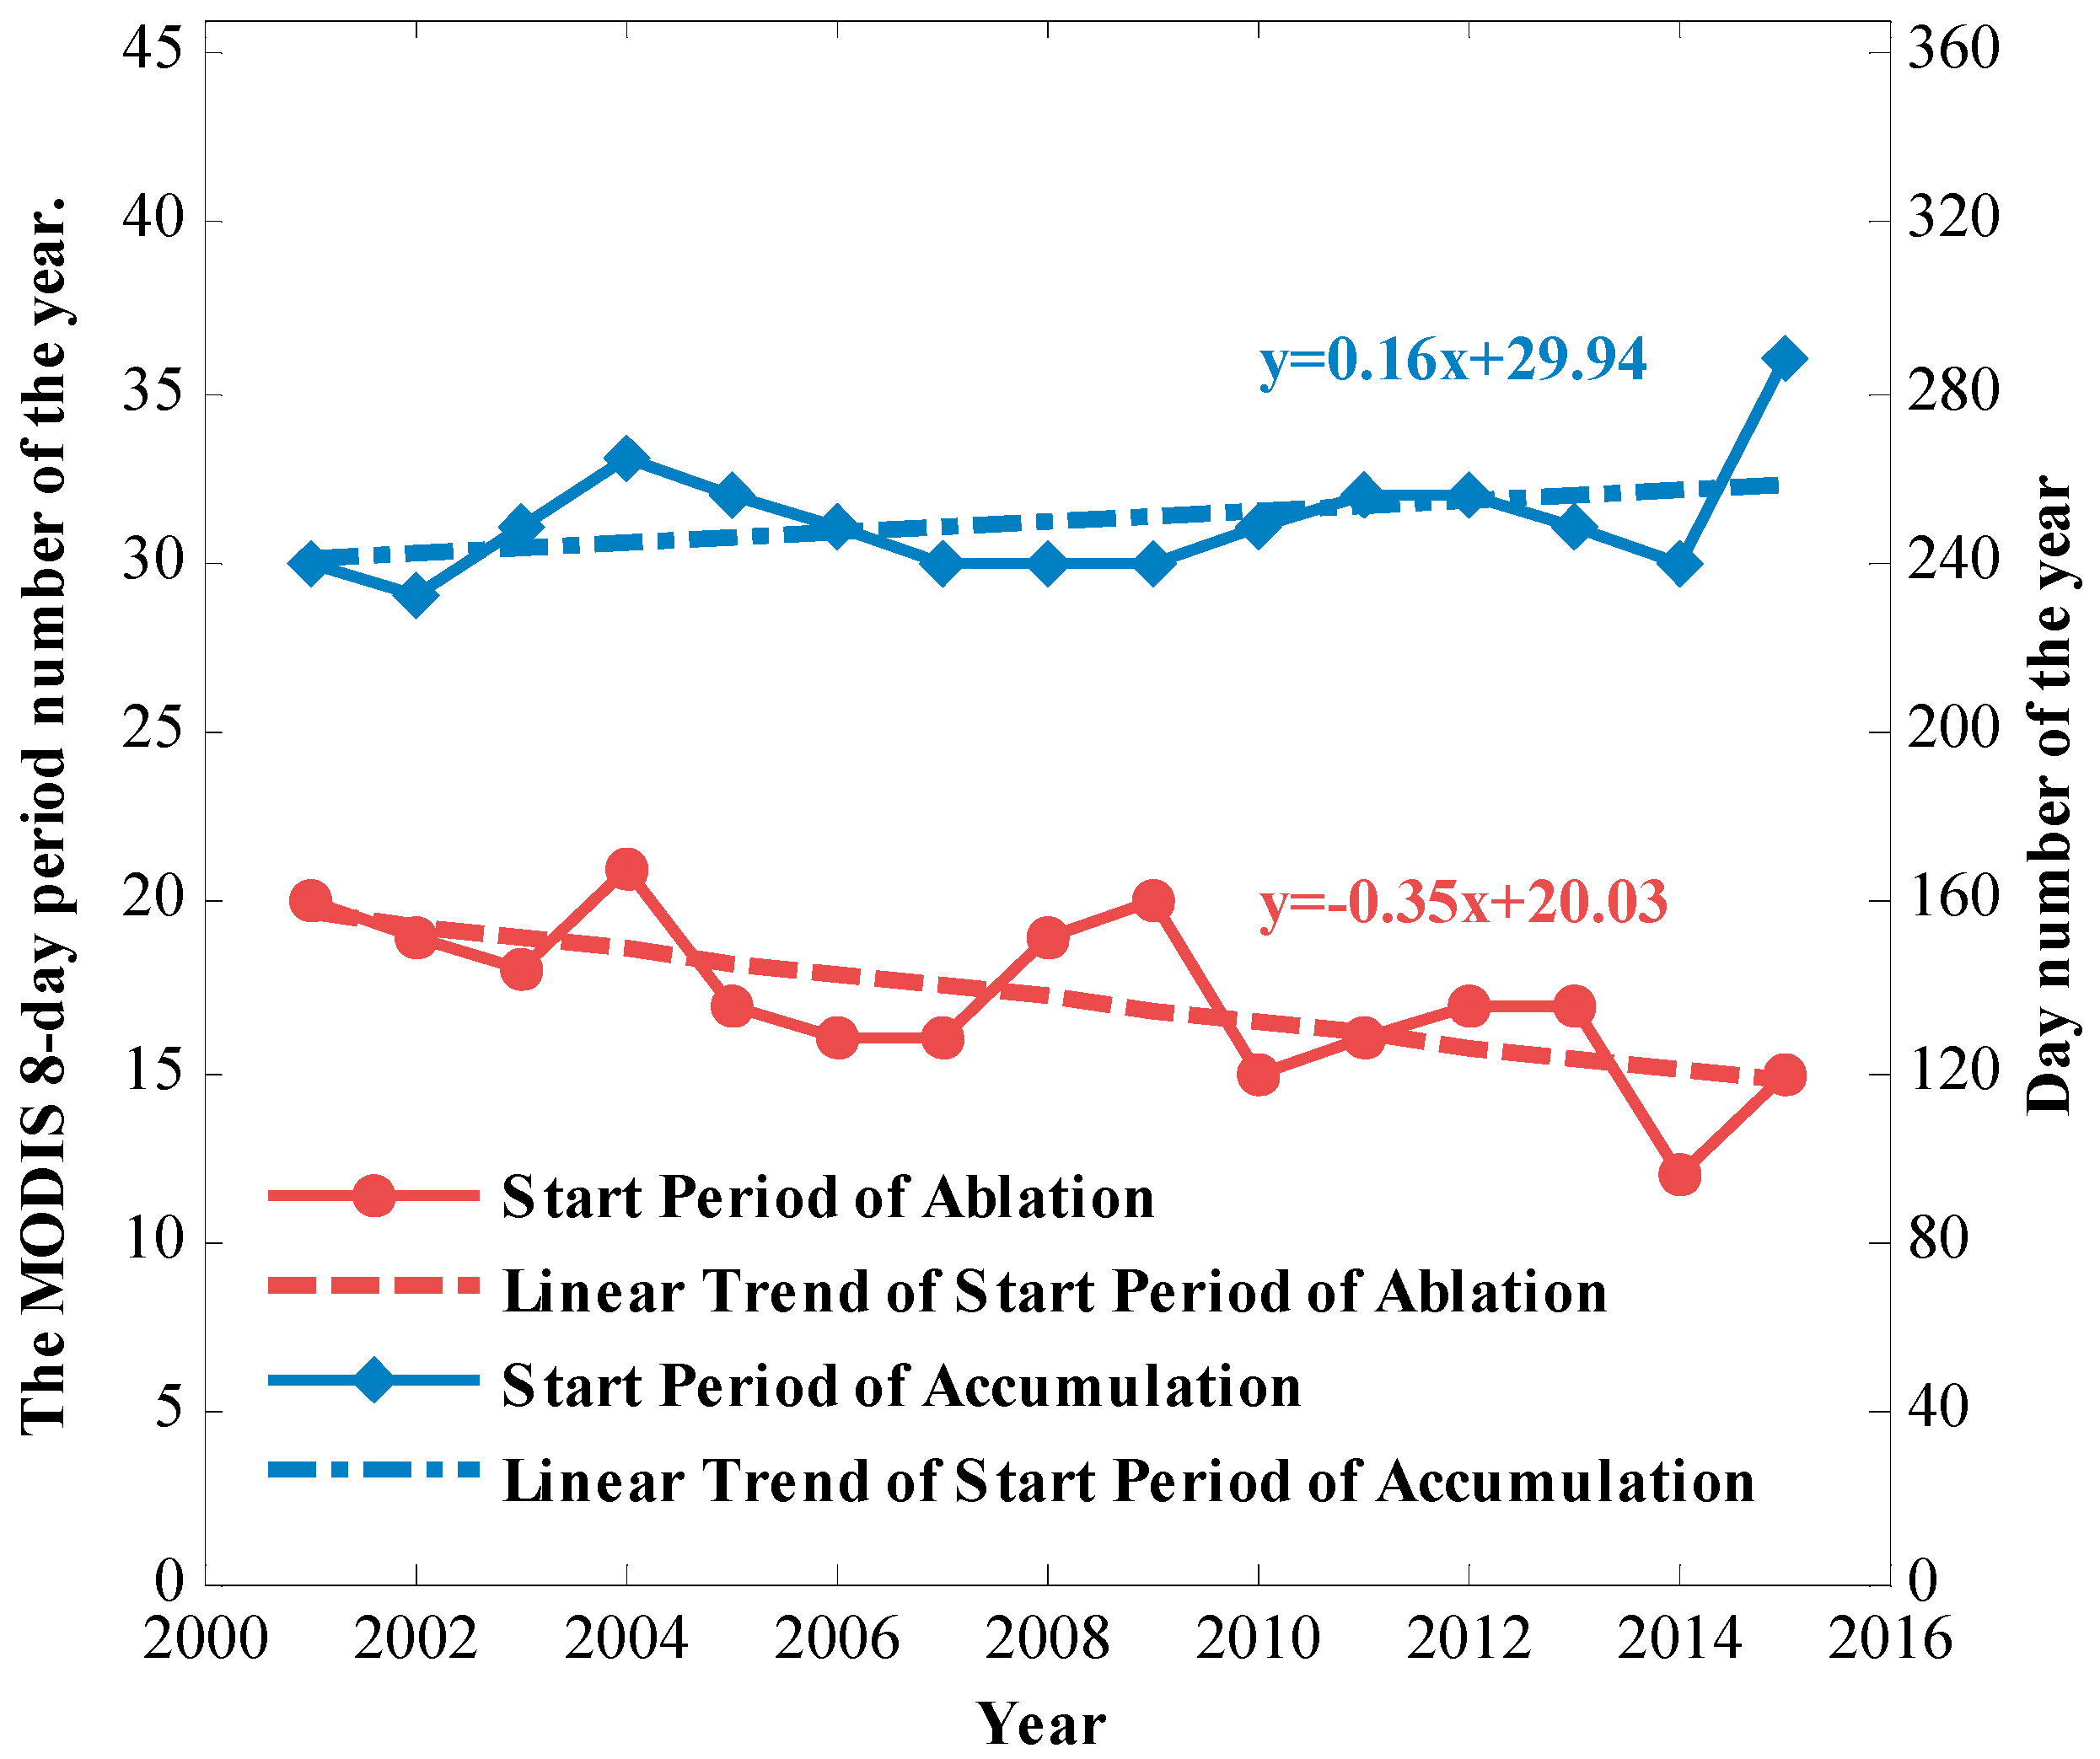
Figure 8.
Daily values for individual years (blue) and for the average year (red) of the number of snow-covered stations.
Figure 8.
Daily values for individual years (blue) and for the average year (red) of the number of snow-covered stations.

Figure 9.
The 2001–2015 average percentages of snow stations for three altitude ranges smoothed by an eight-day moving average filter.
Figure 9.
The 2001–2015 average percentages of snow stations for three altitude ranges smoothed by an eight-day moving average filter.

Figure 10.
Start days of snow accumulation and ablation at the 37 ground stations during 2001–2015 based on the criteria (see the text) applied to the eight-day moving average data of the numbers of daily snow stations.
Figure 10.
Start days of snow accumulation and ablation at the 37 ground stations during 2001–2015 based on the criteria (see the text) applied to the eight-day moving average data of the numbers of daily snow stations.

Figure 11.
(a) The relationship between MODIS and ground observed snow cover at the stations; (b) Difference between MODIS and ground observed snow cover as a function of ground snow cover. The red lines are the respective linear regressions.
Figure 11.
(a) The relationship between MODIS and ground observed snow cover at the stations; (b) Difference between MODIS and ground observed snow cover as a function of ground snow cover. The red lines are the respective linear regressions.
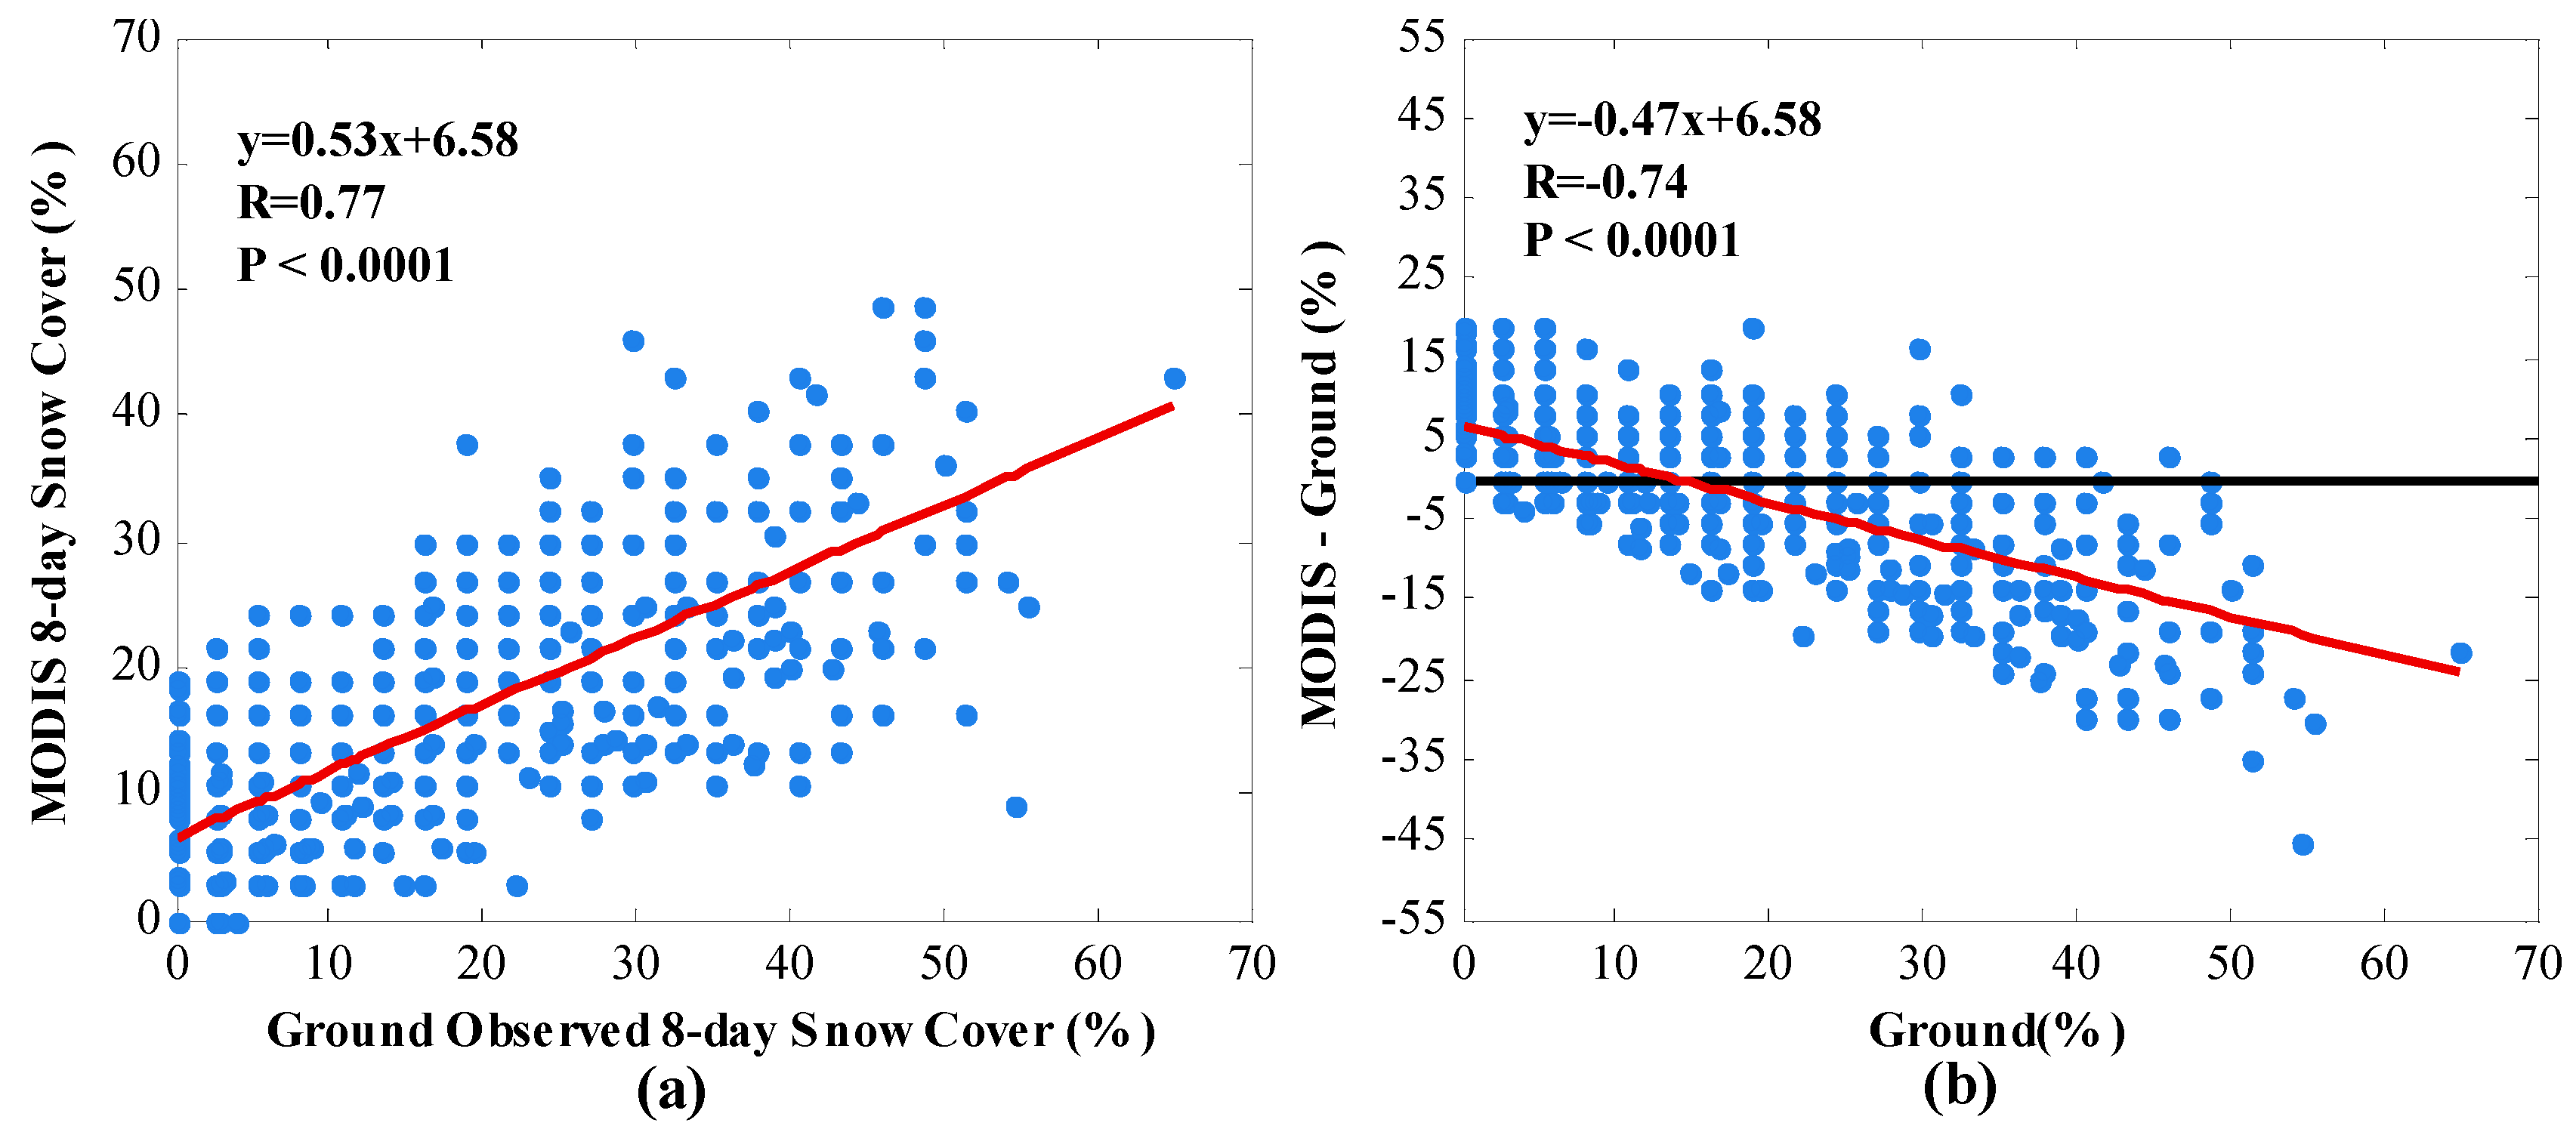
Figure 12.
The eight-day snow cover (in %) in Tibet during 2001–2015. The red and blue curves represent the MODIS and station data, respectively.
Figure 12.
The eight-day snow cover (in %) in Tibet during 2001–2015. The red and blue curves represent the MODIS and station data, respectively.

Figure 13.
The average annual cycles (red curves) of the percentage of daily snow-covered stations (a) and of the MODIS eight-day data (b). The vertical blue bars indicate ±one standard deviation.
Figure 13.
The average annual cycles (red curves) of the percentage of daily snow-covered stations (a) and of the MODIS eight-day data (b). The vertical blue bars indicate ±one standard deviation.
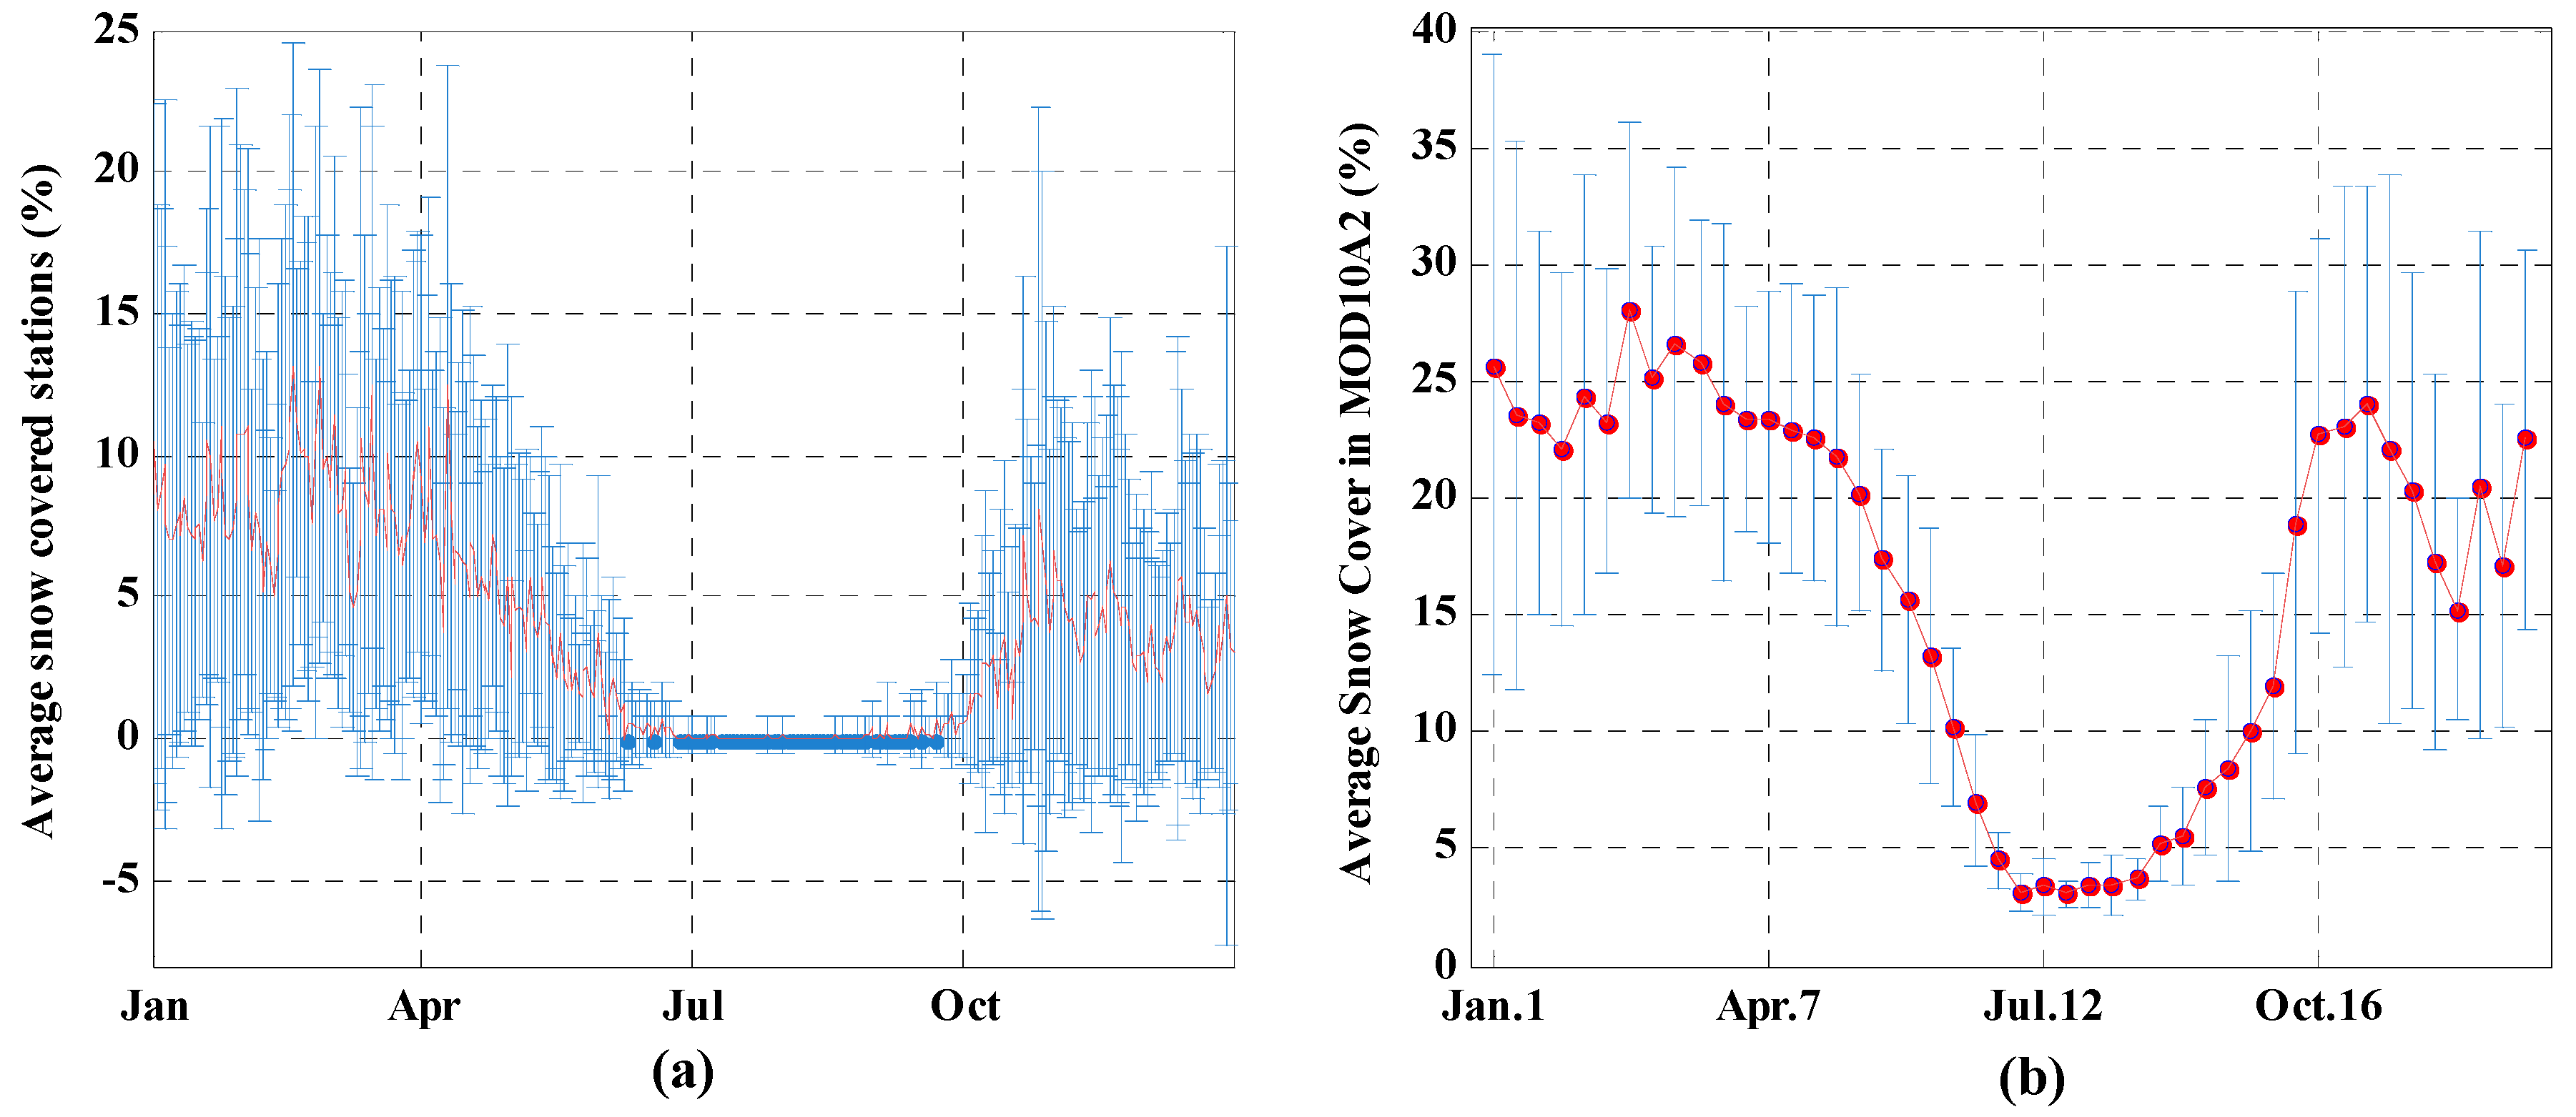
Table 1.
Areas and percentage of the total area of Tibet for the different frequency ranges of snow cover during 2001–2015.
Table 1.
Areas and percentage of the total area of Tibet for the different frequency ranges of snow cover during 2001–2015.
| Frequency Range (%) | Areas (km2) | Percentage of Tibet Area (%) |
|---|---|---|
| Snow Free | 52,416 | 4.2 |
| 1–20 | 856,314 | 68.0 |
| 21–40 | 197,098 | 15.7 |
| 41–60 | 88,441 | 7.0 |
| 61–80 | 44,176 | 3.5 |
| 81–100 | 20,488 | 1.6 |
Table 2.
Periods and start/end dates for the four different seasons of MODIS 8-day snow cover data.
| Season | Summer | Autumn | Winter | Spring |
|---|---|---|---|---|
| Period | 20–30 | 31–42 | 43–46 & 1–8 | 9–19 |
| Date | 2 June–28 August | 29 August–2 December | 3 December–5 March | 6 March–1 June |
Table 3.
Cloud cover percentage of Tibetan area for different ranges of frequency of four seasons during 2001–2015.
Table 3.
Cloud cover percentage of Tibetan area for different ranges of frequency of four seasons during 2001–2015.
| Frequency | Summer (%) | Autumn (%) | Winter (%) | Spring (%) |
|---|---|---|---|---|
| 0% | 15 | 42 | 32 | 36 |
| 1–20% | 72 | 56 | 65 | 57 |
| 21–40% | 8 | 2 | 2 | 5 |
| 41–60% | 5 | 0 | 1 | 1 |
| 61–80% | 1 | 0 | 0 | 0 |
| 81–100% | 0 | 0 | 0 | 0 |
Table 4.
Altitude intervals, their percentage of Tibet’s area and the area (percentage of Tibet’s area) of each interval that was snow covered during 2001–2015.
Table 4.
Altitude intervals, their percentage of Tibet’s area and the area (percentage of Tibet’s area) of each interval that was snow covered during 2001–2015.
| Altitude Interval | <3000 m | 3000–3999 m | 4000–4999 m | 5000–6000 m | >6000 m |
|---|---|---|---|---|---|
| Percentage of Tibet | 4.7% | 5.2% | 49.8% | 39.6% | 0.7% |
| Snow covered at least once during 15 years | 4.0% | 4.2% | 47.5% | 39.5% | 0.7% |
Table 5.
Average and maximum numbers of daily snow-covered stations in Tibet during 2001–2015.
| Year | 2001 | 2002 | 2003 | 2004 | 2005 | 2006 | 2007 | 2008 | 2009 | 2010 | 2011 | 2012 | 2013 | 2014 | 2015 |
|---|---|---|---|---|---|---|---|---|---|---|---|---|---|---|---|
| Average | 1.9 | 2.3 | 2.2 | 2.3 | 2.3 | 1.6 | 1.6 | 2.4 | 2.0 | 1.2 | 1.9 | 1.8 | 1.9 | 1.5 | 1.9 |
| Maximum | 11 | 16 | 18 | 18 | 14 | 13 | 14 | 21 | 15 | 11 | 12 | 14 | 11 | 12 | 16 |
Table 6.
Division of the stations into altitude intervals and their latitude and longitude ranges.
| Altitude Interval | 2300–3000 m | 3000–3999 m | 4000–4800 m |
|---|---|---|---|
| Number of stations | 4 | 17 | 16 |
| North Latitude Range | 28.65–29.87 | 28.18–31.48 | 27.73–32.50 |
| East Longitude Range | 94.22–97.47 | 81.25–98.60 | 80.08–93.78 |
Table 7.
The annual average and maximum MODIS and station snow cover.
| Year | Average (%) | Maximum (%) | Year | Average (%) | Maximum (%) | ||||
|---|---|---|---|---|---|---|---|---|---|
| Station | MODIS | Station | MODIS | Station | MODIS | Station | MODIS | ||
| 2001 | 13.8 | 15.5 | 48.6 | 40.2 | 2009 | 13.4 | 15.9 | 56.8 | 37.4 |
| 2002 | 17.5 | 20.3 | 45.9 | 49.2 | 2010 | 11.8 | 13.8 | 54.1 | 35.1 |
| 2003 | 15.5 | 15.0 | 51.4 | 43.1 | 2011 | 15.4 | 16.6 | 51.4 | 36.5 |
| 2004 | 15.2 | 15.8 | 51.4 | 40.9 | 2012 | 12.1 | 15.9 | 45.9 | 40.7 |
| 2005 | 15.7 | 19.5 | 48.6 | 36.6 | 2013 | 12.6 | 18.0 | 43.2 | 40.8 |
| 2006 | 13.1 | 18.1 | 54.1 | 46.9 | 2014 | 11.6 | 15.5 | 45.9 | 37.7 |
| 2007 | 11.1 | 16.4 | 51.4 | 39.7 | 2015 | 12.7 | 16.1 | 48.6 | 52.3 |
| 2008 | 14.9 | 17.5 | 64.9 | 40.1 | |||||
Table 8.
Average monthly precipitation and temperature during 2001–2015.
| Month | Jan. | Feb. | Mar. | Apr. | May | Jun. | Jul. | Aug. | Sep. | Oct. | Nov. | Dec. |
|---|---|---|---|---|---|---|---|---|---|---|---|---|
| Precipitation (mm) | 2.7 | 5.2 | 12.7 | 23.4 | 40.7 | 73.0 | 111.9 | 100.5 | 58.5 | 21.8 | 3.8 | 1.3 |
| Temperature (°C) | −4.3 | −1.9 | 2.0 | 5.3 | 9.2 | 12.9 | 13.7 | 13.0 | 10.6 | 5.3 | −0.1 | −3.1 |
Table 9.
Differences between MODIS and station data for the starting day of ablation and accumulation during 2001–2015.
Table 9.
Differences between MODIS and station data for the starting day of ablation and accumulation during 2001–2015.
| Year | 2001 | 2002 | 2003 | 2004 | 2005 | 2006 | 2007 | 2008 | 2009 | 2010 | 2011 | 2012 | 2013 | 2014 | 2015 |
|---|---|---|---|---|---|---|---|---|---|---|---|---|---|---|---|
| Ablation | 7 | 4 | 2 | 11 | −4 | −6 | −5 | 11 | 8 | 2 | −5 | 6 | 2 | −28 | 0 |
| Accumulation | −44 | −26 | −47 | −1 | −20 | −28 | −50 | −2 | −37 | −29 | −14 | −28 | −25 | −28 | 5 |
© 2017 by the authors. Licensee MDPI, Basel, Switzerland. This article is an open access article distributed under the terms and conditions of the Creative Commons Attribution (CC BY) license (http://creativecommons.org/licenses/by/4.0/).
Share and Cite
MDPI and ACS Style
Basang, D.; Barthel, K.; Olseth, J.A. Satellite and Ground Observations of Snow Cover in Tibet during 2001–2015. Remote Sens. 2017, 9, 1201. https://doi.org/10.3390/rs9111201
AMA Style
Basang D, Barthel K, Olseth JA. Satellite and Ground Observations of Snow Cover in Tibet during 2001–2015. Remote Sensing. 2017; 9(11):1201. https://doi.org/10.3390/rs9111201
Chicago/Turabian StyleBasang, Droma, Knut Barthel, and Jan Asle Olseth. 2017. "Satellite and Ground Observations of Snow Cover in Tibet during 2001–2015" Remote Sensing 9, no. 11: 1201. https://doi.org/10.3390/rs9111201
Note that from the first issue of 2016, this journal uses article numbers instead of page numbers. See further details here.