Moisture Content Measurement of Broadleaf Litters Using Near-Infrared Spectroscopy Technique

1
Department of Biosystems and Biomaterials Science and Engineering, Seoul National University, 1 Gwanak-ro, Gwanak-gu, Seoul 08826, Korea
2
Research Institute of Agriculture and Life Sciences, Seoul National University, 1 Gwanak-ro, Gwanak-gu, Seoul 08826, Korea
3
Department of Forest Sciences, Seoul National University, 1 Gwanak-ro, Gwanak-gu, Seoul 08826, Korea
*
Author to whom correspondence should be addressed.
Remote Sens. 2017, 9(12), 1212; https://doi.org/10.3390/rs9121212
Submission received: 18 October 2017
/
Revised: 14 November 2017
/
Accepted: 20 November 2017
/
Published: 24 November 2017
(This article belongs to the Section Forest Remote Sensing)
Abstract
:Near-infrared spectroscopy (NIRS) was implemented to monitor the moisture content of broadleaf litters. Partial least-squares regression (PLSR) models, incorporating optimal wavelength selection techniques, have been proposed to better predict the litter moisture of forest floor. Three broadleaf litters were used to sample the reflection spectra corresponding the different degrees of litter moisture. The maximum normalization preprocessing technique was successfully applied to remove unwanted noise from the reflectance spectra of litters. Four variable selection methods were also employed to extract the optimal subset of measured spectra for establishing the best prediction model. The results showed that the PLSR model with the peak of beta coefficients method was the best predictor among all of the candidate models. The proposed NIRS procedure is thought to be a suitable technique for on-the-spot evaluation of litter moisture.
1. Introduction
Floor litter refers to the relatively fresh organic residue on the uppermost layer of soil; it plays an important role in the water dynamics of the forest floor [1]. It can retain water within the layer during storm periods and deplete stored moisture through evaporation [2]. The moisture variation of litter can influence the hydrologic, carbon, and nutrient cycles of forests by altering the wetting and drying phases [3,4]. Moreover, litter moisture content is one of the critical determinants for fire ignition and spread in forests [5].
Several attempts have been made to quantitatively measure the moisture variation of floor litter over the past couple of decades [6]. Among them, the gravimetric method is the most common technique that determines the moisture amount from the difference in the litter weight of wet and dry conditions [7]. Yet, it is a highly cumbersome and labor-intensive measurement. Some researchers have attested the continuous non-destructive techniques for litter moisture measurement. Gillespie and Kidd proposed the electrical impedance grids with mock leaf sensors to monitor the leaf wetness of crops [8]. This technique was further improved by Hanson et al. [9]. On the other hand, time-domain reflectometry (TDR) probes have been employed in litter moisture measurement [10,11]. Ataka et al. developed a rather simple technique to continuously detect moisture content in litters using the modified capacitance sensors [1]. Robichaud and Bilskie developed a commercial device for measuring dead fuel moisture with a frequency domain (FD) sensor [12]. However, these methods exhibit inherently electrical bias and limitations for the in situ measurement of litter moisture, because floor litter is highly heterogeneous and porous material with lower density and compactness.
Recently, spectroscopy techniques have been widely used to nondestructively analyze the quality of crops, chemicals, and biomaterials [13,14,15,16,17,18]. Among them, a near-infrared spectroscopy (NIRS) technique is being considered as a promising spectroscopic method that treats the near-infrared (NIR) region of an electromagnetic spectrum, which corresponds to the wavelength range of 780 to 2500 nm [19]. NIRS can obtain a signal of relatively high energy when compared to far-infrared and microwave radiation, and also detect the special spectrum from the intrinsic component of object because each functional group in a molecule has characteristic absorption frequencies in the NIR spectrum by their vibrational characteristics of several chemical bonds (O-H, C-H, and N-H). The exact frequency at which a given vibration occurs is determined by the strengths of the bonds involved and the mass of the component atoms. Moreover, a NIR device structurally consists of a light splitter, a fiber optic cable, a monochromator, and a detector. Since this simple assembly is relatively easy to implement, the NIRS technique is being widely used in nondestructive quality analysis for food, feed, pharmaceutical, and agricultural industries [20,21,22]. In ecological studies, NIRS has been successfully used for the determination of organic compounds in soils [23,24,25], or to characterize the composition of forest foliage and forest litters [26,27,28,29]. Gillon et al. predicted litter decomposability more accurately by NIRS than by the initial litter composition measured by standard chemical methods [30]. Petra et al. investigated the ability of near infrared reflectance spectroscopy for the rapid determination of several chemical properties of plant litters, and found good relationships between the chemical properties and NIR spectra using partial least squares regression method by showing that the r2 that varied from 0.80 to 0.99 [31].
It is known that NIR spectra possess complex and overlapping absorption bands, so that mathematical procedures are needed for turning the spectra into meaningful information. Therefore, a multivariate analysis method is commonly used for the analysis of data sets with more than one variable because it is capable of describing how the measured spectral features are related to the property of interest [32,33]. Until now, some multivariate techniques, such as partial least-squares regression (PLSR), principal component regression (PCR), and multiple linear regression (MLR), are commonly used to extract quantitative and qualitative information from NIR spectra [34,35]. However, NIRS technique is occasionally facing an undesired situations in use, i.e. noise can be induced into reflectance spectra by environment and instruments. This undesired influences can reduce the detection accuracy of a prediction model because NIR spectrum comprises various combinations and overtones of fundamental vibrational transitions that are overlapped. Therefore, suitable preprocessing techniques were developed and applied to eliminate the inappropriate noise components [36]. Rinnan et al. provided an overview of preprocessing techniques that are widely used in NIRS applications [37].
In addition to the application of suitable preprocessing techniques, an optimal variable selection method is being significantly considered as a critical step to establish a reliable and robust model because it can extract a key subset of optimal spectral frequencies to produce better prediction results [38,39]. Moreover, the optimally squeezed variable can be usefully applied to on-the-spot evaluation of dead leaf litter moisture. For this purpose, many mathematical approaches for optimal wavelength selection have been studied from the scientific knowledge on the spectroscopic properties of materials [40]. It was revealed that the selection of informative variables can produce better and simpler prediction models if the wavelengths carrying the most valuable information are carefully selected. Indeed, the removal of redundant, irrelevant, and noisy wavelengths can typically enhance the models in terms of accuracy and robustness, and also reduce their complexity [41,42]. Therefore, we employed four different variable selection methods that refer to the optimal separation of classes and the selection of spectral bands to demonstrate the accuracy enhancement of prediction models.
The main objective of this study is to develop a nondestructive and non-contact moisture measuring method of broadleaf litters using the NIRS technique through the selection of optimal wavelength. Floor litter samples were taken from deciduous forests, and the gravimetric method was used to obtain the reference moisture content of each sample. PLSR multivariate analysis with several preprocessing techniques has been employed to quantitatively predict the moisture content of floor litter. In addition, four different optimal variable selection methods were used to extract the optimal wavelength range through model development, and the model performance was also evaluated in conformity with variable selection methods.
2. Materials and Methods
2.1. Litter Moisture Measurement
The NIR spectra were acquired from the current year’s (2017 years) litters, collected in the Seoul National University Arboretum in Seoul, Korea. The broadleaf litters were manually gathered under deciduous trees, such as Chinese cork oak (Quercus variabilis), Sawtooth oak (Quercus acutissima), and Mongolian oak (Quercus mongolica). Sampled litters were then sorted to three groups according to tree species. All of the samples were immersed in water for 12 h in order to fully saturate, and were then placed in a screened plate for a certain times to naturally drain water from samples. During the spectra measurements of 10 h, all of the samples were naturally dried in the laboratory environments that were controlled at a temperature of 24 °C and relative humidity of 30%, and three leaves were extracted from each species group and the reflectance spectrum of single leaf litter was measured at every one hour. The weight of each litter was immediately measured to obtain the initial wet weight of litter when NIR measurement was done. After the experiment was completed, all of the litter samples were placed in an oven at a temperature of 70 °C for 48 h, and then measured the weight of oven-dried litter to obtain the dry weight. The moisture content of litter was calculated based on the gravimetric method as follow:
where mw and md are the litter weight of wet and oven-dried conditions, respectively. The moisture content histogram of broadleaf litters used in this study is shown in Figure 1, and the data are summarized in Table S1.
2.2. NIR Spectra Measurement
NIR reflectance spectra of litter samples were sampled in spectral range from 904 to 1707 nm with the NIR spectrometer (CDI-NIR128, Control Development Inc., South Bend, IN, USA). The tungsten-halogen lamp (LS-1, Ocean Optics, Largo, FL, USA) was installed as a light source, as shown in Figure 2. The reflectance spectrum was taken at three different positions on the litter surface, and then the averaged values were recorded according to the moisture content of litter samples. The integration time was set to 0.25 s, and the distance between the sample and a probe was maintained at 1 cm. The reflectance of measured spectra was calibrated by using both white-referenced and dark-referenced spectra, as shown in Equation (2). The white-referenced spectra was measured from the reflectance from a spectralon panel, and the dark-referenced spectra was measured with a completely blocked fiber optic cable in a dark room.
where Oi is the raw reflectance of the ith sample, and D and R represent the raw reflectance of dark- and white-referenced spectra, respectively.
2.3. Multivariate Model Development
The pretreatment of raw NIR spectra is the first step for model development and optimization to achieve the better NIR veracity. The instrument and environment causes may lead to sample-to-sample variations, such as noise, light scattering, and optical path changes. Generally, spectral preprocessing is strongly demanded to exclude noise components in reflectance spectra. In this study, two scatter correction techniques (multiplicative scatter correction (MSC), standard normal variate (SNV)), three normalization techniques (maximum normalization, mean normalization, range normalization), and three Savitzky-Golay (SG) filters (smoothing, the first- and second-derivative with a cubic polynomial and a window size of five points) were used for spectra pretreatment.
The PLSR model was also employed to establish the relationship between litter moisture content and reflectance responses. PLSR is a classical and widely used statistical method that bears a relation between independent and dependent variables in large data sets. The general structure of PLSR model is written as follow:
where X is the n by m matrix of predictors, Y is the n by p matrix of responses, T is the n by 1 matrix of the score matrix, E and F are Gaussian error terms, and P and Q are the m by 1 and p by 1 loading matrices.
The performance of PLSR model is quantitatively assessed with the root mean square error (RMSE) and the coefficient of determination (R2). For calibration purposes, the regression model with a small RMSE value and a large value of R2 could be selected as an appropriate model. In this study, latent variables (LVs) set with the smallest RMSE value was determined through the validation procedure, and then the prediction model performance was evaluated through the further test process.
A calibration model has to be evaluated with a validation set of samples to get an impression of its predictive ability. Model test has sometimes conducted in the NIRS research to further ensure model performance when the calibration and validation have completed. Among 99 spectra dataset, model calibration, validation, and test have conducted from 60, 15, and 24 dataset, respectively. Both preprocessing and regression analysis were done by using MATLAB commercial software (ver. R2016, MathWorks, Natick, MA, USA).
2.4. Estimation of Prediction Uncertainty
Uncertainty estimation is an important criterion in the prediction model, and in the case of ordinary regression, there is a standard expression that quantifies uncertainty. However, it is known that there is no generally accepted uncertainty estimation method in chemometrics, such as PLSR model. For uncertainty estimation of PLSR model, various methods such as linearization-based methods, re-sampling method, and U-deviation have been proposed [43]. In this study, the uncertainty of the PLSR model was estimated by the re-sampling method using bootstrap residual [44]. As a first step, residues of the constructed PLSR model were calculated, and in this study, pseudo-degrees of freedom was used to obtain degree of freedom in multivariate regression [45]. We constructed bootstrap residues F* through random substitutions with replacement for the calculated residues, and then added the constructed bootstrap residues to the YPLS matrix to compute the Y* matrix as follow:
Then, we constructed a new PLSR model by using the obtained Y* and calculated the predicted value of the model for each sample i using the new model Beta coefficient β* to calculate the residues of the predicted value of the existing model and the predicted value of the new model. This bootstrap residue was calculated by repeating N times. The 95% bootstrap confidence intervals were computed during the calculation and the confidence interval was calculated using the percentile method in the distribution of yi values of each sample as follows:
where α is the degree of confidence, and N is the repeating number of the bootstrap calculation.
2.5. Optimal Wavelength Selection
The reflectance spectra, ranging 904 to 1707 nm, were used in this study for establishing a regression model to predict the moisture content of litter. PLSR technique generally uses the entire range of wavelength’s spectra, but recent studies have employed the most appropriate wavelength. It proved that data analysis involving only a representative part of the spectra can lead to a better prediction performance. Selection of optimal wavelength is to carefully pick the subset of spectral data, which closely relate to the property of the interest. If the number of wavelength bands are greater than that of spectral samples, then the predictive model is likely to enhance its capability with the optimal wavelength. In this study, various techniques such as the peak of beta coefficients, variable importance in projection (VIP), bootstrap of beta coefficients, and interval PLS (iPLS) were applied to determine the optimal wavelength from preprocessed spectra information.
2.5.1. Peak of Beta Coefficient
The peak of beta coefficients (beta-peak method) extracts the optimal wavelength corresponding to the peak of beta coefficients. The beta coefficient, the regression coefficient of PLSR model, is a linear vector between the measured spectra and the predicted values. It measures the contribution of each wavelength set on the model’s predictive ability so as to select the optimum wavelength.
2.5.2. Variable Importance in Projection
VIP is a method that evaluates the contribution of a variable on the weight matrix of a multivariate analysis, such as a PLSR model. The idea of this method is to accumulate the importance of each variable j being reflected by w from each component. It has been widely applied to determine major wavelength bands when the variable matrix X defined in Equation (3) was considered [46]. The VIP measure vj is defined as follows [47]:
where vj represents the VIP value, p is the number of variables, SSa is the sum of squares explained by the ath component, wa is the weight of ath component, and wak is the weight of the ath component at the kth variable.
Hence, the vj is a measure of the contribution of each variable according to the variance explained by each PLS component where (wak/ǁwaǁ2) represents the importance of the kth variable. The variable selection process by a VIP technique is terminated when the calculated VIP value approaches to the threshold. In general, a threshold value of 1 is set in many studies. In this study, we compared the accuracies of developed models for selected wavelength sets by adjusting a threshold value.
2.5.3. Bootstrap of Beta Coefficients
The bootstrap of beta coefficients (bootstrap method) is a useful technique to set the confidence interval, and to estimate the significance level. It is mainly used when it is difficult to estimate the distribution of samples. In the bootstrap method, a new dataset is first obtained by randomly re-sampling the sample population. Thereafter, statistical values are obtained from the selected data sets, and then the confidence interval is set [48]. The PLSR-bootstrap method can re-sample the sample data n times and perform a PLSR for each re-sampled data set to obtain the beta coefficient. From the distribution of beta coefficients, the confidence interval is obtained according to the significance level of the beta coefficient of the specific variable. Finally, optimal wavelength is determined by removing the variables with zero value in its confidence interval. The confidence interval is computed by
where Ik represents the confidence interval, is the mean of beta coefficients at the kth variable, c is a constant that determines the confidence interval, and Sk is the standard deviation of beta coefficients at the kth variable.
In Equation (7), the constant c is explicitly determined regarding the level of significance. A higher significance level could select fewer wavelength bands. In this study, the number of re-sampling is set to 1000, and the model accuracy with the selected wavelength is evaluated by changing the c values [49].
2.5.4. Interval PLS
iPLS executes a PLSR model with the wavelength of a specific interval rather than the entire wavelength band. It removes unnecessary wavelength bands and uses only the certain bands of a given interval. The interval is repeatedly sampled to achieve the lowest RMSE value. In this study, the entire wavelength band divided into 20 intervals and PLSR analysis was conducted to acquire the optimal wavelength by shifting the wavelength range to the right or the left until the smallest RMSE value was pursued [50].
3. Results
3.1. Reflectance Spectra of Litters
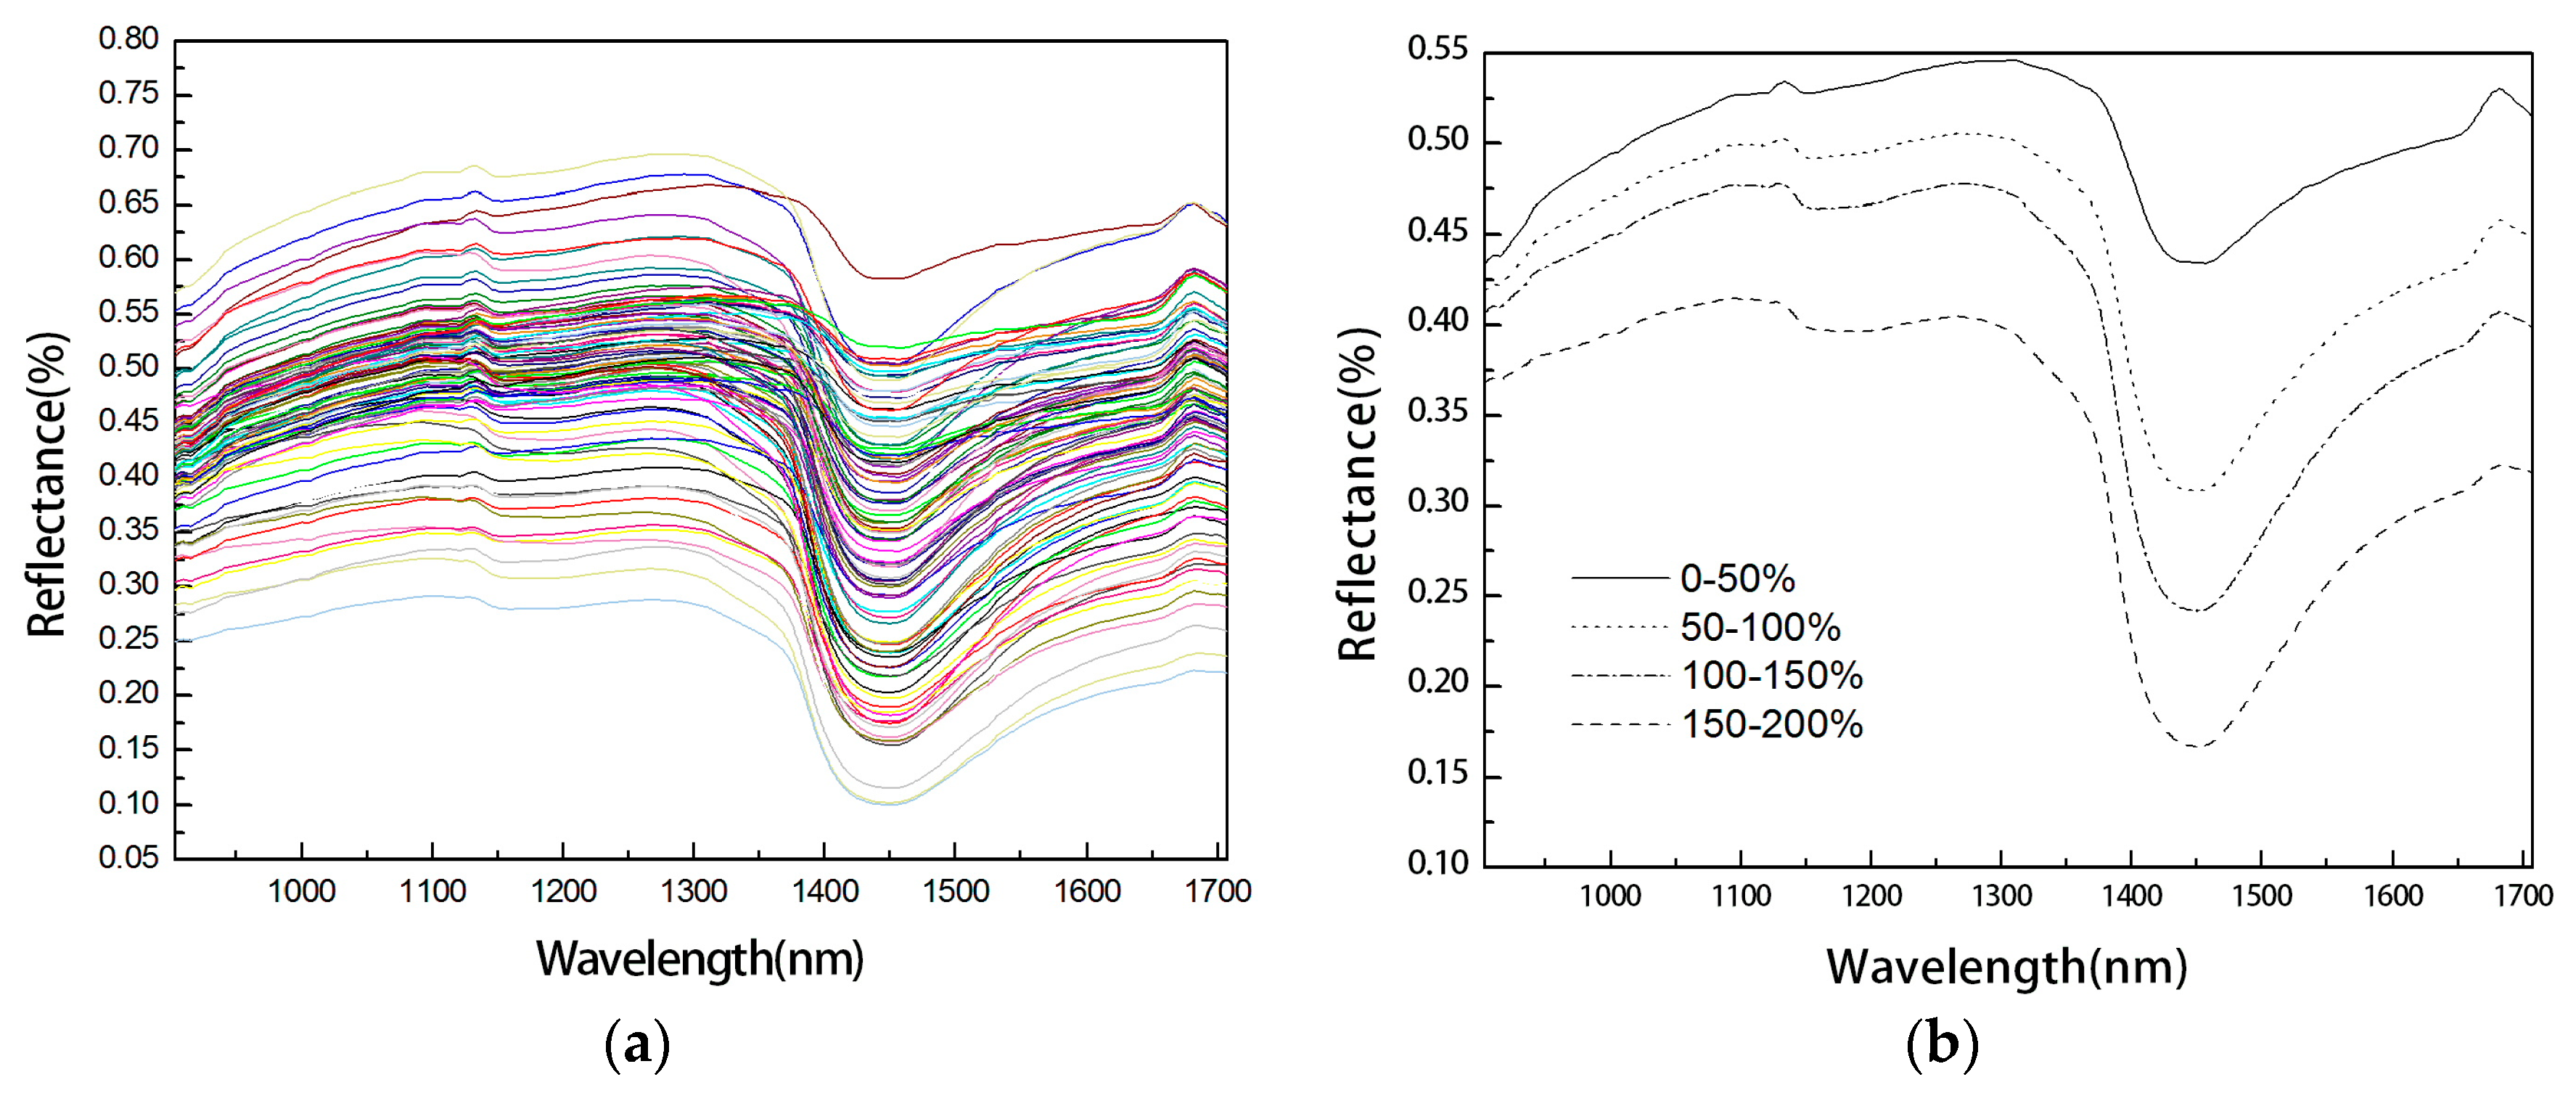
Figure 3 depicts the raw and average NIR reflectance spectra of litter samples in the wavelength range of 900–1700 nm prior to the pretreatment. There seems to be a slight variation in all of the reflectance spectra through the litter moisture (Figure 3a). Figure 3b illustrates the averaged spectra with different degrees of litter moisture (0–50%, 50–100%, 100–150%, and 150–200%). The spectral difference appeared more clearly in Figure 3b. The absorption rate of NIR spectrum increased in the wavelength range of 1400–1500 nm regardless of litter moisture. It is commonly known that NIR spectrum is mostly absorbed at 980, 1222, and 1450 nm wavelength by the overtone and combination of the vibrational transitions of water molecules [51]. On the NIR reflectance of litters, the absorption coefficients at 980 and 1222 nm wavelength were estimated to be less than 1.3 cm−1, while the value was estimated to be 29.8 cm−1 at a wavelength of 1450 nm [51]. Figure 3b exhibits that the reflectivity of NIR spectrum decreased sharply beyond the wavelength of 1400 nm and had the lowest value at the wavelength of 1450 nm for all of the litter samples.
3.2. PLSR Model for Different Preprocessing Methods
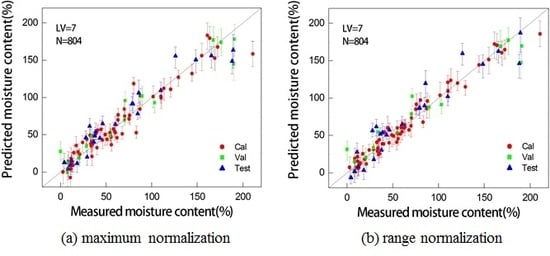
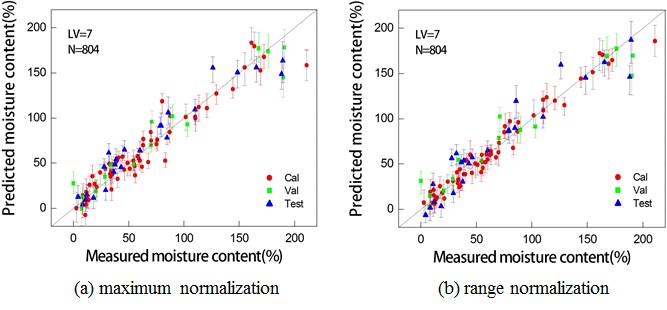
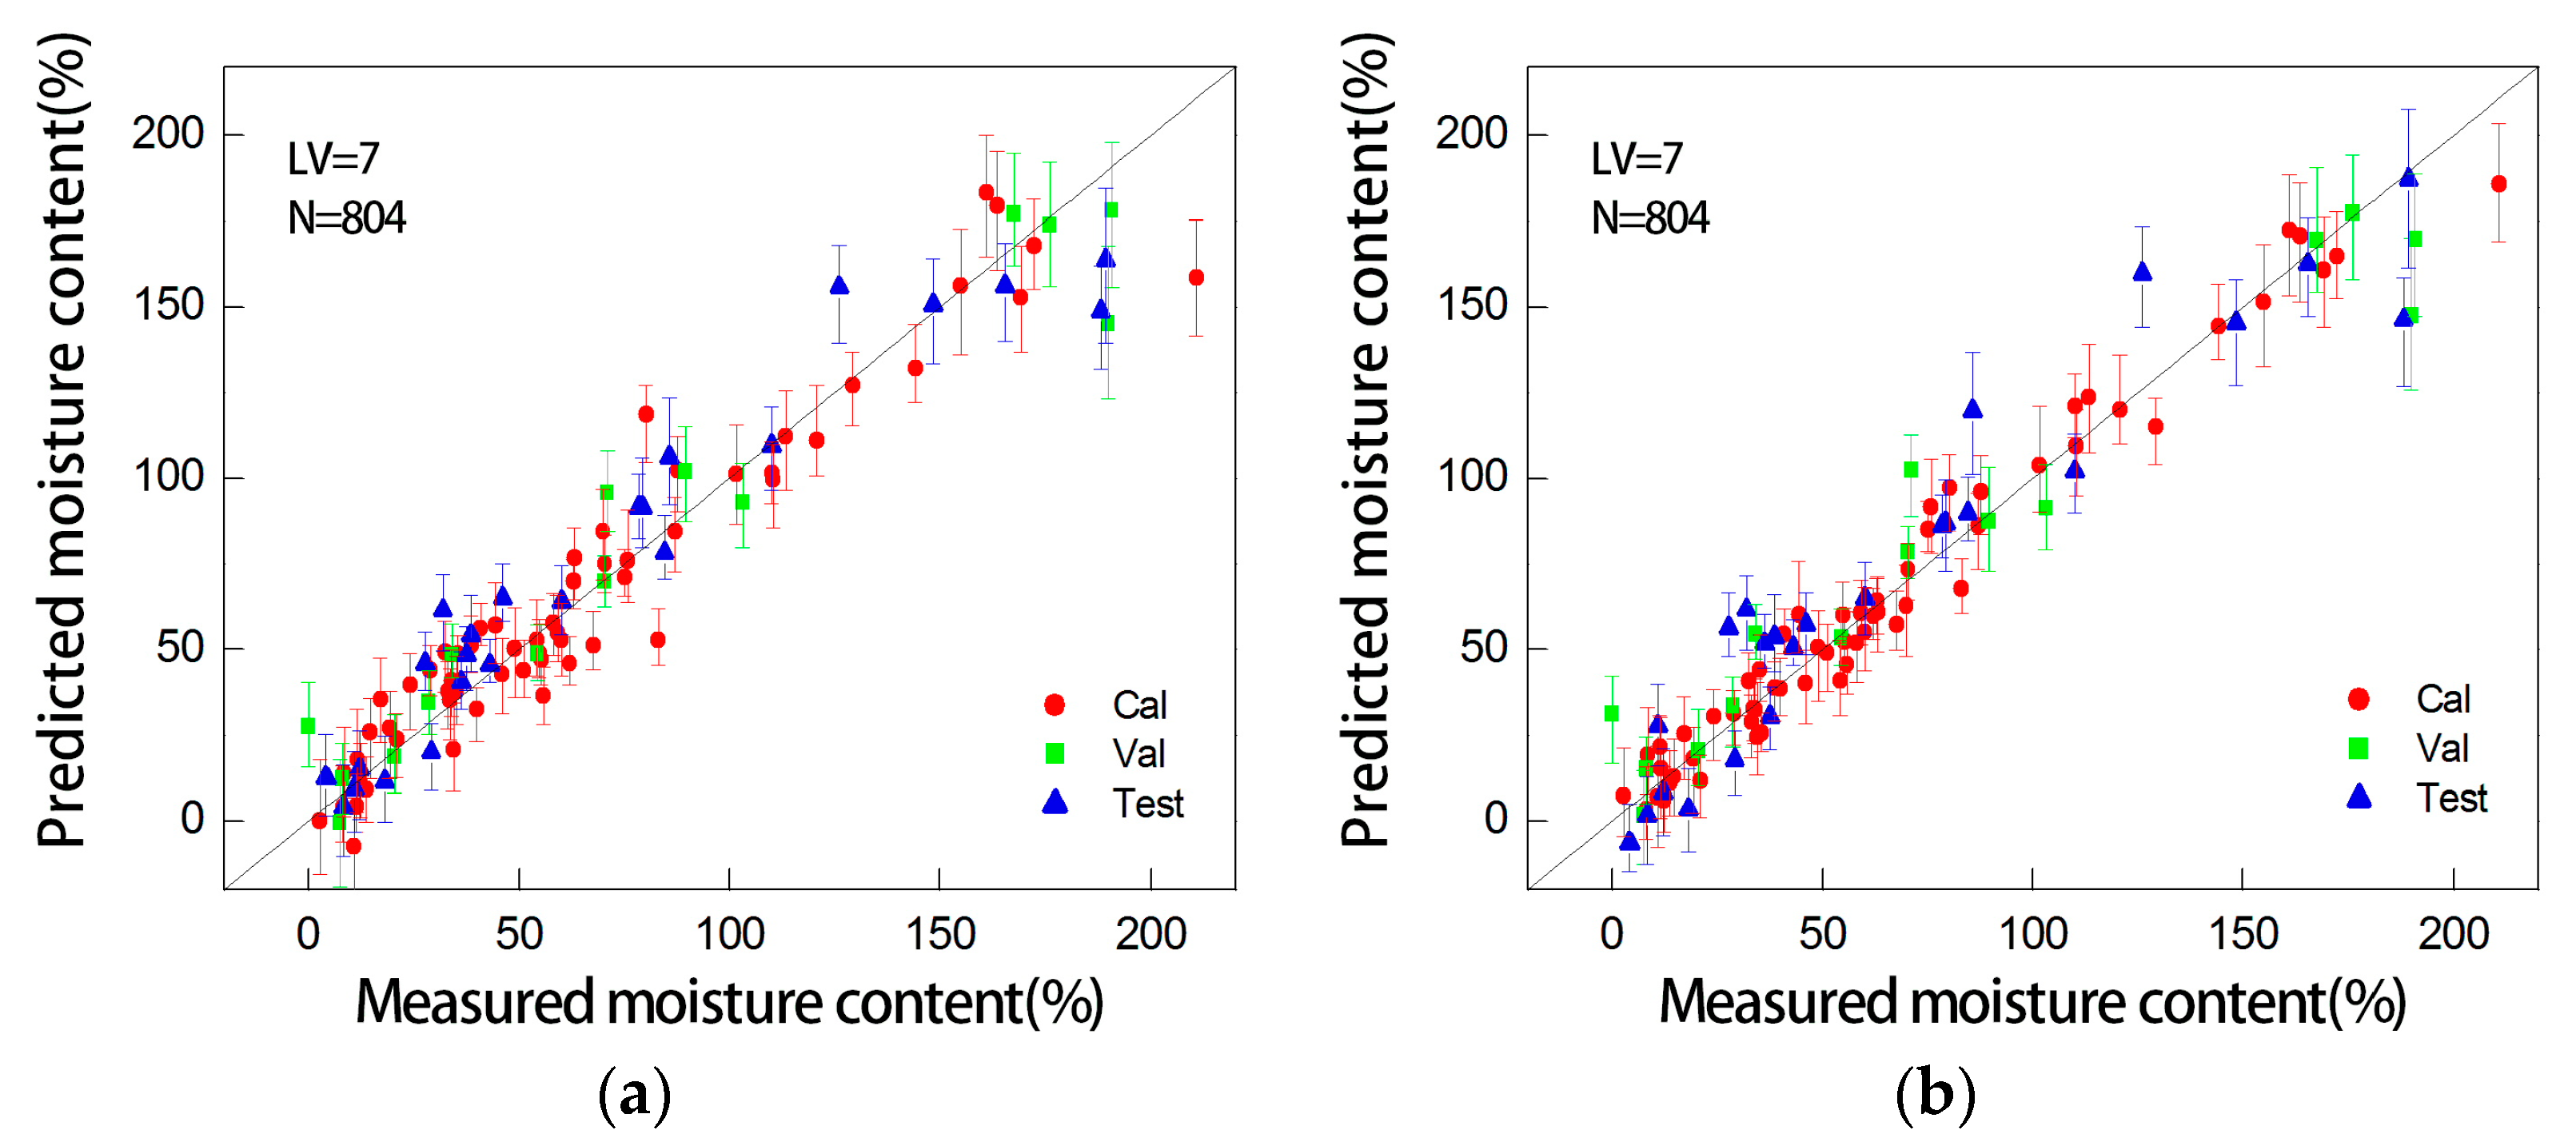
A number of pretreatment techniques for NIR spectra have been tested to achieve better performance in litter moisture spectral model. Table 1 compares the results of PLSR model with different spectral preprocessing techniques. The entire range of NIR dataset was treated and used to develop PLSR models with the different preprocessing techniques. The performance of the model was evaluated with two statistical criteria, coefficient of determination (R2) and root mean square error (RMSE), between the reference and prediction of litter moisture content. The PLSR models treated by the preprocessing methods of MSC, SNV, maximum normalization, and range normalization have a good prediction performance for validation. The test results of the models showed that maximum normalization achieved the highest performance (Rt2: 0.922, RMSEt: 15.711), and followed by the model with range normalization preprocessing (Rt2: 0.920, RMSEt: 15.970). Figure 4 shows the prediction result of two most highly correlated PLSR models for litter moisture estimation with the uncertainty estimation for samples shown by the error bar. The PLSR model preprocessed by the maximum normalization show better confidence in the calibration set, and the lower and upper confidence limits that are calculated for this set ranged from 11.3 to 10.9, and all of the samples were fairly predicted.
3.3. PLSR Models for Optimal Wavelength Selection Methods
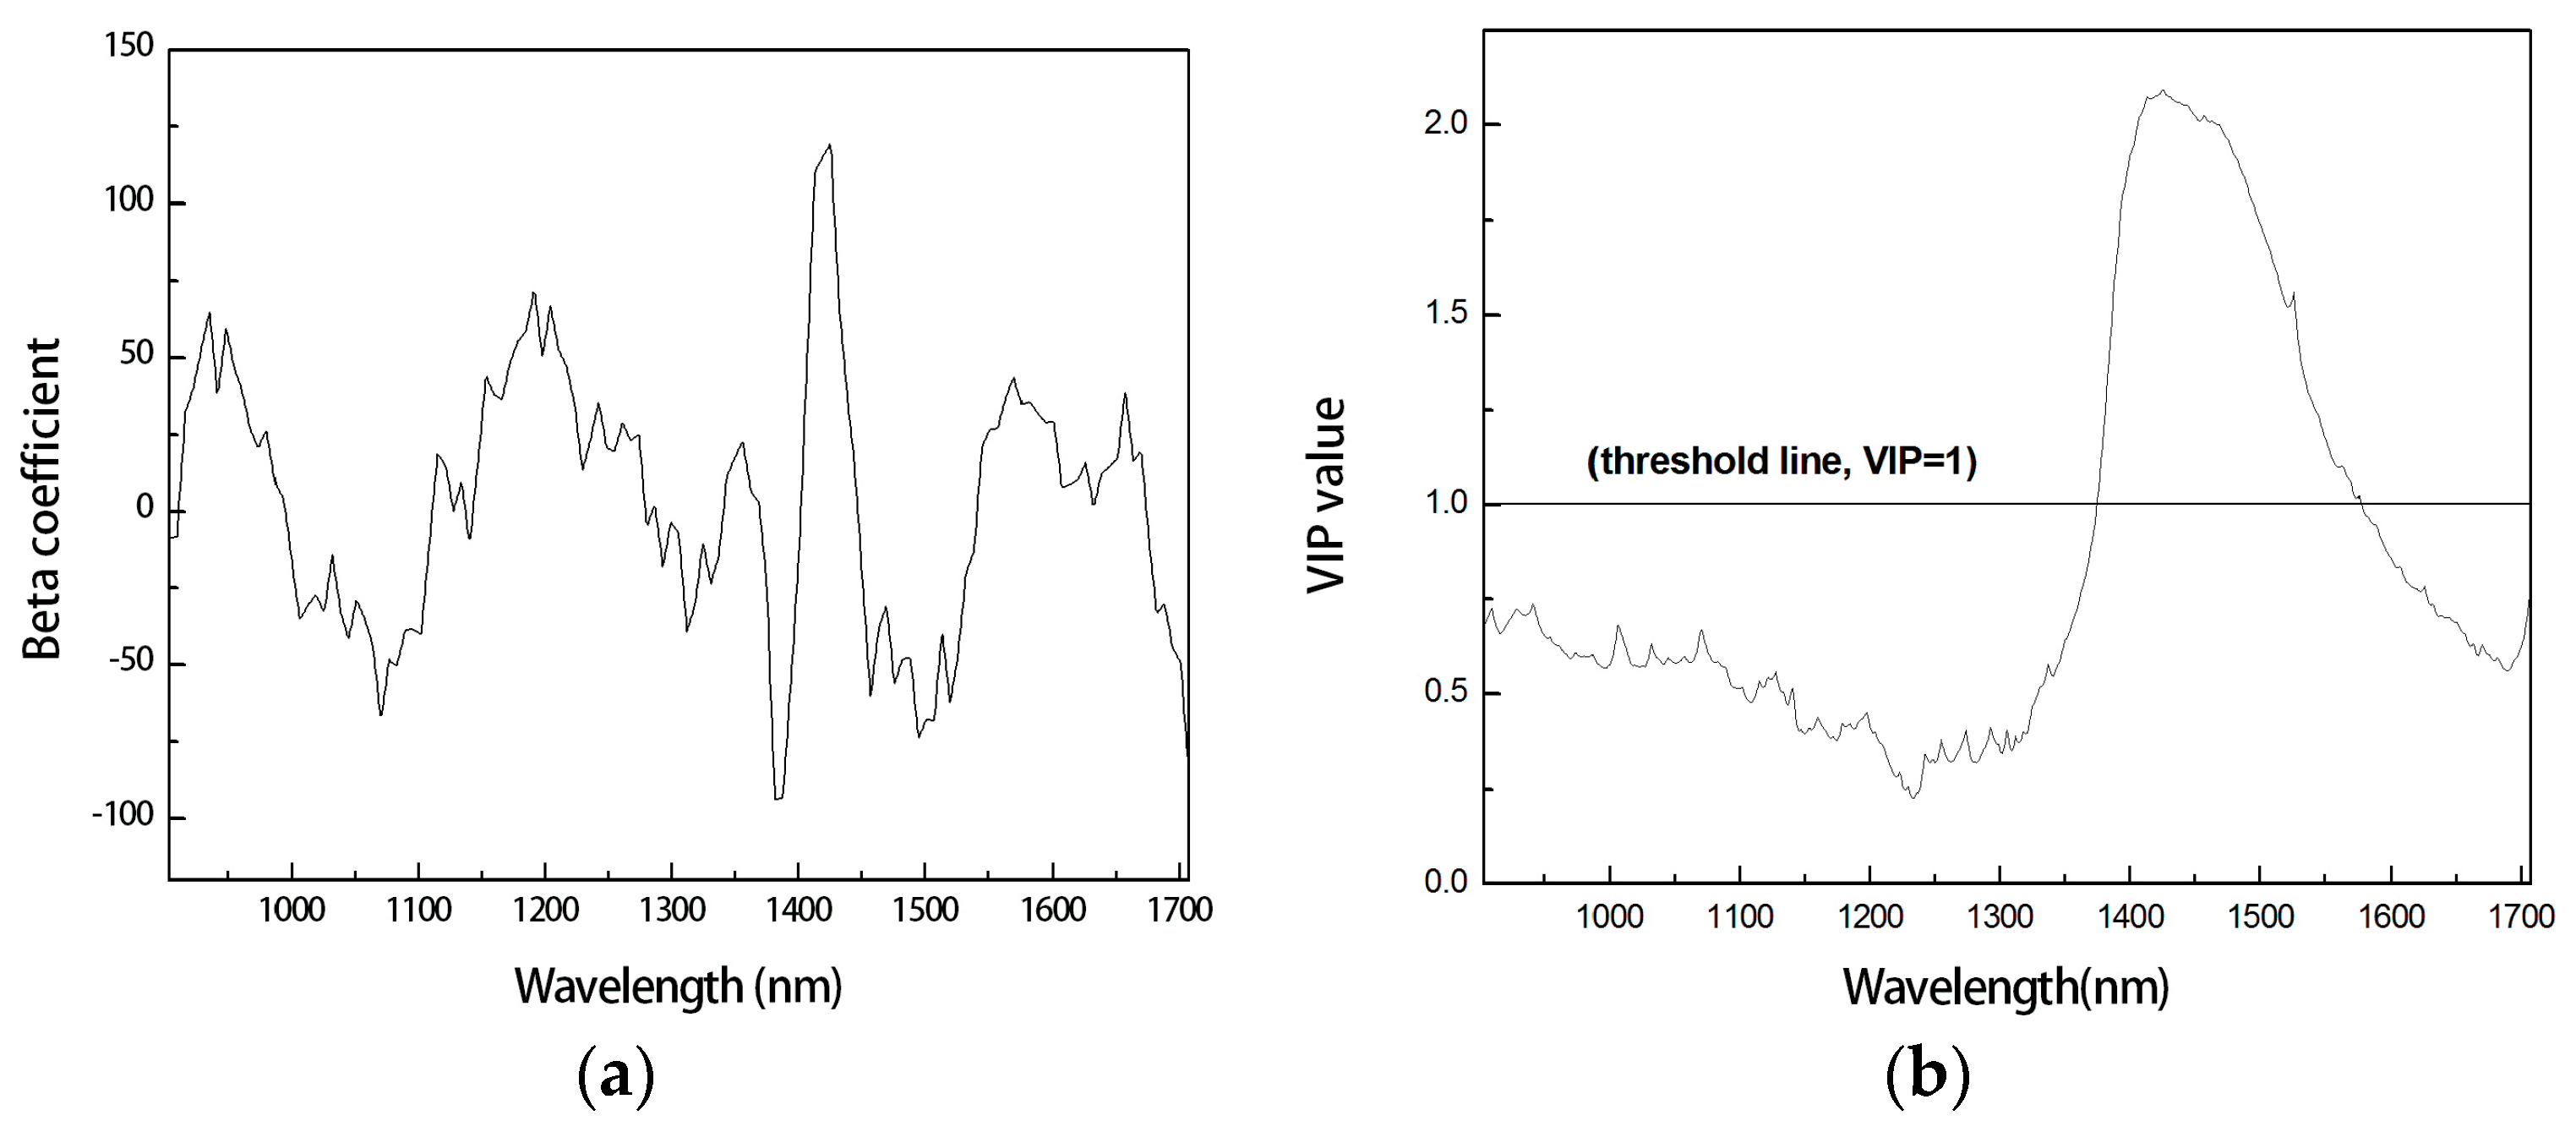
Four variable selection methods were used to set the optimal wavelength bands from around 800 data set of wavelength (900–1700 nm). NIR dataset that was treated by maximum normalization was used in the works of optimal wavelength selection because the PLSR model, which developed by the preprocessing method of maximum normalization, showed the highest performance in the moisture estimation of broadleaf litter in previous result. The selected wavelength set was then input the PLSR model for predicting the moisture content of floor litter. Figure 5 illustrates the beta coefficients and VIP values of PLSR model that were derived from the entire wavelength’s spectra. As shown in Figure 5a, the peak points of beta coefficients were evenly distributed over the entire wavelength band, and the largest peak point was discovered around 1450 nm. But, large VIP values are observed around only in the range of 1400–1500 nm (exactly in the range of 1370–1580 nm) because a threshold value of 1 is set in this study.
Figure 6 shows the first four weight vectors with respect to equivalent latent variables of the PLSR model that were obtained from the entire wavelength’s spectra. The weight vector can imply the correlation between the measured spectrum and calculated latent variables through PLSR analysis. It revealed how much the measured spectrum contributed to the formation of corresponding latent variables. As shown in Figure 6a–d, the highest peak is observed around the wavelength of 1400–1500 nm, which is highly correlated with the largest absorption coefficient of a water molecule.
Figure 7 shows the optimal wavelength bands that were determined by four variable selection methods. By applying the beta-peak method, 63 optimal wavelength bands corresponding to all of the peak points of the beta coefficient were selected, and they were uniformly distributed over the entire wavelength, as shown in Figure 7a. VIP method was implemented with different threshold values (v = 0.7, 1.0, 1.5, 2.0), and the wavelength ranged from 1375 to 1577 nm was finally selected for v = 1.0 (Figure 7b). In the case of the bootstrap method, the significant level constant c was set to four cases (c = 1.0, 1.3, 1.6, 1.9). For c = 1.3, the extracted wavelength bands were relatively evenly distributed over the entire range, as shown in Figure 7c. After applying the iPLS technique with several intervals, 150 variables were selected in the wavelength range of 1394–1543 nm (Figure 7d).
Table 2 presents the calibration, validation, and test performance of the PLSR models developed from the optimally selected wavelength’s spectra. Predictive abilities of different models have been compared against the PLSR model with the entire wavelength’s spectra (hereafter, the full PLSR model). As 63 wavelength bands, selected by the beta-peak method, were input in the PLSR model, the model could better predict the litter moisture than the full PLSR model. The VIP method also confirmed that the performance of the PLSR model taken from the 316 spectra showed better prediction performance (Rt2: 0.923, RMSEt: 15.597) than that of the full PLSR_model. VIP value of 1.5 marked 150 wavelength set among the entire wavelength range, and had a similar ability for litter moisture estimation (Rt2: 0.920, RMSEt: 15.916) with the entire wavelength PLSR_model.
The bootstrap method was applied to select the optimal wavelength. The PLSR model with 305 spectra data (c = 1.0) showed better capability in data analysis (Rt2: 0.927, RMSEt: 15.164), while the PLSR model with 106 spectra (c = 1.6) also showed a similar prediction performance (Rt2: 0.918, RMSEt: 16.128) when compared to the full PLSR model. A total of 150 wavelength bands was optimally selected in the iPLS technique application, and the prediction performance of PLSR model achieved the Rt2 value of 0.918, RMSEt value of 16.115.
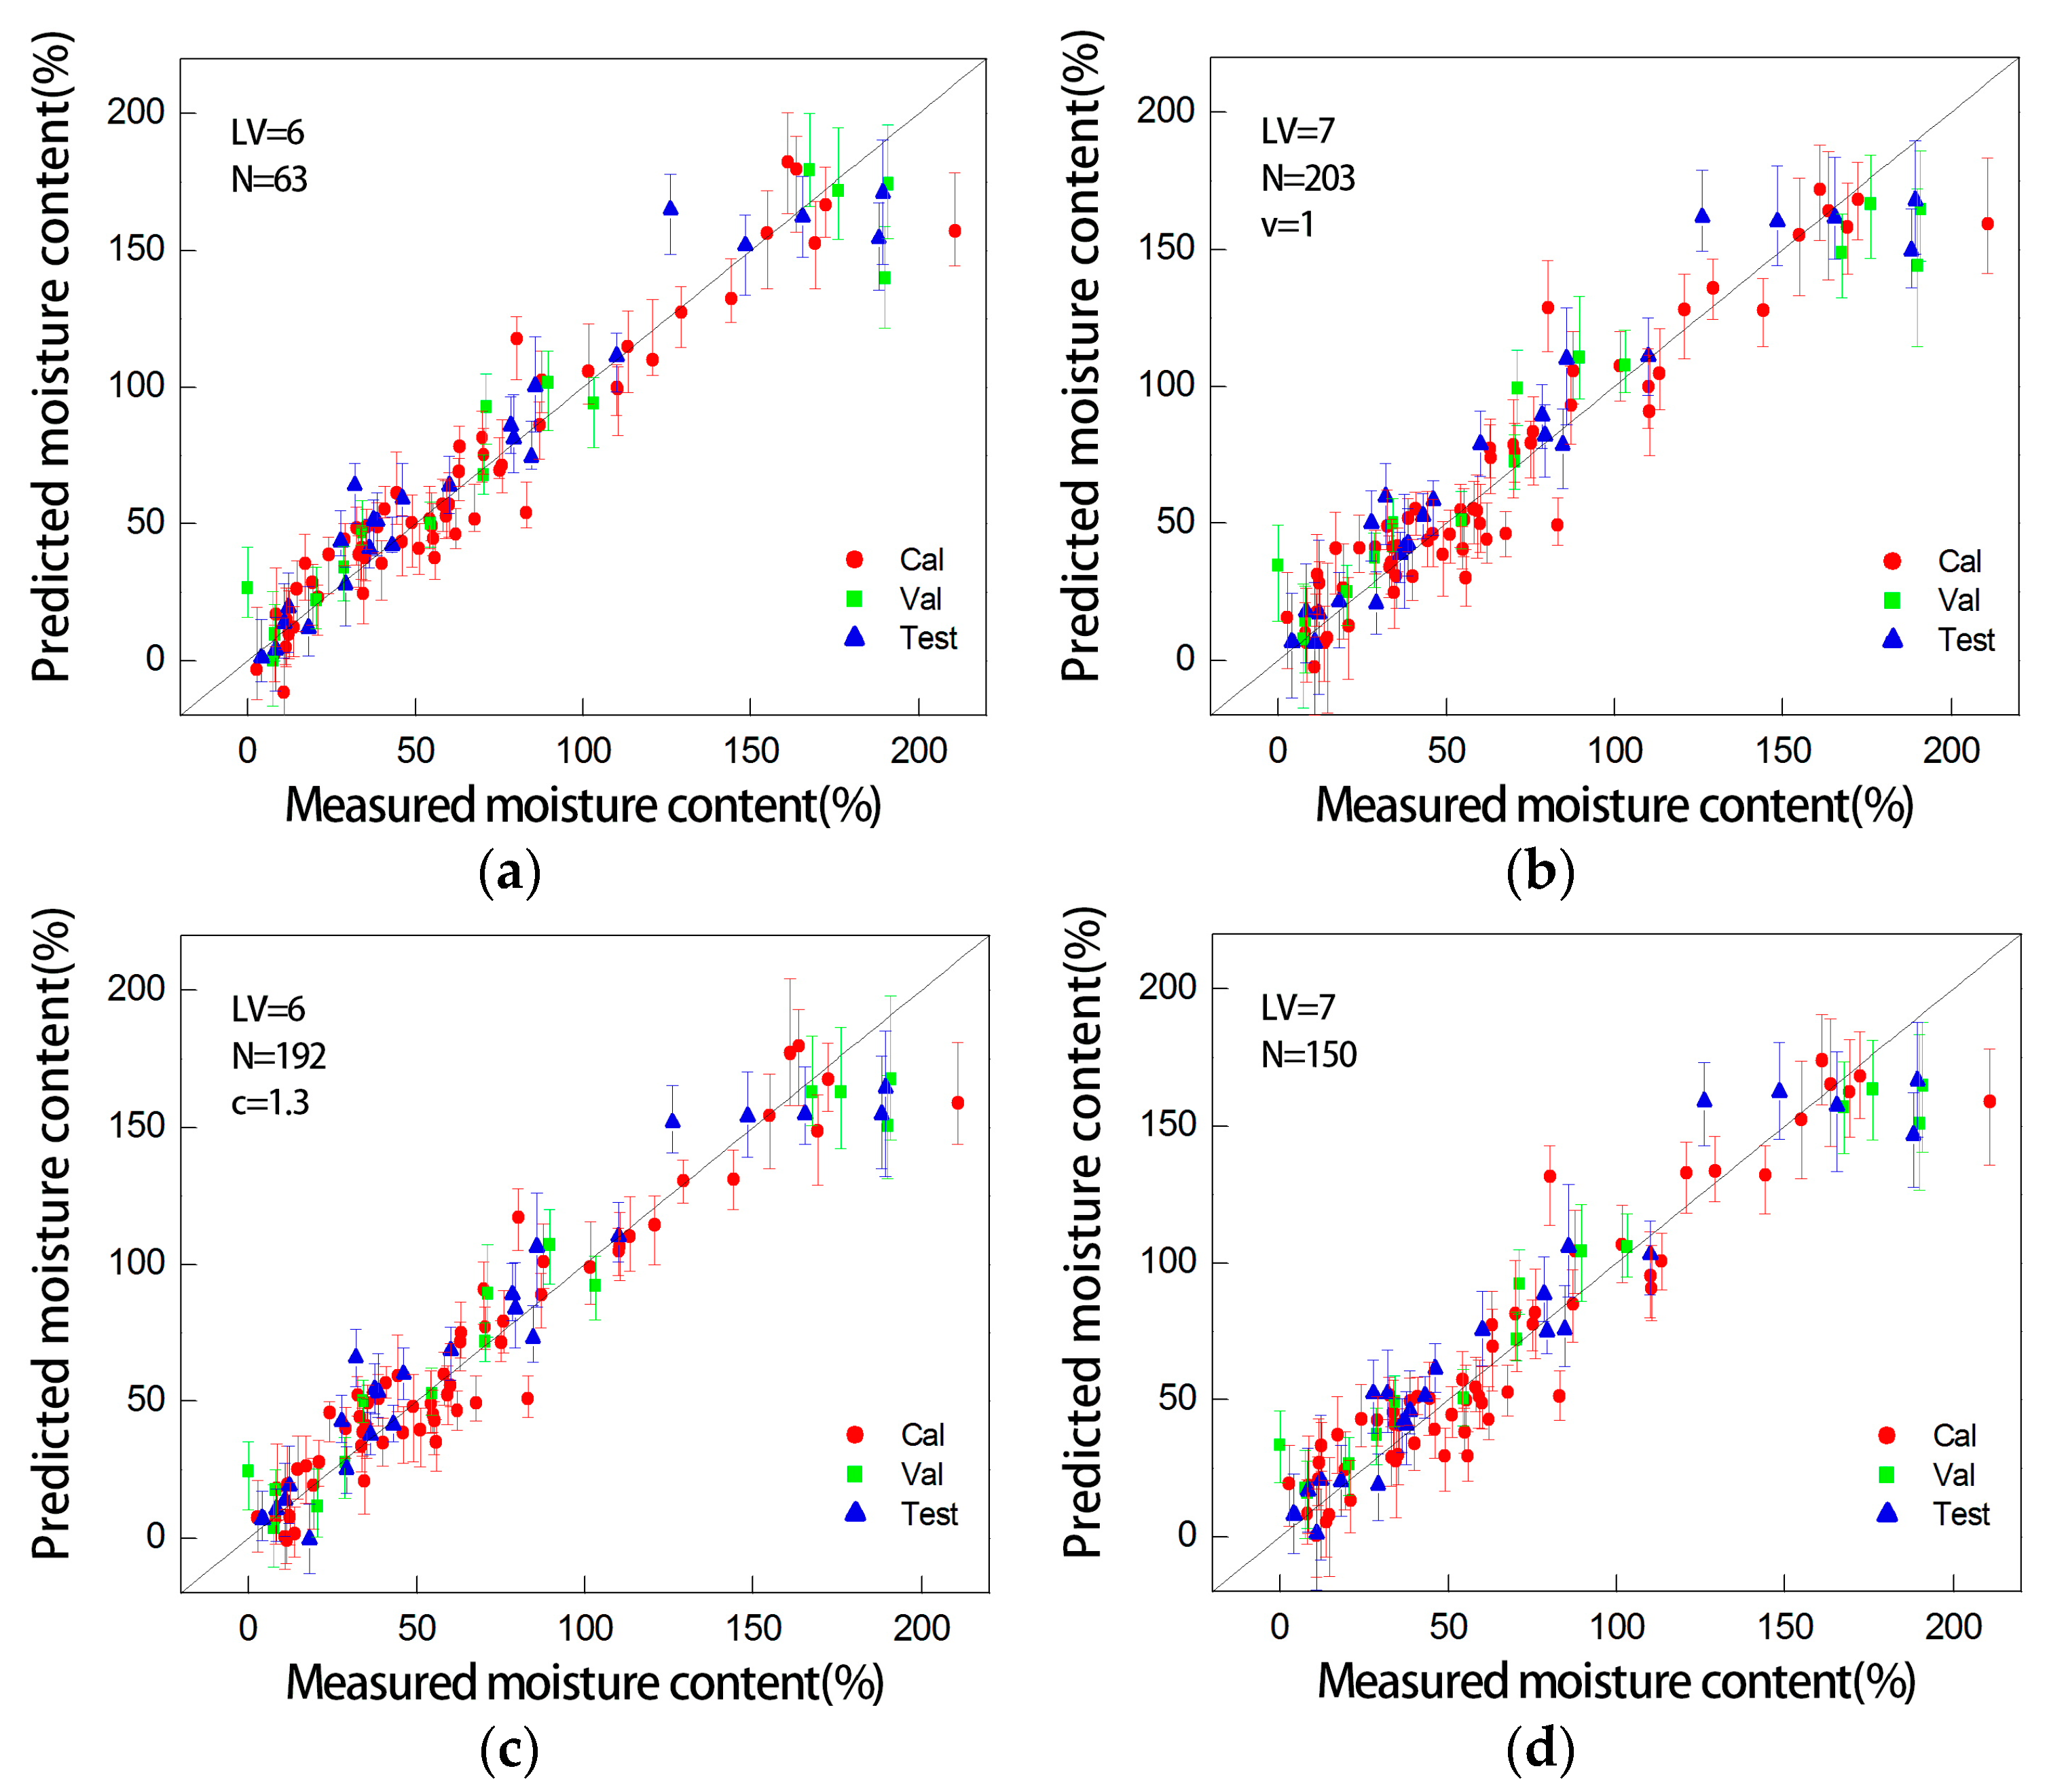
As presented in Table 2, the predictive abilities of the PLSR models with reduced wavelength bands by employing the variable selection methods showed similar or better performance with the full PLSR_model, excepting only two cases of VIP (v = 2.0) and bootstrap method (c = 1.9). But, optimal wavelength selection can improve the prediction accuracy by effectively identifying the best subset of candidate spectra. It also eliminates unnecessary information so as to enhance the efficiency and effectiveness of model run. Figure 8 shows the prediction results of the best PLSR models, which were derived from the optimally selected wavelength’s spectra with the uncertainty estimation for samples as shown by the error bar. In common with the results of Table 2, the PLSR model developed by the variable selection of beta-peak method showed the best confidence in the test set, and the lower and upper confidence limits that were calculated for this test set ranged from 11.3 to 10.8, while worst confidence of the model developed by the VIP ranged from 13.7 to 13.2. However, whole samples of Figure 8 were fairly predicted when compared to the result of Table 2, and the results show the reliability of the model to predict the moisture content of floor litter.
4. Conclusions
Litter refers to the organic residue on the forest floor, and plays an important role in forest water cycle. Litter moisture is one of the critical determinants for evaporation, infiltration, and fire ignition in a forest environment. In this study, the commonly used technique, NIRS, has been implemented to fast, non-destructively monitor the moisture content of broadleaf litters. Several techniques for data pretreatment and optimal wavelength selection have been tested to establish a reliable and robust multivariate model.
Prior to establishing a PLSR model, the pretreatment was conducted to eliminate the unwanted noise in raw NIR spectra. Maximum normalization preprocessing, one of well-known normalization techniques, achieved the best prediction ability in litter moisture estimation among eight pretreatment methods. The entire wavelength may uphold the whole information of target samples, but the redundant data causes the decline in model accuracy. The peak of beta coefficients seems to be the best variable selector to extract the optimal wavelength bands as to yield the better predictive ability in litter moisture estimation.
The NIRS has been commonly used in both qualitative and quantitative analysis of target samples with respect to the vibrational energy of molecules. The low optical absorbance characteristics of NIR rays facilitates deeper penetration than mid-infrared rays. This optical method has some merits in reducing time-consuming work and supporting reliable results by minimizing the errors that may originate from the quick changes of litter moisture on the spot.
The NIRS also has limited ability to resolve noise that is caused by the instrument and environment causes. NIR spectra tends to be highly complex and over-parameterized, which sometime yields a poor prediction. In the face of its drawback, multivariate analysis through variable reduction and proper pretreatment have been successfully introduced in practical uses. It is believed that this research provides us with some great opportunities for multicomponent analysis of agricultural products and foods, as well as many other scientific sectors, such as life sciences and biomaterial research.
Supplementary Materials
The following are available online at www.mdpi.com/2072-4292/9/12/1212/s1.
Acknowledgments
This research was supported by Basic Science Research Program through the National Research Foundation of Korea (NRF) funded by the Ministry of Education (NRF-2015R1D1A1A02061769).
Author Contributions
G.K. designed the experimental concept and data analysis methods; S.H. and A.L. performed experiments and analyzed the data; Y.L. supported experiments and data analysis; S.I. wrote the article and have been supervising, discussing the experiments and edited the presented work.
Conflicts of Interest
The authors declare no conflict of interest.
References
- Ataka, M.; Kominami, Y.; Miyama, T.; Yoshimura, K.; Jomura, M.; Tani, M. Using capacitance sensors for the continuous measurement of the water content in the litter layer of forest soil. Appl. Environ. Soil Sci. 2014. [Google Scholar] [CrossRef]
- Stocks, B.J. Moisture in the Forest Floor—Its Distribution and Movement; Department of Fisheries and Forestry, Canadian Forestry Service: Ottawa, ON, Canada, 1970; p. 20.
- Xiao, Q.; McPherson, E.G. Surface water storage of twenty tree species in Davis, California. J. Environ. Qual. 2016, 45, 188–198. [Google Scholar] [CrossRef]
- Borken, W.; Matzner, E. Reappraisal of drying and wetting effects on C and N mineralization and fluxes in soils. Glob. Chang. Biol. 2009, 15, 808–824. [Google Scholar] [CrossRef]
- Johnson, E.A.; Miyanishi, K. Forest Fires: Behavior and Ecological Effects; Academic Press: Washington, DC, USA, 2001; p. 594. [Google Scholar]
- Schunk, C.; Ruth, B.; Leuchner, M.; Wastl, C.; Menzel, A. Comparison of different methods for the in situ measurement of forest litter moisture content. Nat. Hazard Earth Syst. Sci. 2016, 16, 403–415. [Google Scholar] [CrossRef]
- Wotton, B.M.; Stocks, B.; Martell, D.L. An index for tracking sheltered forest floor moisture with the Canadian Forest Fire Weather Index System. Int. J. Wildland Fire 2005, 14, 169–182. [Google Scholar] [CrossRef]
- Gillespie, T.J.; Kidd, G. Sensing duration of leaf moisture retention using electrical impedance grids. Can. J. Plant Sci. 1978, 58, 179–187. [Google Scholar] [CrossRef]
- Hanson, P.J.; O’Neill, E.G.; Chambers, M.L.S.; Riggs, J.S.; Joslin, J.D.; Wolfe, M.H. Soil respiration and litter decomposition. In North America Temperature Deciduous Forests Response to Changing Precipitation Regimes; Hanson, P.J., Wullschleger, S.D., Eds.; Springer: New York, NY, USA, 2003; pp. 163–189. [Google Scholar]
- Borner, T.; Johnson, M.G.; Ryglewlcz, P.T.; Tingey, D.T.; Jarrell, G.D. A two-probe method for measuring water content of thin forest floor litter layers using time domain reflectometry. Soil Technol. 1996, 9, 199–207. [Google Scholar] [CrossRef]
- Pumpanen, J.; Ilvesniemi, H. Calibration of time domain reflectometry for forest soil humus layers. Boreal Environ. Res. 2005, 10, 589–595. [Google Scholar]
- Robichaud, P.R.; Bilskie, J. A new tool for fire managers-an electronic duff moisture meter. Fire Manag. Today 2004, 64, 15–18. [Google Scholar]
- Hong, S.-J.; Rho, S.-J.; Lee, A.-Y.; Park, H.; Cui, J.; Park, J.; Hong, S.-J.; Kim, Y.-R.; Kim, G. Rancidity estimation of perilla seed oil by using near-infrared spectroscopy and multivariate analysis techniques. J. Spectrosc. 2017, 2017, 1–10. [Google Scholar] [CrossRef]
- Kim, W.-K.; Hong, S.-J.; Cui, J.; Kim, H.-J.; Park, J.; Yang, S.-H.; Kim, G. Application of NIR spectroscopy and artificial neural network techniques for real-time discrimination of soil categories. J. Korean Soc. Nondestruct. Test. 2017, 6, 148–157. [Google Scholar] [CrossRef]
- Lohumi, S.; Kandpal, L.M.; Seo, Y.W.; Cho, B.K. Net analyte signal-based quantitative determination of fusel oil in Korean alcoholic beverage using FT-NIR spectroscopy. J. Biosyst. Eng. 2016, 41, 208–220. [Google Scholar] [CrossRef]
- Liu, Y.; Kim, H.-J. Fourier transform infrared spectroscopy (FT-IR) and simple algorithm analysis for rapid and non-destructive assessment of developmental cotton fibers. Sensors 2017, 17, 1469. [Google Scholar] [CrossRef] [PubMed]
- Lefcourt, A.M.; Kistler, R.; Gadsden, S.A.; Kim, M.S. Automated cart with VIS/NIR hyperspectral reflectance and fluorescence imaging capabilities. Appl. Sci. 2017, 7, 3. [Google Scholar] [CrossRef]
- Kim, G.S.; Kim, D.-Y.; Kim, G.H.; Cho, B.-K. Applications of discrete wavelet analysis for predicting internal quality of cherry tomatoes using VIS/NIR spectroscopy. J. Biosyst. Eng. 2013, 38, 48–51. [Google Scholar] [CrossRef]
- ASTM International. American Society for Testing and Materials, E1866-97: Standard Guide for Establishing Spectrophotometer Performance Tests; E1655: Standard Practices for Infrared, Multivariate, Quantitative Analysis; Official ASTM Publications: Philadelphia, PA, USA, 2000. [Google Scholar]
- Choe, E.; van der Meer, F.; van Ruitenbeek, F.; van der Werff, H.; de Smeth, B.; Kim, K.W. Mapping of heavy metal pollution in stream sediments using combined geochemistry, field spectroscopy, and hyperspectral remote sensing: A case study of the Rodalquilar mining area, SE Spain. Remote Sens. Environ. 2008, 112, 3222–3233. [Google Scholar] [CrossRef]
- Choi, C.H.; Lee, K.J.; Park, B.S. Prediction of soluble solid and firmness in apple by visible/near-infrared spectroscopy. J. Korean Soc. Agric. Mach. 1997, 22, 256–265. (In Korean) [Google Scholar]
- Lu, R.F.; Guyer, D.E.; Beaudry, R.M. Determination of firmness and sugar content of apples using near-infrared diffuse reflectance. J. Texture Stud. 2000, 31, 615–630. [Google Scholar] [CrossRef]
- Dalal, R.C.; Henry, R.J. Simultaneous determination of moisture, organic carbon, and total nitrogen by near infrared reflectance spectrophotometry. Soil Sci. Soc. Am. J. 1986, 50, 120–123. [Google Scholar] [CrossRef]
- Ludwig, B.; Khanna, P.K.; Bauhus, J.; Hopmans, P. Near infrared spectroscopy of forest soils to determine chemical and biological properties related to soil sustainability. For. Ecol. Manag. 2002, 171, 121–132. [Google Scholar] [CrossRef]
- Martin, P.D.; Malley, D.F.; Manning, G.; Fuller, L. Determination of soil organic carbon and nitrogen at the field level using near infrared spectroscopy. Can. J. Soil Sci. 2002, 82, 413–422. [Google Scholar] [CrossRef]
- Card, D.H.; Peterson, D.J.; Matson, P.A.; Aber, J.D. Prediction of leaf chemistry by the use of visible and near-infrared reflectance spectroscopy. Remote Sens. Environ. 1988, 26, 123–147. [Google Scholar] [CrossRef]
- Wessman, C.A.; Aber, J.D.; Peterson, D.L.; Melillo, J.M. Foliar analysis using near-infrared reflectance spectroscopy. Can. J. For. Res. 1988, 18, 6–11. [Google Scholar] [CrossRef]
- Martin, M.E.; Aber, J.D. Analysis of forest foliage. III: Determining nitrogen, lignin and cellulose in fresh leaves using near infrared reflectance data. J. Near Infrared Spectrosc. 1994, 2, 25–32. [Google Scholar] [CrossRef]
- Bolster, K.L.; Martin, M.E.; Aber, J.D. Determination of carbon fraction and nitrogen concentration in tree foliage by near infrared reflectance: A comparison of statistical methods. Can. J. For. Res. 1996, 26, 590–600. [Google Scholar] [CrossRef]
- Gillon, D.; Joffre, R.; Ibrahima, A. Can litter decomposability be predicted by near infrared reflectance spectroscopy? Ecology 1999, 80, 175–186. [Google Scholar] [CrossRef]
- Vávřová, P.; Stenberg, B.; Karsisto, M.; Kitunen, V.; Tapania, T.; Laiho, R. Near infrared reflectance spectroscopy for characterization of plant litter quality: Towards a simpler way of predicting carbon turnover in Peatlands? In Wastewater Treatment, Plant Dynamics and Management in Constructed and Natural Wetlands; Vymazal, J., Ed.; Springer: New York, NY, USA, 2008; p. 65. [Google Scholar]
- Kim, Y.T.; Suh, S.R. Comparison of performance of models to predict hardness of tomato using spectroscopic data of reflectance and transmittance. J. Biosyst. Eng. 2008, 33, 63–68. (In Korean) [Google Scholar] [CrossRef]
- Kawano, S.; Watanabe, H.; Iwamoto, M. Determination of sugar content in intact peaches by near infrared spectroscopy. J. Jpn. Soc. Hortic. Sci. 1992, 61, 445–451. [Google Scholar] [CrossRef]
- Dull, G.G.; Leffler, R.G.; Birth, G.S.; Smittle, D.A. Instrument for non-destructive measurement of soluble solids in honeydew melons. Trans. Am. Soc. Agric. Eng. 1992, 35, 735–737. [Google Scholar] [CrossRef]
- Chung, H.-I.; Kim, H.-J. Near-infrared spectroscopy: Principles. Anal. Sci. Technol. 2000, 13, 138–151. [Google Scholar]
- Porep, J.U.; Kammerer, D.R.; Carle, R. On-line application of near infrared (NIR) spectroscopy in food production. Trends Food Sci. Technol. 2015, 46, 211–230. [Google Scholar] [CrossRef]
- Rinnan, A.; Berg, F.; van den Engelsen, S.B. Review of the most common pre-processing techniques for near-infrared spectra. Trends Anal. Chem. 2009, 28, 1201–1222. [Google Scholar] [CrossRef]
- Sarathjith, M.C.; Das, B.S.; Wani, S.P.; Sahrawat, K.L. Variable indicators for optimum wavelength selection in diffuse reflectance spectroscopy of soils. Geoderma 2016, 267, 1–9. [Google Scholar] [CrossRef]
- Zhang, C.; Jiang, H.; Liu, F.; He, Y. Application of near-infrared hyperspectral imaging with variable selection methods to determine and visualize caffeine content of coffee beans. Food Bioprocess Technol. 2017, 10, 213–221. [Google Scholar] [CrossRef]
- Fernández Pierna, J.A.; Abbas, O.; Baeten, V.; Dardenne, P. A backward variable selection method for PLS regression (BVSPLS). Anal. Chim. Acta 2009, 642, 89–93. [Google Scholar] [CrossRef] [PubMed]
- Kamruzzaman, M.; ElMasry, G.; Sun, D.-W.; Allen, P. Non-destructive assessment of instrumental and sensory tenderness of lamb meat using NIR hyperspectral imaging. Food Chem. 2013, 141, 389–396. [Google Scholar] [CrossRef] [PubMed]
- Kandpal, L.M.; Lohumi, S.; Kim, M.S.; Kang, J.-S.; Cho, B.-K. Near-Infrared hyperspectral imaging system coupled with multivariate methods to predict viability and vigor in muskmelon seeds. Sens. Actuators B Chem. 2016, 229, 534–544. [Google Scholar] [CrossRef]
- Zhang, L.; Garcia-Munoz, S. A comparison of different methods to estimate prediction uncertainty using Partial Least Squares (PLS): A practitioner’s perspective. Chem. Intell. Lab. Syst. 2009, 97, 152–158. [Google Scholar] [CrossRef]
- De Almeida, M.R.; Correa, D.N.; Rocha, W.F.C.; Scafi, F.J.O.; Poppi, R.J. Discrimination between authentic and counterfeit banknotes using Raman spectroscopy and PLS-DA with uncertainty estimation. Microchem. J. 2013, 109, 170–177. [Google Scholar] [CrossRef]
- Van der Voet, H. Pseudo-degrees of freedom for complex predictive models: The example of partial least squares. J. Chem. 1999, 13, 195–208. [Google Scholar] [CrossRef]
- Anderson, C.M.; Bro, R. Variable selection in regression-a tutorial. J. Chem. 2010, 24, 728–737. [Google Scholar] [CrossRef]
- Mehmood, T.; Liland, K.H.; Snipen, L.; Sæbø, S. A review of variable selection methods in partial least squares regression. Chem. Intell. Lab. 2012, 118, 62–69. [Google Scholar] [CrossRef]
- Bickel, P.J.; Freedman, D.A. Some asymptotic theory for the bootstrap. Ann. Stat. 1981, 9, 1196–1217. [Google Scholar] [CrossRef]
- Lazraq, A.; Clérouxb, R.; Gauchic, J.-P. Selecting both latent and explanatory variables in the PLS1 regression model. Chem. Intell. Lab. 2003, 66, 117–126. [Google Scholar] [CrossRef]
- Nørgaard, L.; Saudland, A.; Wagner, J.; Nielsen, J.P.; Munck, L.; Engelsen, S.B. Interval partial least-squares regression (iPLS): A comparative chemometric study with an example from near-infrared spectroscopy. Appl. Spectrosc. 2000, 54, 413–419. [Google Scholar] [CrossRef]
- Collins, J.R. Change in the infra-red absorption spectrum of water with temperature. Phys. Rev. 1925, 26, 771–779. [Google Scholar] [CrossRef]
Figure 1.
Moisture content histogram of broadleaf litters.
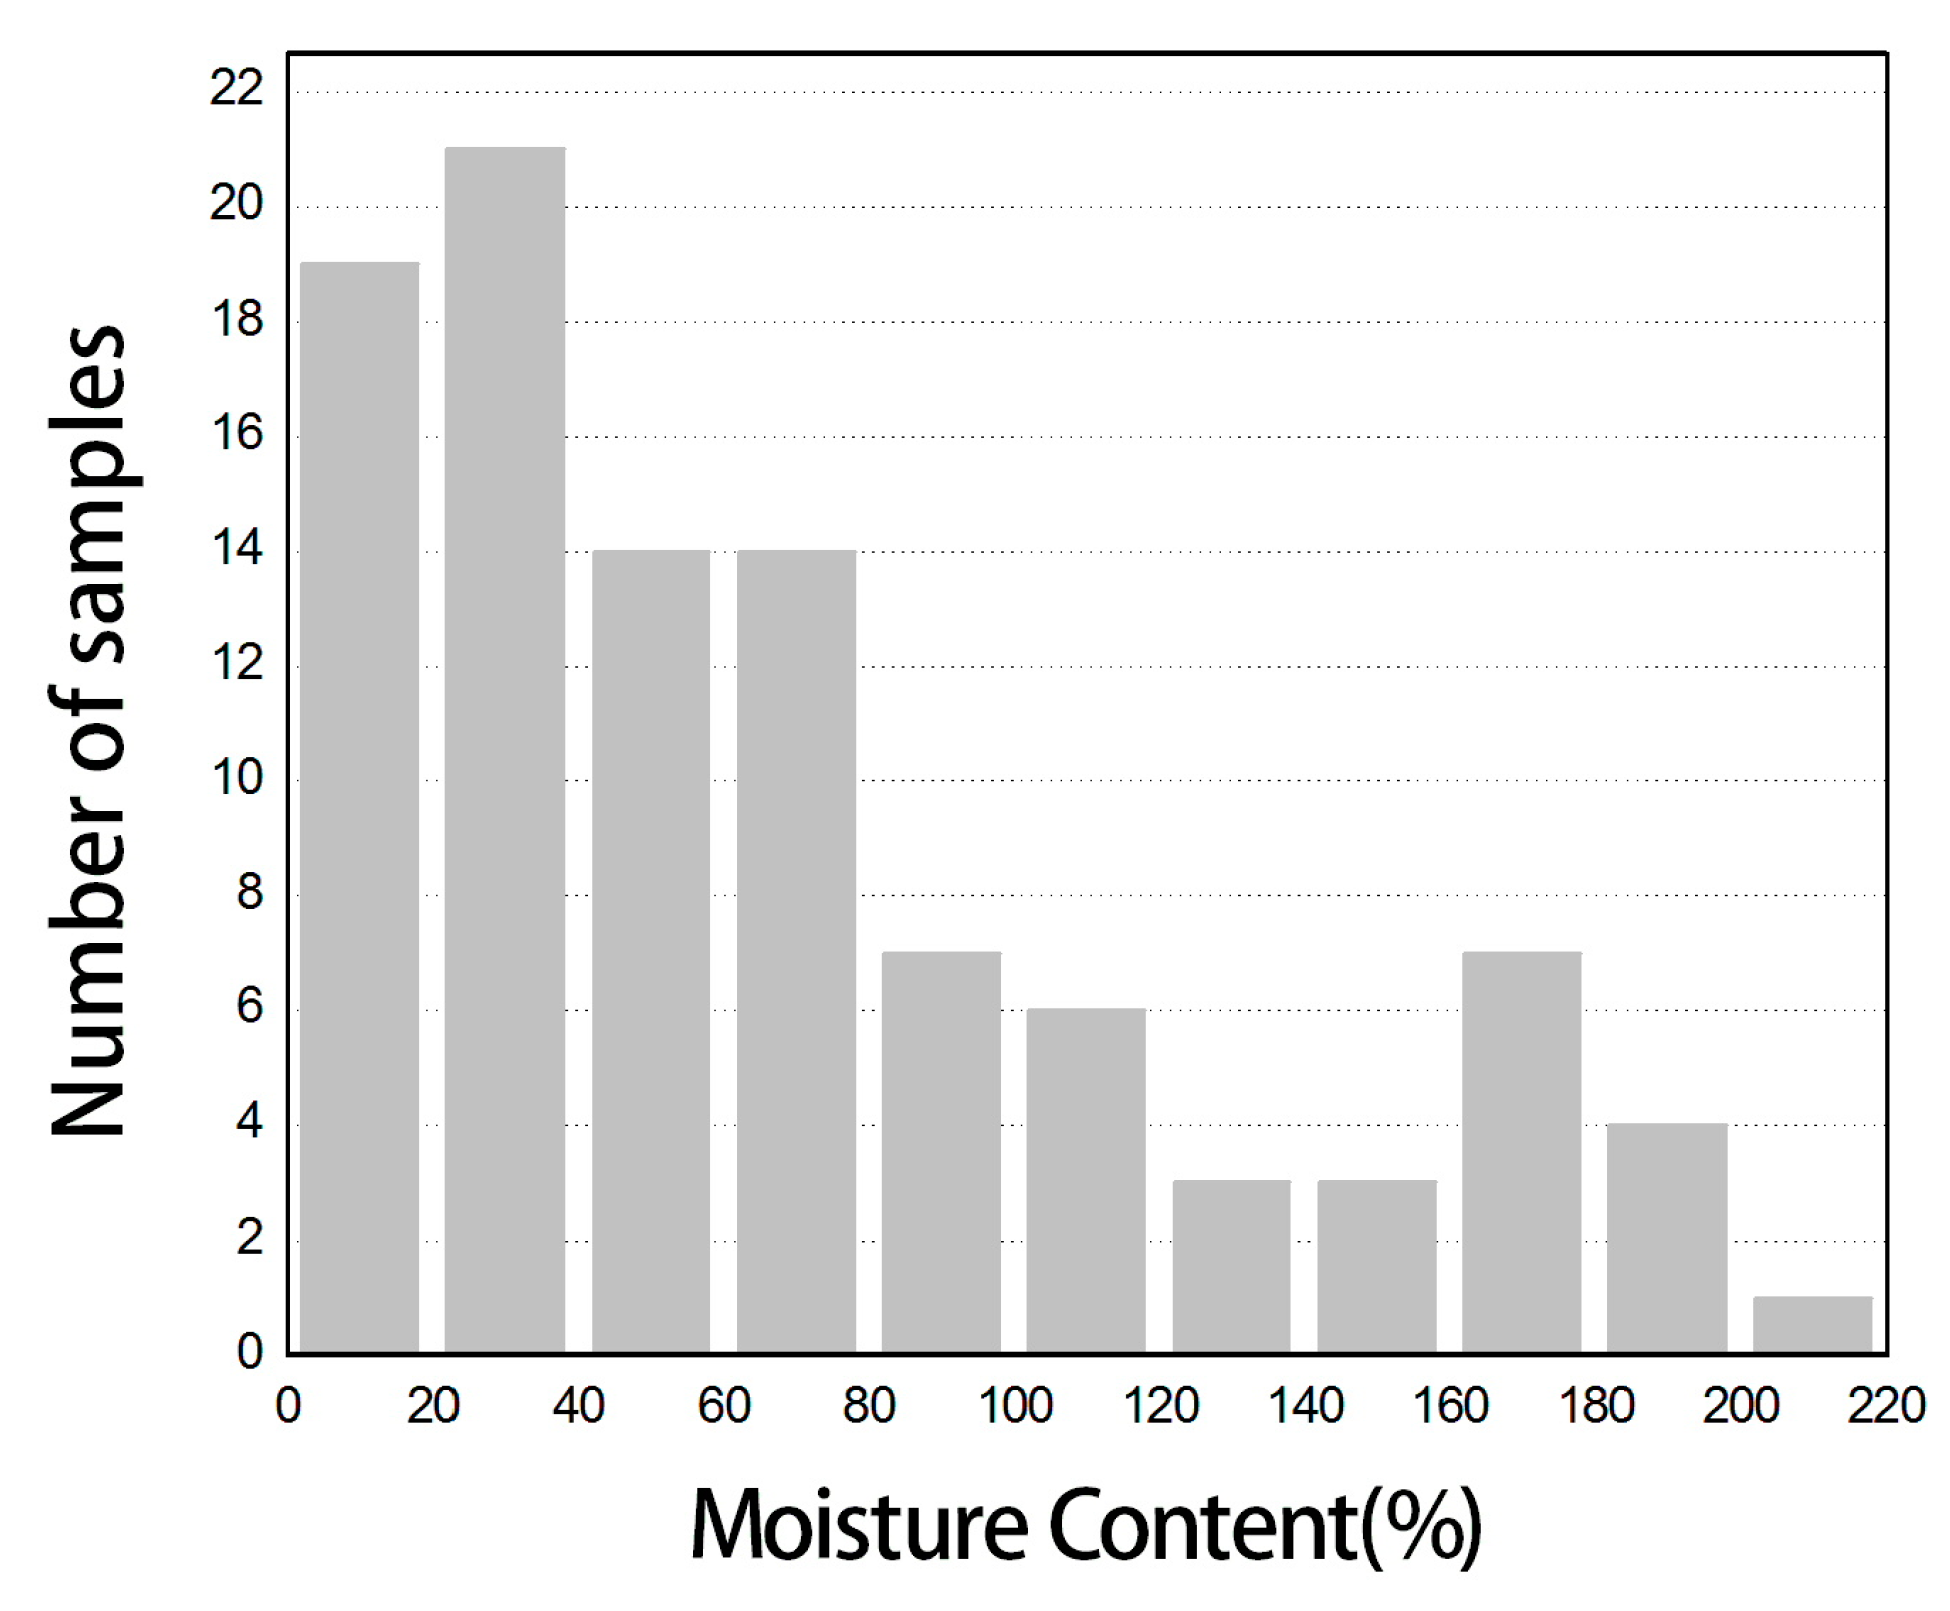
Figure 2.
Schematic diagram of near-infrared spectroscopy (NIR) spectra measurement.
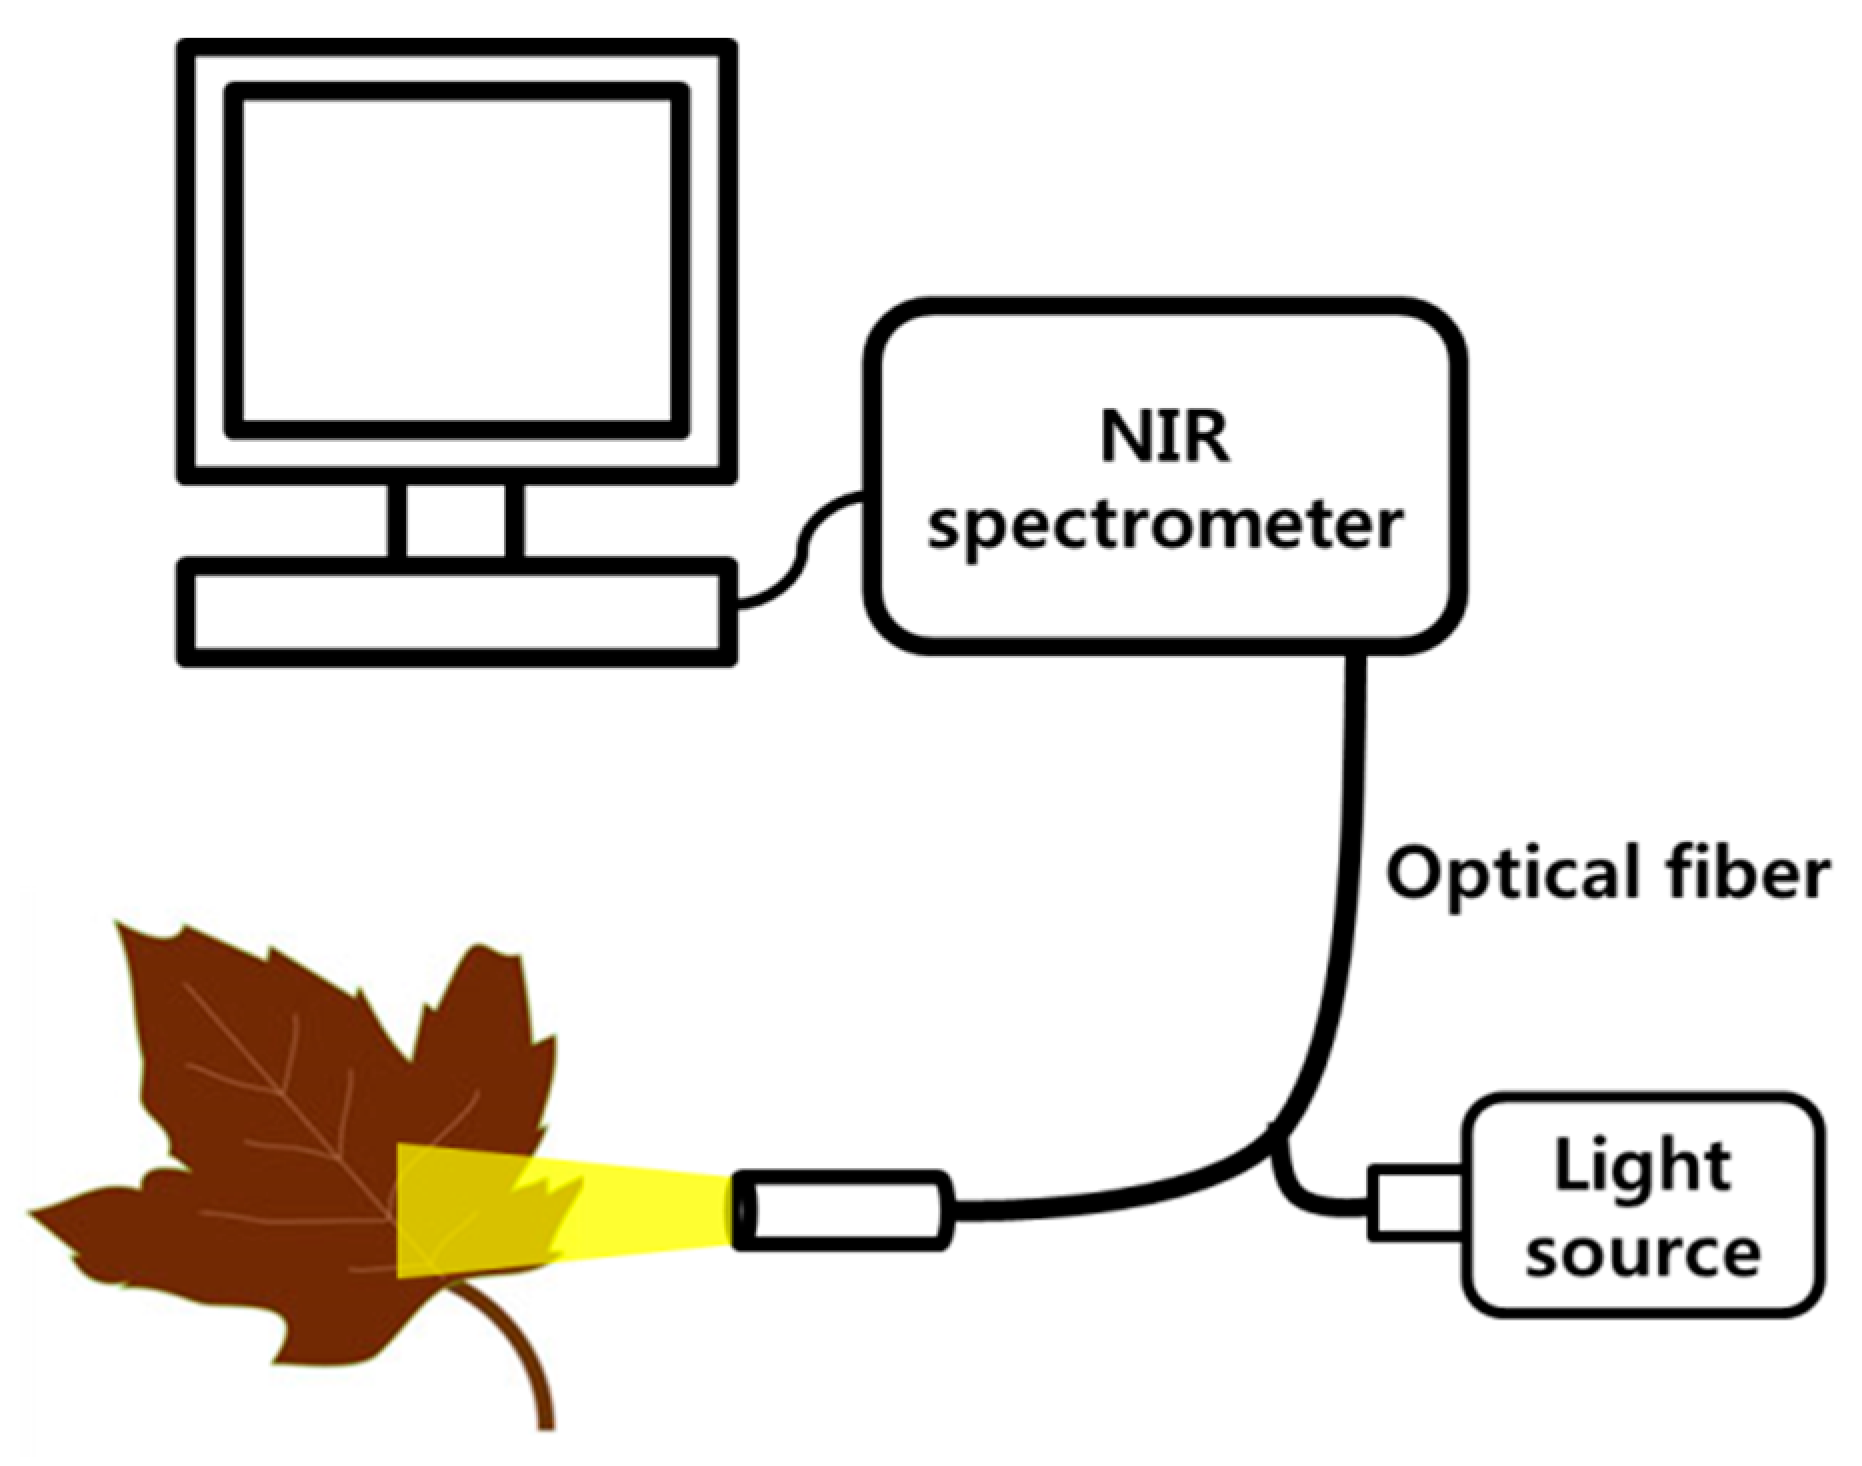
Figure 3.
Near-infrared reflectance spectrum of litter samples prior to preprocessing: (a) raw spectra; (b) averaged spectra.
Figure 3.
Near-infrared reflectance spectrum of litter samples prior to preprocessing: (a) raw spectra; (b) averaged spectra.

Figure 4.
Comparison of predicted and measured moisture content. The prediction values were taken from the PLSR model with (a) maximum normalization, and (b) range normalization preprocessing.
Figure 4.
Comparison of predicted and measured moisture content. The prediction values were taken from the PLSR model with (a) maximum normalization, and (b) range normalization preprocessing.

Figure 5.
Beta coefficients (a) and variable importance in projection (VIP) values (b) of the PLSR model with the entire wavelength’s spectra.
Figure 5.
Beta coefficients (a) and variable importance in projection (VIP) values (b) of the PLSR model with the entire wavelength’s spectra.

Figure 6.
First four weight vectors with respect to equivalent latent variables of the PLSR model with the entire wavelength’s spectra: (a) First weight vector; (b) Second weight vector; (c) Third weight vector; and, (d) Fourth weight vector.
Figure 6.
First four weight vectors with respect to equivalent latent variables of the PLSR model with the entire wavelength’s spectra: (a) First weight vector; (b) Second weight vector; (c) Third weight vector; and, (d) Fourth weight vector.
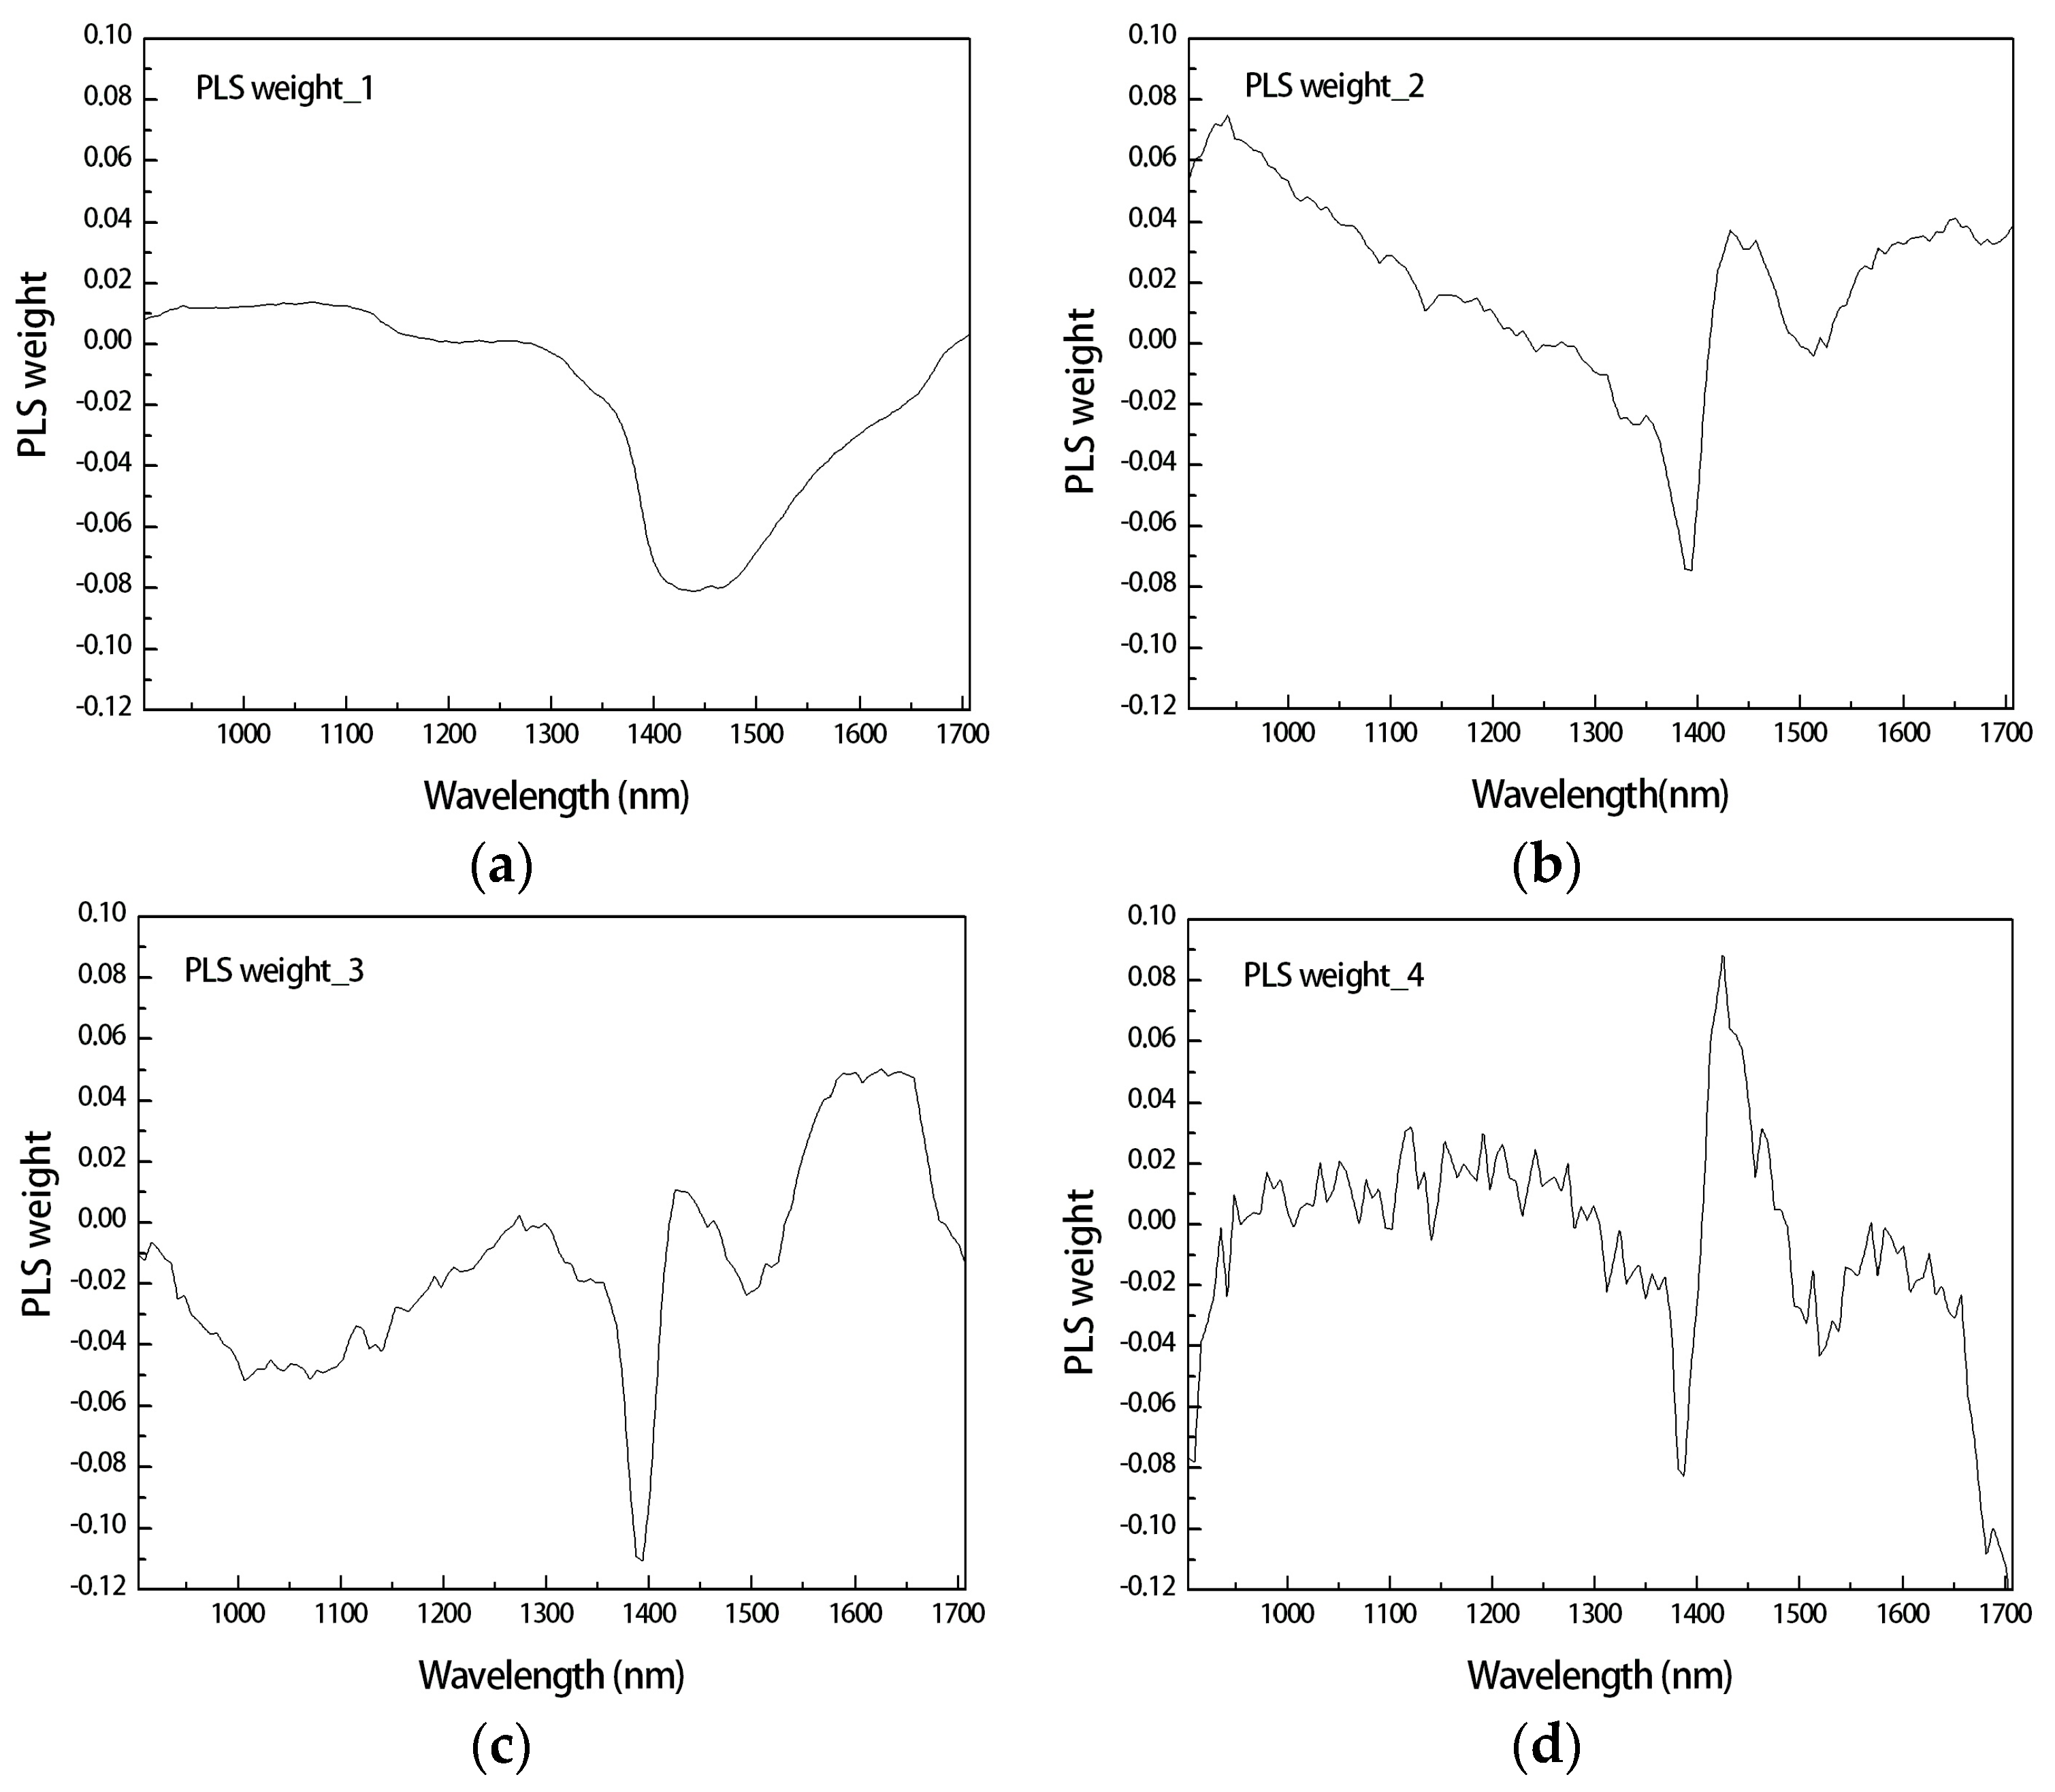
Figure 7.
Optimal wavelength derived by variable selection methods: (a) beta-peak (N = 63); (b) VIP (v = 1.0, N = 203); (c) bootstrap (c = 1.3, N = 192); and, (d) iPLS (N = 150).
Figure 7.
Optimal wavelength derived by variable selection methods: (a) beta-peak (N = 63); (b) VIP (v = 1.0, N = 203); (c) bootstrap (c = 1.3, N = 192); and, (d) iPLS (N = 150).
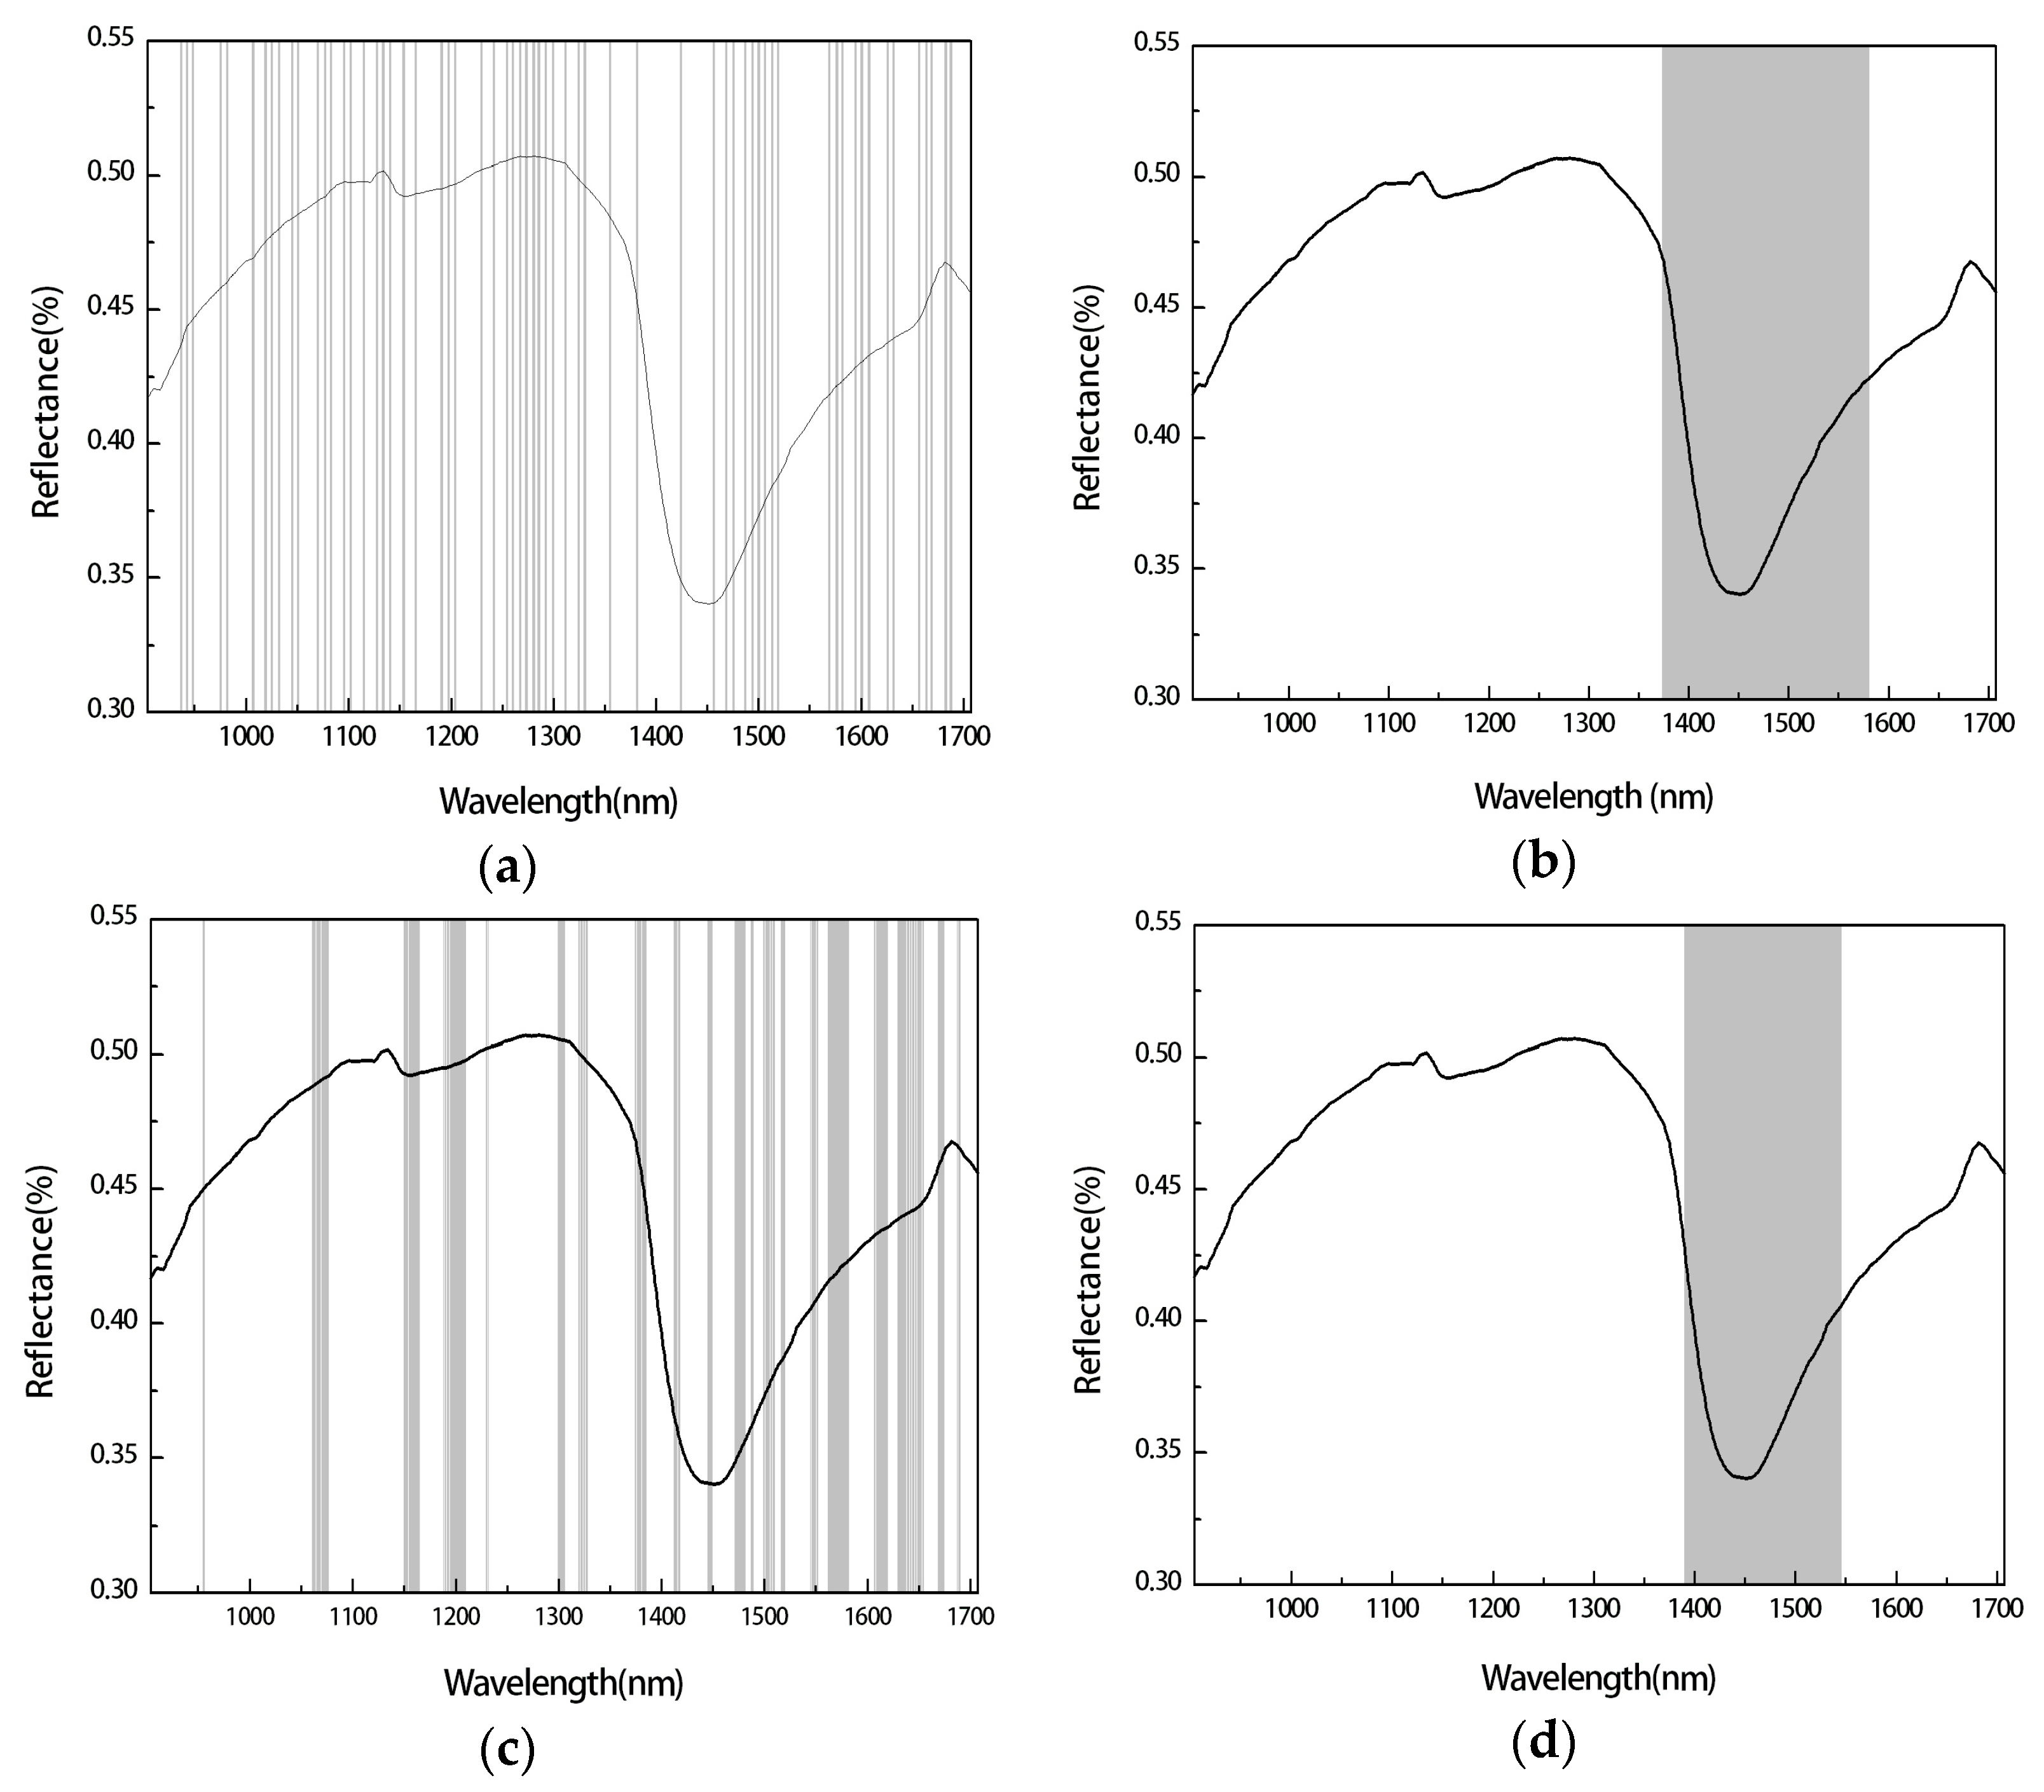
Figure 8.
Comparison of the PLSR results with variable selection methods: (a) beta-peak; (b) VIP; (c) bootstrap; and (d) iPLS.
Figure 8.
Comparison of the PLSR results with variable selection methods: (a) beta-peak; (b) VIP; (c) bootstrap; and (d) iPLS.

Table 1.
Partial least-squares regression (PLSR) results with different preprocessing techniques.
| Preprocessing Method | LVs | Calibration | Validation | Test | |||
|---|---|---|---|---|---|---|---|
| Rc2 | RMSEc | Rv2 | RMSEv | Rt2 | RMSEt | ||
| Raw data | 9 | 0.930 | 12.757 | 0.920 | 19.041 | 0.884 | 19.170 |
| SG smoothing | 8 | 0.918 | 13.848 | 0.915 | 19.571 | 0.897 | 18.103 |
| SG-1st derivative | 6 | 0.918 | 13.882 | 0.925 | 18.376 | 0.883 | 19.259 |
| SG-2nd derivative | 6 | 0.937 | 12.114 | 0.913 | 19.792 | 0.840 | 22.506 |
| MSC | 8 | 0.926 | 13.132 | 0.933 | 17.432 | 0.914 | 16.482 |
| SNV | 8 | 0.927 | 13.069 | 0.943 | 16.106 | 0.915 | 16.426 |
| Max. normalization | 7 | 0.920 | 13.699 | 0.938 | 16.797 | 0.922 | 15.711 |
| Mean normalization | 9 | 0.926 | 13.149 | 0.926 | 18.308 | 0.892 | 18.479 |
| Range normalization | 7 | 0.922 | 13.535 | 0.931 | 17.722 | 0.920 | 15.970 |
Table 2.
PLSR performance comparison with variable selection methods.
| Method | LVs | No. of Variables | Calibration | Validation | Test | ||||
|---|---|---|---|---|---|---|---|---|---|
| Rc2 | RMSEc | Rv2 | RMSEv | Rt2 | RMSEt | ||||
| Full PLSR | 7 | 804 | 0.920 | 13.699 | 0.938 | 16.797 | 0.922 | 15.711 | |
| iPLS | 7 | 150 | 0.900 | 17.825 | 0.930 | 17.825 | 0.918 | 16.115 | |
| VIP | v = 0.7 | 7 | 316 | 0.924 | 13.391 | 0.934 | 17.276 | 0.923 | 15.597 |
| v = 1.0 | 7 | 203 | 0.905 | 20.131 | 0.910 | 20.131 | 0.918 | 16.130 | |
| v = 1.5 | 7 | 150 | 0.909 | 14.620 | 0.926 | 18.314 | 0.920 | 15.916 | |
| v = 2.0 | 7 | 40 | 0.884 | 16.522 | 0.853 | 25.818 | 0.859 | 21.167 | |
| Boots-trap | c = 1.0 | 7 | 305 | 0.919 | 13.795 | 0.941 | 16.392 | 0.927 | 15.164 |
| c = 1.3 | 7 | 192 | 0.916 | 14.012 | 0.940 | 16.472 | 0.924 | 15.526 | |
| c = 1.6 | 7 | 106 | 0.909 | 14.586 | 0.929 | 17.954 | 0.918 | 16.128 | |
| c = 1.9 | 7 | 35 | 0.875 | 17.1670 | 0.884 | 22.913 | 0.878 | 19.655 | |
| Beta-peak | 6 | 63 | 0.918 | 13.834 | 0.932 | 17.494 | 0.930 | 14.905 | |
© 2017 by the authors. Licensee MDPI, Basel, Switzerland. This article is an open access article distributed under the terms and conditions of the Creative Commons Attribution (CC BY) license (http://creativecommons.org/licenses/by/4.0/).
Share and Cite
MDPI and ACS Style
Kim, G.; Hong, S.-J.; Lee, A.-Y.; Lee, Y.-E.; Im, S. Moisture Content Measurement of Broadleaf Litters Using Near-Infrared Spectroscopy Technique. Remote Sens. 2017, 9, 1212. https://doi.org/10.3390/rs9121212
AMA Style
Kim G, Hong S-J, Lee A-Y, Lee Y-E, Im S. Moisture Content Measurement of Broadleaf Litters Using Near-Infrared Spectroscopy Technique. Remote Sensing. 2017; 9(12):1212. https://doi.org/10.3390/rs9121212
Chicago/Turabian StyleKim, Ghiseok, Suk-Ju Hong, Ah-Yeong Lee, Ye-Eun Lee, and Sangjun Im. 2017. "Moisture Content Measurement of Broadleaf Litters Using Near-Infrared Spectroscopy Technique" Remote Sensing 9, no. 12: 1212. https://doi.org/10.3390/rs9121212
Note that from the first issue of 2016, this journal uses article numbers instead of page numbers. See further details here.