River Levels Derived with CryoSat-2 SAR Data Classification—A Case Study in the Mekong River Basin
by
 , , , and
Eva Boergens
1,* ,
,
Karina Nielsen
2,
Ole Baltazar Andersen
2,
Denise Dettmering
1 and
Florian Seitz
1 1
Deutsches Geodätisches Forschungsinstitut der Technischen Universität München (DGFI-TUM), Arcisstraße 21, 80333 Munich, Germany
2
Division of Geodesy, DTU Space, National Space Institute, DK-2800 Kongens Lyngby, Denmark
*
Author to whom correspondence should be addressed.
Remote Sens. 2017, 9(12), 1238; https://doi.org/10.3390/rs9121238
Submission received: 13 October 2017
/
Revised: 23 November 2017
/
Accepted: 27 November 2017
/
Published: 30 November 2017
(This article belongs to the Special Issue Satellite Altimetry for Earth Sciences)
Abstract
:In this study we use CryoSat-2 SAR (delay-Doppler synthetic-aperture radar) data in the Mekong River Basin to estimate water levels. Compared to classical pulse limited radar altimetry, medium- and small-sized inland waters can be observed with CryoSat-2 SAR data with a higher accuracy due to the smaller along track footprint. However, even with this SAR data the estimation of water levels over a medium-sized river (width less than 500 m) is still challenging with only very few consecutive observations over the water. The target identification with land–water masks tends to fail as the river becomes smaller. Therefore, we developed a classification approach to divide the observations into water and land returns based solely on the data. The classification is done with an unsupervised classification algorithm, and it is based on features derived from the SAR and range-integrated power (RIP) waveforms. After the classification, classes representing water and land are identified. Better results are obtained when the Mekong River Basin is divided into different geographical regions: upstream, middle stream, and downstream. The measurements classified as water are used in a next step to estimate water levels for each crossing over a river in the Mekong River network. The resulting water levels are validated and compared to gauge data, Envisat data, and CryoSat-2 water levels derived with a land–water mask. The CryoSat-2 water levels derived with the classification lead to more valid observations with fewer outliers in the upstream region than with a land–water mask (1700 with 2% outliers vs. 1500 with 7% outliers). The median of the annual differences that is used in the validation is in all test regions smaller for the CryoSat-2 classification results than for Envisat or CryoSat-2 land–water mask results (for the entire study area: 0.76 m vs. 0.96 m vs. 0.83 m, respectively). Overall, in the upstream region with small- and medium-sized rivers the classification approach is more effective for deriving reliable water level observations than in the middle stream region with wider rivers.
1. Introduction
River waters are crucial as suppliers of water for irrigation and fresh water for drinking. However, river floods can destroy crops, settlements, and infrastructure. For this reason, it is essential to monitor the water level of river systems. However, an increasing number of in situ gauges have been derelicted since the 1980s [1], or the data is not publicly available. Therefore, it is more and more important to close this data gap with satellite altimetry.
In recent years many studies have been published that apply satellite pulse-limited altimetry over rivers of various sizes (e.g., [2,3,4,5,6,7]). CryoSat-2, launched in 2010, is the first satellite carrying a delay-Doppler altimeter [8] that operates in three measuring modes: the classical pulse-limited low resolution (LR) mode, the delay-Doppler synthetic-aperture radar (SAR) mode, and the SAR interferometric (SARin) mode.
Compared to conventional radar altimeters, delay-Doppler SAR measurements have a higher along-track resolution and a smaller footprint. This improves the observation of water levels of inland water bodies like lakes (e.g., [9,10,11]) or rivers (e.g., [12,13]). The advantage of SAR altimetry observations is that they are especially effective for measuring smaller inland waters like rivers. However, CryoSat-2 has a long repeat time of 369 days compared to 35 days for Envisat and SARAL, and 10 days for Topex/Poseidon, Jason-1, Jason-2, and Jason-3. This restricts the estimation of water level time series over lakes and even more over rivers. The advantage of the long repeat time is the very dense spatial distribution of observations. This spatial distribution enables better river monitoring in the continuous progression. Unlike lakes, rivers can change their water levels rapidly over their course which makes a denser spatial distribution of observations desirable.
To derive water levels from lakes or rivers it is necessary to identify the water returns of the altimeter. A land–water mask can be used for this purpose, like the mask provided by the World Wildlife Fund (https://www.worldwildlife.org/pages/global-lakes-and-wetlands-database). Such a mask is constant over time; therefore, it neither accounts for the seasonal variations of the water extent nor inter-annually shifting river and lake banks. Extracting dynamic land–water masks from optical remote sensing images is difficult in the tropics, which includes the study area of the Mekong Basin, since cloud-free optical data is only available during the dry season with low water level. Moreover, SAR images with sufficient spatial resolution are only available from the launch of Sentinel-1 in 2014. Although a high accuracy land–water mask is provided by the Mekong River Commission (http://portal.mrcmekong.org/map_service) for the study area with an accuracy of 30 m, this accuracy might not be sufficient for medium- and small-sized rivers. Additionally, the mask has no seasonal variations included.
Within this study, an innovative classification approach for SAR altimetry data is developed and validated, which is independent of the accuracy and availability of land–water masks. With this approach, reliable river levels, even for small and medium-sized rivers, are derived. Compared to classical approaches based on land–water masks, the number of valid measurements is increased and the water level precision is improved.
For the classical pulse-limited altimeter data, classification has been done successfully for the last decade worldwide (e.g., [14,15]). Even very small water areas in wetlands have been classified successfully with Envisat data by [16].
In these classifications, the shape of the waveform is used to discriminate between different reflecting surfaces. Also, CryoSat-2 SAR data has been classified based on the SAR waveform for lakes [11], lakes and rivers [17], or ice [18]. This study takes a step further and uses not only the waveform but also the range-integrated power (RIP) for a classification of the altimeter measurements in water and non-water returns over the Mekong River Basin in Southeast Asia. The RIP is only available for delay-Doppler SAR altimetry and gives additional insight to the reflective surface that the waveform alone could not provide [19].
The unsupervised k-means algorithm is employed for the classification [20] as not enough reliable training data is available for a supervised classification. The k-means algorithm is a widely used unsupervised clustering algorithm and has been used for altimetry classification before (e.g., [11]).
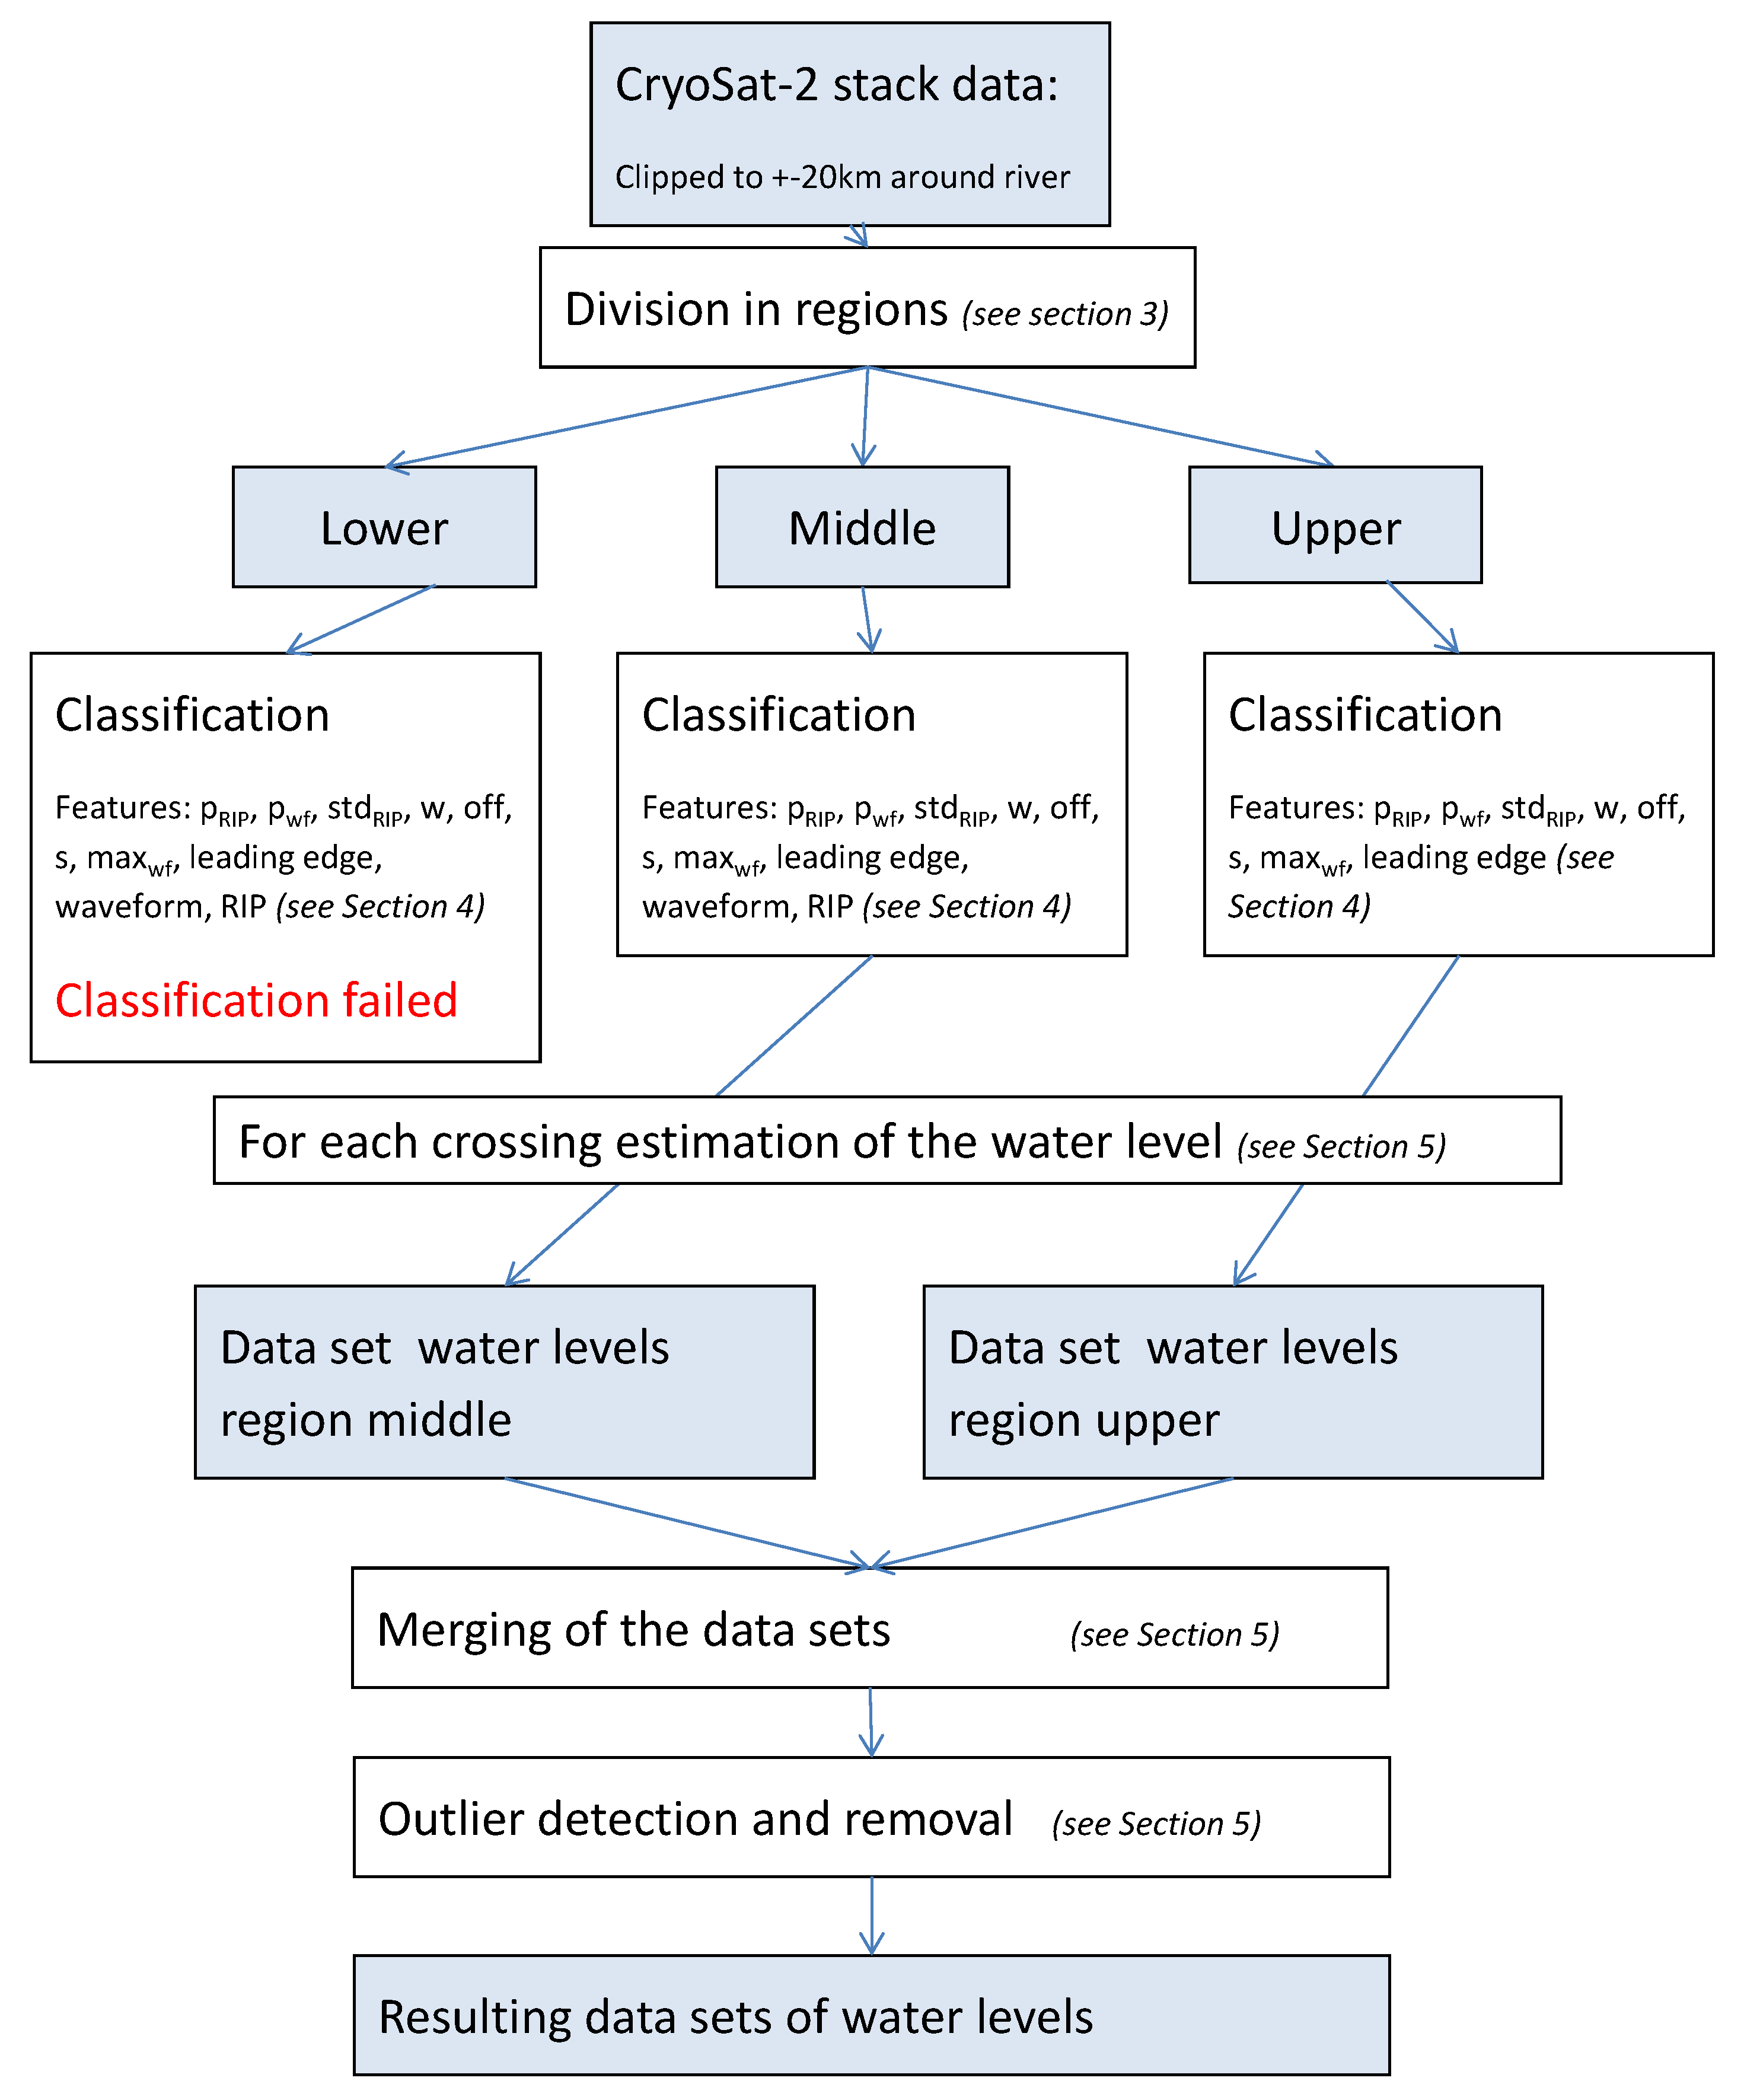
This paper is structured as follows: First, an introduction is given about the study area of the Mekong River Basin in Section 2, afterwards more information of the CryoSat-2 SAR data is given in Section 3. The classification and the used features are described in Section 4.1 followed by an explanation of the water level estimation in Section 4.2. The results and validations are presented in Section 5. These results are discussed in Section 6 and an outlook is given. The paper ends with the conclusions in Section 7. An overview over all relevant processing steps of this study is given in Figure 1.
2. Study Area
The Mekong River Basin in Southeast Asia (China, Myanmar, Thailand, Laos, Cambodia, and Vietnam) is investigated in this study, with a focus on the part of the basin south of the Chinese border. Further upstream the river gorge is too narrow for reliable altimeter observations. Downstream, the study area is limited by by the confluence with the Tonle Sap River from where the river is under a tidal influence. The tributaries, namely the large left bank side tributaries in Laos, are investigated as well. The hydrology of the Mekong Basin is primarily influenced by the precipitation on the Tibetan Plateau and the south-eastern monsoon [21].
In the Mekong River Basin the river width varies between 20 m to more than 2 km. Most of the tributaries and the upstream reach of the main river stream are less than 100- m-wide small rivers. The medium rivers, which are less than 500- m but more than 100- m-wide, are the main tributaries for the upstream main river. In the downstream reach of the river, before it splits into the delta, the river has a width of over 2 km (see also Figure 2 for a map of the basin).
The Mekong River and its tributaries flow through different topographic regions (Figure 2). The main river upstream from Vientiane and the left bank tributaries in Laos are surrounded by mountainous areas with steep banks where the rivers have a greater slope and have a width smaller than 500 m or even less than 100 m. Downstream of Vientiane and up to the Mekong Falls the river widens and flows with less slope over the Khorat plateau. Below the Mekong Falls the river is surrounded by seasonal wetlands and widens to more than 1 km. For further processing we defined three overlapping data masks according to these regions (Figure 2). The regions are determined by the roughness of a topography model and the absolute height. Afterwards a margin around each subregion allows for an overlap.
3. Data
3.1. CryoSat-2 SAR Data
In this study we use delay-Doppler SAR altimeter data measured by CryoSat-2 between 2010 and 2016. CryoSat-2 measures in three different modes (LR, SAR, and SARIn mode), which are set in a geographical mask (https://earth.esa.int/web/guest/-/geographical-mode-mask-7107): The LRM is active mostly over the oceans and the interior of the ice sheets of Antarctica and Greenland, whereas the SAR mode measures over sea ice and other selected regions, and SARin focuses mostly on glaciated regions [22]. This mask has changed over the life time of the satellite. The entire study area of the Mekong River Basin has only been measured in SAR mode since July 2014 (see Figure 2 for the extent of the SAR mode mask). In SAR mode the along-track foot print size is reduced to 300 m while it remains at 14 km in the across-track direction [23].
The delay-Doppler SAR altimeter measures a point on the surface several times from different looking angles [24]. Unlike pulse limited altimetry, which is only able to measure the returning signal from the whole foot print, SAR altimetry discretizes the returning signal corresponding to 300- m-wide stripes of the footprint in along track direction. The signals from each of these stripes are recorded in the so-called single-look waveform. All single-look waveforms for the same surface area are collected in the stack matrix.
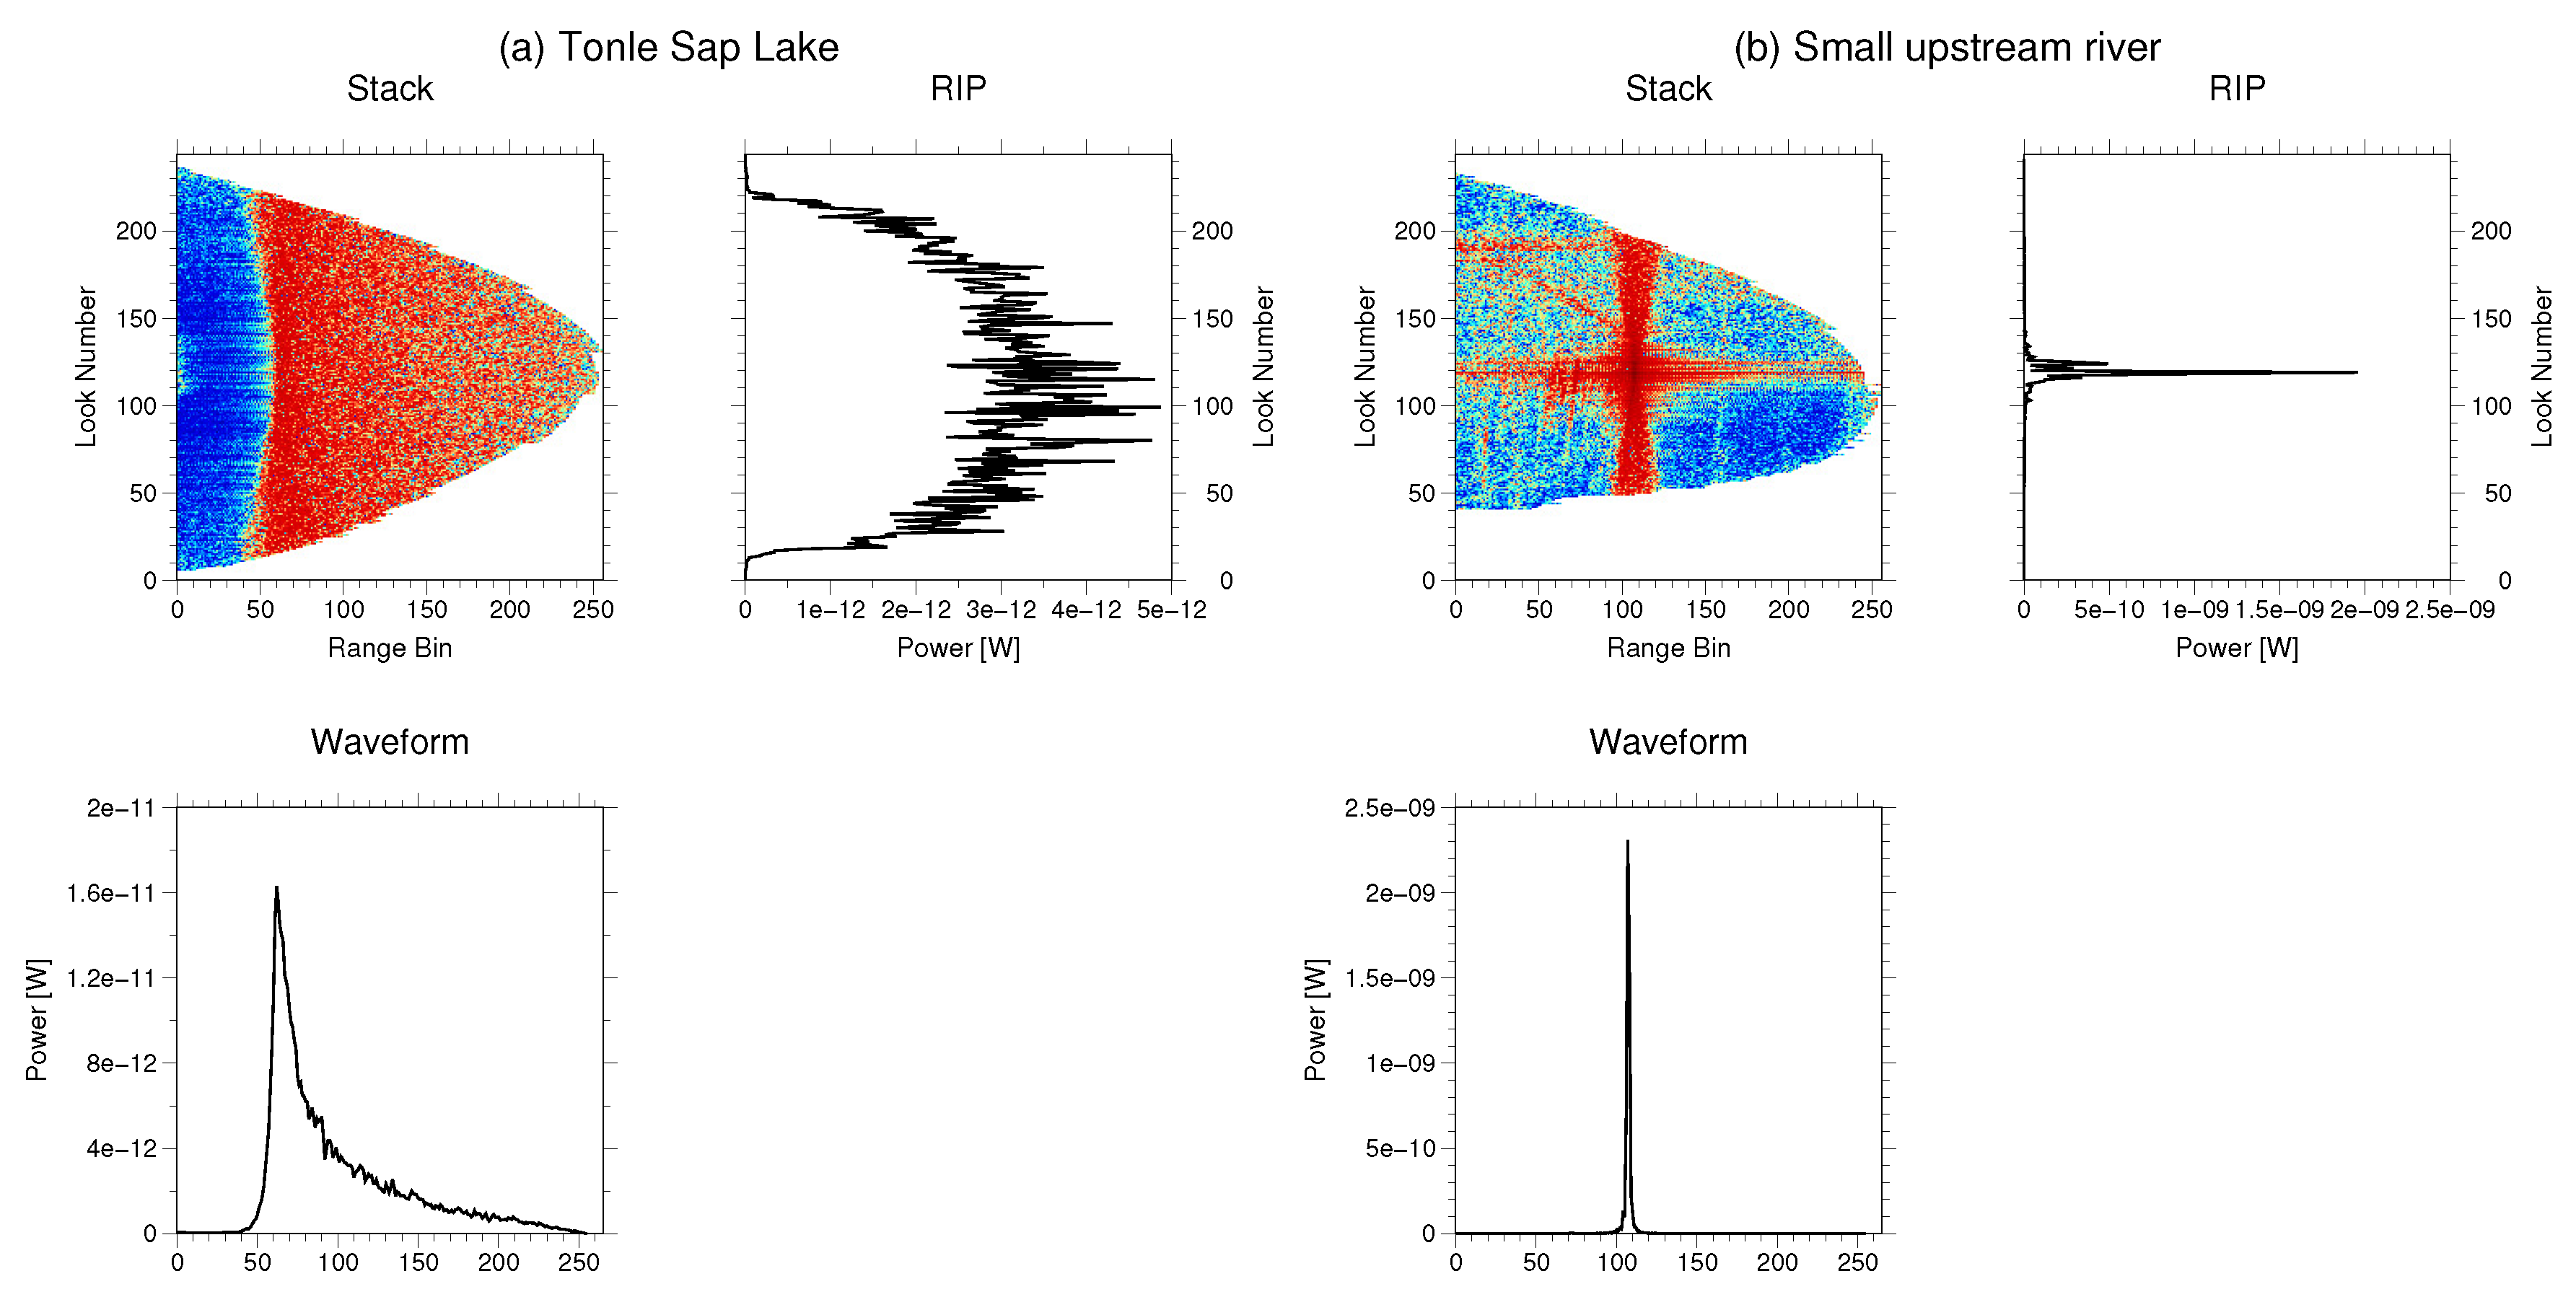
In Figure 3, two exemplary stack matrices are presented. The first (a) is measured over the Tonle Sap lake and the second (b) over a medium-sized river in the upstream region of the Mekong River. Each row is a single-look waveform. The integration of this matrix over all single-looks results in the multi-look SAR waveform (in Figure 3 with integration over each row of the stack) hereafter referred to as the waveform. The integration over the range bins results in the range-integrated power (RIP). In Figure 3 this corresponds to the integration over the columns. Detailed information on the delay-Doppler measurements is described in [8].
Here, we use the CryoSat-2 baseline C SAR Level 1b data provided by ESA GPOD SARvatore (https://gpod.eo.esa.int/) for the period 2010–2016. SARvatore is the official ESA platform for the dissemination of the CryoSat-2 level 1b SAR data. The data is processed on user request with different processing parameters. The most important data processing parameters of the data in this study are: the applied Hamming window, fft zero-padding, 20-Hz data, and stack data in the output file.
3.2. Envisat Data
Envisat water level observations are used for the validation in this study. The water levels are taken from the DAHITI database [4]. DAHITI uses a throughout outlier detection in combination with a Kalman filter approach to derive reliable water level time series for lakes and rivers. More information on the processing strategy is available in [4]. The Envisat water level time series in the Mekong Basin has a temporal resolution of 35 days, even though data gaps may occur for some cycles. For small tributaries, a correction for the Hooking effect is applied additionally in [5].
3.3. In Situ Data
For validation, in situ gauge data is used which is provided by the Mekong River Commission (http://ffw.mrcmekong.org/). The gauge data has a daily temporal resolution but the time series ends with 2012. No absolute height of the gauge is provided.
Additionally, we use a river polygon which is also provided by the Mekong River Commission (http://portal.mrcmekong.org/map_service). The polygon was derived from aerial images and topographic maps. The accuracy of the river mask is ~30 m, but no information about the seasonality of the polygon is given.
4. Methods
4.1. Classification Approach
For the medium and small rivers in our study area of the Mekong basin no reliable land–water mask is available. Thus, a classification by means of the k-means algorithm is performed to extract the water measurements.
The k-means algorithm [20] is an unsupervised method to cluster the data on the basis of different features. For the land–water classification a set of features derived from the CryoSat-2 stack data over the intermediate step of the waveform and the RIP is used. The features are summarized in Table 1. The features derived from the waveform are the maximum power, the peakiness, and the position of the leading edge. It is well known that waveforms of water reflections have a higher power than those of land reflections. Medium, and to a greater degree small, water bodies have smooth mirror-like surfaces which can only be measured by signals emitted close to nadir. This leads to a very peaky waveform and RIP with a high power. Following [25] the peakiness is calculated with
where wf is the waveform and the power of the ith bin.
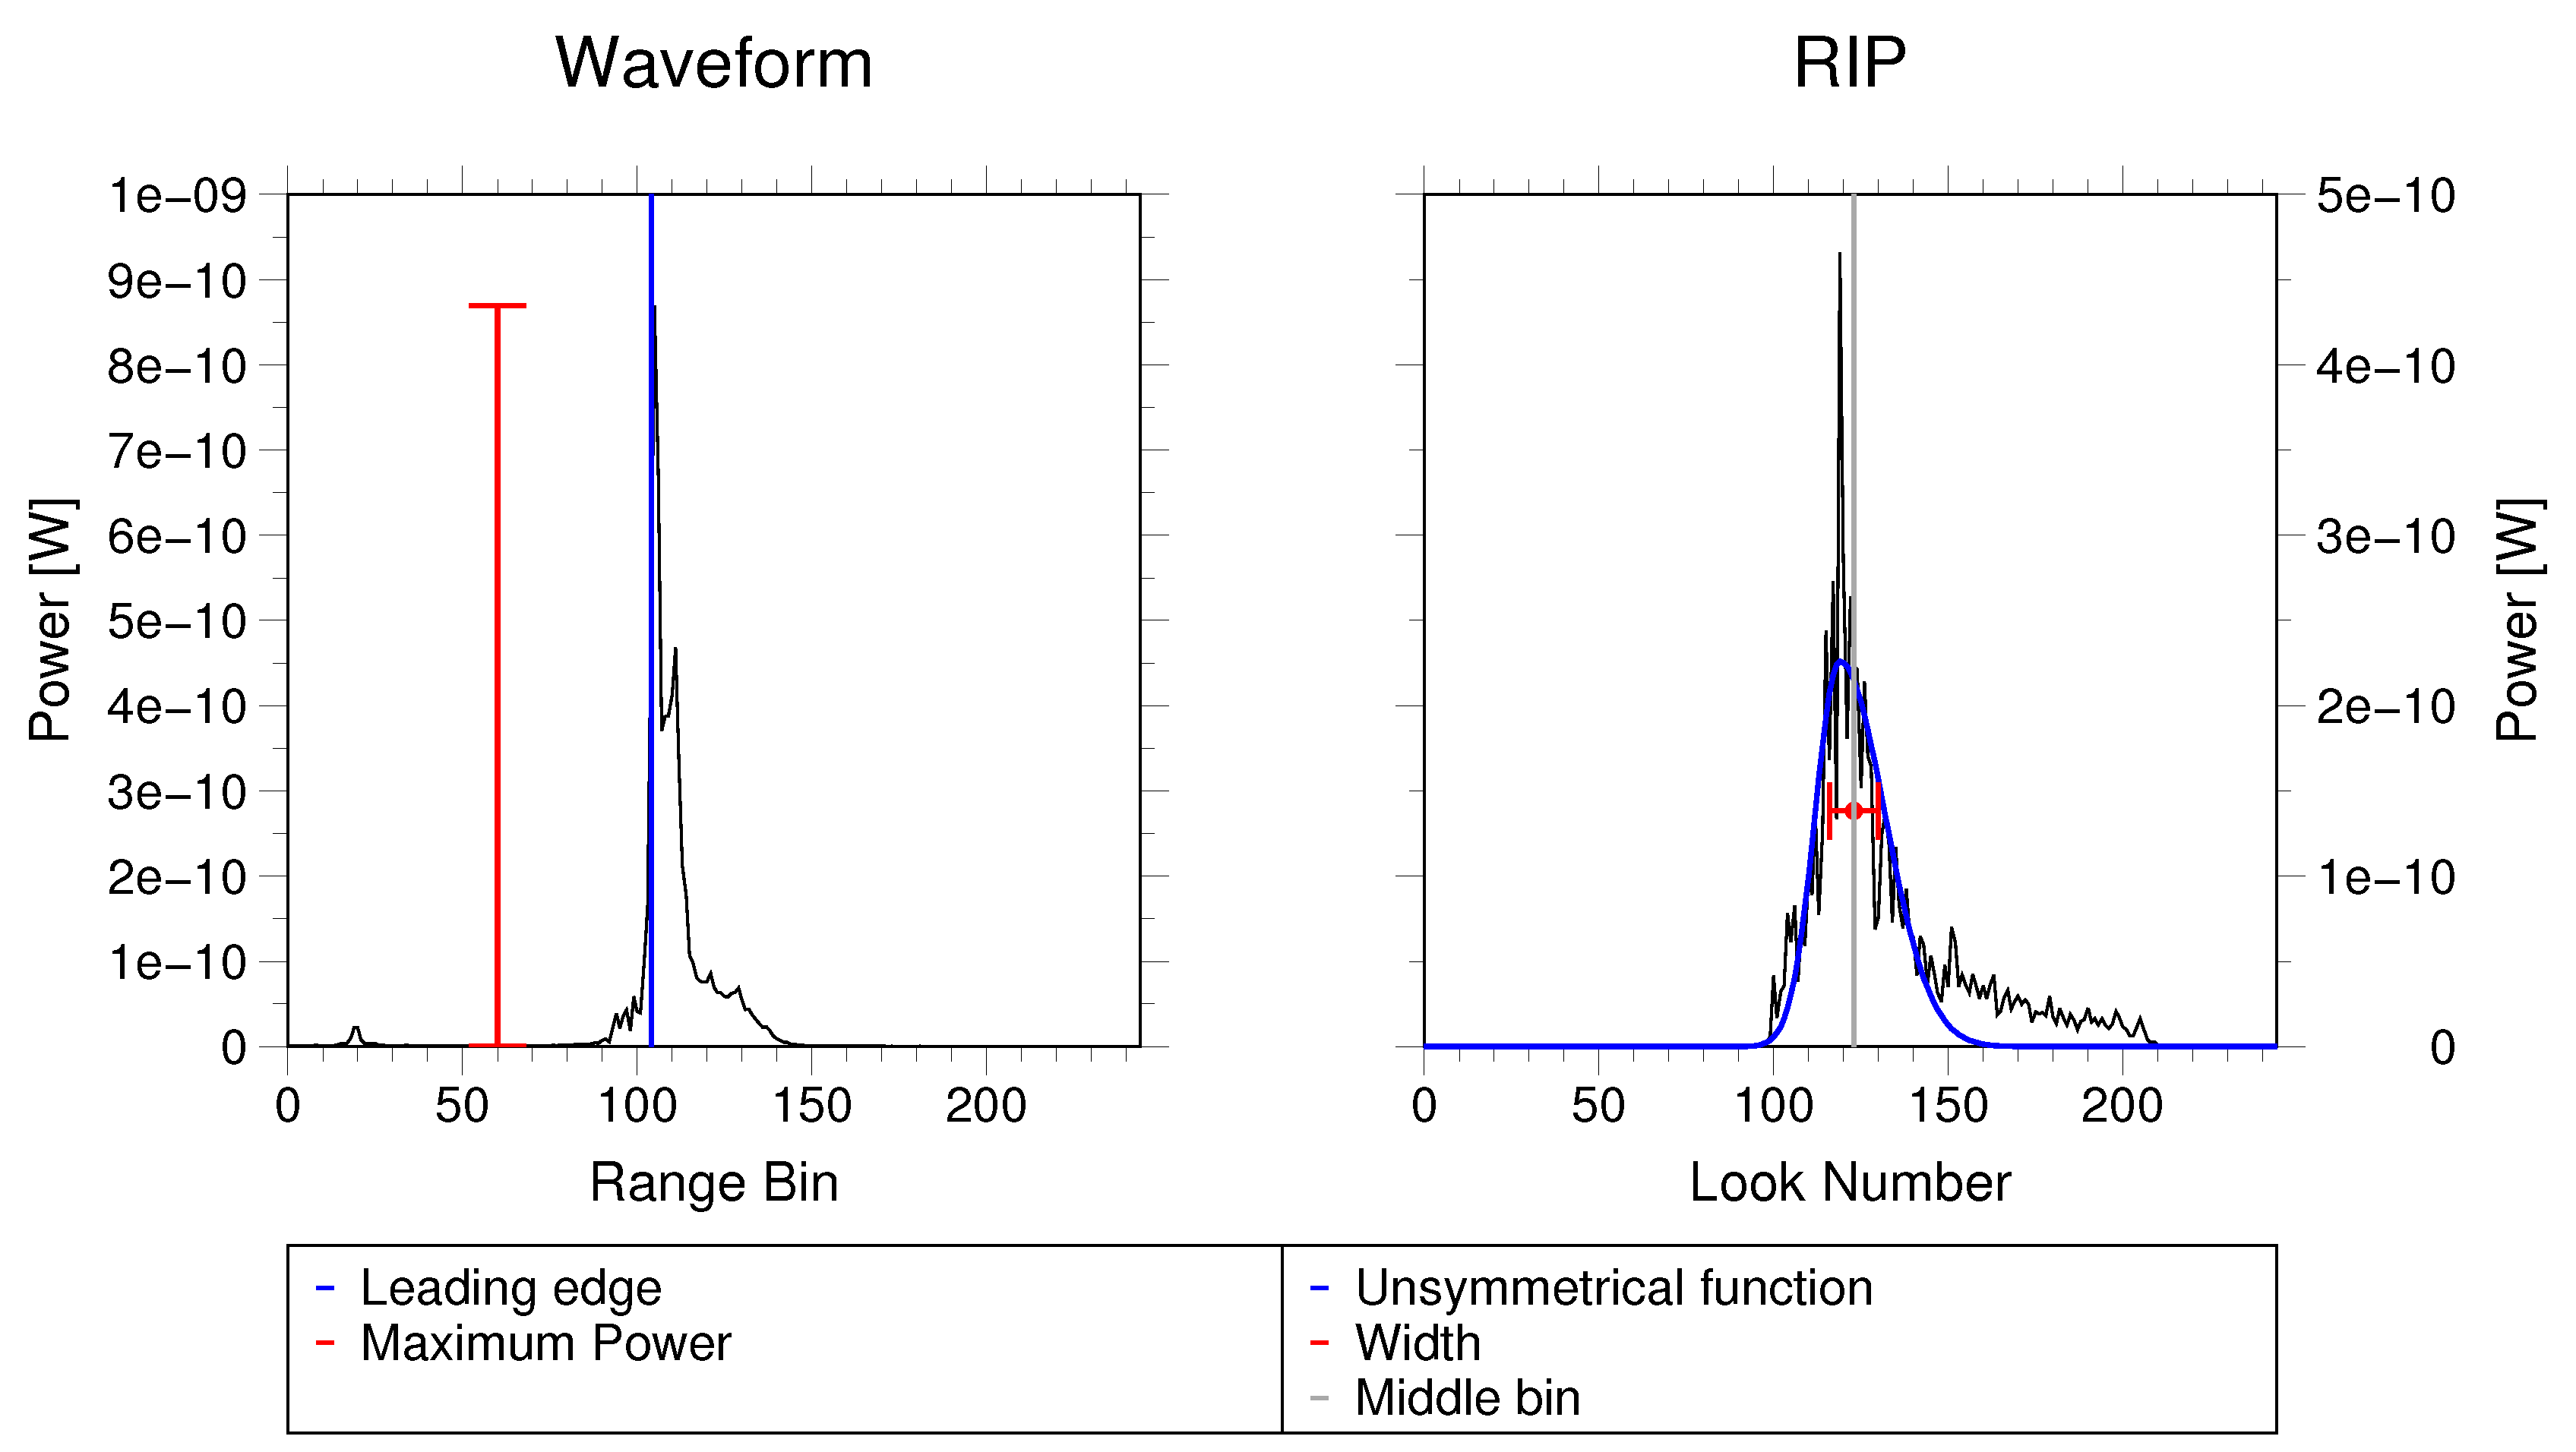
To estimate the relative position of the leading edge in the waveform, the waveform is retracked using an improved threshold retracker with a threshold of 50% on the best sub-waveform [26]. The on-board tracking system always tries to hold the leading edge of the main reflection at the nominal tracking point. This is not always possible and leads to a deviation of the leading edge from the nominal tracking point. Over wider rivers the tracking system can manage to keep the leading edge close to the tracking point. In Figure 4 (left panel), one exemplary waveform with its features maximum power and position of the leading edge is shown (the peakiness cannot be displayed).
Features based on the RIP are the peakiness , the standard deviation , the width, the off-center, and the symmetry. Water reflections over large water bodies result in a overall smoother RIP than water reflections over small water bodies that in turn have a smoother RIP than land reflections(see Figure 3). This smoothness is measured with a standard deviation feature . The is then
where is the ith entry of the RIP and N the number of looks in the RIP, usually 246.
As mentioned before, small and medium inland waters with a smooth surface only reflect the signal back to the satellite at near nadir. Therefore, the RIP is both very peaky and narrow. The width w is derived with:
The off-center feature describes the deviation of the main reflection from the nadir point. It should be close to zero for measurements of water, whereas land measurements are more disturbed and often show the maximum return in the side lobes. We measure the off-center feature as the difference between the middle look of the RIP and the mean point of the RIP which is calculated with:
A positive value indicates that the majority of the returning power was detected before the satellite passed the nadir position, a negative value vice versa.
The last feature is a measure of the symmetry of the RIP s. For an ideal smooth water reflection, like a small lake, the RIP should be perfectly symmetrical. However, for a sloped target, such as a river, the reflection depends on the relative orientation between the satellite and the water surface. The reflection is stronger when the satellite looks on a water surface that is sloped towards it. A positive s indicates a water surface sloped towards the approaching satellite. This effect leads to an unsymmetrical RIP. To quantify this, an unsymmetrical exponential function is fitted to the RIP with
Here, a is the amplitude of the exponential function, b the look where the function reaches its maximum, and and are the two decay parameters. The symmetry feature is then
Figure 4 (right-hand side), displays an RIP with the feature w marked. The off-center feature is too small to be visible in this example, but the symmetry, or the lack thereof, is clearly showing.
Additional to these eight features, both the whole waveform and the whole RIP are used as features. Each bin is then considered as a single feature. The waveform needs to be shifted so that the leading edge is positioned on the nominal tracking point. We found that including waveform and RIP as features only improves the results for the middle region and does not change them in the upstream regions. Therefore, the upstream region is classified without waveform and RIP as features. Since the features span different orders of magnitude, it is necessary to normalize the feature set. All of these features were chosen according to their sensitivity for the posed problem of water classification in the Mekong River Basin and independently from each other. More features were tested but discarded because they were either not sensitive for the classification or highly correlated to one of the used features.
The k-means algorithm is used to cluster the data on the basis of the above features in 20 classes. An unsupervised clustering algorithm is applied because no reliable training data is available. The k-means algorithm assumes normally distributed features with equal variance, which we ensured and tested by the normalization of the features.
The number of classes depends on the application and variation in the input features. An estimate for the number of classes can be done with knowledge of the classified data. In our study case, a look at the spatial distribution of the features tells us that only two classes, land and water, are not sufficient as altimeter measurements of land can be very diverse (this holds also for water measurements, but they are less diverse than land). The diversity of the returning waveform and RIP can be explained by the reflective properties of e.g., land, water, vegetation. With this it can be concluded that at least 10 classes are needed. We tested the classification and validated resulting water levels for several numbers of classes (10, 15, 20, 30) and found similar results for all with the results of 20 classes slightly superior.
Each of the clusters is defined by their centroid which are the mean features of all points in this cluster. New data is classified by grouping it to the closest centroid. Here, the clustering is done on one randomly drawn third of the data. The residual two-thirds of the data are then classified into the cluster classes. The clustering is not done on the whole data set due to computational efficiency. The repeatability of the clustering and classification will be validated in Section 5. After the classification, it is determined which classes represent water and land returns. This was done by visual inspection of the mean waveform and RIP for each class and the locations of the observations in each class related to the approximate location of the river known from the land–water mask (see Section 3).
As described in Section 2 the Mekong Basin is divided into different regions: upstream, middle, and downstream. We classify each of the regions separately as they are too diverse in the reflectivity properties of the water bodies to be classified together. Additionally, the classification is done only on altimeter data not further away than 20 km from the river polygon due to computational efficiency (the polygon can be seen in Figure 2).
4.2. Water Level Estimation Approach
4.2.1. Altimetric Water Levels
The classification results in a set of measurements considered as water returns. From these measurements the water level at each crossing of the satellite track with a river in the Mekong River Basin is determined. A river polygon is employed to locate all crossings in the river basin (see Section 3). We used all measurements less than 5 km away from the river crossing that were classified as water and retracked the SAR waveforms with an improved threshold retracker with 50% threshold [26]. The retracked range is corrected for dry and wet tropospheres, ionospheres, solid Earth and pole tides, and geoid undulation. To ensure consistency for both the Envisat and CryoSat-2 data, the same corrections are used. Instead of using a median or mean over all classified measurements, we search for a horizontal line in the heights, which is assumed to represent the water surface. It is still possible that some of the water-classified measurements do not represent the river surface and need to be excluded from the water level computation (across-track of nadir effects or water bodies surrounding the river). These outliers do not necessarily have to be at the margin of the river but can also be located in the middle due to islands or sandbanks in the river. This can restrict the use of an along-track standard deviation of the heights for outlier detection.
To find the line of equal water height, a histogram of the water levels with Doane bins [27] is used. Doane bins are more suitable for small (less than 30) non-normally distributed data sets than the classical Sturge bins [28]. The Doane bin method not only uses the number of data points to estimate the number of bins and thus bin size, but the shape of the distribution is incorporated with a skewness parameter as well. The range of the data in the data set is indirectly considered in the Doane bins. If a horizontal line is present in the heights, one of the bins is distinctively larger, e.g., contains more observations, than the others and collects the heights of nearly equal water level. The median of the heights in this bin is then taken as water level. If less than five height points are classified as water, the median of the heights is taken as the water level. The advantage of this approach is that it is better suited for rivers wider than 1 km with islands and sandbanks that cause outliers in the heights. However, in many cases this histogram approach or only taking the median of all observations delivers similar results.
4.2.2. Outlier Detection
In spite of careful data selection through the classification and in the height retrieval, some of the water levels have to be considered as outliers. The height retrieval with a horizontal line only prevents outliers if more than five observations are labeled as water observations. In particular, along the small and medium-sized rivers many crossings have less than five observations. A considerable number of crossings have only one observation. The long repeat time of the CryoSat-2 satellite of 369 days complicates the detection of outliers. Unlike altimetric water levels of short repeat time missions, such as Envisat and the Jasons, we do not have a water level time series at a location which can be investigated for outliers by the estimation of and the comparison to an annual signal.
To find the CryoSat-2 outliers we make use of the said repeat time of 369 days. With the knowledge of the very stable annual signal of the Mekong River one can assume that two measurements of the same CryoSat-2 track 369 days apart should measure a similar height [21]. Based on this, a water level is considered as an outlier if the mean difference to all other heights of the same pass is larger than 7 m; the choice of threshold will be discussed below. This is only applicable if other water level measurements of the same track exist. Due to the changing mode mask (see Section 3) some regions are only measured in the last two years. To overcome this, a second outlier detection is applied which compares the water level with water levels of other tracks that are close in space and season (day of the year). To this end, we used all measurements that were less than 10 km away along the river and less than 30 days of the year apart. If the water level was different by more than 10 m from the distance weighted mean water level of all these points, it was considered as an outlier.
The thresholds for the outlier detection were chosen as a conservative upper bound. It is expected that there is an average water level difference of 40 to 60 cm in the five days during the rising water season, but it could be as high as 4 or 5 m [29]. Additionally, some inter-annual changes in the flood season can be expected, and the slope of the river has to be considered which is has a median value of 30 cm/km for the Mekong River. Of the three thresholds used for the outlier detection the difference of 7 m w.r.t. the year is the most sensitive for the later result. The time and distance weighted mean in the second part of the outlier detection limits the sensitivity of the other threshold.
4.2.3. Merging of the Overlap Regions
From the classification we derive a set of heights for each of the different geographical regions which have a certain overlap (see Figure 2 and Section 2). In this overlap, for the same crossing two water levels were computed. Therefore, it has to be decided which height shall be used. To resolve this, we use the distance-weighted mean water level as in the outlier detection (see Section 4.2.2). The water level that is closest to this mean water level is applied.
5. Results and Validation
We applied the described methodology for the classification and water level determination on CryoSat-2 SAR data in the Mekong River Basin. In this section, both the results of the classification and the water level determination are presented and validated.
5.1. Results of the Classification
After the clustering and classification of the CryoSat-2 measurements in the Mekong Basin we select the classes of water returns. In the upstream region we identify three and in the middle region six out of 20 classes as water classes. In the downstream region the rivers are surrounded by seasonal wetland, which makes it difficult to distinguish water return related to the river from the surroundings. Therefore, the downstream region will not be investigated further.
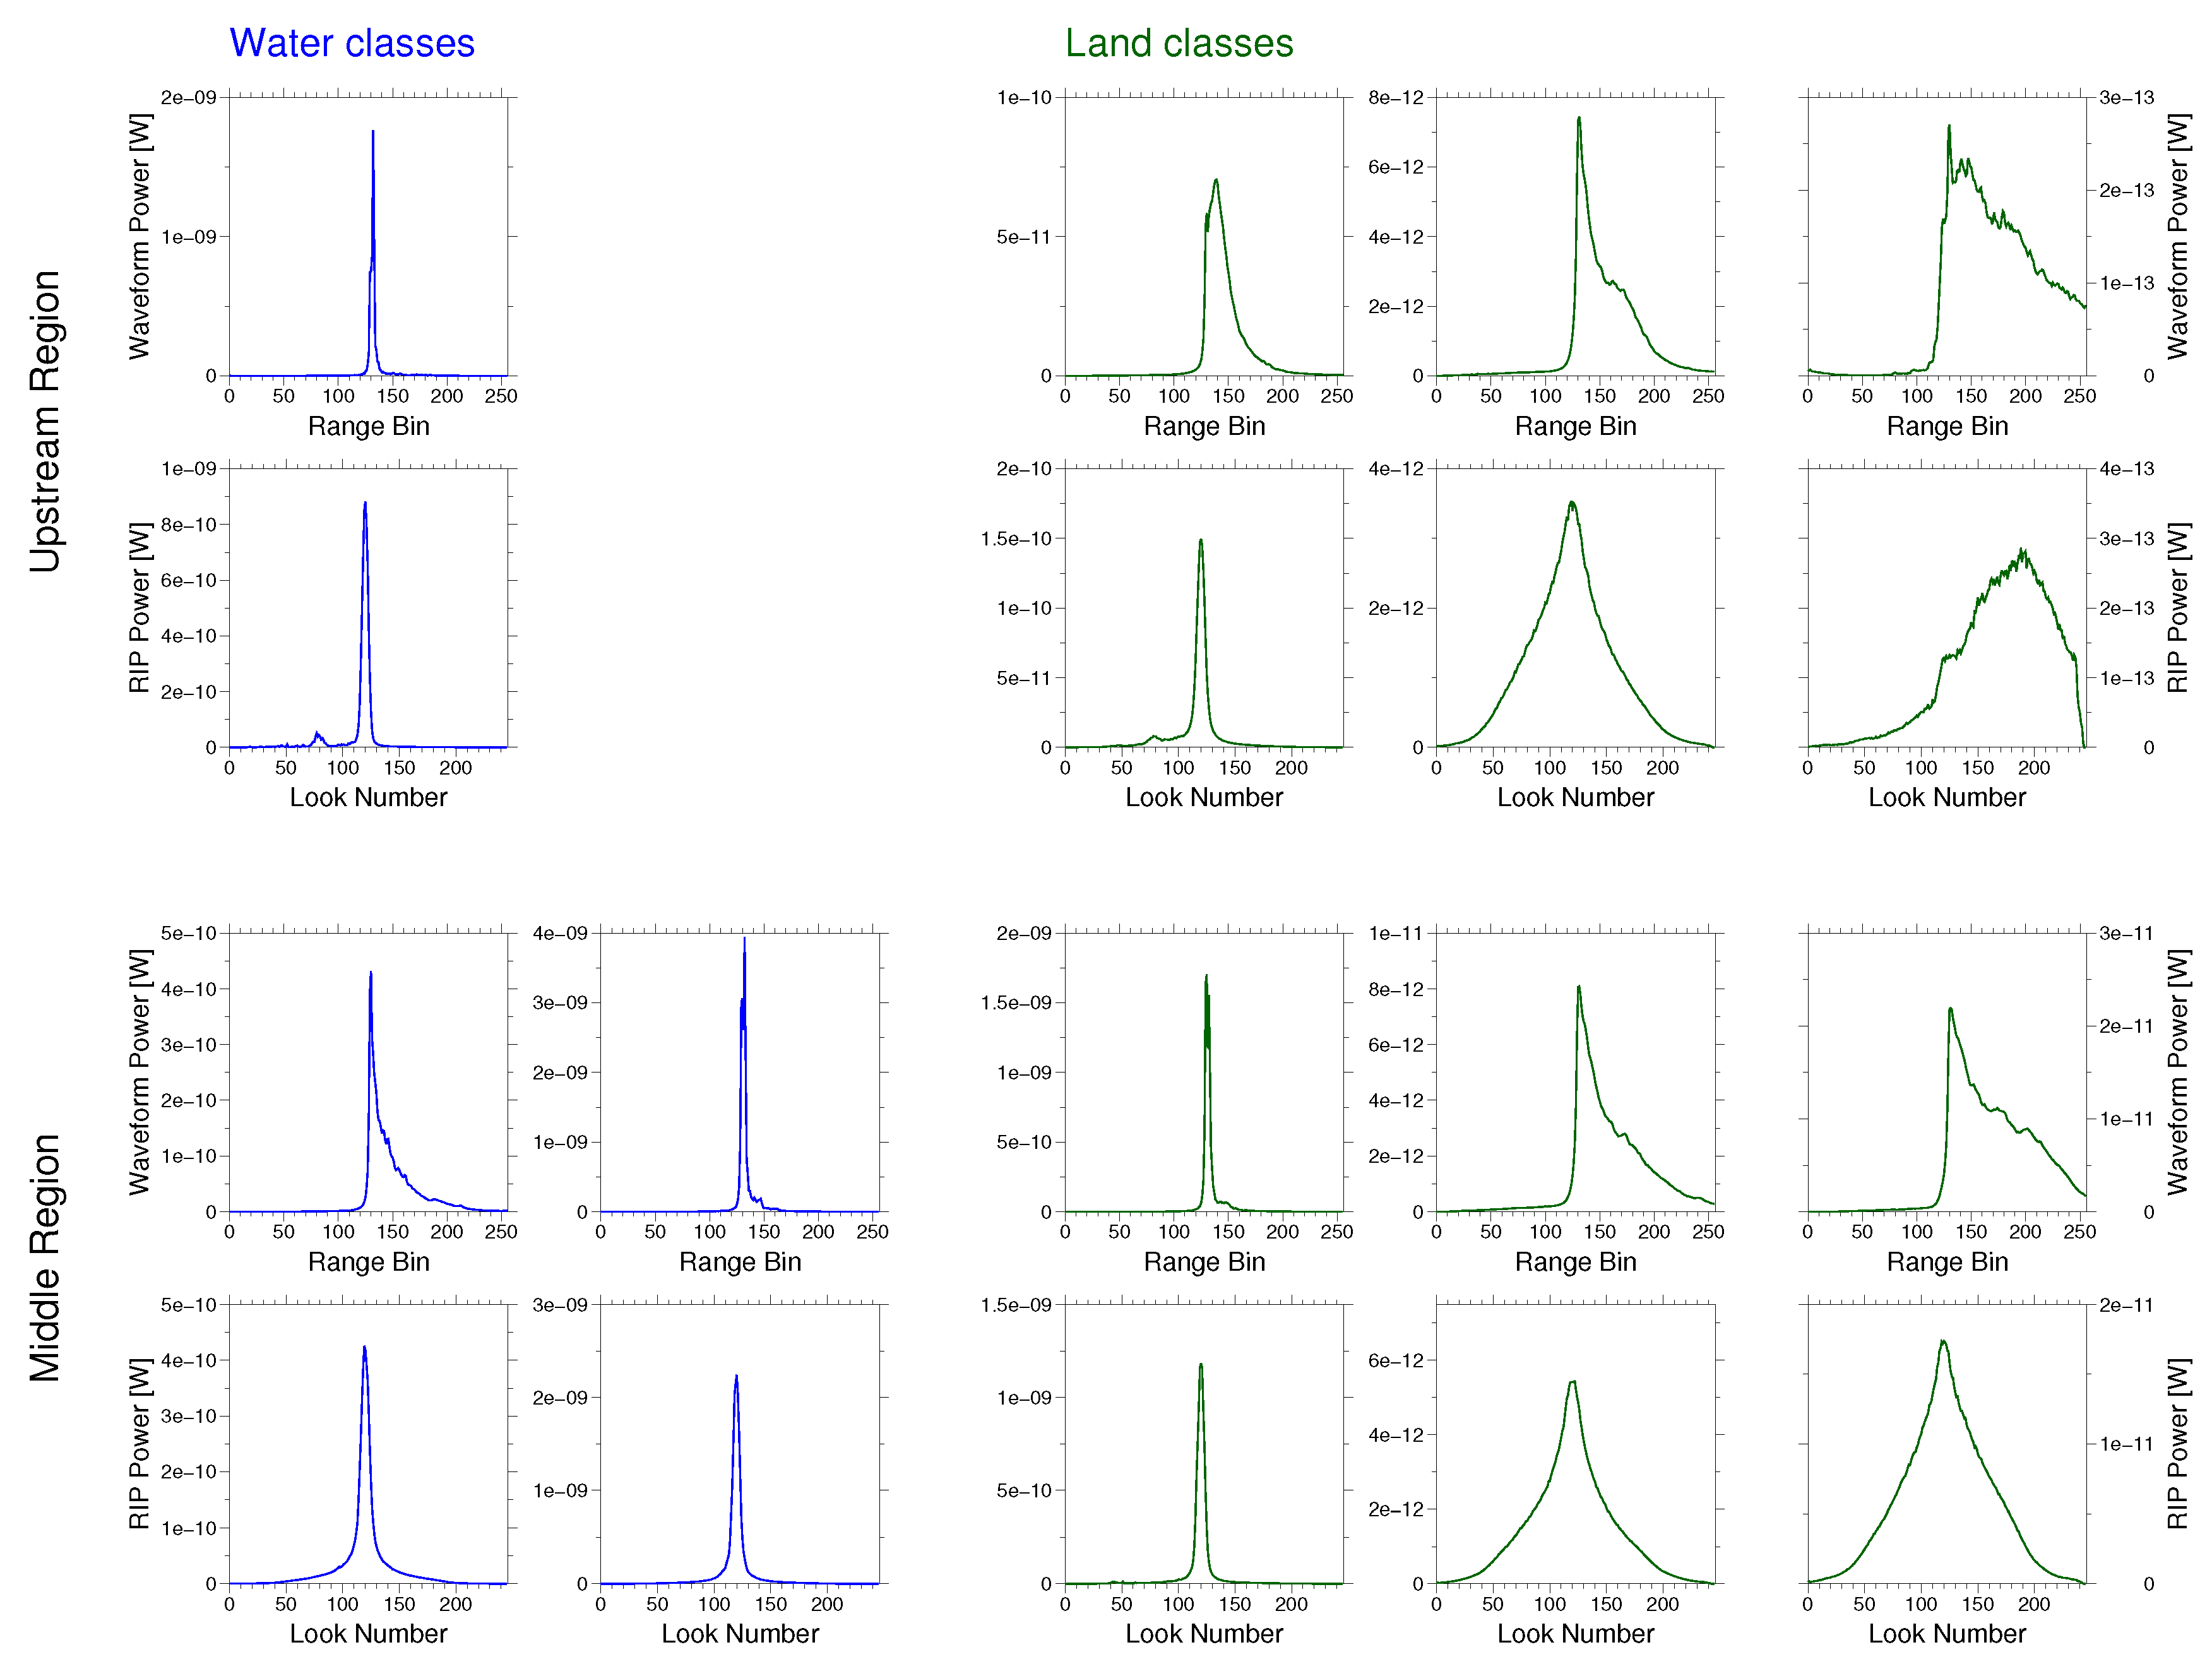
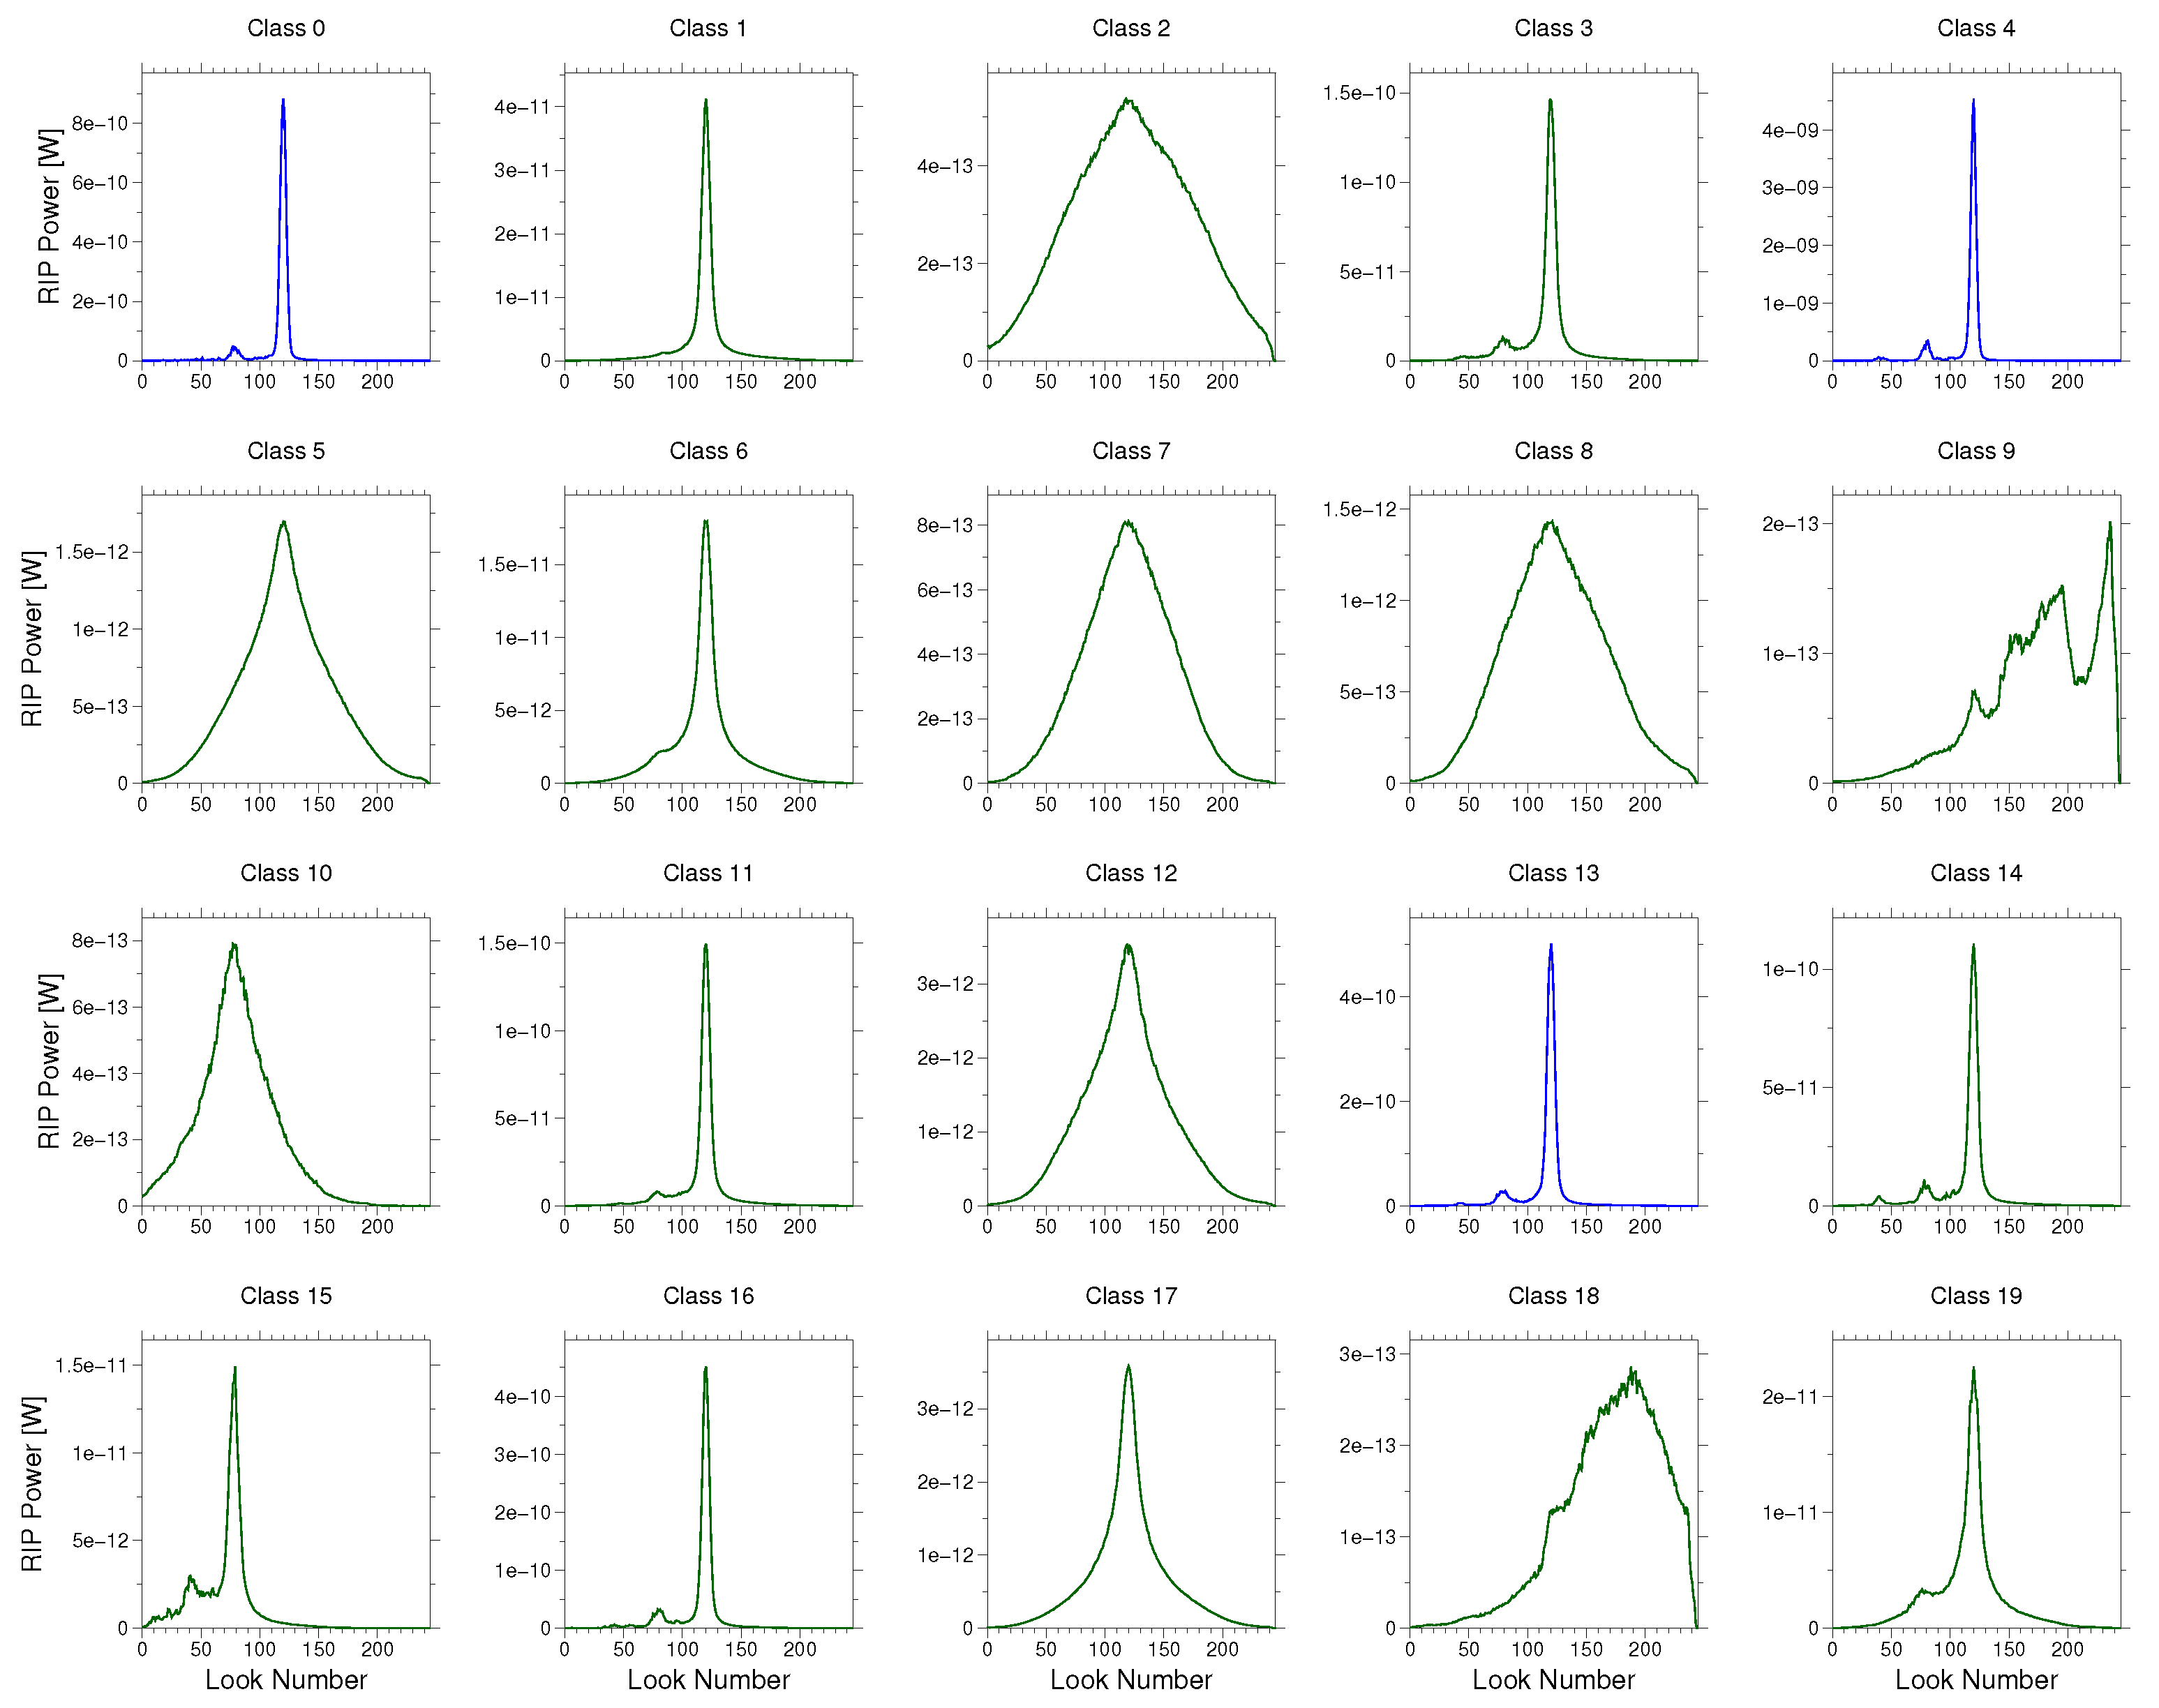
In Figure 5 the mean waveform and mean RIP of some classes are shown (note the different power axes). The classes displayed are selected to best represent all 20 classes for the upstream and middle region. As can be seen, the shape of the mean waveform and mean RIP of water classes in the upstream region reappear in the middle region, but not as water classes. In the middle region small lakes or paddy fields have the same signature as the river upstream. This observation leads to the decision to classify the two regions separately. Some classes have very similar mean waveforms and RIPs (e.g., second water class and first land class in the middle region) but are either classified as water or as land. In this case the maximum power is the important discriminant between the classes. In the upstream region not all stacks over land are ‘full’, i.e., not every single-look recorded the returning power. This leads to strongly distorted RIPs as shown for the third land class. All mean waveforms and RIPs are displayed in Appendix A for the interested reader.
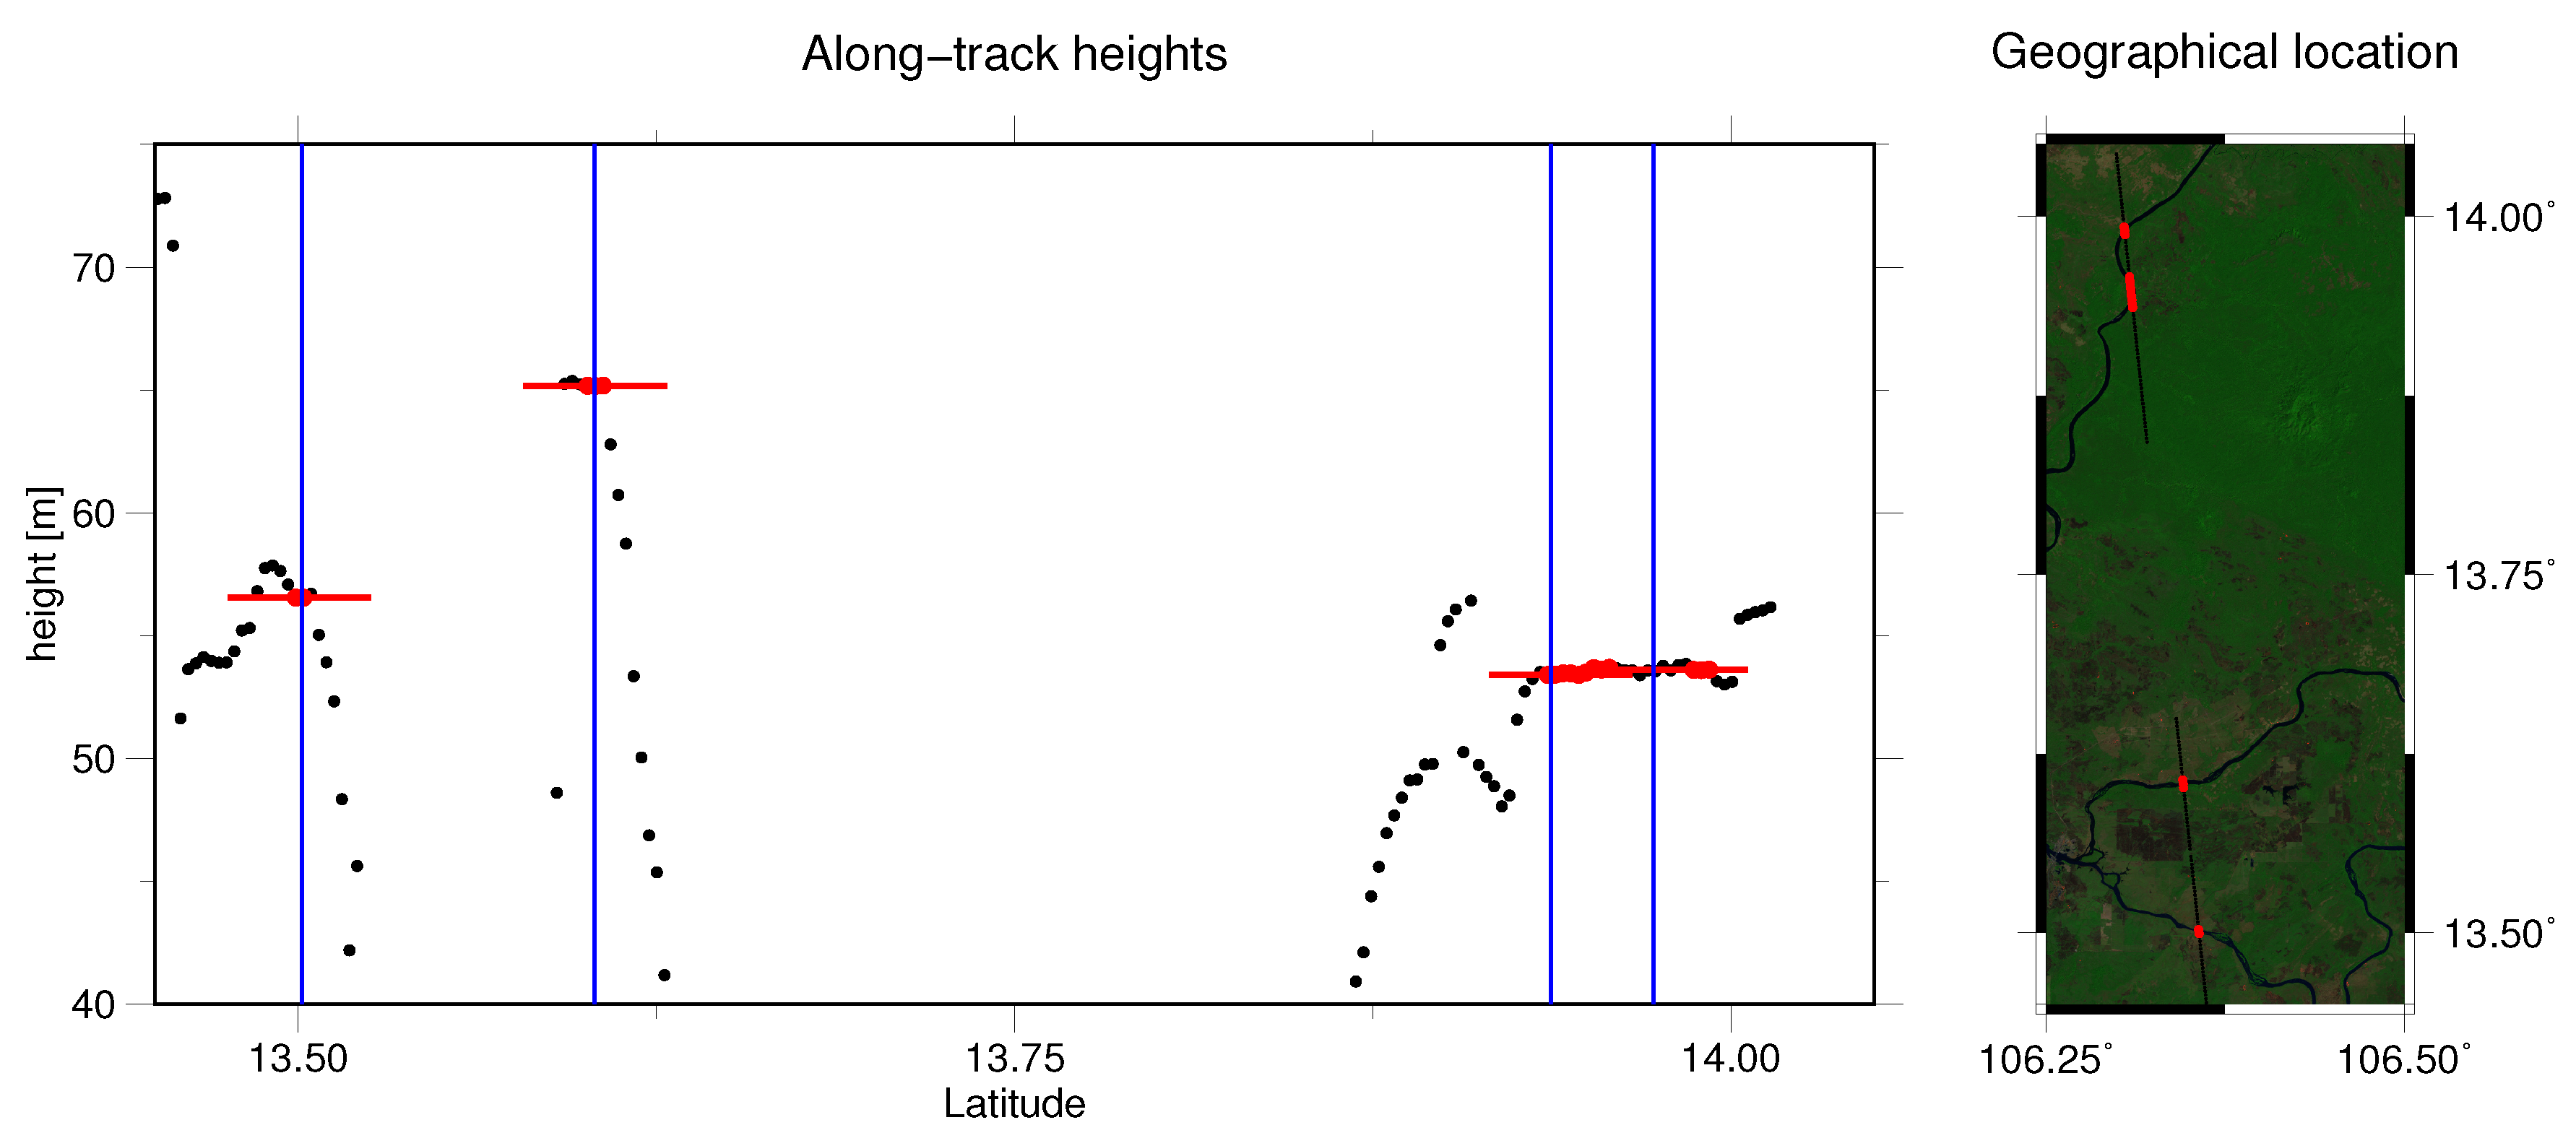
In Figure 6, a section of the river network in the upstream region with the results of the classification is shown. The course of the river is well depicted, however, not every crossing of the satellite track with the river water is identified. At some crossings no water reflection of the river is measured since the river is too narrow. On the other hand, some points classified as water are not close to the given polygon (blue line). However, the topography model (HydroSHEDs, as presented in Lehner et al. [30]) shown in the background indicates river valleys in the three circled areas. Therefore, one can assume that the classification is able to find rivers that are so small (down to 20 m width) that they are not present in the high-resolution river polygon provided by the MRC. Figure 7 shows the classification for one exemplary track in the upstream region. The measurements classified as water (red dots) line up to a nearly constant water level at all crossings of the satellite track with the river.
5.2. Resulting Water Level
In the entire Mekong Basin we estimate water levels at more than 2000 crossings, which means approximately one measurement every 4 km along the main river (compared to 50 km for Envisat). The water level was not measured at every crossing. As mentioned before, at some crossings the river was so small that a reliable measurement could not be made in every pass, and some other water levels were discarded during outlier detection. Furthermore, at some crossings the classification failed to identify the water. However, we are still able to retrieve at least some measurements from rivers as narrow as 20 m. In Figure 8 all measured heights at all dates are presented in a map, which shows the overall topography of the river network well but cannot show details like seasonal variations.
For one track the heights and the classification are displayed in Figure 7 with a Landsat map of the river network and the surrounding area. In this track four water crossings are found where the two most northern ones are very close together with a difference of the water level of 20 cm. There the river meanders under the track which causes two crossings close together. The two southern crossings belong to two different rivers which explains the large height difference. It is visible that only few measurements are used to estimate the water level at each crossing. Approximately 180 water levels (or 8%) are estimated by just one measurement, with the majority in the upstream region. Hence, the outlier detection is more important in this area. In the upstream region, the outlier detection removes 113 of 1740 water level observations; all of them are detected by the comparison with surrounding water level measurements. The comparison with water levels of the same pass reveals only 37 of the 113 outliers. In the middle region only 13 of 529 observations are rejected as outliers: 10 by the comparison with surrounding observations, 9 by the comparison with the same pass, and 6 by both outlier detections.
For crossings with more than one water measurement we can calculate the standard deviation of the measurements used for water level estimation. More than 85% of the water levels have a standard deviation of less than 0.5 m.
5.3. Validation
In this section both the classification and the water levels are validated. We test and validate the repeatability of the classification with cross-validation. The altimetric water levels cannot be validated against in situ gauge data without an absolute height reference as is common for short repeat time missions because no time series can be built from CryoSat-2 data without reducing the unknown topography of the river. Therefore, we validate the resulting water levels with respect to the stable seasonal signal and compare these results with the performance of Envisat water levels and CryoSat-2 data extracted with a land–water mask in the same validation.
5.3.1. Validation of the Classification
The classification is validated with a cross-validation. To this end, we cluster the data in a first step. The resulting classes are considered as the ’true’ classes. In the second step only parts of the data are clustered with the other parts classified in this second clustering. The cross-validation compares the resulting classifications of the two steps.
Table 2 summarizes the results of the cross-validation; water and non-water classes are distinguished. The overall accuracy is 97.9%. This cross-validation shows that the classification is stable and does not change with the data subset used for the clustering.
5.3.2. Validation of Water Levels
Unlike water level time series measured by short repeat time missions, CryoSat-2 measurements cannot be validated against the time series of in situ gauges without reducing the topography as done by [12]. The Mekong River and its tributaries have topography that is too complex to allow for reliable reduction. Besides this, the temporal overlap between the CryoSat-2 data and the gauge data is only about 1.5 years or even less (April 2011 until December 2012).
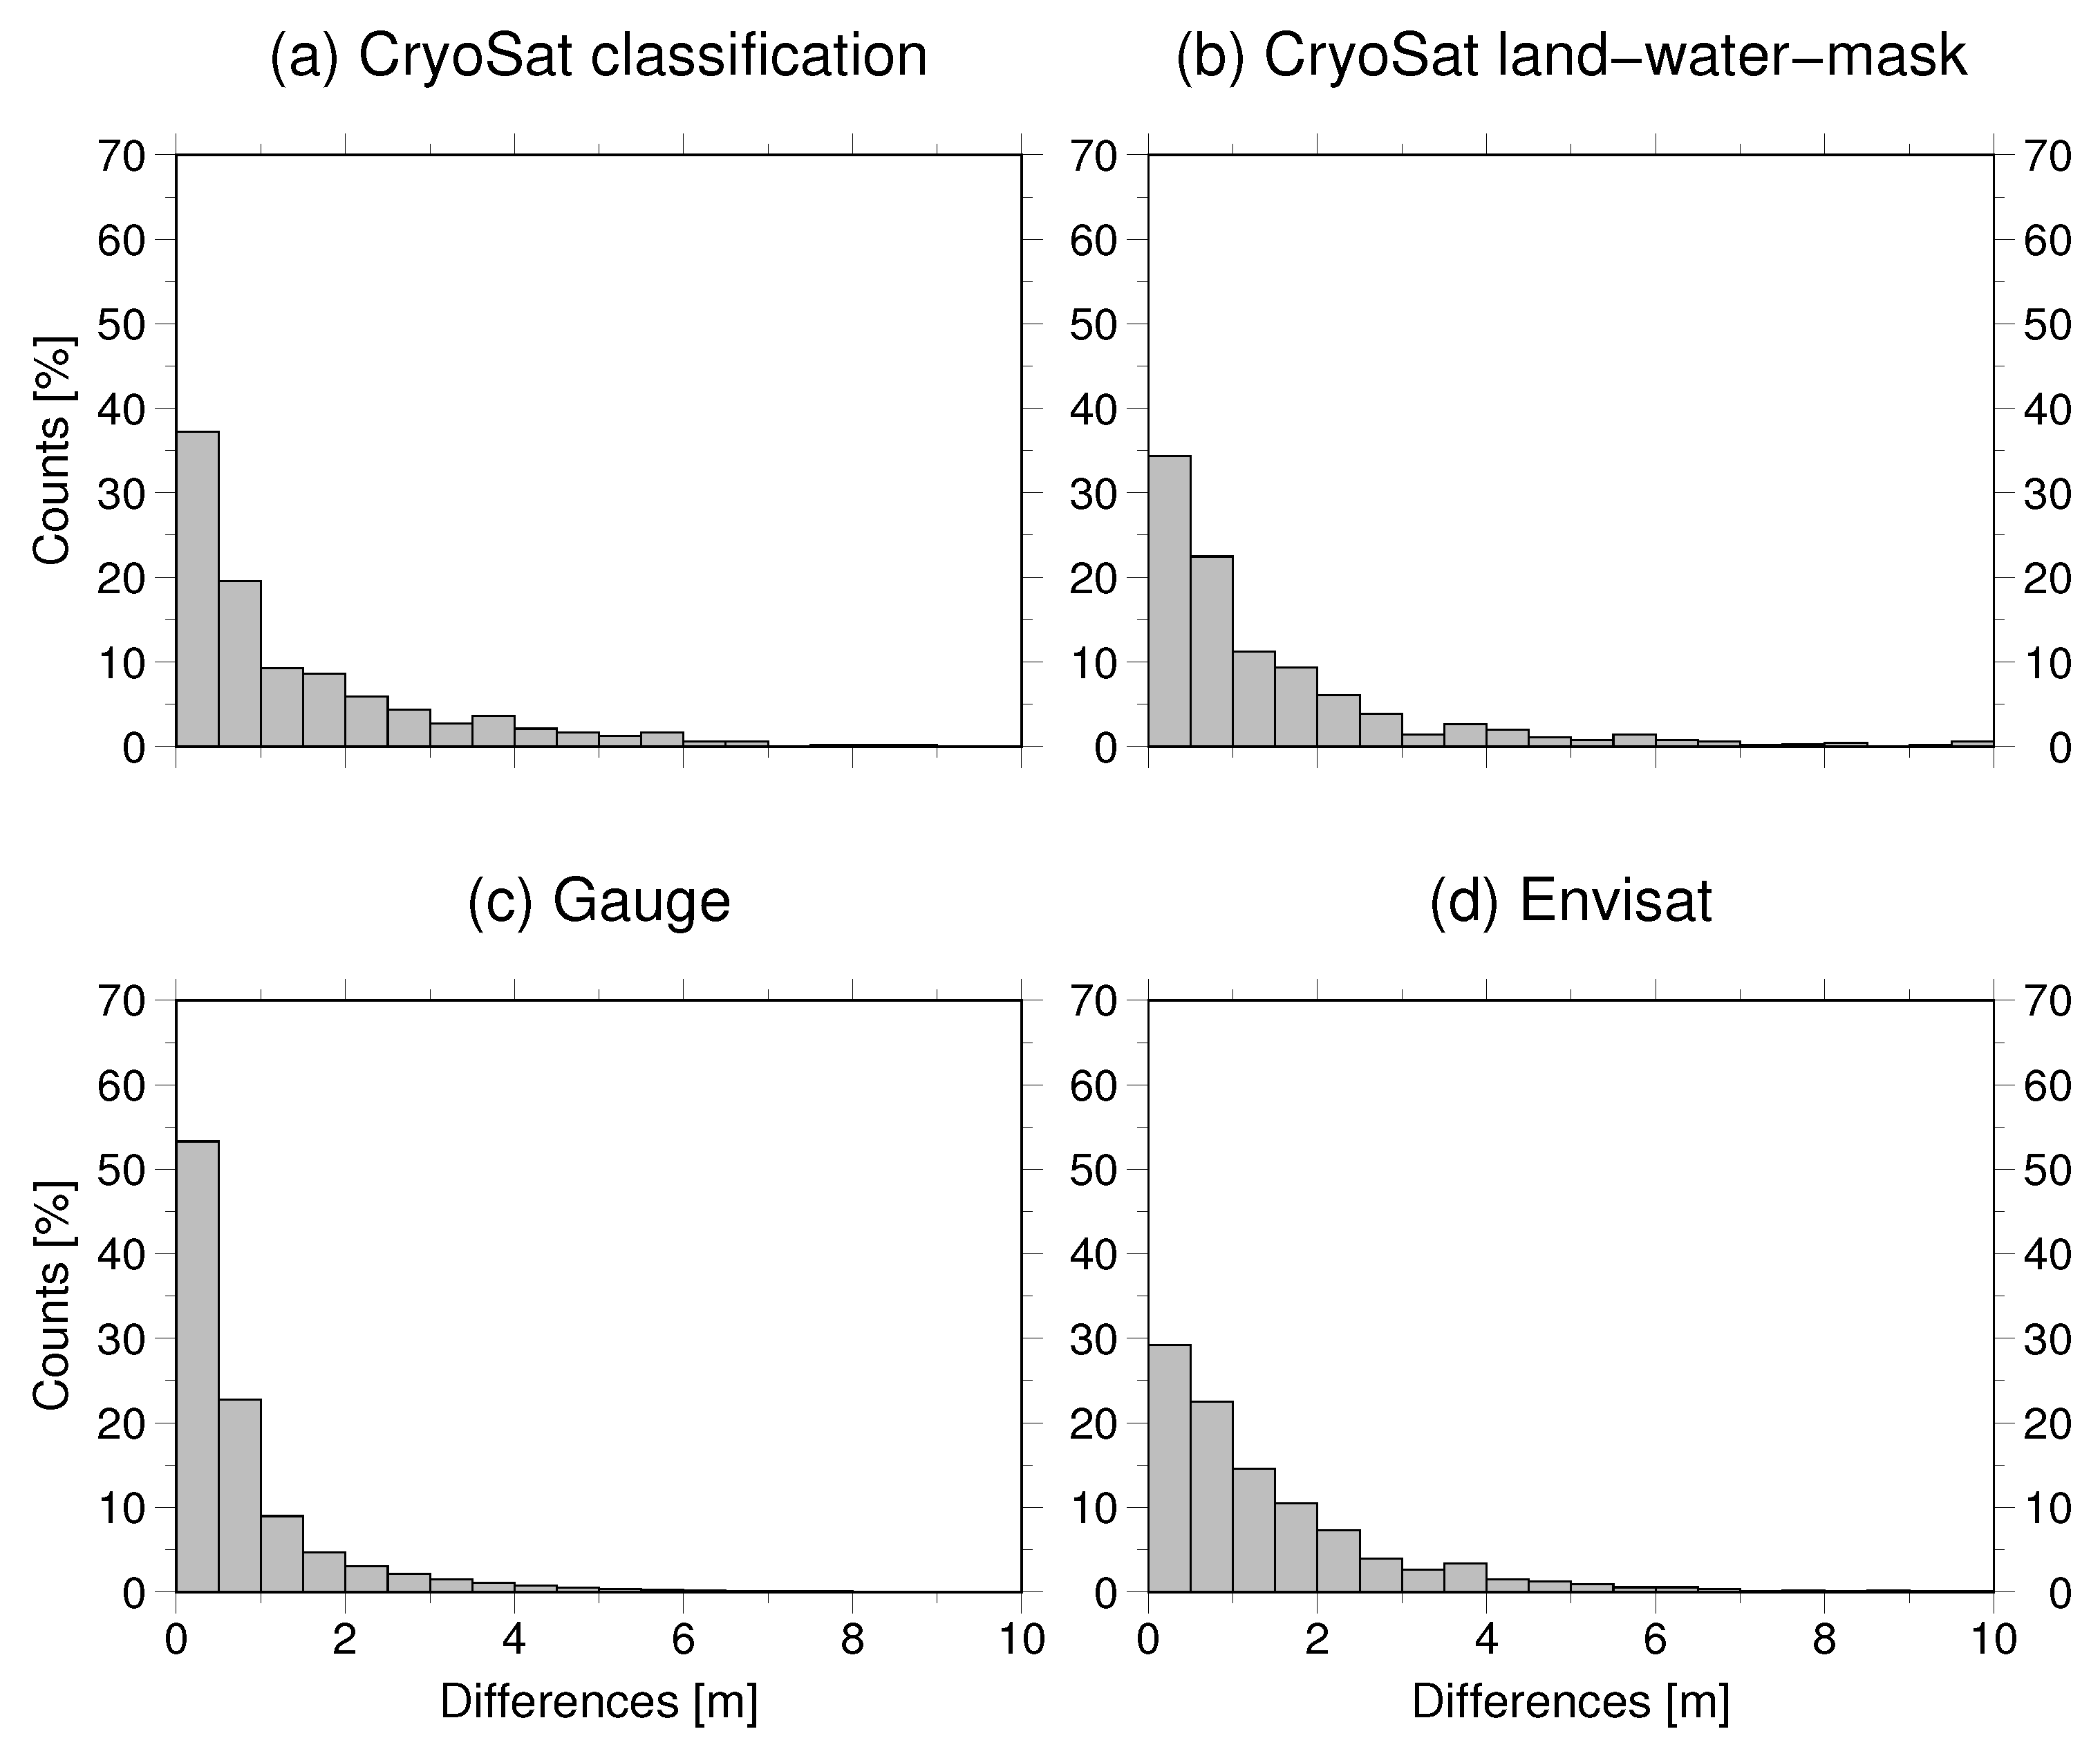
To validate the water levels we use the nearly one-year repeat time of CryoSat-2. We investigate the differences between two subsequent tracks at the same river crossing. A histogram of the differences is shown in Figure 9a. Table 3 displays the median, mean, and standard deviation of these differences for the merged results as well as for the two regions (upstream and middle) separately. The results of the validation are compared to a validation with in situ gauge data, Envisat data, and CryoSat-2 data with a land–water mask.
For this validation, we take the differences between gauge measurements that are 369 days apart and Envisat measurements where the day of the year has a less than 5-day difference. The gauges give a measure of how stable the annual signal is in the Mekong Basin, i.e., a benchmark on how small the differences between the water levels could be. The Envisat observations are the most commonly used data for inland waters with a pulse-limited altimeter. The comparison to the water levels which are derived from CryoSat-2 by simply averaging measurements inside the land–water mask allows for evaluation of the benefits of the classification approach. The land–water mask water levels underwent the same outlier detection as used on the results of the CryoSat-2 classification for better comparability. The median of the differences in Table 3 for the CryoSat-2 classification results are in both the upstream and the middle stream region better than the ones from the Envisat results. In the upstream region the improvements of the CryoSat-2 classification results compared to the Envisat results are more apparent than in the middle region where the validation results are more similar. However, the CryoSat-2 classification results have a higher standard deviation in the upstream regions, and thus larger differences than the Envisat results. The land–water mask approach for CryoSat-2 in the upstream region has even larger differences, which can also be seen in Figure 9. In the middle region no large differences between the validation of the two CryoSat-2 approaches are to be seen. The land–water mask approach yields to more valid water level observations in the middle region but at the same time also a higher number of outliers in both regions (see Table 4).
6. Discussion
In the results and validation section above we demonstrated the advantages and limitations of the classification approach for CryoSat-2 SAR data over the Mekong Basin. Compared to CryoSat-2 water levels extracted with a fixed land–water mask, the classification approach yields water levels with a higher quality according to the used measures with fewer outliers. The difference between the two approaches is most pronounced in the upstream region with rivers as small as 20 m in width. However, the land–water mask approach yields more water levels in the middle region. This reveals the opportunity that SAR altimetry provides for rivers in the Mekong Basin which are too small to be reliably identified in optical (e.g., Landsat, resolution: 30 m) or SAR (e.g., Sentinel-1, resolution: 10 m) images. As shown in Section 5.1 and Figure 6 the classification of SAR altimetry is able to identify rivers which are not visible in the land–water mask derived from satellite images. On the other hand, the classification fails to identify all crossings with a river, which leads to data gaps in the water level measurements. Some of the undetected rivers are very small and shadowed by surrounding river gorges. At other crossings the returning signal is too noisy and disturbed to be identified correctly even by visual inspection.
The better performance of the classification approach in the upstream part of the river is probably caused by the feature selection which is more focused on the reflective properties of small water bodies. The main drawback of the classification approach is its failure in the downstream area. The classification is not able to discern between river water and water in seasonal wetland regions. This problem can only be solved by using a high-resolution seasonal land–water mask that could be derived from Sentinel-1 or 2 data for example.
The existence of outliers after the classification process indicates a certain amount of misclassification. Some of these might be related to reflections from river banks, concrete areas, or other flat regions causing river-like waveforms. Moreover, water surfaces close to the river (such as paddy fields) can provoke outliers.
The inevitable outlier detection is challenging due to the long-repeat orbit of CryoSat-2 preventing the application of the usual virtual station concept. In this study, the outlier detection approach exploits the stable annual water level cycle within the Mekong Basin. Hence, this method is not transferable to other river systems with less stable annual signals. The second outlier detection approach of this study relies on a certain density of water level observations along the river. Without any observation close by a water level cannot be checked to be an outlier.
The validation inherits the problems of the outlier detection as no direct comparison with in situ gauge data is possible. As the gauge data has no absolute reference, not even the absolute height of CryoSat-2 water levels in the vicinity of a gauging station can be validated.
Using CryoSat-2 over rivers improves the knowledge for the river topography, as with this mission the spatial distribution of water level observations is much denser than with any prior satellite altimetry mission (as can be seen in Figure 8). Even small tributaries are observed successfully with CryoSat-2 SAR, which allows monitoring of the entire river network. However, this high spatial resolution entails a sparse repeat time and thus, precludes the application of the classical virtual station concept for data screening, interpretation, and validation.
Nevertheless, using the derived CryoSat-2 data set—in combination with short repeat altimetry mission results—for building a mathematical water level model (as done in [31]) or for assimilation in hydrological models [32] will certainly improve our knowledge of the water regime in the Mekong region.
7. Conclusions
We demonstrate in this study the advantages of CryoSat-2 SAR altimetry data for measuring rivers in the Mekong Basin identified by a classification which is independent of an accurate land–water mask. The classification uses features derived not only from the waveform but also from the RIP. The RIP contains more information about the reflecting surface than the waveform on its own can provide. This improves the classification and allows us to identify even very small rivers with a width as small as 20 m. In fact, the classification works better on medium and small rivers than on large rivers. The cross-validation of the classification shows that it is stable and repeatable. However, we were not able to use this classification to isolate the river in the downstream region where the Mekong River is surrounded by seasonal wetlands.
The classification in water and land measurements is used to derive water levels at the crossings of the CryoSat-2 track with a river in the whole Mekong Basin. Overall, more than 2000 water levels are measured, after outlier detection. However, it is not possible to derive a water level at every crossing. The altimeter is not able to measure a water return at every possible river crossing due to too-small rivers or overly-disturbed returns. Additionally, some measured water levels are discarded in the outlier detection.
The water levels are validated using the 369-day return time of CryoSat-2 and the very stable annual signal in the basin. The same validation is performed on Envisat water levels, gauge measurements, and by using a precise land–water mask on CryoSat-2 data. In particular, for small rivers in the upstream region the classification improves the water level determination compared to the use of a land–water mask: The median differences between consecutive passes in the upstream region are 0.79 m compared to 0.85 m for the land–water mask approach. The reduction of the standard deviation by a factor of four is even more significant. Moreover, the number of outliers is significantly smaller for the classification approach than for the land–water mask approach, with only 2% for the classification but 5.6% for the CryoSat-2 land–water mask.
Compared to Envisat water levels the CryoSat-2 water levels are of higher quality in the whole river basin due to the smaller footprint of the SAR compared to pulse-limited altimeter on Envisat. The median differences for Envisat are as high as 1.01 m in the upstream region, and 0.96 m for the whole basin (CryoSat-2 classification 0.76 m).
The classification of CryoSat-2 data allows to exploit the full along-track resolution of the data set. Therefore, it is possible to observe the water levels of rivers as small as 20 m that are usually not correctly mapped in land–water masks. Moreover, due to the dense spatial resolution of CryoSat-2 most of the smaller tributaries are observed, which is not possible with the short repeat missions Envisat, SARAL, or Jason-2 and Jason-3. Information on the water level variations for all rivers within the basin helps to further understand the hydrology of the river network.
The resulting water levels of this study will be used in combination with other altimetric water levels following the ideas of [31] to build basin-wide multi-mission water level time series. With CryoSat-2 data we will be able to significantly improve the spatial resolution of the water level observations and better close the data gap between the end of the Envisat mission and the launch of the SARAL mission. Since the launch of Sentinel-3A in February 2016, SAR altimetry data with a short repeat time of 27 days has been available. This enables testing of the transferability of the application and validation of the proposed classification approach based on a new data set.
Acknowledgments
We want to thank the ESA GPOD team who provided us with the full data set through the SARvatore database and who were very helpful with questions regarding the data. This work was supported by the German Research Foundation (DFG) through the TUM International Graduate School of Science and Engineering (IGSSE) and the Technical University of Munich (TUM) in the framework of the Open Access Publishing Program.
Author Contributions
Eva Boergens developed the method, conducted the data analysis, and wrote the majority of the paper. Karina Nielsen helped with the development of the method and validation. Ole B. Andersen and Denise Dettmering contributed to the discussion of the method and results and the writing of the manuscript. Florian Seitz supervised the research and contributed to manuscript writing and organization.
Conflicts of Interest
The authors declare that they have no conflict of interest.
Appendix A. Mean Waveforms and RIPs
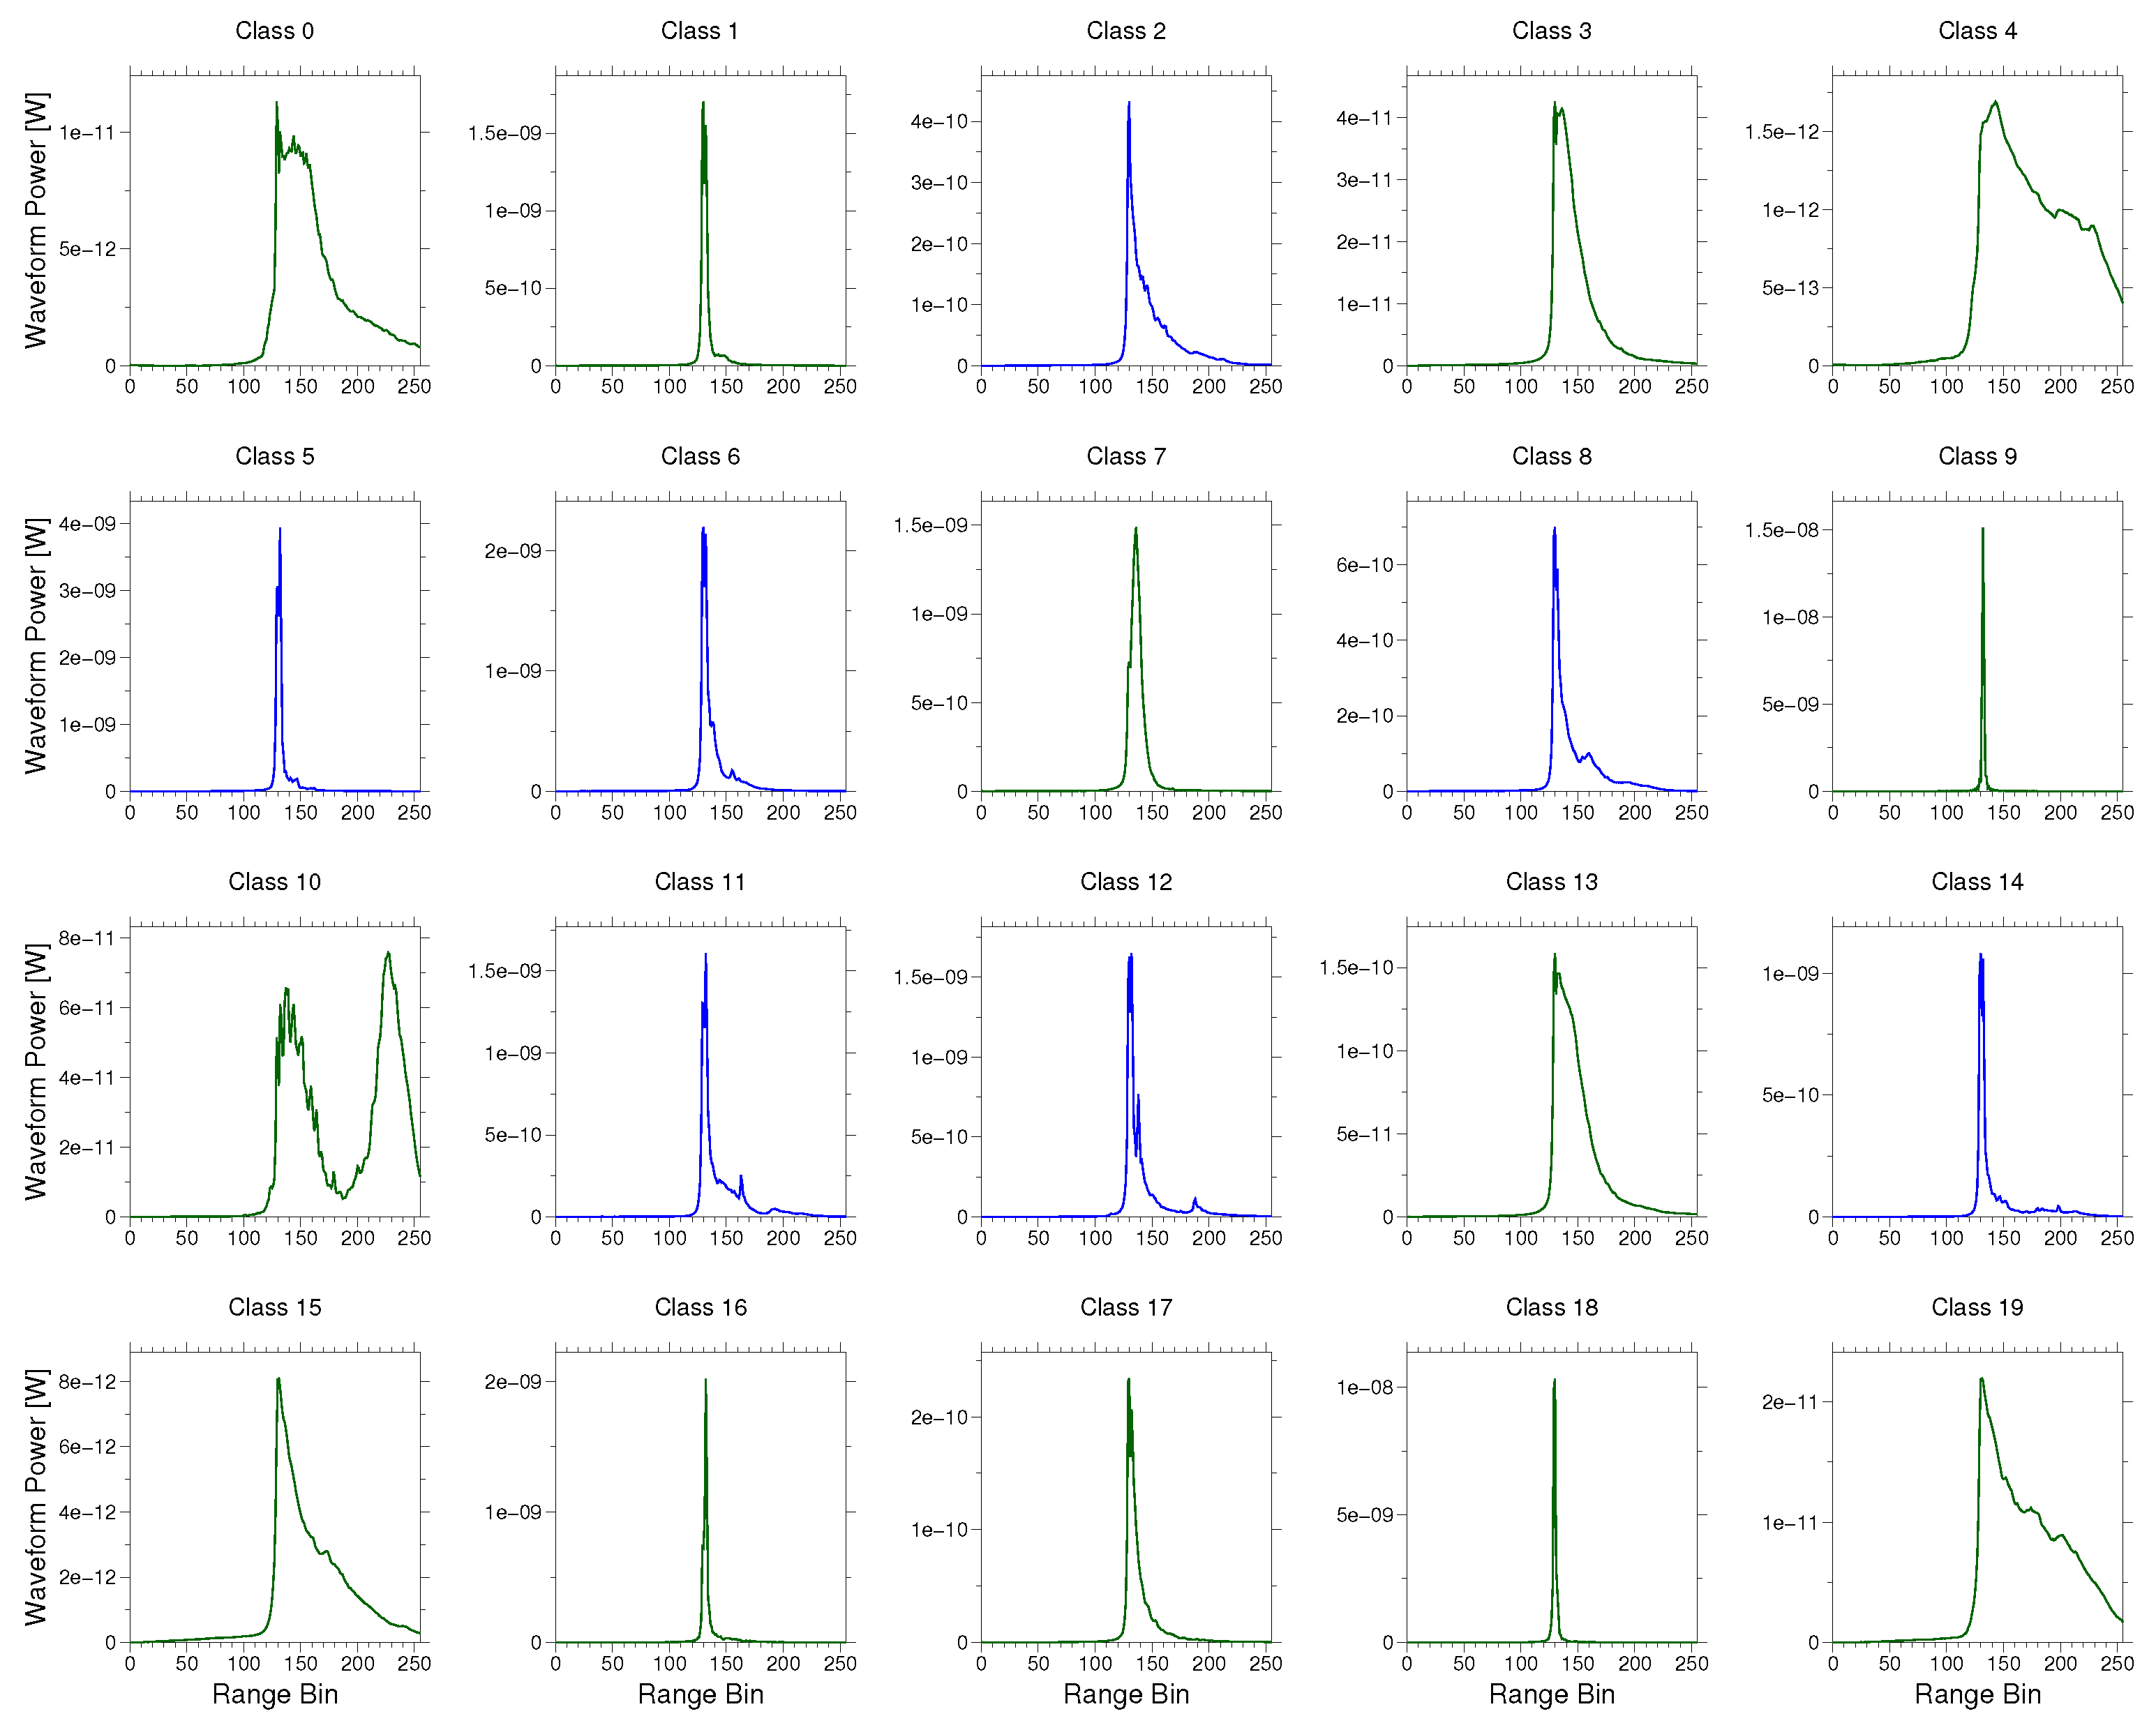
Figure A1.
Upstream region mean waveforms. Water classes: 0, 4, 13.
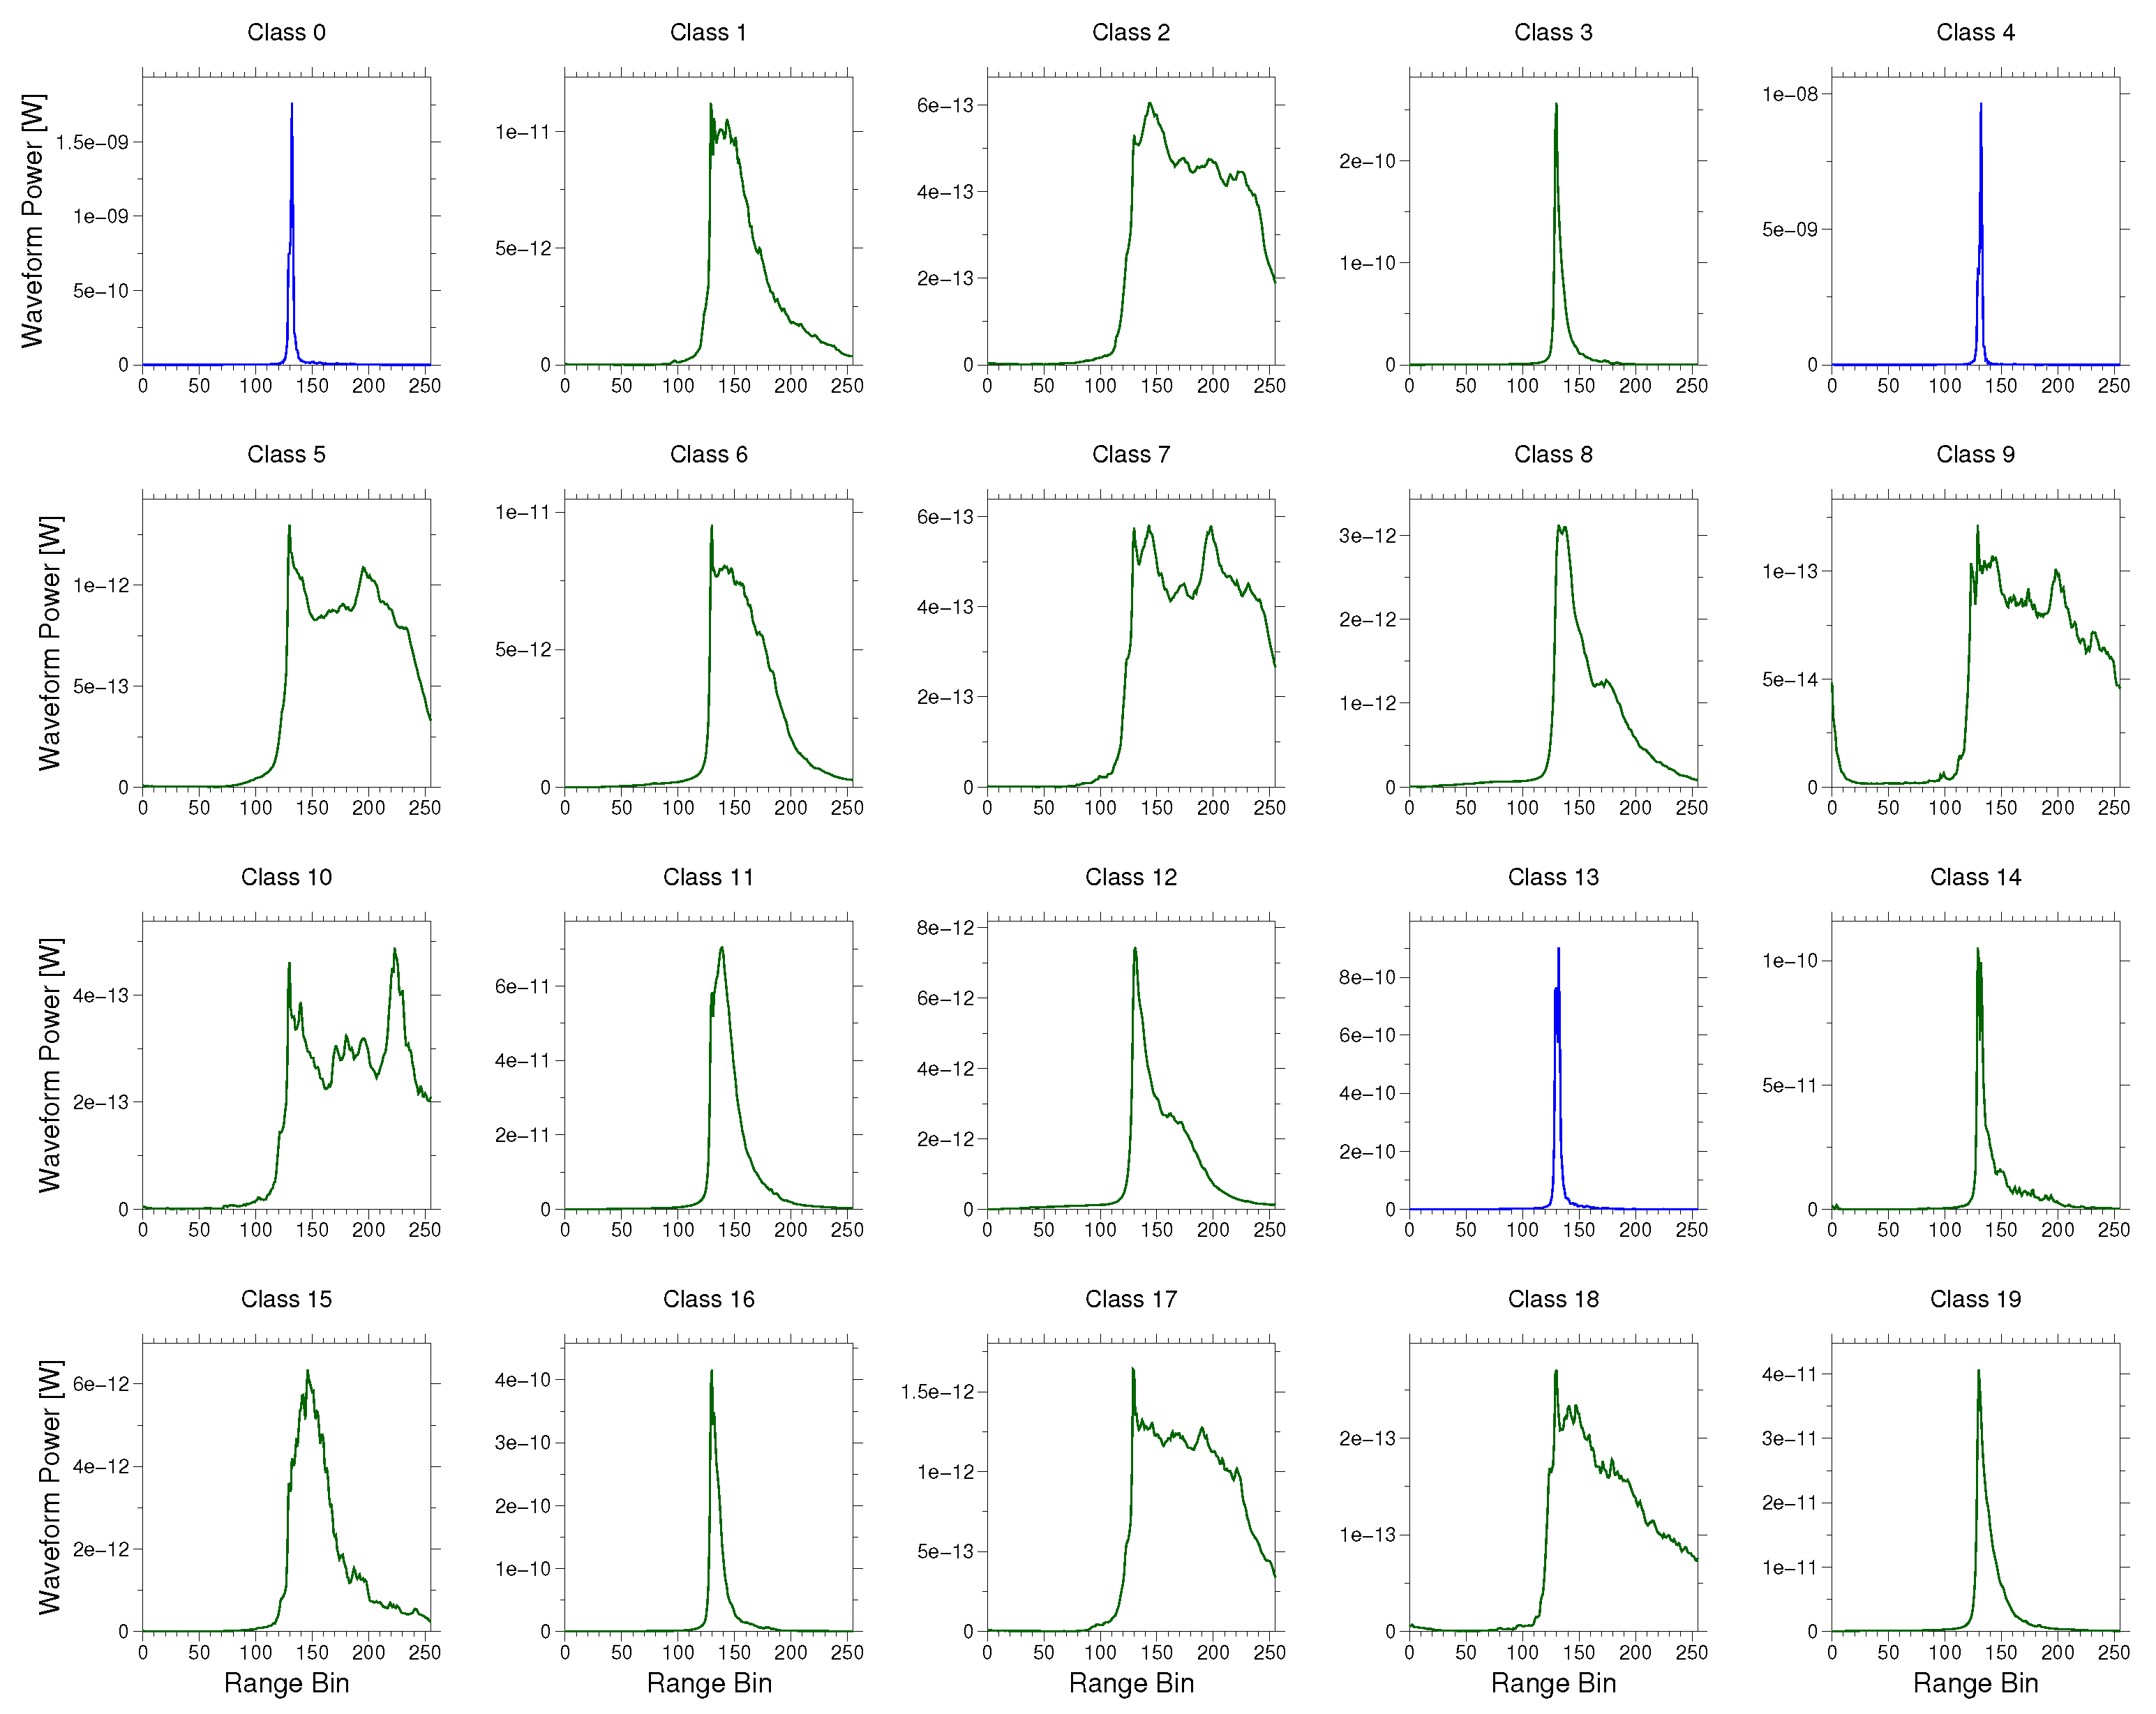
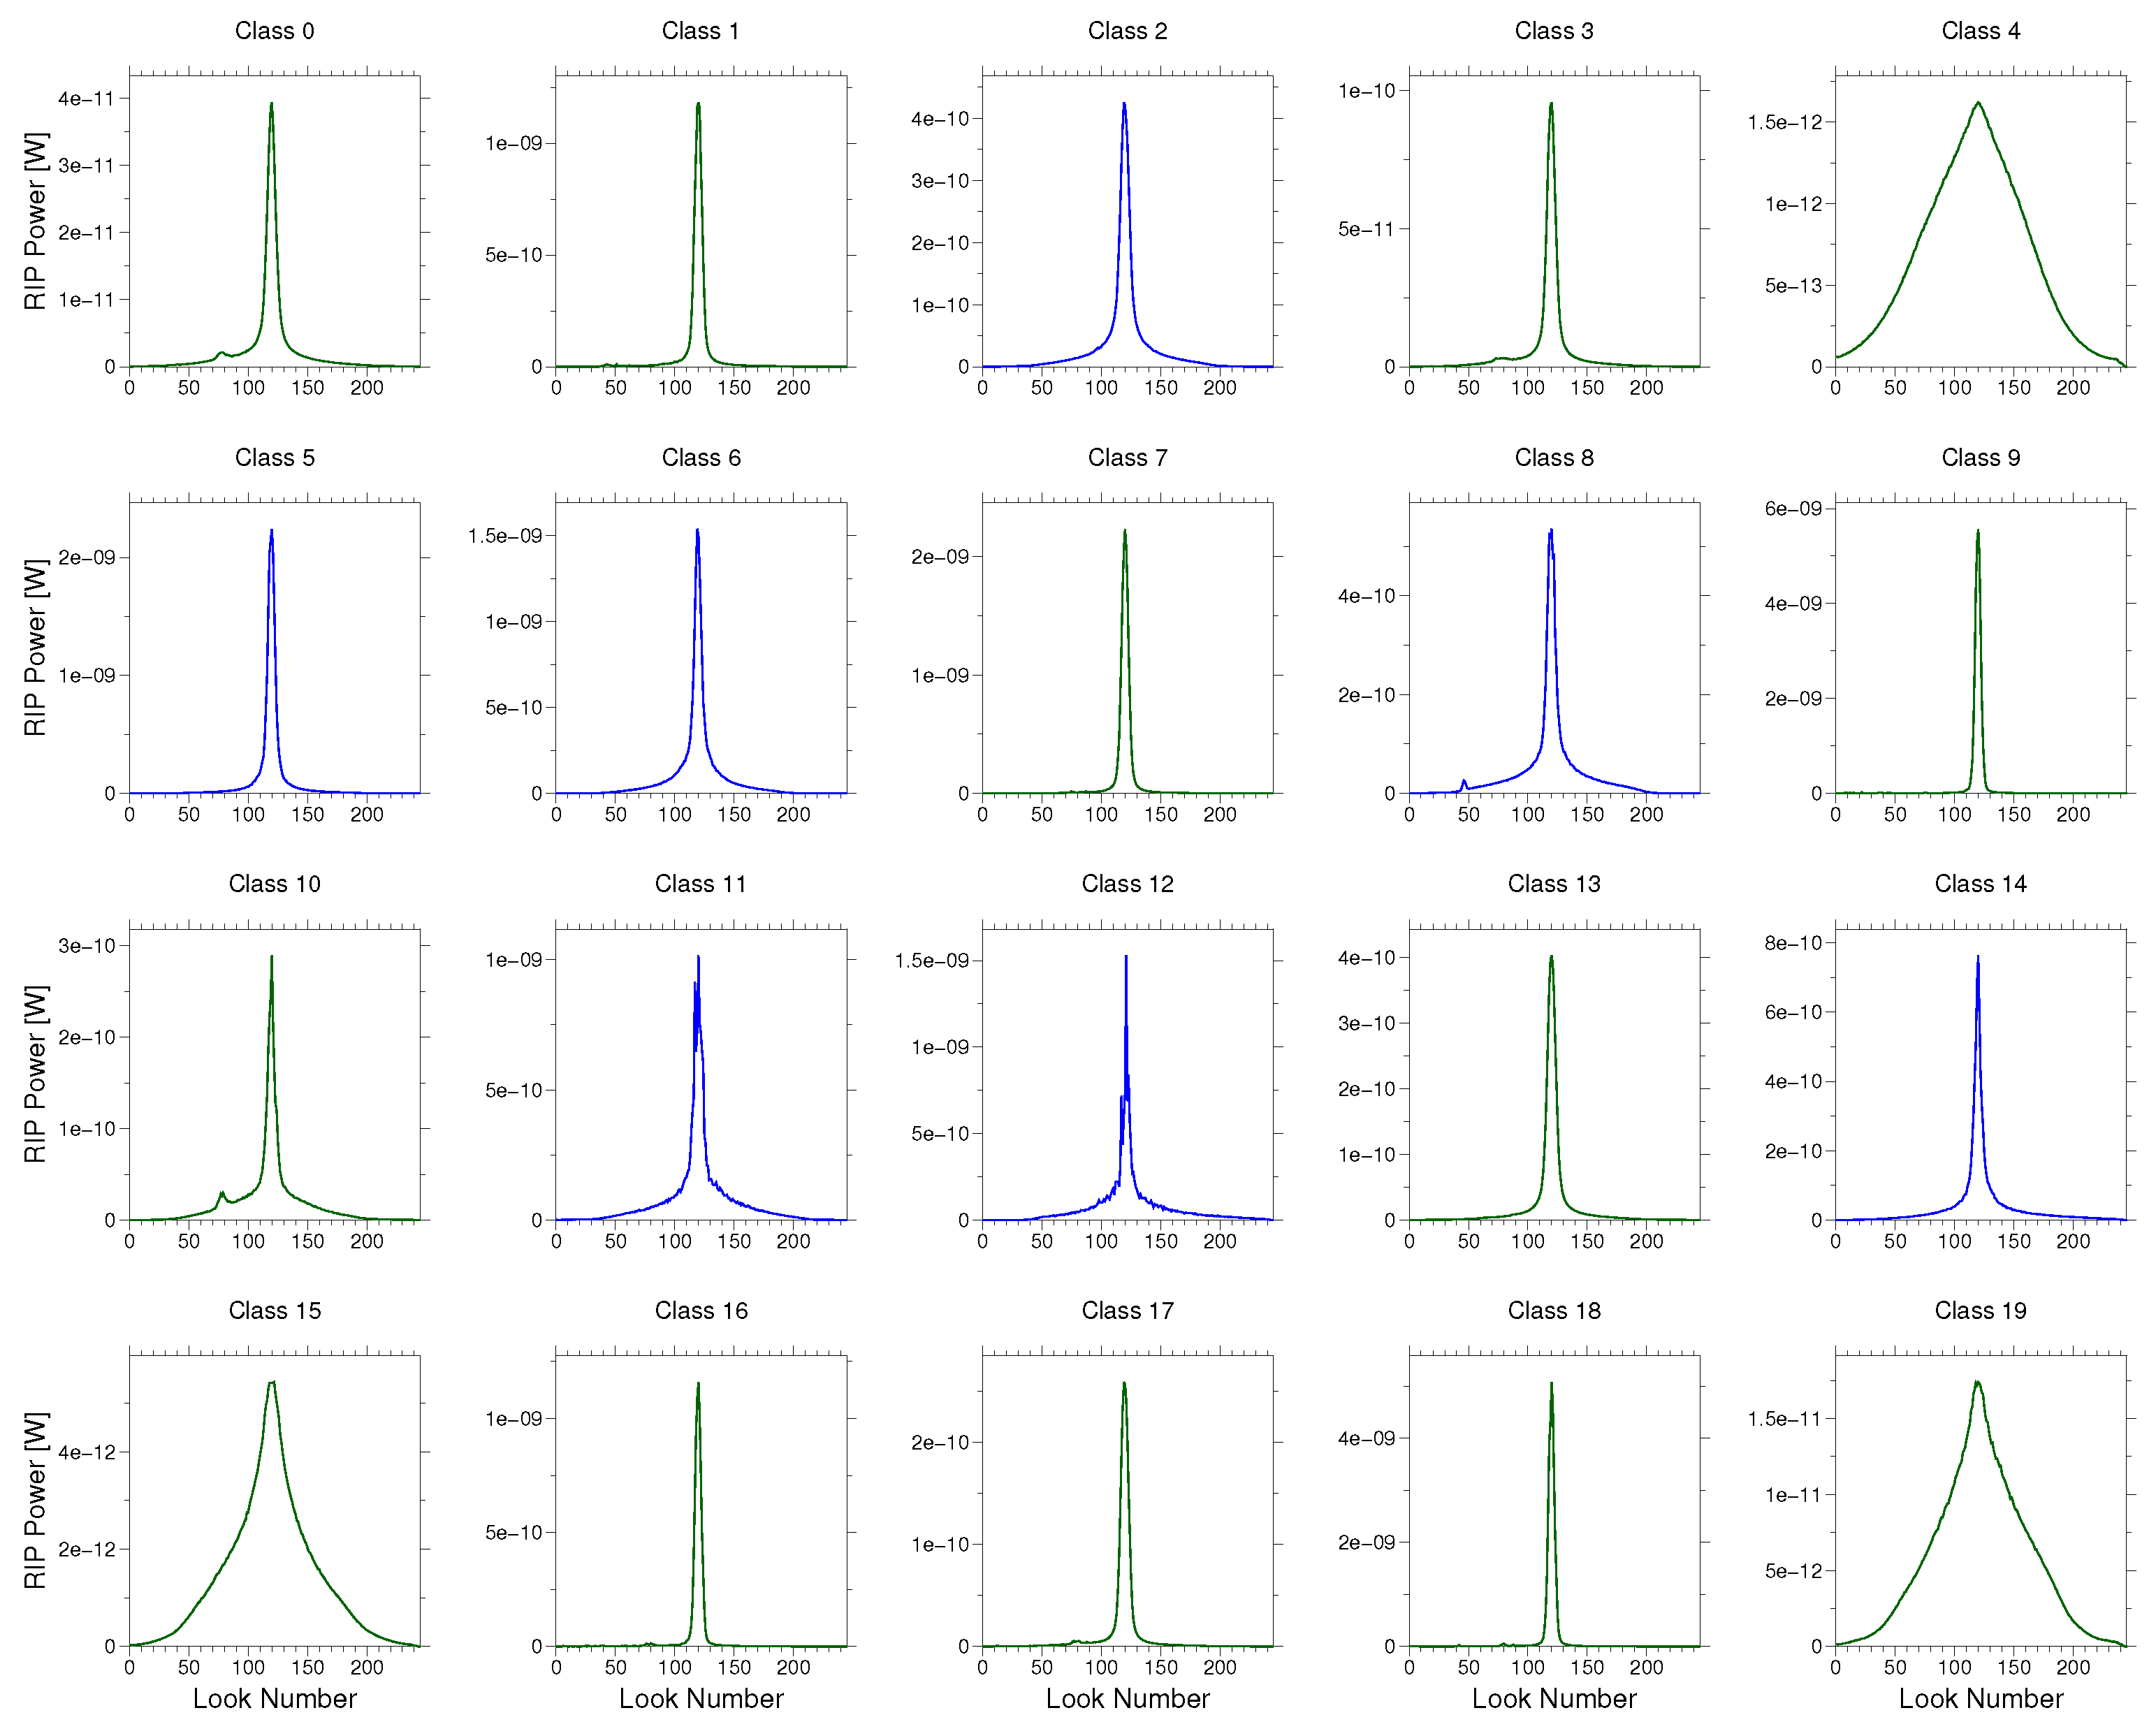
Figure A2.
Upstream region mean RIPs. Water classes: 0, 4, 13.

Figure A3.
Middle region mean waveforms. Water classes: 2, 5, 6, 8, 11, 12, 14.

Figure A4.
Middle region mean RIPs. Water classes: 2, 5, 6, 8, 11, 12, 14.
References
- Global Runoff Data Center. Long-Term Mean Monthly Discharges and Annual Characteristics of GRDC Stations; Technical Report; Federal Institute of Hydrology: Koblenz, Germany, 2013. [Google Scholar]
- Birkett, C.M. Contribution of the TOPEX NASA radar altimeter to the global monitoring of large rivers and wetlands. Water Resour. Res. 1998, 34, 1223–1239. [Google Scholar] [CrossRef]
- Santos da Silva, J.; Calmant, S.; Seyler, F.; Rotunno Filho, O.C.; Cochonneau, G.; Mansur, W.J. Water levels in the Amazon basin derived from the ERS-2 and ENVISAT radar altimetry missions. Remote Sens. Environ. 2010, 114, 2160–2181. [Google Scholar] [CrossRef]
- Schwatke, C.; Dettmering, D.; Bosch, W.; Seitz, F. DAHITI—An innovative approach for estimating water level time series over inland waters using multi-mission satellite altimetry. Hydrol. Earth Syst. Sci. 2015, 19, 4345–4364. [Google Scholar] [CrossRef]
- Boergens, E.; Dettmering, D.; Schwatke, C.; Seitz, F. Treating the Hooking Effect in satellite altimetry data: A case study along the Mekong River and its tributaries. Remote Sens. 2016, 8, 91. [Google Scholar] [CrossRef]
- Frappart, F.; Do Minh, K.; L’Hermitte, J.; Cazenave, A.; Ramillien, G.; Le Toan, T.; Mognard-Campbell, N. Water volume change in the lower Mekong from satellite altimetry and imagery data. Geophys. J. Int. 2006, 167, 570–584. [Google Scholar] [CrossRef]
- Biancamaria, S.; Frappart, F.; Leleu, A.S.; Marieu, V.; Blumstein, D.; Desjonquères, J.D.; Boy, F.; Sottolichio, A.; Valle-Levinson, A. Satellite radar altimetry water elevations performance over a 200 m wide river: Evaluation over the Garonne River. Adv. Space Res. 2016, 59, 1–19. [Google Scholar]
- Raney, R.K. The delay/doppler radar altimeter. IEEE Trans. Geosci. Remote Sens. 1998, 36, 1578–1588. [Google Scholar] [CrossRef]
- Nielsen, K.; Stenseng, L.; Andersen, O.B.; Villadsen, H. Validation of CryoSat-2 SAR mode based lake levels. Remote Sens. Environ. 2015, 171, 162–170. [Google Scholar] [CrossRef] [Green Version]
- Kleinherenbrink, M.; Lindenbergh, R.C.; Ditmar, P.G. Monitoring of lake level changes on the Tibetan Plateau and Tian Shan by retracking Cryosat SARIn waveforms. J. Hydrol. 2015, 521, 119–131. [Google Scholar] [CrossRef]
- Göttl, F.; Dettmering, D.; Müller, F.L.; Schwatke, C. Lake level estimation based on CryoSat-2 SAR altimetry and multi-looked waveform classification. Remote Sens. 2016, 8, 1–16. [Google Scholar] [CrossRef]
- Villadsen, H.; Andersen, O.B.; Stenseng, L.; Nielsen, K.; Knudsen, P. CryoSat-2 altimetry for river level monitoring—Evaluation in the Ganges-Brahmaputra River basin. Remote Sens. Environ. 2015, 168, 80–89. [Google Scholar] [CrossRef]
- Bercher, N.; Dinardo, S.; Lucas, B.M.; Fleury, S.; Picot, N. A review of cryosat-2/siral applications for the monitoring of river water levels. ESA Living Planet 2013, 2013, 1–7. [Google Scholar]
- Berry, P.A.M.; Garlick, J.D.; Freeman, J.A.; Mathers, E.L. Global inland water monitoring from multi-mission altimetry. Geophys. Res. Lett. 2005, 32, 1–4. [Google Scholar] [CrossRef]
- Desai, S.; Chander, S.; Ganguly, D.; Chauhan, P.; Lele, P.; James, M. Waveform Classification and Water-Land Transition over the Brahmaputra River using SARAL/AltiKa & Jason-2 Altimeter. Indian Soc. Remote Sens. 2015, 43, 475–485. [Google Scholar]
- Dettmering, D.; Schwatke, C.; Boergens, E.; Seitz, F. Potential of ENVISAT Radar Altimetry for Water Level Monitoring in the Pantanal Wetland. Remote Sens. 2016, 8, 596. [Google Scholar] [CrossRef]
- Villadsen, H.; Deng, X.; Andersen, O.B.; Stenseng, L.; Nielsen, K.; Knudsen, P. Improved inland water levels from SAR altimetry using novel empirical and physical retrackers. J. Hydrol. 2016, 537, 234–247. [Google Scholar] [CrossRef] [Green Version]
- Armitage, T.W.K.; Davidson, M.W.J. Using the interferometric capabilities of the ESA CryoSat-2 mission to improve the accuracy of sea ice freeboard retrievals. IEEE Trans. Geosci. Remote Sens. 2014, 52, 529–536. [Google Scholar] [CrossRef]
- Wingham, D.J.; Francis, C.R.; Baker, S.; Bouzinac, C.; Brockley, D.; Cullen, R.; de Chateau-Thierry, P.; Laxon, S.W.; Mallow, U.; Mavrocordatos, C.; et al. CryoSat: A mission to determine the fluctuations in Earth’s land and marine ice fields. Adv. Space Res. 2006, 37, 841–871. [Google Scholar] [CrossRef]
- MacQueen, J. Some methods for classification and analysis of multivariate observations. Proc. Fifth Berkeley Symp. Math. Stat. Probab. 1967, 1, 281–297. [Google Scholar]
- Mekong River Commission (Ed.) Overview of the Hydrology of the Mekong Basin; Mekong River Commission: Phnom Penh, Cambodia, 2005. [Google Scholar]
- ESA. CryoSat-2 Geographical Mode Mask; ESA: Paris, France, 2016. [Google Scholar]
- Scagliola, M. CryoSat Footprints. 2013. Available online: https://earth.esa.int/documents/10174/125271/CryoSat_Footprints_TN_v1.1.pdf/2a5d996b-8b77-4d1c-ae7b-fbf93848c35d;jsessionid=B1FF8C50A1B0F2A0879F6FA028844644.eodisp-prod4040?version=1.0 (accessed on 23 November 2017).
- Cullen, R.A.; Wingham, D.J. CryoSat Level 1b Processing Algorithms and Simulation Results. In Proceedings of the 2002 IEEE International Geoscience and Remote Sensing Symposium, Toronto, ON, Canada, 24–28 June 2002; pp. 1762–1764. [Google Scholar]
- Laxon, S.W. Sea-Ice Altimeter Processing Scheme at the EODC. Int. J. Remote Sens. 1994, 15, 915–924. [Google Scholar] [CrossRef]
- Gommenginger, C.; Thibaut, P.; Fenoglio-Marc, L.; Quartly, G.; Deng, X.; Gómez-Enri, J.; Challenor, P.; Gao, Y. Retracking altimeter waveforms near the coasts. In Coastal Altimetry; Benveniste, J., Cipollini, P., Kostianoy, A.G., Vignudelli, S., Eds.; Springer: Berlin, Germany, 2011; pp. 61–101. [Google Scholar]
- Doane, D.P. Aesthetic frequency classifications. Am. Stat. 1976, 30, 181–183. [Google Scholar]
- Sturges, H. The choice of a class interval. J. Am. Stat. Assoc. 1926, 21, 65–66. [Google Scholar] [CrossRef]
- Mekong River Commision. Annual Mekong Flood Report 2008; Mekong River Commission: Phnom Penh, Cambodia, 2009. [Google Scholar]
- Lehner, B.; Verdin, K.; Jarvis, A. New global hydrography derived from spaceborne elevation data. Eos 2008, 89, 93–94. [Google Scholar] [CrossRef]
- Boergens, E.; Buhl, S.; Dettmering, D.; Klüppelberg, C.; Seitz, F. Combination of multi-mission altimetry data along the Mekong River with spatio-temporal kriging. J. Geodesy 2017, 91, 519–534. [Google Scholar] [CrossRef]
- Schneider, R.; Nygaard Godiksen, P.; Villadsen, H.; Madsen, H.; Bauer-Gottwein, P. Application of CryoSat-2 altimetry data for river analysis and modelling. Hydrol. Earth Syst. Sci. 2017, 21, 751–764. [Google Scholar] [CrossRef]
Figure 1.
Processing steps used in this study for extracting water levels from the CryoSat-2 synthetic-aperture radar (SAR) data. RIP: range-integrated power.
Figure 1.
Processing steps used in this study for extracting water levels from the CryoSat-2 synthetic-aperture radar (SAR) data. RIP: range-integrated power.

Figure 2.
Map of the study area with the regional masks (black areas with different hachures) and the SAR mode mask with their validity period (red boxes).
Figure 2.
Map of the study area with the regional masks (black areas with different hachures) and the SAR mode mask with their validity period (red boxes).
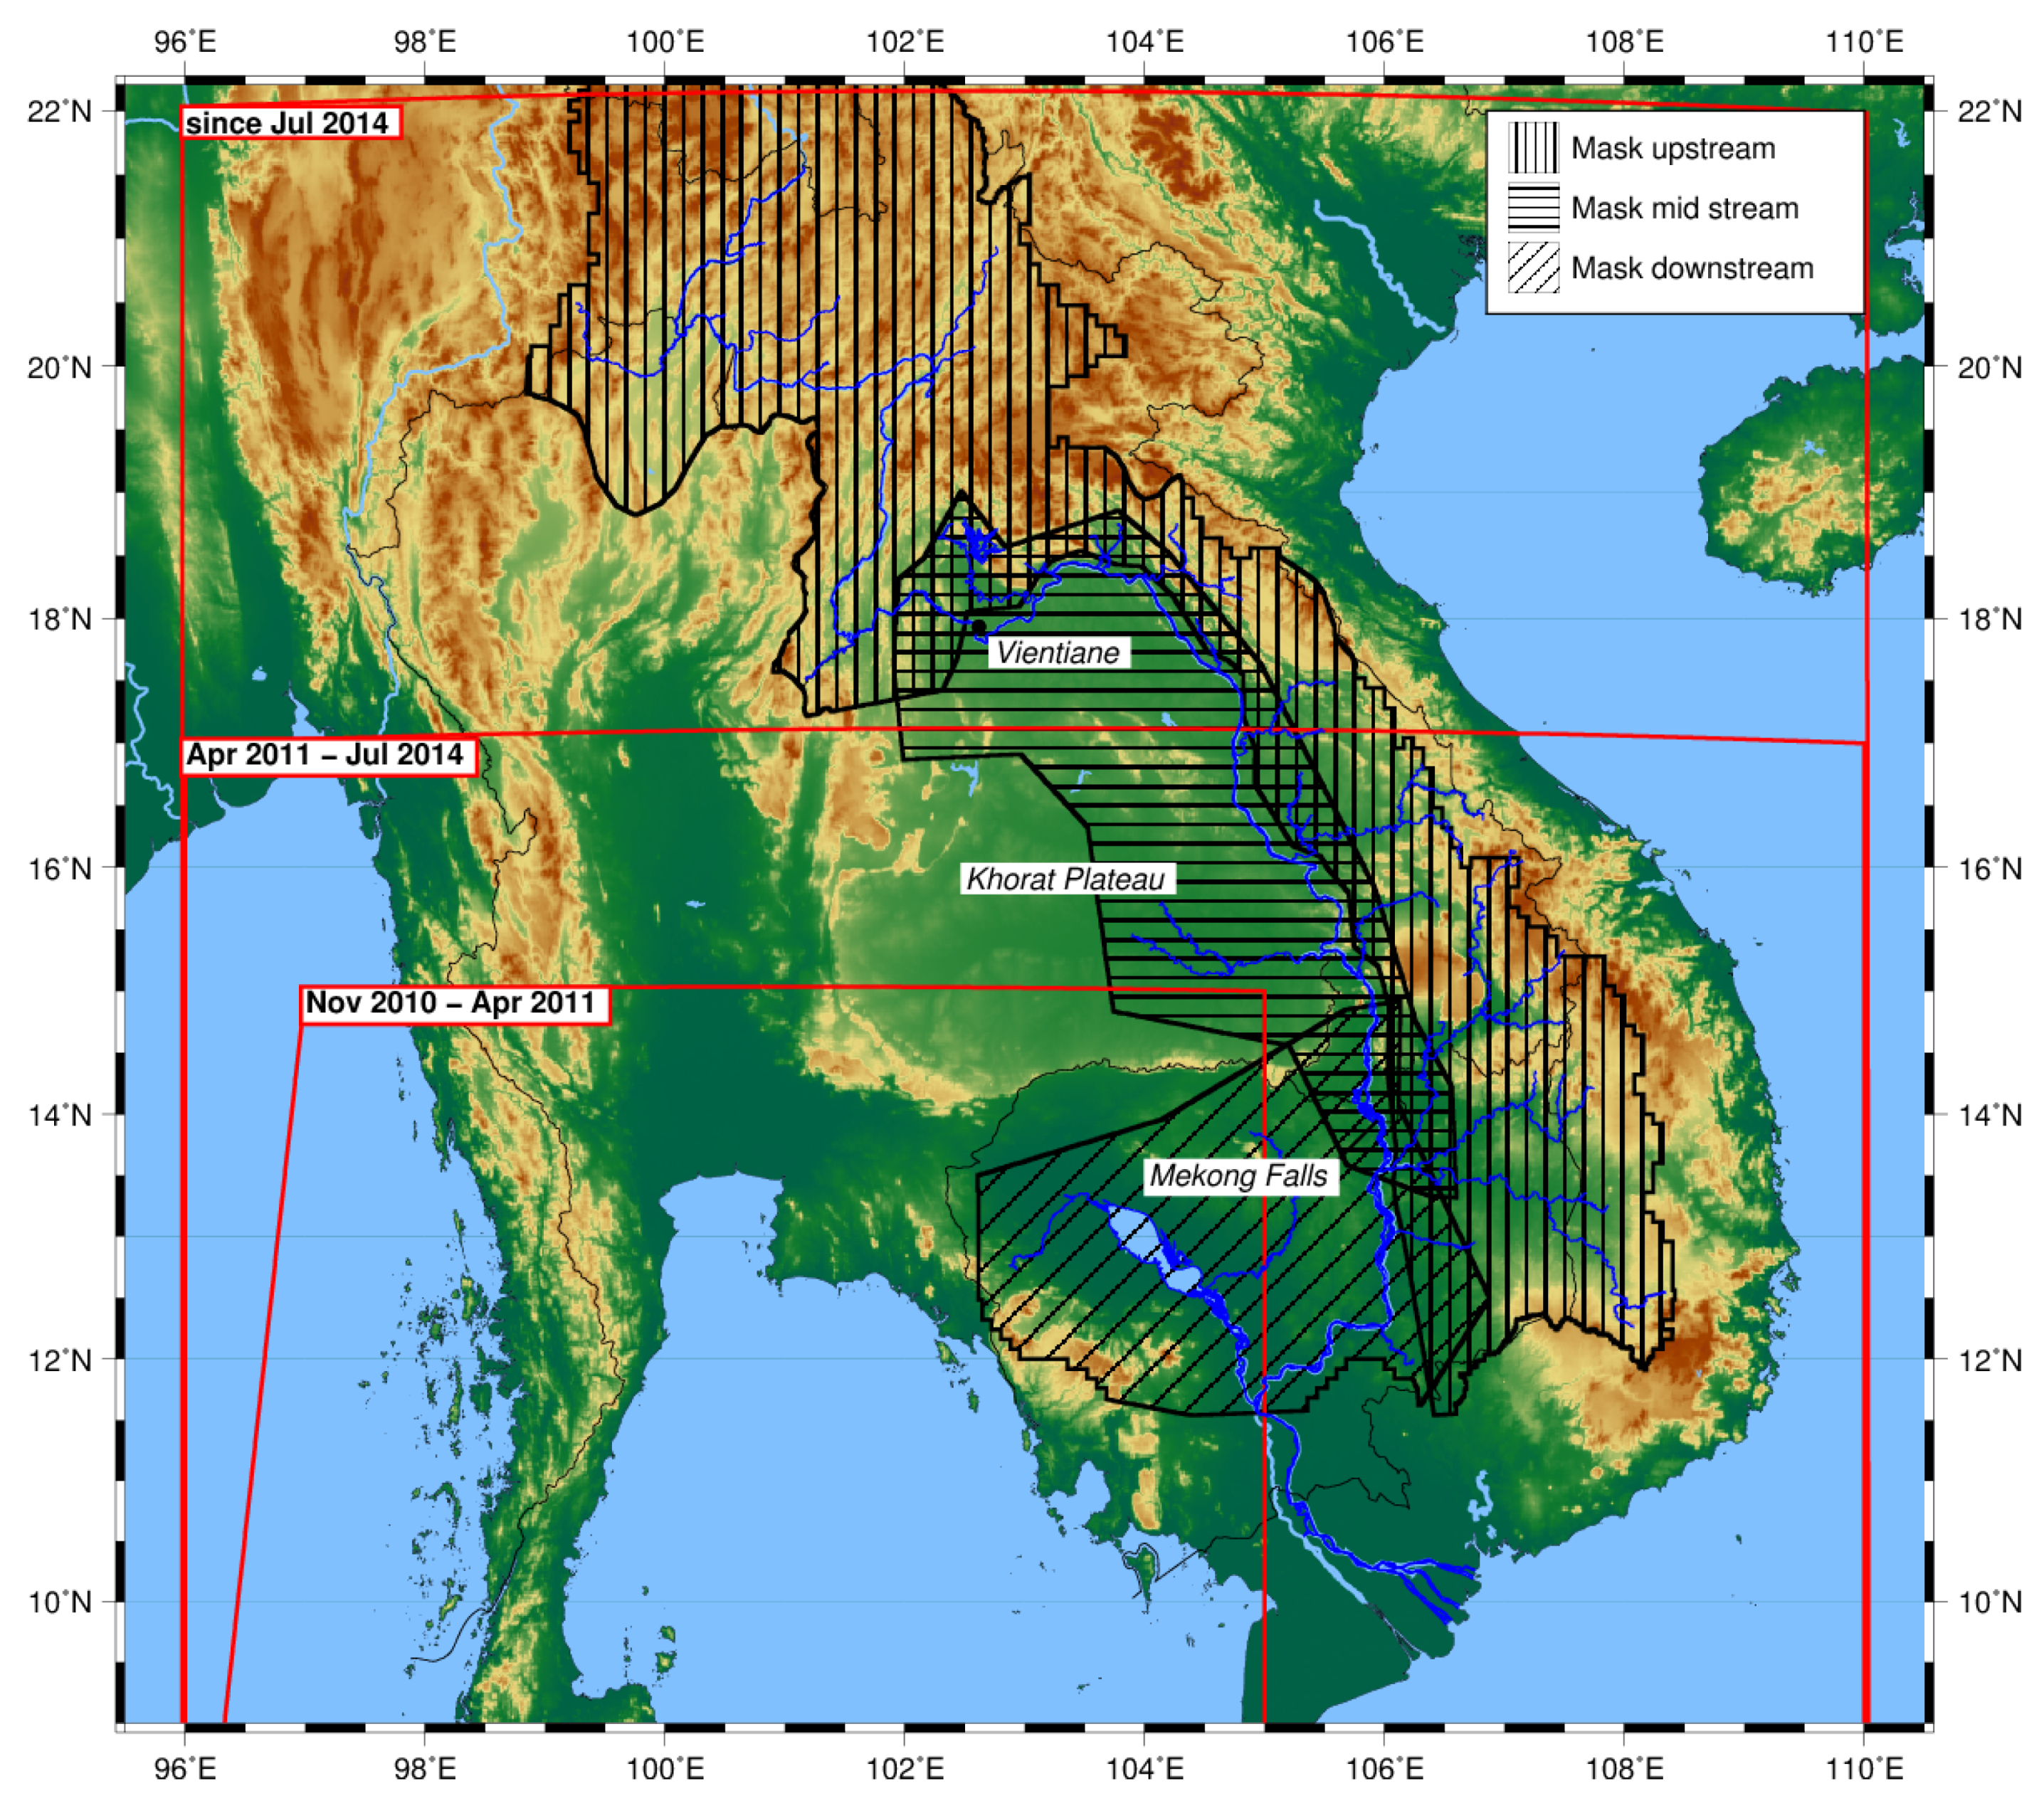
Figure 3.
Two exemplary stack matrices with their RIP and waveform. The color of the stack plot indicates the power of the signal. The example on the left-hand side is measured over the Tonle Sap lake, the one on the right-hand side over a medium upstream river.
Figure 3.
Two exemplary stack matrices with their RIP and waveform. The color of the stack plot indicates the power of the signal. The example on the left-hand side is measured over the Tonle Sap lake, the one on the right-hand side over a medium upstream river.

Figure 4.
One example of a waveform and the corresponding RIP with some of their derived features.

Figure 5.
The mean waveforms and RIP of some selected classes; the waveforms and RIP above each other belong to the same class.
Figure 5.
The mean waveforms and RIP of some selected classes; the waveforms and RIP above each other belong to the same class.

Figure 6.
An example of the classification. The red dots are classified as water measurements, and black lines are the land-classified measurements. The three circles indicate areas where water was detected in river valleys which are not included in the river polygon. The background shows the HydroSHEDs topography model.
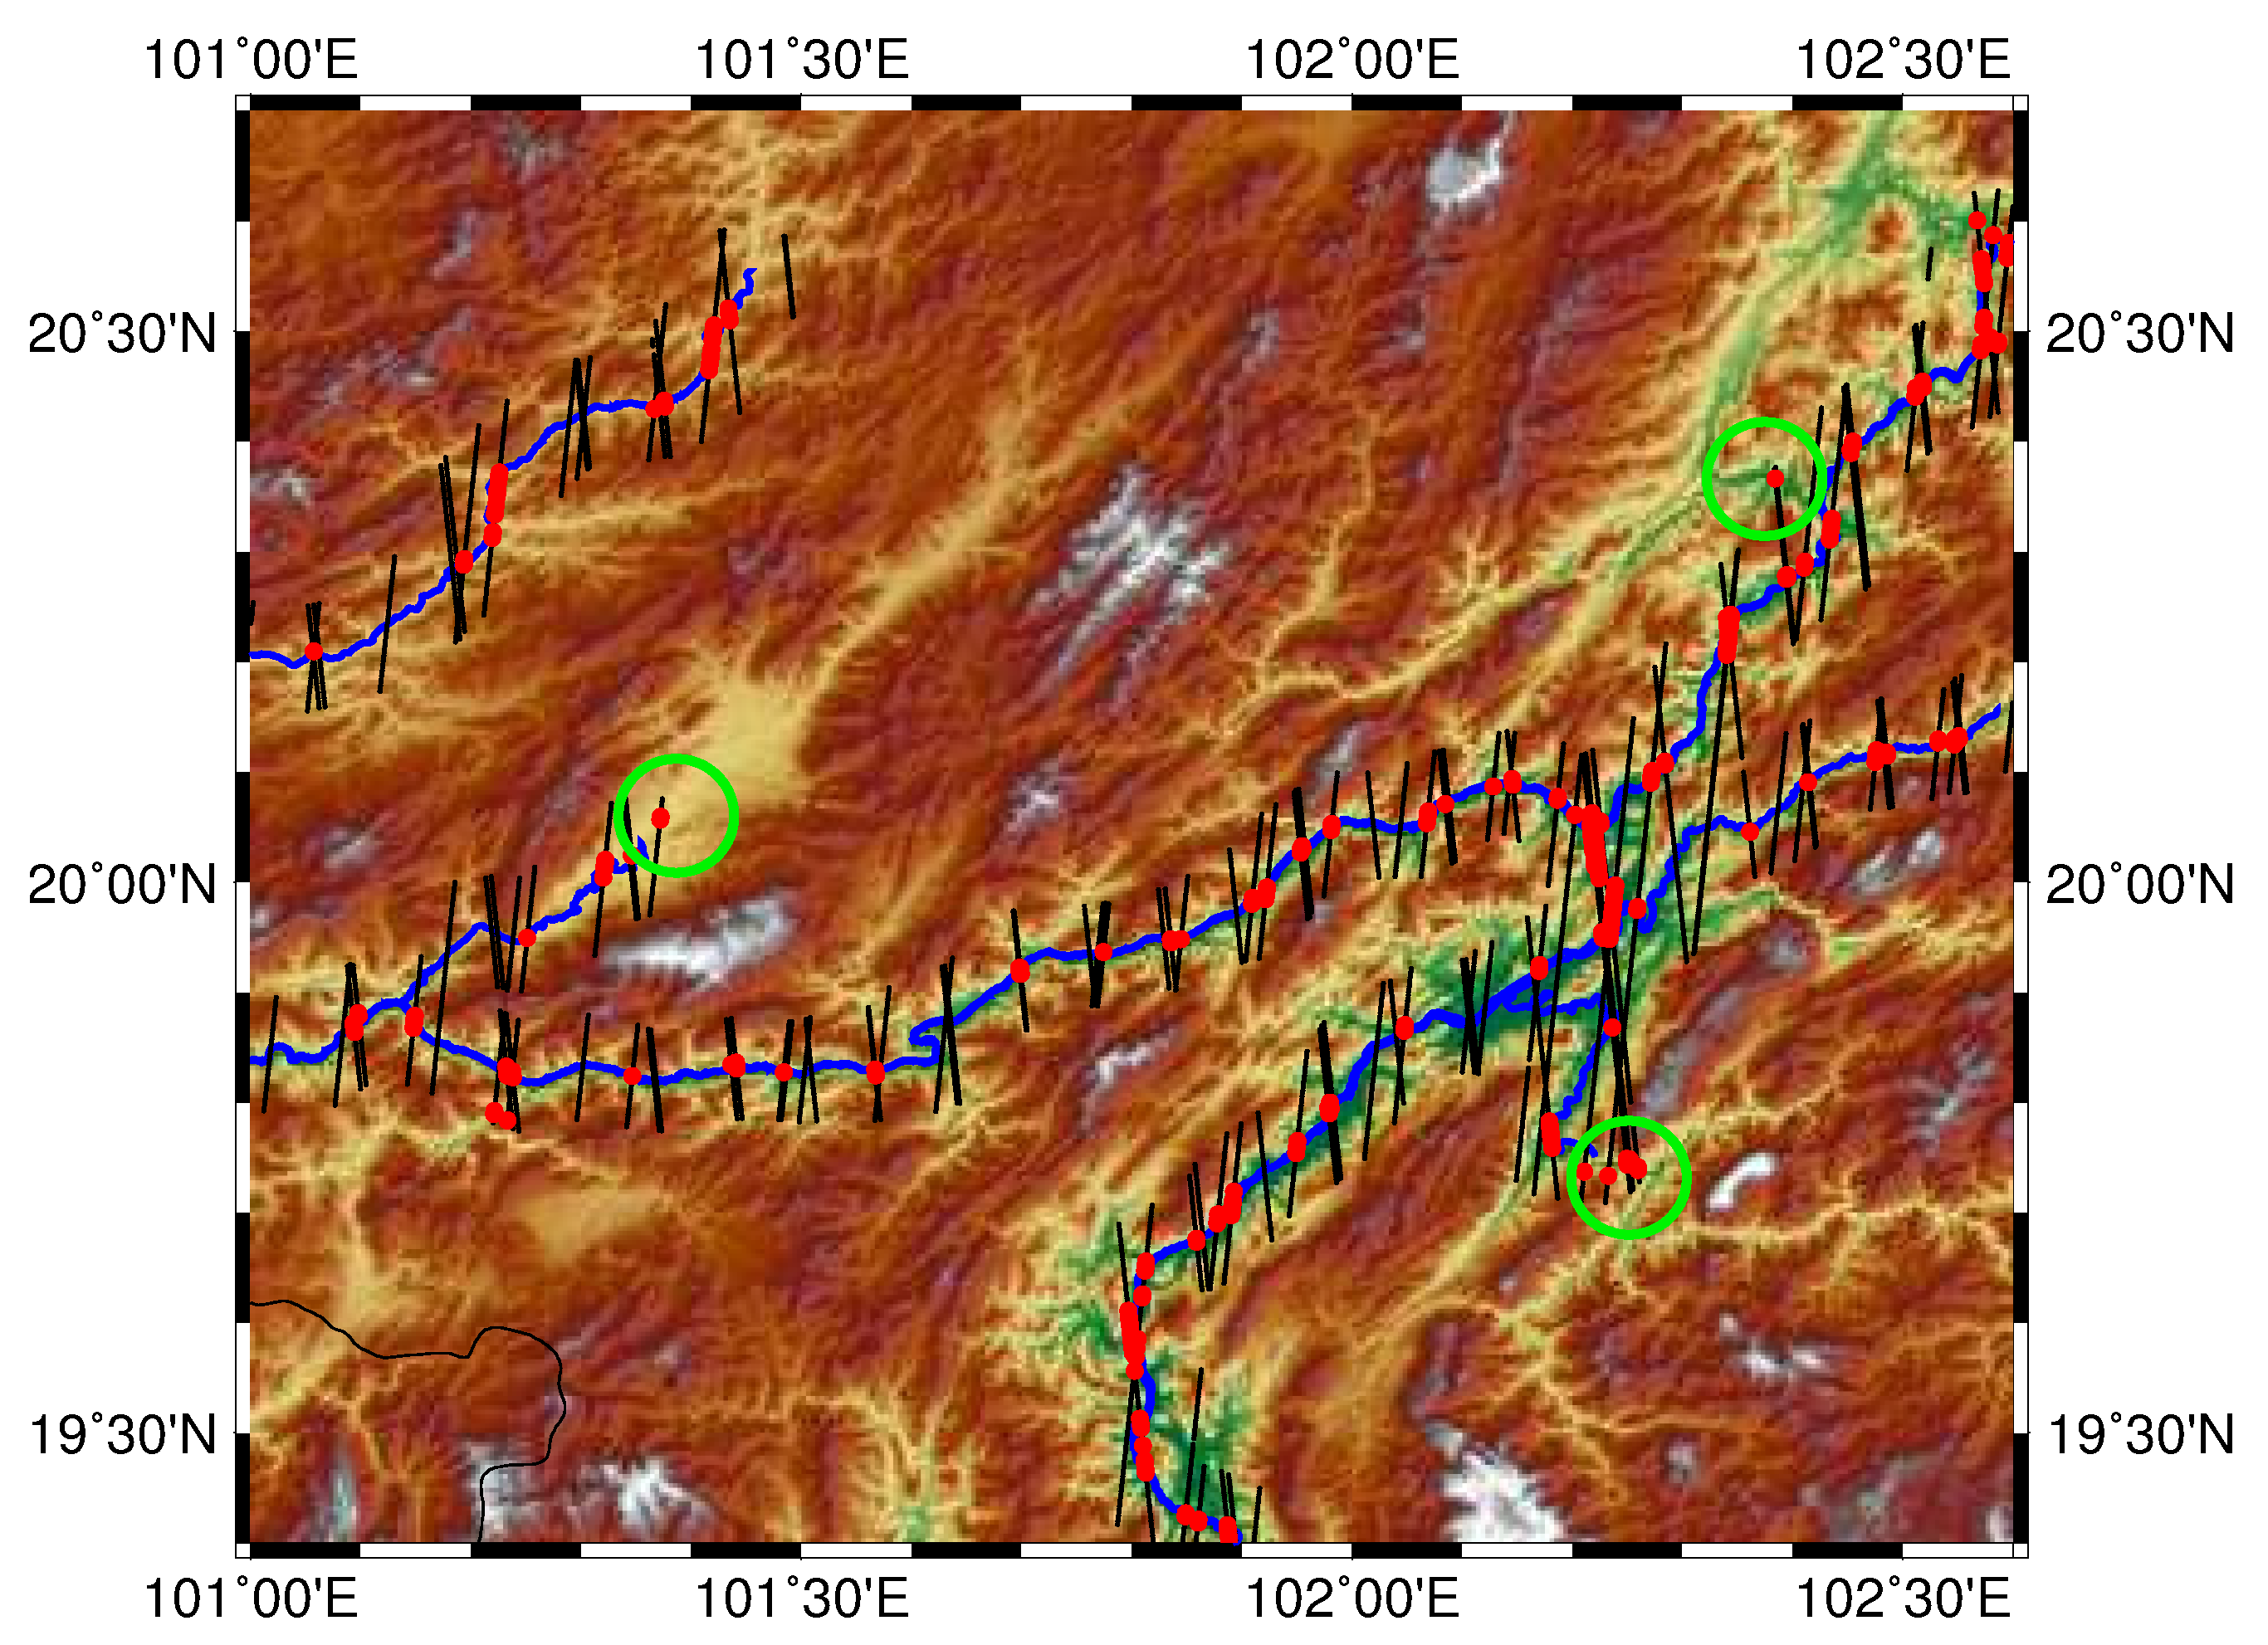
Figure 7.
Heights along one track which crosses a river at four locations. The map on the right side shows the geographical surroundings with the background as a Landsat-8 scene where the rivers are well visible. The black dots are all retracked heights with the red dots indicating which measurements were classified as water. The blue vertical lines show the location of the crossing of the track with the river polygon and the horizontal lines are the estimated water level at each crossing.

Figure 8.
Resulting water levels in the Mekong River Basin.
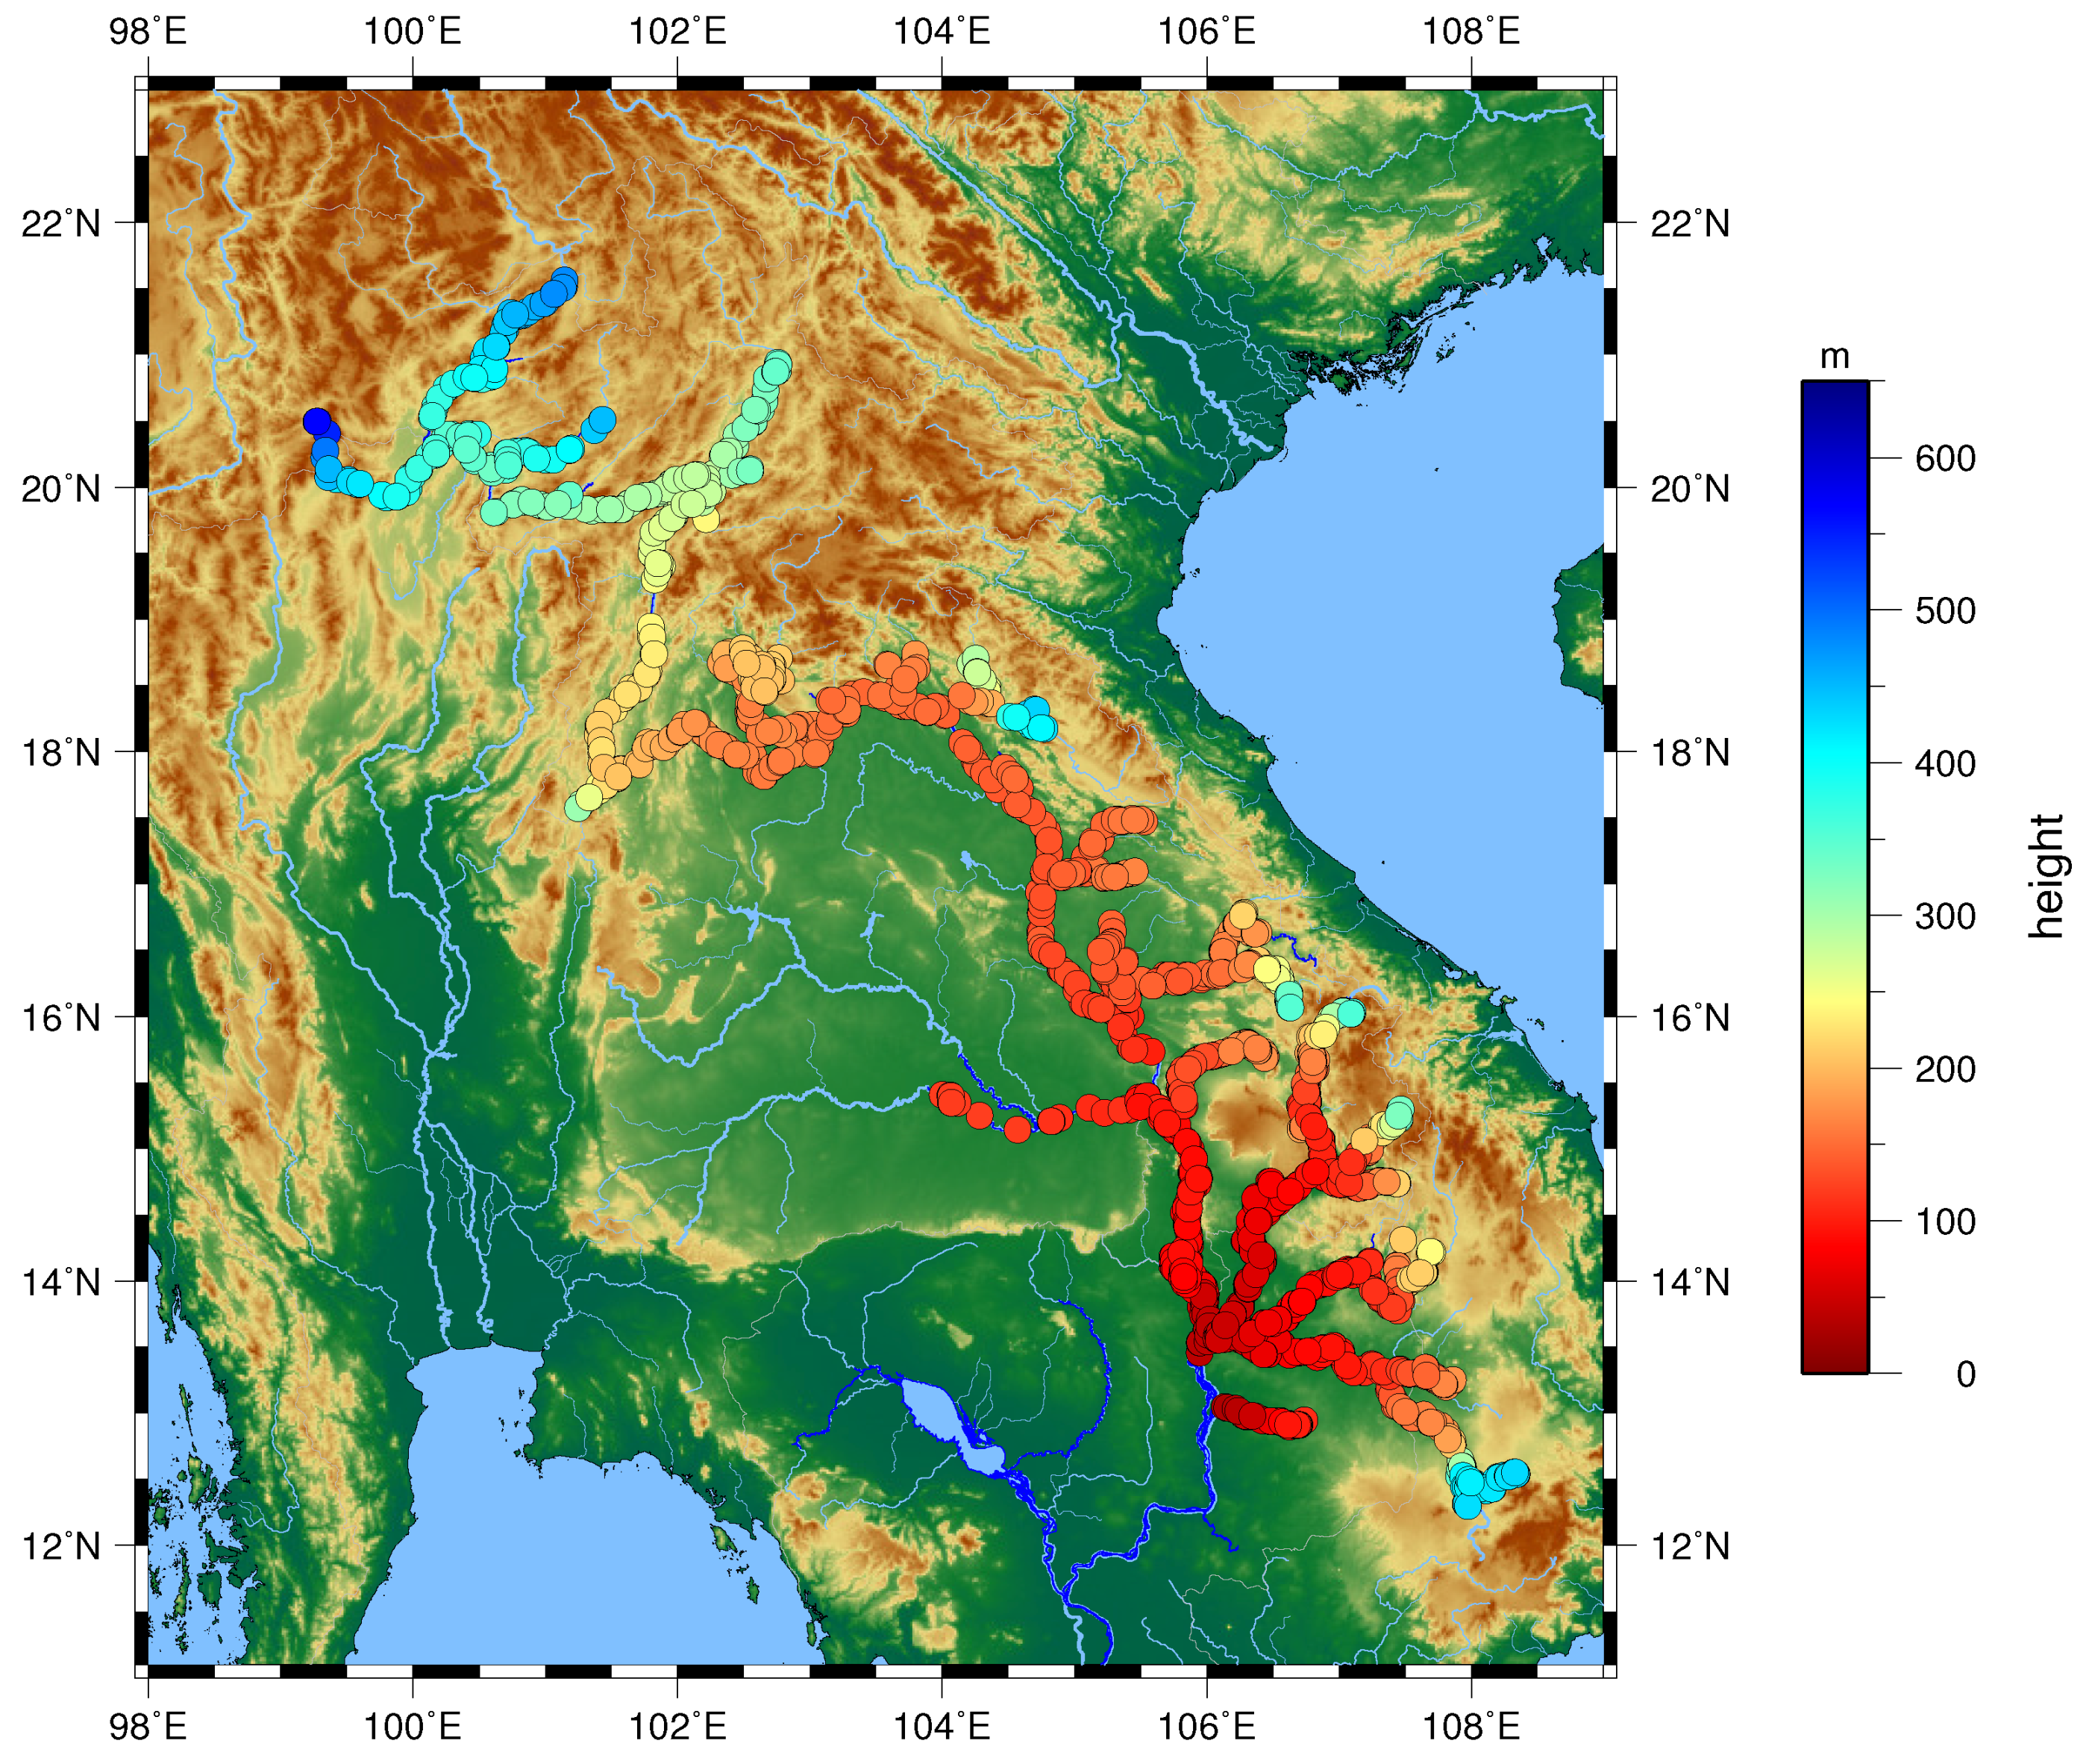
Figure 9.
Histogram of the differences of height measurements 369 days apart for CryoSat-2 water levels with classification, CryoSat-2 water levels inside the land–water mask, gauge water level, and Envisat water level.
Figure 9.
Histogram of the differences of height measurements 369 days apart for CryoSat-2 water levels with classification, CryoSat-2 water levels inside the land–water mask, gauge water level, and Envisat water level.

Table 1.
Features used for the classification.
| RIP Features | Waveform Features |
|---|---|
| Peakiness: | |
| Standard deviation: | Maximum power: |
| Width: w | Relative position of leading edge |
| Off-center: | |
| Symmetry: s |
Table 2.
Results of the cross-validation. The first classification is a clustering on the whole data set, and the second classification is based on clustering on a subset of data with classification of the residual data set.
Table 2.
Results of the cross-validation. The first classification is a clustering on the whole data set, and the second classification is based on clustering on a subset of data with classification of the residual data set.
| Second Classification | |||
|---|---|---|---|
| Water | No Water | ||
| First Classification | Water | 7321 | 205 |
| No water | 423 | 22,660 | |
Table 3.
Analysis of the differences of height measurements 369 days apart for the whole study area, only the upstream region, and only the middle stream region.
Table 3.
Analysis of the differences of height measurements 369 days apart for the whole study area, only the upstream region, and only the middle stream region.
| Median (m) | Mean (m) | Standard Deviation (m) | |
|---|---|---|---|
| Whole study area | |||
| CryoSat-2 classification | 0.76 | 1.43 | 1.59 |
| CryoSat-2 land–water mask | 0.83 | 1.86 | 4.55 |
| Gauge | 0.45 | 0.82 | 1.09 |
| Envisat | 0.96 | 1.42 | 1.44 |
| Upstream region | |||
| CryoSat-2 classification | 0.79 | 1.54 | 1.70 |
| CryoSat-2 land–water mask | 0.85 | 2.00 | 5.44 |
| Gauge | 0.42 | 0.72 | 1.05 |
| Envisat | 1.01 | 1.46 | 1.49 |
| Middle region | |||
| CryoSat-2 classification | 0.76 | 1.15 | 1.10 |
| CryoSat-2 land–water mask | 0.84 | 1.55 | 1.87 |
| Gauge | 0.54 | 1.00 | 1.14 |
| Envisat | 0.81 | 1.26 | 1.26 |
Table 4.
Comparison of the two approaches for CryoSat-2 water levels in terms of absolute number of water levels and number of outliers.
Table 4.
Comparison of the two approaches for CryoSat-2 water levels in terms of absolute number of water levels and number of outliers.
| Upstream Region | Middle Region | |||
|---|---|---|---|---|
| No. of Water Levels | % of Outliers | No. of Water Levels | % of Outliers | |
| Classification approach | 1703 | 2 | 520 | 2 |
| Land–water mask approach | 1534 | 7 | 1364 | 4 |
© 2017 by the authors. Licensee MDPI, Basel, Switzerland. This article is an open access article distributed under the terms and conditions of the Creative Commons Attribution (CC BY) license (http://creativecommons.org/licenses/by/4.0/).
Share and Cite
MDPI and ACS Style
Boergens, E.; Nielsen, K.; Andersen, O.B.; Dettmering, D.; Seitz, F. River Levels Derived with CryoSat-2 SAR Data Classification—A Case Study in the Mekong River Basin. Remote Sens. 2017, 9, 1238. https://doi.org/10.3390/rs9121238
AMA Style
Boergens E, Nielsen K, Andersen OB, Dettmering D, Seitz F. River Levels Derived with CryoSat-2 SAR Data Classification—A Case Study in the Mekong River Basin. Remote Sensing. 2017; 9(12):1238. https://doi.org/10.3390/rs9121238
Chicago/Turabian StyleBoergens, Eva, Karina Nielsen, Ole Baltazar Andersen, Denise Dettmering, and Florian Seitz. 2017. "River Levels Derived with CryoSat-2 SAR Data Classification—A Case Study in the Mekong River Basin" Remote Sensing 9, no. 12: 1238. https://doi.org/10.3390/rs9121238
Note that from the first issue of 2016, this journal uses article numbers instead of page numbers. See further details here.