Validation of Satellite Rainfall Products over a Mountainous Watershed in a Humid Subtropical Climate Region of Brazil


1
Remote Sensing Division (DSR), National Institute for Space Research (INPE), Av. dos Astronautas, 1758, Jardim da Granja, São José dos Campos SP 12227-010, Brazil
2
Image Processing Division (DPI), National Institute for Space Research (INPE), Av. dos Astronautas, 1758, Jardim da Granja, São José dos Campos SP 12227-010, Brazil
*
Author to whom correspondence should be addressed.
Remote Sens. 2017, 9(12), 1240; https://doi.org/10.3390/rs9121240
Submission received: 28 August 2017
/
Revised: 14 November 2017
/
Accepted: 27 November 2017
/
Published: 1 December 2017
(This article belongs to the Special Issue Remote Sensing Precipitation Measurement, Validation, and Applications)
Abstract
:Remote sensing allows for the continuous and repetitive measurement of rainfall values. Satellite rainfall products such as Tropical Rainfall Measurement Mission (TRMM) 3B42 and the Hydroestimator (Hydroe) can be potential sources of data for hydrologic applications, mainly in areas with irregular and sparse spatial distributions of traditional rain gauge stations. However, the accuracy of these satellite rainfall products over different spatial and temporal scales is unknown. In this study, we examined the potential of the TRMM 3B42 and Hydroe rainfall products to provide reliable rainfall estimates for a mountainous watershed in a humid subtropical climate region of Brazil. The purpose was to develop useful guidelines for future hydrologic studies on the potential and uncertainties of the rainfall products at different spatial and temporal resolutions. We compared the satellite products to reference rainfall data collected at 11 rain gauge stations irregularly distributed in the area. The results showed different levels of accuracy for each temporal scale evaluated. TRMM 3B42 performed better at the daily, monthly, and seasonal scales than Hydroe, while Hydroe presented a better correlation at the annual scale. In general, TRMM 3B42 overestimated the rainfall over the watershed at all evaluated temporal scales, whereas Hydroe underestimated it except for June–August at the seasonal scale. An evaluation based on contingency tables indicated that TRM 3B42 was better able to represent the local rainfall than Hydroe. The findings of this study indicate that satellite rainfall products are better suited for applications at the monthly and annual scales rather than the daily scale.

1. Introduction
Hydrology is the study of the distribution and circulation of water and its interaction with the environment, including interactions with living things and human beings [1]. Hydrologic studies play a major role in the monitoring of natural hazards such as droughts [2] and floods [3,4,5]. The most important variable for hydrologic applications is the accurate spatial rainfall data [6], which is a critical input for hydrologic models [3,4,7].
Because of the high spatiotemporal variability of rainfall, a dense monitoring network is required with rain gauges distributed regularly throughout the watershed to generate a reliable estimate [8]. Although traditional rain gauge stations provide the most accurate rainfall data, their spatial distribution is irregular, sparse, or missing in some areas, which may limit the accuracy of hydrologic studies [9].
Remote sensing allows for the continuous and repetitive measurement of regional and global values of rainfall in regions with insufficient or no rain gauge coverage [10]. Rainfall products derived from remote sensing have reached a good level of maturity [11]; even for watersheds with rain gauges, these products are considered an important complement for gauge-based observations [9].
Various types of satellites have been designed to measure rainfall. The Hydroestimator algorithm uses the cloud-top infrared (IR) brightness temperature based on IR data from NOAA’s Geostationary Operational Environmental Satellites (GOES) to derive rainfall rates [12,13]. The Tropical Rainfall Measuring Mission (TRMM) Multisatellite Precipitation Analysis (TMPA) merges rainfall estimates from multiple sensors and gauge observations to gain quasi-global rainfall (50° N–50° S) products at a relatively fine resolution (0.25 × 0.25°, 3 h) [14,15]. Building upon the success of TRMM, the Global Precipitation Mission (GPM), which was launched in February 2014, uses a multi–sensor technique to provide a new generation of global precipitation observations [15,16,17]. The GPM was designed to quantify the spatiotemporal variability of global precipitation with an improved accuracy and better spatiotemporal resolution (0.1 × 0.1°, 30 min) than the TRMM-TMPA [15,16,17]. Nevertheless, the longer records of GPM data are still necessary for qualitative analysis and posterior applications in hydrologic models. Also noteworthy is the advent of weather radar systems that provide rainfall estimates at high spatial and temporal resolutions based on microwave radiance data [13].
However, random errors and uncertainties are present in rainfall products [3,9,13]. Weather radar systems use a robust relationship to transform the radar-measured reflectivity into the rainfall rate [13]. This is commonly referred to as the Z–R relationship where Z is the radar reflectivity factor and R is the rainfall rate [13]. However, weather radars have an uneven distribution and limited spatial coverage. Rainfall products based on infrared and/or visible satellite data are generally derived from the cloud-top IR brightness temperature; this is related to thick clouds, which in turn are more likely to be associated with rainfall [11,13]. Although this is true for convective precipitation, this relationship is indirect and problematic for some types of clouds, such as nimbostratus and non-precipitating cirrus clouds [13]. Microwave data have a physical relationship to hydrometers that measure the surface rainfall, but each individual satellite provides a very sparse sampling of the spatiotemporal occurrences of rainfall when using microwave data that is incompatible with the operational evaluation of extreme rainfall events [13].
Therefore, a performance evaluation is necessary to determine the potential and limitations of using satellites to estimate rainfall before application [9]. Many studies have evaluated rainfall products such as TRMM [7,9,18,19,20,21] and a Hydroestimator [7]. However, all of these studies were carried out over large regions or river basins. Other studies have highlighted the importance of topography to the quality of satellite rainfall estimates [20]. A study conducted in a region of South Korea identified the elevation-dependent performance of TRMM products [21]. Attention towards small watersheds has increased because of the occurrences of flash floods following heavy rainfall events, which has generated a need for hydro-meteorological studies in these areas [22,23]. In order to improve our understanding of the potential of satellite rainfall products, studies are needed to evaluate the influence of topography and climate, mainly over ungauged or data-sparse small watersheds that are rarely assessed.
The aim of the present study was to evaluate the performance of two satellite rainfall products in terms of providing reliable rainfall estimates for a mountainous watershed in a humid subtropical climate region of Brazil. This evaluation can provide useful guidelines for hydrologic studies on the potential and uncertainties of the rainfall products at different spatial and temporal resolutions. The results of the validation process will permit the usage of these satellite data in other regions with sparse coverage of rain gauge stations. The TMPA 3B42 version 7 product was selected because it covers 17 years of valuable scientific data, while the Hydroestimator is an important source of rainfall data for the South American continent.
2. Materials and Methods
2.1. Study Area
Sapucaí River Basin is located in southeastern Brazil (Figure 1a). The study area comprises the entire drainage area located upstream of the municipality of Itajubá, with an area of approximately 859 km2 (Figure 1b).
According to the Köppen–Geiger classification system, the local climate is humid subtropical (Cwa), which is characterized by dry winters and rainy summers [24]. The annual air temperature ranges from 18 °C to 19 °C; it increases in summer during the three rainiest months (December–February) and decreases in winter during the three driest months (June–August) [25]. Figure 2 presents monthly regional rainfall variations, based on forty years of daily data from five rain gauge stations provided by the Brazilian National Water Agency (ANA) (yellow points in Figure 1b). Figure 2 also illustrates the mean monthly rainfall from 2009 to 2014, based on data from the TRMM 3B42 and Hydroe products.
The study area relief is predominantly hilly with alluvial plains, V-shaped valleys, and dendritic drainage [26]. The elevation is more than 2000 m at the southeastern mountain region, near the headwaters area of the Sapucaí River. The original vegetation corresponds to the Atlantic Forest domain. However, urban expansion, infrastructure development, and economic activities have caused degradation of the forest and changed the natural characteristics of the region to agricultural areas and pastures [26]. This region, particularly the municipality of Itajubá, is markedly affected by rainfall with the potential to induce flood events [27,28].
2.2. Rain Gauge Stations
Rainfall data collected by 11 gauge stations available inside and near the study area (Figure 1b) were used as a reference to validate the TRMM and Hydroestimator data. Data collected by each of the five rain gauge stations in the Brazilian National Water Agency (ANA) network were measured daily at 10:00 a.m. (UTC) and represented the accumulated rainfall in the last 24 h (mm day−1). The ANA database provided rainfall data from the National Information System for Water Resources [29]. Rainfall data from six gauge stations of the Unifei–Copasa agreement for the flood warning system in the Sapucaí River Basin were provided by the Federal University of Itajubá (Unifei). Data provided by Unifei were measured at shorter time intervals: some data were collected every 30 min, and other data were collected every 1 h. Rainfall data measured between January 2009 and December 2014 from both sources represented the longer rainfall data period available.
2.3. Satellite Rainfall Products
2.3.1. TRMM Multisatellite Precipitation Analysis
The TMPA is designed to combine rainfall estimates from different satellite systems and—when possible—from land surface precipitation gauge analysis with the objective of providing the best global rainfall product [14]. The multi-sensor technique used to generate rainfall estimates combines passive MW data that are collected by a variety of low Earth orbit (LEO) satellites and window-channel (~10.7 µm) IR data that are collected by the international constellation in geosynchronous earth orbit (GEO). The MW data have a physical relationship to hydrometers that measure the surface rainfall, but each individual satellite provides a very sparse sampling for the spatiotemporal occurrences of rainfall. This lack of data can be filled with IR data, which provides excellent temporal (half-hourly) and spatial (4 km × 4 km) coverage. The TMPA is computed twice as part of the routine processing for TRMM: the first is a real-time (RT) monitoring product about 9 h after real time, and then a post-real-time research-quality product is produced about 10–15 days after the end of each month. The research TMPA also makes use of three additional data sources: the TRMM Combined Instrument (TCI) estimate, which employs data from both TMI and the TRMM precipitation radar (PR) (TRMM product 2B31); the Global Precipitation Climatological Center (GPCC) monthly rain gauge analysis; and the Climate Assessment and Monitoring System (CAMS) monthly rain gauge analysis [14].
Note that the TRMM satellite was boosted in altitude from 350 to 402 km in August 2001. Curtarelli et al. [18] evaluated the effects of the TRMM orbital change on the monthly rainfall measurements. They showed that the increased error does not preclude the use of the TRMM 3B43 product for estimating the areal rainfall over the Itumbiara Reservoir drainage area [18]. However, only data after the boost was included in the analysis of the present study.
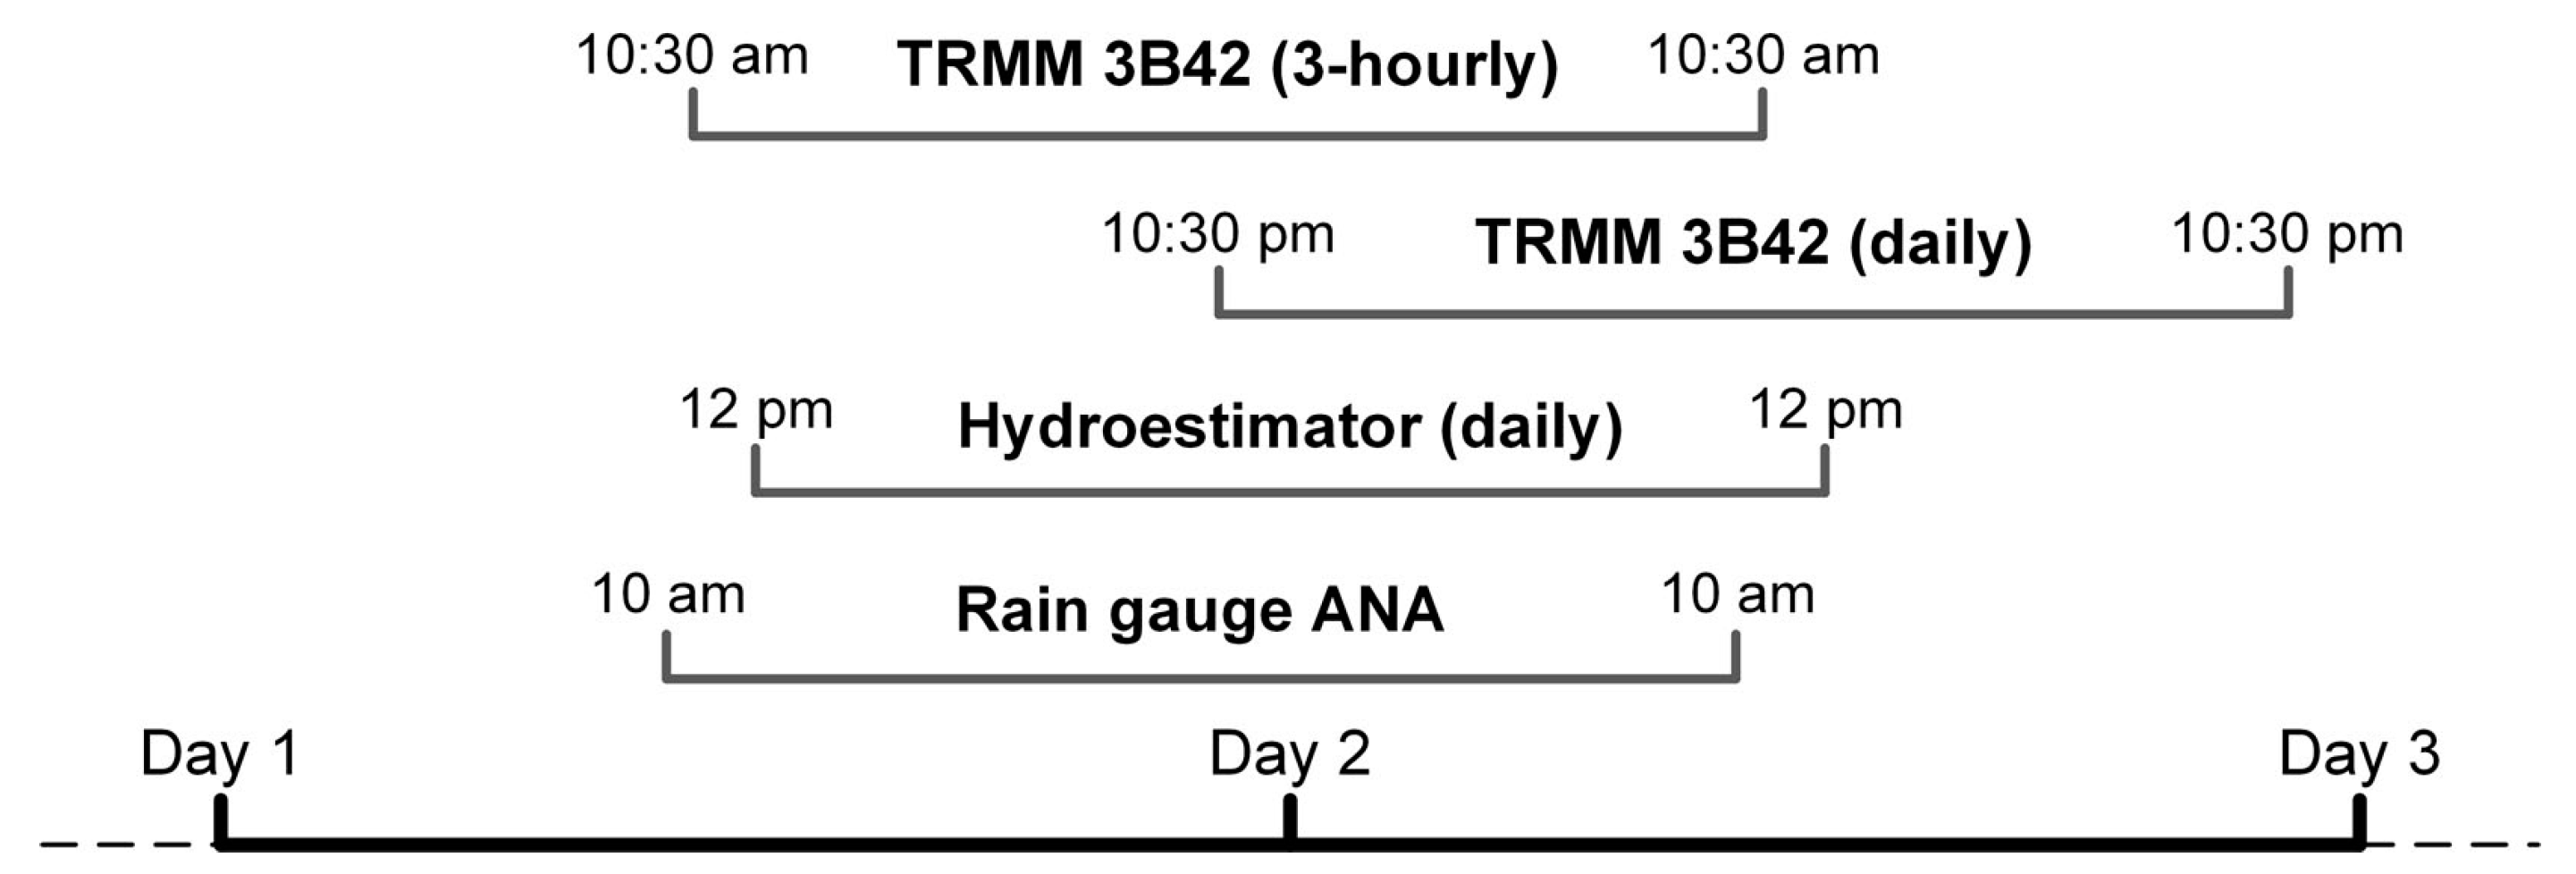
In this study, we used the research TRMM 3B42 v7 product, with temporal and spatial resolutions of 3-hourly and 0.25 × 0.25°, respectively, for the period of January 2009 to December 2014 [30]. Note that the 3B42 research-derived daily product (mm day−1) was available. This daily product uses the Coordinated Universal Time (UTC) as the reference time and is derived from eight original 3-hourly TRMM 3B42 product files. For every data day, eight files are simply collected and scaled to obtain the daily rainfall (mm day−1). The first of the eight 3-hourly 3B42 files has a starting time of 10:30 p.m. (UTC) on the day before, and the last 3B42 file has the ending time 10:29 p.m. (UTC) on the data day. Therefore, the daily TRMM product did not match the daily rain gauge observations provided by ANA. To minimize this problem, the daily rainfall dataset was calculated from the values referring to 12 h (UTC) from the previous day until 9 h (UTC) of the following day, which represented the data day. Figure 3 illustrates the daily rainfall data of 3B42 matched to the daily rain gauge observations provided by ANA.
2.3.2. Hydroestimator Algorithm
The Hydroestimator satellite rainfall estimation technique is a fully automated method that uses an empirical power-law function based on IR data from GOES to produce rainfall estimates [13]. The Hydroestimator (Hydroe) is another version of the Autoestimator and was developed to reduce the need for radar and/or rain gauge coverage exhibited by the latter [13]. The algorithm uses two important factors to automatically adjust the rainfall rate: (1) the parallax correction that is used to provide a better location of the precipitation cores; and (2) the orographic correction for adjusting the rainfall rate in complex terrain due to the lack of other data sources, such as radar and rain gauges [31]. A version adapted to the conditions and precipitation structure of South America has been running at the Center for Weather Forecasting and Climate Studies (CPTEC) of the National Institute for Space Research (INPE) since 2004 [12,32].
This rainfall estimate product was available at a spatial resolution of 0.04° and temporal resolution of 15–30 min (mm h−1), in addition to a daily product (mm day−1) [33]. The daily data represented the accumulated rainfall from 12:00 UTC on the day before to 12:00 UTC on the data day (Figure 3). To match the gauge observations from 10:00 a.m. (UTC) to 10:00 a.m. the day after, we collected the data for this time interval to obtain the daily rainfall dataset.
2.4. Preparation of Reference Data
The obtained time series represents a period between January 2009 and December 2014. Before the TRMM 3B42 and Hydroe products were evaluated, the reference rainfall data were organized and homogenized to evaluate the consistency. Data gaps were filled using a linear-regression method, which was straightforward and useful for extrapolating rainfall records to areas with incomplete records [34]. The independent variable was the gauge station used to fill the gap, and the dependent variable was the gauge station with the data gap. After the gap filling, consistency analysis was performed by using the double-mass curve (DMC) technique to verify the presence of abnormalities in the rainfall data from the gauge stations [35]. Table 1 summarizes the rain gauge stations used as references in this study.
Rainfall data provided by Unifei were accumulated in the form of daily data to match the daily rain gauge observations provided by ANA.
To obtain the mean rainfall based on reference data over the watershed, we chose the Thiessen polygon method, which considers the non-uniformity in the spatial distribution of the rain gauge stations, where it simply assumes a linear variation of rainfall between stations [8,18]. This method defines the area of influence for each station within the watershed, where the mean rainfall is calculated by weighting the rainfall values of each station for its area of influence [8]. To perform an analysis at different time scales, the mean rainfall data were organized into daily, monthly, seasonal, and annual data.
2.5. Mean Rainfall Estimation Using the Satellite Products
To estimate the mean rainfall over the watershed with the TRMM 3B42 and Hydroe rainfall products, the first step consisted of converting the unit of rate (mm h−1) to a daily cumulative unit (mm day−1) for each product. The daily mean rainfall over the study area was obtained by the weighted average method using the daily rainfall grid for each satellite product. This method weights the area of the pixels contained within the study area to calculate daily mean rainfall values. The weighted average method was performed with R statistical software [36] through the Raster package [37].
The daily rainfall data of TRMM 3B42 and Hydroe satellite products were also organized into monthly, seasonal, and annual data for comparison and evaluation with the reference data. Besides the mean rainfall values, the data were also extracted and organized in terms of the original daily values of each pixel that includes a rain gauge station for further point-to-pixel evaluation to compare the time series of rainfall data observed at gauge stations with the respective satellite rainfall estimates for each grid cell.
2.6. Evaluation of the Satellite Rainfall Products
Validation was focused on the rainfall characteristics relevant to hydrologic applications, such as the performance at different temporal scales (daily, monthly, annual, and seasonal) and spatial scales (two spatially aggregated levels: point-to-pixel and mean values to the whole study area), and the reproducibility of days without rain and daily events with rainfall above a fixed threshold.
The satellite rainfall estimates were evaluated through analyses of the error (P3B42 − Prain gauge for TRMM data and PHydroe − Prain gauge for Hydroe data), linear correlation coefficient (r), bias, mean absolute error (MAE), and root mean square error (RMSE) based on the work of Curtarelli et al. [18] and Duan and Bastiaanssen [10]. To facilitate the comparison and discussion with published results, the relative value of each statistical indicator was also calculated based on the mean rainfall estimated by the reference data for all temporal scales. The relative RMSE was used to evaluate the reliability of the satellite rainfall products; values less than 50% of the gauge observations were considered reliable [9].
In addition to the above statistics, we also evaluated the ability of the satellite products to reproduce the observed rainfall with a focus on discriminating heavy rainfall events (90th percentile of gauge observations) [4] and days without rain (p = 0 mm day−1). The ability of a product is based on a contingency table (see Table 2), which includes four variables calculated from the set of observations (reference data) and estimated values (satellite rainfall products) [38,39].
Based on the contingency table, Peirce [40] formulated the Peirce Skill Score (PSS). The PSS accounts for all elements of the contingency table and is calculated as the difference between the probability of detection (POD) and probability of false detection (POFD) [38,39]:
PSS = POD − POFD = (H/(H + M)) − (FA/(FA + CN))
PSS values range from −1 to 1. A PSS of greater than 0 means that the number of hits was higher than the number of false alerts and indicates that remote sensing data have some ability to estimate rainfall. An estimate has no predictive ability when PSS ≤ 0 [38].
3. Results
3.1. Daily Scale
Figure 4 shows the spatial distributions of the eleven available rain gauge stations, as well as the TRMM 3B42 and Hydroe grid.
As the rainfall events present high spatiotemporal variability, a point-to-pixel evaluation was performed to compare daily time series at each gauge station with the respective satellite grid cell. This evaluation can give a more reliable representation of the performance of satellite products in estimating the rainfall spatial variability. Table 3 presents the summary statistics used for point-to-pixel evaluations.
Table 3 indicates that the TRMM 3B42 and Hydroe pixels contained large errors. The relative RMSE values for both products were higher than 200%. Despite differences in the spatial resolution of each satellite product analyzed (Figure 4), the TRMM pixels showed higher r values than the Hydroe pixels when compared with the daily rainfall values observed at the rain gauge stations. In general, the pixels of the Hydroe product tended to underestimate the rainfall observed by rain gauge stations. These bias values contrasted with the behavior of the TRMM pixels. Even with a smaller grid size, the Hydroe pixels showed worse RMSE results than the TRMM products.
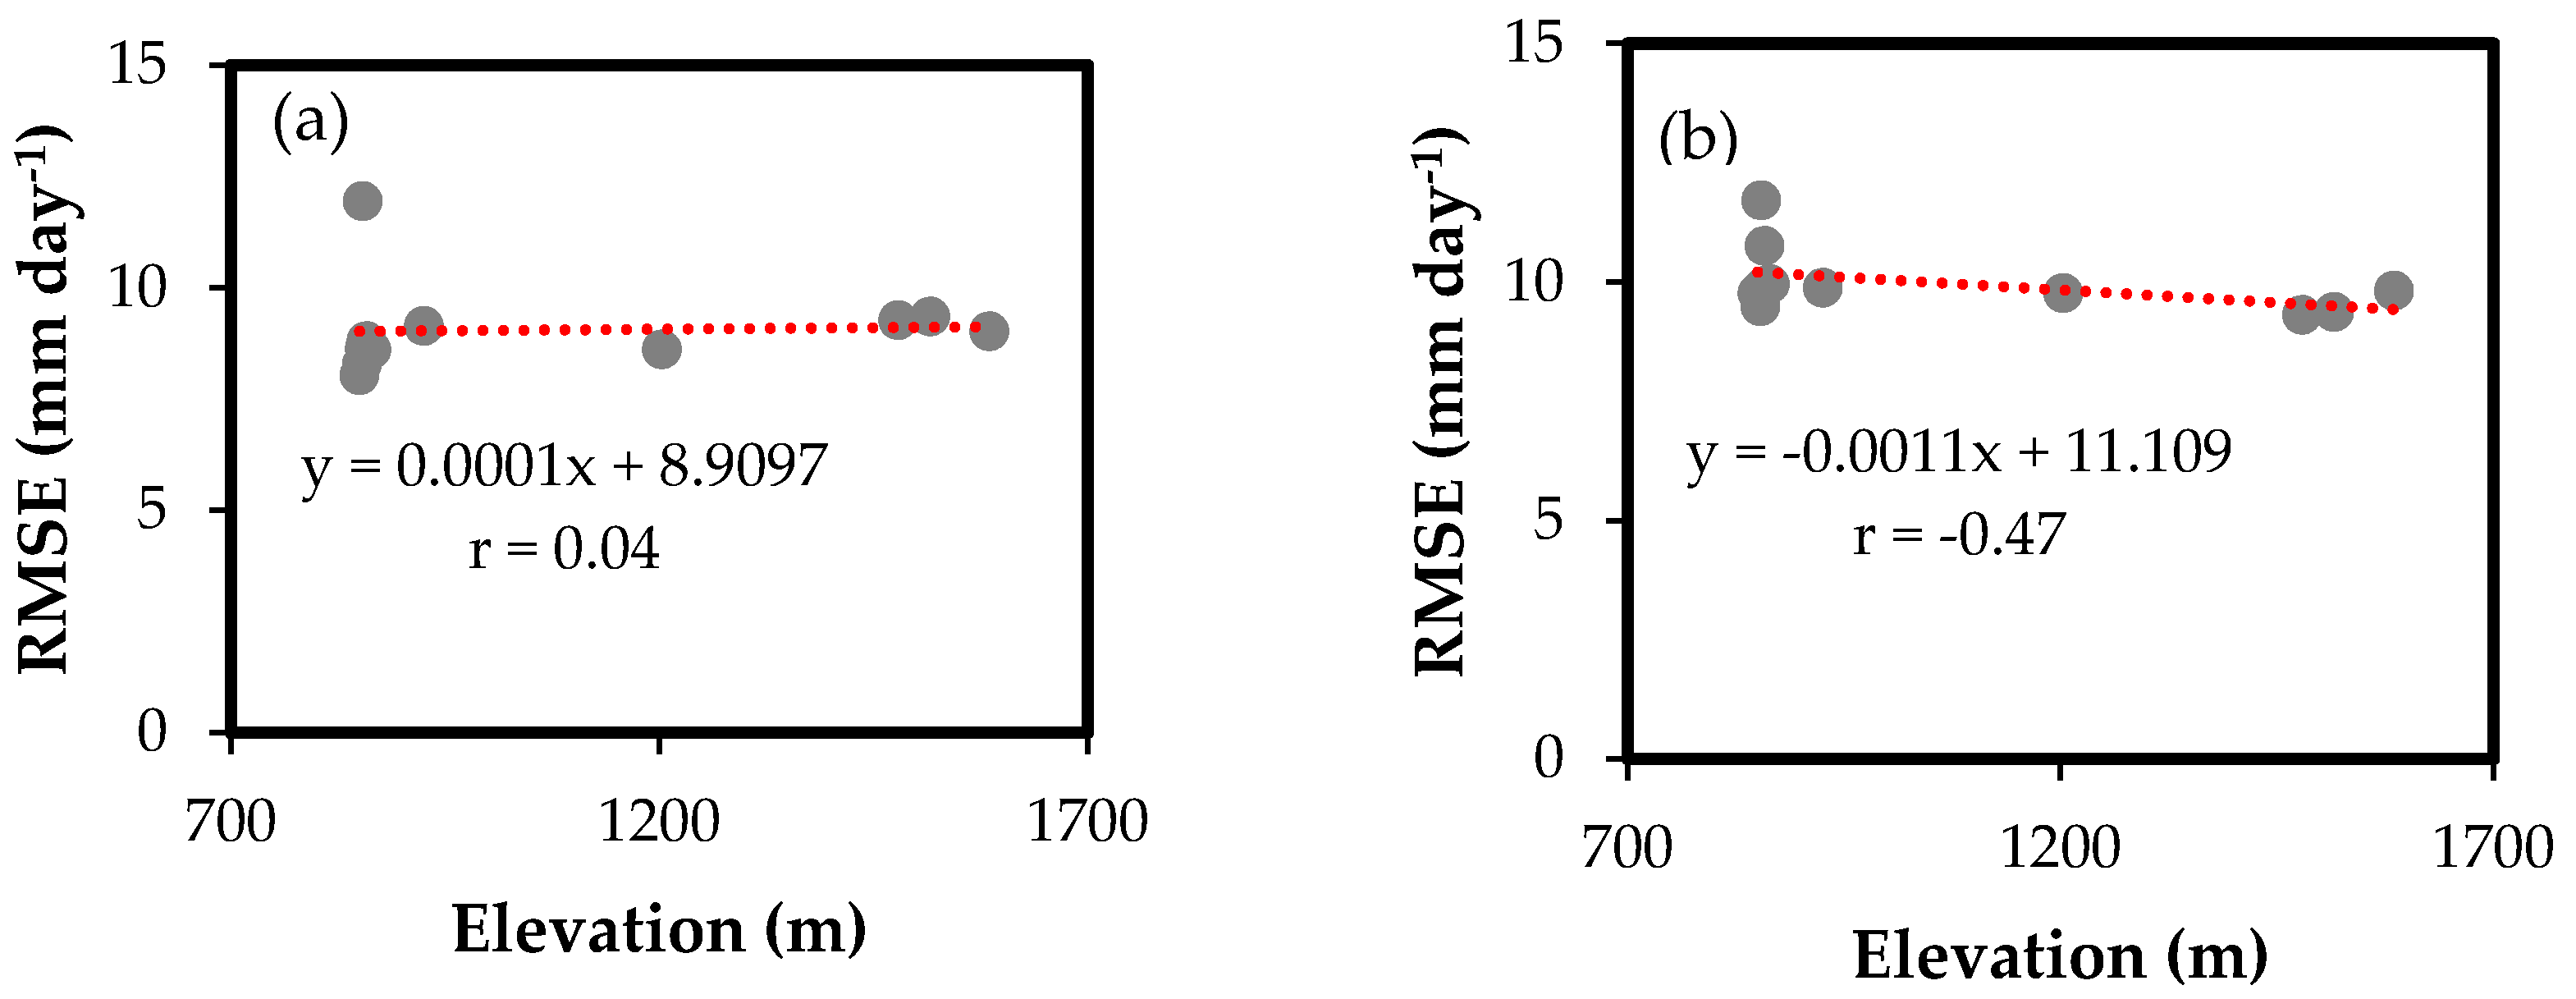
To understand the possible effects of the high elevation variation in the satellite rainfall estimates, further analysis (Figure 5a,b) was performed to show the RMSE variation of each pixel as a function of elevation (using the data in Table 1). The RMSEs of the TRMM products (Figure 5a) did not correlate linearly with the elevation variation (r = 0.04), whereas the RMSEs found with the Hydroe data presented a negative linear correlation (r = −0.47); that is, the RMSE values decreased slightly with higher altitudes. However, these findings should be interpreted with caution. Although lower linear correlation and higher RMSE values were observed with the Hydroe data compared to TRMM statistical values (Table 3), the Hydroe data provide more detailed spatial information in terms of rainfall than the TRMM 3B42, due to its original spatial resolution of 0.04° versus that of the TRMM products (0.25 × 0.25°).
The satellite rainfall products were also evaluated in terms of their mean values for the whole study area. Figure 6a,b show the evaluation of the rainfall estimates from 3B42 and Hydroe versus rain gauges in the Sapucaí watershed at a daily scale. The 3B42 product had a linear correlation coefficient of 0.70, bias of 0.85 mm (23%), and RMSE value of 6.6 mm (181%), which suggests that the daily estimate of 3B42 is unreliable. While the TRMM data indicated an overestimation, the Hydroe data underestimated the rain gauge observations with a bias of −0.30 mm (−8%), r value of 0.51, and RMSE of 7.6 mm (208%), which are worse results than those of the TRMM product. Daily analysis based on point-to-pixel data (Table 3) and mean values for the study area (Figure 6a,b) showed different results. The r values found by point-to-pixel validation of the TRMM and Hydroe products were lower than those found with the mean values, although the errors were higher. This behavior supports the conclusion that enlargement of the spatial scale smoothens the errors.
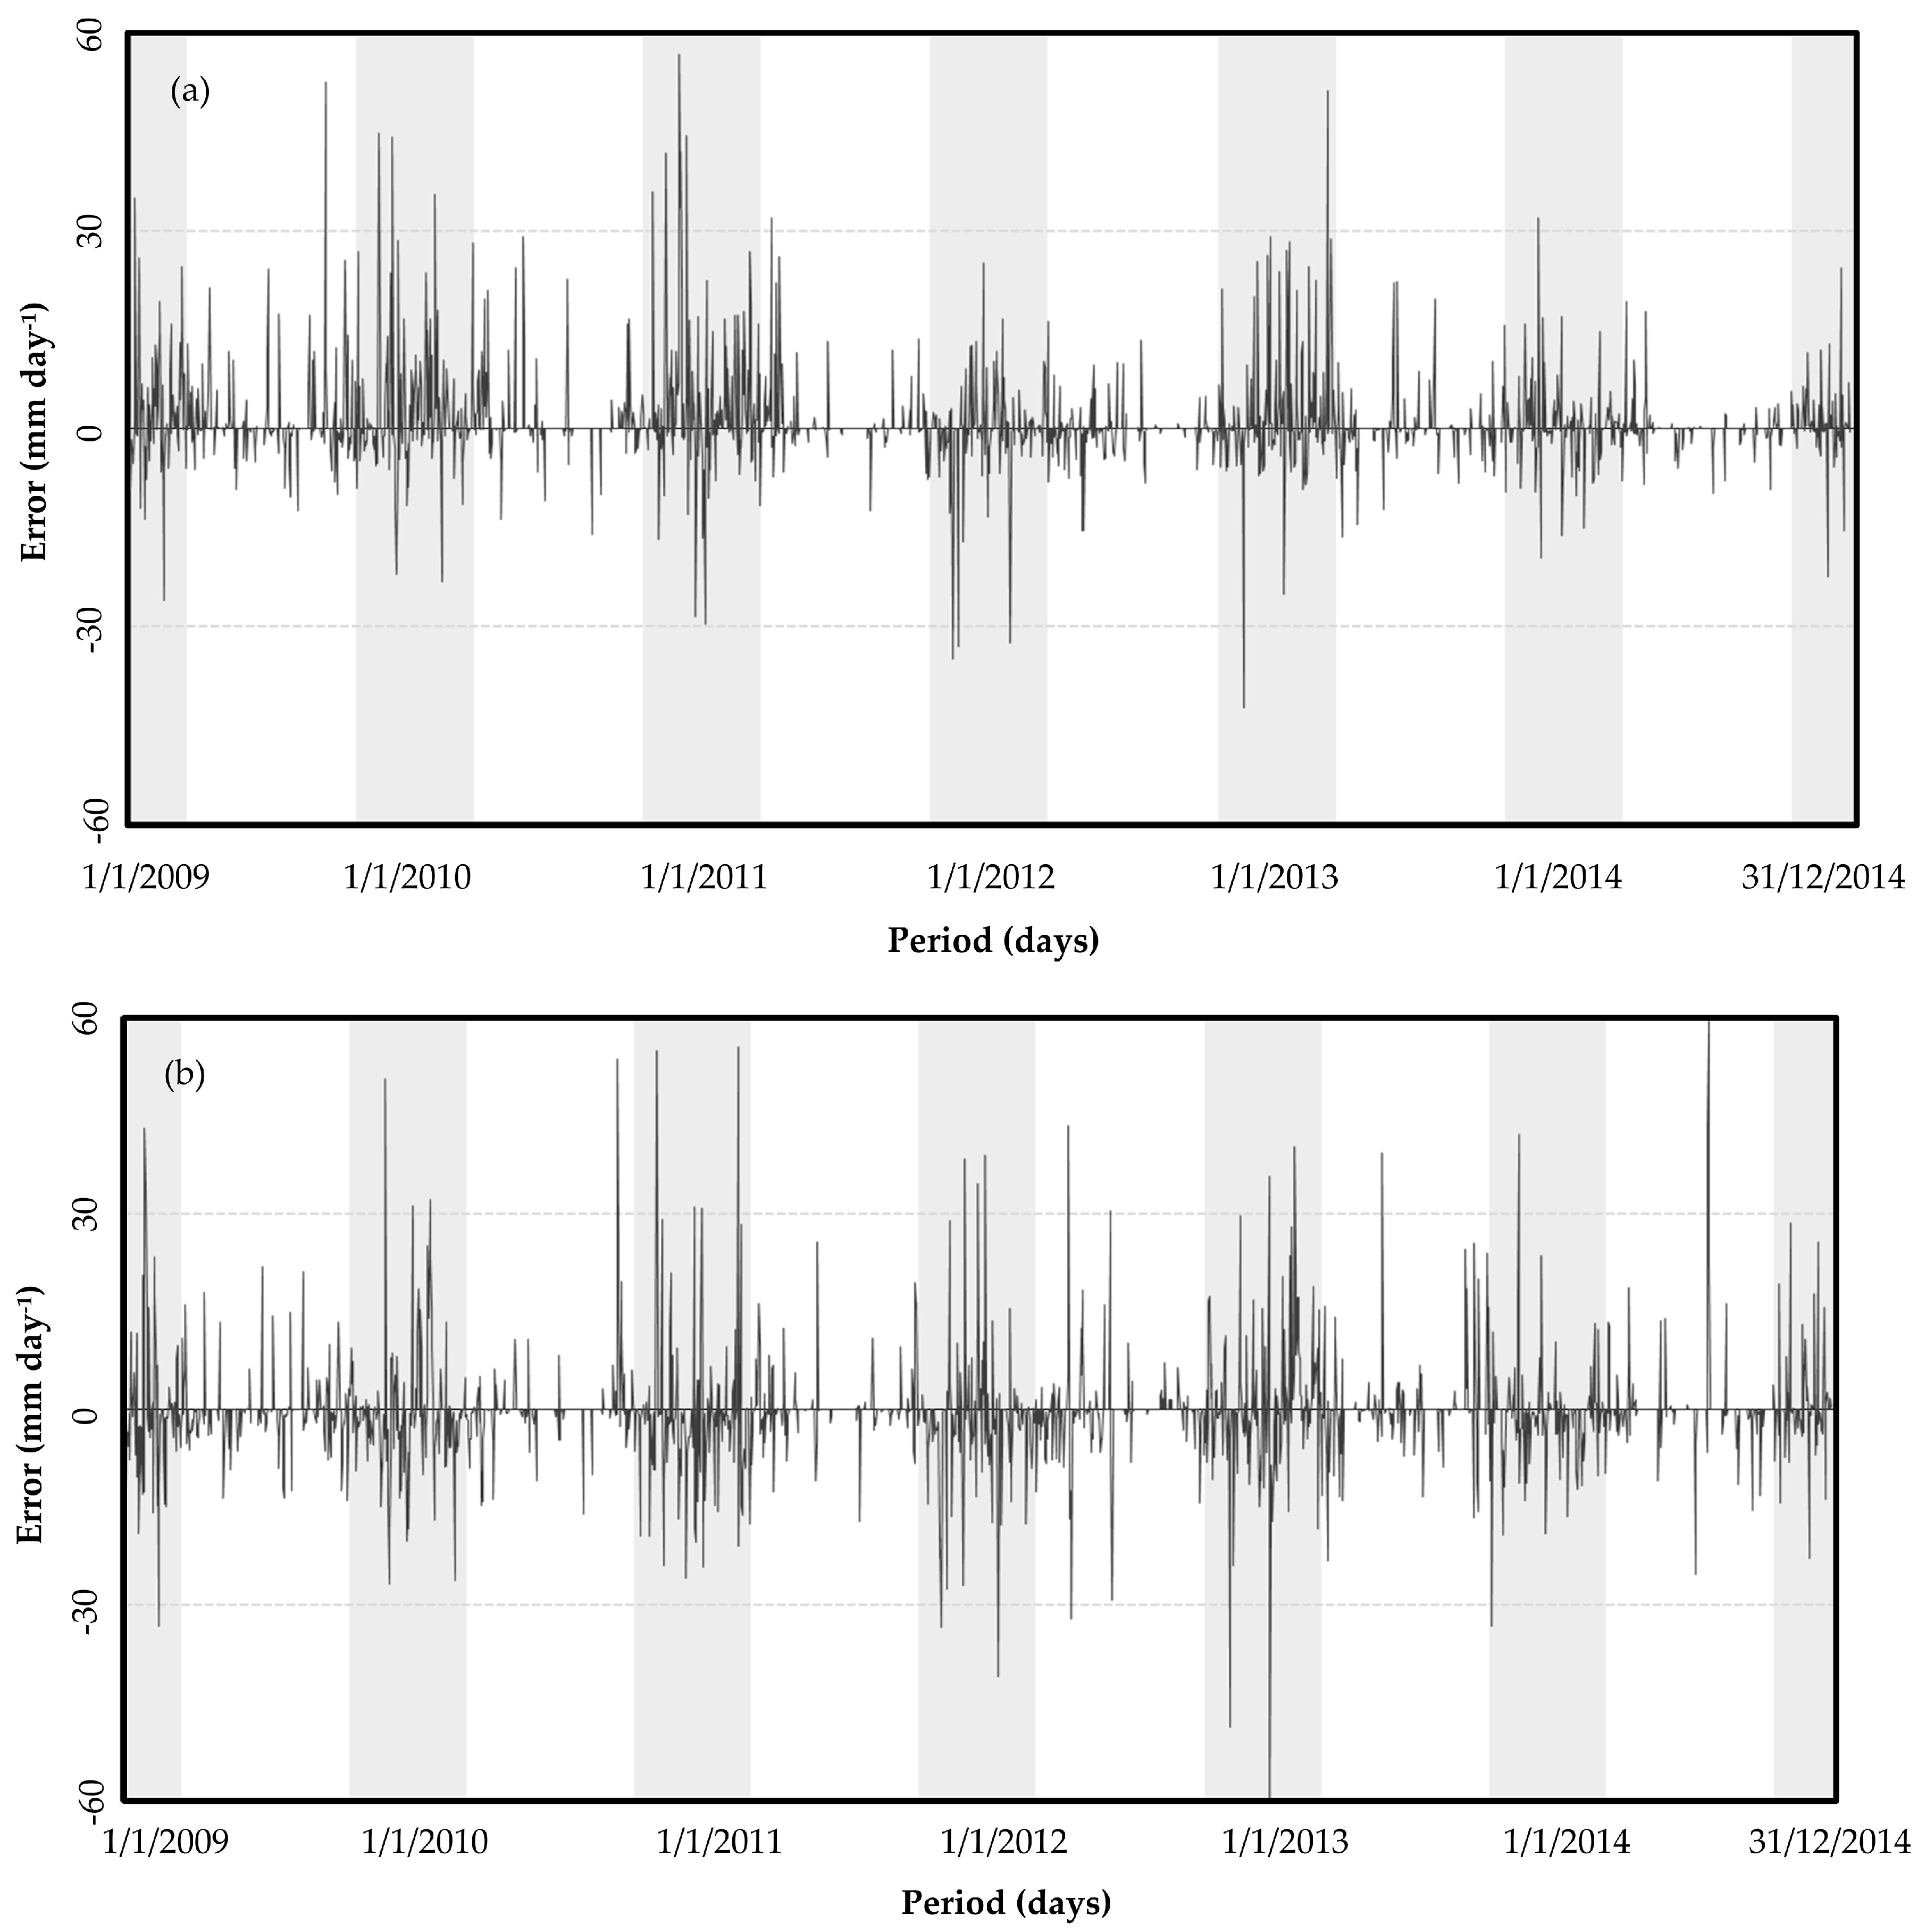
In general, the biggest errors of the 3B42 and Hydroe products showed a seasonality compatible with periods of heavy rainfall events from December to February (summer in the Southern hemisphere), while periods of drought (June, July, and August) had low error values (Figure 7a,b).
The behavior identified by the analysis of daily error (Figure 7a,b) clearly involves the ability of the satellite products to reproduce observed rainfall during the rainy season, which is a period with higher rainfall rates. By using the POD, POFD, and PSS metrics in the contingency table (Table 4), it is possible to determine the ability of the satellite rainfall products (TRMM 3B42 and Hydroe) to detect days without rain (p = 0 mm day−1) and heavy rainfall events. Here, the latter was considered as the 90th percentile of gauge observations.
The satellite rainfall products of TRMM and Hydroe provided skillfully estimated values (i.e., PSS > 0) in both analyses (Table 4). The 3B42 product (PSS > 0.50) was better able to represent the local rainfall than the Hydroe product. However, isolating the POD analysis to p = 0 mm day−1 indicated better behavior from Hydroe (POD = 0.92), although the POFD was high (0.44). This high POFD suggests that the Hydroe algorithm is insensitive to low rainfall values; in other words, it considers days with a low rainfall rate as days with p = 0 mm.
3.2. Monthly Scale
Figure 8 shows the monthly values of each satellite rainfall product and reference data. The monthly rainfall values of the TRMM and Hydroe products had a pattern similar to the observed values of the rain gauge stations for the entire analysis period. The satellite products were able to estimate the seasonal variation during the summer (rainy period) and winter (low rainfall rate). The monthly rainfall of TRMM ranged from 0 mm (August 2010) to 425 mm (January 2013). Hydroe had a minimum monthly value of 0 mm (August 2010) and maximum of 365 mm (February 2013).
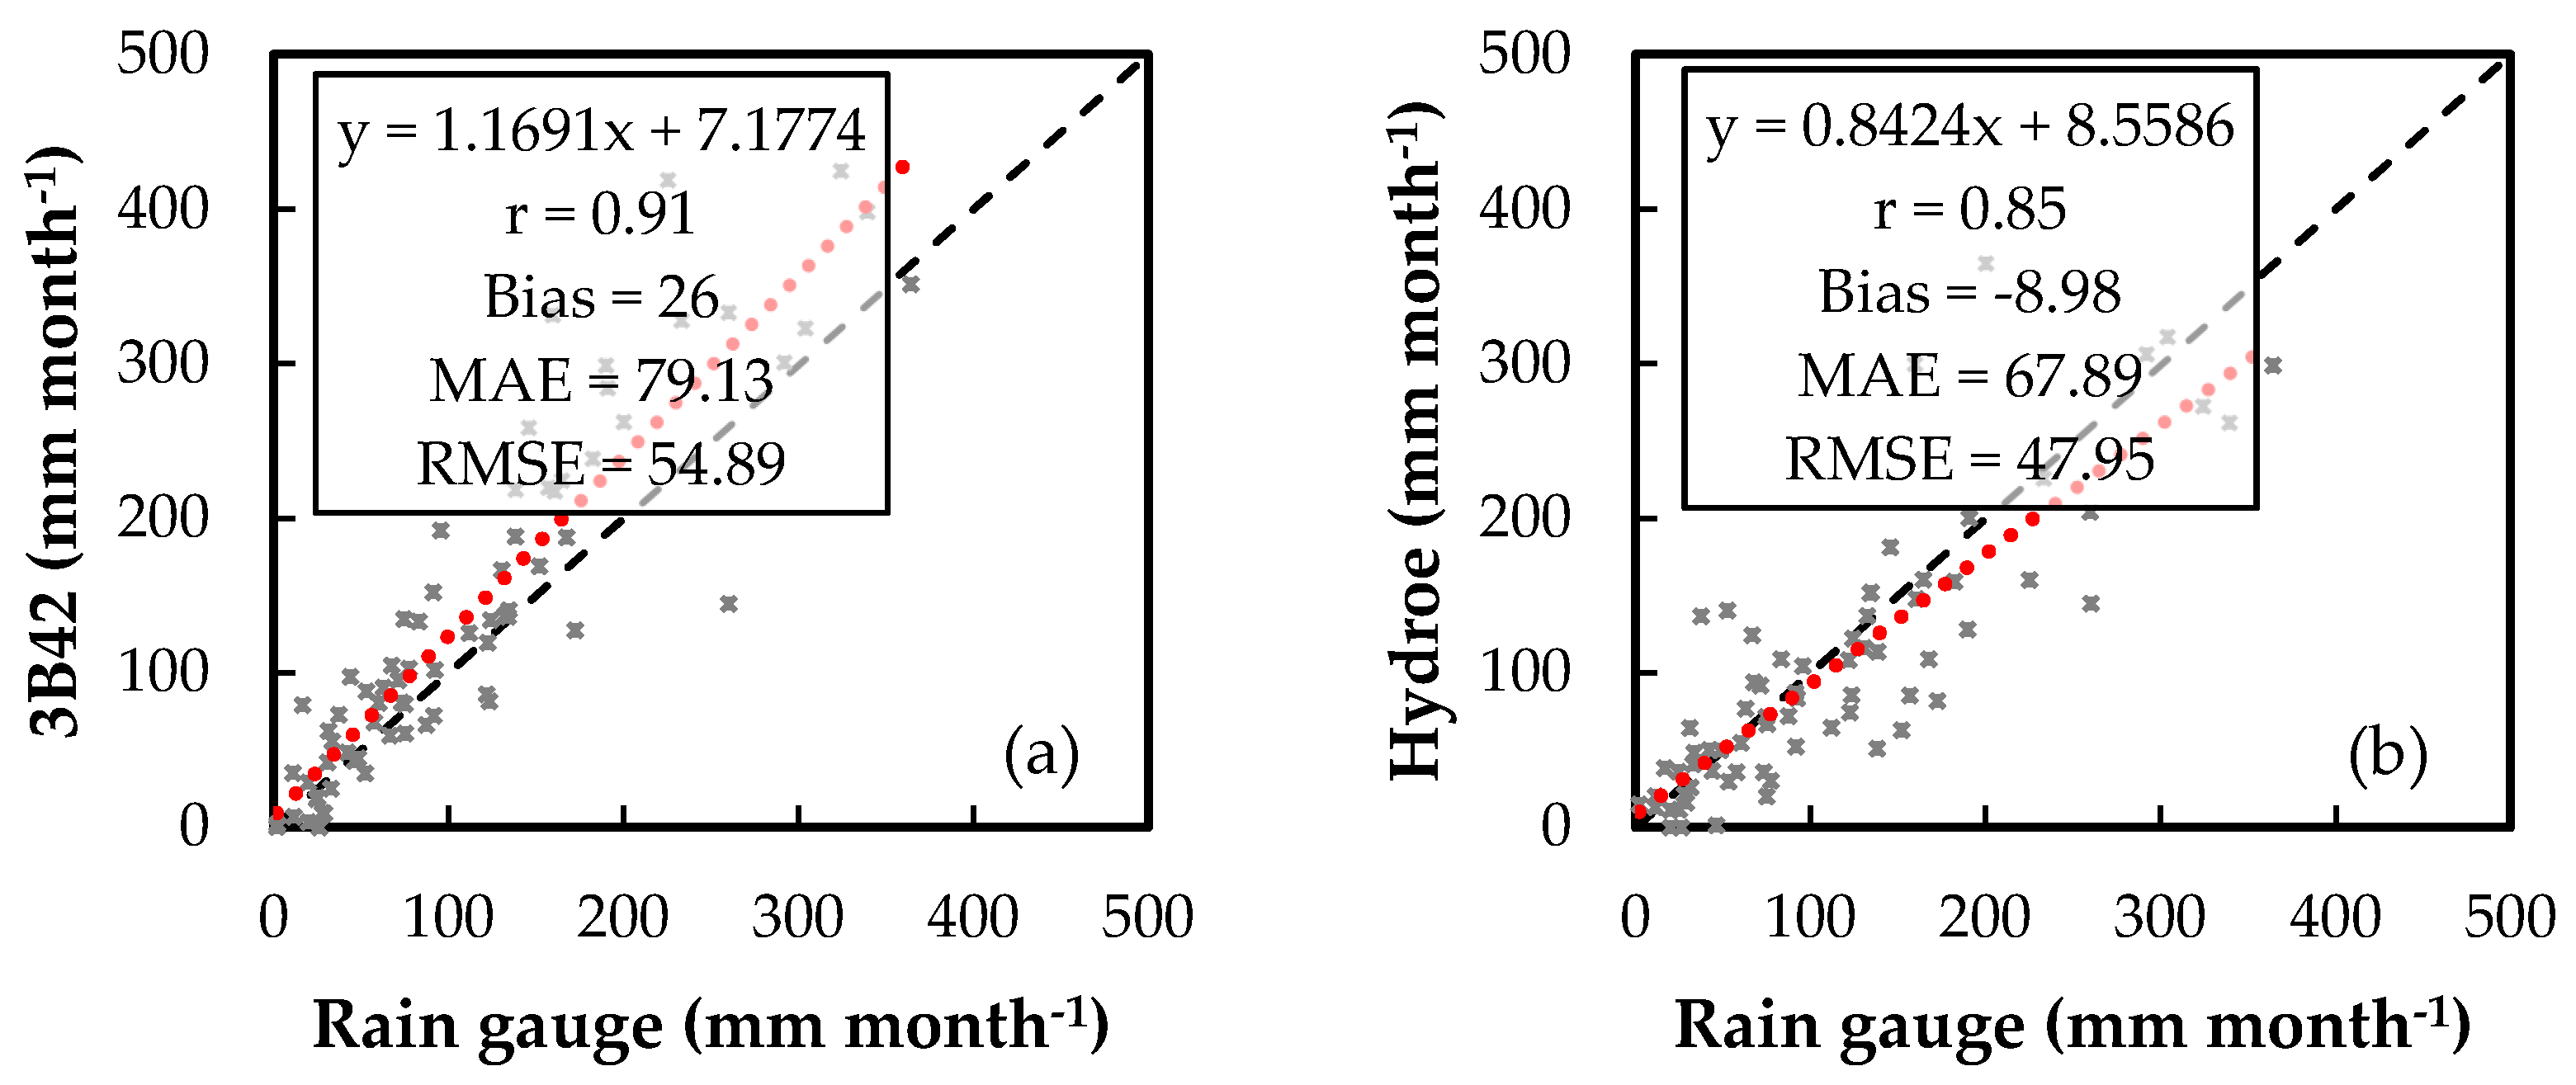
Figure 9a,b show the evaluations of the monthly rainfall estimates by TRMM and Hydroe. The 3B42 product had a higher r value (0.91) than Hydroe (r = 0.85). Similar to the daily behavior, the TRMM monthly data tended to overestimate the rainfall within the watershed by 26 mm (23%). The Hydroe product underestimated the rainfall with a bias of −9 mm (−8%). The MAE and RMSE values were considerably reduced compared to the daily results. The relative RMSE values were lower than 50% for both satellite products, suggesting that TRMM and Hydroe are more suitable for monthly applications than daily applications.
The errors in the monthly accumulated data with TRMM ranged from −115.5 mm (November 2011) to 194.25 mm (December 2010) (Figure 10). Even though these errors occurred during months with high rainfall rates, these contradictory values (high values of underestimation and overestimation) may be related to the types of clouds that generate rainfall. This indicates a possible limitation of TRMM precipitation products. Similarly, the analysis of the errors related to the Hydroe product showed a variation of −115.45 mm (November 2011) to 165.73 mm (February 2013) (Figure 10).
Because the analysis of the monthly error (Figure 10) did not allow the identification of a clear error pattern over the years, a seasonal evaluation was performed in order to understand the behavior of the mean seasonal rainfall according to the TRMM and Hydroe products. Table 5 and Table 6 present the r, bias, MAE, and RMSE values at the seasonal scale: December–February (DJF), March–May (MAM), June–August (JJA), and September–November (SON). The TRMM r varied between 0.75 (SON) and 0.87 (MAM and JJA) with higher values for all four seasons compared with Hydroe. The 3B42 product overestimated the seasonal accumulated rainfall, mainly during MAM (bias = 33.37 mm month−1; 38%). The relative RMSE of more than 60% indicates that the rainfall estimates for this season are unreliable. Therefore, the TRMM product is generally reliable for estimating the rainfall during DJF, JJA, and SON (%RMSE < 50%). Table 6 indicates that the Hydroe product had a maximum r value of 0.77 (MAN) and minimum value of 0.63 (SON). Despite the general trend of the monthly rainfall over the study area being underestimated (Figure 9b), the seasonal analysis detected a different performance for JJA. In this specific period, the Hydroe product overestimated the rainfall with a bias of 3.51 mm (8.8%). The relative RMSE value of >69% suggests that the JJA seasonal estimate from Hydroe is unreliable. This high relative RMSE value for the period of JJA may be related to the insensibility to low rainfall values (POFD = 0.44, Table 4), which is common during this period of the year when low monthly values of accumulated rainfall are often found (Figure 11).
Figure 11 illustrates the mean monthly rainfall from 2009 to 2014. The mean rainfall from TRMM 3B42 did not exceed the rain gauge data only in August, while it tended to overestimate the reference data in the other months. The Hydroe data reproduced the general pattern of monthly rainfall but overestimated January, June, July, and September.
3.3. Annual Scale
The final analysis was based on the annual accumulated rainfall (Figure 12). TRMM overestimated all six years of the analysis period. The highest error was in 2010, when it exceeded the rainfall observed by rain gauge stations by 700 mm. The lowest error was in 2014 at 30 mm. The Hydroe product had its highest error in 2009 with an underestimation of −260 mm, and the lowest error was in 2014 at 21 mm. Hydroe only overestimated the annual rainfall in 2013 and 2014.
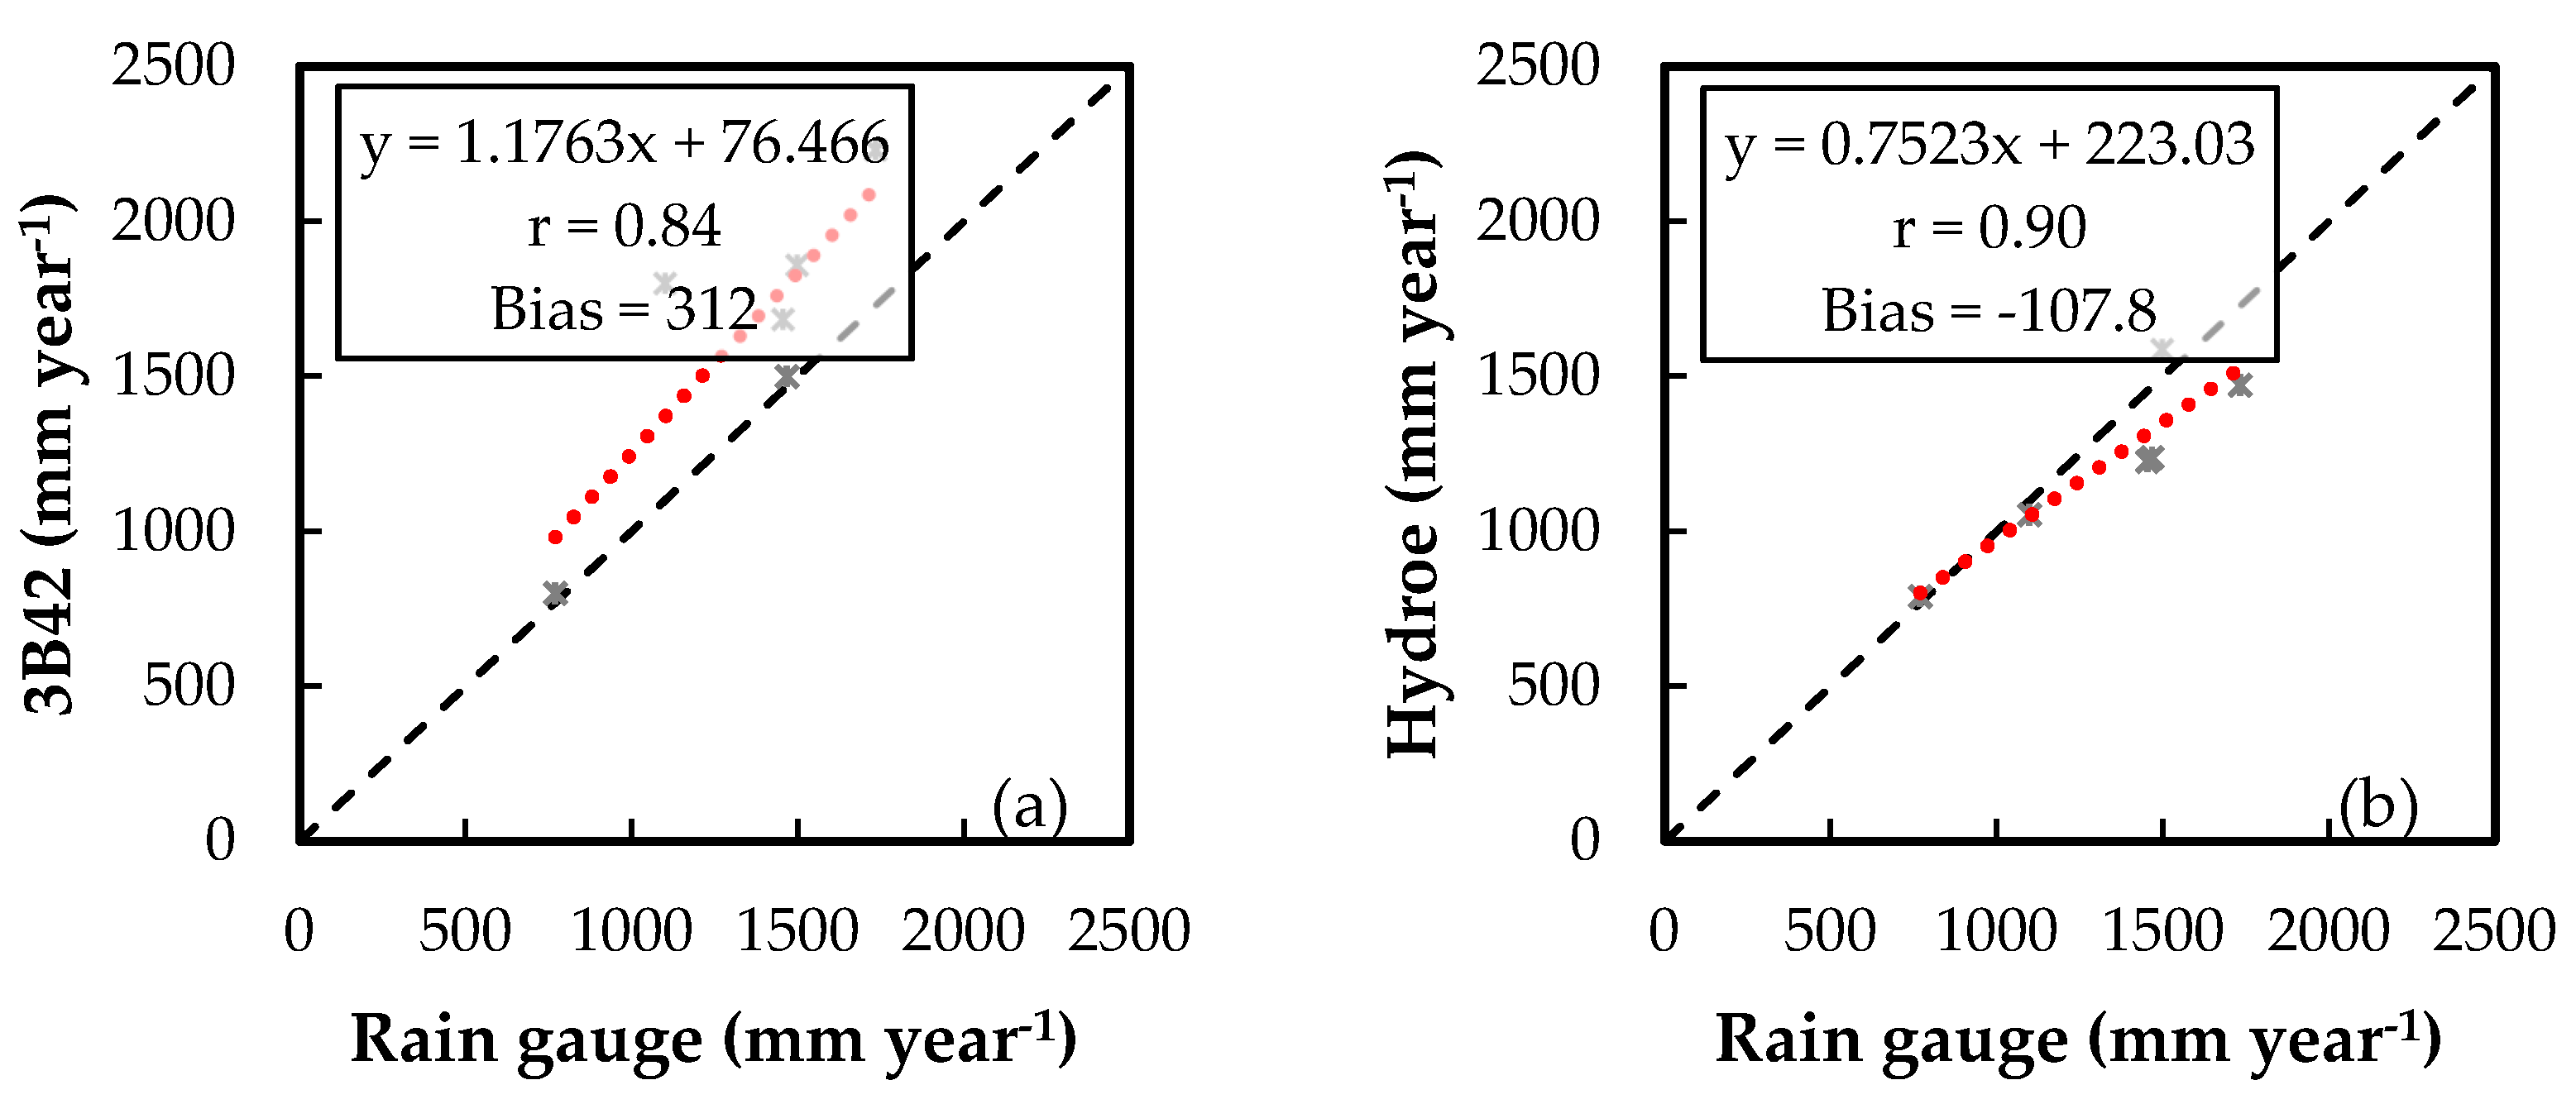
The correlation coefficient values (Figure 13a,b) showed that the annual rainfall over the watershed and estimated with the Hydroe product had a good correlation with the observed reference data (r = 0.90). Hydroe tended to underestimate the annual rainfall by −107 mm (−8%). The TRMM 3B42 product had an r value of 0.84 and bias of 312 mm, which is 23% higher relative to the observed value.
4. Discussion
The profiles of heavy rainfall events are largely subject to small-scale variabilities in space and time. Hence, the first validation was performed on the smallest possible spatial scale (point-to-pixel analysis) to understand the ability of the satellite products to estimate the daily rainfall at each point represented by the rain gauge stations. Ouatiki et al. [41] found low values for the linear relationship (<0.38) at all 19 rain gauge stations across a mountainous watershed in Morocco and explained that the low efficiency of the TRMM 3B42 product was due to the rapid cloud dynamics and the stormy nature of rainfall events in the study region. The authors also observed that the TRMM product had difficulties in estimating rainfall levels over mountainous regions receiving snowfall [41]. In general, the r values obtained with TRMM and Hydroe products in this work (Table 2) were higher than those measured in Morocco [41]. Yuan et al. [20] evaluated the quality of the daily TRMM 3B42 and GPM IMERG products at the locations of five rain gauges in Myanmar. The results showed considerable errors and low correlation coefficients for both products (r < 0.35) [20]. Jiang et al. [19] analyzed the TRMM 3B42 product across a large region of China and obtained higher correlation coefficients in the wet part of the study area, whereas lower r values occurred mostly in relatively dry regions. Although the rainfall over the study area was better estimated in this work than in the studies by Ouatiki et al. [41] and Yuan et al. [20], the TRMM and Hydroe products showed high error values. Comparing satellite pixels with data from rain gauge stations involves a mismatched spatial scale because the satellite products are extracted from an area of approximately 625 km2 for the TRMM products and of 25 km2 for the Hydroe products, unlike the rain gauges that provide punctual rainfall measurements.
The daily mean value results found here are similar to those reported in previous studies. We found higher r values with the TRMM 3B42 product than Collischonn et al. [42] and similar values to those reported by Nobrega et al. [43]. Nobrega et al. [43] noted that the good performance of TRMM with daily data is linked with the predominance of convective rainfall in the Jamari River Basin, Brazil. Soares et al. [44] found higher values for the correlation coefficient (between 0.75 and 0.89) than the results in this study (r = 0.70 for TRMM and r = 0.51 with Hydroe). The difference in performance may be related to the precipitation regimes of each region. The Sapucaí watershed has an average annual rainfall of 1200 mm, while Paraíba state, which is located in the semiarid region, varies from 300 to 1000 mm. Studies conducted in the mountainous regions of South Korea [21] and China [19] showed different r values. We found higher correlation coefficients with TRMM (r = 0.7, Figure 6a) and lower coefficients with Hydroe (r = 0.51, Figure 6b) than those reported by Jiang et al. [19] (r = 0.66). However, our results were slightly lower than those of Kim et al. [21], who identified an elevation-dependent performance for the TRMM product with high correlations at low elevations and low correlations at high elevations.
Based on the PSS values (Table 4), we found that the two satellite products were better at detecting days without rainfall (p = 0 mm day−1) than heavy rainfall events. Thus, the better performance may be explained by the greater ability to estimate days without rain than rainy days. These findings need to be interpreted with caution; a previous study [19] suggested that the capability of TRMM 3B42 at detecting rainfall events is influenced by the combination of the precipitation regime, latitude, and distance to the ocean. In this work, we used the POD to assess the ability of satellite products to estimate heavy rainfall events (rainfall > 11.57 mm day−1). Ouatiki et al. [41] and Yuan et al. [20] applied the POD to detect rainfall events (rainfall > 0.5 mm day−1) and found lower values than those reported here with the 3B42 product (POD = 0.7). The POD value with the Hydroe product (POD = 0.43) was similar to the values found by Ouatiki et al. [41] and higher than that reported by Yuan et al. [20]. The tendency of satellite products to overestimate or underestimate the rainfall over the study area was evaluated. Overall, the Hydroe algorithm showed a negative bias, and TRMM 3B42 showed a positive bias. Falck et al. [7] studied the rainfall estimated by TRMM 3B42, Hydroe, CMORPH, and GSMaP over the Tocantins-Araguaia catchment in Brazil and found different values: Hydroe exhibited a large positive bias in the middle and lower basins, and 3B42RT showed a bias close to zero in most regions of the basin. TRMM and Hydroe showed behavior specific to each basin; based on these results, they cannot be generalized to other study areas. Alfieri et al. [38] considered PSS > 0.5 to be a good indicator of a system’s ability at estimating rainfall values. From this perspective, only the 3B42 product showed values higher than 0.5 for both analyses. Therefore, it presented a better performance than the Hydroe product.
The daily rainfall data were integrated over time to monthly accumulated values. Overall, the satellite products reproduced the monthly rainfall of the watershed with a greater accuracy than the daily products. The monthly rainfall of the study period between January 2009 and December 2014 was used to detect the six rainiest months (October, November, December, January, February and March) and six drier months (April, May, June, July, August and September). This is the same profile found by Rao et al. [25]. The statistical values for the monthly data showed improvement compared with the results of the daily analysis. However, Curtarelli et al. [18] evaluated the monthly mean rainfall estimated with the TRMM 3B43 product over the Itumbiara Reservoir drainage area and found higher values (r = 0.96 and relative RMSE lower than 20%). Curtarelli et al. [18] also found better bias, MAE, and RMSE values with the seasonal evaluation, which indicates that the TRMM 3B43 product provides a reliable estimation of the rainfall over the Itumbiara Reservoir drainage area. Franchito et al. [9] analyzed data from the TRMM Precipitation Radar (PR) for the southeast region of Brazil and obtained lower values than the two products analyzed here. Oliveira et al. [45] studied the relation between TRMM data and rain gauges at monthly and annual scales over Brazilian Cerrado. They pointed out that errors in TRMM precipitation were the main source of water budget uncertainty. Oliveira et al. [45] found similar r and RMSE values to those obtained here with TRMM data but higher than the values found with Hydroe data.
Even though Thiemig et al. [46] found deficiencies in TRMM 3B42 for mountainous areas in Africa, where the rainfall was generally underestimated, we observed that TRMM tended to overestimate the rainfall over the study area. It still performed better than the Hydroe product. The better performance of TRMM can be linked to its embedded bias correction, which relies on rain gauge data and the multi-sensor technique. However, in order to extend the applications of TRMM products in hydrologic studies, the detection capability of the 3B42 product needs to be enhanced, especially at a daily scale [19]. In this context, GPM is expected to improve the next generation of global precipitation observation satellites.
5. Conclusions
In this study, satellite rainfall products represented by TRMM 3B42 and Hydroe were evaluated for the quality of their rainfall estimates at different temporal scales based on data from rain gauge stations over the Sapucaí watershed in a humid subtropical climate region of Brazil for the period of January 2009 to December 2014.
The results showed that TRMM performed better at the daily, monthly, and seasonal scales than Hydroe, while Hydroe presented a lower bias at the annual scale. However, they showed different trends. The TRMM product overestimated rainfall over the watershed at all temporal scales considered, whereas Hydroe underestimated the rainfall except for the JJA season at the seasonal scale, for which it overestimated the rainfall. In addition to the evaluations at different temporal scales, the ability of the satellite products to reproduce observed rainfall was evaluated according to contingency tables, with a focus on discriminating heavy rainfall events and days without rain. The results indicated that the 3B42 product was better able to represent the local heavy rainfall (PSS = 0.61) and days without rain (PSS = 0.63) than the Hydroe product (PSS = 0.37 for heavy rainfall events and 0.47 for days without rain). The findings of this study indicate that satellite rainfall products are better suited for applications at monthly and annual scales than at the daily scale, although further improvements are needed to reduce the errors of the daily data.
This study helps in enhancing our understanding of the accuracy of two satellite products (TRMM 3B42 v7 and Hydroe). However, given the sample size, the period analyzed, and the characteristics of the region, caution must be taken when considering the results presented. In summary, the results allow for discrimination between available products depending on the applications needed for regions with sparse or no rain gauge coverage, although the errors, uncertainties, potential, and limitations need to be kept in mind. Despite the differences between satellite rainfall data and ground data, this work emphasizes the use of remotely sensing data. Overall, the TRMM and Hydroe products were evaluated for their ability to estimate the rainfall over the Sapucaí watershed. The evaluation in this specific watershed is especially attractive for the community because it shows how precise rainfall estimates by remote sensing are over a mountainous region, which usually has a poor spatial coverage of rain gauge stations around the world. The results will be helpful for investigations or applications in hydrologic studies, such as managing floods. Further investigations should be conducted to examine the potential of calibration and bias correction for satellite products based on rain gauge data and the propagation of satellite precipitation uncertainties through a hydrologic model.
Acknowledgments
The authors acknowledge the financial support provided by the National Council for Scientific and Technological Development (CNPq) (under Grant No. 141379/2014-6). The Brazilian National for Space Research (INPE) provided all of the computational resources needed to process the dataset. The authors thank the research community for making satellite rainfall data available for this work.
Author Contributions
João Bosco Coura dos Reis is the main author and performed the analyses and wrote the paper with contributions from all coauthors. Camilo Daleles Rennó and Eymar Silva Sampaio Lopes supervised the research and contributed to discussions and the article’s organization.
Conflicts of Interest
The authors declare no conflict of interest.
References
- Brutsaert, W. Hydrology: An Introduction; Cambridge University Press: New York, NY, USA, 2005. [Google Scholar]
- Tan, M.L.; Tan, K.C.; Chua, V.P.; Chan, N.W. Evaluation of TRMM product for monitoring drought in the Kelantan River Basin, Malaysia. Water 2017, 9, 57. [Google Scholar] [CrossRef]
- Thiemig, V.; Rojas, R.; Zambrano-Bigiarini, M.; De Roo, A. Hydrological evaluation of satellite based rainfall estimates over the Volta and Baro-Akobo Basin. J. Hydrol. 2013, 499, 324–338. [Google Scholar] [CrossRef]
- Mehran, A.; Aghakouchak, A. Capabilities of satellite precipitation datasets to estimate heavy precipitation rates at different temporal accumulations. Hydrol. Process. 2014, 28, 2262–2270. [Google Scholar] [CrossRef]
- Wu, H.; Adler, R.F.; Tian, Y.; Huffman, J.G.; Li, H.; Wang, J. Real-time global flood estimation using satellite-based precipitation and a coupled land surface and routing model. Water Resour. Res. 2014, 50, 2693–2717. [Google Scholar] [CrossRef]
- Villarini, G.; Krajewski, W.F. Evaluation of the research version TMPA three-hourly 0.25 × 0.25° rainfall estimates over Oklahoma. Geophys. Res. Lett. 2007, 34, 1–5. [Google Scholar] [CrossRef]
- Falck, A.S.; Maggioni, J.T.; Vila, D.A.; Diniz, F.L.R. Propagation of satellite precipitation uncertainties through a distributed hydrologic model: A case study in the Tocantins-Araguaia basin in Brazil. J. Hydrol. 2015, 527, 943–957. [Google Scholar] [CrossRef]
- World Meteorological Organization (WMO). Guide to Hydrological Practices: Data Acquisition and Processing, Analysis, Forecasting and Other Applications, 5th ed.; WMO: Geneva, Switzerland, 1994. [Google Scholar]
- Franchito, S.H.; Rao, V.B.; Vasques, A.C.; Santo, C.M.E.; Conforte, J.C. Validation of TRMM precipitation radar monthly rainfall estimates over Brazil. J. Geophys. Res. 2009, 114. [Google Scholar] [CrossRef]
- Duan, Z.; Bastiaanssen, W.F.M. First results from Version 7 TRMM 3B43 precipitation product in combination with a new downscaling-calibration procedure. Remote Sens. Environ. 2013, 131, 1–13. [Google Scholar] [CrossRef]
- Kidd, C.; Levizzani, V. Status of satellite precipitation retrievals. Hydrol. Earth Syst. Sci. 2010, 15, 1109–1116. [Google Scholar] [CrossRef] [Green Version]
- Center for Weather Forecasting and Climate Studies (CPTEC). Available online: http://www.cptec.inpe.br/ (accessed on 6 April 2017).
- Scofield, R.A.; Kuligowski, R.J. Status and outlook of operational satellite precipitation algorithms for extreme-precipitation events. Weather Forecast. 2003, 18, 1037–1051. [Google Scholar] [CrossRef]
- Huffman, G.J.; Adler, R.F.; Bolvin, D.T.; Gu, G.; Nelkin, E.J.; Bowman, K.P.; Hong, Y.; Stocker, E.F.; Wolff, D.B. The TRMM multisatellite precipitation analysis: Quasi-global, multiyear, combined-sensor precipitation estimates at fine scale. J. Hydrometeorol. 2007, 8, 38–55. [Google Scholar] [CrossRef]
- Hou, A.Y.; Kakar, R.K.; Neeck, S.; Azarbarzin, A.A.; Kummerow, C.D.; Kojima, M.; Oki, R.; Nakaruma, K.; Iguchi, T. The global precipitation measurement mission. Bull. Am. Meteorol. Soc. 2014, 95, 701–722. [Google Scholar] [CrossRef]
- Yong, B.; Liu, D.; Gourley, J.J.; Tian, Y.; Huffman, G.J.; Ren, L.; Hong, Y. Global view of real-time TRMM multisatellite precipitation analysis: Implications for its successor global precipitation measurement mission. Bull. Am. Meteorol. Soc. 2015, 96, 283–296. [Google Scholar] [CrossRef]
- Huffman, G.J.; Bolvin, D.T.; Braithwaite, D.; Hsu, K.; Joyce, R.; Xie, P.; Yoo, S.H. NASA Global Precipitation Measurement (GPM) Integrated Multi-Satellite Retrievals for GPM (IMERG); Algorithm Theoretical Basis Document, Version 4.5; NASA/GSFC: Greenbelt, MD, USA, 2015.
- Curtarelli, M.P.; Rennó, C.D.; Alcântara, E.H.E. Evaluation of the Tropical Rainfall Measuring Mission 3B43 product over an inland area in Brazil and the effects of satellite boost on rainfall estimates. J. Appl. Remote Sens. 2014, 8. [Google Scholar] [CrossRef]
- Jiang, D.; Zhang, H.; Li, R. Performance evaluation of TMPA version 7 estimates for precipitation and its extremes in Circum-Bohai-Sea region, China. Theor. Appl. Climatol. 2016. [Google Scholar] [CrossRef]
- Yuan, F.; Zhang, L.; Win, K.W.W.; Ren, L.; Zhao, C.; Zhu, Y.; Jiang, S.; Liu, Y. Assessment of GPM and TRMM multi-satellite precipitation products in streamflow simulations in a data-sparse mountainous watershed in Myanmar. Remote Sens. 2017, 9, 302. [Google Scholar] [CrossRef]
- Kim, J.P.; Jung, I.W.; Park, K.W.; Yoon, S.K.; Lee, D. Hyrological utility and uncertainty of multi-satellite precipitation products in the mountainous region of South Korea. Remote Sens. 2016, 8, 608. [Google Scholar] [CrossRef]
- Alfieri, L.; Smith, P.; Thielen, J.; Beven, K. A staggered approach to flash flood forecasting—Case study in the Cevennes Region. Adv. Geosci. 2011, 29, 13–20. [Google Scholar] [CrossRef] [Green Version]
- Alfieri, L.; Thielen, J.; Pappenberger, F. Ensemble hydro-meteorological simulation for flash flood early detection in southern Switzerland. J. Hydrol. 2012, 424–425, 143–153. [Google Scholar] [CrossRef]
- Peel, M.C.; Finlayson, B.I.; McMahon, T.A. Update world map of the Köppen-Geiger climate classification. Hidrol. Earth Syst. Sci. 2007, 11, 1633–1644. [Google Scholar] [CrossRef]
- Rao, V.B.; Franchito, S.H.; Santo, C.M.E.; Gan, M.A. An update on the rainfall characteristics of Brazil: Seasonal variations and trends in 1979–2011. Int. J. Climatol. 2016, 36, 291–302. [Google Scholar] [CrossRef]
- VIDA. Plano Diretor de Recursos Hídricos da Bacia Hidrográfica do rio Sapucaí—Resumo Executivo. Belo Horizonte, Brazil, 2010. Available online: http://www.igam.mg.gov.br/images/stories/planos_diretores_BH/sapucai.pdf (accessed on 6 April 2017).
- Pinheiro, V.M. Avaliação Técnica e Histórica das Enchentes em Itajubá. Master’s Thesis, University of Itajubá, Itajubá, Brazil, 2005. (In Portuguese). [Google Scholar]
- Reis, J.B.C.; Pons, N.A.D.; Lopes, E.S.S. Monitoramento e alerta de inundações no município de Itajubá (MG) por regressão polinomial. Geociências 2016, 35, 134–148. (In Portuguese) [Google Scholar]
- HidroWeb: Sistema de Informações Hidrológicas. Available online: www.snirh.gov.br/hidroweb/ (accessed on 6 April 2017).
- TRMM Data Downloads. Available online: https://pmm.nasa.gov/data-access/downloads/trmm (accessed on 6 April 2017).
- Vicent, G.; Davenport, J.C.; Scofield, R.A. The role of orographic and parallax corrections on real time high resolution satellite rainfall rate distribution. Int. J. Remote Sens. 2002, 23, 221–230. [Google Scholar] [CrossRef]
- Vila, D.; Lima, A. Satellite rainfall estimation over South America: The hydroestimator technique. In Proceedings of the 14th International Conference on Clouds and Precipitation, Bologna, Italy, 19–23 July 2004; pp. 8–23. [Google Scholar]
- DSA: Satellite Division and Environmental Systems. Available online: http://satelite.cptec.inpe.br/atendimento/formulario.jsp?i=en (accessed on 6 April 2017).
- Salas, J.D. Analysis and modeling of hydrologic time series. In Handbook of Hydrology; Maidment, D.R., Ed.; McGraw-Hill: New York, NY, USA, 1993; pp. 1–72. [Google Scholar]
- United Nations Educational, Scientific and Cultural Organization (UNESCO). Methodological Guide for Developing the Water Balance of South America; UNESCO/ROSTLAC: Montevideo, Uruguay, 1982. [Google Scholar]
- R Core Team. R: A Language and Environment for Statistical Computing; R Foundation for Statistical Computing: Vienna, Austria, 2016; Available online: https://www.R-project.org/ (accessed on 6 April 2017).
- Hijmans, R.J. Raster: Geographic Data Analysis and Modeling. R Package Version 2.6-7. 2017. Available online: https://CRAN.R-project.org/package=raster (accessed on 6 April 2017).
- Alfieri, L.; Burek, P.; Dutra, E.; Krzeminski, D.; Thielen, J.; Pappenberger, F. GloFAS—Global ensemble streamflow forecasting and flood early warning. Hydrol. Earth Syst. Sci. 2013, 17, 1161–1175. [Google Scholar] [CrossRef] [Green Version]
- Thiemig, V.; Bisselink, B.; Pappenberger, F.; Thielen, J. A pan-African medium-range ensemble flood forecast system. Hydrol. Earth Syst. Sci. 2015, 19, 1–21. [Google Scholar] [CrossRef]
- Peirce, C.S. The numerical measure of the success of predictions. Science 1884, 4, 453–454. [Google Scholar] [CrossRef] [PubMed]
- Ouatiki, H.; Boudhar, A.; Tramblay, Y.; Jarlan, L.; Benabdelouhab, T.; Hanich, L.; Meslouhi, M.R.E.; Chehbouni, A. Evaluation of TRMM 3B42 v7 rainfall product over the Oum Er Rbia watershed in Morocco. Climate 2017, 5, 1. [Google Scholar] [CrossRef]
- Collischonn, B.; Allasia, D.; Collischonn, W.; Tucci, C.E.M. Desempenho do satélite TRMM na estimativa de precipitação sobre a bacia do Paraguai superior. Rev. Bras. Cartogr. 2007, 59, 93–99. [Google Scholar]
- Nóbrega, R.S.; Souza, E.P.; Galvíncio, J.D. Análise da estimativa de precipitação do TRMM em uma sub-bacia da Amazônia Ocidental. Rev. Geogr. 2008, 25, 6–20. (In Portuguese) [Google Scholar]
- Soares, A.S.D.; Paz, A.R.; Piccilli, D.G.A. Avaliação das estimativas de chuva do satélite TRMM no Estado da Paraíba. RBRH 2016, 21, 288–299. (In Portuguese) [Google Scholar] [CrossRef]
- Oliveira, P.T.S.; Nearing, M.A.; Moran, M.S.; Goodrich, D.C.; Wendland, E.; Gupta, H.V. Trends in water balance components across the Brazilian Cerrado. Water Resour. Res. 2014, 50, 7100–7114. [Google Scholar] [CrossRef]
- Thiemig, V.; Rojas, R.; Zambrano-Bigiarini, M.; Levizzani, V.; De Roo, A. Validation of satellite-based precipitation products over sparsely-gauged African river basins. J. Hydrometeorol. 2012, 13, 1760–1783. [Google Scholar] [CrossRef]
Figure 1.
Study area. (a) Location of the watershed in Brazil (red rectangle). (b) Limit, main drainage system, and topography of the study area. The yellow and red points represent the locations of rain gauge stations used in this study.
Figure 1.
Study area. (a) Location of the watershed in Brazil (red rectangle). (b) Limit, main drainage system, and topography of the study area. The yellow and red points represent the locations of rain gauge stations used in this study.
Figure 2.
Mean monthly rainfall from 1970 to 2010 in the study area.
Figure 3.
Differences in the daily rainfall amount: daily rainfall amount of 3B42 (3-hourly), daily 3B42 product, daily Hydroestimator product, and daily rain gauge data (ANA) (UTC).
Figure 3.
Differences in the daily rainfall amount: daily rainfall amount of 3B42 (3-hourly), daily 3B42 product, daily Hydroestimator product, and daily rain gauge data (ANA) (UTC).

Figure 4.
Spatial distributions of rain gauge stations, the TRMM 3B42, and the Hydroe grid in the study area.
Figure 4.
Spatial distributions of rain gauge stations, the TRMM 3B42, and the Hydroe grid in the study area.
Figure 5.
Scatter plots of the RMSE variation as a function of elevation for (a) TRMM 3B42 and (b) Hydroe products. The trend line is shown in red.
Figure 5.
Scatter plots of the RMSE variation as a function of elevation for (a) TRMM 3B42 and (b) Hydroe products. The trend line is shown in red.

Figure 6.
Scatter plots comparing the daily mean rainfalls obtained with the reference data (rain gauge) and with (a) TRMM 3B42 and (b) Hydroe. The statistical values are in the insets. The bias, MAE, and RMSE values are in millimeters. The trend line is in red, and the 1:1 ratio is represented by a dashed line.
Figure 7.
Analysis of the daily error: error time series of (a) TRMM and (b) Hydroe. The dark gray line represents the error, and the light gray bar highlights the rainy period.
Figure 7.
Analysis of the daily error: error time series of (a) TRMM and (b) Hydroe. The dark gray line represents the error, and the light gray bar highlights the rainy period.

Figure 8.
Rain gauge (reference data), TRMM 3B42, and Hydroe monthly rainfall over the study area from January 2009 to December 2014.
Figure 8.
Rain gauge (reference data), TRMM 3B42, and Hydroe monthly rainfall over the study area from January 2009 to December 2014.
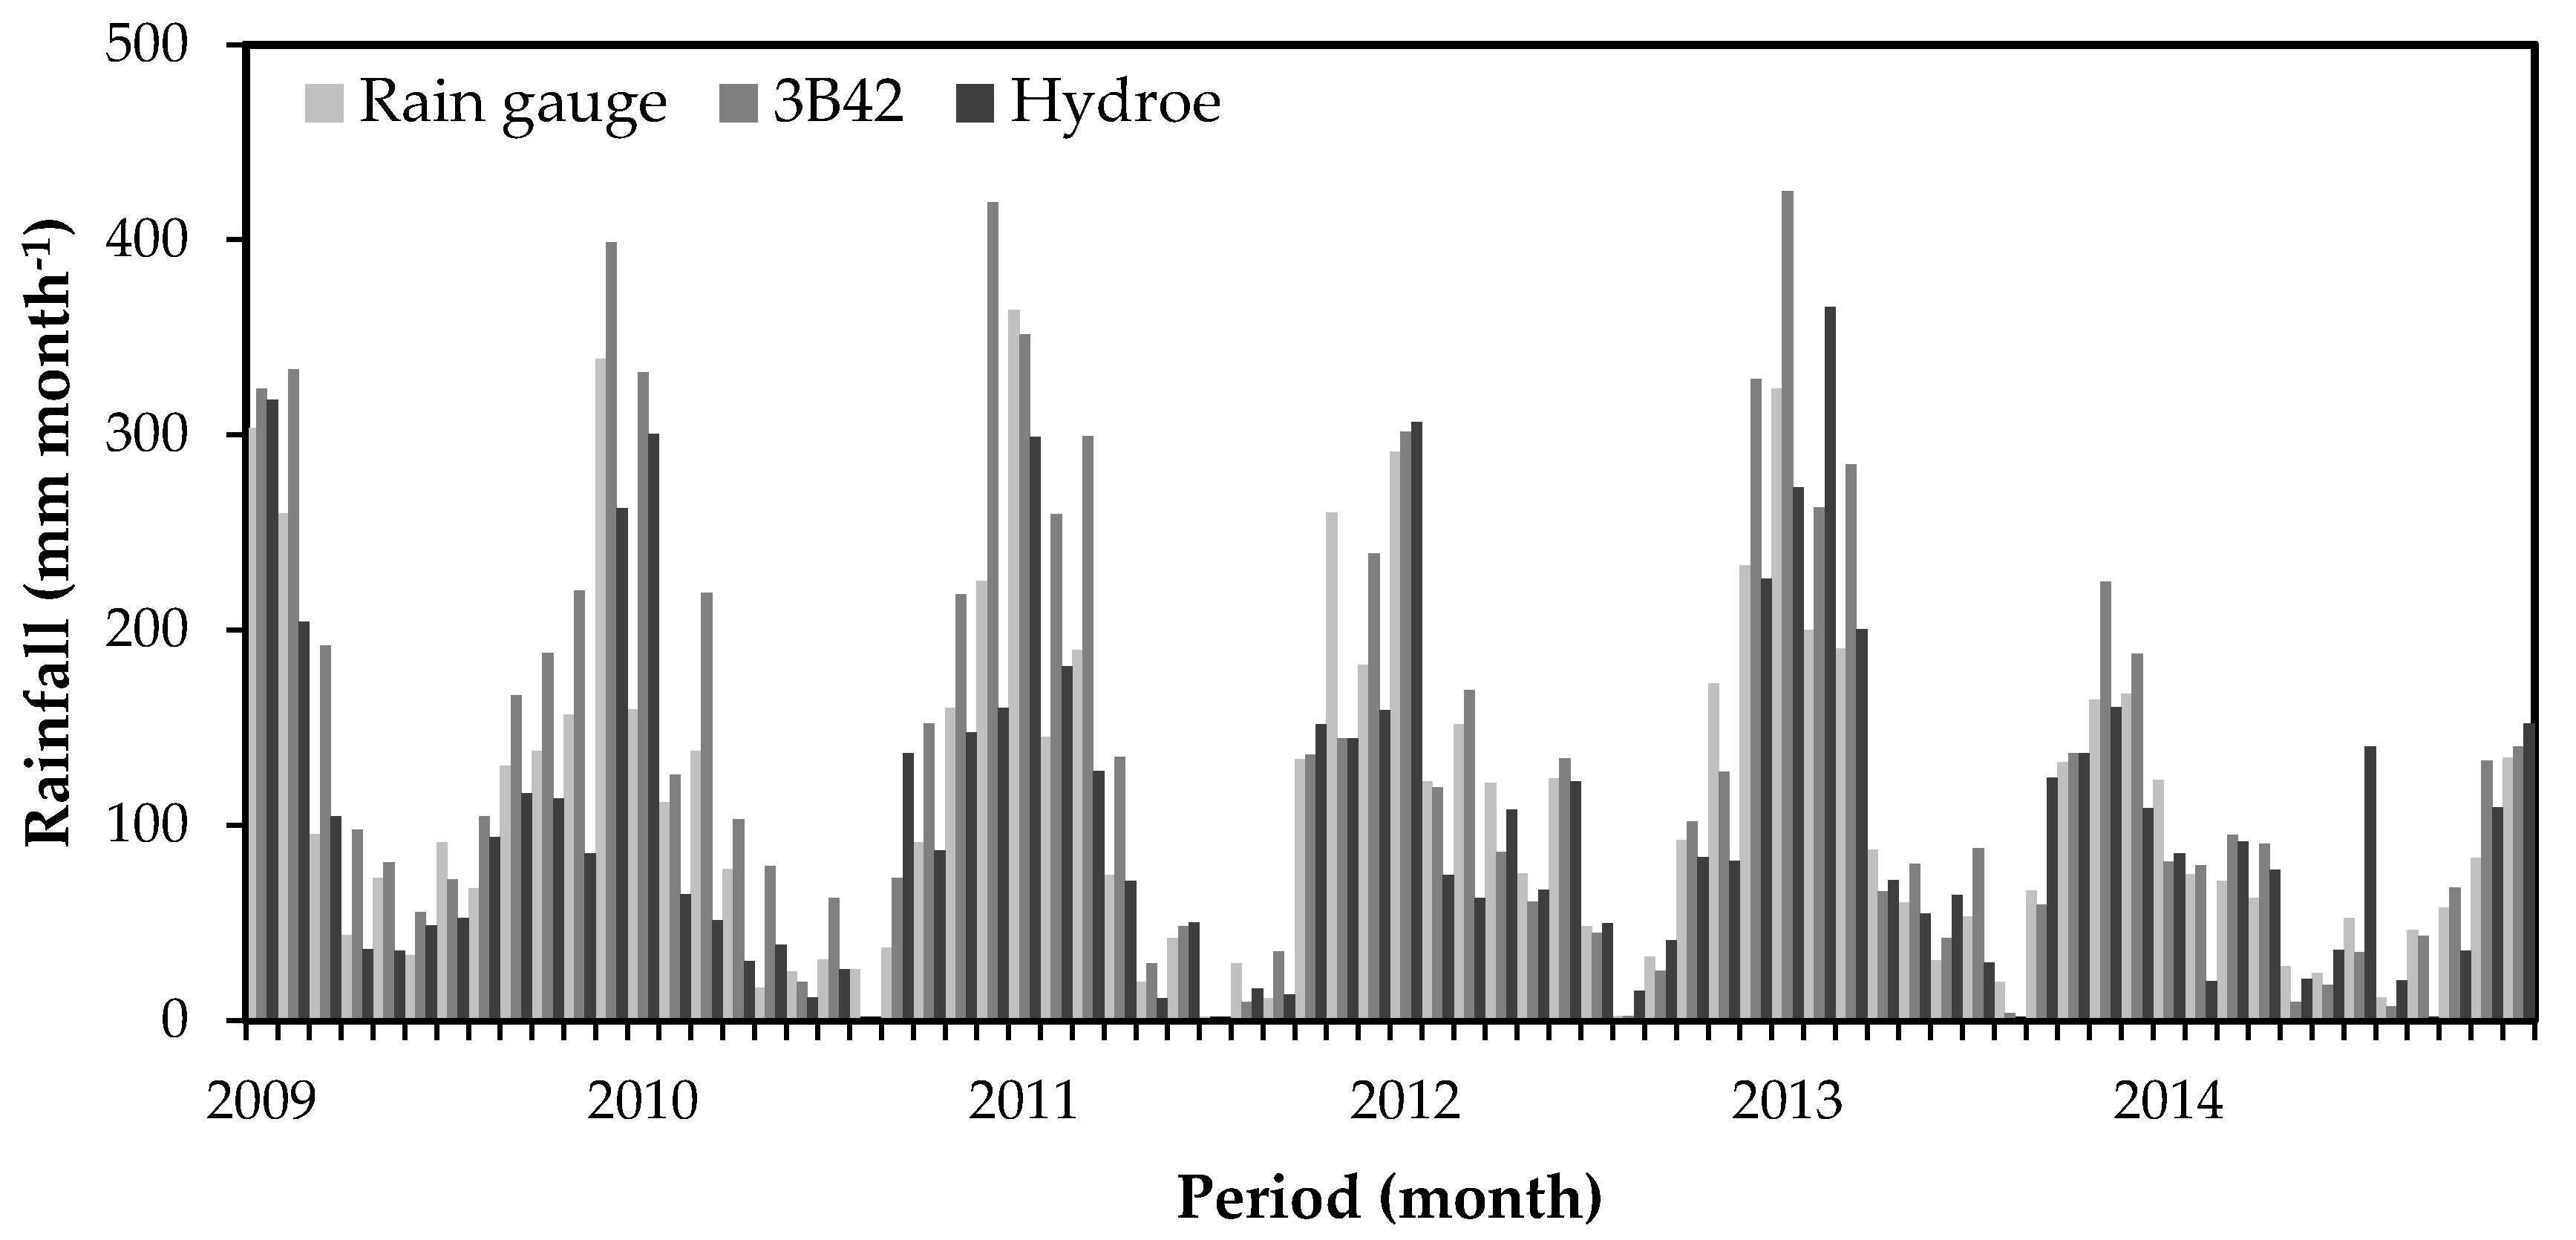
Figure 9.
Scatter plots comparing the monthly mean rainfalls obtained with reference data (rain gauge) and with (a) TRMM 3B42 and (b) Hydroe. The statistical values are in the insets. The bias, MAE, and RMSE values are in millimeters. The trend line is in red, and the 1:1 ratio is given by the dashed line.

Figure 10.
Analysis of the monthly error: error time series of (a) TRMM 3B42 and (b) Hydroe. The light gray bar highlights the rainy period.
Figure 10.
Analysis of the monthly error: error time series of (a) TRMM 3B42 and (b) Hydroe. The light gray bar highlights the rainy period.
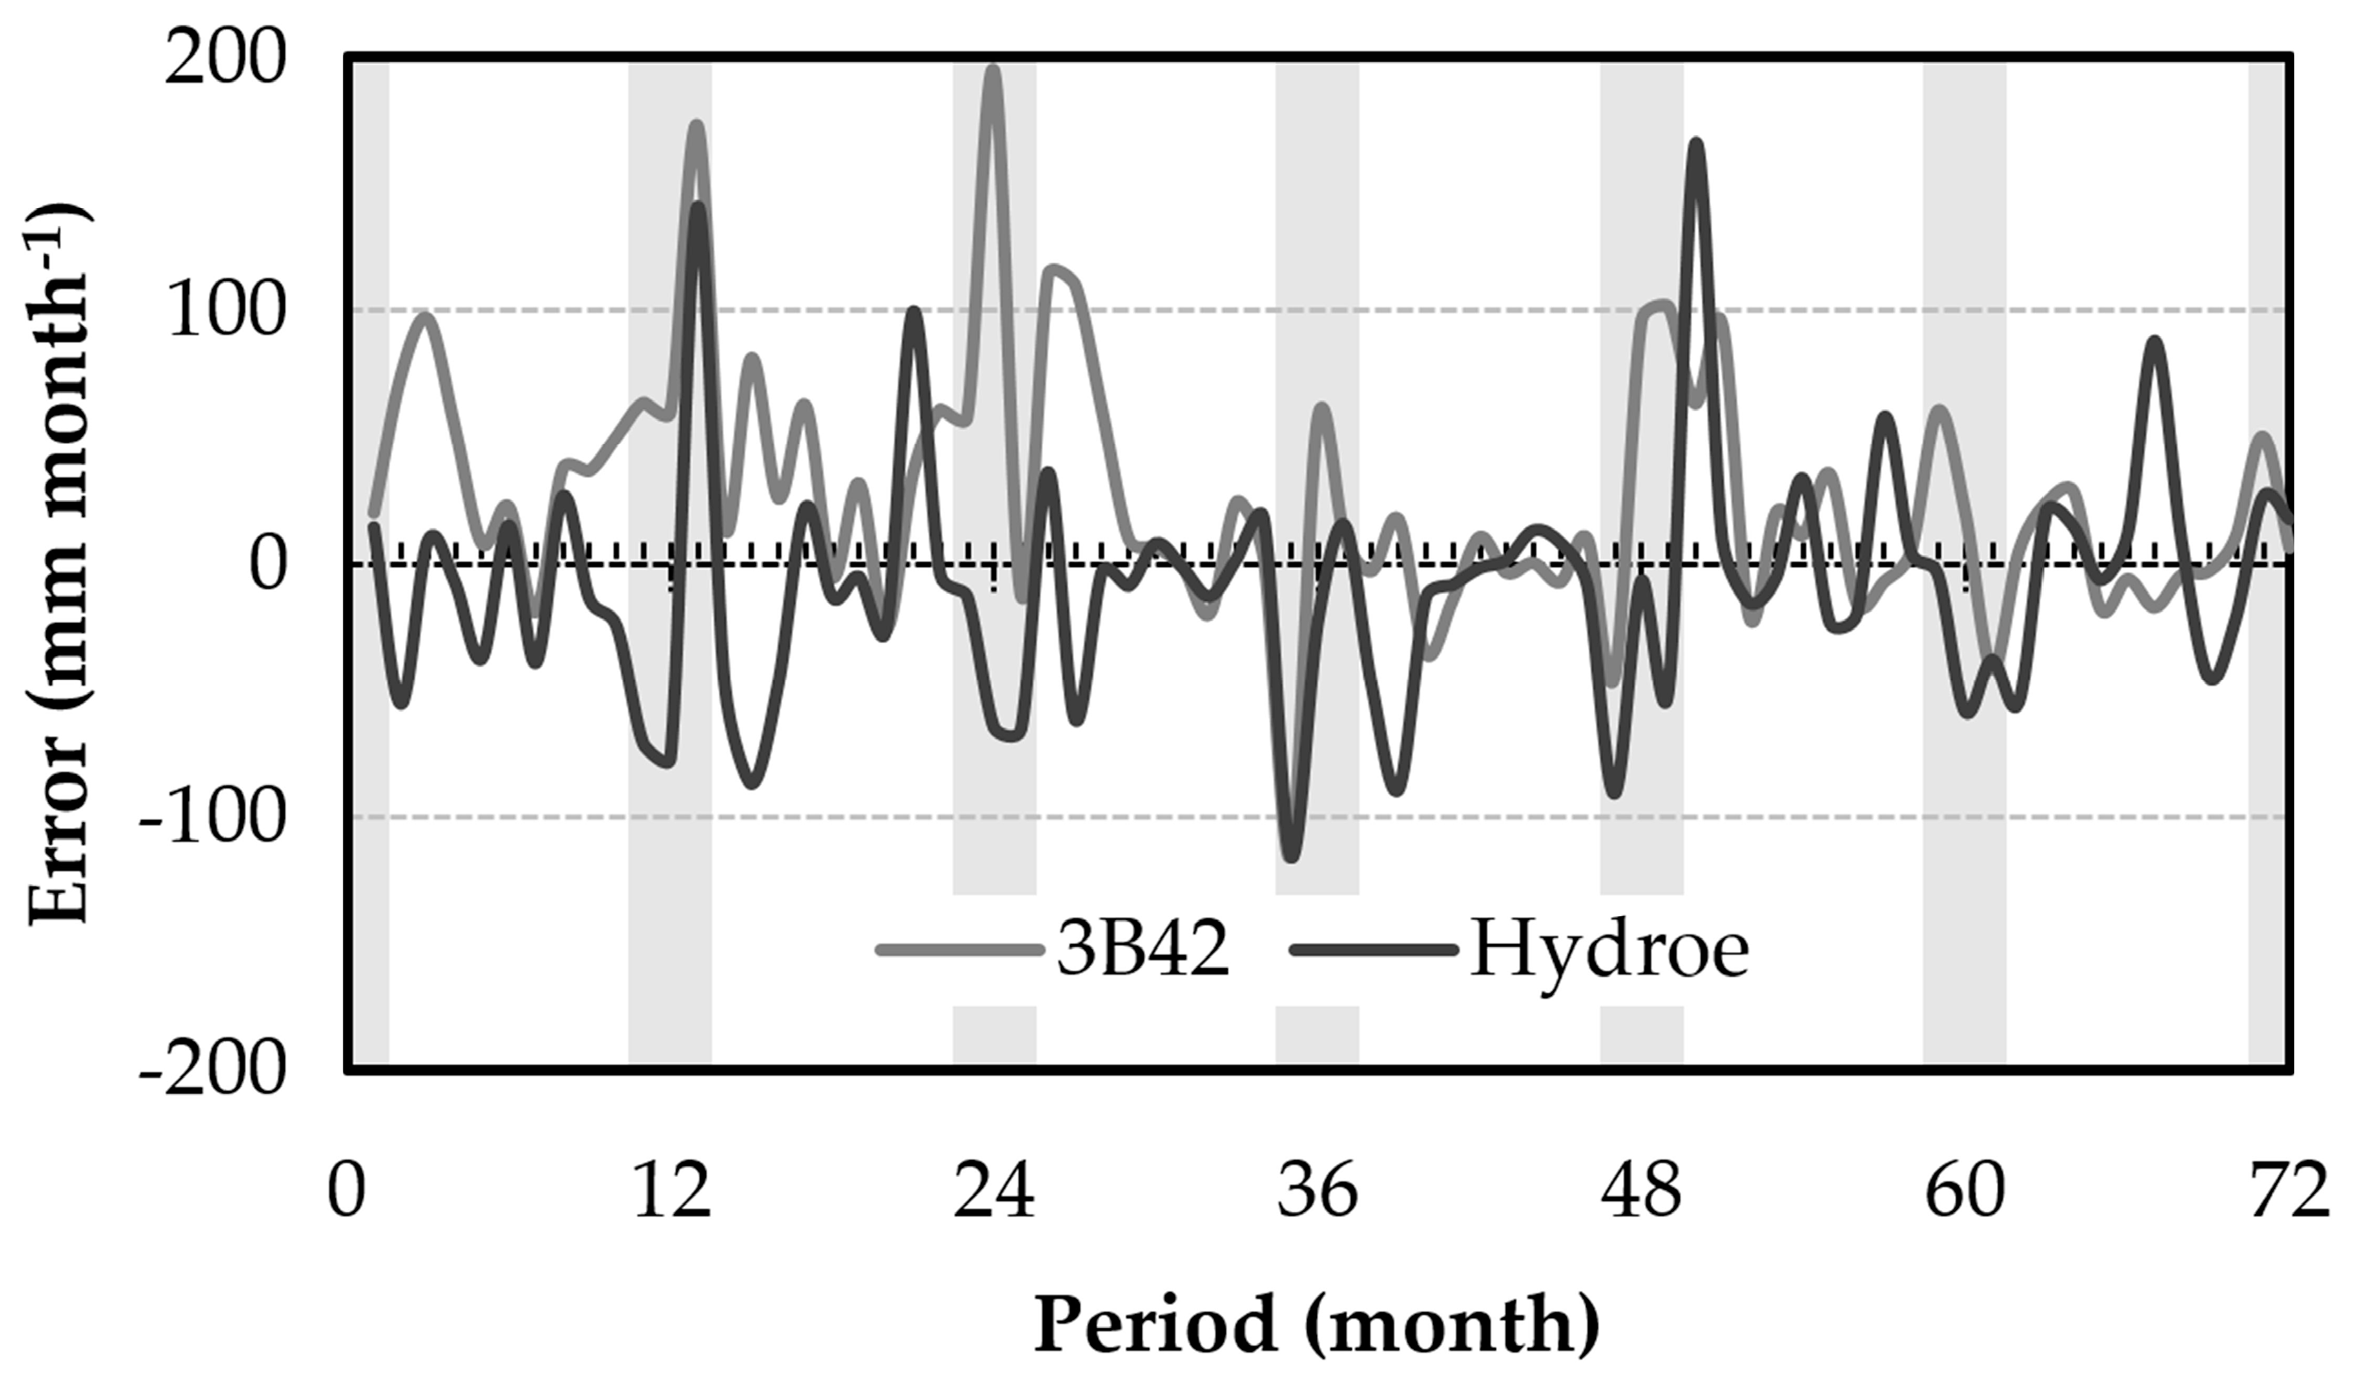
Figure 11.
Mean monthly rainfall from 2009 to 2014.
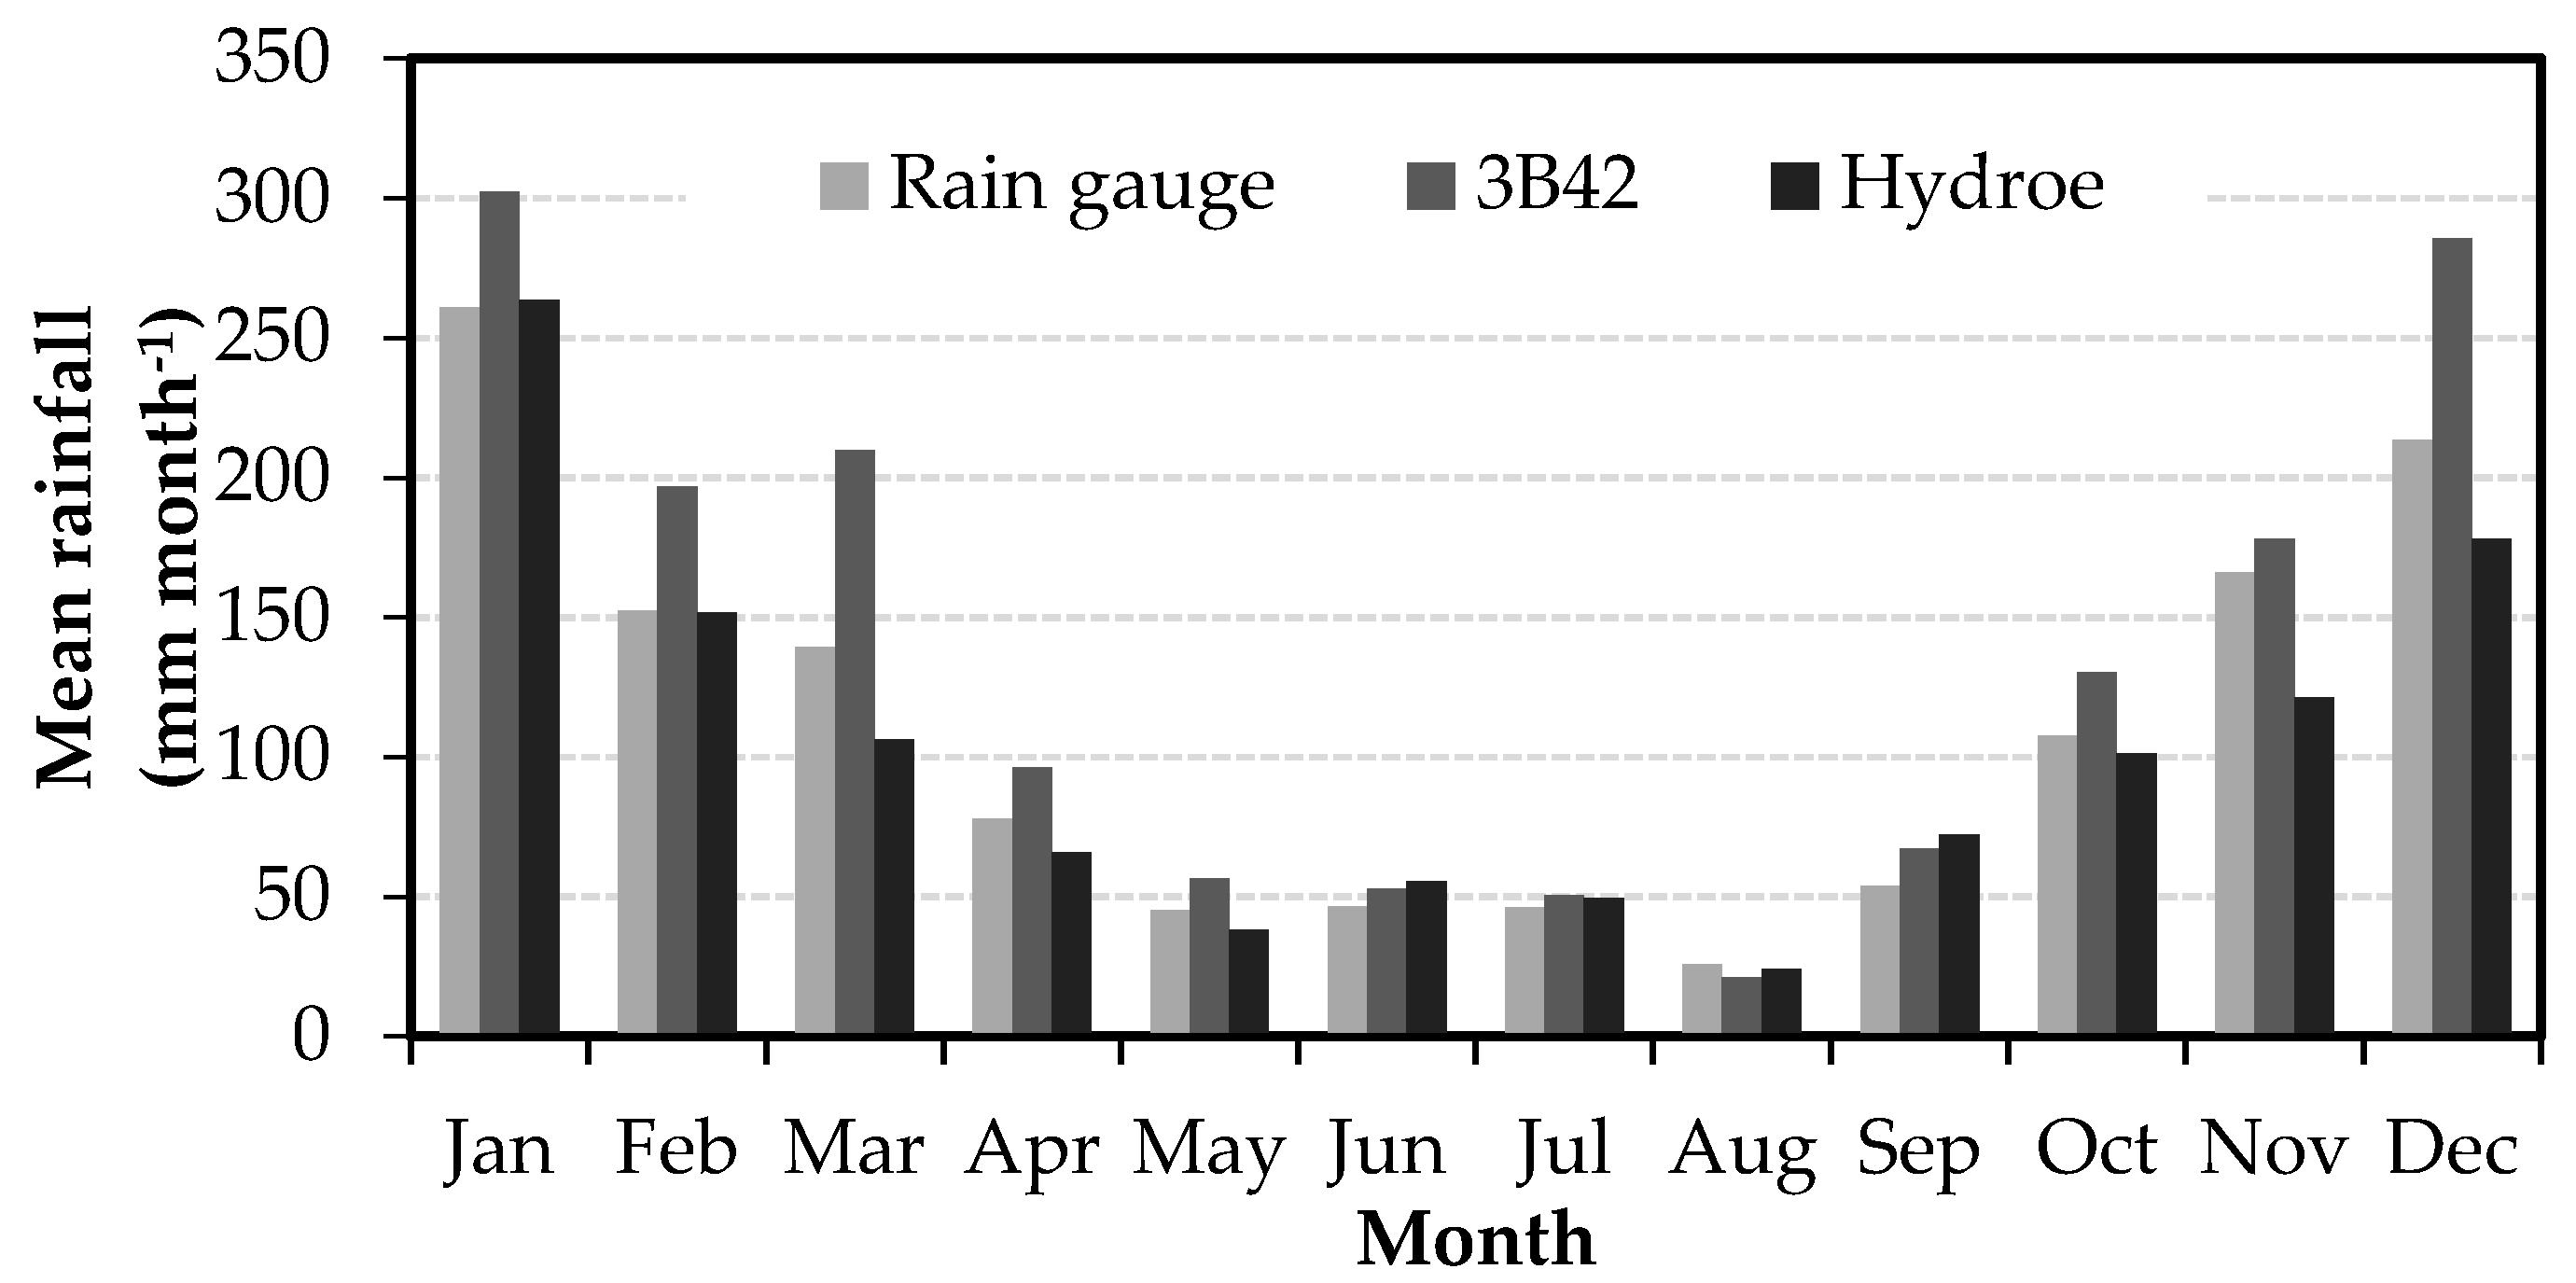
Figure 12.
Annual rainfall from 2009 to 2014.
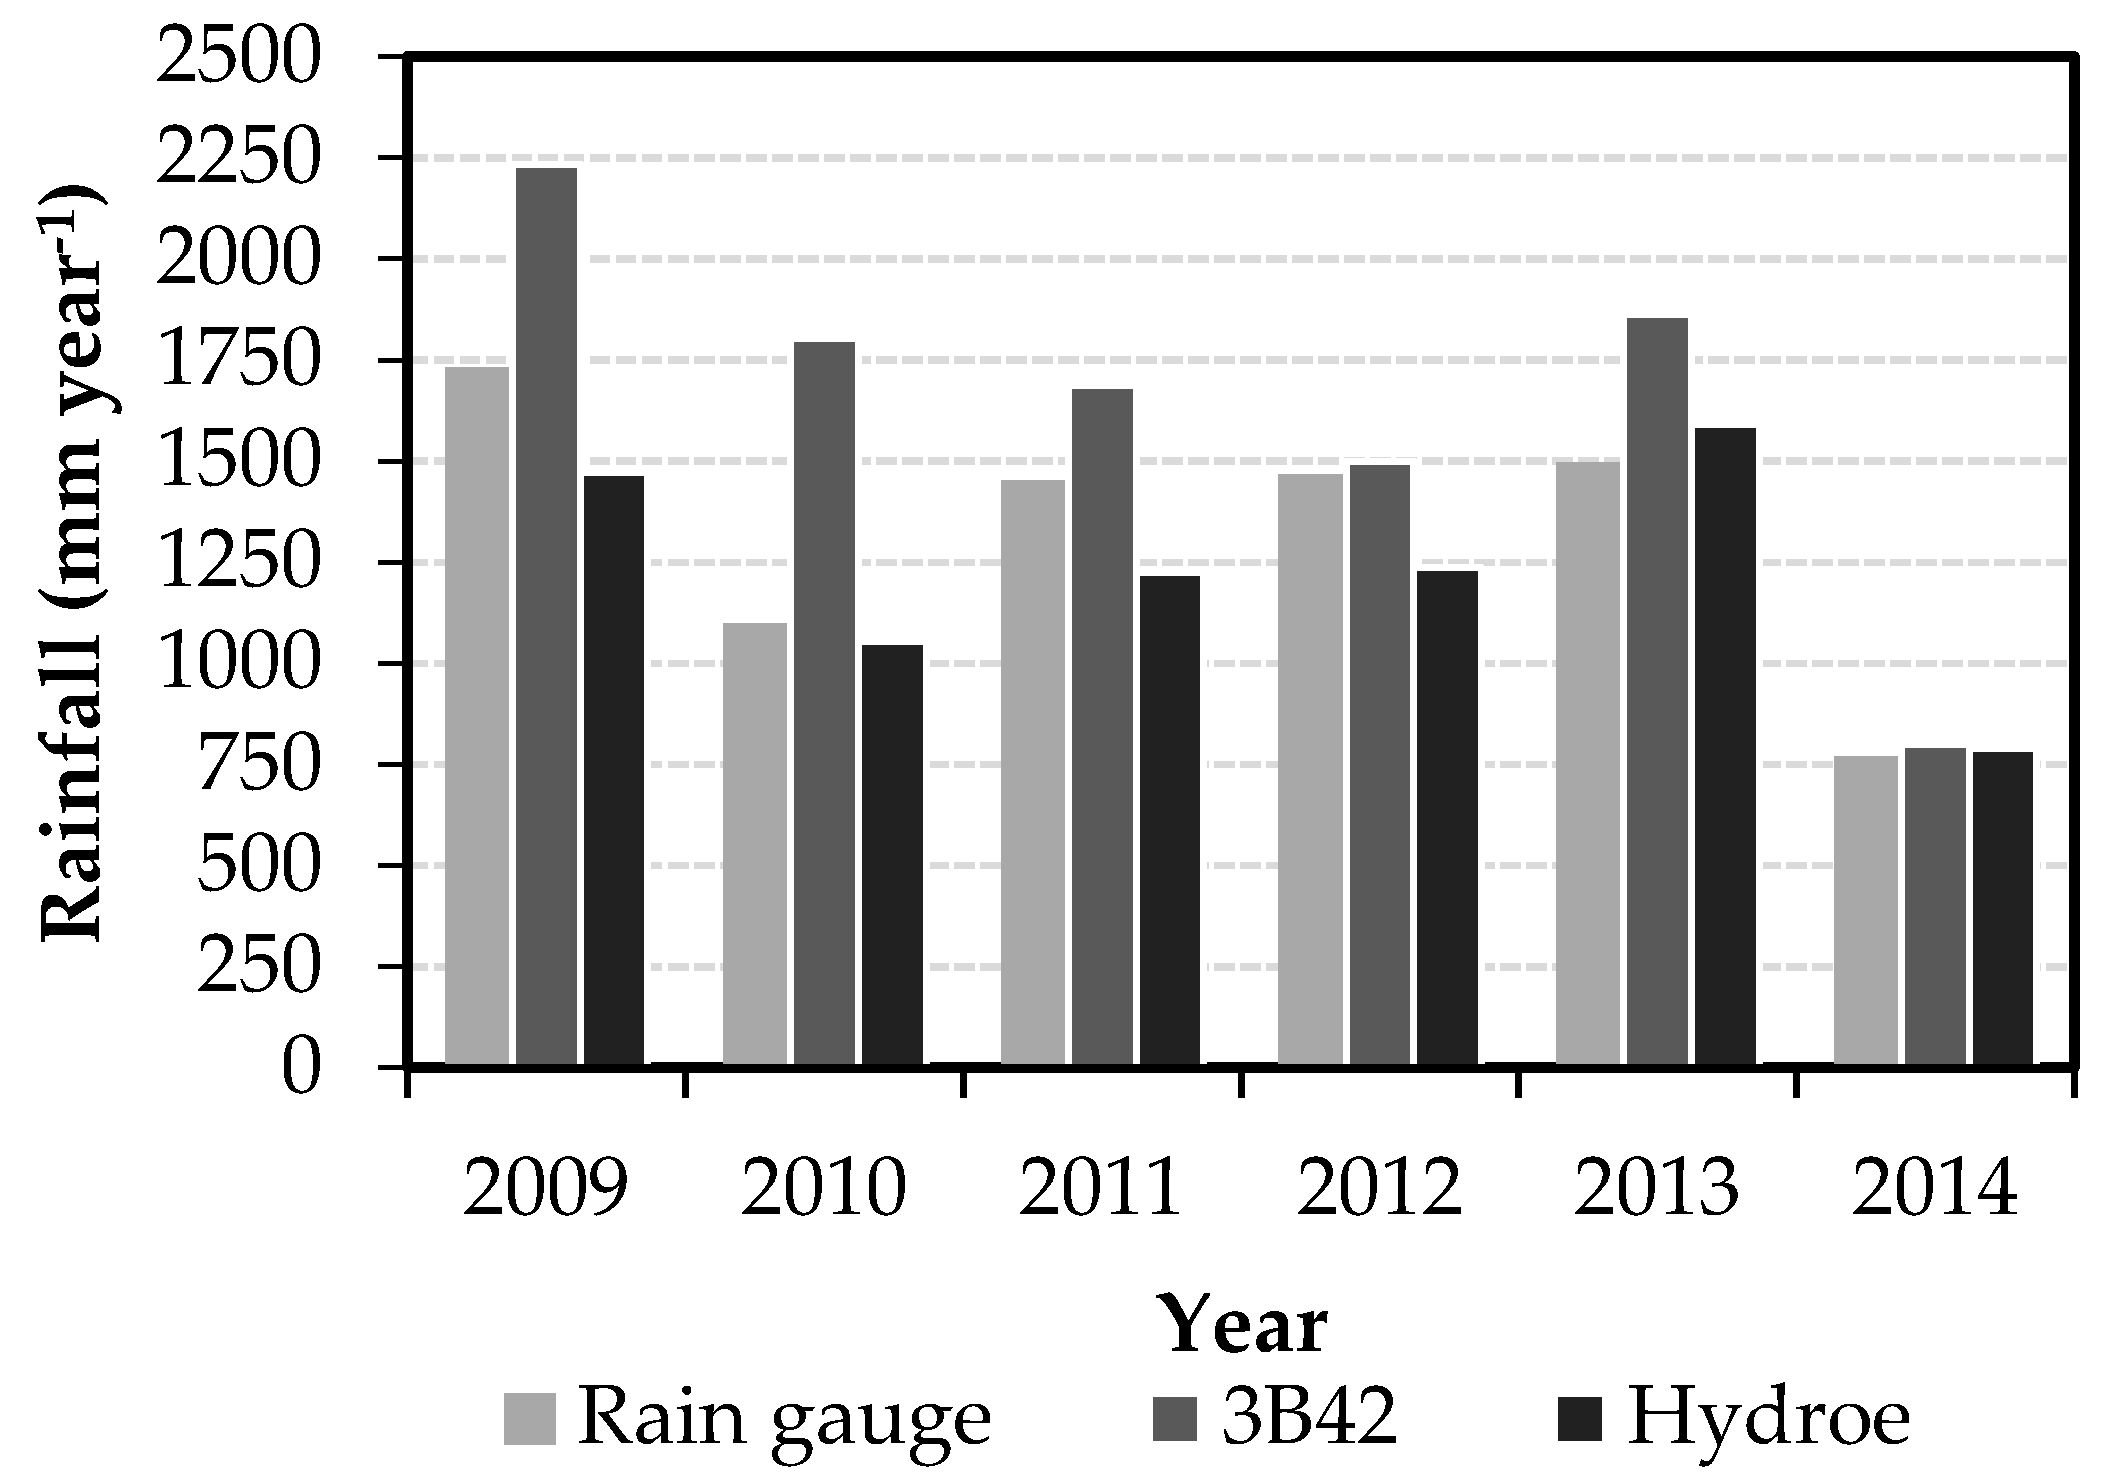
Figure 13.
Scatter plots comparing the annual mean rainfalls obtained with reference data (rain gauge) and with (a) TRMM 3B42 and (b) Hydroe. The statistical values are in the insets. The bias values are in millimeters. The trend line is in red, and the 1:1 ratio is given by the dashed line.
Figure 13.
Scatter plots comparing the annual mean rainfalls obtained with reference data (rain gauge) and with (a) TRMM 3B42 and (b) Hydroe. The statistical values are in the insets. The bias values are in millimeters. The trend line is in red, and the 1:1 ratio is given by the dashed line.

Table 1.
Summary of rain gauge stations used as a reference.
| Station/Provider | Elevation (m) | Latitude (°) | Longitude (°) |
|---|---|---|---|
| 2245018/ANA | 1585 | −45.567 | −22.717 |
| 2245087/ANA | 1479 | −45.215 | −22.407 |
| 2245070/ANA | 853 | −45.622 | −22.471 |
| 2245010/ANA | 1516 | −45.481 | −22.689 |
| 2245083/ANA | 854 | −45.447 | −22.376 |
| Borges/Unifei | 925 | −45.460 | −22.572 |
| Água Limpa/Unifei | 858 | −45.368 | −22.469 |
| Delfim Moreira/Unifei | 1203 | −45.286 | −22.510 |
| Cantagalo/Unifei | 856 | −45.392 | −22.477 |
| Santa Rosa/Unifei | 850 | −45.424 | −22.446 |
| Santana/Unifei | 864 | −45.382 | −22.507 |
Table 2.
Contingency table.
| Observed | |||
|---|---|---|---|
| Yes | No | ||
| Estimated | Yes | Hits (H) | False alarms (FA) |
| No | Misses (M) | Correct negatives (CN) | |
Table 3.
Summary of the point-to-pixel evaluation data. The bias, MAE, and RMSE values are shown in millimeters.
Table 3.
Summary of the point-to-pixel evaluation data. The bias, MAE, and RMSE values are shown in millimeters.
| Station | r | Bias | MAE | RMSE | ||||||
|---|---|---|---|---|---|---|---|---|---|---|
| TRMM | Hydroe | TRMM | Hydroe | TRMM | Hydroe | TRMM | % | Hydroe | % | |
| 2254010 | 0.47 | 0.33 | 0.35 | −1.18 | 5.86 | 5.05 | 9.42 | 224.30 | 9.36 | 222.88 |
| 2245018 | 0.53 | 0.33 | 0.83 | −0.57 | 5.68 | 4.90 | 9.03 | 247.77 | 9.82 | 269.36 |
| 2245070 | 0.64 | 0.42 | 0.74 | −0.28 | 5.73 | 5.12 | 8.04 | 224.32 | 9.49 | 264.77 |
| 2245083 | 0.23 | 0.19 | 1.07 | 0.07 | 5.83 | 5.24 | 12.06 | 363.90 | 11.71 | 353.42 |
| 2245087 | 0.51 | 0.37 | 0.46 | −1.07 | 6.03 | 5.17 | 9.15 | 223.81 | 9.30 | 227.66 |
| Água Limpa | 0.54 | 0.35 | 1.08 | 0.45 | 5.53 | 5.27 | 8.86 | 267.54 | 10.75 | 324.71 |
| Borges | 0.57 | 0.43 | 0.44 | −0.83 | 6.15 | 5.48 | 9.12 | 221.79 | 9.88 | 240.22 |
| Cantagalo | 0.56 | 0.39 | 0.82 | −0.06 | 5.69 | 5.24 | 8.68 | 243.42 | 9.87 | 276.68 |
| Delfim Moreira | 0.55 | 0.37 | 1.26 | 0.12 | 5.52 | 4.94 | 8.68 | 263.58 | 9.77 | 296.63 |
| Santana | 0.55 | 0.37 | 1.36 | 0.37 | 5.51 | 5.04 | 8.64 | 268.52 | 9.95 | 309.46 |
| Santa Rosa | 0.61 | 0.40 | 0.88 | −0.03 | 5.67 | 5.19 | 8.13 | 231.77 | 9.76 | 278.18 |
| Mean value | 0.53 | 0.36 | 0.84 | −0.27 | 5.75 | 5.15 | 9.07 | 252.79 | 9.97 | 278.54 |
Table 4.
Evaluation of satellite rainfall products based on the contingency table for days without rain (p = 0 mm day−1) and heavy rainfall events (90th percentile of gauge observations).
Table 4.
Evaluation of satellite rainfall products based on the contingency table for days without rain (p = 0 mm day−1) and heavy rainfall events (90th percentile of gauge observations).
| p = 0 mm day−1 | Rain Gauge | Heavy Rainfall | Rain Gauge | ||||
|---|---|---|---|---|---|---|---|
| Yes | No | Yes | No | ||||
| 3B42 | Yes | 693 | 341 | 3B42 | Yes | 153 | 161 |
| No | 101 | 1056 | No | 67 | 1810 | ||
| Hydroe | Yes | 729 | 620 | Hydroe | Yes | 94 | 116 |
| No | 65 | 777 | No | 126 | 1855 | ||
| Satellite | POD | POFD | PSS | Satellite | POD | POFD | PSS |
| 3B42 | 0.87 | 0.24 | 0.63 | 3B42 | 0.70 | 0.08 | 0.61 |
| Hydroe | 0.92 | 0.44 | 0.47 | Hydroe | 0.43 | 0.06 | 0.37 |
Table 5.
Mean seasonal values of the TRMM 3B42 product for the bias, MAE, and RMSE.
| Season | r | Bias | MAE | RMSE | |||
|---|---|---|---|---|---|---|---|
| mm month−1 | % | mm month−1 | % | mm month−1 | % | ||
| DJF | 0.83 | 52.77 | 25.27 | 90.09 | 43.14 | 81.43 | 39 |
| MAM | 0.87 | 33.37 | 38.11 | 52.45 | 60 | 53.96 | 61.6 |
| JJA | 0.87 | 1.89 | 4.76 | 26.76 | 67.55 | 18.95 | 47.83 |
| SON | 0.75 | 15.97 | 14.6 | 52.91 | 48.42 | 46.35 | 42.41 |
Table 6.
Mean seasonal values of the Hydroe product for the bias, MAE, and RMSE.
| Season | r | Bias | MAE | RMSE | |||
|---|---|---|---|---|---|---|---|
| mm month−1 | % | mm month−1 | % | mm month−1 | % | ||
| DJF | 0.75 | −11.05 | −5.29 | 79.85 | 38.23 | 67.63 | 32.38 |
| MAM | 0.77 | −17.46 | −19.9 | 36.72 | 41.93 | 37.19 | 42.47 |
| JJA | 0.72 | 3.51 | 8.8 | 26.65 | 67.26 | 27.63 | 69.74 |
| SON | 0.63 | −10.93 | −10 | 45.43 | 41.6 | 49.75 | 45.53 |
© 2017 by the authors. Licensee MDPI, Basel, Switzerland. This article is an open access article distributed under the terms and conditions of the Creative Commons Attribution (CC BY) license (http://creativecommons.org/licenses/by/4.0/).
Share and Cite
MDPI and ACS Style
Dos Reis, J.B.C.; Rennó, C.D.; Lopes, E.S.S. Validation of Satellite Rainfall Products over a Mountainous Watershed in a Humid Subtropical Climate Region of Brazil. Remote Sens. 2017, 9, 1240. https://doi.org/10.3390/rs9121240
AMA Style
Dos Reis JBC, Rennó CD, Lopes ESS. Validation of Satellite Rainfall Products over a Mountainous Watershed in a Humid Subtropical Climate Region of Brazil. Remote Sensing. 2017; 9(12):1240. https://doi.org/10.3390/rs9121240
Chicago/Turabian StyleDos Reis, João Bosco Coura, Camilo Daleles Rennó, and Eymar Silva Sampaio Lopes. 2017. "Validation of Satellite Rainfall Products over a Mountainous Watershed in a Humid Subtropical Climate Region of Brazil" Remote Sensing 9, no. 12: 1240. https://doi.org/10.3390/rs9121240
Note that from the first issue of 2016, this journal uses article numbers instead of page numbers. See further details here.