Evaluation of Seed Emergence Uniformity of Mechanically Sown Wheat with UAV RGB Imagery
by
 ,
,
Tao Liu
1, 
Rui Li
1,
Xiuliang Jin
2,
Jinfeng Ding
1,
Xinkai Zhu
1,
Chengming Sun
1,* and
Wenshan Guo
1,* 1
Jiangsu Key Laboratory of Crop Genetics and Physiology/Co-Innovation Center for Modern Production Technology of Grain Crops, Yangzhou University, Yangzhou 225009, China
2
INRA-EMMAH, UMT-CAPTE, 84914 Avignon, France
*
Authors to whom correspondence should be addressed.
Remote Sens. 2017, 9(12), 1241; https://doi.org/10.3390/rs9121241
Submission received: 29 September 2017
/
Revised: 27 November 2017
/
Accepted: 28 November 2017
/
Published: 1 December 2017
(This article belongs to the Special Issue Estimation of Crop Phenotyping Traits using Unmanned Ground Vehicle and Unmanned Aerial Vehicle Imagery)
Abstract
:The uniformity of wheat seed emergence is an important characteristic used to evaluate cultivars, cultivation mode and field management. Currently, researchers typically investigated the uniformity of seed emergence by manual measurement, a time-consuming and laborious process. This study employed field RGB images from unmanned aerial vehicles (UAVs) to obtain information related to the uniformity of wheat seed emergence and missing seedlings. The calculation of the length of areas with missing seedlings in both drill and broadcast sowing can be achieved by using an area localization algorithm, which facilitated the comprehensive evaluation of uniformity of seed emergence. Through a comparison between UAV images and the results of manual surveys used to gather data on the uniformity of seed emergence, the root-mean-square error (RMSE) was 0.44 for broadcast sowing and 0.64 for drill sowing. The RMSEs of the numbers of missing seedling regions for broadcast and drill sowing were 1.39 and 3.99, respectively. The RMSEs of the lengths of the missing seedling regions were 12.39 cm for drill sowing and 0.20 cm2 for broadcast sowing. The UAV image-based method provided a new and greatly improved method for efficiently measuring the uniformity of wheat seed emergence. The proposed method could provide a guideline for the intelligent evaluation of the uniformity of wheat seed emergence.

1. Introduction
Wheat seedlings grown under non-uniform conditions will result in yield loss. Excessive planting density will reduce the availability of nutrients and intensify intraspecific competition between plants, which will further affect growth and development as well as reduce productivity [1]. However, while a sparse planting density can ensure full development of individual plants, poor soil fertility and a lack of luminous energy may make it difficult to achieve ideal output, and result in different levels of reduced production. Many factors affect the uniformity of wheat seed emergence. Some problems with seed emergence are also research hotspots, such as the effects of straw mulching [2,3], as well as the effects of temperature, moisture and sowing depth [4,5]. However, most current research on the uniformity of wheat seed emergence involves manually selecting several regions, investigating the amount of plants in those regions, and calculating the coefficients of variation of the plants in those regions to reflect the uniformity of seed emergence. Such method for measuring the uniformity of seed emergence are time-consuming and laborious as well as inadequate because it cannot directly reflect the seed emergence conditions in a field scale.
Currently, UAV remote sensing is playing an important role in crop monitoring and features high efficiency, high resolution, low cost, low risk, flexibility and other characteristics [6,7,8]. Previous research studies have found that the application of UAV remote sensing is mainly used for crop classification, disaster monitoring, wheat plants density, estimation of agronomic parameters and growth analysis in agricultural applications [9,10] In crop classification research, UAVs mainly acquire data on different types of planting areas to facilitate crop management and related decision-making [11]. Disaster monitoring has been an important topic in recent years, including both the monitoring of field pests and the abnormal growth of crops caused by external factors, such as the monitoring of lodging [12,13]. The plants density of wheat was estimated using image processing algorithm and RGB imagery [14].
The estimation of the agronomic parameters mainly includes growth traits including leaf area index, biomass, nitrogen content and plant height through the establishment of models. Then, researchers looked for UAV image parameters that could reflect the quality of crop population to evaluate the status of crop growth [15,16]. Although many applications of UAVs are available related to crop growth and management, few reports were about the application of UAV remote sensing to the evaluation of the uniformity of wheat seed emergence.
This study used UAV images to evaluate the uniformity of wheat seed emergence under the conditions of mechanical broadcast and mechanical drill sowing, to explore the evaluation methods and implementation theories of the study of the uniformity of seed emergence under different sowing patterns. The goal was to provide technical support and a theoretical basis for the comprehensive evaluation of the uniformity of wheat seed emergence.
2. Materials and Methods
2.1. Field Trials
This study employed an experimental wheat variety, Yangfumai 4, with a seed emergence rate of 80% and a field emergence rate of 60% and used both mechanical drill and mechanical broadcast sowing patterns. Drill sowing machine put seeds in different rows, and the space between two lines was 25 cm. The normal distance between seeds was about 1 cm to 2.5 cm in one line. Broadcast sowing machine spread seeds on the field symmetrically, and the normal distance among seeds was about 6 cm to 9 cm. Three planting densities were selected: 180 × 104 ha−1, 240 × 104 ha−1, and 300 × 104 ha−1 (Figure 1). The size of each experiment plot is 2.7 m wide and 33 m long. There were 6 plots in the experiment: one replicate for each sowing method and density. Trials were made in both 2014 and 2015. The basic information of the experiments is shown in Table 1.
2.2. Image Acquisition
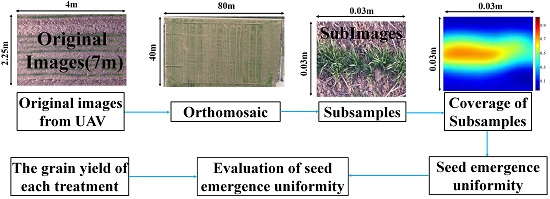
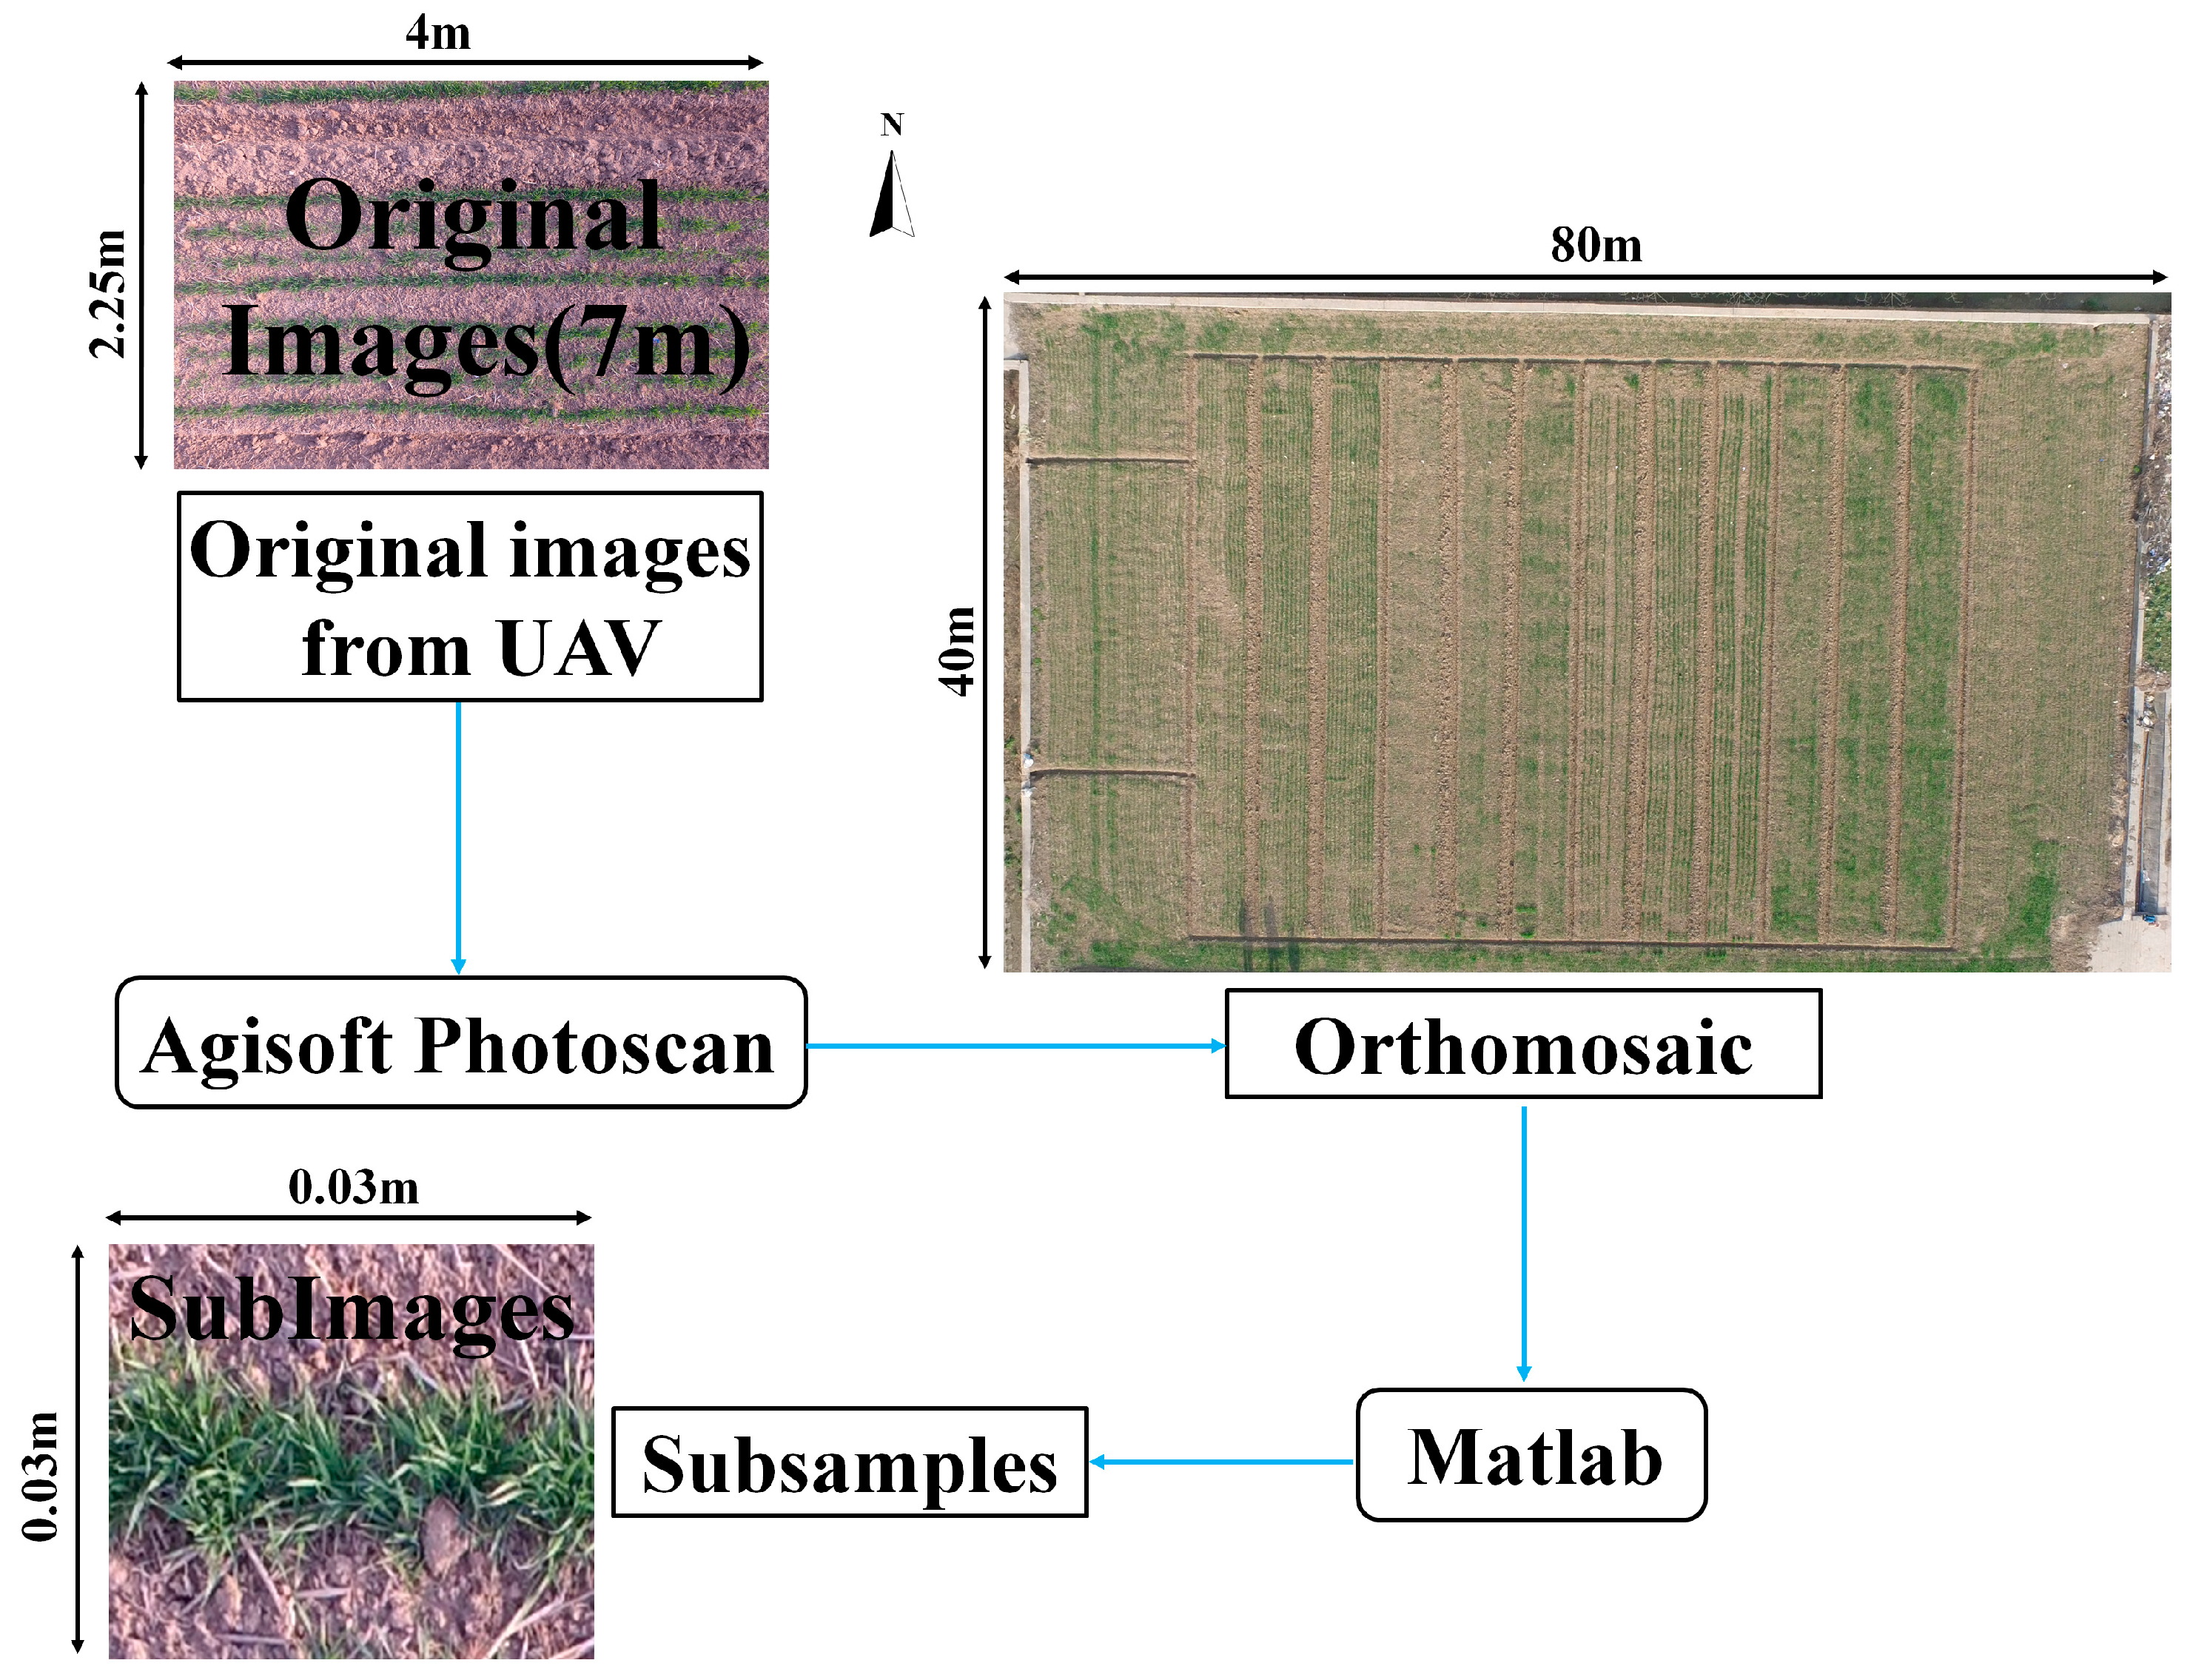
A DJI 1 Inspire RAW UAV was selected to obtain images. The camera calibration function of DJI Go APP (http://www.dji.com/) was used for camera calibration. It was equipped with a RGB camera with 16 megapixels, which is capable of acquiring images vertically with a flight height of 7 m (the spatial resolution is about 0.6 mm). The coordinates of the subsample over each microplot were manually defined using the orthomosaic image generated by the Agisoft Photoscan software (Version 1.2.2, Agisoft LLC., St. Petersburg, Russia). Matlab (V2016a, MathWorks, Natick, MA, USA) was used to process the images. The flowchart of UAV image preprocessing is shown in Figure 2. In this study, UVA data wree acquired on 17 February 2015 and 26 February 2016. All UVA data were acquired during 3:00 p.m.–5:00 p.m.
2.3. Image Processing
2.3.1. Image Segmentation
Based on the row spacing of drill sowing, the entire image in each date was divided into 30 cm × 30 cm sub-regions (Figure 3), and then the percentage of wheat cover in each sub-region was calculated. Each replicate was divided in to 990 sub-regions. Coverage refers to the percentage of wheat seedling pixels in each sub-region. The image segmentation methods for drill and broadcast sowing were the same. The vegetation index (Equation (1)) and Otsu’s algorithm were used to extract wheat seedlings in the image [17]. The reference threshold value obtained by Otsu’s algorithm was about 40 in both dates. The rows of drill sowing should be detected before getting the missing seedling region. The missing seedling region of broadcast sowing could be obtained without detecting rows. Thus, different analytical methods were designed in this study.
Exg = 2 × G − R − B
The values of the three color components (red, green, and blue) in RGB color images (24 bits) are, respectively, represented as R, G, and B.
2.3.2. Calculation of Seed Emergence Uniformity
The coefficient of variation (CVs) between sub-regions were calculated by Equations (2)–(4) and the coverage of each sub-region. “x”, “i”, and “n” in Equations (2) and (3) are the coverage of each sub-region, the serial number of each sub-region, and the total number of each sub-region, respectively. The coefficient of variation method is used to represent a uniformity index by dividing the standard deviation (δx) by the average value (Ex). A smaller coefficient of variation indicates higher uniformity [18]. Equations (2)–(4) provide the calculations [19]:
2.4. Localization of Seedlingless Ridges in Drill Sowing
Localization of seedlingless ridges refers to seeking the condition of missing seedlings with drill sowing of wheat in the row direction, identifying the regions with missing seedlings, and calculating the lengths of these regions. The localization steps were as follows. (1) Traverse the image based on a 3 × 3 pixels (about 2 × 2 cm) template, extract the coverage of the template by using Equation (1) and Otsu’s algorithm, and construct a three-dimensional image of the area covered by the image. The three-dimensional image was constructed by coverage values (z-axis) and the coordinate (x-axis, y-axis) of the original image. In this type of image, the “hills” in a three-dimensional image represent the regions with wheat seedlings and the “cliff” areas in the row direction represent regions with missing seedlings. The regions of missing seedlings can be more intuitively seen through three-dimensional images. (2) Localize the wheat rows (the ridge in the three-dimensional image) using Equation (5). Each three-dimensional image is defined as I(m, k), where m is the height of the image and k is the width of the image. (xi, yj) is the coordinate of each pixel in the image, where Yj is the total value of each row’s coverage in the image. Rg is the center line of the wheat row which is obtained by Equation (6). (3) With row as the unit, calculate the change in horizontal coverage. (4) The portion where the mean value of the coverage change curve is equal to 0 is the region of missing seedlings. The length of the region of missing seedlings was calculated by adding all the length of 0 value points on the coverage change curve
2.5. Localization of Missing Seedling in Broadcast Sowing
The extraction steps for locating regions of missing wheat seedlings with broadcast sowing included: (1) confirming the coordinates of the original image (this step was used to confirm the length and width); (2) traversing the image based on a 2 cm × 2 cm template and extracting the coverage of wheat in the template by using Equation (1) and Otsu’s algorithm; (3) extracting the regions whose value is 0 in the coverage distribution diagram and also with an area larger than 0.02 m2; and (4) counting the number and measuring the area of the regions of missing seedlings as well as collecting any relevant information from between the regions of missing seedlings.
2.6. Uniformity Evaluation
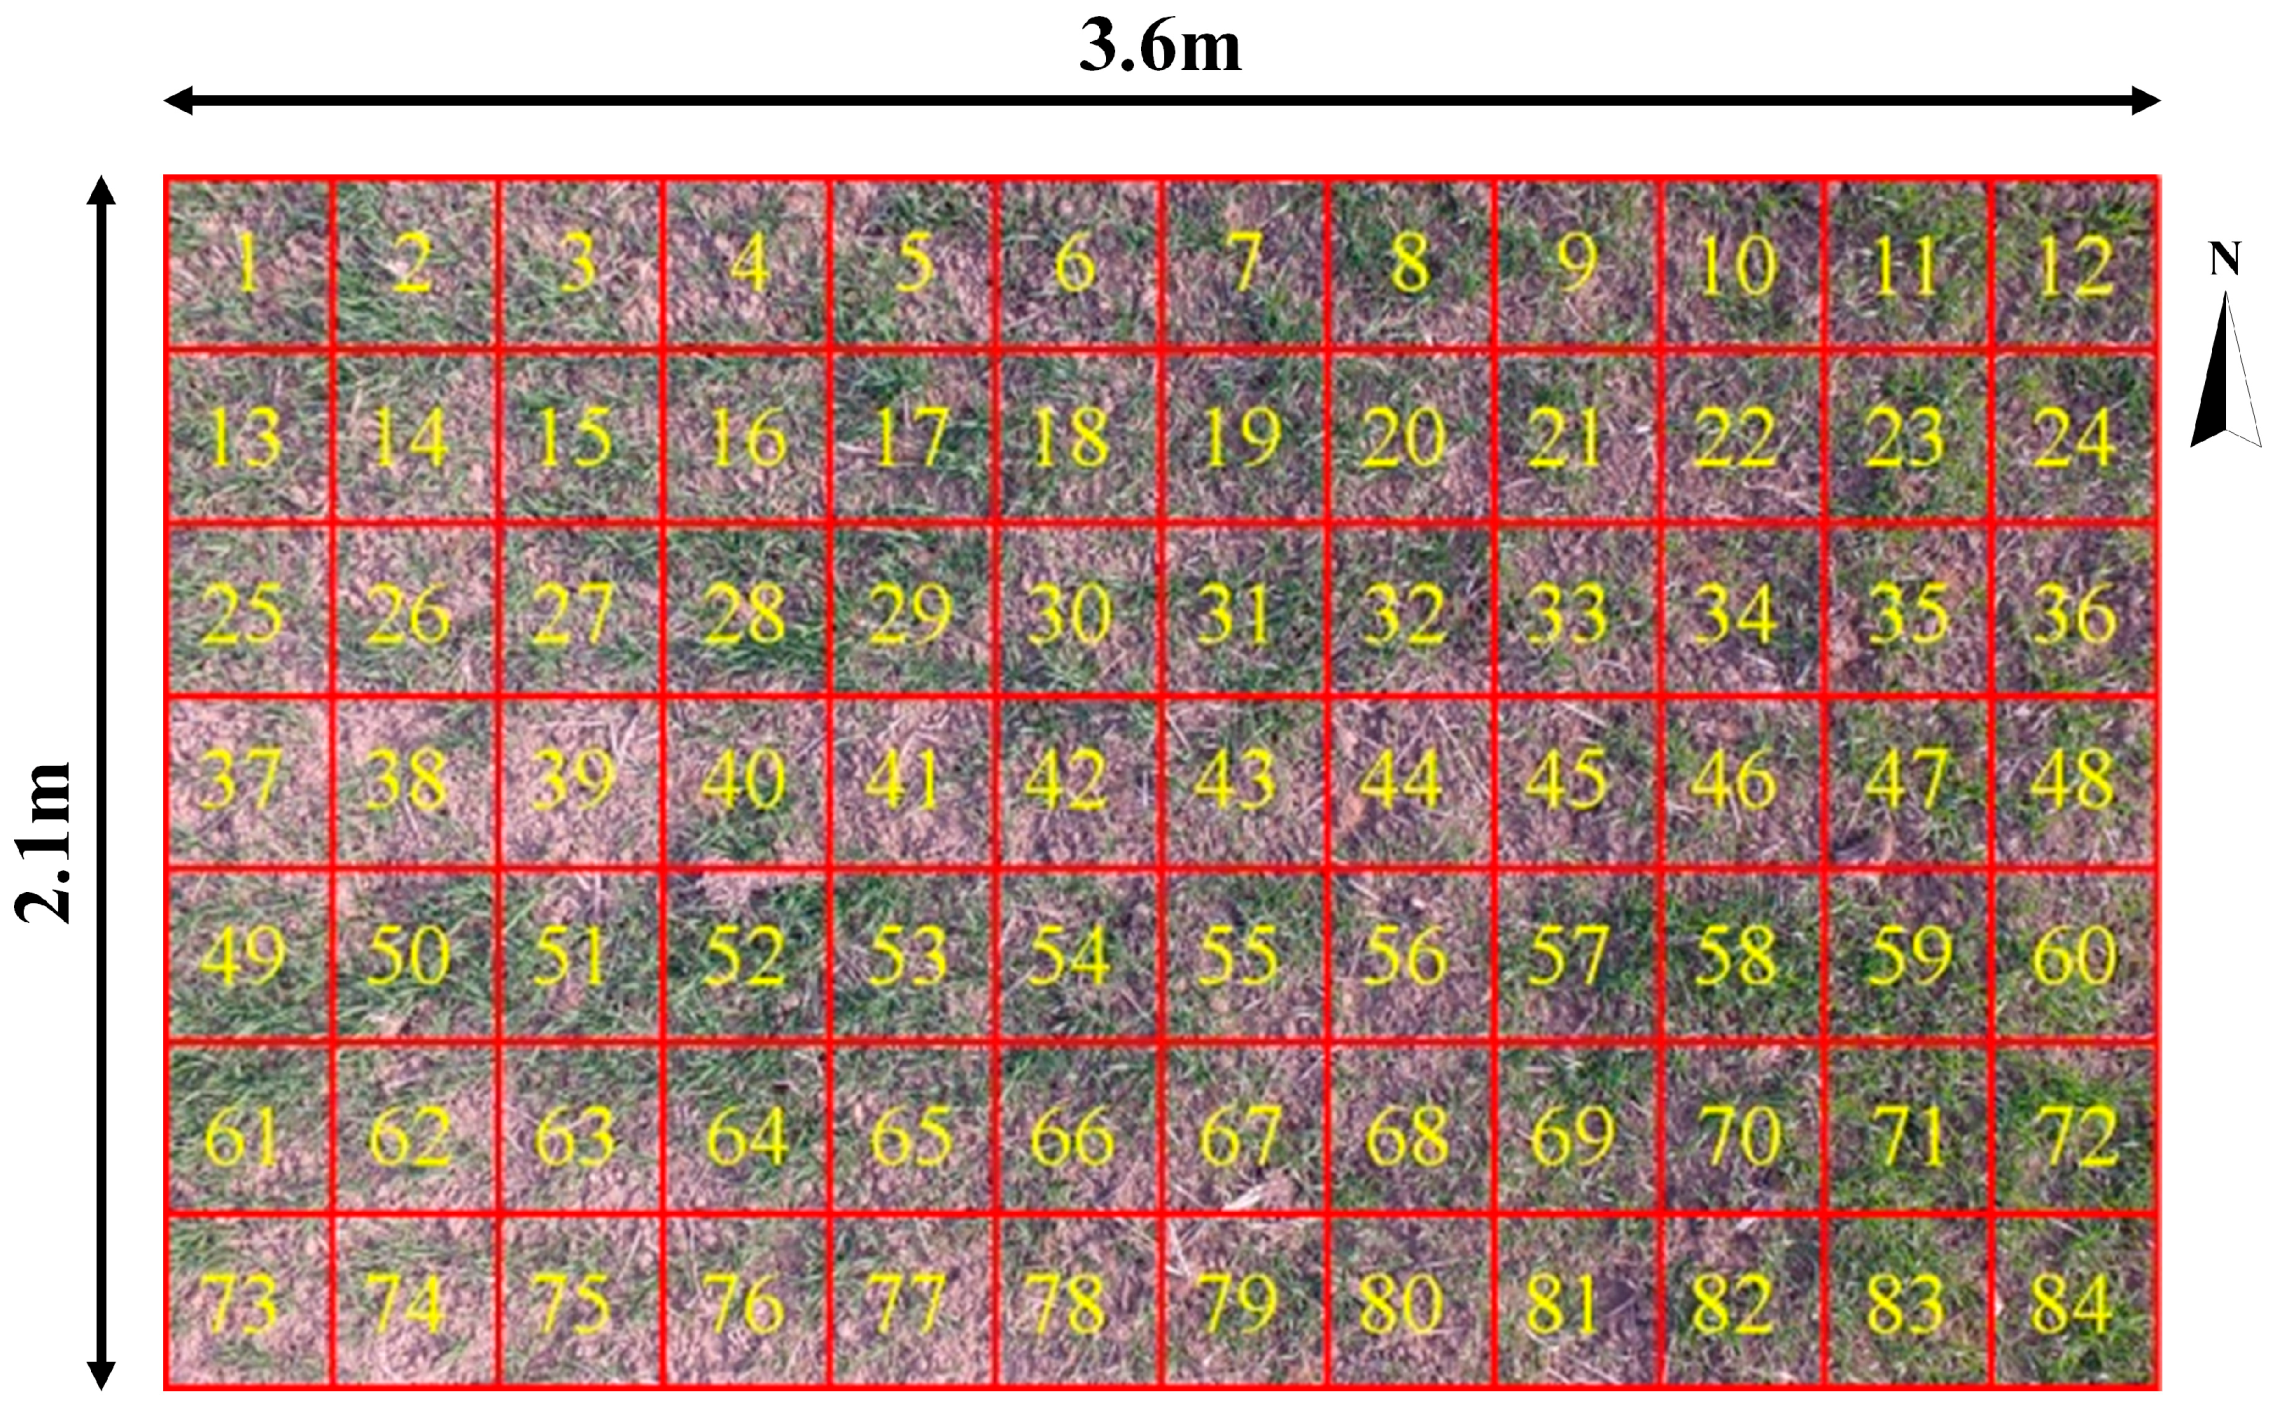
The standard of evaluating uniformity was formulated by exploring the change of yield under different uniformity conditions. The field was divided into 2.5 m × 2.5 m regions. The grain yield and uniformity of each region was measured correspondingly. The grains were dried and weighed after manual harvesting, and then the grain yield of each region was obtained. The manual measurement steps of seed emergence uniformity are: (1) selecting 50 points randomly in each treatment; (2) marking each point by a 30 cm × 30 cm square and counting the seedling number manually; and (3) calculating the uniformity by Equations (2)–(4). The reference number of missing seedling region was counted manually. The length of missing seedling region for drill sowing field were measured by “Ruler” tool in the Agisoft Photoscan software. The area of missing seeding for broadcast sowing field were measured by “Polygon” tool in the Agisoft. The miss seedling rates of broadcast and drill sowing are calculated by Equation (7).
MS is the length of missing seedlings for drill sowing, and is the area of missing seedlings for broadcast sowing. TS is the total length of wheat seedlings for drill sowing, and is the total area of wheat seedlings for broadcast sowing.
3. Results
3.1. Localization of Seedlingless Ridges in Drill Sowing
Figure 4 shows the three-dimensional effect of drill sowing on wheat coverage. In the three-dimensional diagram, wheat was clearly divided into different “hills.” The ridges can be easily positioned based on Equations (5) and (6).
Then, through the extraction value of the hill line, the method can clearly delineate the position of the missing seedlings and seedlingless ridges regions. Figure 5 shows the ranges values for extraction of the first and fifth hill results in Figure 4. The result shows that the locations whose coverage values are 0 are all seedlingless ridge regions.
3.2. Localization of Missing Seedlings in Broadcast Sowing
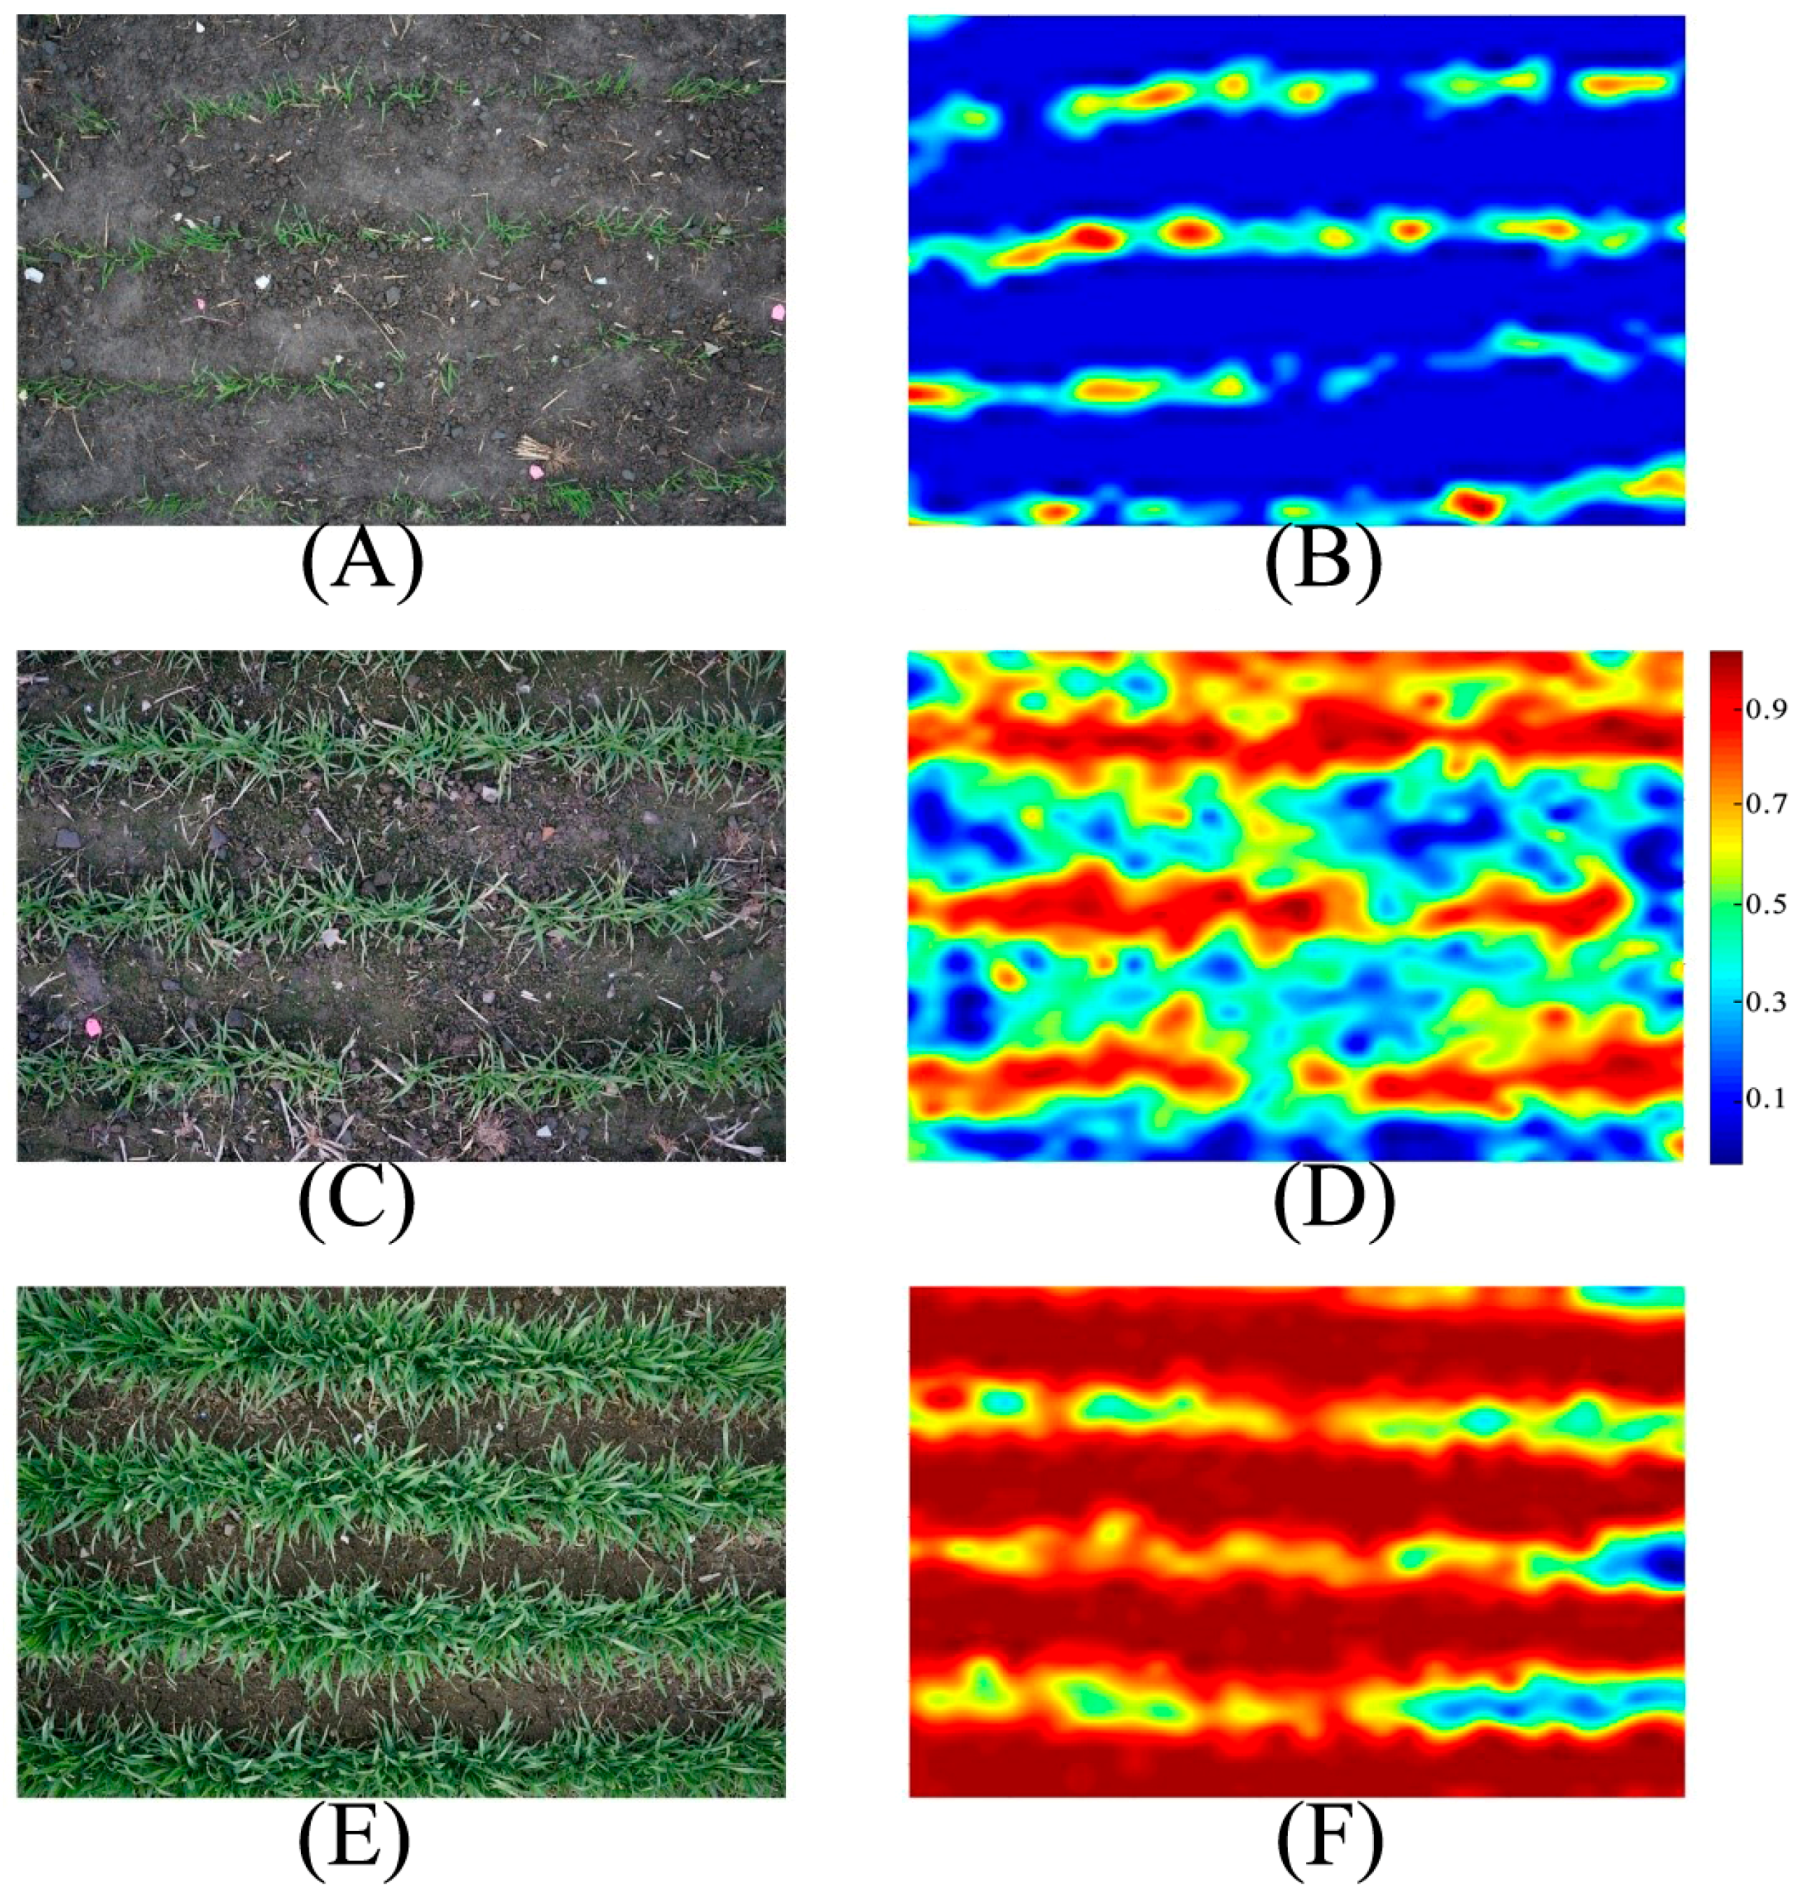
Figure 6 illustrates the process and results of missing seedling localization in broadcast sowing. Through the extraction of the coverage and segmentation of regions, the regions of missing seedlings were accurately positioned. At the same time, the number of regions of missing seedlings (RN), the area of each of these regions, the maximum and minimum area of these regions (MX and MN), and the mean value (MA) and variance (ST) of the area of these regions can be calculated according to the characteristics of the regions.
3.3. Test of Wheat Seed Emergence Uniformity
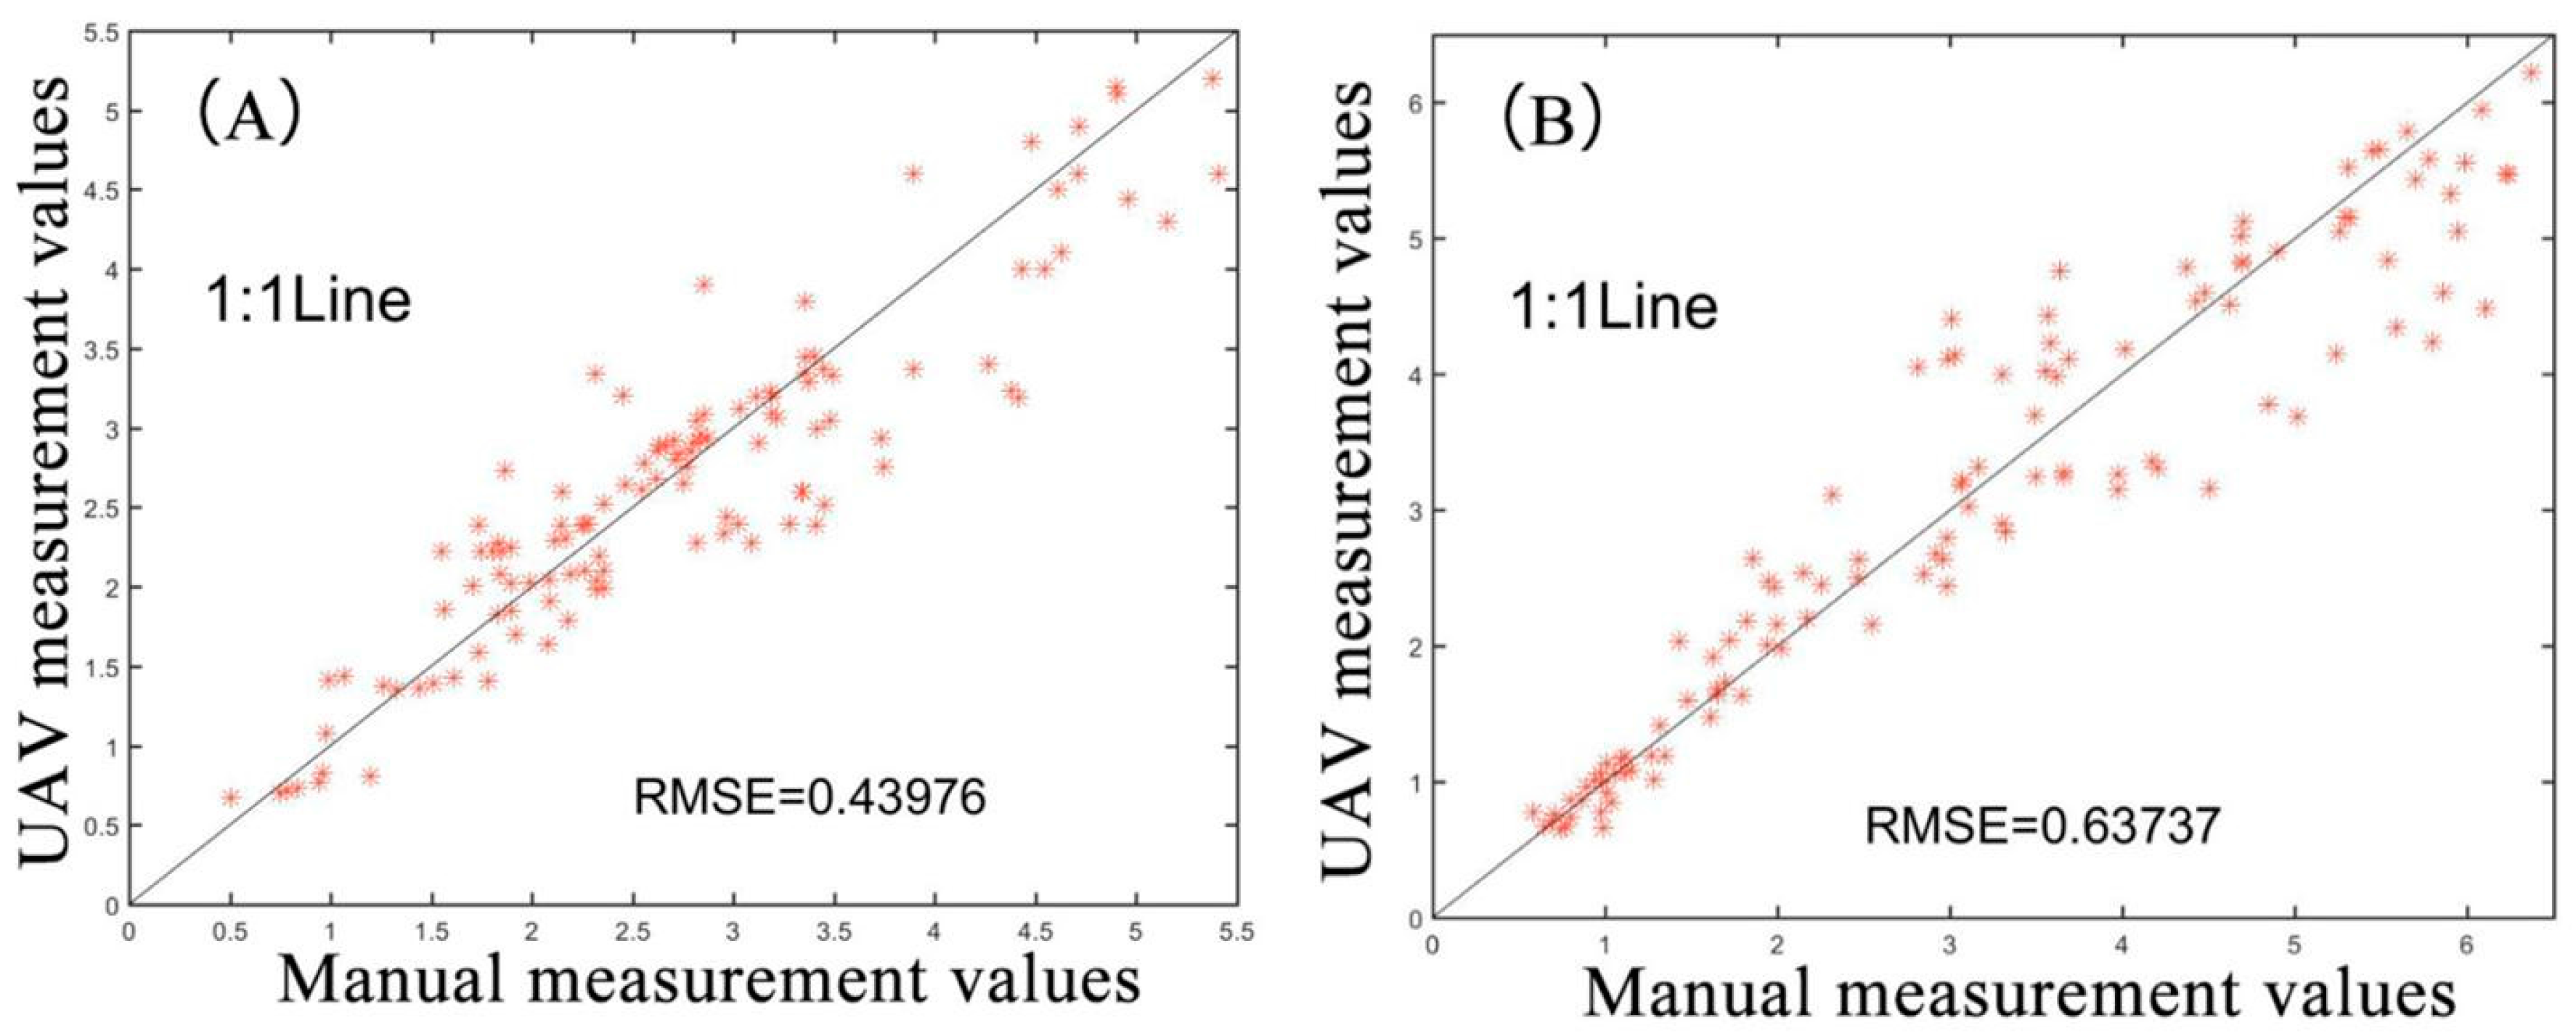
The summary of the measured uniformity by UAV is shown in Table 2. The test results of UAV image-based uniformity delineation of wheat seed emergence is shown in Figure 7. From the 1:1 line, it can be seen that the uniformity measurement value of different sowing methods only slightly varied when compared with the manual measurement value. The R2 values of drill and broadcast sown wheat were 0.83** and 0.89**, respectively. The RMSE values were 0.44 and 0.64, respectively. The maximum deviation of broadcast and drill sown wheat were 1.22 and 2.24, respectively.
3.4. Test of Drill Sowing Wheat Seedling-Missing Region
The summary of the measured information of missing seedlings is shown in Table 3. The 1:1 line between the UAV and manual measurement results of the number and length of drill sowing region of missing wheat seedlings is shown in Figure 8. The R2 value of the number of this region was 0.84**, and RMSE was 3.99; the R2 value of the length of this region was 0.61**, and RMSE was 12.39. The average numbers of regions of missing seedlings obtained from UAV images and manual measurement were 22.3 and 23.2, respectively. The average length of these regions obtained from UAV and manual measurement was 38.7 cm and 43.9 cm, respectively, which shows only a small difference.
3.5. Test of Broadcast Sowing Wheat Seedling-Missing Region
The summary of the measured information of missing seedlings is shown in Table 4. The 1:1 line between the UAV measurement results and manual measurement results of the number and area of broadcast sowing region of missing wheat seedlings is shown in Figure 9. The R2 value of the number of region of missing seedlings was 0.93**, and RMSE was 1.39; the R2 value of the area of region of missing seedlings was 0.78**, and RMSE was 0.20. The average number of these regions obtained from UAV images and manual measurement was 4.5 and 5.2, respectively. The average area of these regions obtained from UAV and manual measurement was 0.57 cm2 and 0.51 cm2, respectively, which shows little difference.
3.6. Uniformity Evaluation under Different Plant Density
The present study found that, for both drill and broadcast sown wheat, changes in the uniformity of seedling emergence always had certain effects on yield (Table 5). At three different planting densities, when the measure of uniformity was larger than four, the population yield remained relatively high and stable. When the measure of uniformity fell between two and four, the yield fluctuated more widely, and, when uniformity was less than two, yield was relatively low.
The length of a drill sowing region with missing seedlings had little effect on the yield in a certain range. However, when the missing seedling rate is more than 20%, yield will reduced significantly (Table 6). When the missing seedling rate is less than 10%, populations create a relatively uniform distribution and this will usually result in high yield.
The effects of the missing seedling rate with both broadcast and drill sowing were similar (Table 7). When the missing seedling rate was more than 10%, the yield was affected to different degrees. In contrast, when the missing seedling rate is less than 5%, the plants formed a relatively uniform population with high yield.
The uniformity of wheat seed emergence and the missing seedling rate certainly affect yield, but the effects are difficult to describe using a mathematical expression. The present study formulated a grading scale based on the effects of the uniformity of seed emergence on the population and the missing seedling rate on yield (Table 8). The uniformity of wheat seed emergence was classified as high (U1), moderate (U2) and low (U3). Table 8 refers to the different uniformity levels listed in Table 5. L1 (low), L2 (moderate) and L3 (high), giving the length of missing wheat seedlings with drill sowing (Table 6). A1 (low), L2 (moderate) and L3 (high) give the area of missing wheat seedlings with broadcast sowing (Table 7). The grading system developed here (Table 8) was formulated according to the various effects of missing seedling conditions on yield (Table 5, Table 6 and Table 7). The population seed emergence of levels I, II and II range from most to least uniform, laying the best to worst foundation for obtaining high yield. Based on the grading system developed in the present study, when the population seed emergence reaches levels VII, VIII and IX, it usually indicates serious conditions caused by missing seedlings that will significantly affect yield. In these situations, the gaps need to be filled with seedlings.
4. Discussion
The use of UAV image-based data related to the uniformity of wheat seed emergence proposed in this study, to some extent, solved some deficiency problems in terms of manual measurement, but some problems remain and need to be discussed.
4.1. Acquisition Time
The UAV image acquisition time in the wheat growing period may affect the results. Wheat plants at the first and third leaf stage have relatively small leaves (Figure 10a) so that the UAV images do not provide a clear image of the plants. In addition, some wheat seeds may still have not germinated, so that the use of UAV images at that time provides only relatively partial data related to the uniformity of seedling coverage (Figure 10b). When wheat reaches the fourth and fifth leaf stage (Figure 10c), tillering begins to occur, and the region of missing seedlings is more obvious. Therefore, using the coverage of seedlings to evaluate the uniformity of seed emergence in a population is more appropriate (Figure 10d). By the time the wheat reaches the jointing stage, in some fields the rows will be fully covered by wheat leaves, and the regions with missing seedlings will be hidden by the leaves of other plants (Figure 10e). The jointing stage loses its usefulness in evaluating the uniformity of seed emergence (Figure 10f). In summary, the best time to use UAVs for evaluating the uniformity of wheat seed emergence should be around the fifth leaf stage.
4.2. Flight Attitude
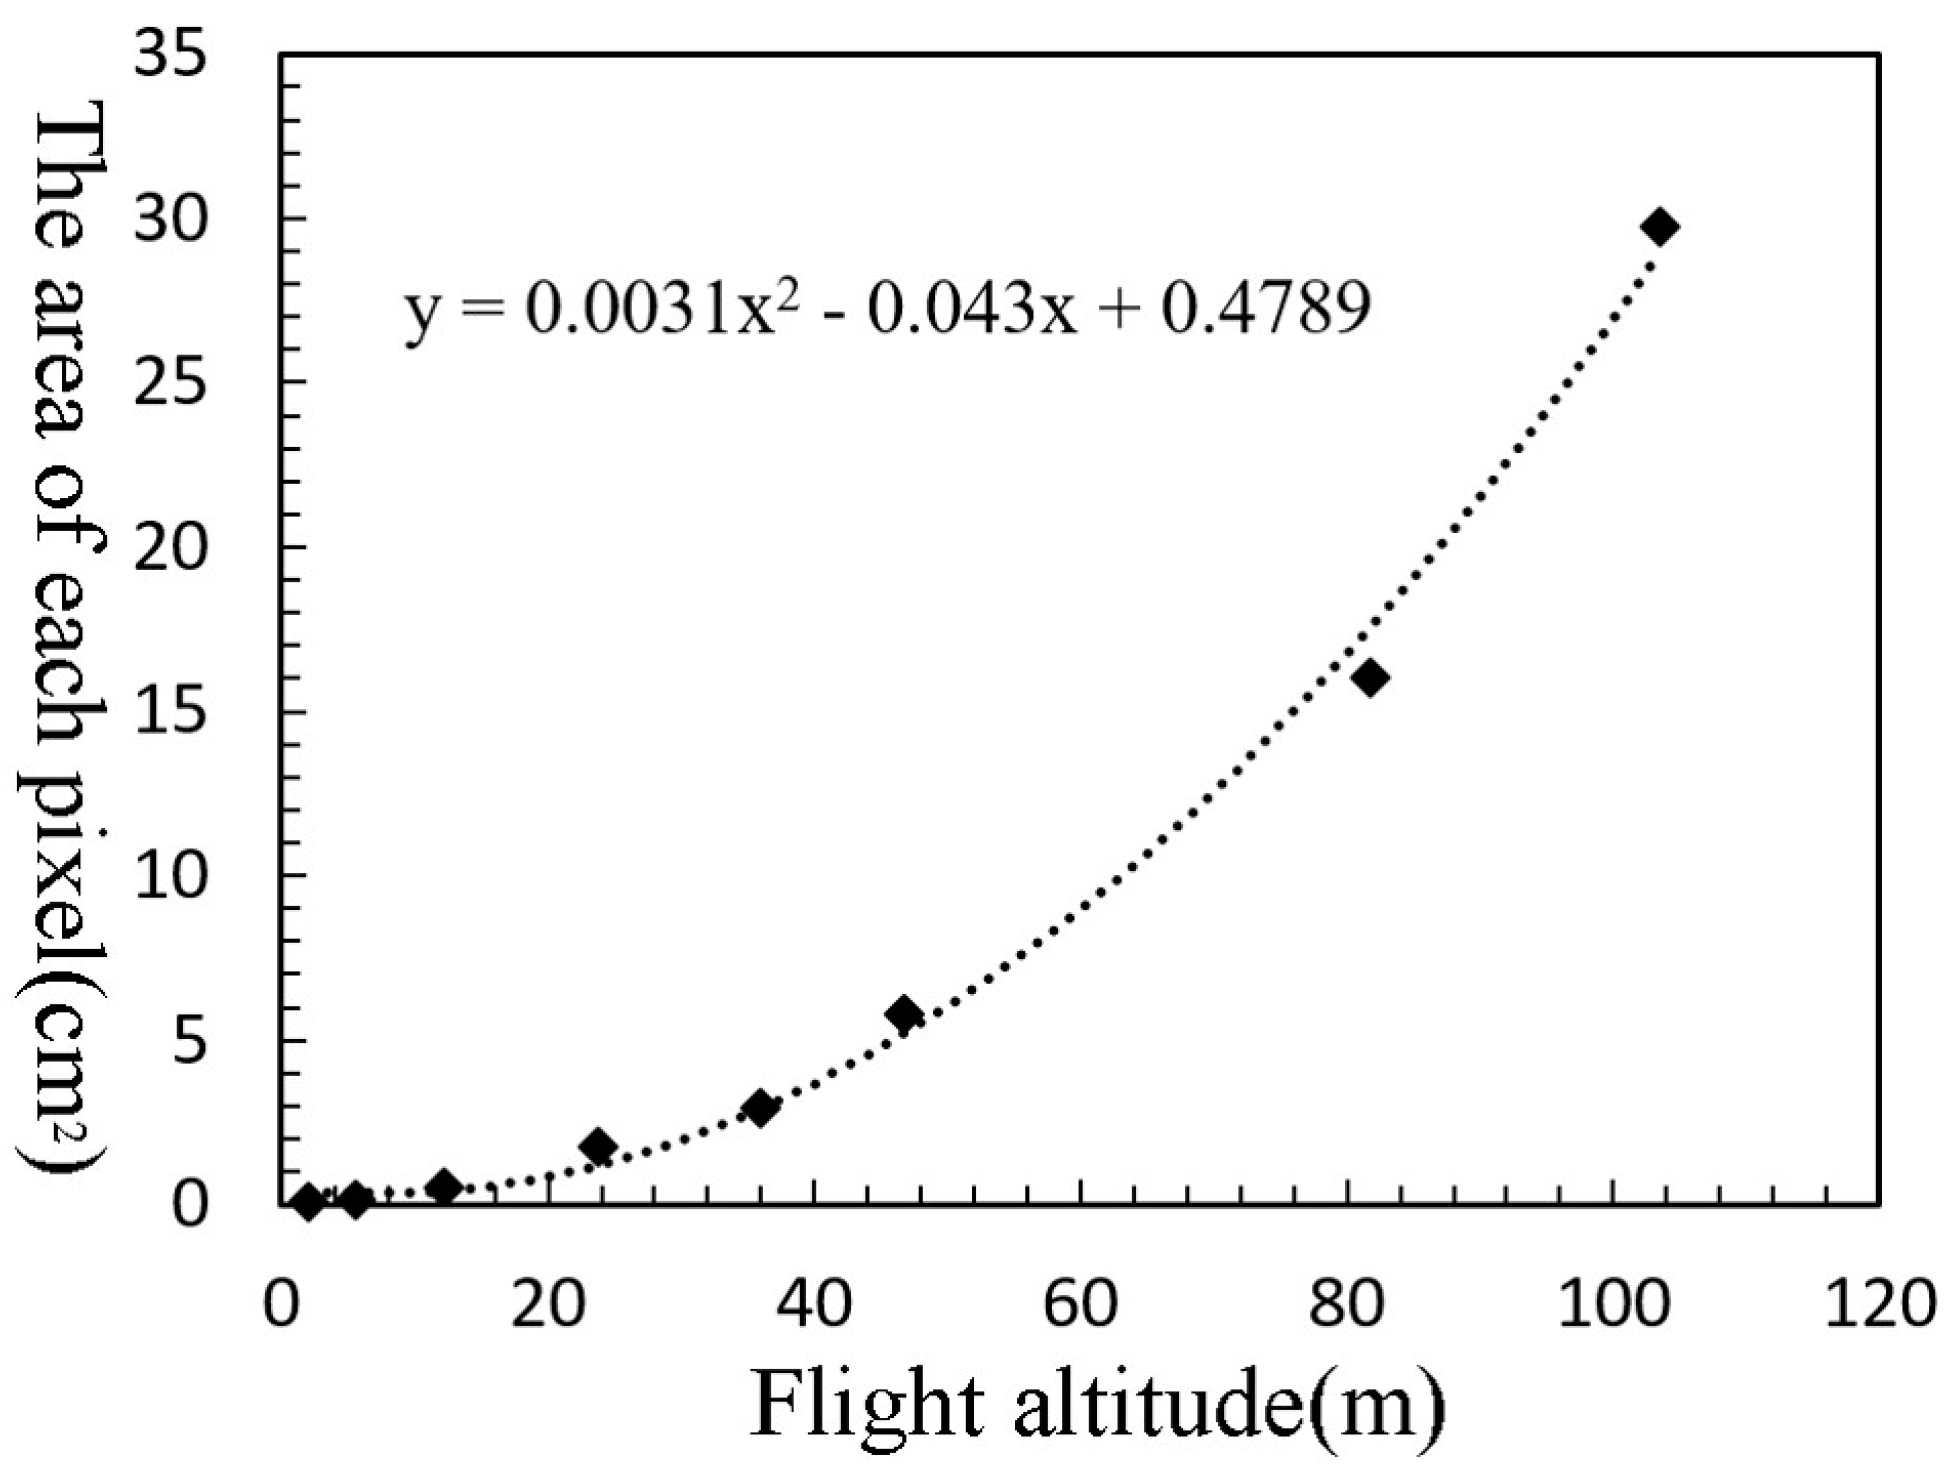
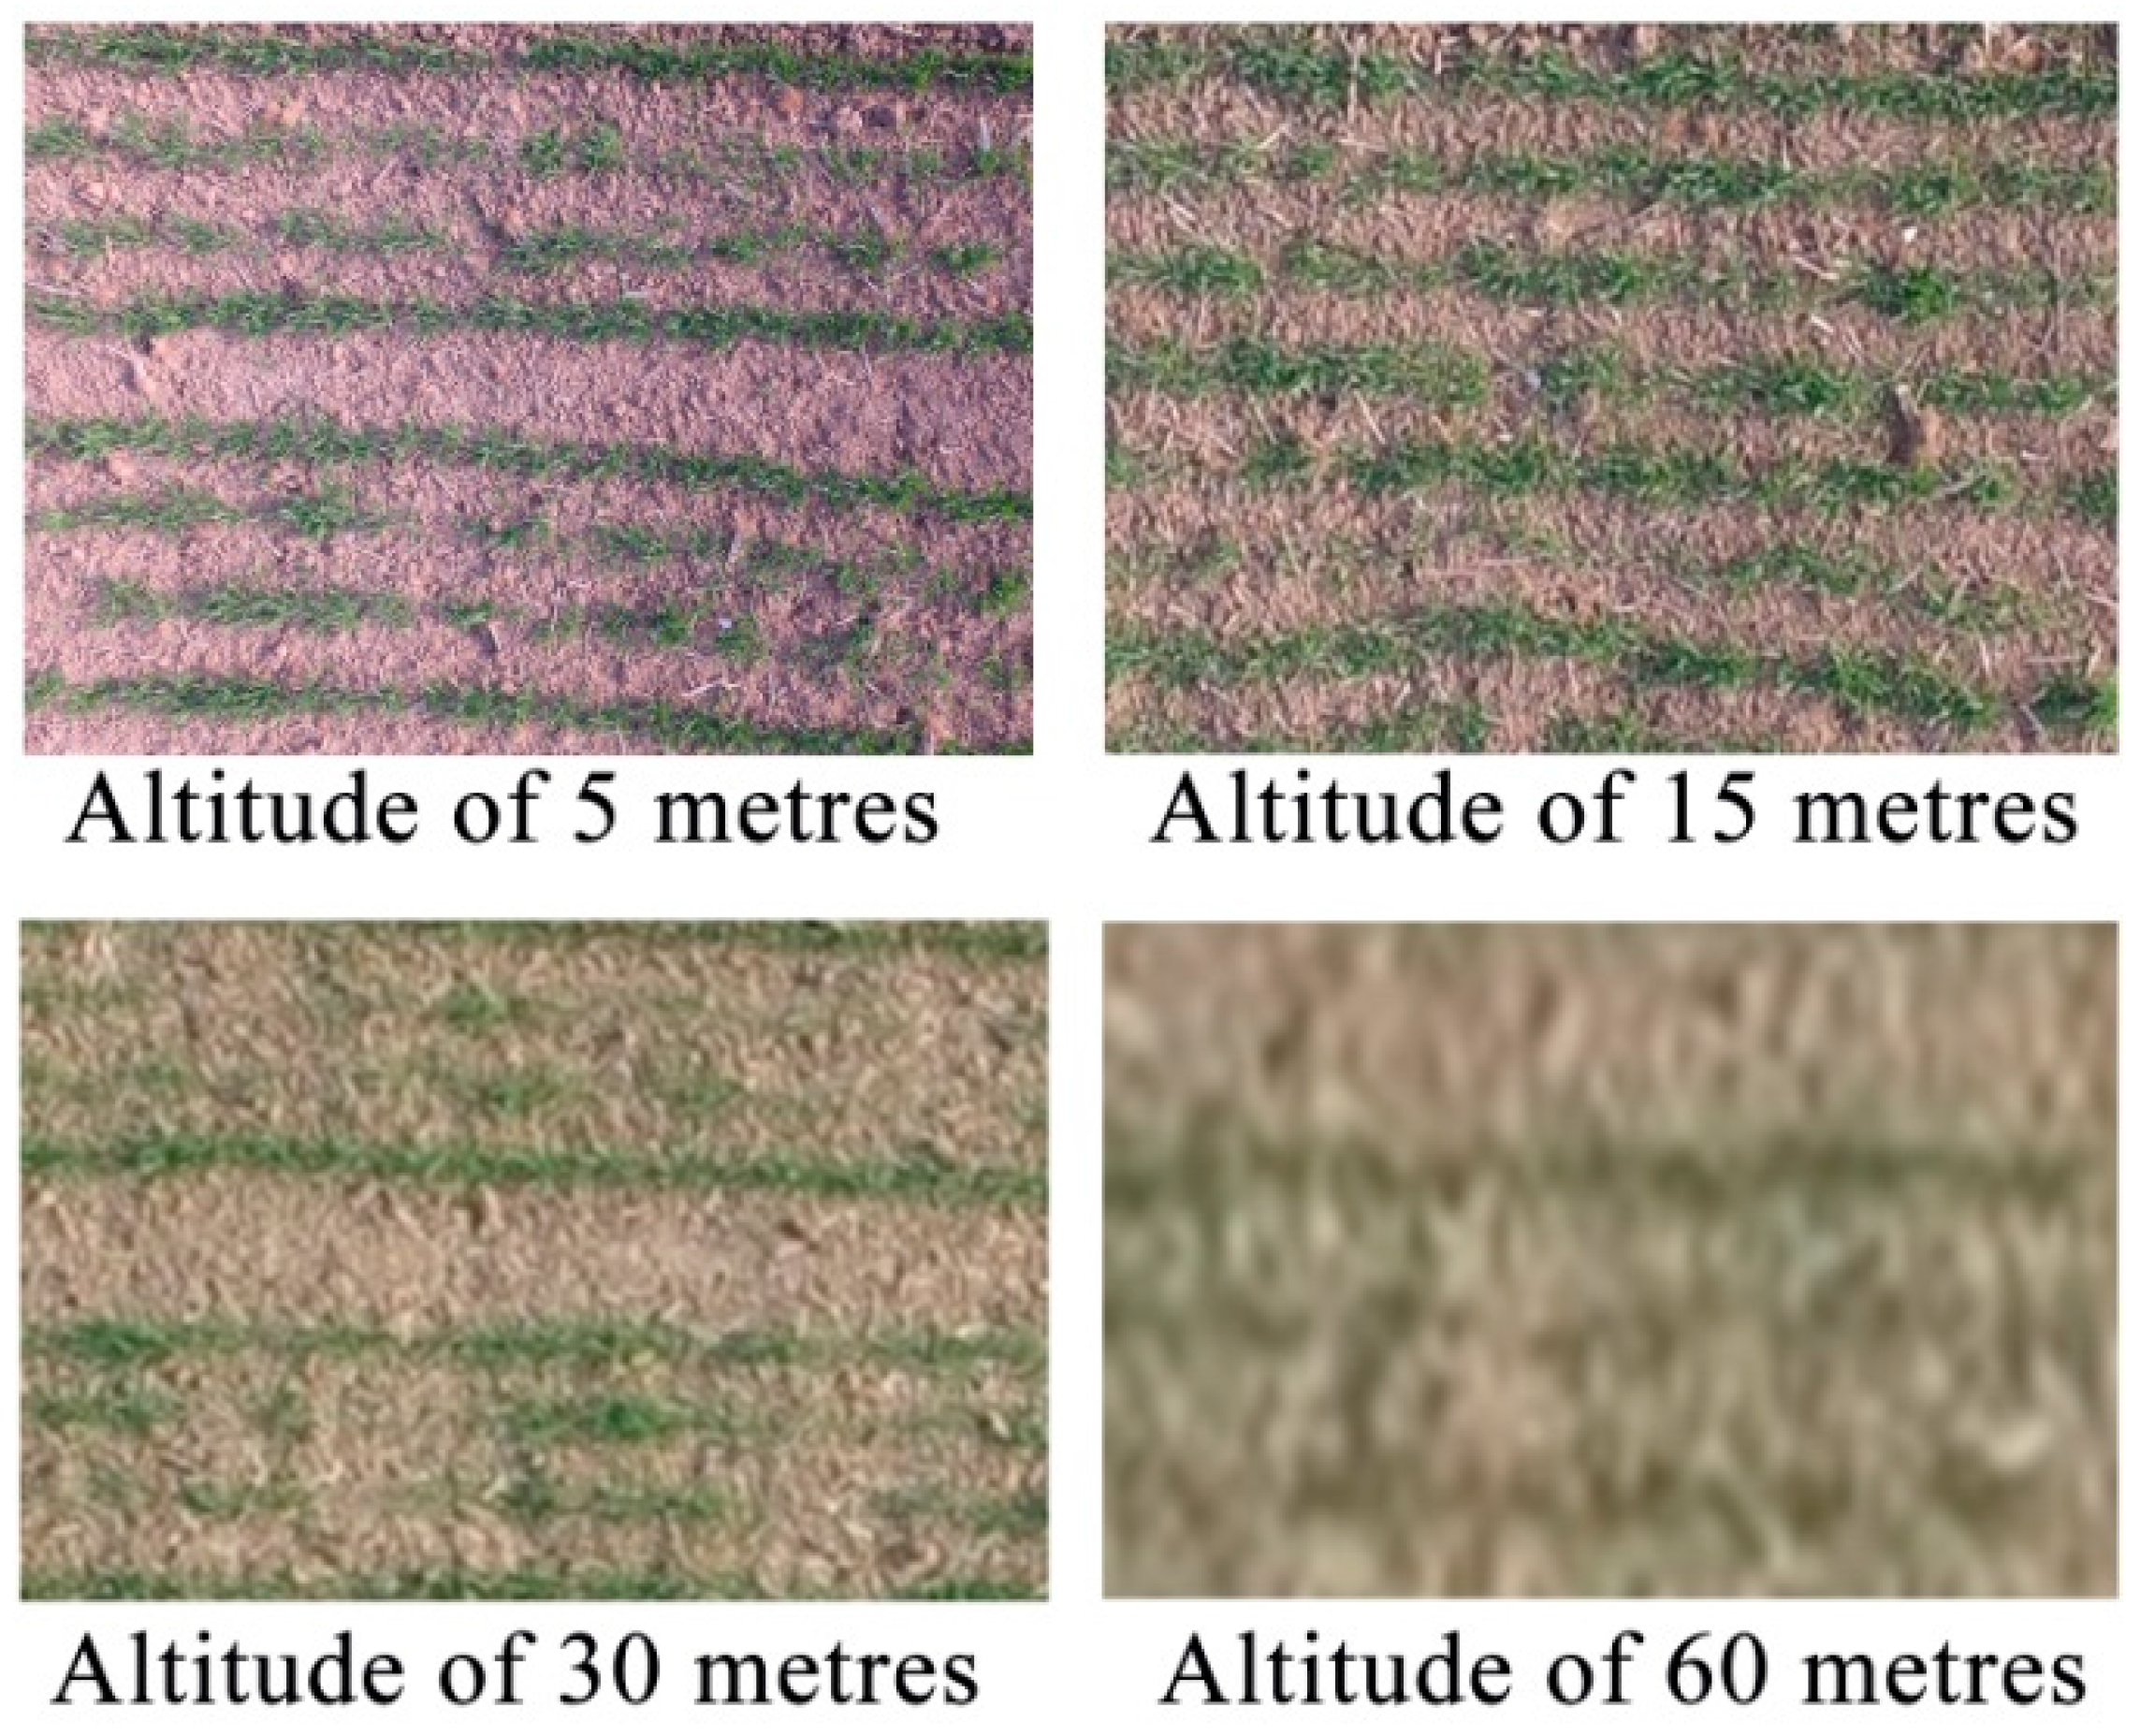
A reasonable range of UAV flight height falls between 5 m and 15 m when acquiring images. In the present study, the relationship between UAV image acquisition altitude and actual area of each pixel was demonstrated through standard editing methods (Figure 11). A low flight height makes it difficult to acquire stable images because the wheat seedlings may sway in the wind, resulting in increased labor to deal with image processing. At the other extreme, a high flight height will lead to the collection of obscure images.
When the UAV flies at an altitude of 5 m, the image is relatively clear and some of the details of the wheat are visible. At 15 m, sporadic regions are fuzzy, but this has smaller impact on the height extraction (Figure 12). When the flight height reaches 30 m, the image becomes blurred, and the uniformity extraction error is relatively large. Meanwhile, at 60 m, poor image quality makes it impossible to carry out uniformity evaluation.
4.3. Illumination Condition
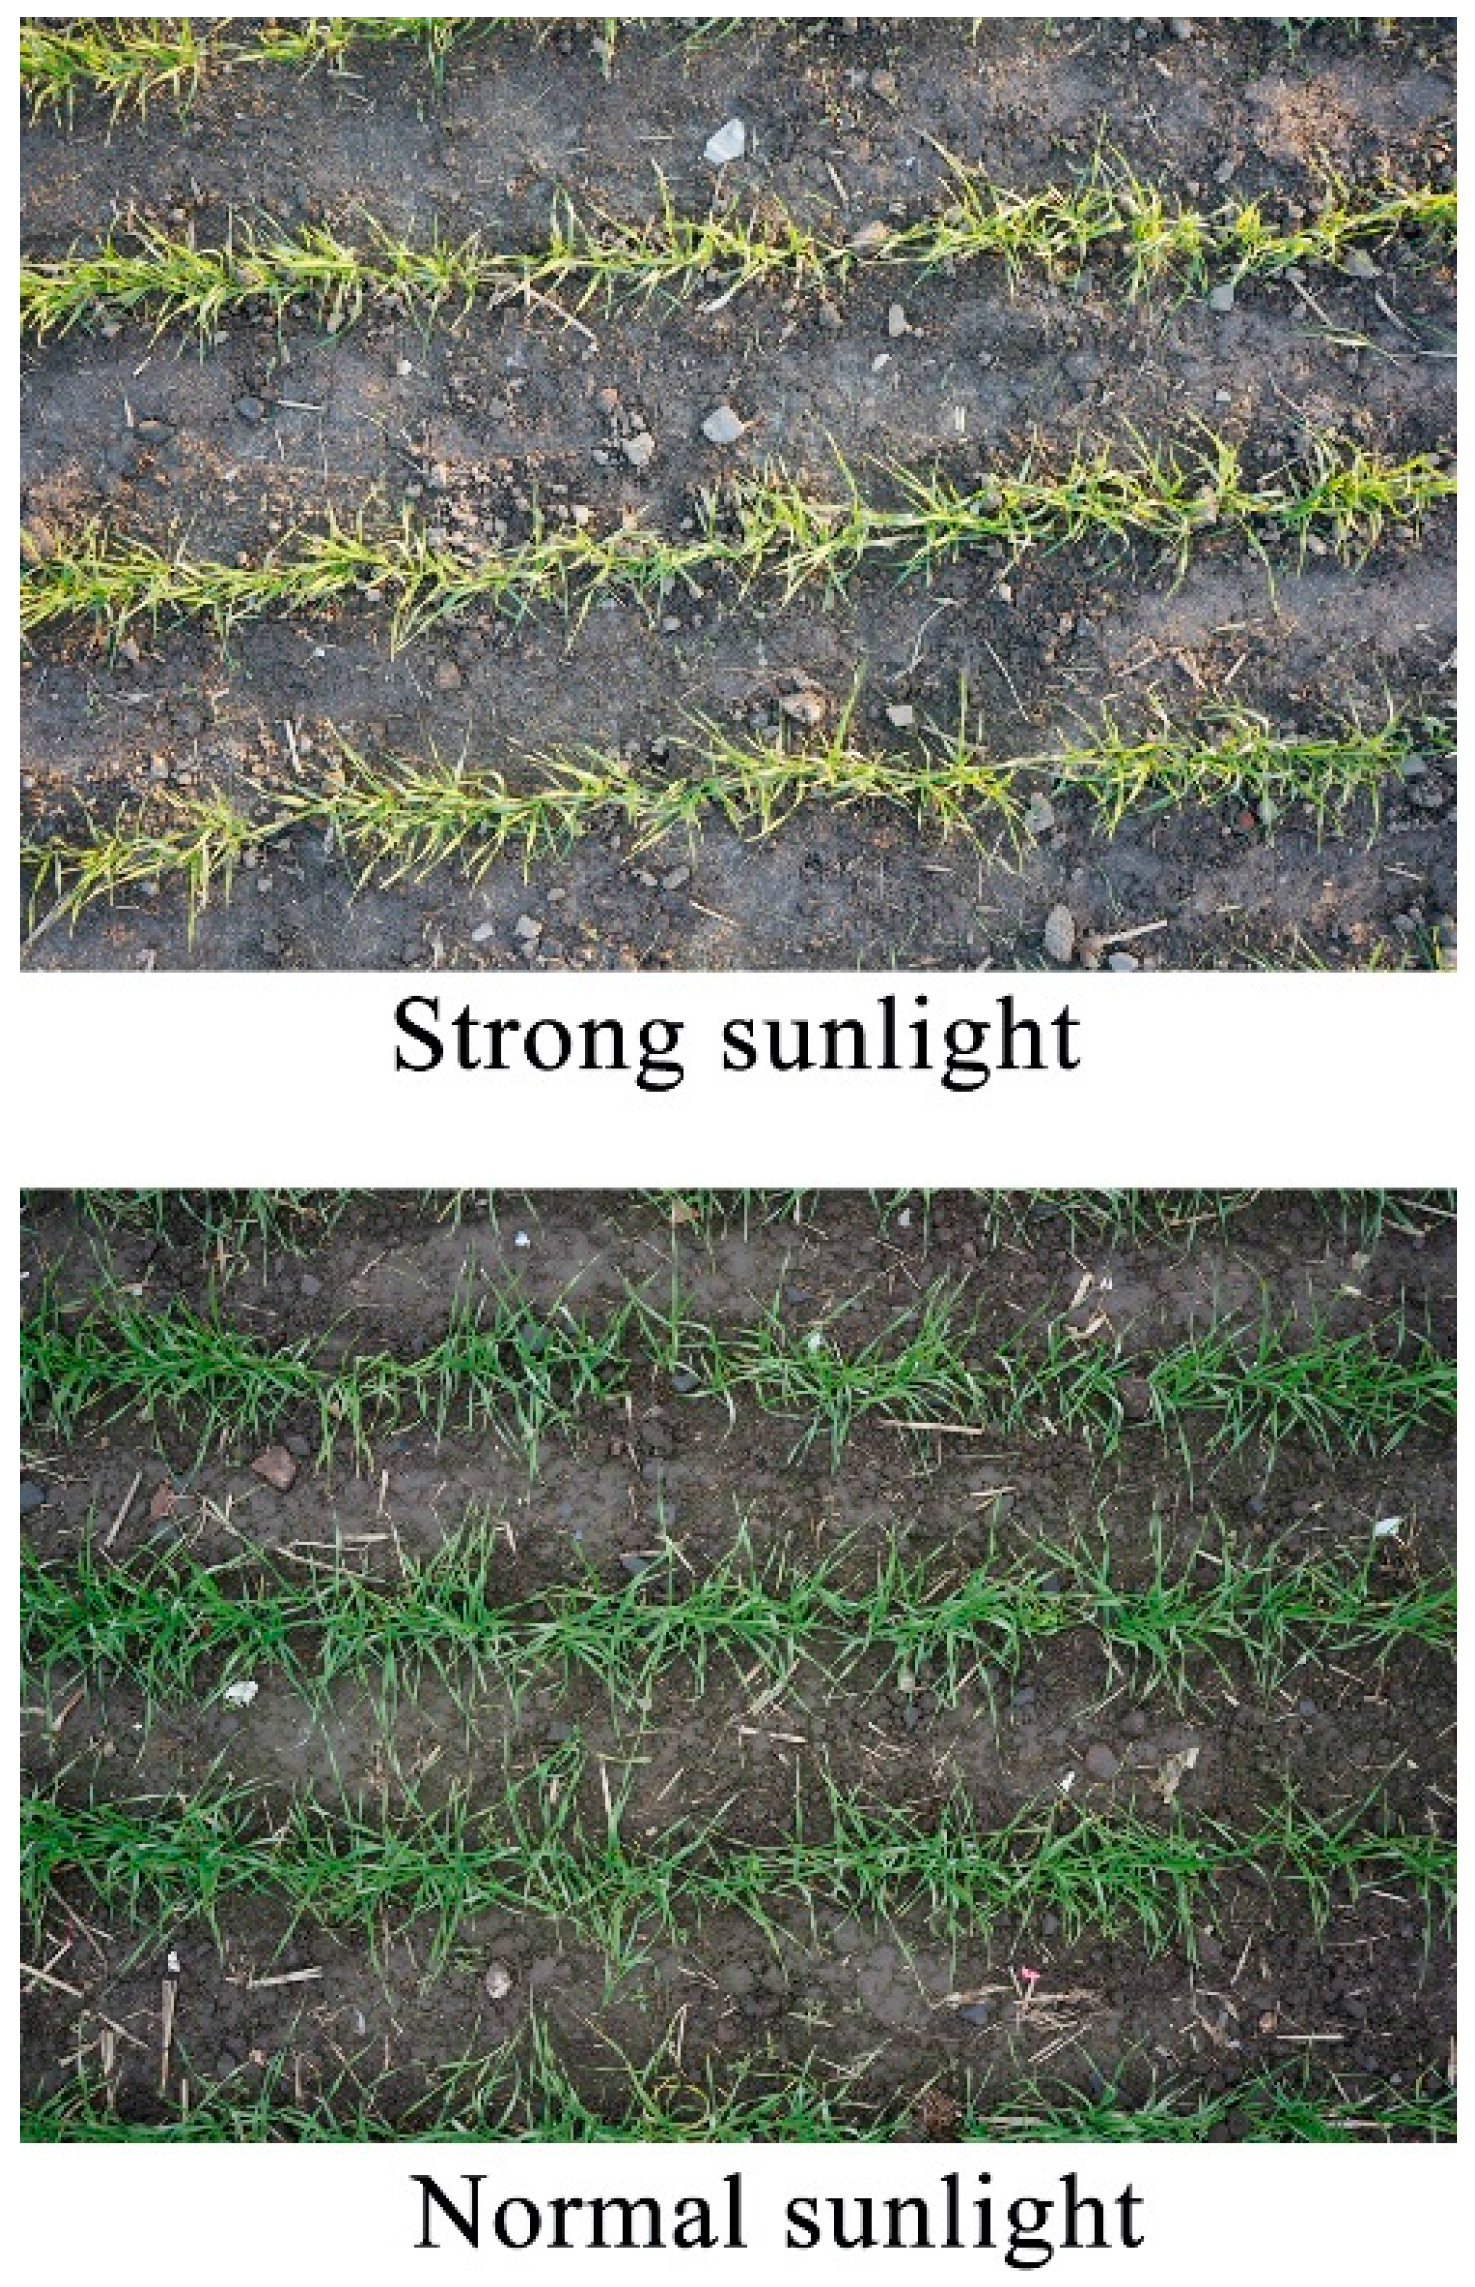
Weather only slightly affects UAV image acquisition. After collecting the field data, images acquired in the morning or evening with relatively soft light or cloudy weather were available for review. However, particularly strong illumination is unsuitable for data collection because strong light may cause the wheat seedlings to appear white (Figure 13), making it impossible to completely extract the plants using Equation (1).
4.4. The Component of Field
In terms of field image composition, the fields used in the present study were sprayed with herbicides before the experiment. Therefore, relatively few weeds grew in the field when acquiring the images, and the influence of weeds was ignored during the evaluation of uniformity. Fields with many weeds may be difficult to evaluate using the method proposed in this study. In terms of image processing, the great differences in wheat posture between the broadcast and drill sown patterns presented in the images make it impossible to design a universal method for the extraction of localized regions of missing wheat seedlings and related data. Thus, the methods designed here were unique to the present study.
4.5. The Effect of Emergence Uniformity
The uniformity of wheat seed emergence and the missing seedling rate had certain effects on yield, for the reason that plant density is a key factor influencing grain yield [14,20]. However, this effect proved difficult to quantify. Through studying the effects of uniformity and missing seedling rate on the yield, this paper designed an evaluation criterion (Table 8) for the wheat seed emergence rate, which was formulated based on the range of change of uniformity in the missing seedling rate. Only three stages were classified in this range, namely “good,” “medium” and “bad.” Discovering how to refine the evaluation criteria with the goal of further improving the precision of the evaluation will be the focus of future research studies.
4.6. Comparison to Others
Recent developments in UAV have provided research opportunities in assessing crop growth and physiological traits [21]. Imagery from UAV coming from different sensors [RGB cameras, multispectral imagery, hyperspectral imagery, and thermal camera] have been used to estimate LAI [22], biomass [23], height [24], nitrogen [25], and carotenoid [26]. Most of these studies estimated agronomic parameters by the spectral features of crop. However, some agronomic parameters could not be acquired only using spectral features, such as the information of missing seedling and emergence uniformity. In this case, the geometric and morphological analysis in the proposed method are available. Further, this work could be selected as a reference when the researchers want to use UAV imagery to acquire some agronomic parameters that are difficult to analyze only by spectral features.
5. Conclusions
This study established a comprehensive method to measure the uniformity of wheat seed emergence using UAV images. This method allows the measurement of the overall uniformity of wheat seed emergence (reciprocal value of the coefficient of variation), and determine the number of regions of missing seedlings with both drill sowing and broadcast sowing of wheat. Based on comparison with the conventional manual measurement method, the UAV image-based method of measuring the overall uniformity of seed emergence and the detection of regions of missing seedlings was achieved with high accuracy. Through a comparison between UAV images and the results of manual surveys used to gather data on the uniformity of seed emergence, the RMSEs was 0.44 for broadcast sowing and 0.64 for drill sowing. The RMSEs of the numbers of missing seedling regions for broadcast and drill sowing were 1.39 and 3.99, respectively. The RMSEs of the lengths of the missing seedling regions were 12.39 cm for drill sowing and 0.20 cm2 for broadcast sowing. The UAV image-based method provided a new and greatly improved method for efficiently measuring the uniformity of wheat seed emergence.
Acknowledgments
This research was mainly supported by the National Natural Science Foundation of China (31701355 and 31671615); China Postdoctoral Science Foundation (2016M600448); and The Priority Academic Program Development of Jiangsu Higher Education Institutions, and the science and technology plan projects of Yangzhou (YZ2016251).
Author Contributions
T.L., C.S. and W.G. performed all experiments and analyzed the data. R.L. and X.J. performed some experiments and analyzed the data. J.D. and X.Z. contributed the conceptual design and provided supervision. L.T. wrote the main manuscript text and prepared all figures. All authors were involved in preparing and revising the manuscript.
Conflicts of Interest
The authors declare no competing financial interests.
References
- Jin, X.; Li, Z.; Yang, G.; Yang, H.; Feng, H.; Xu, X.; Wang, J.; Li, X.; Luo, J. Winter wheat yield estimation based on multi-source medium resolution optical and radar imaging data and the AquaCrop model using the particle swarm optimization algorithm. ISPRS J. Photogramm. Remote Sens. 2017, 126, 24–37. [Google Scholar] [CrossRef]
- Jia, C.; Guo, H.; Yuan, K.; Yang, Q.; Sui, X.; Zhang, Y.; Fan, Q. Effects of different seeding manner on the seedling emergence, over-winter and yield of wheat under maize stalk full returned to the field. Chin. Agric. Sci. Bull. 2010, 26, 149–154. [Google Scholar]
- Schillinger, W.F.; Donaldson, E.; Allan, R.E.; Jones, S.S. Winter wheat seedling emergence from deep sowing depths. AGRON J. 1998, 90, 582–586. [Google Scholar] [CrossRef]
- Al-Mulla, Y.A.; Huggins, D.R.; Stöckle, C.O. Modeling the emergence of winter wheat in response to soil temperature, water potential, and planting depth. Trans. ASABE 2014, 57, 761–775. [Google Scholar]
- Lindstrom, M.J.; Papendick, R.I.; Koehler, F.E. A model to predict winter wheat emergence as affected by soil temperature, water potential, and depth of planting. Agron. J. 1976, 68, 137–141. [Google Scholar] [CrossRef]
- Sankaran, S.; Khot, L.R.; Carter, A.H. Field-based crop phenotyping: Multispectral aerial imaging for evaluation of winter wheat emergence and spring stand. Comput. Electron. Agric. 2015, 118, 372–379. [Google Scholar] [CrossRef]
- Senthilnath, J.; Dokania, A.; Kandukuri, M.; Ramesh, K.N.; Anand, G.; Omkar, S.N. Detection of tomatoes using spectral-spatial methods in remotely sensed RGB images captured by UAV. Biosyst. Eng. 2016, 146, 16–32. [Google Scholar] [CrossRef]
- Vega, F.A.; Ramírez, F.C.; Saiz, M.P.; Rosúa, F.O. Multi-temporal imaging using an unmanned aerial vehicle for monitoring a sunflower crop. Biosyst. Eng. 2015, 132, 19–27. [Google Scholar] [CrossRef]
- Primicerio, J.; Gennaro, S.F.D.; Fiorillo, E.; Genesio, L.; Lugato, E.; Matese, A.; Vaccari, F.P. A flexible unmanned aerial vehicle for precision agriculture. Precis. Agric. 2012, 13, 517–523. [Google Scholar] [CrossRef]
- Sugiura, R.; Tsuda, S.; Tamiya, S.; Itoh, A.; Nishiwaki, K.; Murakami, N.; Shibuya, Y.; Hirafuji, M.; Nuske, S. Field phenotyping system for the assessment of potato late blight resistance using RGB imagery from an unmanned aerial vehicle. Biosyst. Eng. 2016, 148, 1–10. [Google Scholar] [CrossRef]
- Tian, Z.; Fu, Y.; Liu, S.; Liu, F. Rapid crops classification based on UAV low-altitude remote sensing. Trans. Chin. Soc. Agric. Eng. 2013, 29, 109–116. [Google Scholar]
- Castaldi, F.; Pelosi, F.; Pascucci, S.; Casa, R. Assessing the potential of images from unmanned aerial vehicles (UAV) to support herbicide patch spraying in maize. Precis. Agric. 2016, 18, 76–94. [Google Scholar] [CrossRef]
- Li, Z.; Chen, Z.; Wang, L.; Liu, J.; Zhou, Q. Area extraction of maize lodging based on remote sensing by small unmanned aerial vehicle. Trans. Chin. Soc. Agric. Eng. 2014, 30, 207–213. [Google Scholar]
- Jin, X.; Liu, S.; Baret, F.; Hemerlé, M.; Comar, A. Estimates of plant density of wheat crops at emergence from very low altitude UAV imagery. Remote Sens. Environ. 2017, 198, 105–114. [Google Scholar] [CrossRef]
- Córcoles, J.I.; Ortega, J.F.; Hernández, D.; Moreno, M.A. Estimation of leaf area index in onion (Allium cepa L.) using an unmanned aerial vehicle. Biosyst. Eng. 2013, 115, 31–42. [Google Scholar] [CrossRef]
- Mathews, A.J.; Jensen, J.L.R. Visualizing and quantifying vineyard canopy LAI using an unmanned aerial vehicle (UAV) collected high density structure from motion point cloud. Remote Sens. 2013, 5, 2164–2183. [Google Scholar] [CrossRef]
- Meyer, G.E.; Neto, J.C. Verification of color vegetation indices for automated crop imaging applications. Comput. Electron. Agric. 2008, 63, 282–293. [Google Scholar] [CrossRef]
- Shan, C.G.; Liao, S.H.; Liu, B.; Wang, Z.F.; Dai, M.H.; Liu, M.; Wang, P. Study of measurement method of population uniformity of wheat based on digital image. J. Triticeae Crops 2008, 28, 819–823. [Google Scholar]
- Tayel, M.; Lightfoot, D.; Mansour, H. Effects of drip irrigation circuit design and lateral line lengths: I—On pressure and friction loss. Agric. Syst. 2012, 3, 551–560. [Google Scholar] [CrossRef]
- Joseph, K.D.S.M.; Alley, M.M.; Brann, D.E.; Gravelle, W.D. Row Spacing and Seeding Rate Effects on Yield and Yield Components of Soft Red Winter Wheat. Agron. J. 1985, 77, 211–214. [Google Scholar] [CrossRef]
- Zamanallah, M.; Vergara, O.; Araus, J.L.; Tarekegne, A.; Magorokosho, C.; Zarcotejada, P.J.; Hornero, A.; Albà, A.H.; Das, B.; Craufurd, P. Unmanned aerial platform-based multi-spectral imaging for field phenotyping of maize. Plant Methods 2015, 11. [Google Scholar] [CrossRef]
- Verger, A.; Vigneau, N.; Chéron, C.; Gilliot, J.M.; Comar, A.; Baret, F. Green area index from an unmanned aerial system over wheat and rapeseed crops. Remote Sens. Environ. 2014, 152, 654–664. [Google Scholar] [CrossRef]
- Bendig, J.; Yu, K.; Aasen, H.; Bolten, A.; Bennertz, S.; Broscheit, J.; Gnyp, M.L.; Bareth, G. Combining UAV-based plant height from crop surface models, visible, and near infrared vegetation indices for biomass monitoring in barley. Int. J. Appl. Earth Obs. Geoinf. 2015, 39, 79–87. [Google Scholar] [CrossRef]
- Díaz-Varela, R.A.; Rosa, R.D.L.; León, L.; Zarco-Tejada, P.J. High-Resolution Airborne UAV Imagery to Assess Olive Tree Crown Parameters Using 3D Photo Reconstruction: Application in Breeding Trials. Remote Sens. 2015, 7, 4213–4232. [Google Scholar] [CrossRef]
- Hunt, E.R.; Cavigelli, M.; Daughtry, C.S.T.; Mcmurtrey, J.E.; Walthall, C.L. Evaluation of Digital Photography from Model Aircraft for Remote Sensing of Crop Biomass and Nitrogen Status. Precis. Agric. 2005, 6, 359–378. [Google Scholar] [CrossRef]
- Zarcotejada, P.J.; Guilléncliment, M.L.; Hernándezclemente, R.; Catalina, A.; González, M.R.; Martín, P. Estimating leaf carotenoid content in vineyards using high resolution hyperspectral imagery acquired from an unmanned aerial vehicle (UAV). Agric. For. Meteorol. 2013, 171–172, 281–294. [Google Scholar] [CrossRef]
Figure 1.
The schematic map of the experiment.
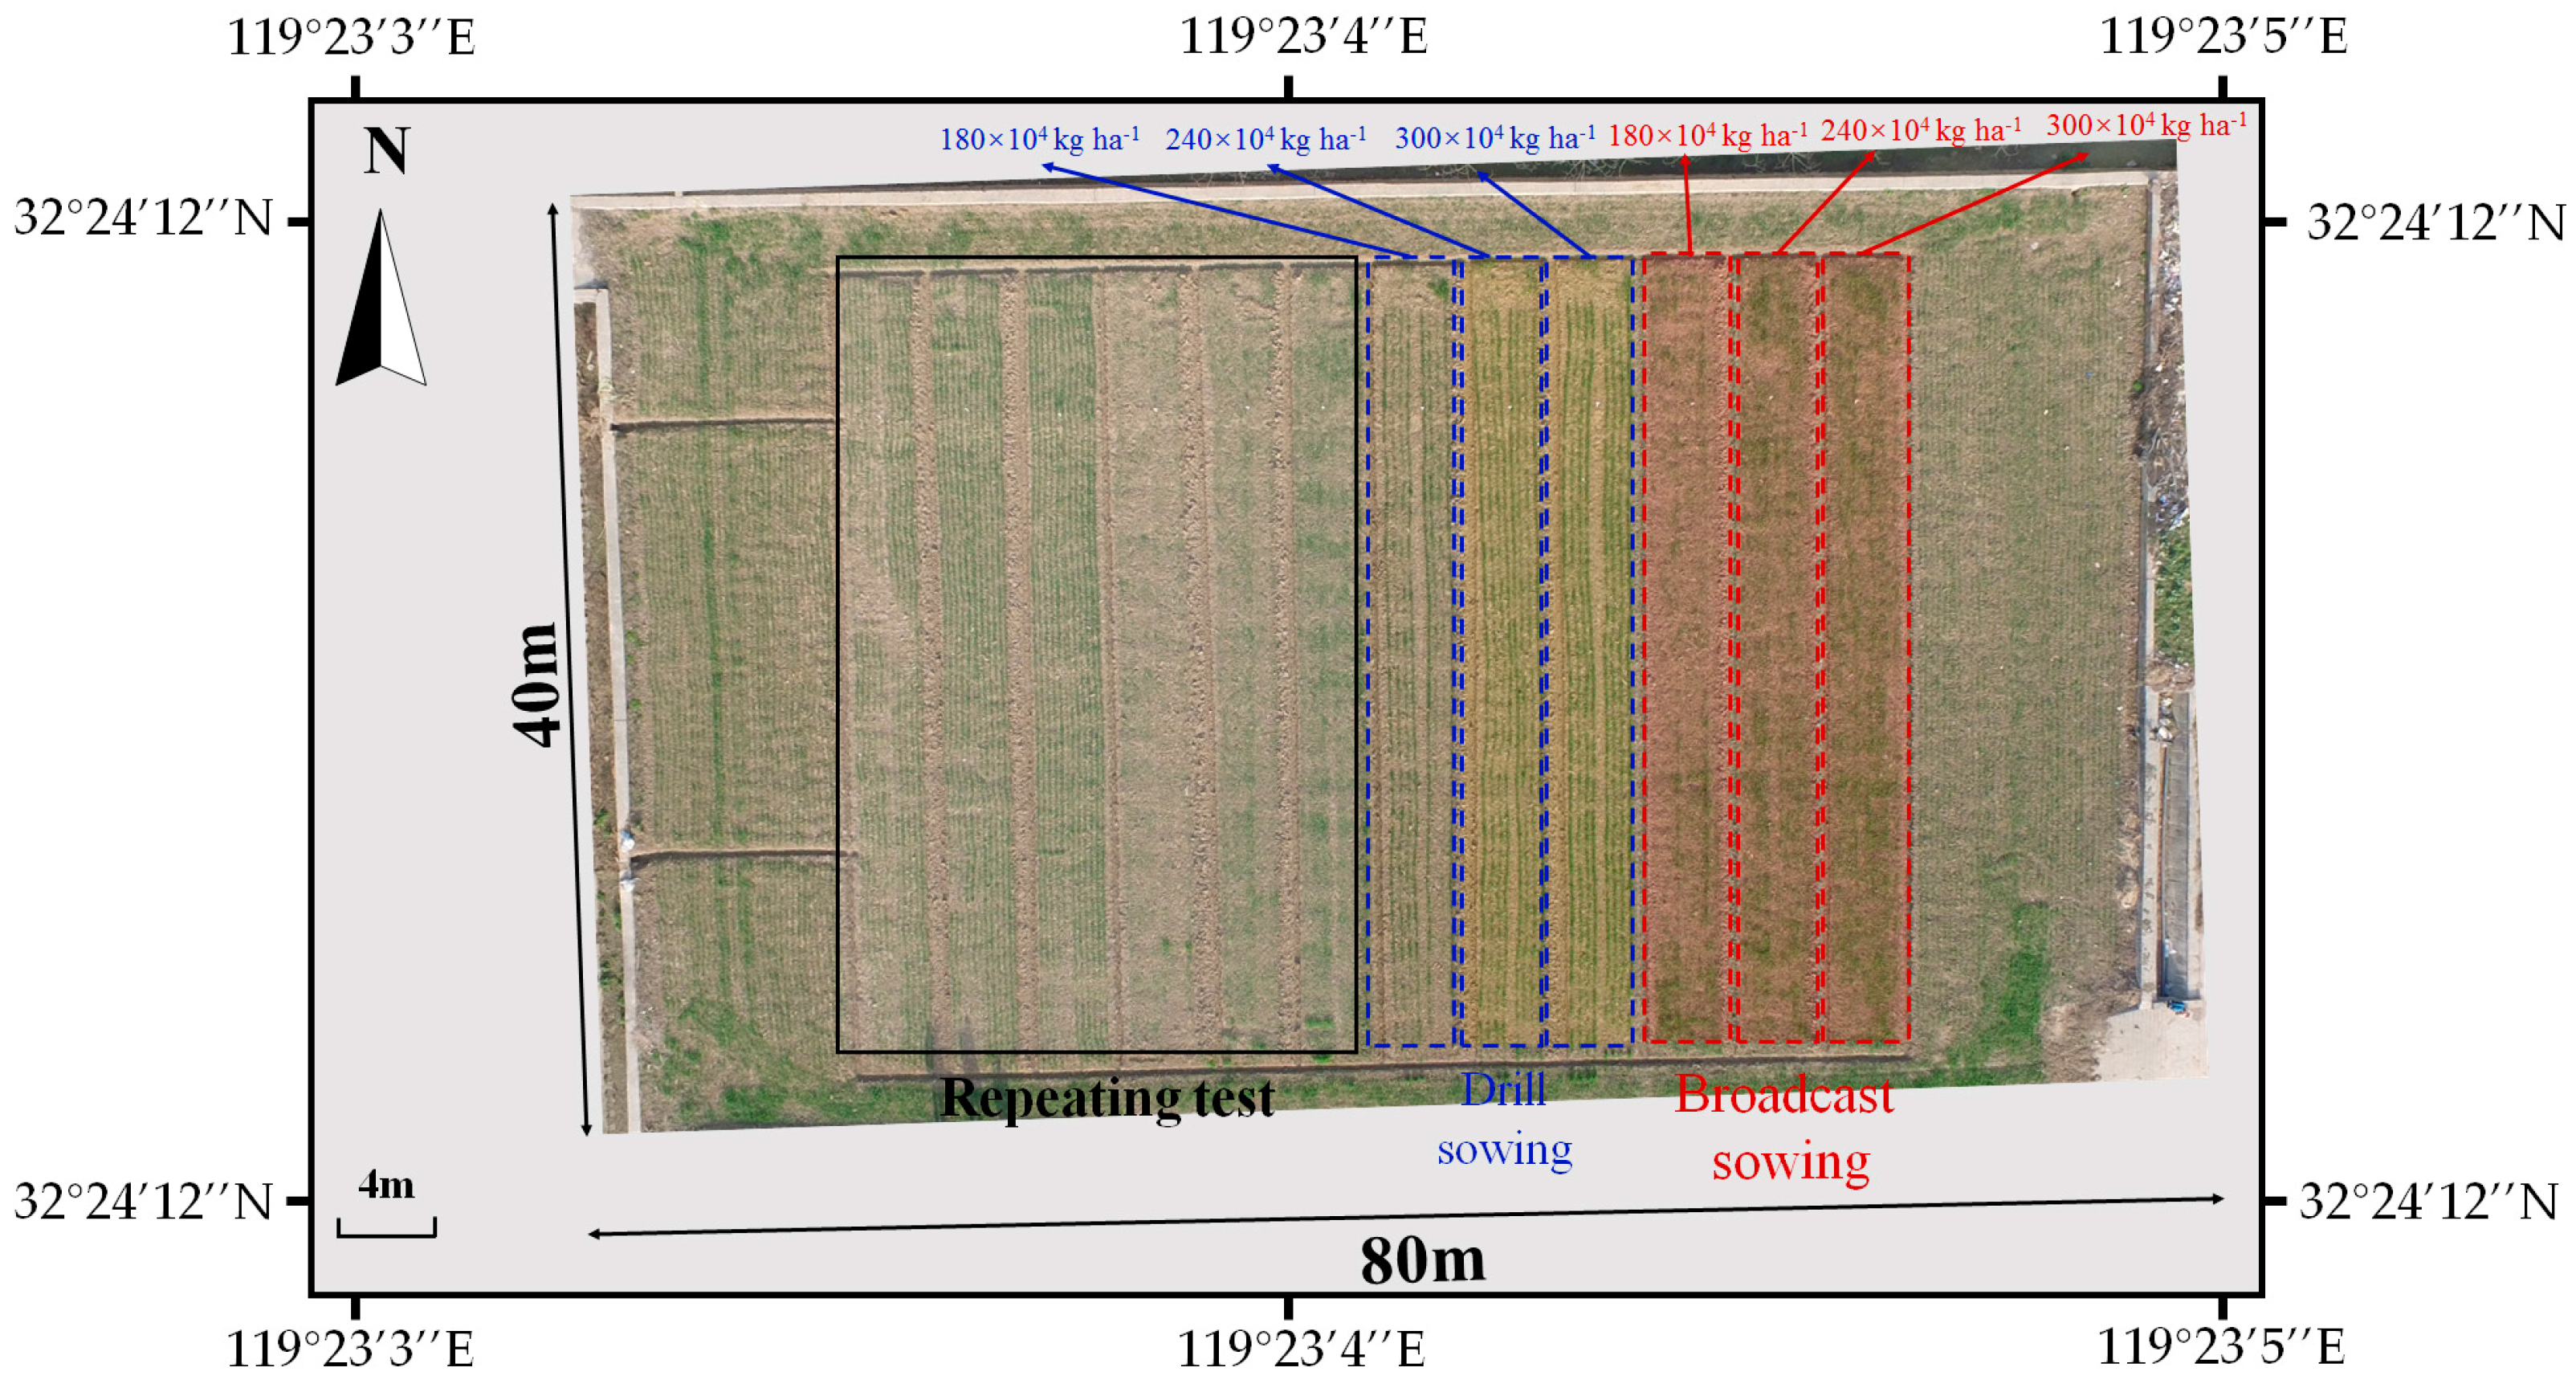
Figure 2.
The flowchart of UAV (Unmanned Aerial Vehicle) image preprocessing.

Figure 3.
Diagrammatic sketch of sub-regions in an image.

Figure 4.
The results of coverage calculation: (A) original Image of drill sowing wheat; and (B) three-dimensional diagram of coverage.
Figure 4.
The results of coverage calculation: (A) original Image of drill sowing wheat; and (B) three-dimensional diagram of coverage.
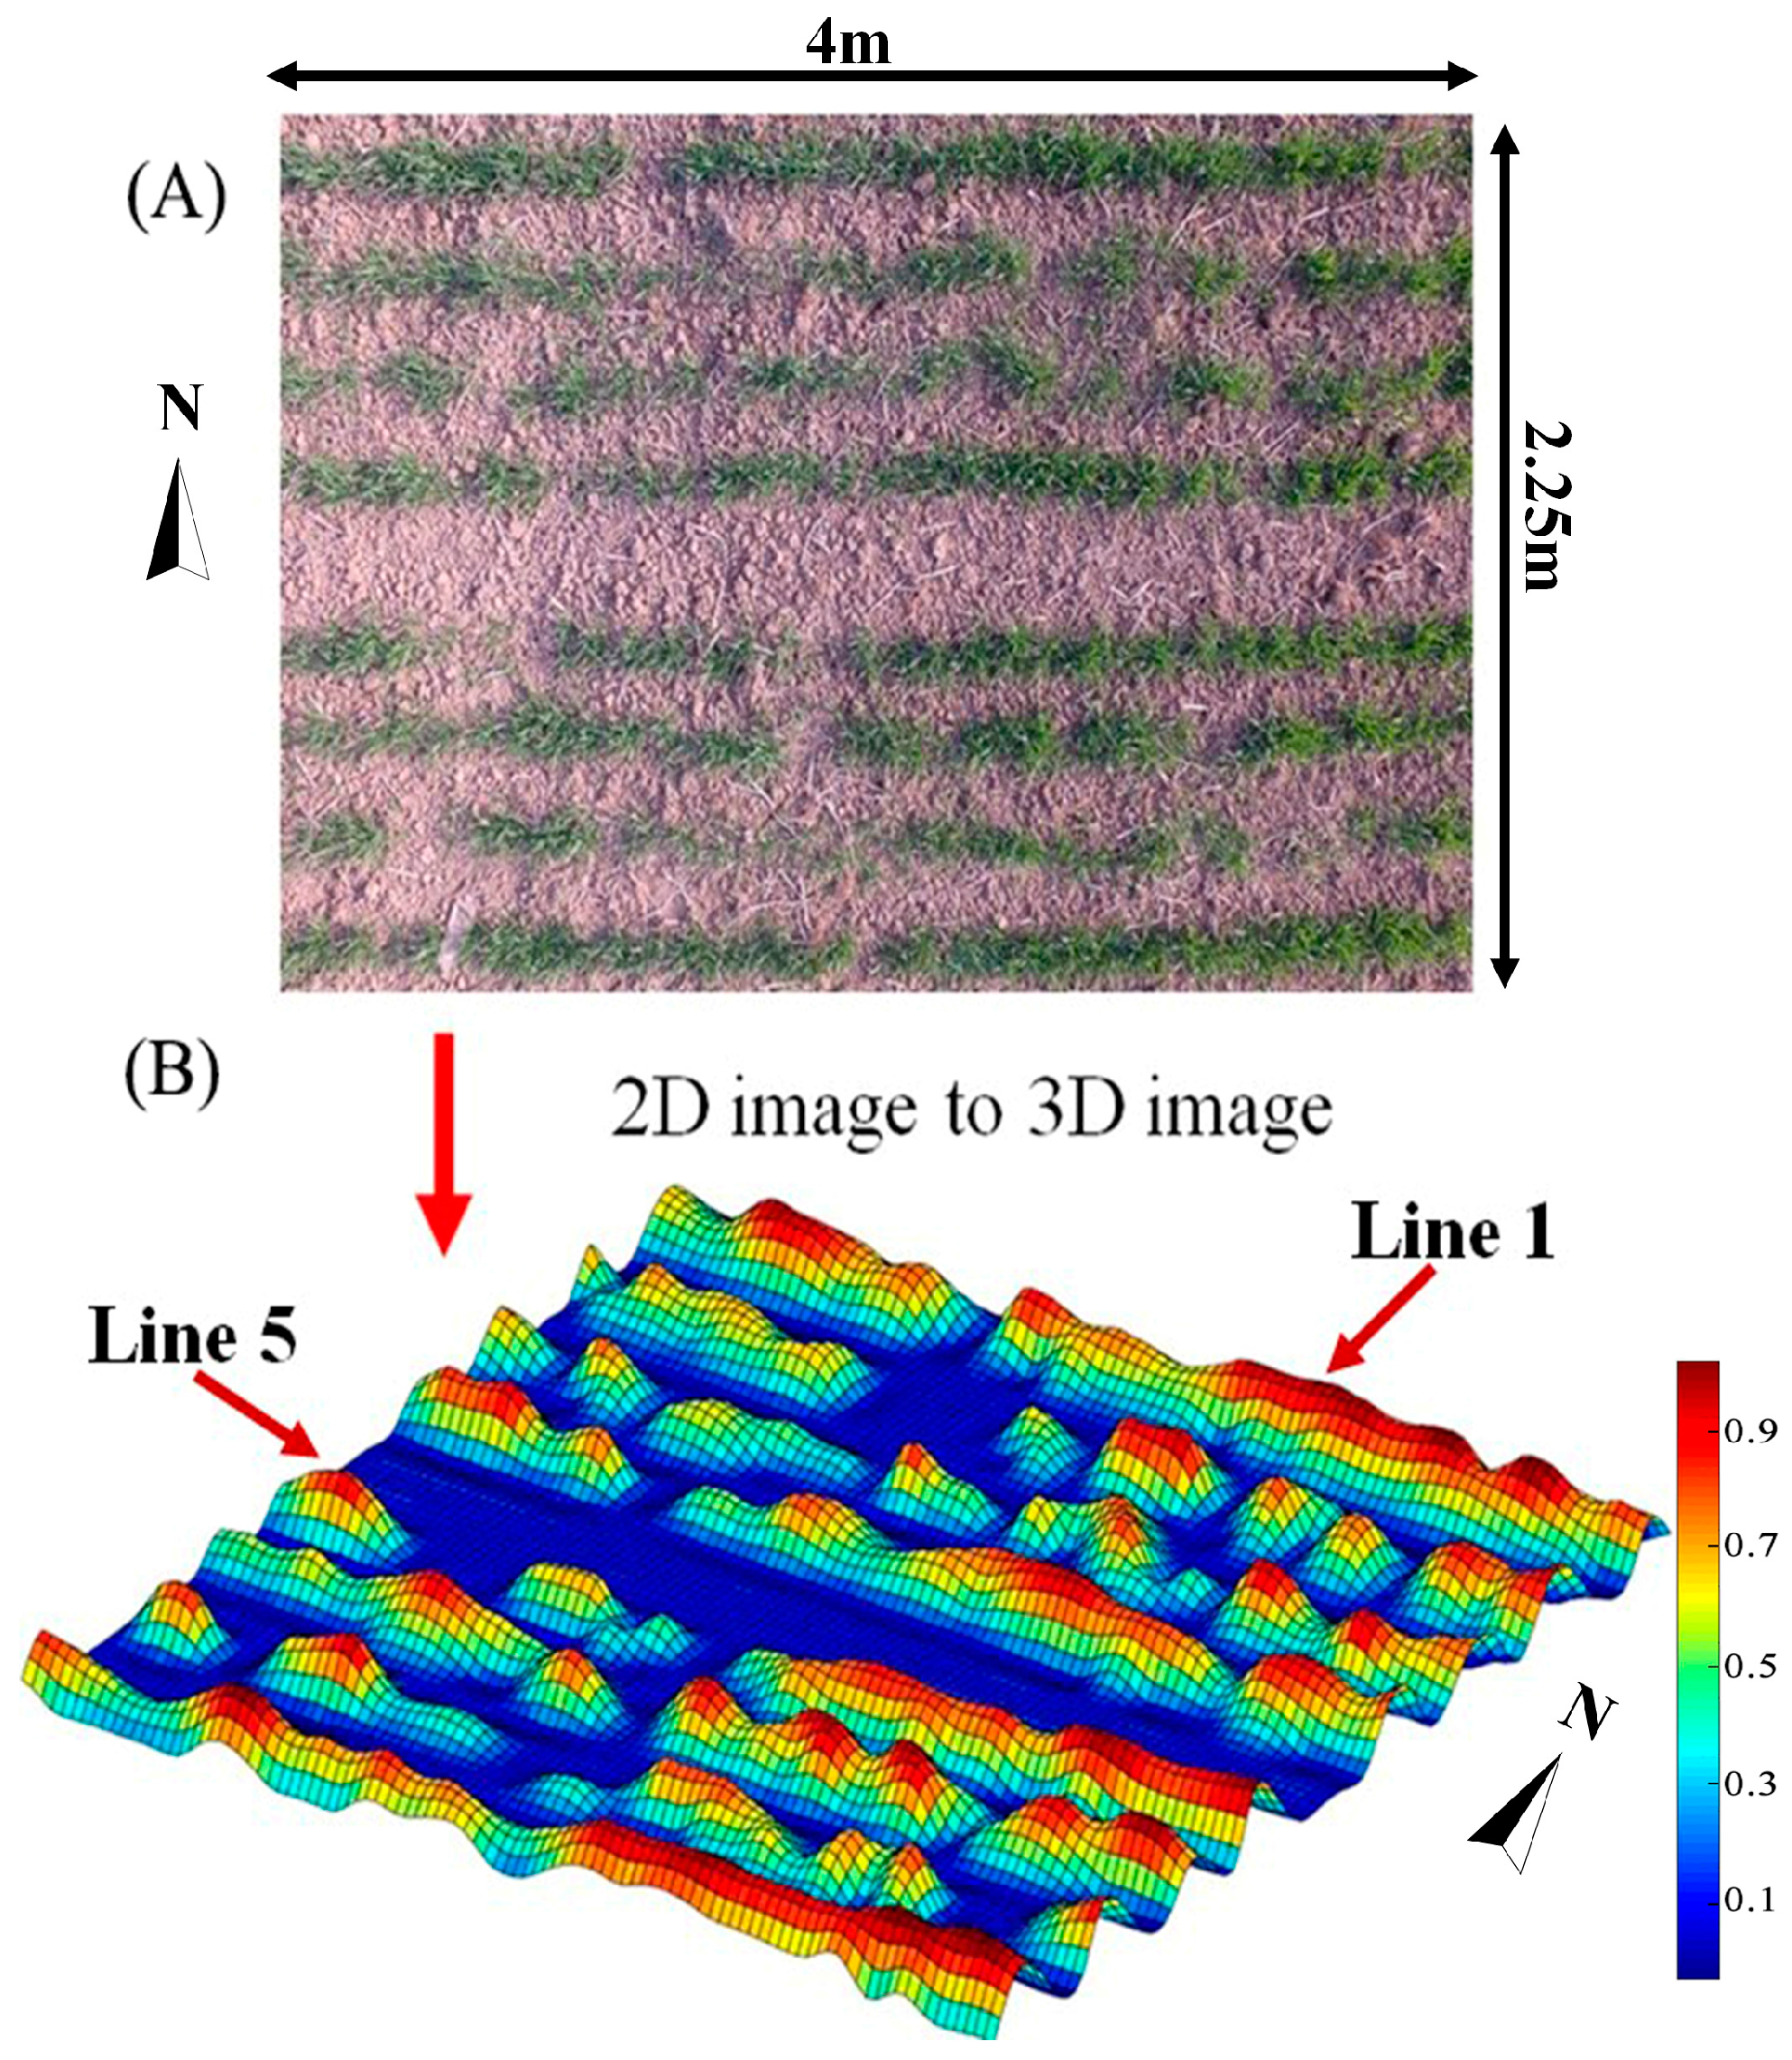
Figure 5.
Changes in the coverage value of the first and fifth lines in Figure 4: (A) coverage value of the first line; and (B) coverage value of the fifth line.
Figure 5.
Changes in the coverage value of the first and fifth lines in Figure 4: (A) coverage value of the first line; and (B) coverage value of the fifth line.
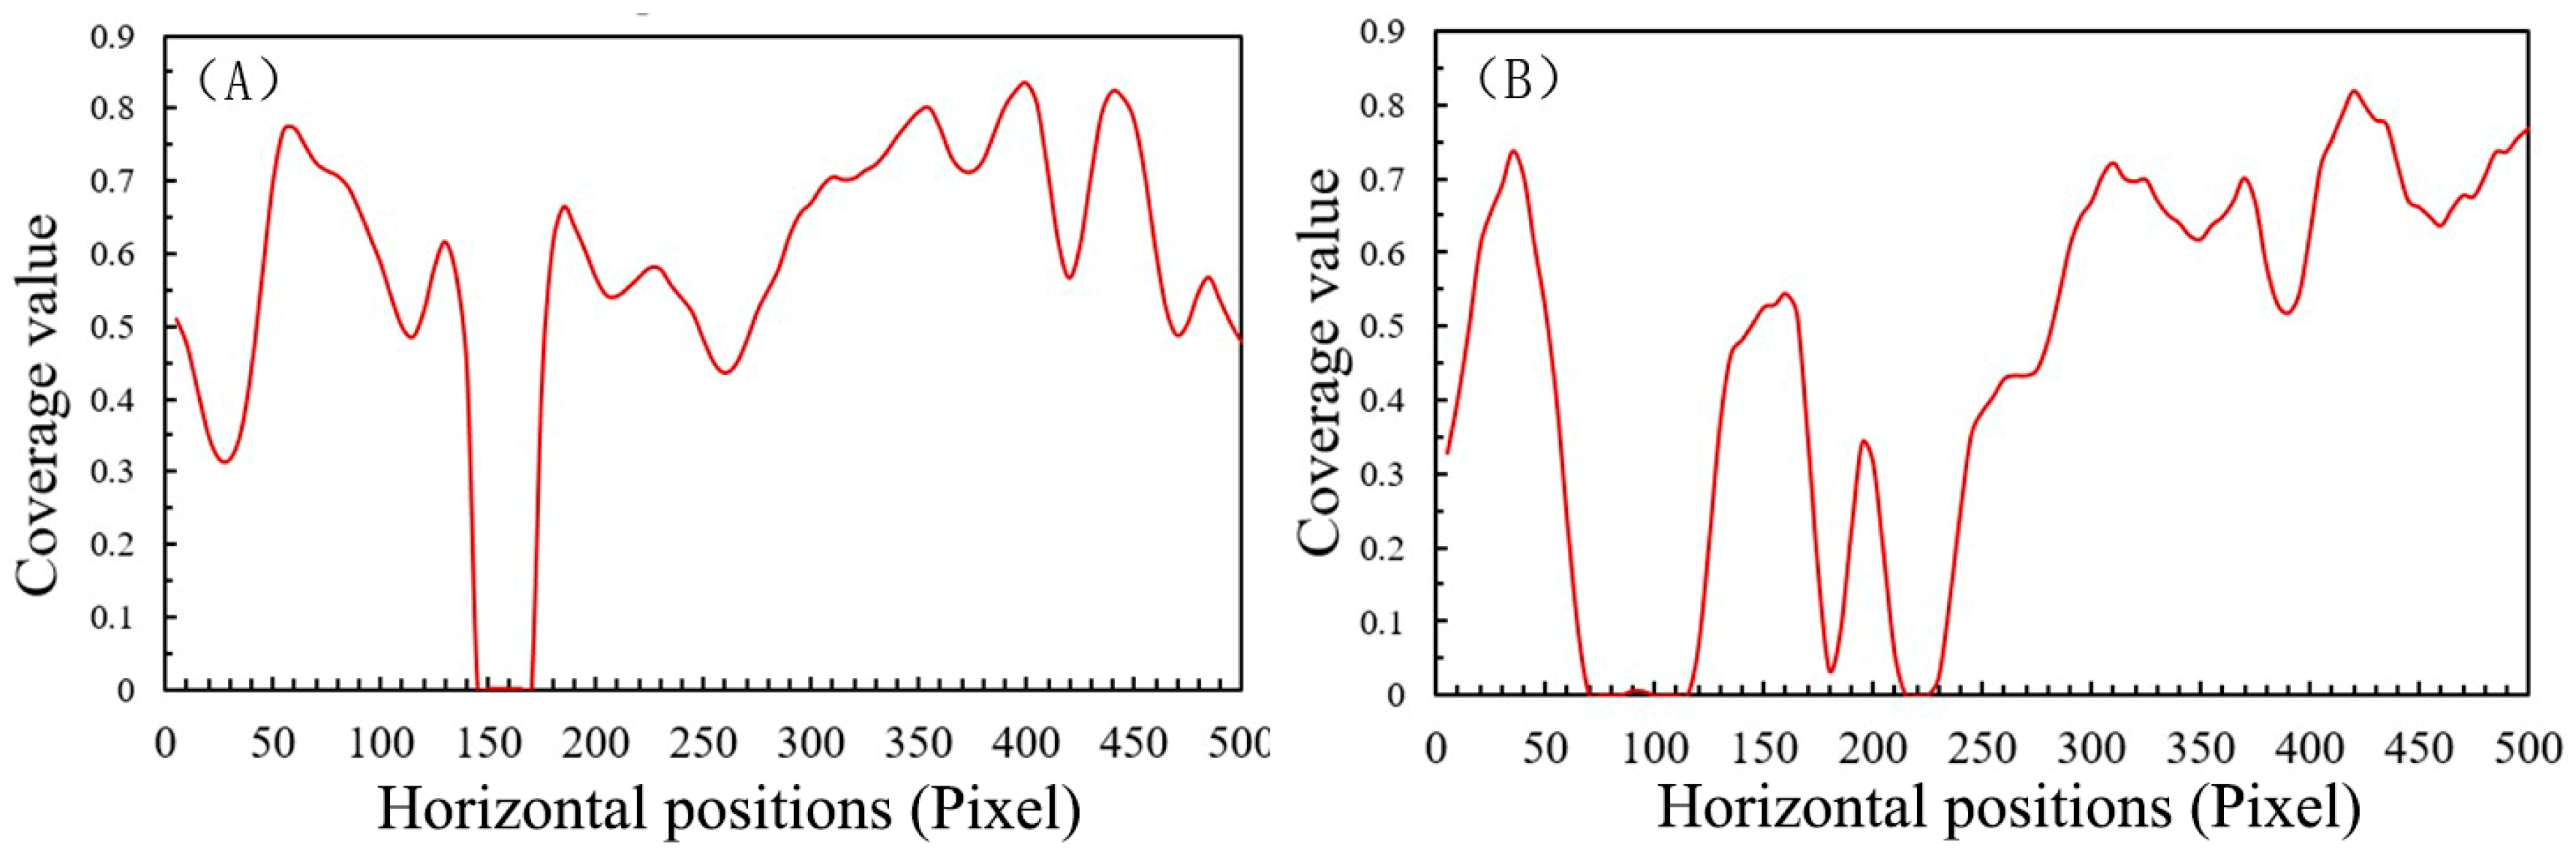
Figure 6.
Extraction of regions with missing seedlings for broadcast sowing of wheat: (A) Original image of broadcast; (B) Color map of coverage distribution; (C) Missing seedling region; (D) Information extraction of missing seedling region.
Figure 6.
Extraction of regions with missing seedlings for broadcast sowing of wheat: (A) Original image of broadcast; (B) Color map of coverage distribution; (C) Missing seedling region; (D) Information extraction of missing seedling region.
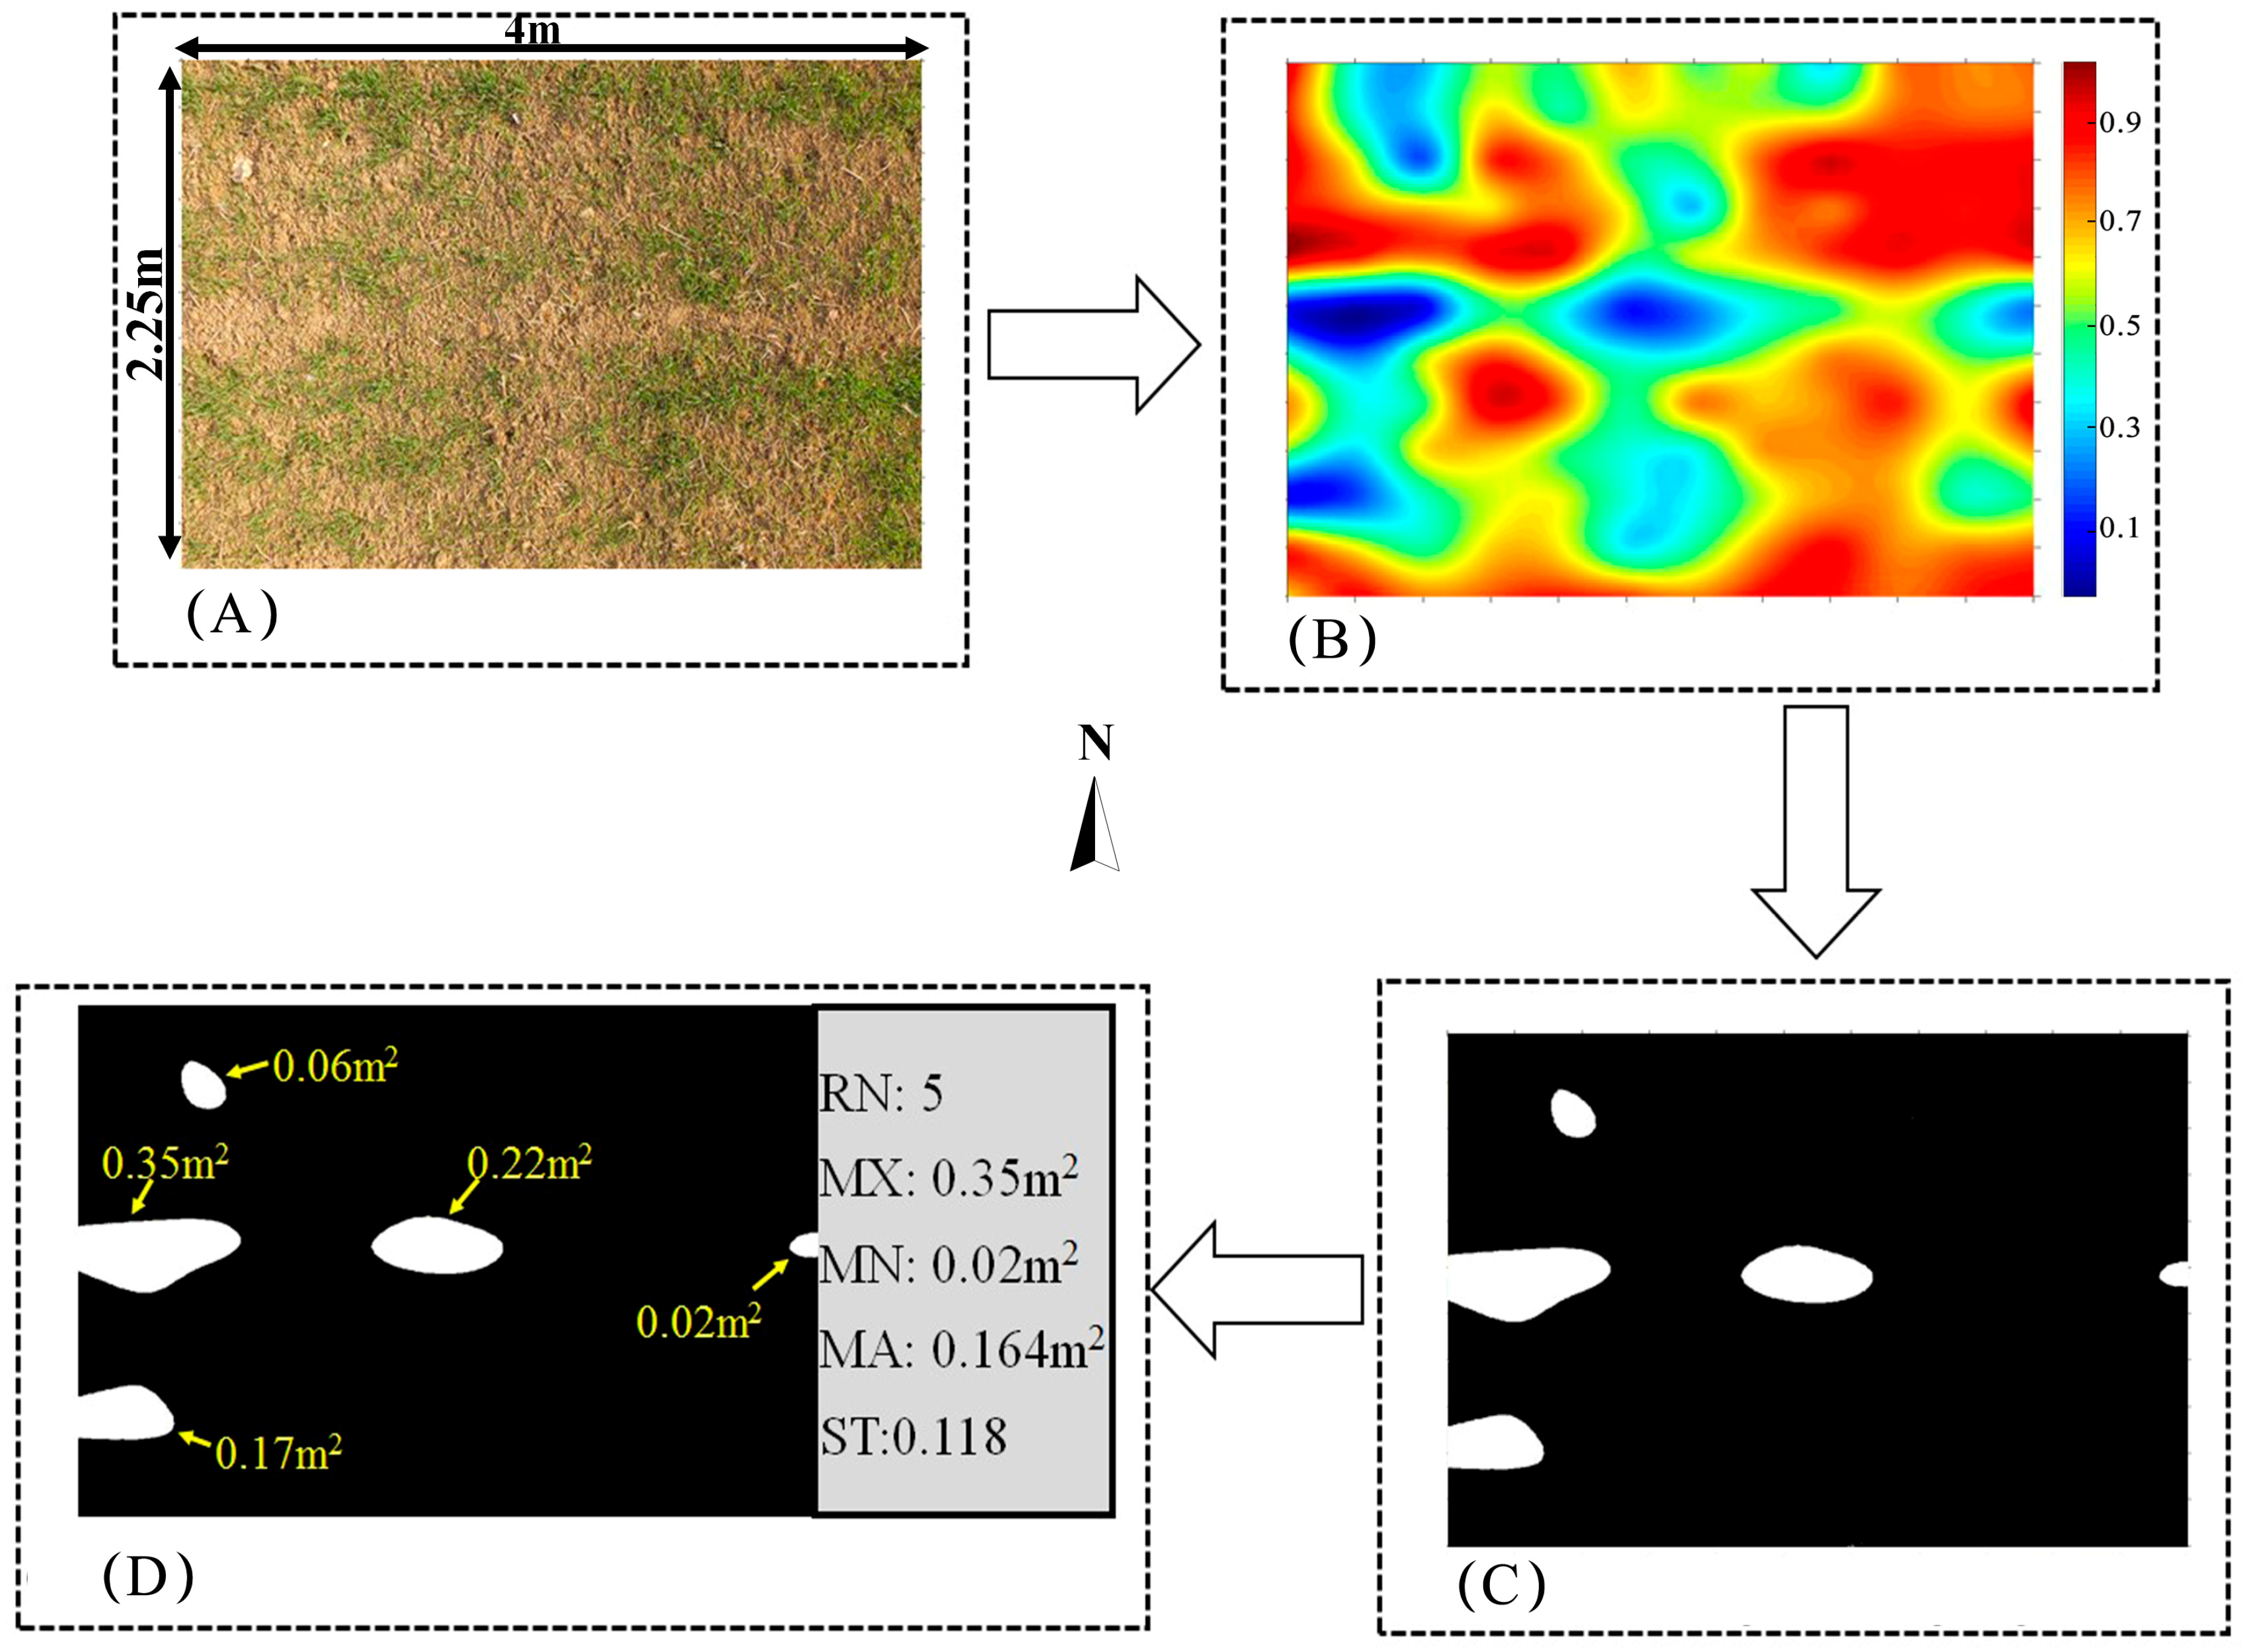
Figure 7.
Test of unmanned aerial vehicle image-based wheat seed emergence uniformity: (A) broadcast sowing of wheat; and (B) drill sowing of wheat.
Figure 7.
Test of unmanned aerial vehicle image-based wheat seed emergence uniformity: (A) broadcast sowing of wheat; and (B) drill sowing of wheat.

Figure 8.
Test results of the: number (A); and length (B) of regions with missing seedlings for drill sowing of wheat regions with missing seedlings. Note: NMSR and LMSR refer to the number and length (cm) of regions with missing seedlings, respectively.
Figure 8.
Test results of the: number (A); and length (B) of regions with missing seedlings for drill sowing of wheat regions with missing seedlings. Note: NMSR and LMSR refer to the number and length (cm) of regions with missing seedlings, respectively.
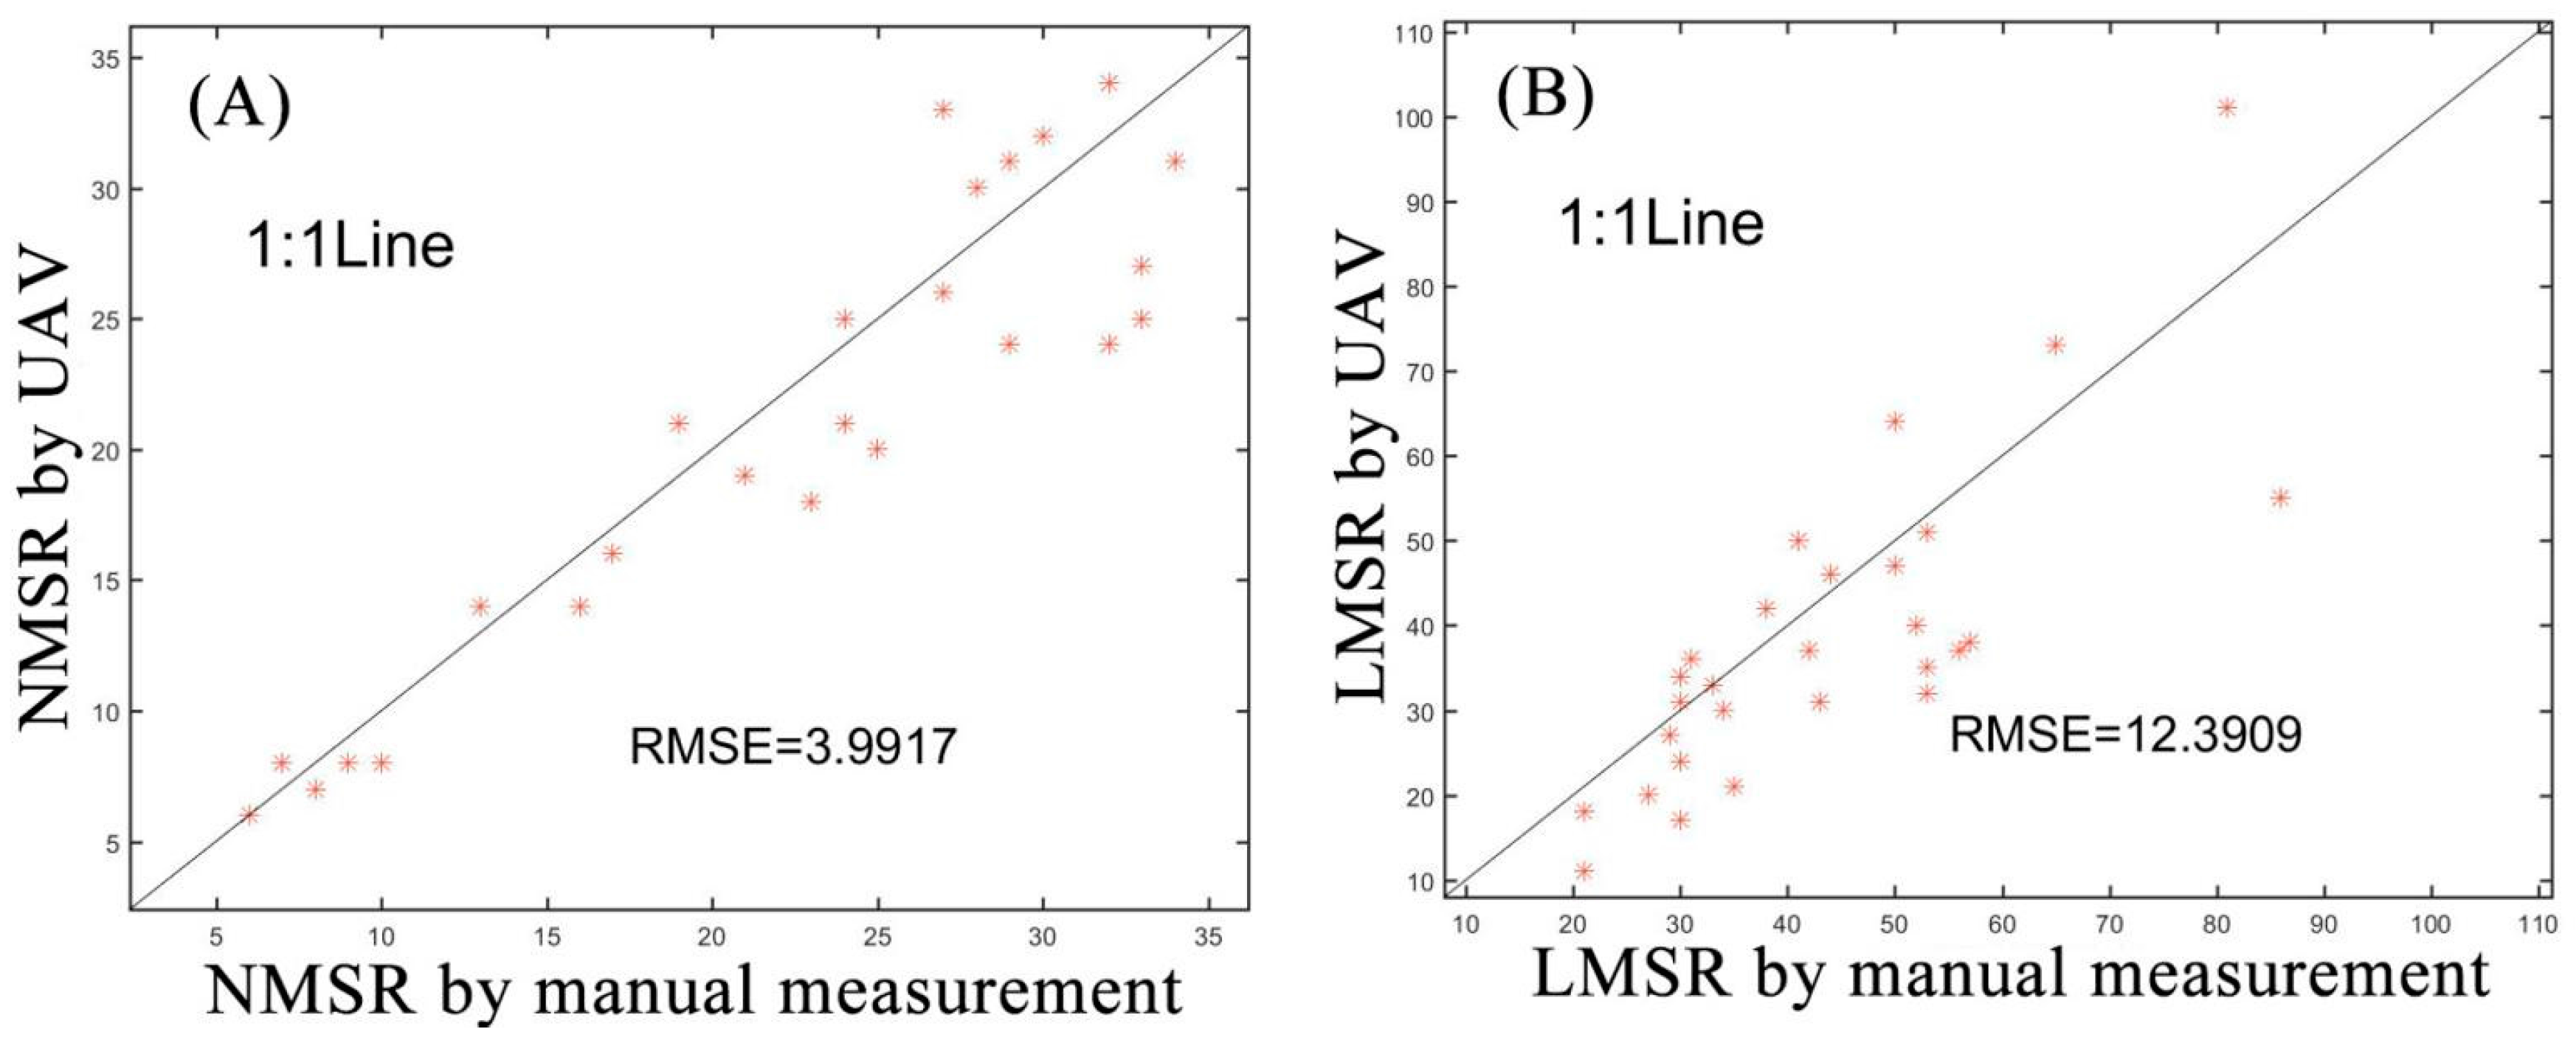
Figure 9.
Test results of the: number (A); and area (B) of regions with missing seedlings for broadcast sowing Note: NMSR and LMSR refer to the number and area of regions with missing seedlings, respectively.
Figure 9.
Test results of the: number (A); and area (B) of regions with missing seedlings for broadcast sowing Note: NMSR and LMSR refer to the number and area of regions with missing seedlings, respectively.

Figure 10.
Extraction effect of wheat images and coverage at different stages of growth: (A) original image of three leaf stage; (B) coverage map of three leaf stage; (C) original image of five leaf stage; (D) coverage map of five leaf stage; (E) original image of jointing stage; and (F) coverage map of jointing stage.

Figure 11.
Relationship between image acquisition altitude and actual area of pixel.

Figure 12.
Effects of different flight altitude on images.

Figure 13.
Effects of different levels of illumination on images.

Table 1.
Basic information of the experiments.
| Year | Sowing Date | Soil Characteristics (mg kg−1) |
|---|---|---|
| 2014 | 29 October | hydrolysable N: 112.23 |
| Available P: 45.61 | ||
| Available K: 137.16 | ||
| 2015 | 8 November | hydrolysable N: 99.86 |
| Available P: 39.12 | ||
| Available K: 106.55 |
Table 2.
Summary of the measured uniformity by UAV.
| Sowing Patterns | Nb. Subsamples | Min | Max | Mean | Range | SD 1 |
|---|---|---|---|---|---|---|
| Broadcast | 120 | 0.67 | 5.2 | 2.64 | 4.53 | 0.99 |
| drill | 120 | 0.65 | 6.22 | 3.16 | 5.57 | 1.66 |
1 SD, standard deviation.
Table 3.
Summary of the measured the number and length of missing seedlings for drill sowing by UAV.
Table 3.
Summary of the measured the number and length of missing seedlings for drill sowing by UAV.
| Info. of MSR | Nb. Subsamples | Min | Max | Mean | Range | SD |
|---|---|---|---|---|---|---|
| Number | 30 | 6 | 40 | 22.27 | 34 | 9.67 |
| Length (cm) | 30 | 11 | 101 | 38.67 | 90 | 17.5 |
Table 4.
Summary of the measured the number and area of missing seedlings for broadcast sowing by UAV.
Table 4.
Summary of the measured the number and area of missing seedlings for broadcast sowing by UAV.
| Info. of MSR | Nb. Subsamples | Min | Max | Mean | Range | SD |
|---|---|---|---|---|---|---|
| Number | 30 | 0 | 17 | 5.2 | 17 | 4.2 |
| Area (m2) | 50 | 0.01 | 0.97 | 0.51 | 0.96 | 0.37 |
Table 5.
Relationship between uniformity and yield (kg ha−1).
| Uniformity | Density (104 ha−1) | ||
|---|---|---|---|
| 180 | 240 | 300 | |
| >4 (U1) | 6800–7100 | 7400–7800 | 6900–7300 |
| 2–4 (U2) | 6100–7100 | 7100–7600 | 6200–7200 |
| <2 (U3) | 5500–6200 | 6000–6800 | 5400–6100 |
Note: U1, U2, and U3 indicate uniformity was >4, 2–4, and <2, respectively.
Table 6.
Relationship between the missing seedling rates for drill sowing and yield (kg ha−1).
| MSRD (%) | Density (104 ha−1) | ||
|---|---|---|---|
| 180 | 240 | 300 | |
| <10 (L1) | 6900–7100 | 7500–7800 | 7200–7300 |
| 10–20 (L2) | 5900–7100 | 6500–7700 | 6000–7200 |
| >20 (L3) | 5800–6000 | 6000–6500 | 5600–5800 |
Note: L1, L2, and L3, indicate MSRD (missing seedling rate for drill sowing) was <10, 10–20, and >20, respectively.
Table 7.
Relationship between the missing seedling rate for broadcast sowing and yield (kg ha−1).
| MSRB (%) | Density (kg ha−1) | ||
|---|---|---|---|
| 180 | 240 | 300 | |
| <5 (A1) | 7000–7200 | 7300–7600 | 7100–7200 |
| 5–10 (A2) | 6100–6800 | 6400–7000 | 6200–6900 |
| >10 (A3) | 5500–6000 | 5700–6600 | 5500–5900 |
Note: A1, A2, and A3, indicate MSR (missing seedling rate for broadcast sowing) was <5, 5–10, and >10, respectively.
Table 8.
Uniformity grading scale used in the present study.
| U1 | U2 | U3 | |
|---|---|---|---|
| L1 | I | III | VI |
| L2 | II | IV | VIII |
| L3 | V | VII | IX |
| A1 | I | III | VI |
| A2 | II | IV | VIII |
| A3 | V | VII | IX |
Note: A1, A2, and A3, indicate MSRD (missing seedling rate for drill sowing) was <5, 5–10, and >10, respectively; L1, L2, and L3, indicate MSRB (missing seedling rate for broadcast sowing) was <10, 10–20, and >20, respectively; and U1, U2, and U3 indicate uniformity was >4, 2–4, and <2, respectively.
© 2017 by the authors. Licensee MDPI, Basel, Switzerland. This article is an open access article distributed under the terms and conditions of the Creative Commons Attribution (CC BY) license (http://creativecommons.org/licenses/by/4.0/).
Share and Cite
MDPI and ACS Style
Liu, T.; Li, R.; Jin, X.; Ding, J.; Zhu, X.; Sun, C.; Guo, W. Evaluation of Seed Emergence Uniformity of Mechanically Sown Wheat with UAV RGB Imagery. Remote Sens. 2017, 9, 1241. https://doi.org/10.3390/rs9121241
AMA Style
Liu T, Li R, Jin X, Ding J, Zhu X, Sun C, Guo W. Evaluation of Seed Emergence Uniformity of Mechanically Sown Wheat with UAV RGB Imagery. Remote Sensing. 2017; 9(12):1241. https://doi.org/10.3390/rs9121241
Chicago/Turabian StyleLiu, Tao, Rui Li, Xiuliang Jin, Jinfeng Ding, Xinkai Zhu, Chengming Sun, and Wenshan Guo. 2017. "Evaluation of Seed Emergence Uniformity of Mechanically Sown Wheat with UAV RGB Imagery" Remote Sensing 9, no. 12: 1241. https://doi.org/10.3390/rs9121241
Note that from the first issue of 2016, this journal uses article numbers instead of page numbers. See further details here.