High Throughput Phenotyping of Blueberry Bush Morphological Traits Using Unmanned Aerial Systems


Bio-Sensing and Instrumentation Laboratory, School of Electrical and Computer Engineering, University of Georgia, Athens, GA 30602, USA
*
Author to whom correspondence should be addressed.
Remote Sens. 2017, 9(12), 1250; https://doi.org/10.3390/rs9121250
Submission received: 6 October 2017
/
Revised: 20 November 2017
/
Accepted: 23 November 2017
/
Published: 2 December 2017
(This article belongs to the Special Issue Estimation of Crop Phenotyping Traits using Unmanned Ground Vehicle and Unmanned Aerial Vehicle Imagery)
Abstract
:Phenotyping morphological traits of blueberry bushes in the field is important for selecting genotypes that are easily harvested by mechanical harvesters. Morphological data can also be used to assess the effects of crop treatments such as plant growth regulators, fertilizers, and environmental conditions. This paper investigates the feasibility and accuracy of an inexpensive unmanned aerial system in determining the morphological characteristics of blueberry bushes. Color images collected by a quadcopter are processed into three-dimensional point clouds via structure from motion algorithms. Bush height, extents, canopy area, and volume, in addition to crown diameter and width, are derived and referenced to ground truth. In an experimental farm, twenty-five bushes were imaged by a quadcopter. Height and width dimensions achieved a mean absolute error of 9.85 cm before and 5.82 cm after systematic under-estimation correction. Strong correlation was found between manual and image derived bush volumes and their traditional growth indices. Hedgerows of three Southern Highbush varieties were imaged at a commercial farm to extract five morphological features (base angle, blockiness, crown percent height, crown ratio, and vegetation ratio) associated with cultivation and machine harvestability. The bushes were found to be partially separable by multivariate analysis. The methodology developed from this study is not only valuable for plant breeders to screen genotypes with bush morphological traits that are suitable for machine harvest, but can also aid producers in crop management such as pruning and plot layout organization.
1. Introduction
The highbush blueberry (Vaccinium corymbosum) is a perennial, deciduous shrub with a typical height of 1–2 m. The blueberry industry has grown by leaps and bounds in the United States and around the world in the past two decades [1]. Currently, most fresh market blueberries are handpicked, which is costly and not sustainable given the shortage and rising costs of labor. Machine harvesting has drastically reduced the labor and time cost of harvesting blueberries, but several major issues need to be addressed before mechanical harvesters can be widely adopted for the fresh market blueberry. In addition to diminished fruit quality due to bruising, ground loss is a critical problem facing machine harvesting. Machine harvesters have spring loaded catch plates that surround the crown of the bush several inches from the ground. Any fruit that does not fall on to the catch plates is lost to the ground. Up to 30% of the harvest can be lost through the crown, most of which comes from upright canes in the middle of the bush [2]. Ideally, the diameter of the bush crown at catch pan height should be less than 8–12 inches to minimize loss [2]. Producers have used collars [3] and crown restricting trellises [4] to reduce ground loss, but these methods are labor intensive and collars can increase the risk of disease. Bushes that are vase shaped have a cavity in the middle of the bush which reduces fruit loss through the crown and allows light to penetrate the bush [2]. Vase shaped bushes are also less prone to sprawling under the weight of the fruit, keeping the branches from drooping to the ground or in the way of the catch plates [4]. Bush height is another important factor as the harvesting machine needs to be able to clear the bushes, and the higher fruit is more susceptible to bruising when falling onto a catch pan [5].
Plant morphological traits are quantitative traits largely determined by plant genetics [6,7]. Studies have been conducted to analyze digital images of bisected fruits to calculate variables to describe their shape with user guidance. Researchers have been able to find genes associated with fruit shape and size, among other features [8]. There have been efforts to develop vocabularies, metrics, and software to aid in the analysis of tomato fruit shape variation [9,10]. This level of shape analysis has not been performed on bushes. Although efforts have been made by plant breeders to breed cultivars with desirable bush morphological traits that are suitable for machine harvest, currently, these traits must all be assessed with manual labor. Plant breeders must visually inspect each bush and record its dimensions, or a subjective assessment, in order to decide which cultivars are worth breeding. Growth indices are used to characterize bush development and fruiting potential based on the product [11] or average [12] of the bush’s length along row, length across row, and height. These indices are useful in growth monitoring, but are not particularly helpful when compared among genetic varieties with varying shapes. Breeding studies require a couple of years before bushes are assessed at all, and at least eight years before a final variety is released [4,13]. Blueberry breeding programs are in need of high throughput phenotyping technologies to take full advantage of genetics and genomics.
Unmanned aerial systems (UASs) are rising in popularity for applications in high-throughput phenotyping due to their capability of data collection with a high spatial and temporal resolution [14]. UASs have been used to determine the height and canopy growth rates of cotton [15], wheat [16], rice [17], trees [18], and other crops. There has been limited research into using 3D models developed from UAS acquired images to examine plant architecture. Height [18] and crown diameter have been assessed in olive trees from aerial imagery [19]. Vineyard macro-structure such as row width, spacing, height, and orientation have also been measured [20]. Tree volume has been measured by tractor and tripod mounted LIDAR [21,22] and bare tree volume has been assessed by UAS, terrestrial LIDAR, and handheld cameras [23,24]. To the best of our knowledge, the application of low altitude UASs to acquire oblique imagery of leafy bushes for the extraction of morphological parameters has not been explored. In particular, morphological traits that are associated with machine harvestability such as crown size and bush shape have not been investigated. This is likely due to the difficulty in imaging bush crowns and the underside of canopies. If morphological traits can be extracted without field labor, the cost and time required for breeding studies will be greatly reduced. Applying this technology to blueberry breeding may provide growers with cultivars that can be machine harvested without significant ground loss.
The overall goal of this study was to determine the feasibility and accuracy of using a low-cost consumer UAS to acquire images to extract blueberry bush morphological traits that are relevant to machine harvestability. Specific objectives were to: (1) determine optimum parameters of the drone and onboard cameras for aerial image data collection; (2) use images to generate point clouds and extract morphological traits from the 3D model; (3) quantify shape metrics for desirable machine harvestability and compare bush varieties.
2. Materials and Methods
2.1. Plant Materials and Test Sites
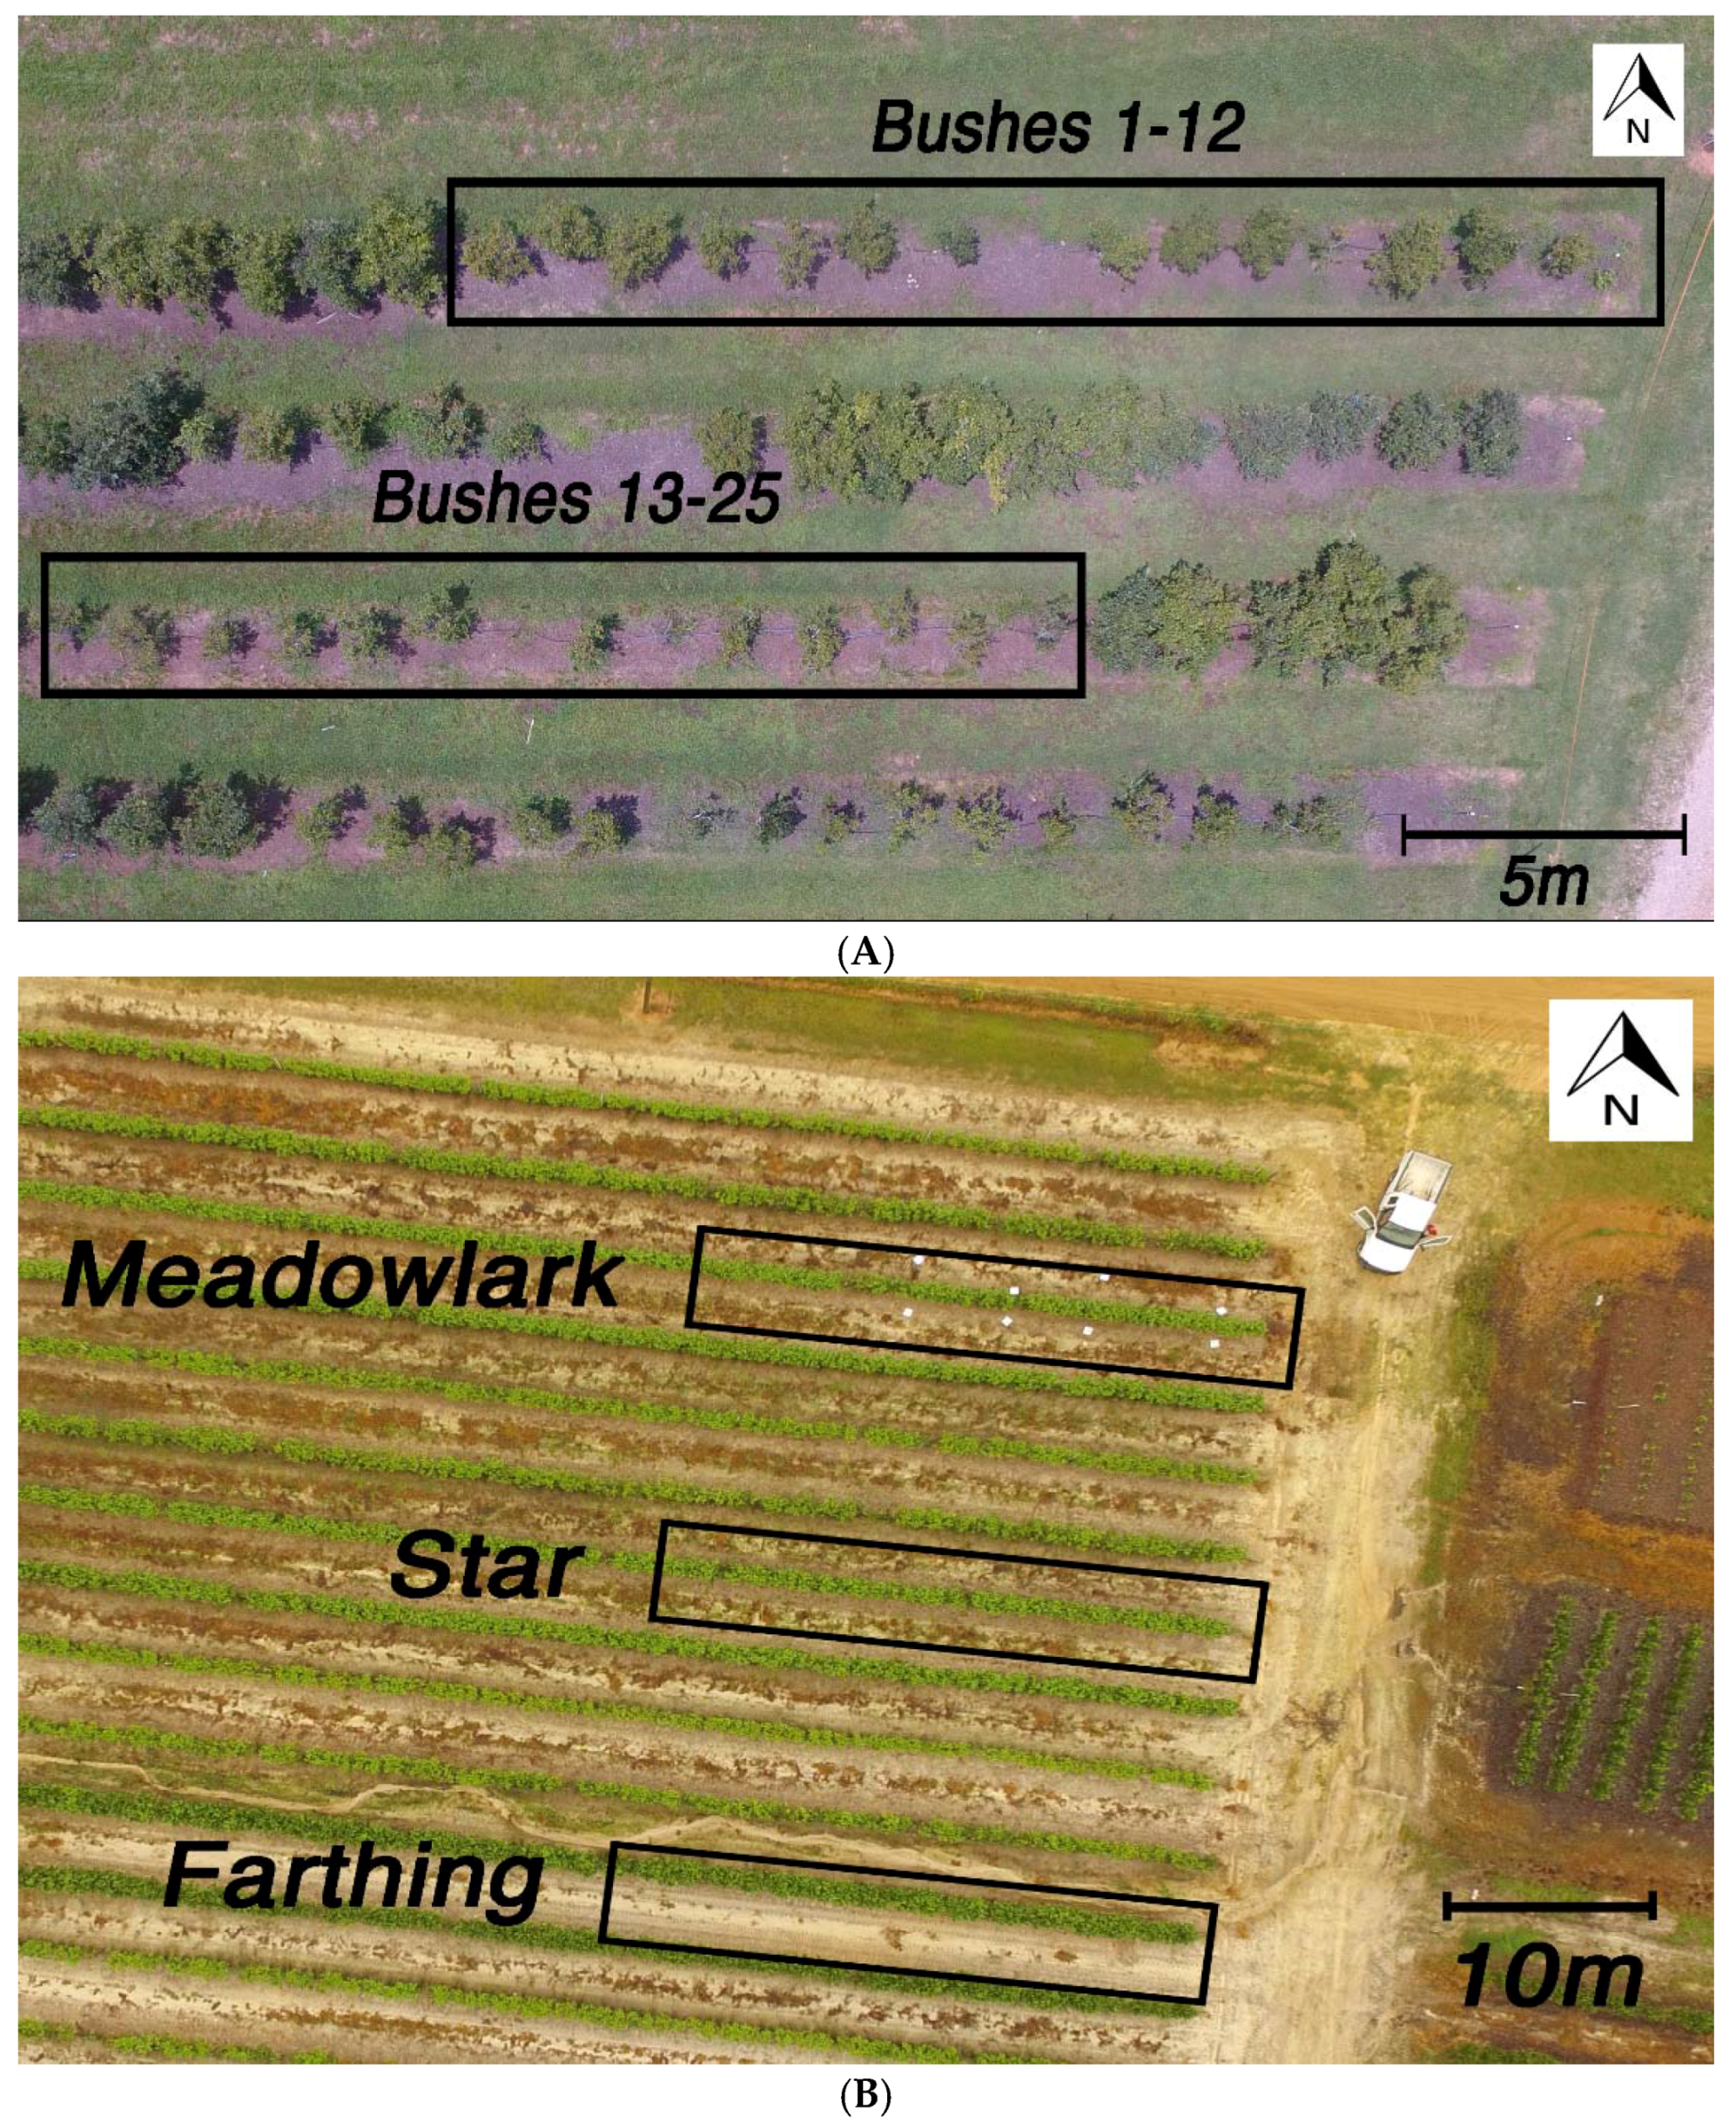
Star and O’Neal Southern Highbush blueberry (Vaccinium darrowii) bushes at the University of Georgia’s Horticulture research farm (33°53′10.7″ N 83°25′15.6″ W) were imaged and manually measured (Figure 1A). The bushes were planted with 1.5 m between bushes and 3 m between rows seven years before this study was conducted. This experimental horticulture research farm has large spacing between bushes to allow them to develop without crowding each other or altering natural growth patterns. The 25 sample bushes selected for this study were selected for their non-overlapping canopies. The bushes are pruned in late winter biannually, and had not been pruned prior to this spring. Reference objects including an exercise ball (55 cm diameter) on a stand and three cardboard boxes (38 × 17 × 61, 41 × 47 × 46, 14 × 19 × 25 cm) were added to the data collection scene for reference.
Commercial cultivation data was collected from a farm located in Alma Georgia (31°31′18.6″ N 82°23′25.1″ W). The bushes were planted with 61 cm between bushes for Meadowlark and Star, and 71 cm between Farthing bushes. The gap between rows was 3.5 m. At this farm, a few ubiquitous southern highbush varieties were grown in hedgerows: Star, Farthing, and Meadowlark (Figure 1B). The bushes at this location are 3.5 years old and have the same cultivation practices. The pruning for the varieties had some variance. The tops of the Farthing, which grow taller than the Star and Meadowlark, were trimmed. The Star and Meadowlark were more drastically hedged on their sides.
2.2. Flight and Camera Parameters
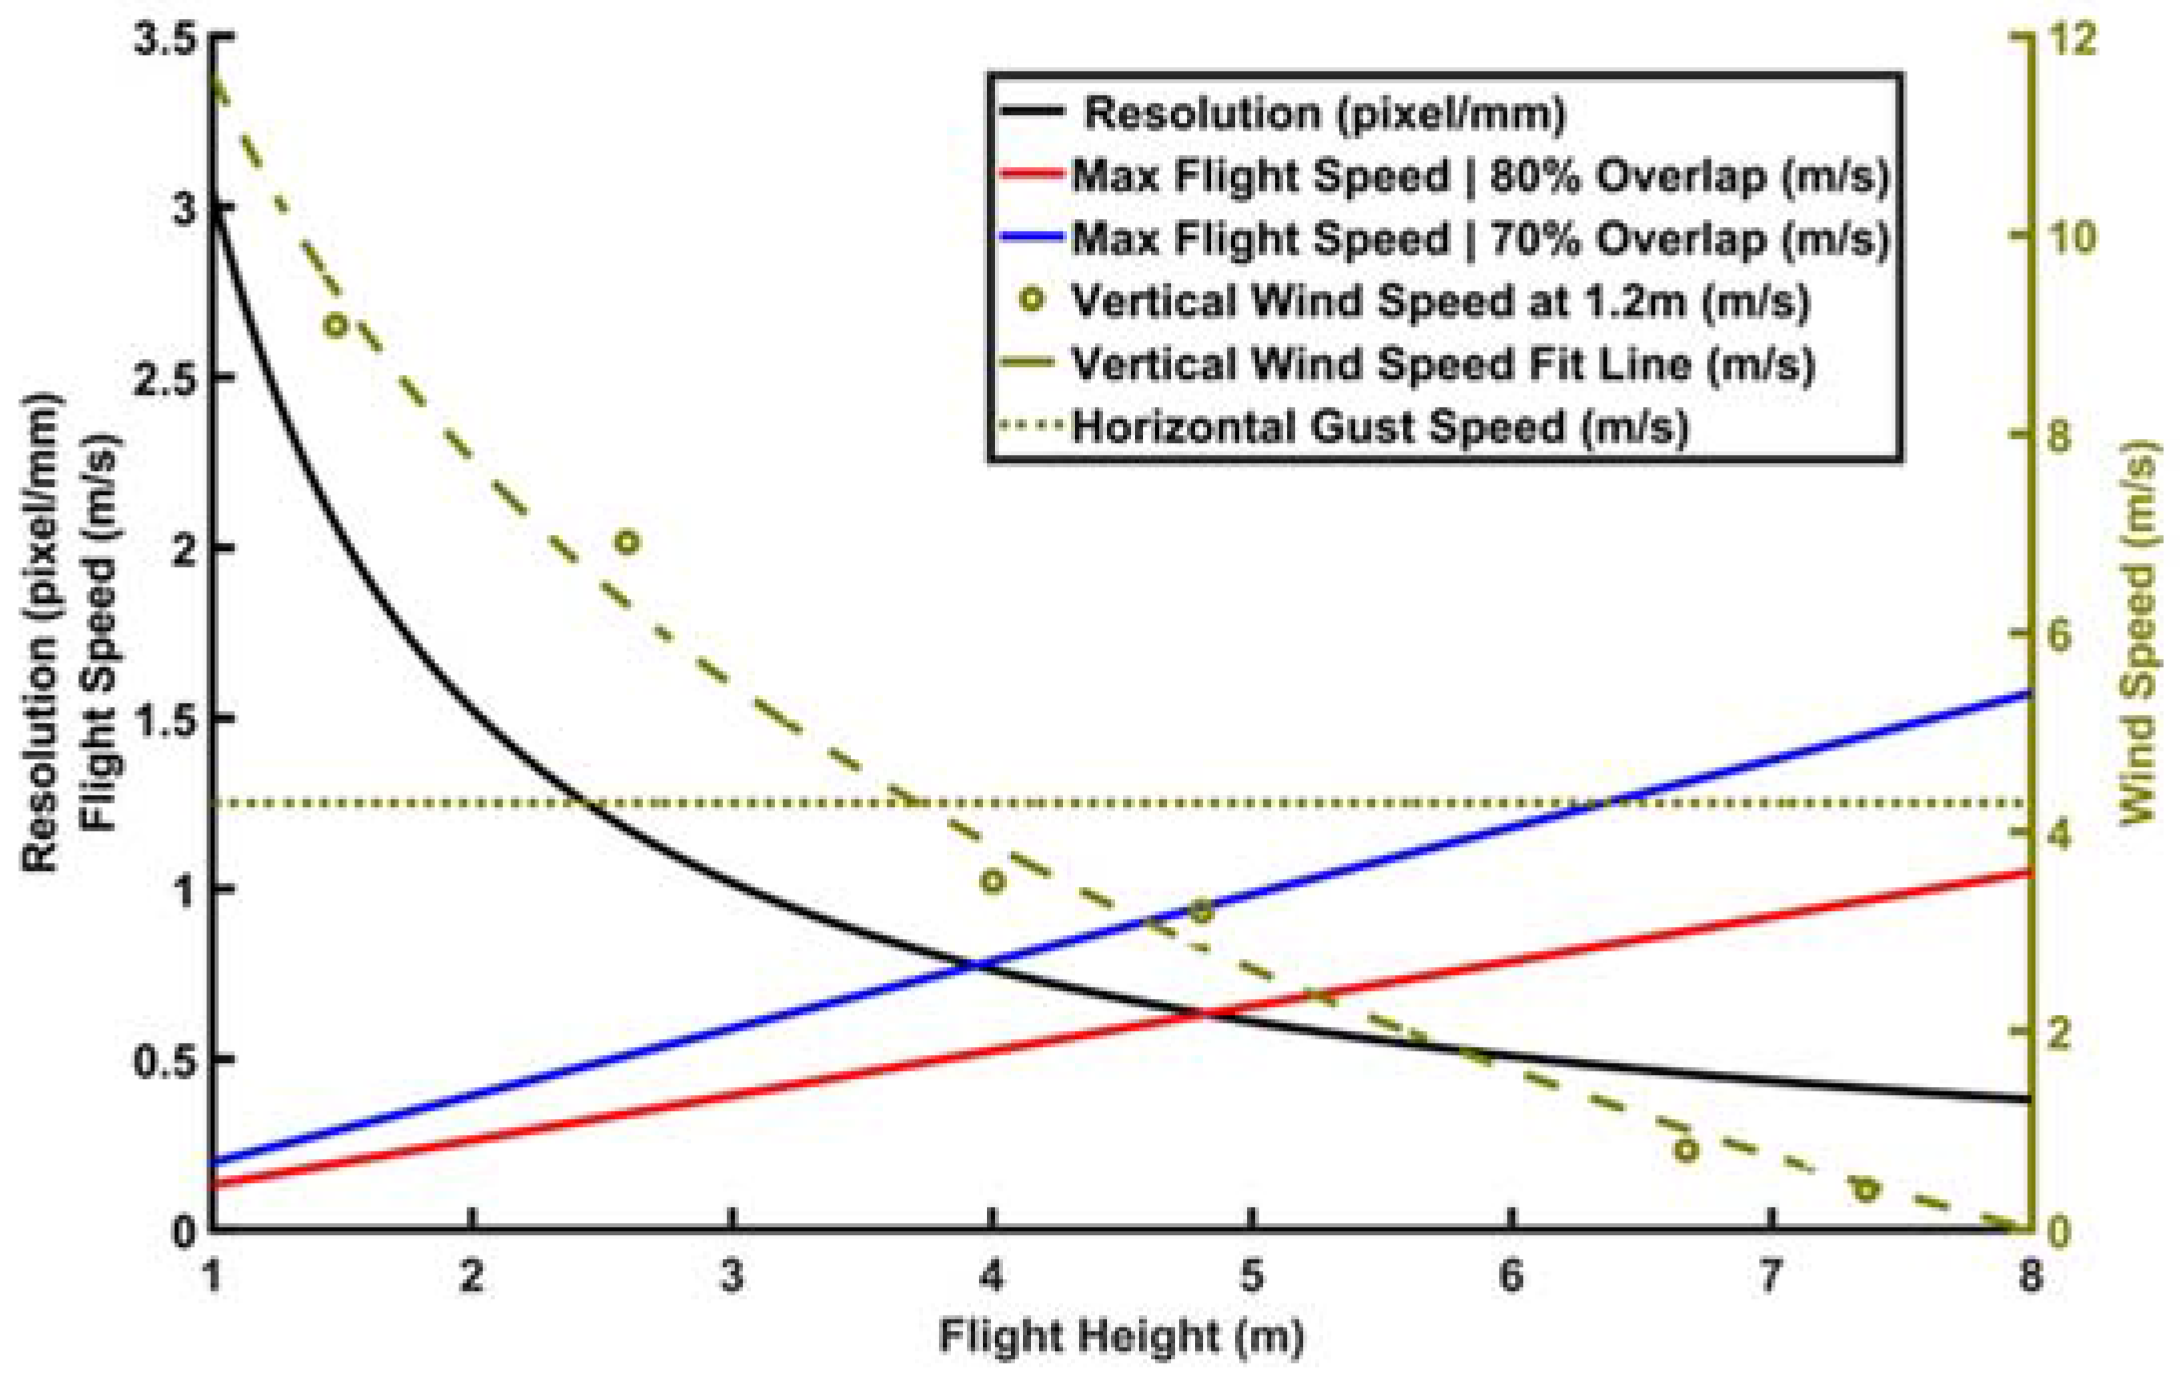
There were a number of tradeoffs to consider when selecting the flight parameters. The flight height is one of the most prominent factors, as it affects the maximum flight speed to maintain image overlap, resolution, and flight duration. Our objective of achieving high accuracy measurements compelled us to seek high resolution images. This meant slowing down the flight speed to reduce motion blur, and to achieve sufficient overlap for the structure from motion (SFM) processing. Ultimately, we decided to fly as low as possible over the bushes without causing a turbulent disturbance differentiable from the naturally occurring breeze. Wind disturbance was measured while the quadcopter was flown at heights from 3 to 8 m above ground (according to the flight control application). At each height, the maximum vertical wind speed at 1.2 m above ground was recorded by an anemometer (MS6252B, MASTECH, City of Industry, CA, USA). During data collection, a reference target was imaged in order to determine the true altitude. The objective was to find the flight height at which the quadcopters thrust disturbance (at bush height) is indistinguishable from an ambient gust.
Paths flown to the side of the row of interest maintained the lowest safe altitude possible (about a meter above the bushes in the adjacent row). The flight speed was determined by the need for overlap, the minimum possible flight height, and the camera sampling rate.
A reference target of known dimensions was imaged by the stationary quadcopter at known distances. The inverse relationship between object distance and the reference target size in the images was established. The same target was imaged during wind disturbance data collection to calculate the true distance from the lens to the ground. Variance and inaccuracy in the quadcopter’s flight height (as a result of the limitations of its internal GPS) was observed, so the repeatability of height control was measured. The quadcopter had its power reset so it would recalculate its position via GPS, and was then directed to hover at 5 m above the reference target. This was repeated eight times to observe the error and variance.
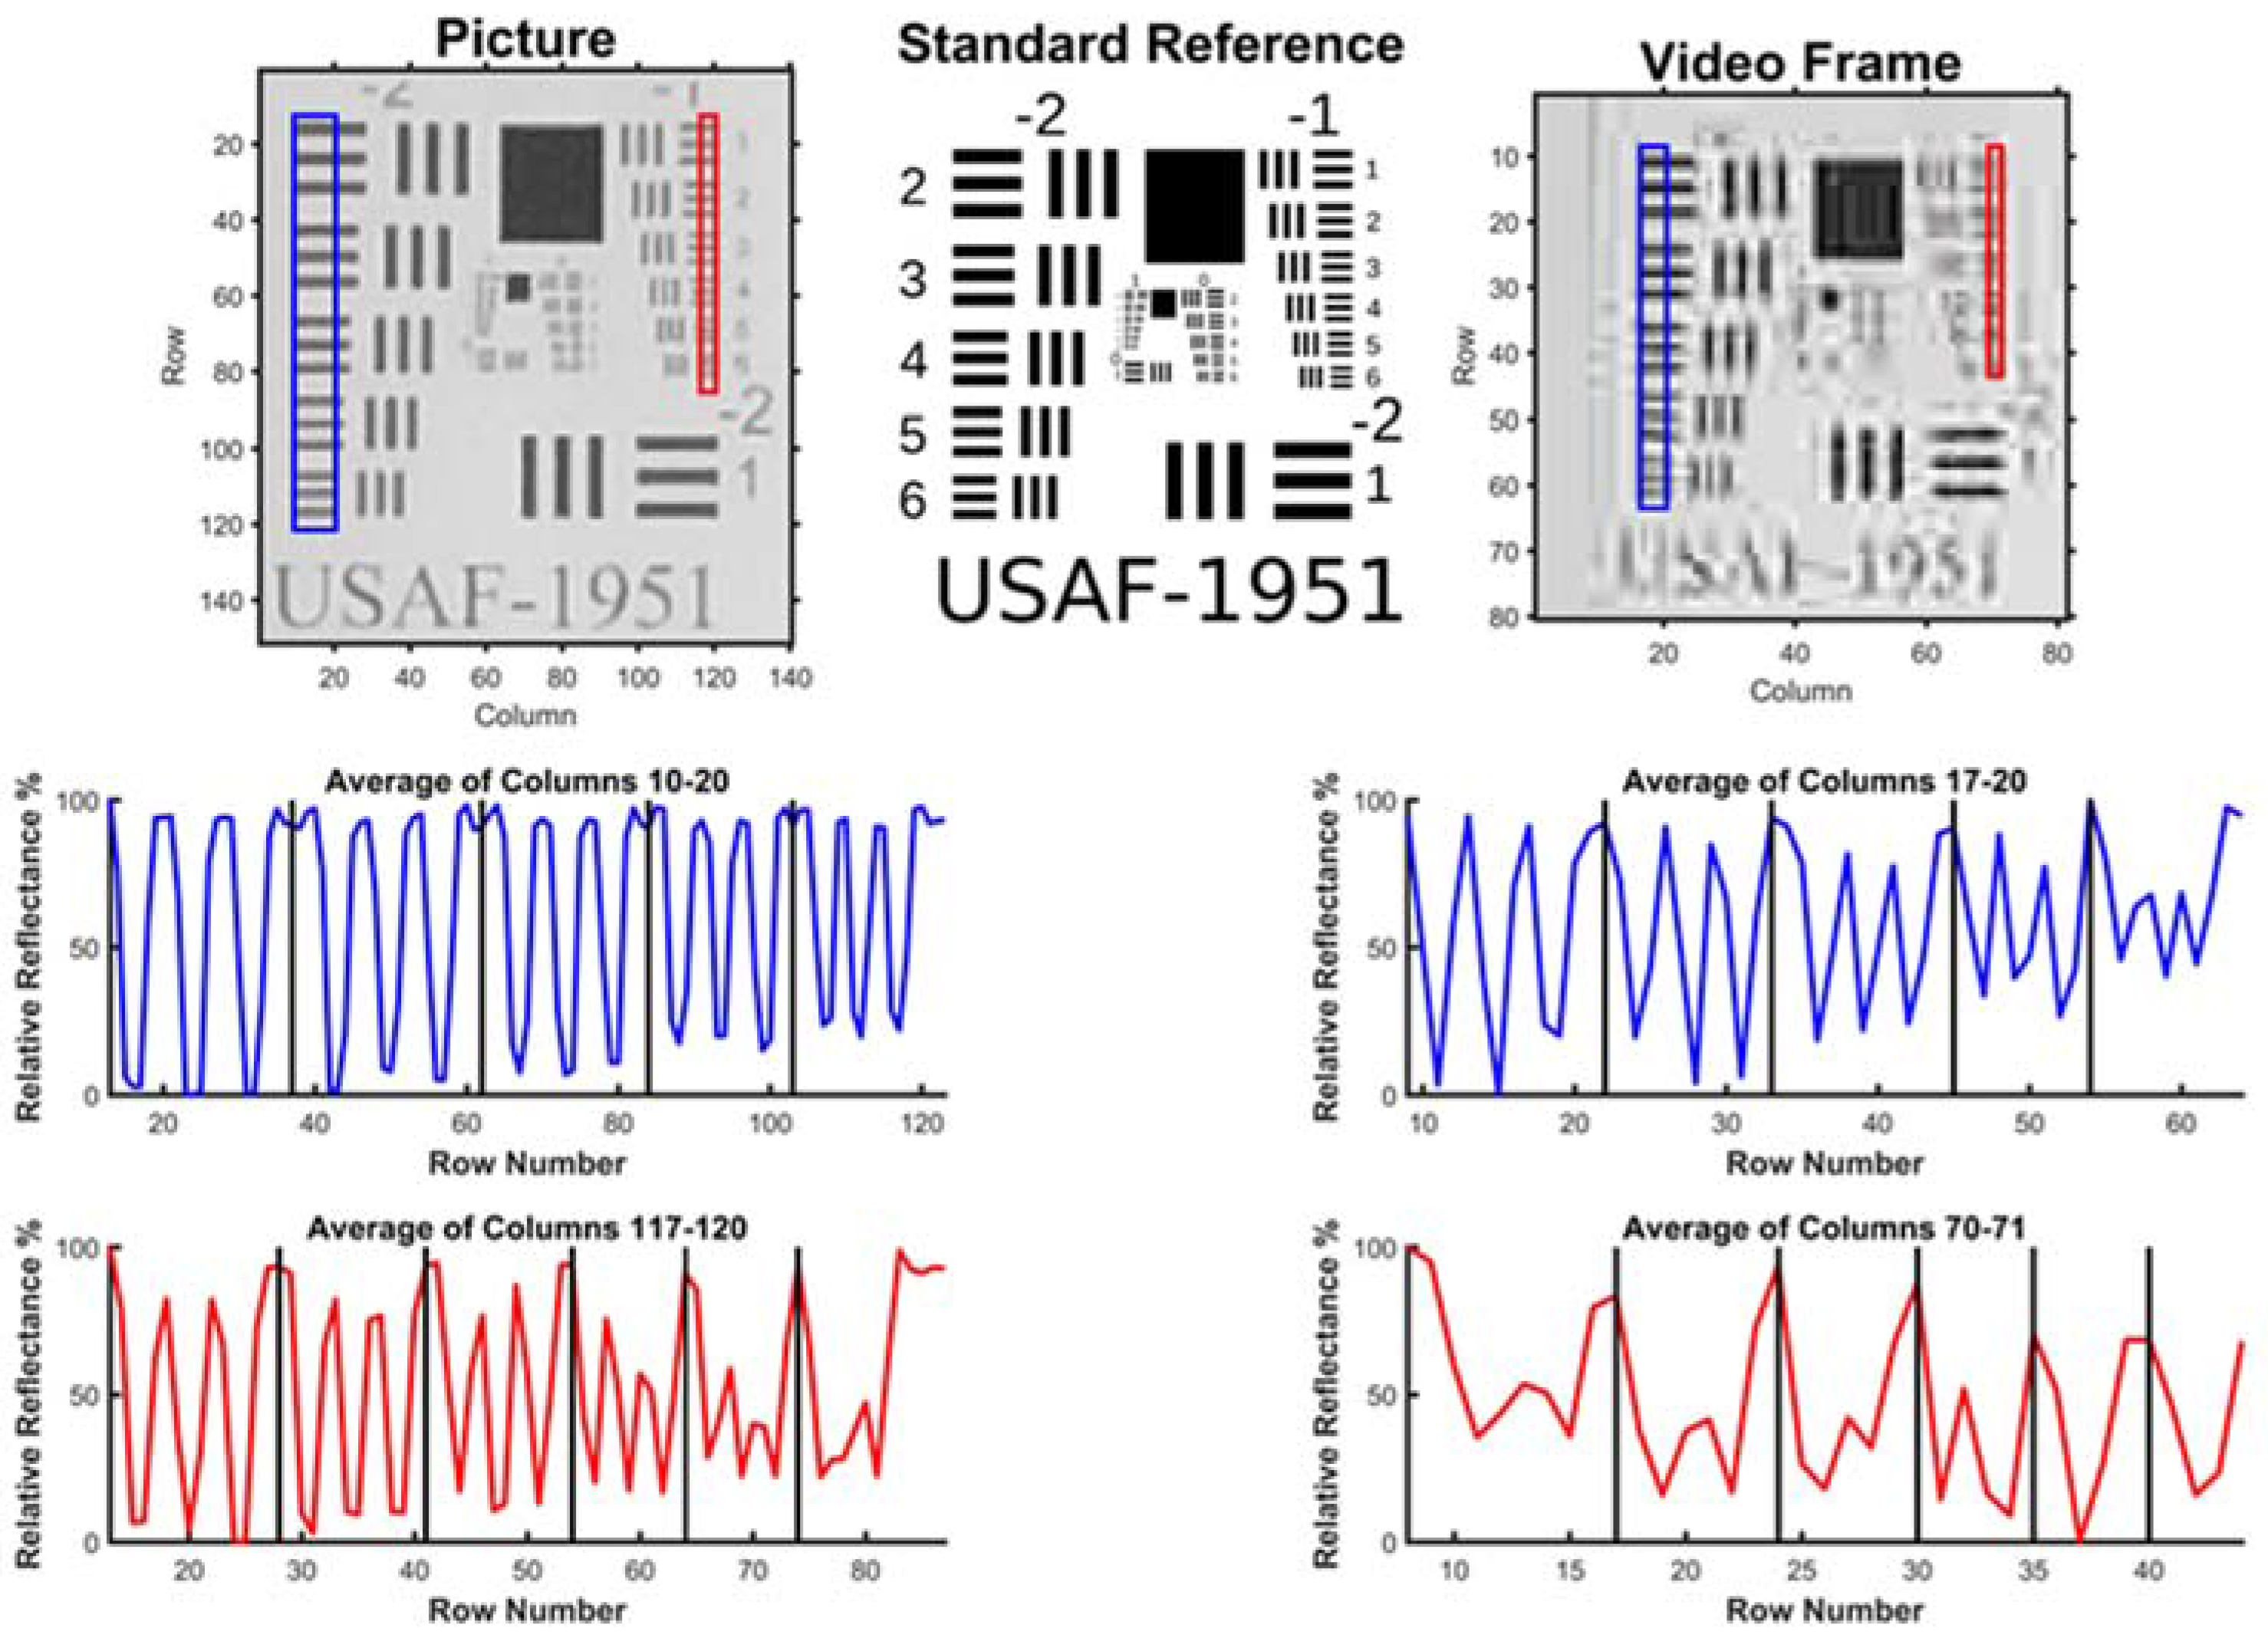
We hypothesized that recording a video and extracting frames would produce better results due to the high sampling frequency (29.97 Hz) of the video as opposed to the interval image collection (0.5 Hz) of the camera. To test the image and video resolution of the camera, the 1951 USAF test pattern was recorded and photographed at a distance of 50 cm from the camera lens. For both video and image collection, the ISO was set to 100 and an exposure bias of 0.0 was achieved. For the camera, this was achieved with a 1/60 s shutter speed. A single frame was extracted from the video using FFMPEG (FFmpeg.org Version 3.3). The images were converted to black and white using MATLAB’s ‘rgb2gray’ function. Pixel columns perpendicular to the line pairs were selected and averaged in the horizontal direction. These values were plotted as relative reflectance. If not all three black lines per element result in troughs, then the group is considered to be unresolved. Also, if the ratio of peak to trough is less than √2, the lines are considered unresolved [25]
2.3. UAS Image Data Collection
Images for a preliminary data (bushes 1–12) set were collected in the horticulture research farm on 23 April 2017, between rainfall under heavy cloud coverage, which provided favorable diffuse lighting, and an unfavorable breeze. A second set (bushes 13–25) was acquired on 29 June 2017 under the same conditions to increase sample size (Figure 1A). Images and video were taken using a DJI Phantom 3 Advanced quadcopter (DJI Inc., Shenzhen, China). The UAS acquired 12 MP images and a 4.1 MP video as it flew routes pre-programmed in Litchi (VC Technology Ltd, London, UK), a remote pilot application. The camera’s sensor is a 1/2.3” CMOS and has a fixed focal length (20 mm) and aperture (f/2.8). The UAS was programmed to fly next to the row of interest at an altitude of 3 m with the camera pointed directly at the row of interest for oblique (~45 degree) images and over the row of interest at an altitude of 4 m for nadir images (Figure 2). The quadcopter captured images/video with the camera pointed perpendicular to the row, as well as at 45 degree angles to the left and right (Figure 3). These three angles for each of the three positions ensured maximum coverage of the bush canopy and crown.
Images recorded by the quadcopter have the system’s GPS coordinates in the picture metadata, which aids in 3D model construction. The data collection flights lasted about 8 min, during which the quadcopter flew at a speed of approximately 0.4 m/s and took roughly 240 photos. Prior to data collection, ground control points with known dimensions and high contrast patterns were placed alongside the bushes to aid in the photo alignment and point cloud scaling.
The commercial production farm utilized a hedgerow growing style. As such, it is not possible to image in between the bushes in a row, so the 45 degree heading changes and angled above row imaging of the bushes was disused (Figure 4). Ground control points were still utilized and 25 m sections of each of the three varieties were imaged. Each flight took approximately 5 min. The same ground control points were used for this data collection.
2.4. Image Data Processing
Images were loaded into Photoscan (Agisoft, Russia) and aligned based on tie points using the highest accuracy setting. The tie points were then culled based on the number of photos they were present in and their projection accuracy. Dense point clouds were then created using the program’s SFM algorithms. The best results were achieved using mild depth filtering and high-density point clouds. After the point clouds were generated, markers were placed in the model and scale bars were set for known lengths between reference points (Figure 5). Bushes and reference objects were cropped from the dense point cloud and exported as .ply files. The bush point clouds were then imported into MATLAB (version 2016b, MathWorks, Natick, MA, USA) for subsequent processing. Data collected at the horticulture research farm were used to extract seven plant morphological traits (height, width in row, width across row, canopy area, bush volume, crown width across row, and crown diameter); data collected at the commercial blueberry farm were used to extract five bush shape traits (base angle, blockiness, percent crown height, crown ratio, vegetative ratio).
2.4.1. Point Cloud Dimension Extraction
Initially, the point cloud is de-noised. The average distance between each point and its five closest neighbors is recorded. The mean and standard deviation of these averages is used to identify and remove outliers. An outlier is defined as any point whose average distance to its five nearest neighbors is more than three standard deviations from the mean of every other point’s average distance to their five nearest neighbors.
The height of the bush was extracted by taking the highest z coordinate of the point cloud as the highest point of the bush. The x and y coordinates of the highest point are recorded. The ‘pcfitplane’ function is used to approximate the ground plane. A more accurate ground plane is generated by applying the ‘pcfitplane’ function using only points within a 10 cm cube centered at the x and y values recorded from the highest point, and the y coordinate determined by the approximate ground plane. The distance between the center of the 10 cm × 10 cm plane and the highest point is the bush height. This measurement method most closely resembles how bush height is measured in the field; from the highest point of the bush to the point on the ground directly below it (Figure 6).
The ground points in the point cloud must be ignored when calculating the extents, volume, and canopy area of the bush. To begin separating the point cloud, it is segmented into 5 mm horizontal slices. The number of points within each horizontal slice is recorded. Starting from the lowest slice, the first slice with a positive gradient after the slice with the maximum number of points is recorded as the bottom of the bush.
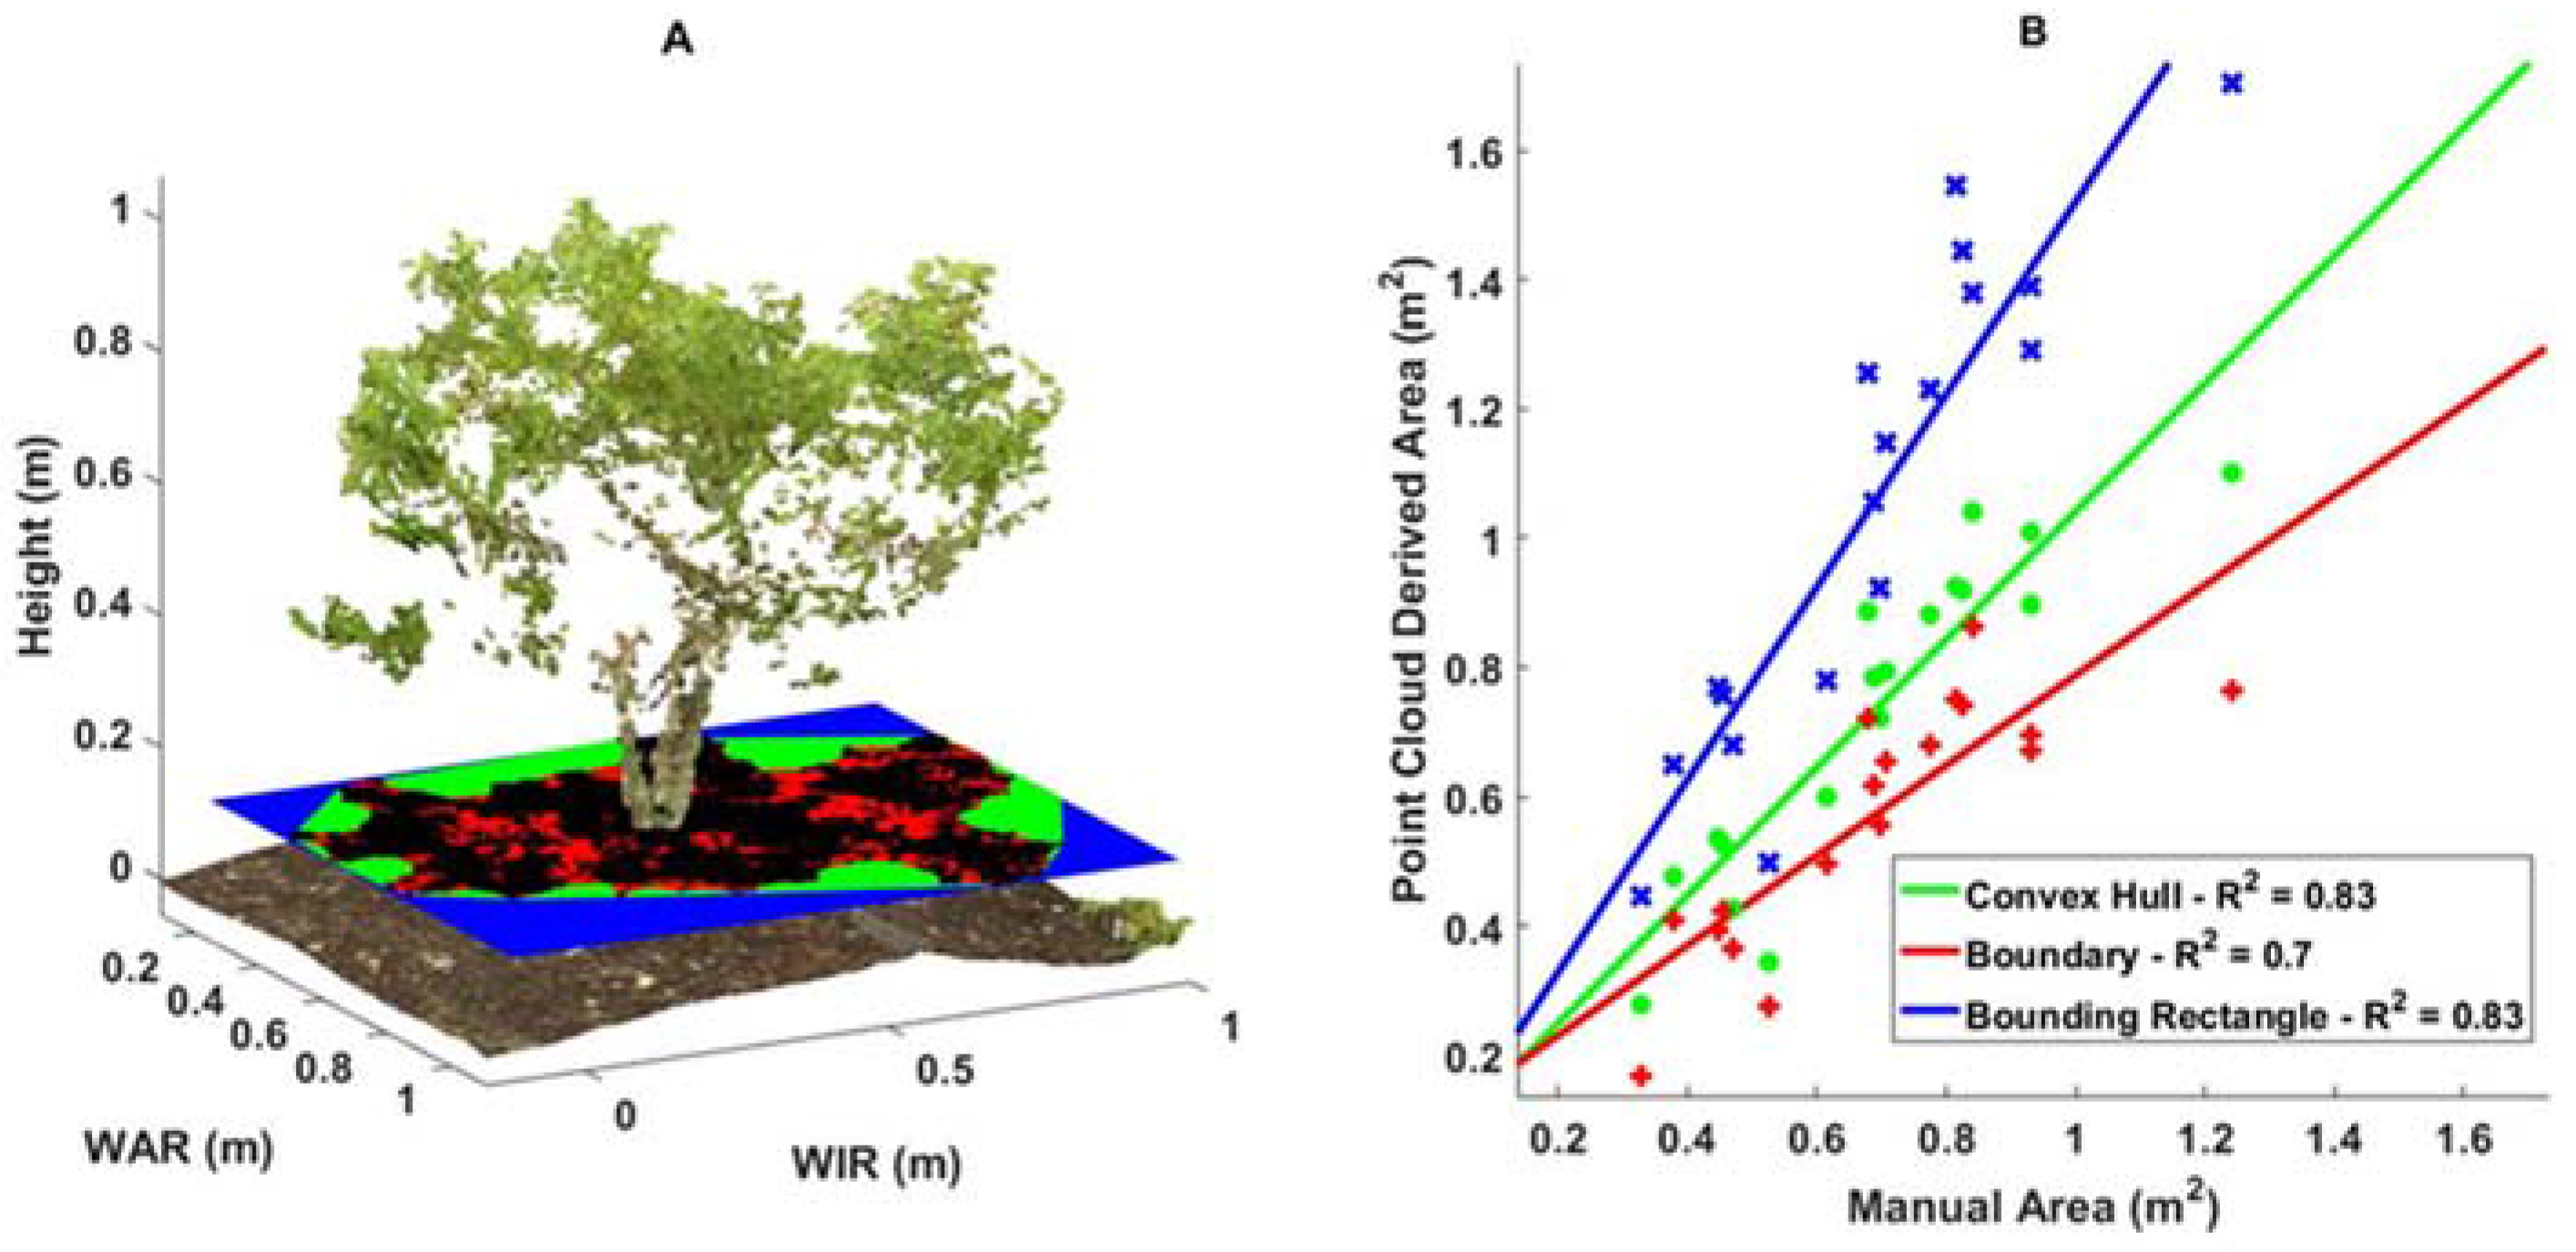
Width in row (WIR) and width across row (WAR) are calculated by calculating the difference of the minimum and maximum coordinates along the respective axis (Figure 6). Canopy area is determined by projecting all bush points into the x-y plane and determining the area of the projected bush. A rectangular area can be determined based on the extents of the bush. The tightest fitting boundary for the points provides a canopy area in addition to a convex hull.
The bush crown is extracted by filtering points based on height and color. Vegetation from both grass and the bush can be removed by filtering out green points. Points below the bottom of the bush and above the desired harvester catch pan height are removed. The remaining points are projected onto a plane. The crown width across row is extracted, since this determines the minimum catch pan width. A circle is fit around the points to determine the crown radius (Figure 6).
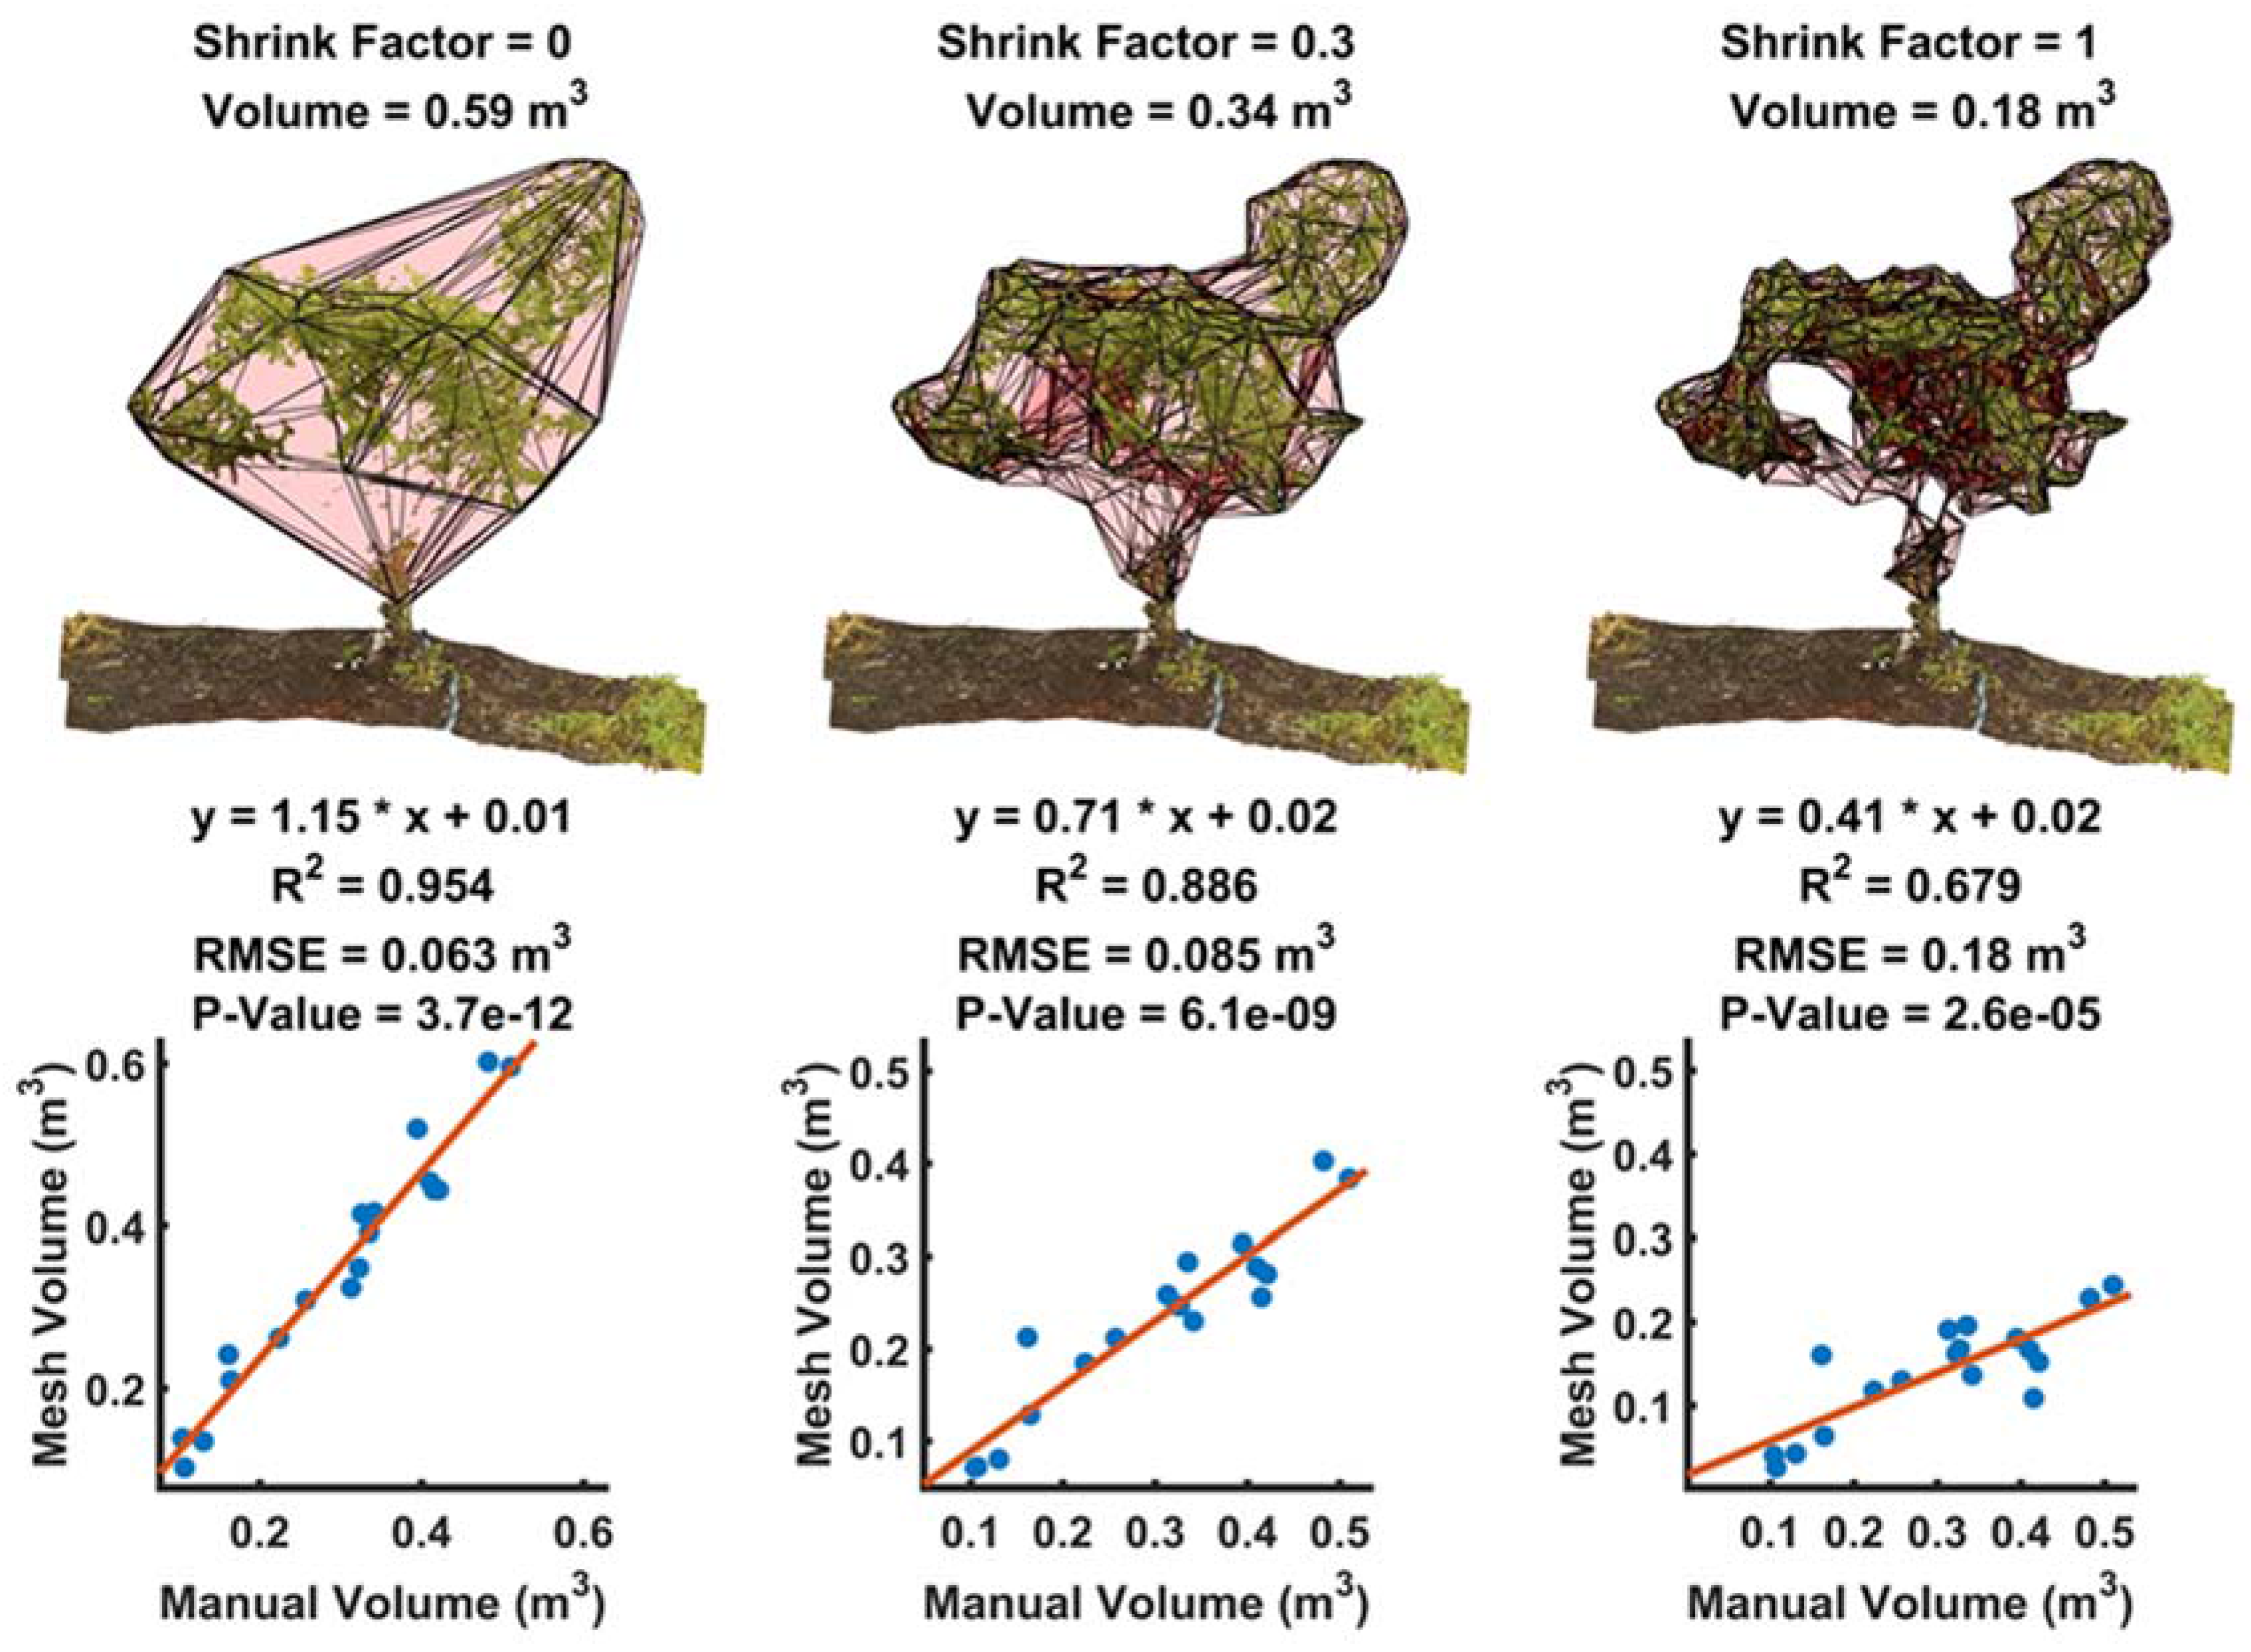
Bush volume was determined by boundary meshes that were formed in MATLAB using the boundary function with a specified shrink factor. Selection of an appropriate shrink factor was performed by observing the meshes generated from a range of factors. A factor of 0.3 was found to remain true to the shape of the bush, and not create cavities within the bush. A shrink factor of 0 creates a convex hull, which best mimics the volume that is measured manually.
2.4.2. Point Cloud Shape Characterization
The bushes grown at the commercial site were grown in hedgerows and needed to be segmented into individual bush point clouds. Bushes were segmented by viewing the bushes along their row and manually dividing the bushes based on the apparent intersection of the canopies. The bush point clouds were then flattened into across row 2D colored scatters and down-sampled to a 1/2 cm grid. The 2D bush scatters were cropped to remove ground points and noise and were assessed for quality. Originally, 45, 40, and 45 bushes of Meadowlark, Farthing, and Star were acquired, respectively. After screening for quality, 34, 33, and 41 subjects remained. A point was selected to separate the crown and body of the bush. This point was approximated based on the lowest green vegetation. The height and width of the body of the bush were extracted. The height and width at 5 cm of the crown were also extracted. Ratios of these heights and widths were extracted as scale invariant features, as defined by Equations (1)–(4).
To characterize the way in which the bush grows away from the crown, an angle was extracted. The vertex of the angle was determined by the midpoint of the bottom of the crown. The other points were determined by the lowest vertical occurrence of the 90th percentile of the horizontal distance from the center of the bush crown on each side of the bush (Figure 7).
2.4.3. Manual Data Collection
On 24 April 2017, manual measurements of the reference objects and first set bushes were recorded in the horticulture research farm. The second set of manual measurements were recorded on 30 June 2017. The bush height recorded was the distance from the highest reaching point on the bush to the ground directly below. The in-row and across-row widths were found by placing boards vertically on either side of the bush, perpendicular to the axis along which the width was being measured, and the distance between boards was measured and recorded. Bush volume was collected by measuring the circumference of bushes at 5 cm intervals in the vertical direction. The circumference measurements of the bush were converted to diameters; under the assumption that bush cross sections are mostly circular. The bushes were then modeled as stacked frustums, from which the volume was determined (Figure 8A). This volume was later compared to the convex hull mesh generated using the boundary function (Figure 8B). The largest area of the bush based on the assumption of circularity served as the bush canopy area. Collecting all manual measurements for a bush took up to 8 min (depending on bush size) with the cooperative effort of three people.
2.5. Statistical Analysis
An analysis of image derived and manual measurements of plant dimensions was performed using linear regression. The errors, coefficient of determination, and statistical power of each correlation were examined. ANOVA tests were performed on the ratios of each possible pairing of the bush widths at 5% height intervals. The strongest ratio of widths would later be used to characterize the bush blockiness. An analysis of each shape feature was performed via ANOVA tests of each of the three variety pairings to determine the probability of each pair sharing a mean value. Finally, MANOVA analysis was performed to observe the dimensionality of multivariate features, and to determine whether the three varieties at the commercial cultivation site could be differentiated. All statistical analysis was performed in MATLAB.
3. Results
3.1. Camera and Flight Parameters
The finest resolution resolved by the regular image was group -1 element 5, or 0.794 line pairs/mm. The frame extracted from the video could only resolve 0.445 line pairs/mm, group -2 element 6. The MPEG video data is compressed during recording using block based temporal interpolation between frames and spatial redundancy reduction techniques [26]. The compression and reduced frame size of the video demonstrate the superior image quality from the camera setting (Figure 9).
The horizontal and vertical viewing angles were found to be approximately 82.5 and 66.5 degrees, respectively. The true flight height for the wind disturbance and altitude accuracy tests was calculated from the reference targets. The mean altitude of the alleged 5 m flights was 4.5 m with a standard deviation of 0.29 m and a range of 0.80 m.
Gusts of 4.29 m/s were recorded at the time of bush imaging, so the lowest flight height was then decided to be 4 m (Figure 10). The speed of data collection was mostly limited by camera resolution and the 2 s image capture interval. The image capture interval, height, and viewing angle of the camera all influence the maximum speed to maintain image overlap. The recommended overlap between images for structure from motion algorithms is at least 70%. Higher flight heights provide larger ground coverage and therefore allow for a faster flight speed to maintain a given percentage of image overlap. The flight controls software has a limited resolution for the control of flight speed, and ultimately a speed of approximately 0.4 m/s was used. The aircraft thrust disturbance will always influence the lowest flight height available, but flying to the side of the row of interest greatly reduces this impact. The canopy measurement methods used in this study did not take full advantage of the high resolution point clouds. Similar results may have been achievable with fewer photos taken at a higher elevation which would provide more coverage in less time. The crown measurements, however, require as much detail as possible.
It is likely that future generations of consumer drones will have a higher resolution and sharpness, and shorter minimum intervals for image capture. These improvements will result in higher resolution point clouds or substantial improvements in throughput for this process.
3.2. Bush and Refernce Object Extents
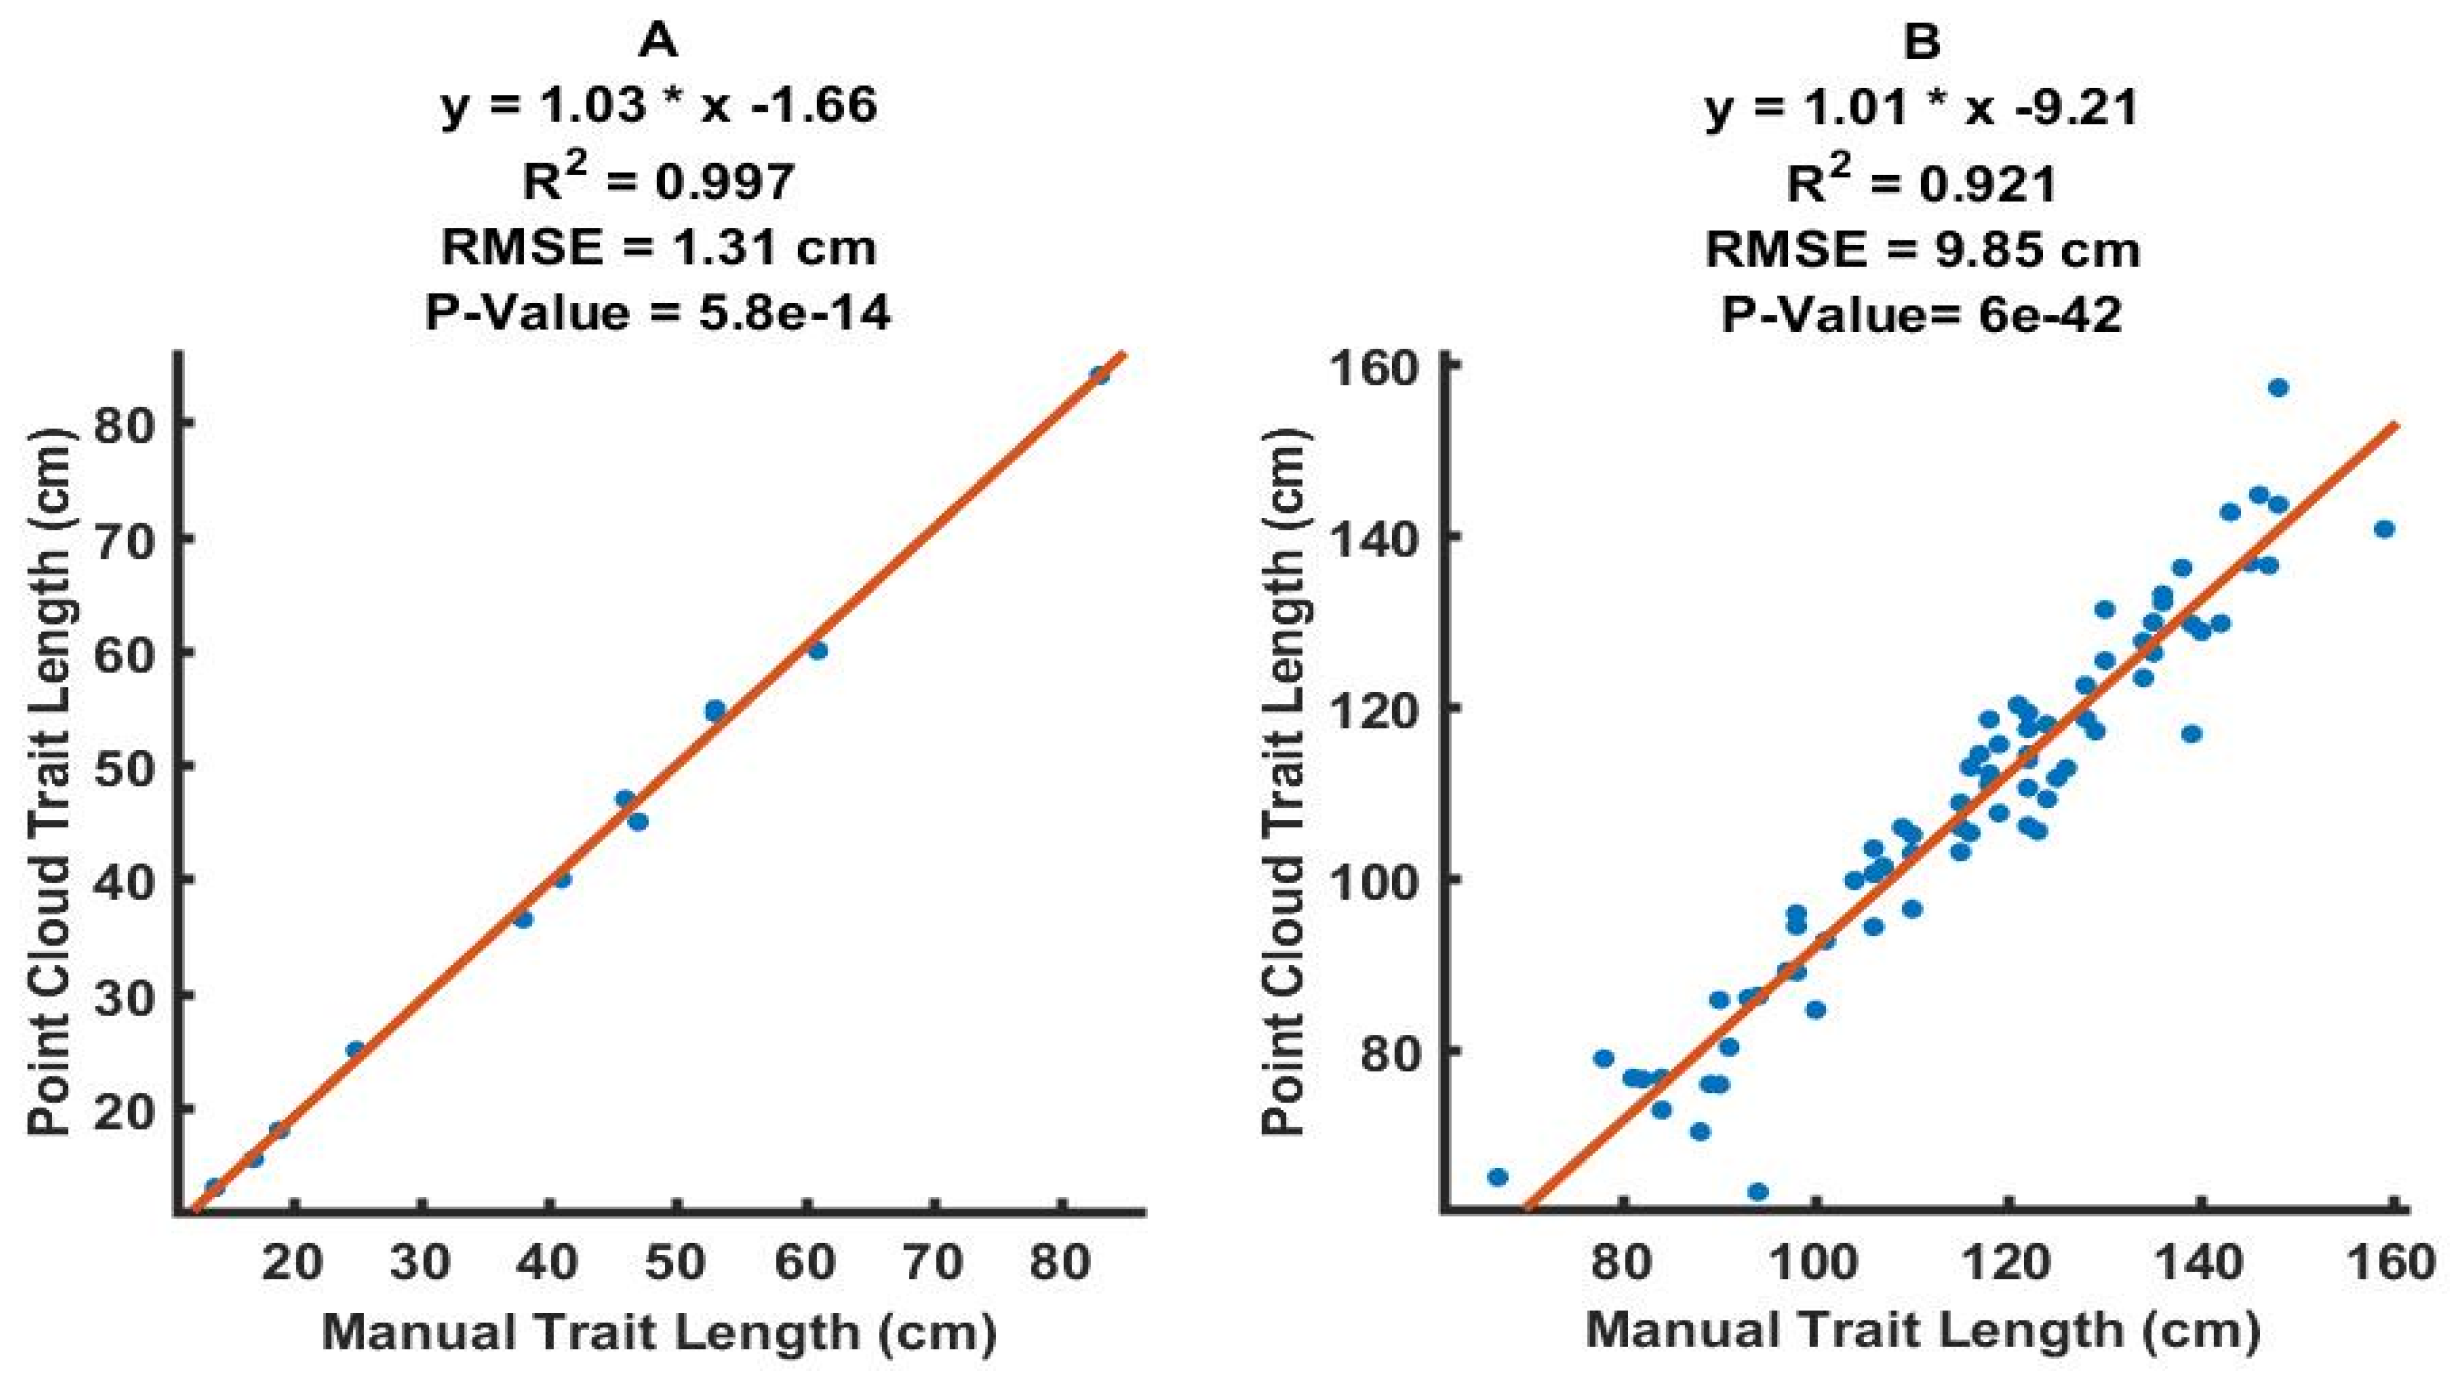
The point cloud derived extents of the reference objects (standard-shaped boxes and balls) had an RMSE of 1.31 cm. The bush extents showed a strong correlation (R2 = 0.921) (Figure 11). The RMSE between measurements of the bush extents was found to be 9.85 cm. The linear regressions show a systematic error of underestimation via an offset of −9.21 cm. When corrected for, the resulting RMSE is 5.82 cm. The extents of bushes are difficult to define for manual measurement. Bushes can seem to have multiple peaks of the same maximum height, but these maximums have varying distances to the sloped beds below.
3.3. Canopy Area
The best correlation between the point cloud derived area and manual area was calculated with the convex hull. The convex hull closely resembles the shape that was measured manually. The bounding rectangle would be the most useful result to examine when considering inter-plant or inter-row length. The boundary most accurately describes the area as seen from above (Figure 12). The trend of underestimation is not seen in the area correlations because the two dimensional measure is less sensitive to moving branches.
3.4. Bush Volume
Traditionally, breeders have simply measured the boundary box of a plant and averaged the length of its dimensions as an index of growth. This is a heavily simplified attempt at measuring the volume of the bush, which cannot be manually measured in a practical fashion. Our manual and point cloud derived bounding mesh volume measurements were strongly correlated. The accuracy of the point cloud derived values depends on the shrink factor used.
A shrink factor of 0 achieved the highest R2 and lowest RMSE value when correlated with the manual measurements and only slightly overestimated the volume. The shrink factor of 0 creates a convex hull which most closely replicates the way in which the bushes were manually measured. As the shrink factor increases, the mesh more closely conforms to the bush point cloud which causes a reduction in volume and a volume underestimation in relation to the manually determined volume. The shrink factor of 0.3 may provide a better idea of the true volume of the bushes, but has a worse correlation and RMSE because the manually measured volume to which it is referenced does not conform to the concavity of the bush (Figure 13). It is possible that the higher shrink factors produce a better correlation with yield and biomass, which should be further investigated if biomass is the major trait of interest.
3.5. Crown Measurements
Due to the unusual bush growth resulting from the late frost and lack of pruning, some bushes had branches that occluded the crown, and could not be accurately measured by the algorithms used. The crowns are more difficult to digitally reconstruct than the canopy due to occlusion from the canopy and the crowding of canes (Figure 14). Even so, there is a moderate correlation between the manual and point cloud derived measurements (Figure 15). The crown diameters are well correlated enough to distinguish which bushes have smaller crowns and which may require pruning.
3.6. Growth Indices
Both multiplicative (Equation (5)) and additive (Equation (6)) growth indices correlated strongly across manual and point cloud methods (Figure 16). The strong correlation between the growth indices and the point cloud derived volumes suggests that the former could be replaced by the latter. The growth indices do not provide compensation for irregular bushes with protruding branches. The point cloud volume better represents the volume of vegetation that is intercepting light—which will be used for further vegetative growth or fruit production.
3.7. Bush Shape by Genotype
The ratio of the 85th percentile over the 65th percentile provided the best ANOVA p-value for differentiating the three genotypes and was thus defined as the blockiness ratio. The ratio of width at these heights is meant to characterize the tapering at the top. The bush rows are parallel to the solar path, so the side closer to the equator grows more. This lopsided growth leads to a tapered bush top. The Farthing bushes did not demonstrate this asymmetry as their tops had been trimmed. The height and width of the crown and body of the bush were used to calculate other ratios to characterize the bush shape.
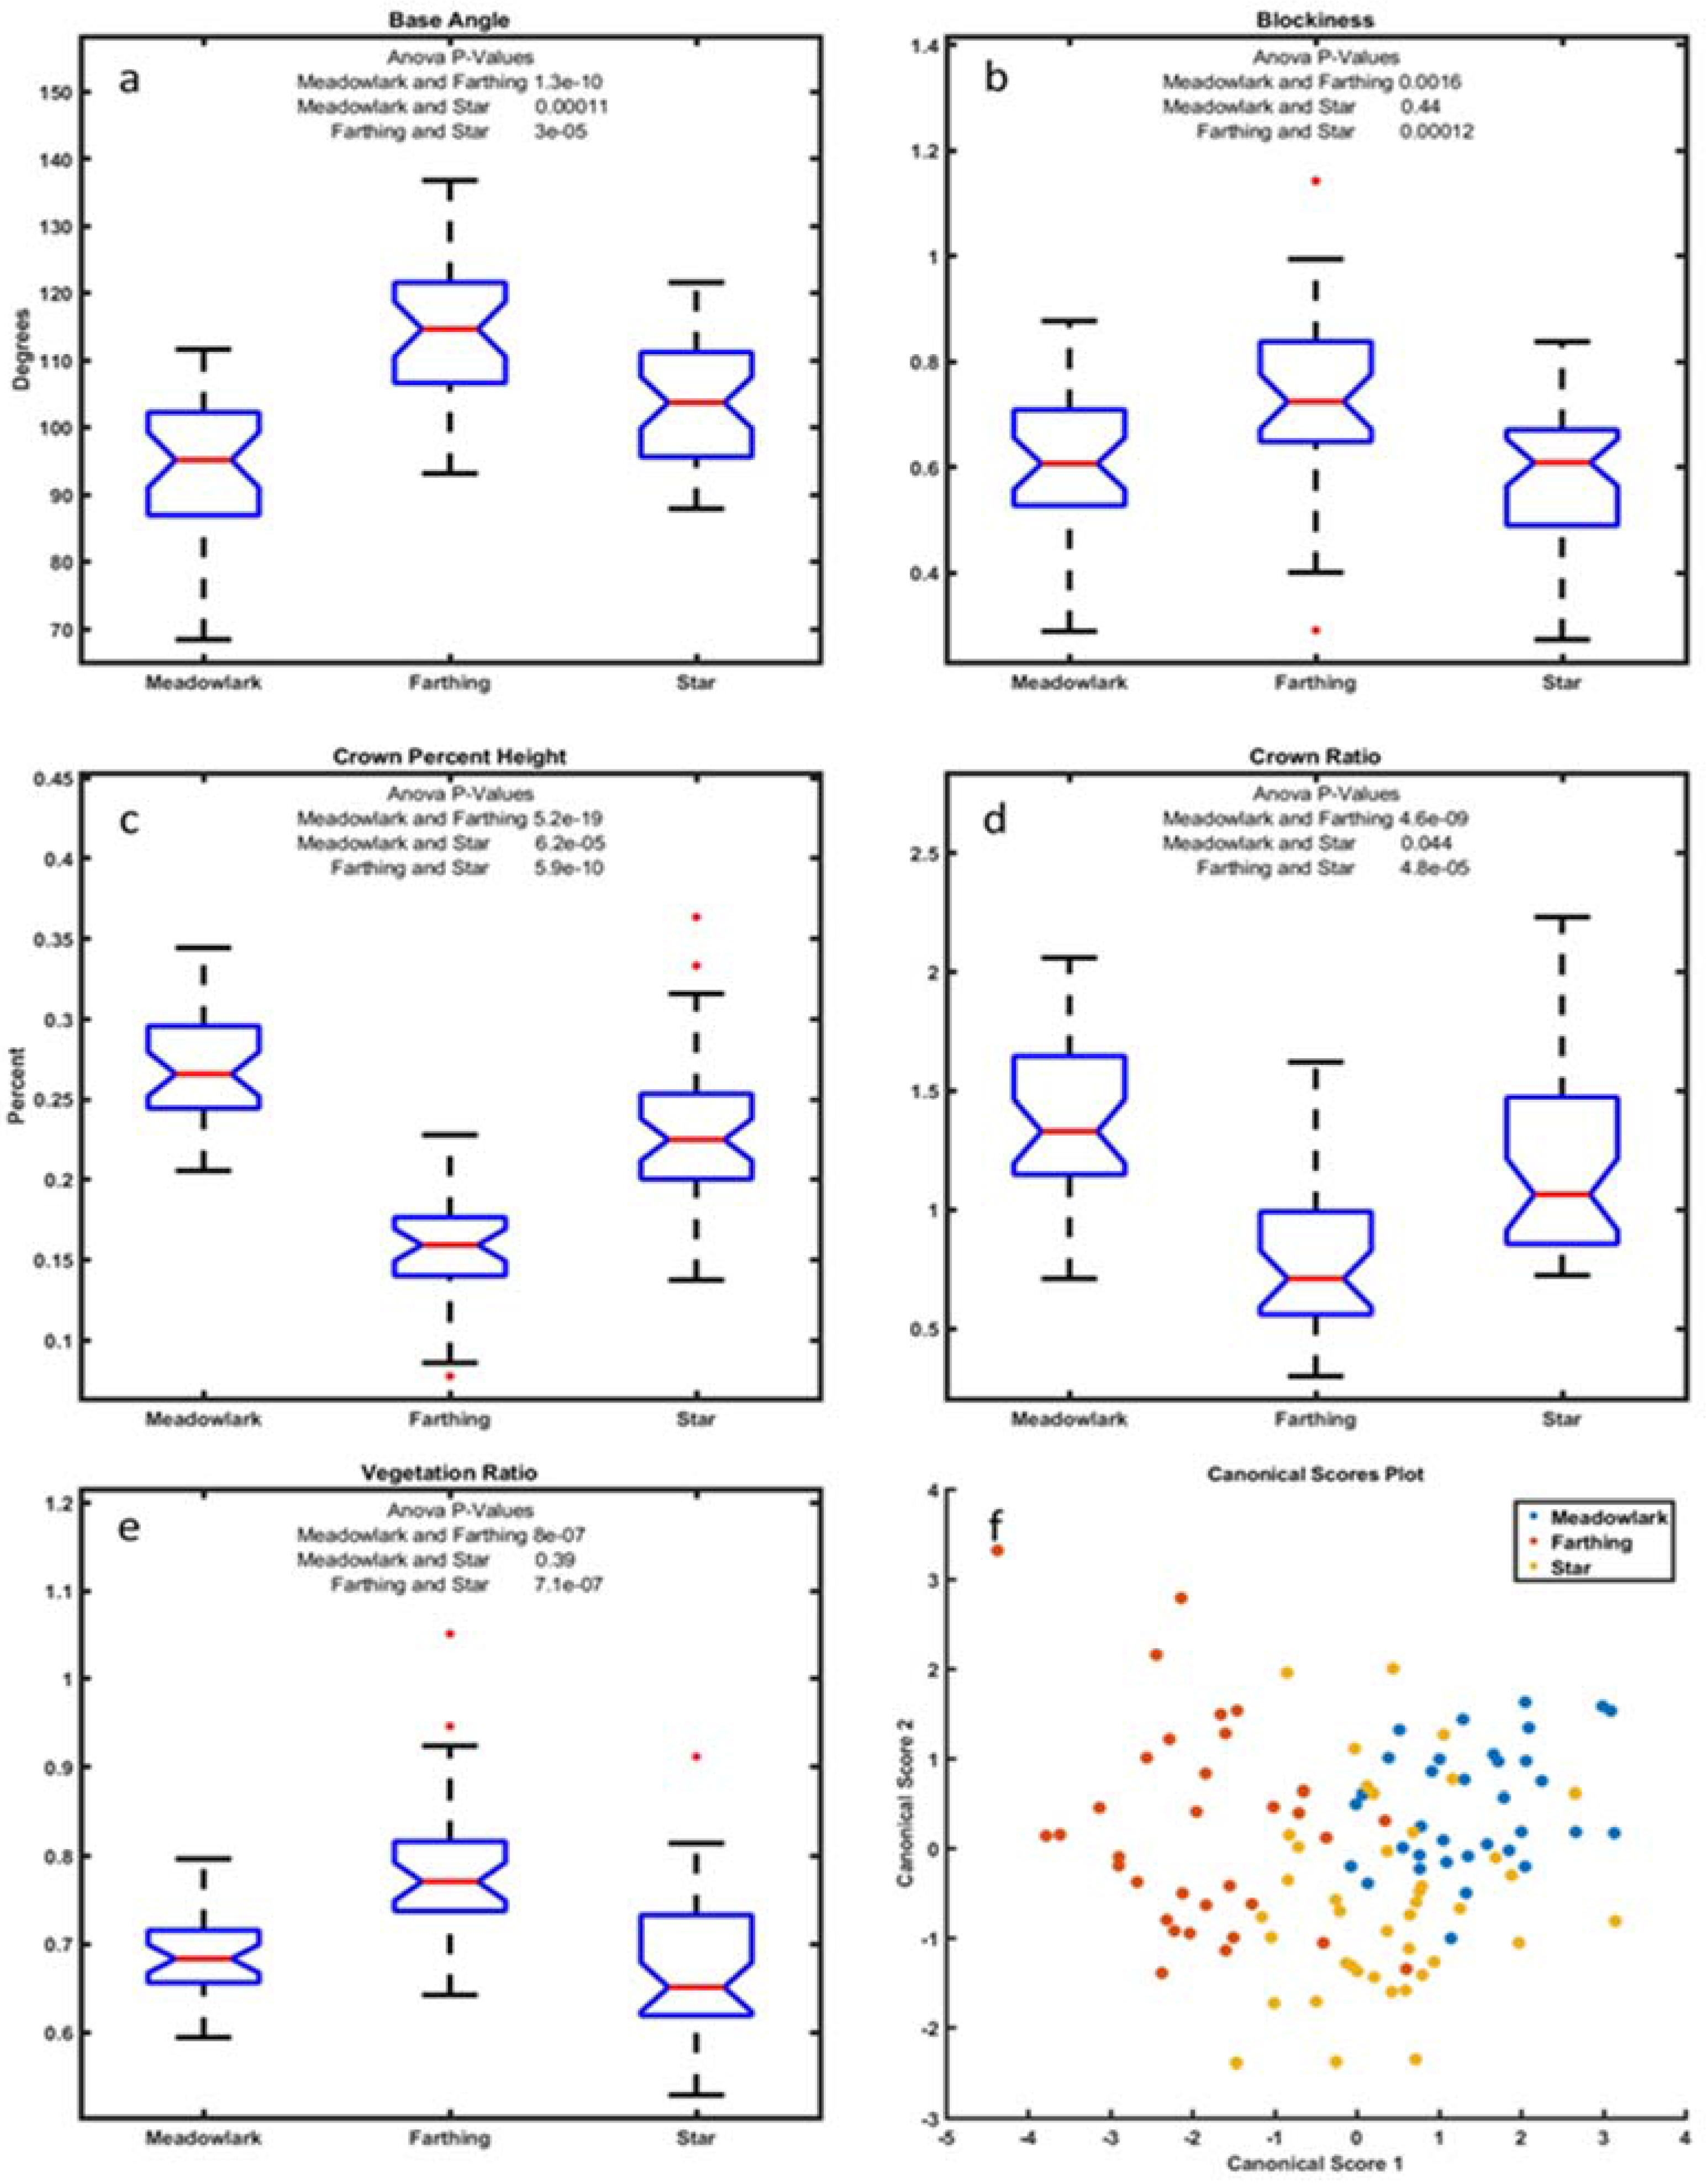
The Farthing bushes are the most distinguishable of the three varieties processed. In this study, Farthing have a square-like bush body shape, wide base angle, and short wide crowns (Figure 17). The Meadowlark and Star are more difficult to differentiate from each other, but the Meadowlark have slightly taller crowns and narrower base angles (Figure 18).
The MANOVA results provided p-values of 3.4 × 10⁻²² and 5.9 × 10⁻⁴ for the first and second dimensionality of the data, indicating that the three groups were significantly different (Figure 18). The first dimension of the canonical score serves to separate the Farthing from the Star and Meadowlark. The second dimension provides more separation between the Meadowlark and Star varieties.
The ideal bush should be “vase shaped”, which means that it has a tall and narrow crown allowing the catch pan to come in tight to minimize ground loss. An ideal vase shaped bush will have a large divergence or “base angle” from this small base to a wide vegetative body for maximum fruit production. Vase shaped bushes have less tapered tops meaning a larger blockiness ratio. This means excess fruit production is not occurring over the middle of the bush where it is likely to fall through the center and become lost to the ground. An ideal bush will have a high crown ratio which indicates the crown is narrow and tall, allowing the machine harvester catch plates to leave a smaller gap for crown loss and some flexibility in their height.
With these priorities, the Meadowlark is the most ideal of the varieties studied due to its large crown ratio, and low vegetative ratio. The Farthing showed a more favorable blockiness ratio and base angle, but its crown ratio was very low, which will lead to difficulties in bringing in the catch plates far enough to catch the fruit.
4. Discussion
This study investigated the feasibility of using a low altitude UAS to acquire oblique imagery of blueberry bushes to extract morphological traits and shape characteristics for machine harvestibility. A 3D point cloud data processing pipeline was developed. Our results revealed that the morphological traits derived from the aerial images were very close to manually measured traits, such as bush extents (height and width), canopy area, and volume. Our method could replace manual measurements in the field to achieve significant labor saving. Using the dimension study as an example, setting up reference targets took a few minutes and image data collection took about 40 s per bush with our scanning flight path, whereas the same data could be collected manually at around 400 s per bush and still required substantial calculation to process the measurements into volume and growth index values. If the bushes of interest are grown in adjacent rows, a higher throughput would be achievable and scaling dataset point clouds takes the same time regardless of sample size.
In addition, the UAS imagery derived traits can provide new characteristics that are currently impractical or impossible for manual measurements, such as bush volume and some shape characteristics. For example, blueberry breeders can only rely on subjective visual scoring to evaluate bush architecture, which is not reliable and repeatable. In addition to machine harvestability, blueberry bush morphological data could also be useful for crop management. For instance, plant size and growth rate can be indicative of vigor and yield potential [27,28]. A plant’s size and shape will also influence the optimal layout for commercial cultivation [29], and blueberry in row spacing has been shown to correlate with yield [30]. Plant shape will also impact light interception and therefore fruit color [31] and quality [32]. Tree architecture has also been observed to correlate with differences in pest and pathogen incidence [29,33]. In future studies, we expect to observe stronger relationships between point cloud derived volume and yield as opposed to manually measured growth indices. Therefore, the oblique UAS imaging technique and the data processing pipeline developed from this study can replace the manual measurement of blueberry bush morphological traits with the benefits of high throughput, labor saving, and repeatability for plant breeding programs and precision agriculture applications.
There are several studies that generated 3D models of plants for the purpose of extracting morphological parameters without the use of aerial imagery. These methods take several minutes per sample and can generate models with extreme detail. For example, one study constructed cotton plant models using 64 high-resolution images per subject. Stem length, leaf number, leaf area, and petiole length were extracted with considerable accuracy [34]. Another study utilized a high precision laser scanner to generate a point cloud of barley plant with sub-millimeter accuracy, from which stem height and leaf area were extracted with a high accuracy [35]. These methods are mostly performed indoor in a controlled environment and require several minutes per plant, which is not practical for field applications. Compared to the LiDAR-based system (either terrestrial or airborne), low altitude imaging by UAS not only offers a high throughput and low cost means of collecting morphological data, but also provides color information which aids in differentiating the canes of the bush crown from grass or other vegetation.
There are a few limitations of this study. The structure-from-motion algorithm requires that the object remains still during image acquisition, but the presence or absence of a breeze during data collection can contribute to errors in point cloud generation. A trend of underestimation can be seen in bush height and extents estimation compared to manual measurement, which is attributed to the plants extremities being smaller than the camera’s resolution. More importantly, the most extreme points are subject to larger movement due to wind, and removed from the point cloud by Photoscan’s depth filtering. Crown size derived from imagery only achieved a moderate correlation with manual measurement, mainly due to the occlusion of the crown by bush canopy. It is likely that a better accuracy in crown size will be obtained during winter when bushes are defoliated.
Although the statistical tests showed the effectiveness of the UAS imagery methods, the number of blueberry bushes and genotypes tested in this study is relatively small. More bushes and genotypes with distinctive shape characteristics need to be assessed on a larger scale to prove the effectiveness of the methods in real breeding programs and production scenarios. In addition to the morphological traits investigated in this study, other phenotypic traits that may affect machine harvestability such as fruit cluster tightness will be explored in future studies.
5. Conclusions
This study confirms the viability of using consumer grade unmanned aerial imagery and structure from motion algorithms to generate 3D models of bushes from which morphological traits can be extracted. Point clouds generated from images had comparable dimensions to those manually measured in the field. Georeferenced images (not video) taken from a low altitude and various angles provided adequate data to characterize bushes reliably. Moderate correlation was achieved between ground truth and image-derived crown sizes which could inform breeder decisions on machine harvestability. A strong relationship between traditional growth indices and image-derived bush volume was demonstrated, and it opened the door to a more precise way of characterizing bush size. Bush architecture differences between three blueberry varieties grown in a commercial setting were quantified and assessed by five shape-related traits. Application of the high throughput phenotyping technology to larger study sites will accelerate the breeding of bushes that are easily and efficiently harvested by machines. Furthermore, the findings of this study lead us to believe that this technology would allow for the convenient surveillance of bushes to observe shape trends and could therefore provide guidance in decisions regarding pruning.
Acknowledgments
Financial support was provided by the USDA’s National Institute of Food and Agriculture (Award No. 2014-51181-22383) with no further involvement. We thank the University of Georgia’s Anish Malladi and Harald Scherm for their insight and guidance, in addition to Ryan McNeil for his management of the horticulture farm. We would like to thank Renee and Johnny Allen for their aid in locating and providing a commercial cultivation site for this study.
Author Contributions
Changying Li and Aaron Patrick conceived the idea; Aaron Patrick and Changying Li designed the experiment; Aaron Patrick performed field data collection; Aaron Patrick analyzed the data; Aaron Patrick and Changying Li wrote the manuscript.
Conflicts of Interest
The authors declare no conflict of interest. The founding sponsors had no role in the design of the study; in the collection, analyses, or interpretation of data; in the writing of the manuscript, and in the decision to publish the results.
References
- Brown-Paul, C. Blueberry boom. Pract. Hydroponics Greenh. 2017, 26–33. [Google Scholar]
- Takeda, F.; Krewer, G.; Li, C.; MacLean, D.; Olmstead, J.W. Techniques for increasing machine harvest efficiency in highbush blueberry. HortTechnology 2013, 23, 430–436. [Google Scholar]
- Rohrbach, R.; Mainland, C. Crown Restriction in Blueberries Reduce Harvesting Ground Losses. In Proceedings of the IV International Symposium on Vaccinium Culture 241, Madison, WI, USA, 13–17 August 1988; pp. 366–372. [Google Scholar]
- Hancock, J.F. Temperate Fruit Crop Breeding: Germplasm to Genomics; Springer: Dordrecht, The Netherlands, 2008. [Google Scholar]
- Yu, P.; Li, C.; Takeda, F.; Krewer, G.; Rains, G.; Hamrita, T. Quantitative evaluation of a rotary blueberry mechanical harvester using a miniature instrumented sphere. Comput. Electron. Agric. 2012, 88, 25–31. [Google Scholar] [CrossRef]
- Prunet, N.; Meyerowitz, E.M. Genetics and plant development. C. R. Biol. 2016, 339, 240–246. [Google Scholar] [CrossRef] [PubMed]
- Hartl, D.L.; Clark, A.G. Principles of Population Genetics; Sinauer Associates: Sunderland, MA, USA, 1997; Volume 116. [Google Scholar]
- Van der Knaap, E.; Tanksley, S. The making of a bell pepper-shaped tomato fruit: Identification of loci controlling fruit morphology in yellow stuffer tomato. TAG Theor. Appl. Genet. 2003, 107, 139–147. [Google Scholar] [CrossRef] [PubMed]
- Brewer, M.T.; Lang, L.; Fujimura, K.; Dujmovic, N.; Gray, S.; van der Knaap, E. Development of a controlled vocabulary and software application to analyze fruit shape variation in tomato and other plant species. Plant Physiol. 2006, 141, 15–25. [Google Scholar] [CrossRef] [PubMed]
- Gonzalo, M.J.; Brewer, M.T.; Anderson, C.; Sullivan, D.; Gray, S.; van der Knaap, E. Tomato fruit shape analysis using morphometric and morphology attributes implemented in tomato analyzer software program. J. Am. Soc. Horticult. Sci. 2009, 134, 77–87. [Google Scholar]
- Williamson, J.G.; NeSmith, D.S. Evaluation of flower bud removal treatments on growth of young blueberry plants. Hortscience 2007, 42, 571–573. [Google Scholar]
- Tertuliano, M.; Krewer, G.; Smith, J.; Plattner, K.; Clark, J.; Jacobs, J.; Andrews, E.; Stanaland, D.; Andersen, P.; Liburd, O. Growing organic rabbiteye blueberries in georgia, USA: Results of two multi-year field studies. Int. J. Fruit Sci. 2012, 12, 205–215. [Google Scholar] [CrossRef]
- Hancock, J. Highbush blueberry breeding. Latv. J. Agronom./Agronom. Vestis 2009, 12, 35–38. [Google Scholar]
- Shi, Y.; Thomasson, J.A.; Murray, S.C.; Pugh, N.A.; Rooney, W.L.; Shafian, S.; Rajan, N.; Rouze, G.; Morgan, C.L.; Neely, H.L. Unmanned aerial vehicles for high-throughput phenotyping and agronomic research. PLoS ONE 2016, 11, e0159781. [Google Scholar] [CrossRef] [PubMed]
- Chu, T.; Chen, R.; Landivar, J.A.; Maeda, M.M.; Yang, C.; Starek, M.J. Cotton growth modeling and assessment using unmanned aircraft system visual-band imagery. J. Appl. Remote Sens. 2016, 10, 036018. [Google Scholar] [CrossRef]
- Holman, F.H.; Riche, A.B.; Michalski, A.; Castle, M.; Wooster, M.J.; Hawkesford, M.J. High throughput field phenotyping of wheat plant height and growth rate in field plot trials using uav based remote sensing. Remote Sens. 2016, 8, 1031. [Google Scholar] [CrossRef]
- Bendig, J.; Willkomm, M.; Tilly, N.; Gnyp, M.; Bennertz, S.; Qiang, C.; Miao, Y.; Lenz-Wiedemann, V.; Bareth, G. Very high resolution crop surface models (csms) from uav-based stereo images for rice growth monitoring in northeast china. Int. Arch. Photogramm. Remote Sens. Spat. Inf. Sci. 2013, 40, 45–50. [Google Scholar] [CrossRef]
- Zarco-Tejada, P.J.; Diaz-Varela, R.; Angileri, V.; Loudjani, P. Tree height quantification using very high resolution imagery acquired from an unmanned aerial vehicle (uav) and automatic 3D photo-reconstruction methods. Eur. J. Agron. 2014, 55, 89–99. [Google Scholar] [CrossRef]
- Díaz-Varela, R.A.; de la Rosa, R.; León, L.; Zarco-Tejada, P.J. High-resolution airborne uav imagery to assess olive tree crown parameters using 3D photo reconstruction: Application in breeding trials. Remote Sens. 2015, 7, 4213–4232. [Google Scholar] [CrossRef]
- Weiss, M.; Baret, F. Using 3D point clouds derived from uav rgb imagery to describe vineyard 3D macro-structure. Remote Sens. 2017, 9, 111. [Google Scholar] [CrossRef]
- Polo, J.R.R.; Sanz, R.; Llorens, J.; Arnó, J.; Escolà, A.; Ribes-Dasi, M.; Masip, J.; Camp, F.; Gràcia, F.; Solanelles, F. A tractor-mounted scanning lidar for the non-destructive measurement of vegetative volume and surface area of tree-row plantations: A comparison with conventional destructive measurements. Biosyst. Eng. 2009, 102, 128–134. [Google Scholar] [CrossRef] [Green Version]
- Moorthy, I.; Miller, J.R.; Berni, J.A.J.; Zarco-Tejada, P.; Hu, B.; Chen, J. Field characterization of olive (Olea europaea L.) tree crown architecture using terrestrial laser scanning data. Agric. For. Meteorol. 2011, 151, 204–214. [Google Scholar] [CrossRef]
- Fritz, A.; Kattenborn, T.; Koch, B. Uav-based photogrammetric point clouds—Tree stem mapping in open stands in comparison to terrestrial laser scanner point clouds. Int. Arch. Photogramm. Remote Sens. Spat. Inf. Sci. 2013, 40, 141–146. [Google Scholar] [CrossRef]
- Miller, J.; Morgenroth, J.; Gomez, C. 3D modelling of individual trees using a handheld camera: Accuracy of height, diameter and volume estimates. Urban For. Urban Green. 2015, 14, 932–940. [Google Scholar] [CrossRef]
- Gebhart, S.C.; Thompson, R.C.; Mahadevan-Jansen, A. Liquid-crystal tunable filter spectral imaging for brain tumor demarcation. Appl. Opt. 2007, 46, 1896–1910. [Google Scholar] [CrossRef] [PubMed]
- Sullivan, G.J.; Baker, R.L. Motion Compensation for Video Compression Using Control Grid Interpolation. In Proceedings of the 1991 International Conference on Acoustics, Speech, and Signal Processing, 1991 ICASSP-91, Toronto, ON, Canada, 14–17 April 1991; pp. 2713–2716. [Google Scholar]
- Moncada, P.; Martinez, C.; Borrero, J.; Châtel, M.; Gauch, H., Jr.; Guimaraes, E.; Tohme, J.; McCouch, S.R. Quantitative trait loci for yield and yield components in an oryza sativa×oryza rufipogon bc2f2 population evaluated in an upland environment. TAG Theor. Appl. Genet. 2001, 102, 41–52. [Google Scholar] [CrossRef]
- Vega, C.R.; Andrade, F.H.; Sadras, V.O.; Uhart, S.A.; Valentinuz, O.R. Seed number as a function of growth. A comparative study in soybean, sunflower, and maize. Crop Sci. 2001, 41, 748–754. [Google Scholar] [CrossRef]
- Simon, S.; Lauri, P.; Brun, L.; Defrance, H.; Sauphanor, B. Does manipulation of fruit-tree architecture affect the development of pests and pathogens? A case study in an organic apple orchard. J. Horticult. Sci. Biotechnol. 2006, 81, 765–773. [Google Scholar] [CrossRef]
- Strik, B.; Buller, G. Improving yield and machine harvest efficiency of ‘bluecrop’ through high density planting and trellising. In Proceedings of the VII International Symposium on Vaccinium Culture 574, Chillan, Chile, 4–9 December 2000; pp. 227–231. [Google Scholar]
- Corelli-Grappadelli, L.; Lakso, A.N. Fruit development in deciduous tree crops as affected by physiological factors and environmental conditions. Acta Hortic. 2004, 636, 425–441. [Google Scholar] [CrossRef]
- Sansavini, S.; Corelli, L. Canopy efficiency of apple as affected by microclimatic factors and tree structure. In Proceedings of the I International Symposium on Training and Pruning of Fruit Trees 322, Shepherdstown, WV, USA, 16–20 July 1991; pp. 69–78. [Google Scholar]
- Calonnec, A.; Burie, J.B.; Langlais, M.; Guyader, S.; Saint-Jean, S.; Sache, I.; Tivoli, B. Impacts of plant growth and architecture on pathogen processes and their consequences for epidemic behaviour. Eur. J. Plant Pathol. 2013, 135, 479–497. [Google Scholar] [CrossRef]
- Paproki, A.; Sirault, X.; Berry, S.; Furbank, R.; Fripp, J. A novel mesh processing based technique for 3D plant analysis. BMC Plant Biol. 2012, 12, 63. [Google Scholar] [CrossRef] [PubMed]
- Paulus, S.; Dupuis, J.; Mahlein, A.-K.; Kuhlmann, H. Surface feature based classification of plant organs from 3D laserscanned point clouds for plant phenotyping. BMC Bioinf. 2013, 14, 238. [Google Scholar] [CrossRef] [PubMed]
Figure 1.
Aerial view of the horticulture farm (A) and commercial farm (B) study site.

Figure 2.
Phantom positioning for oblique imagery relative to the row of interest.
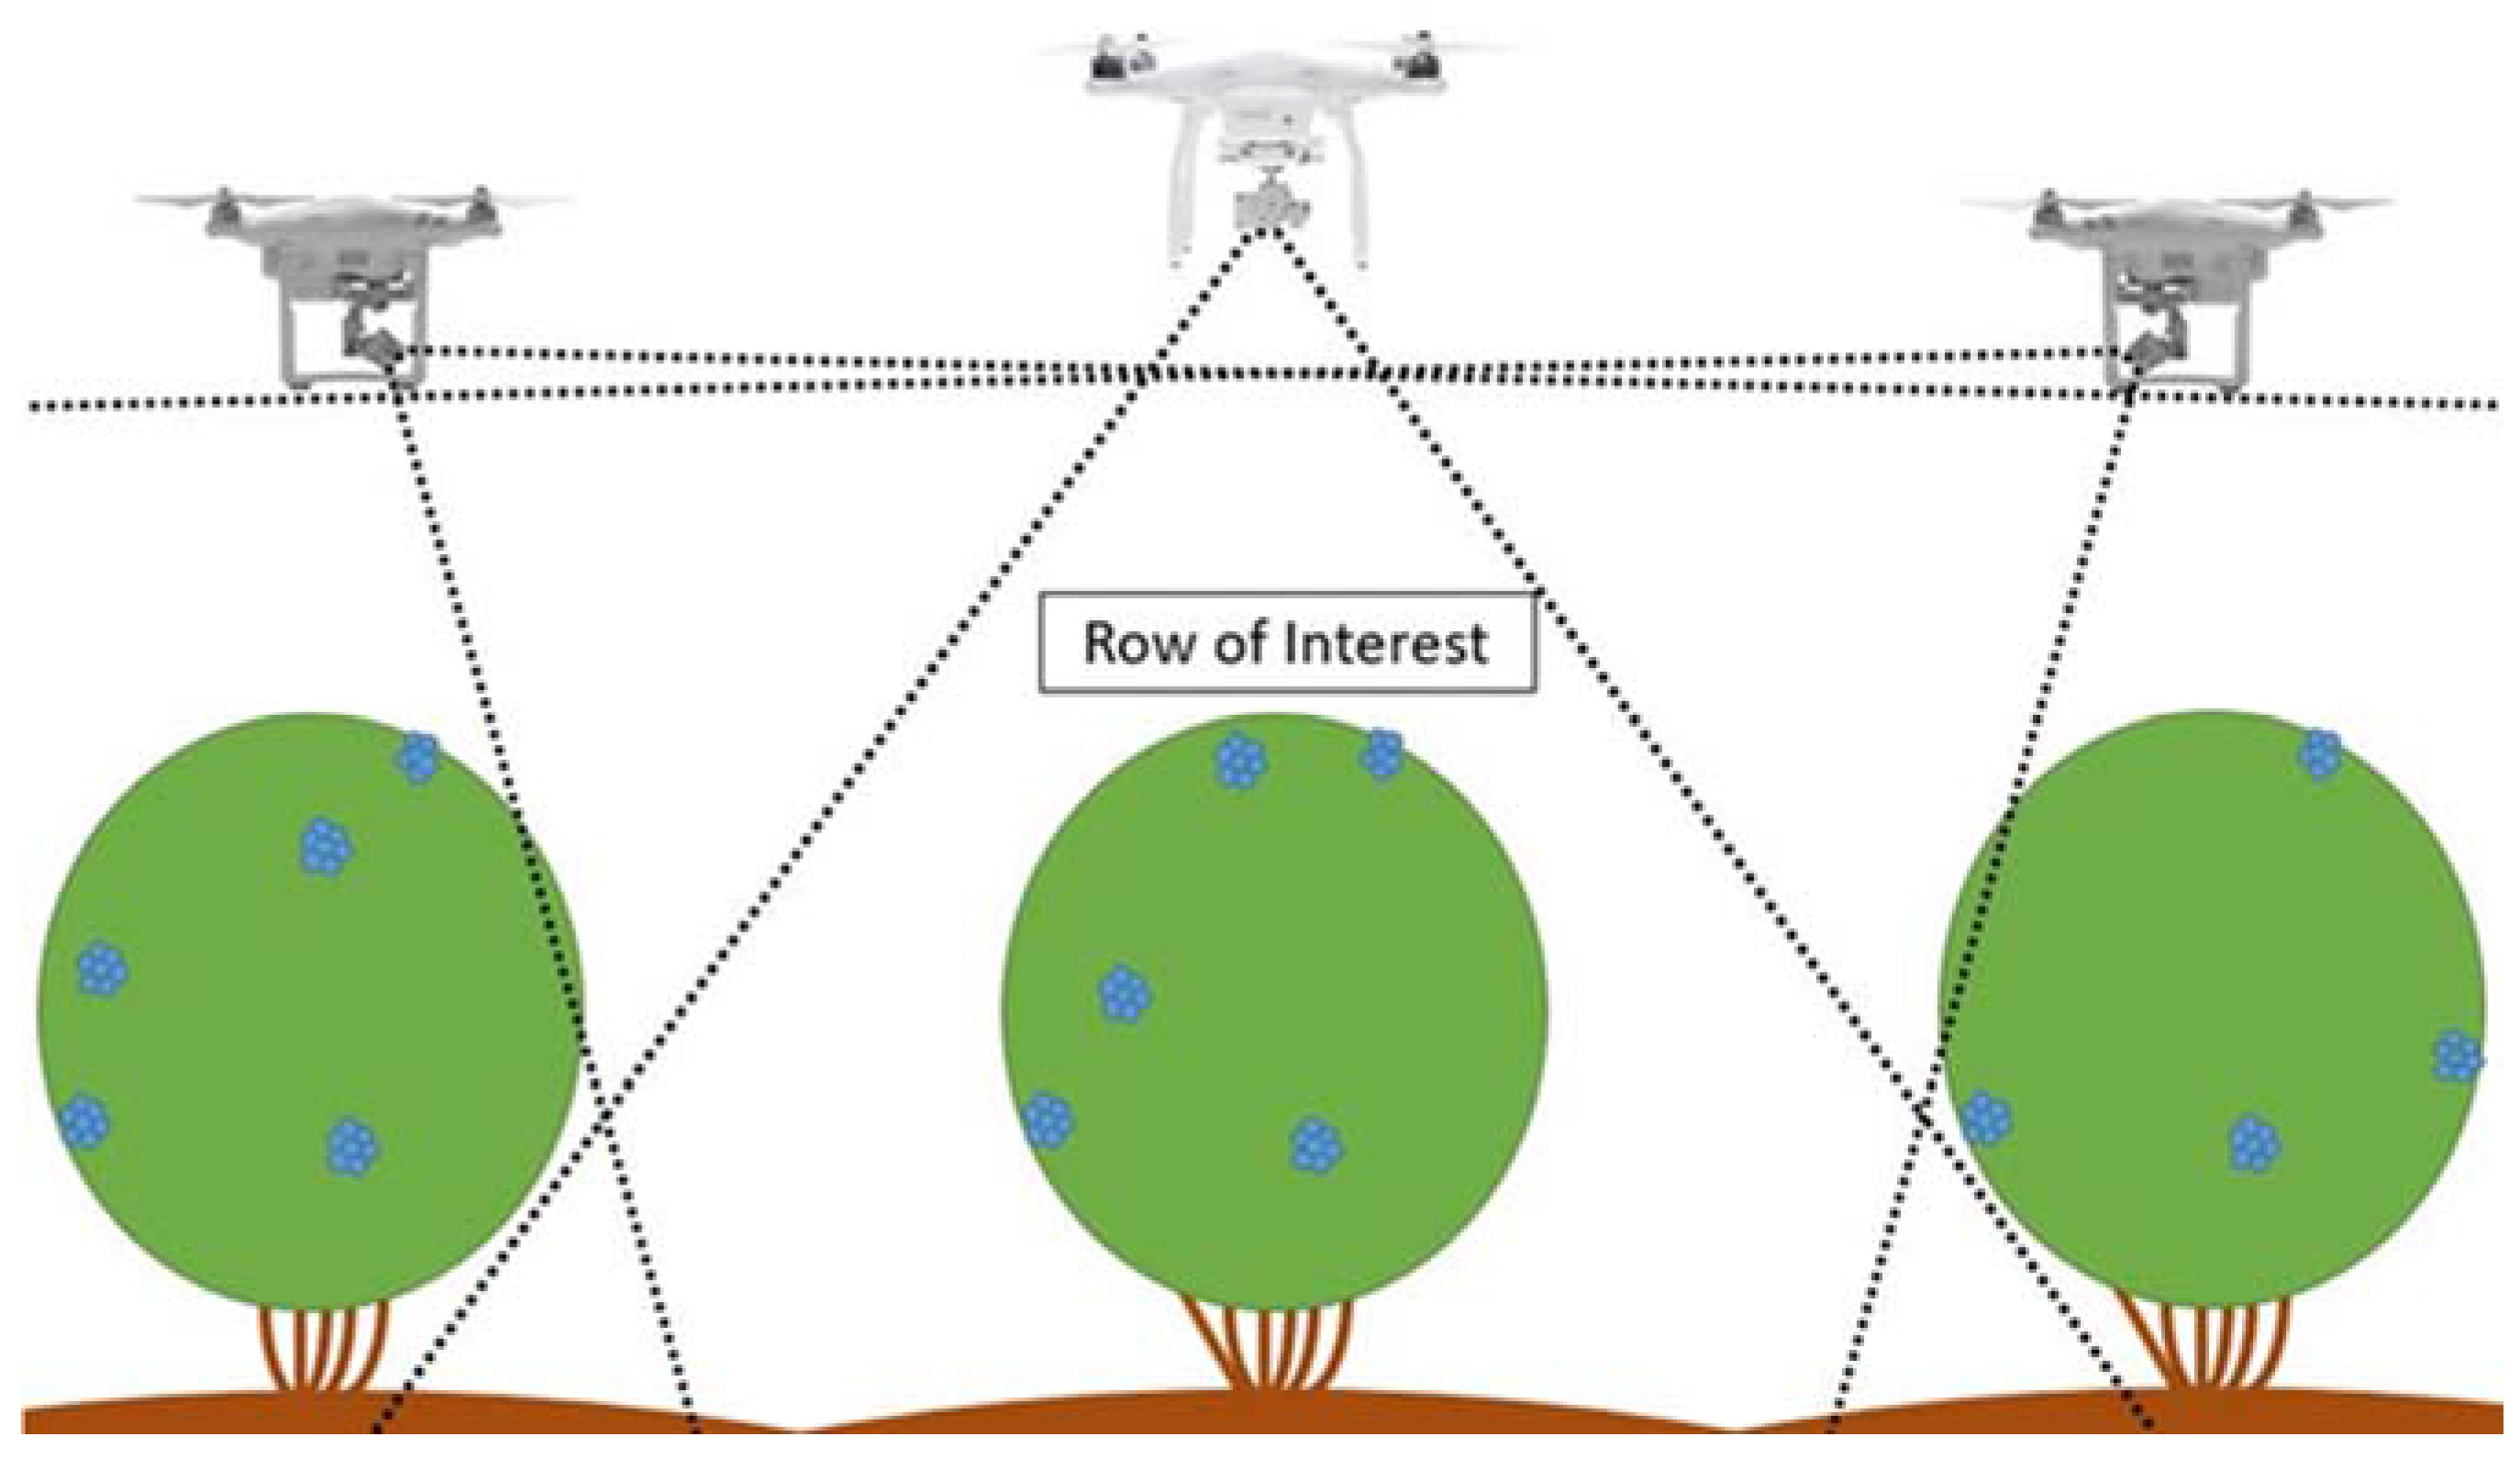
Figure 3.
Flight path of preliminary data collection at the university research farm. Changes in camera heading marked with arrows.
Figure 3.
Flight path of preliminary data collection at the university research farm. Changes in camera heading marked with arrows.
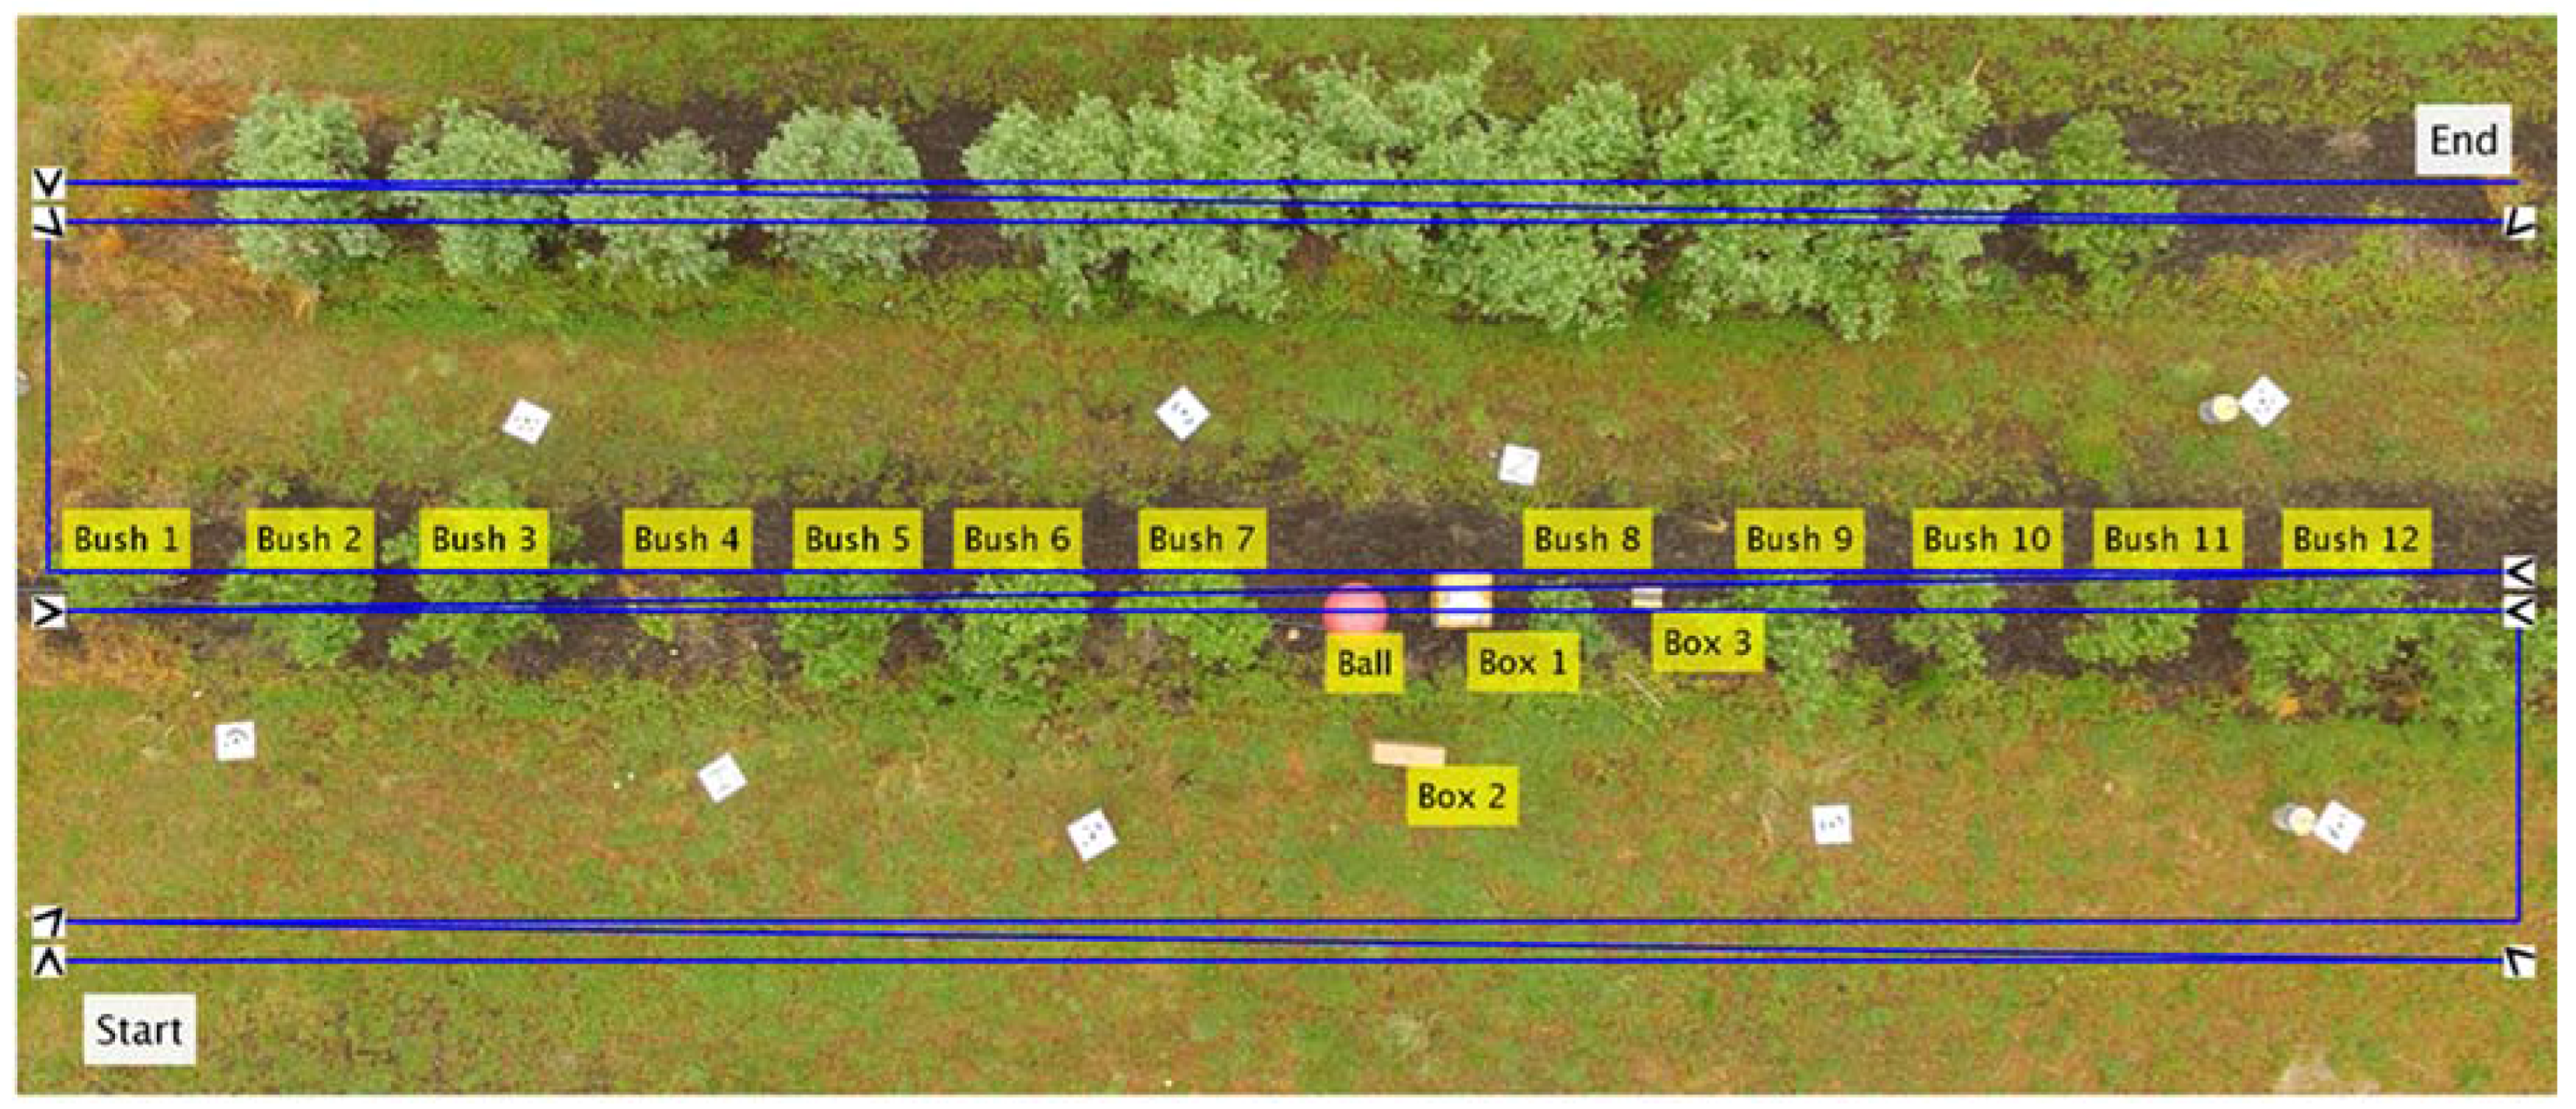
Figure 4.
Flight path of data collection at a commercial blueberry farm. Changes in camera heading marked with arrows.
Figure 4.
Flight path of data collection at a commercial blueberry farm. Changes in camera heading marked with arrows.
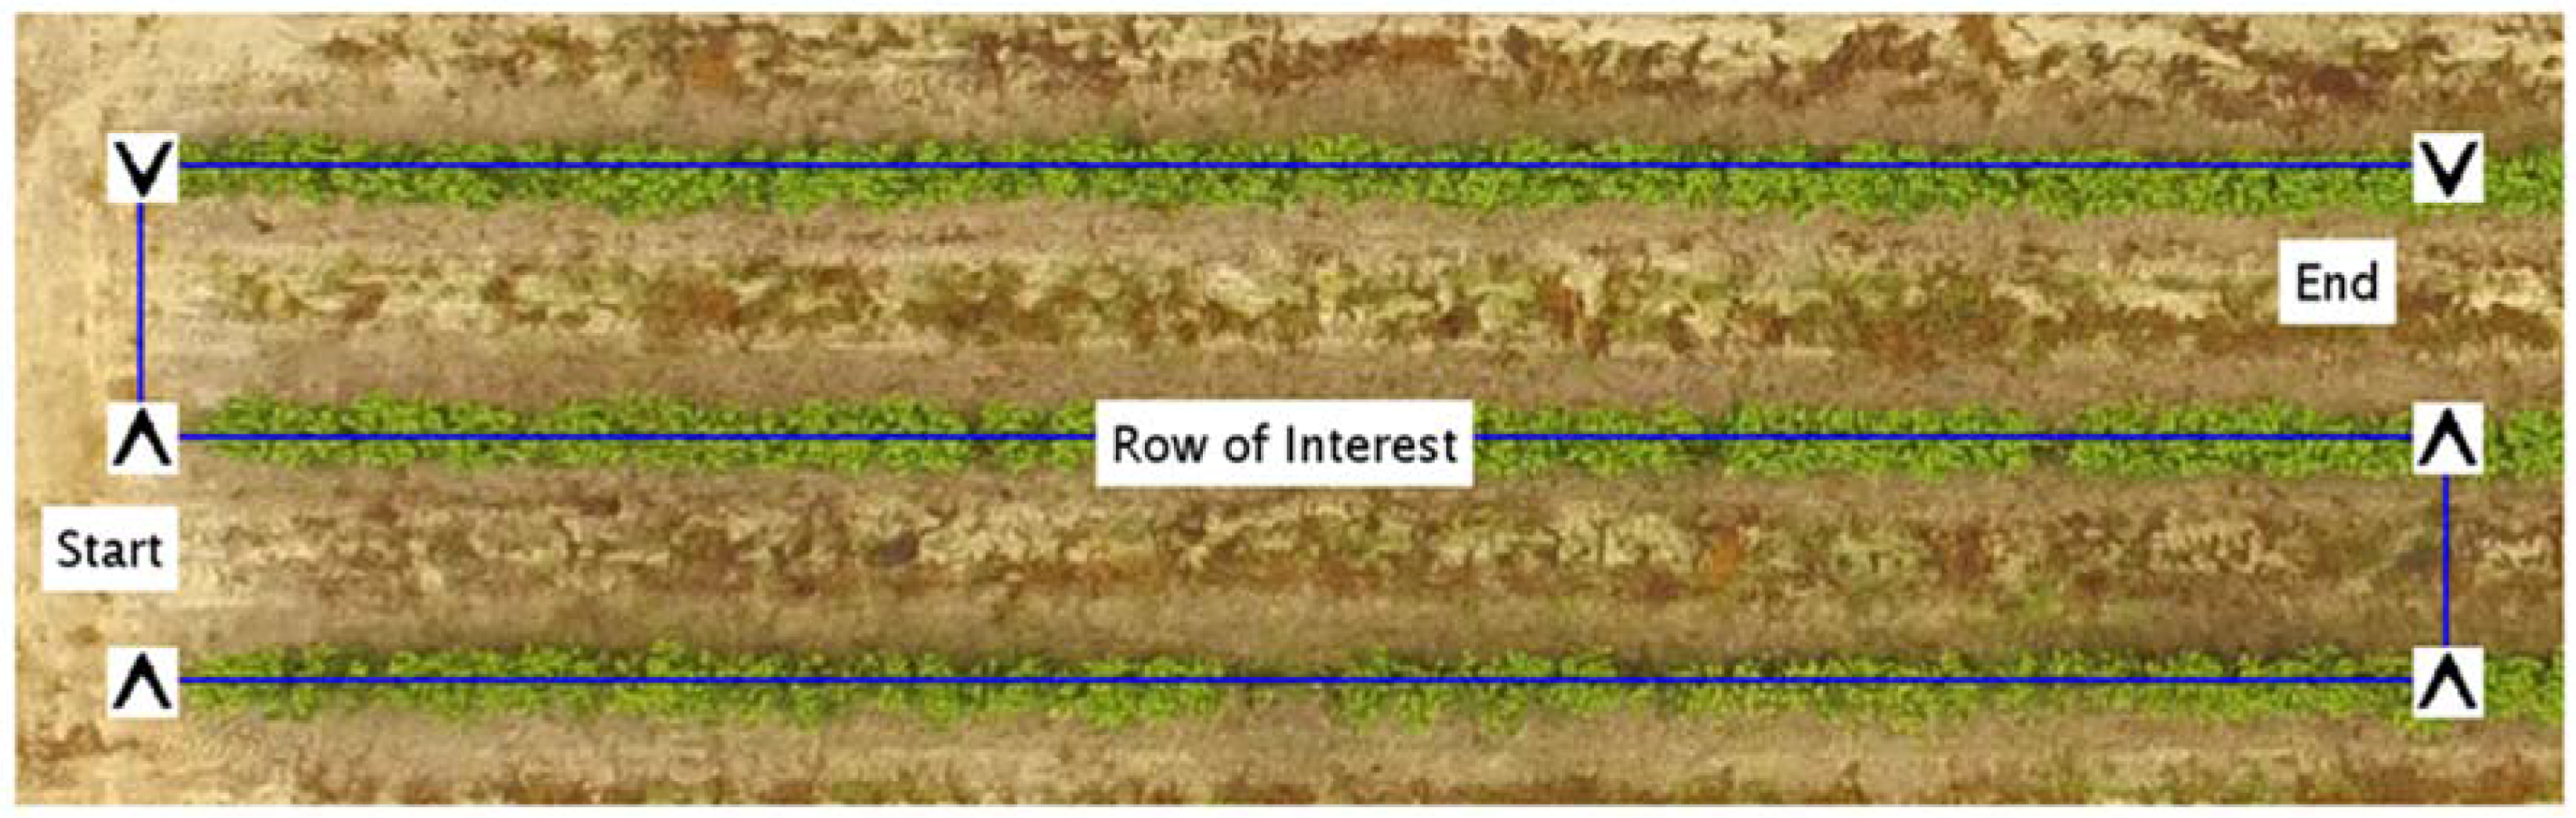
Figure 5.
Data Processing Pipeline.
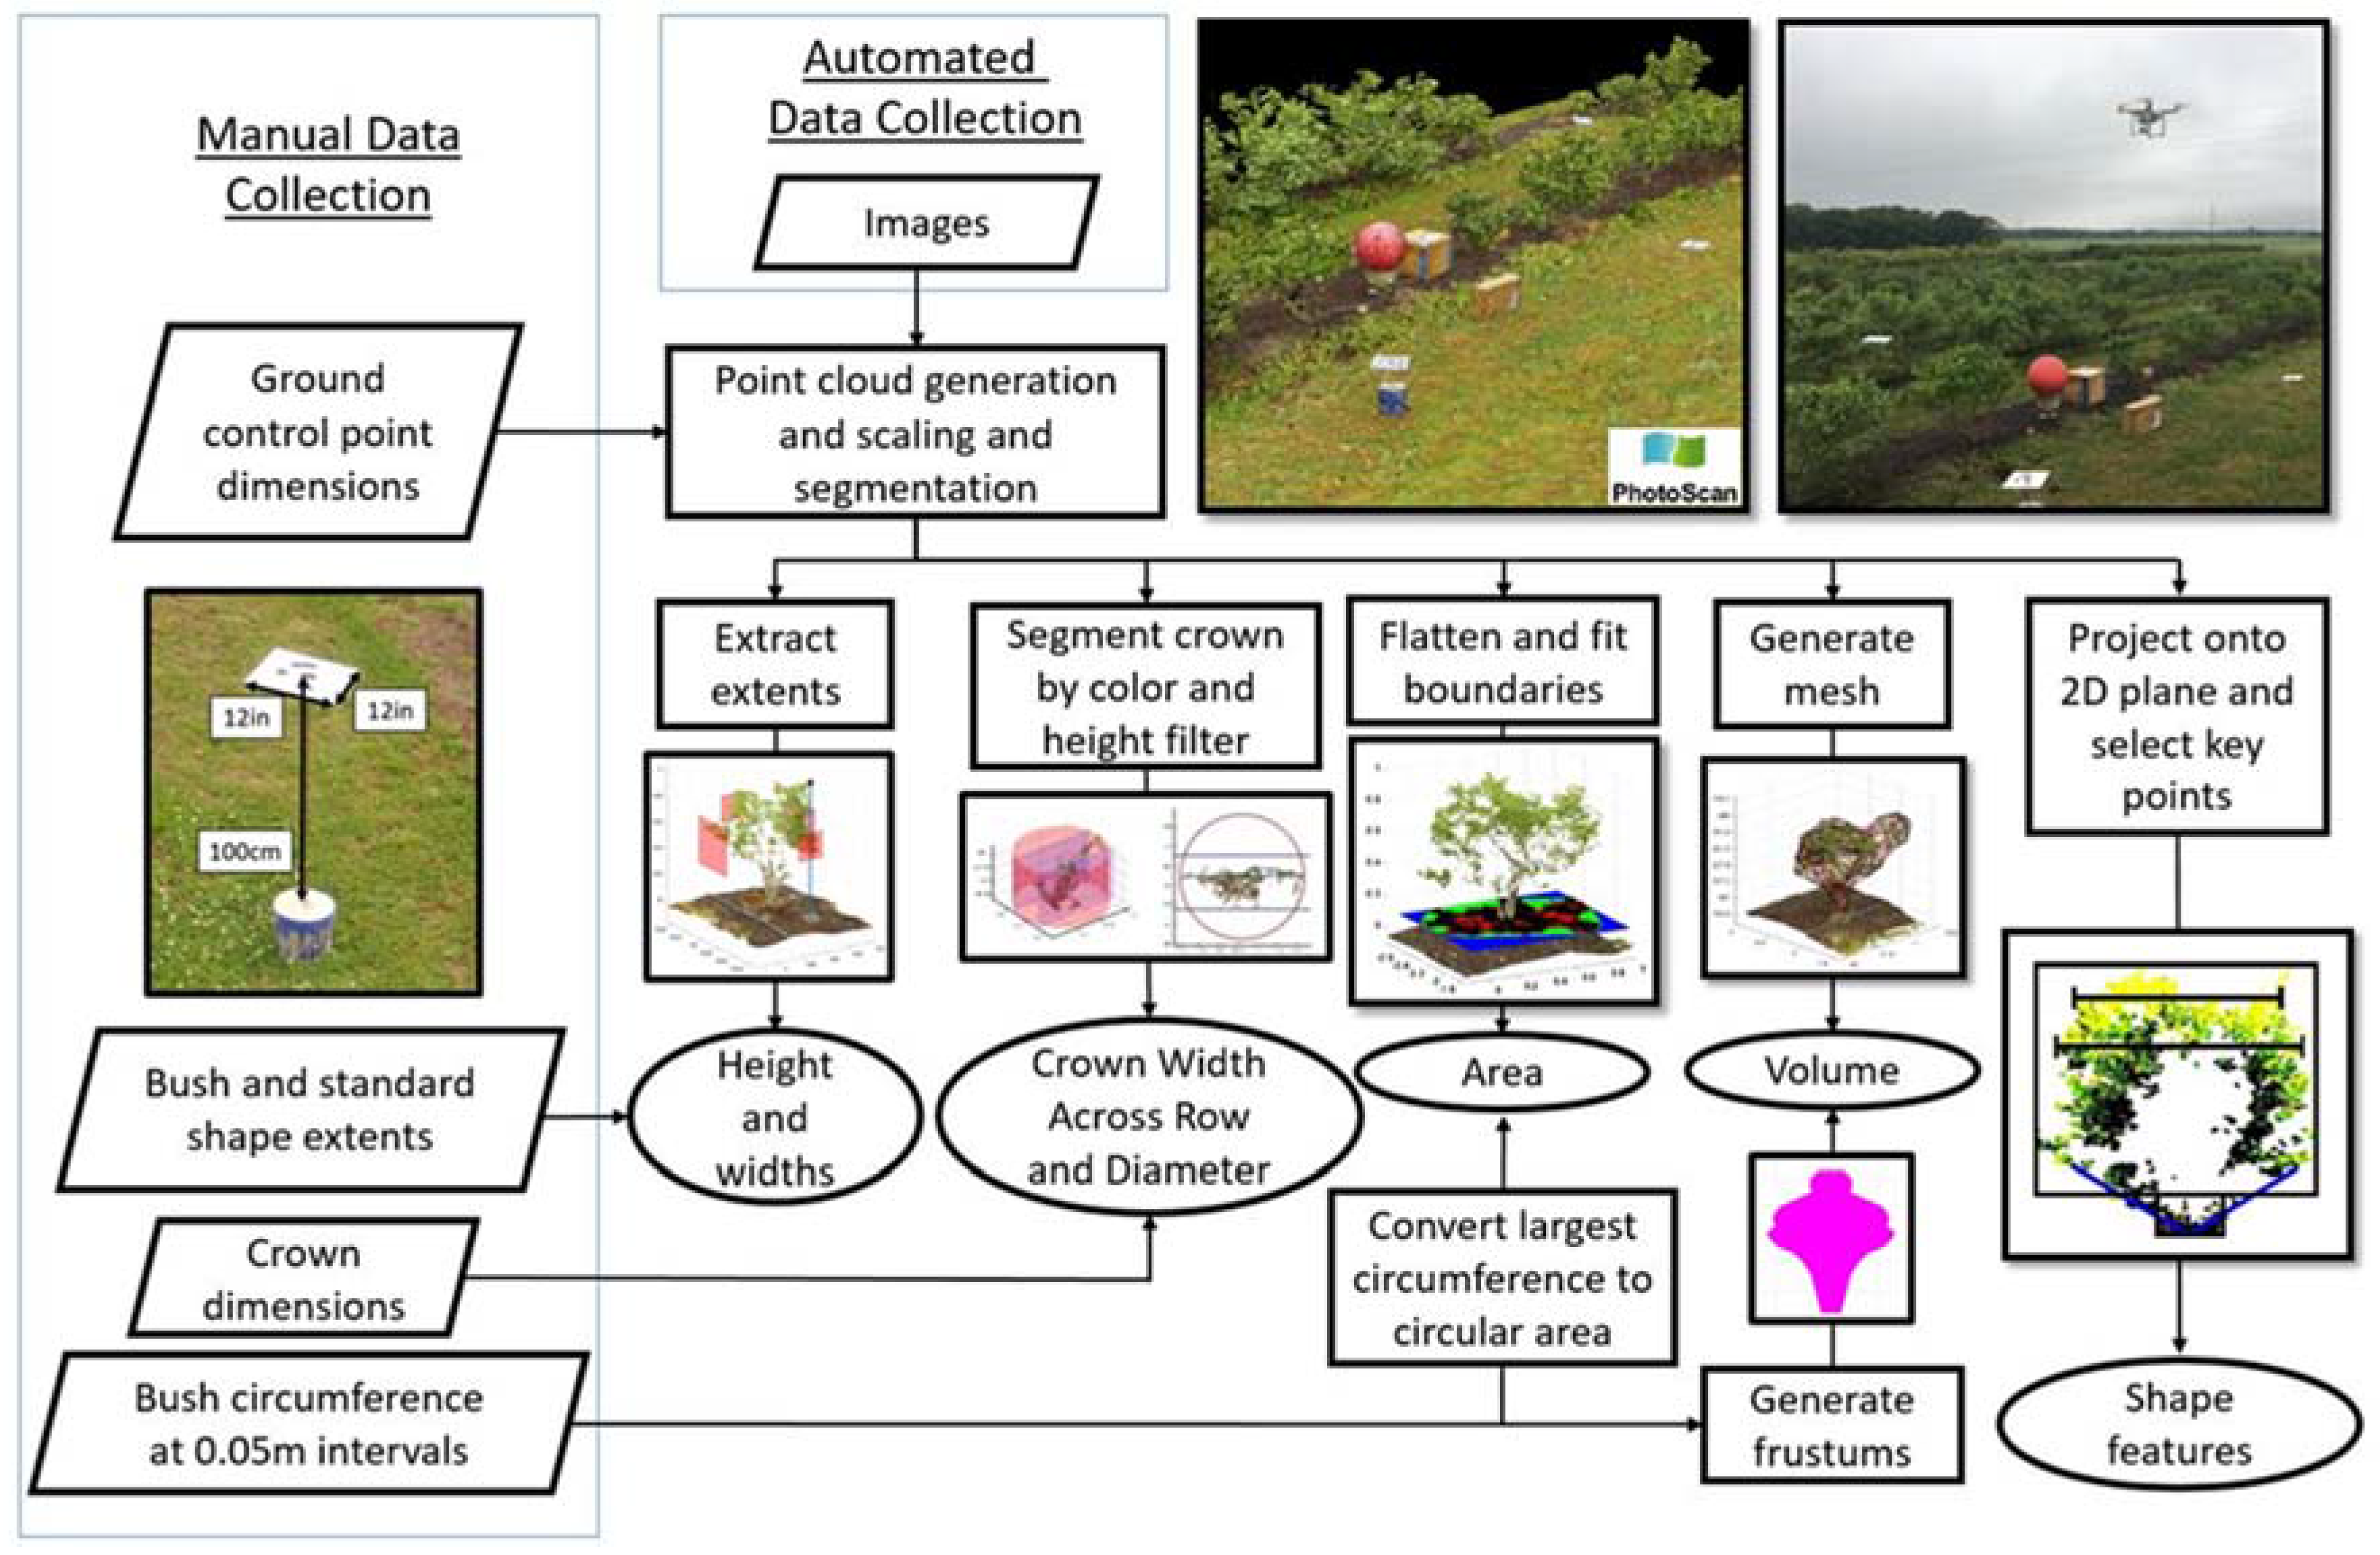
Figure 6.
Point cloud with linear dimensions, canopy projection area, crown bounding cylinder, and crown width at 15 cm labeled. The canopy bounding rectangle (WIR and WAR) is visualized by red planes with an arbitrary height.
Figure 6.
Point cloud with linear dimensions, canopy projection area, crown bounding cylinder, and crown width at 15 cm labeled. The canopy bounding rectangle (WIR and WAR) is visualized by red planes with an arbitrary height.
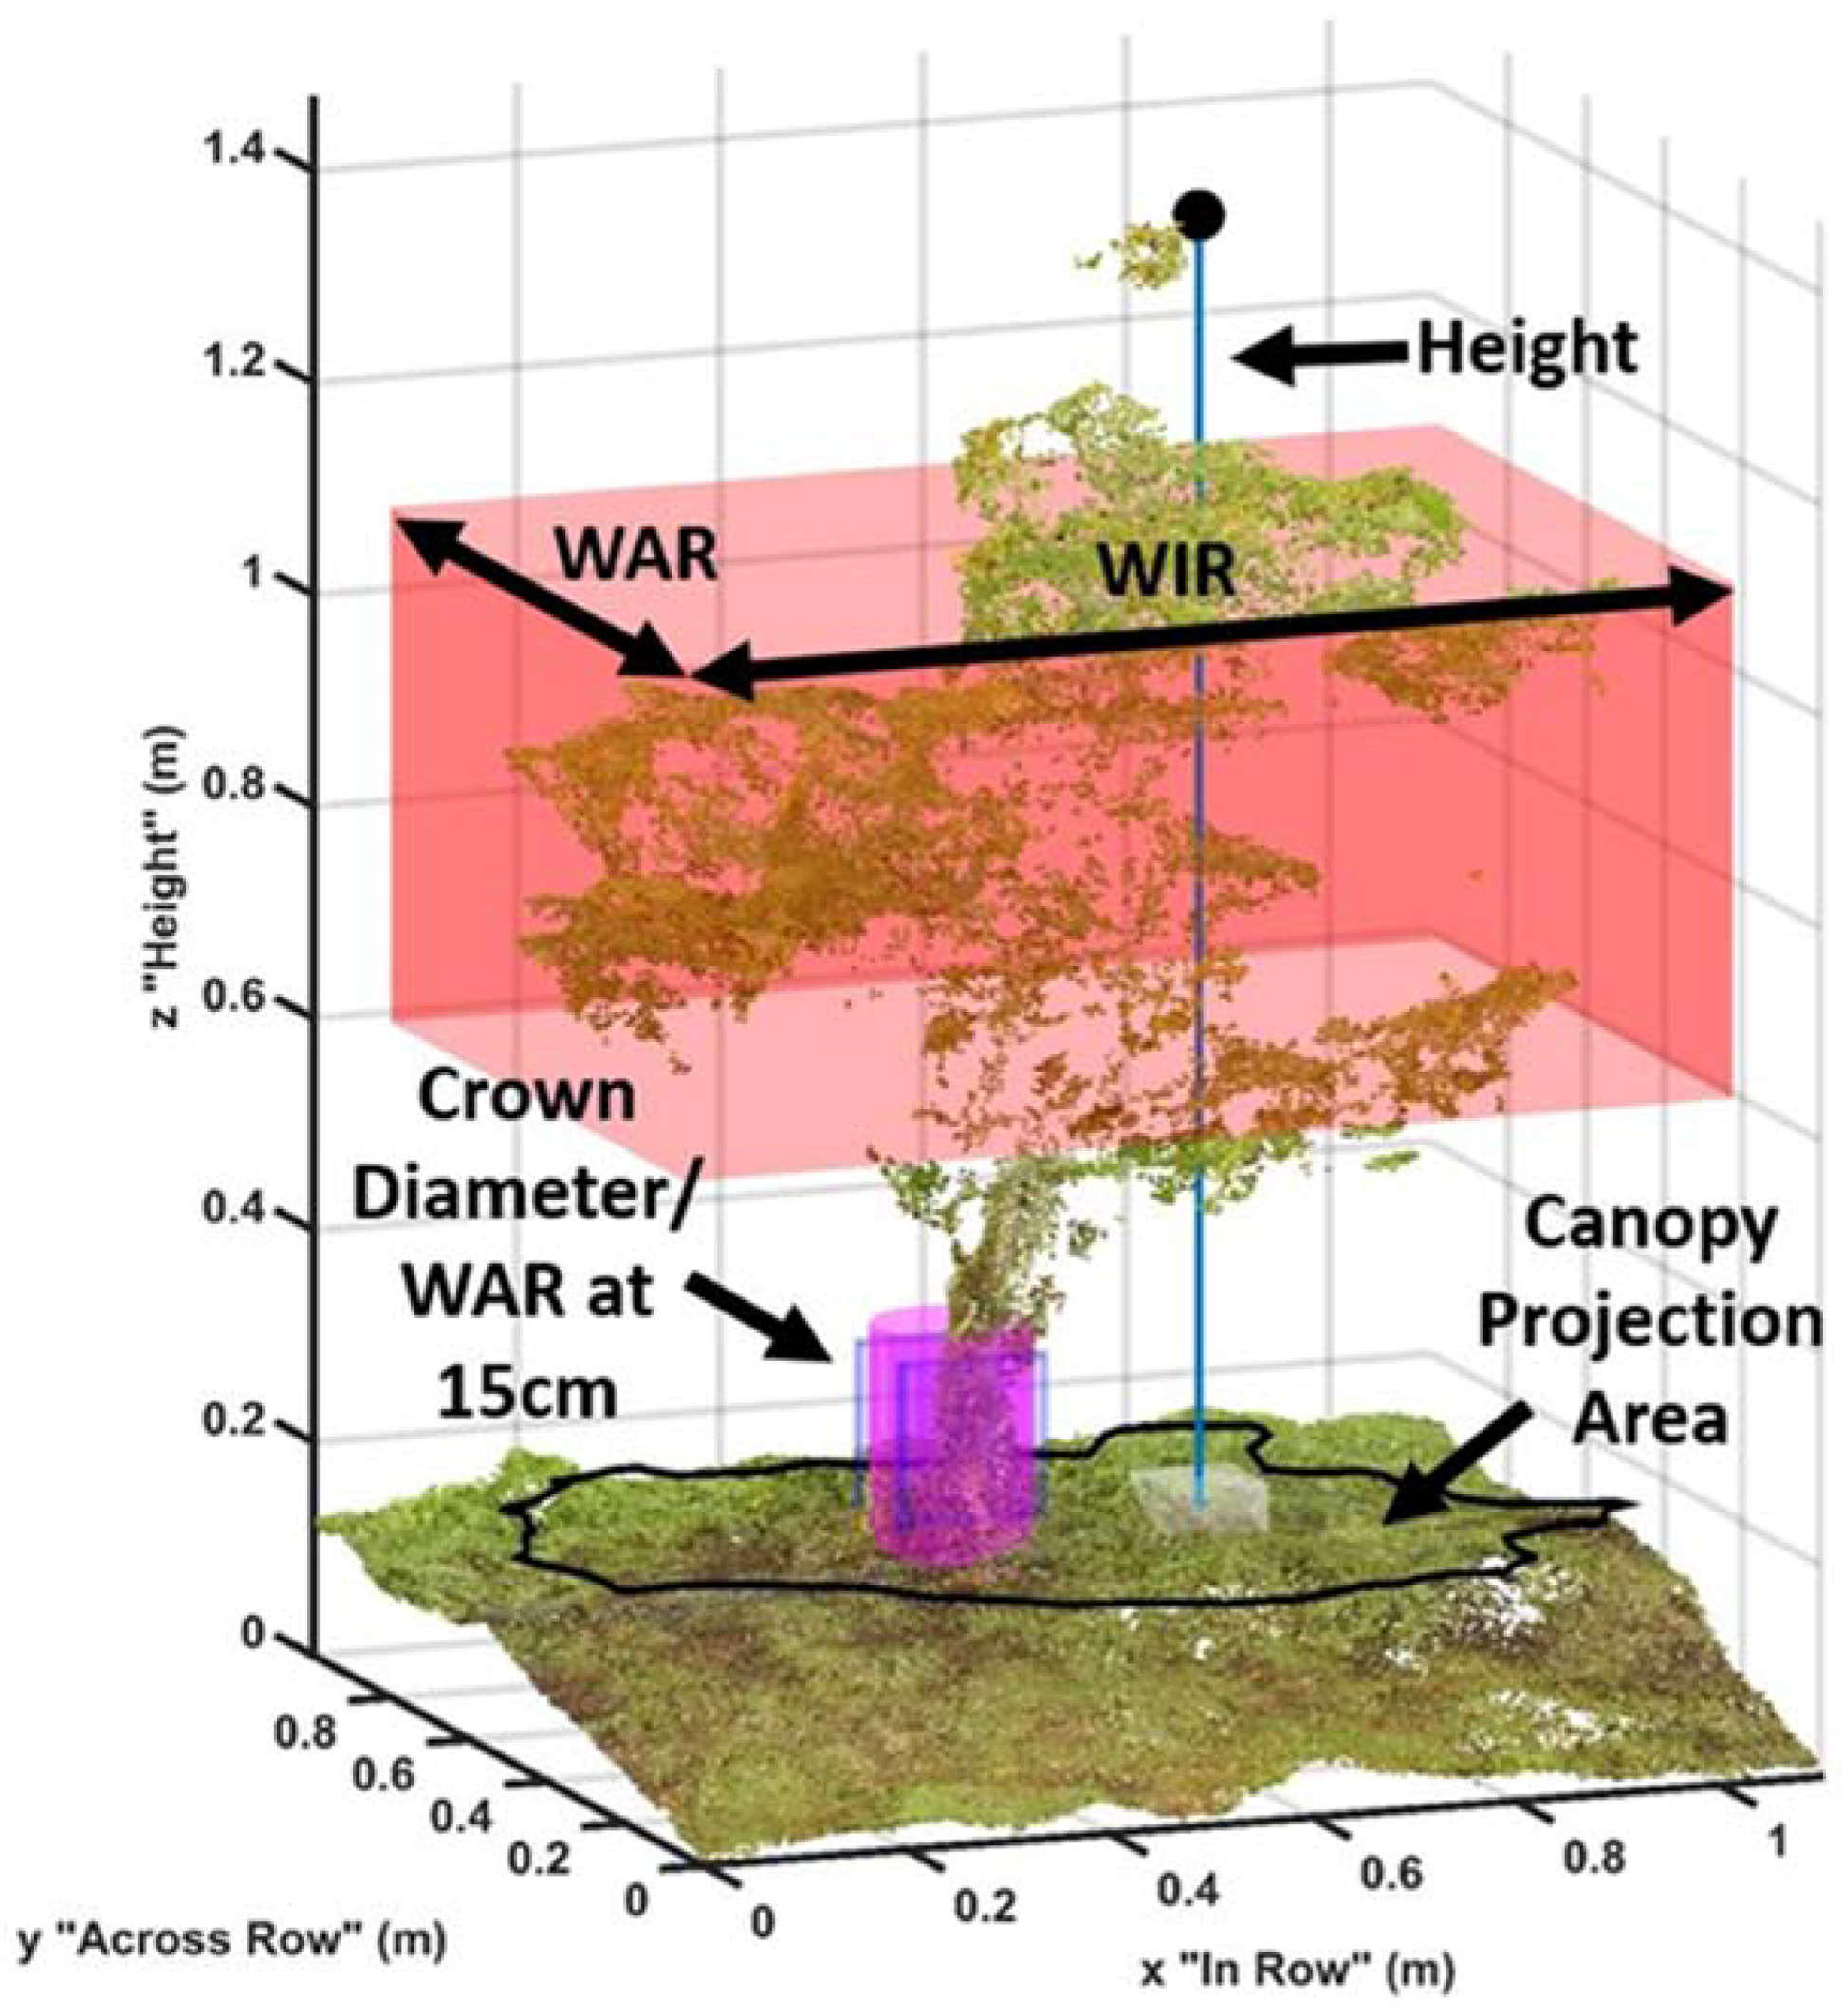
Figure 7.
Commercially grown Farthing bush with dimensions from which features are derived shown.
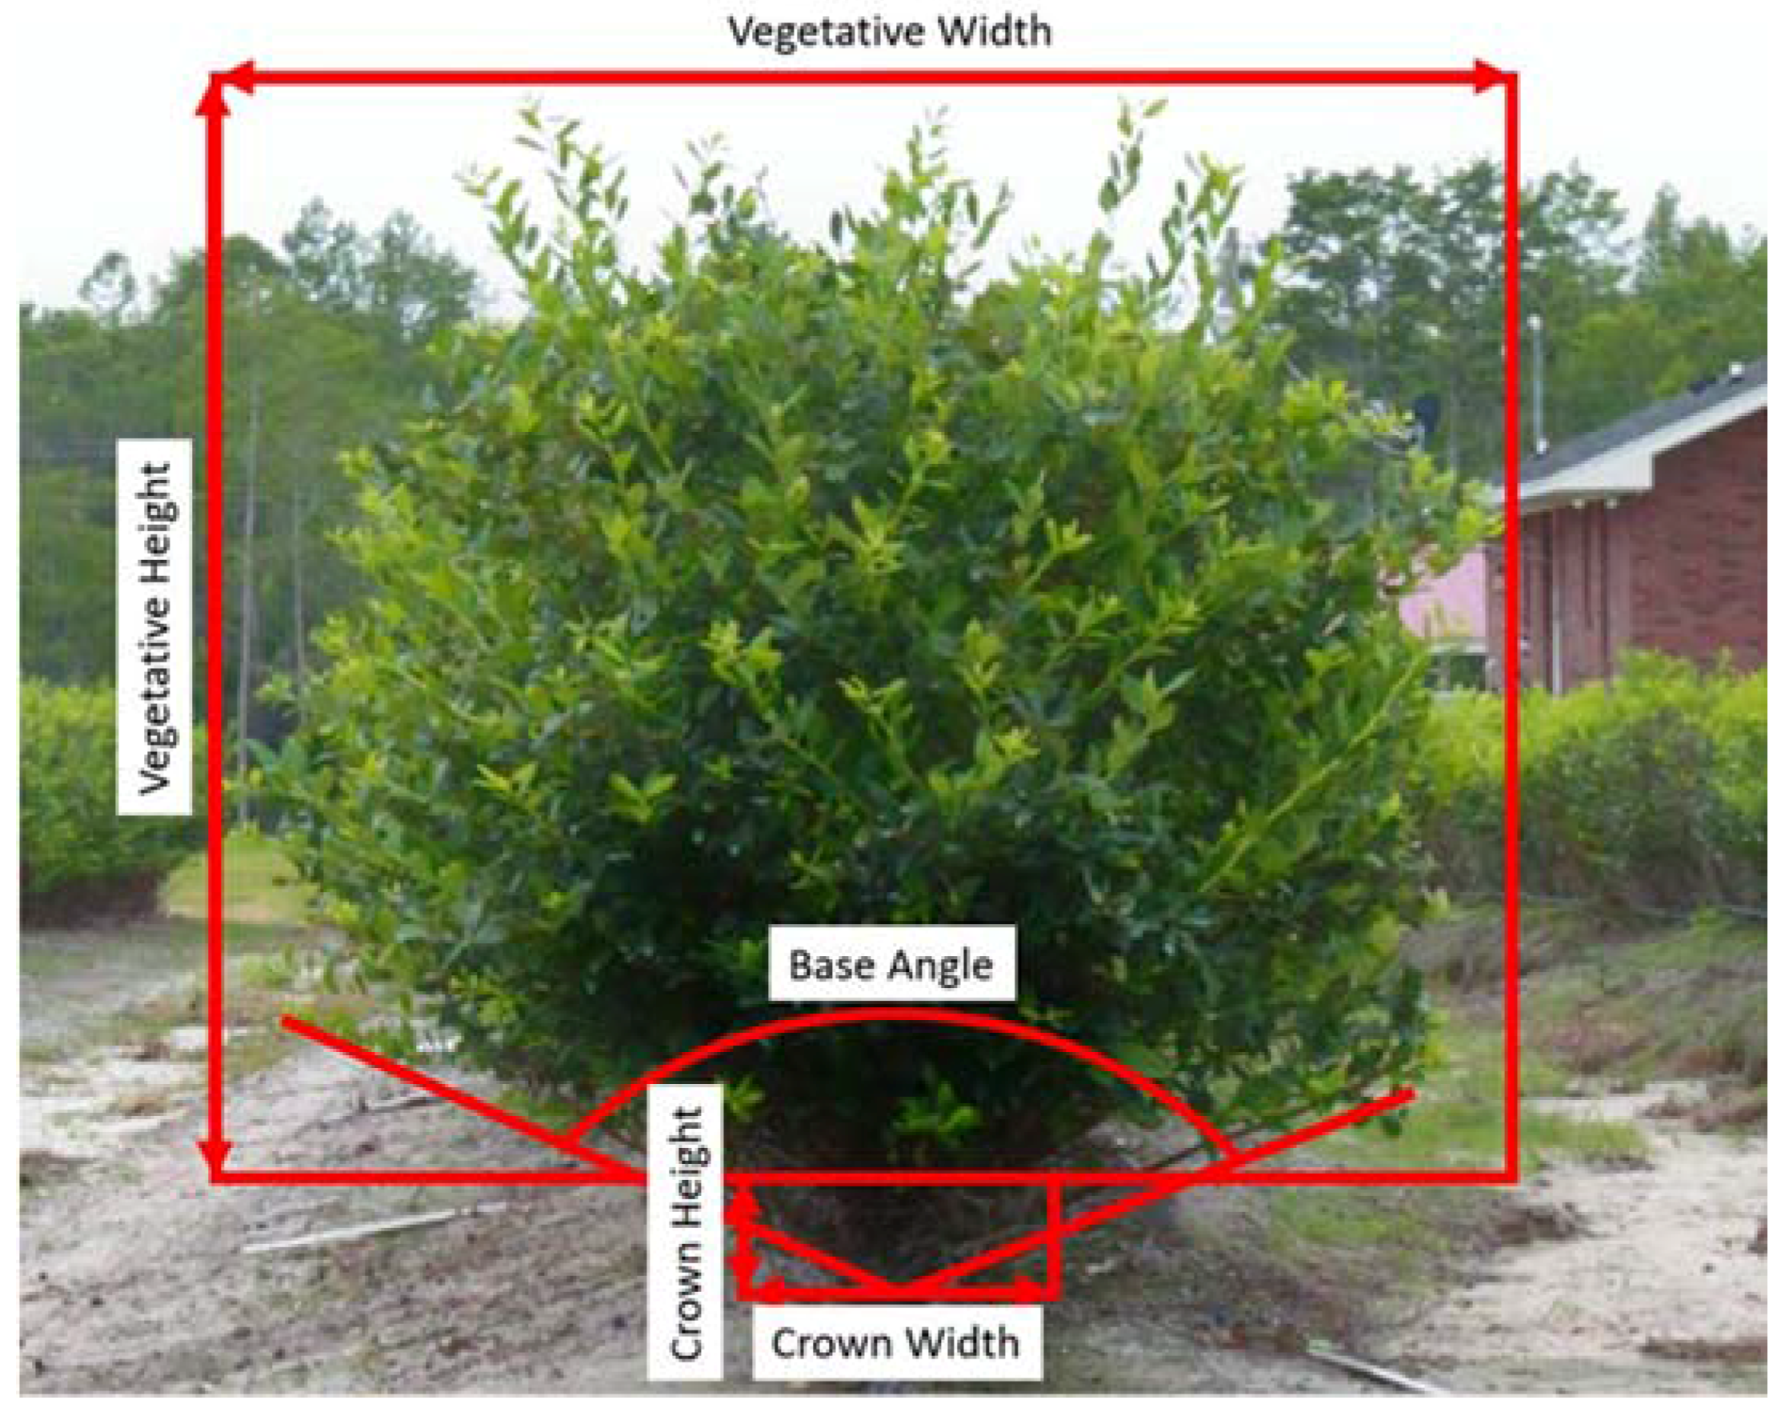
Figure 8.
Manually measured frustums overlaid on point cloud (A) Convex hull mesh (B).
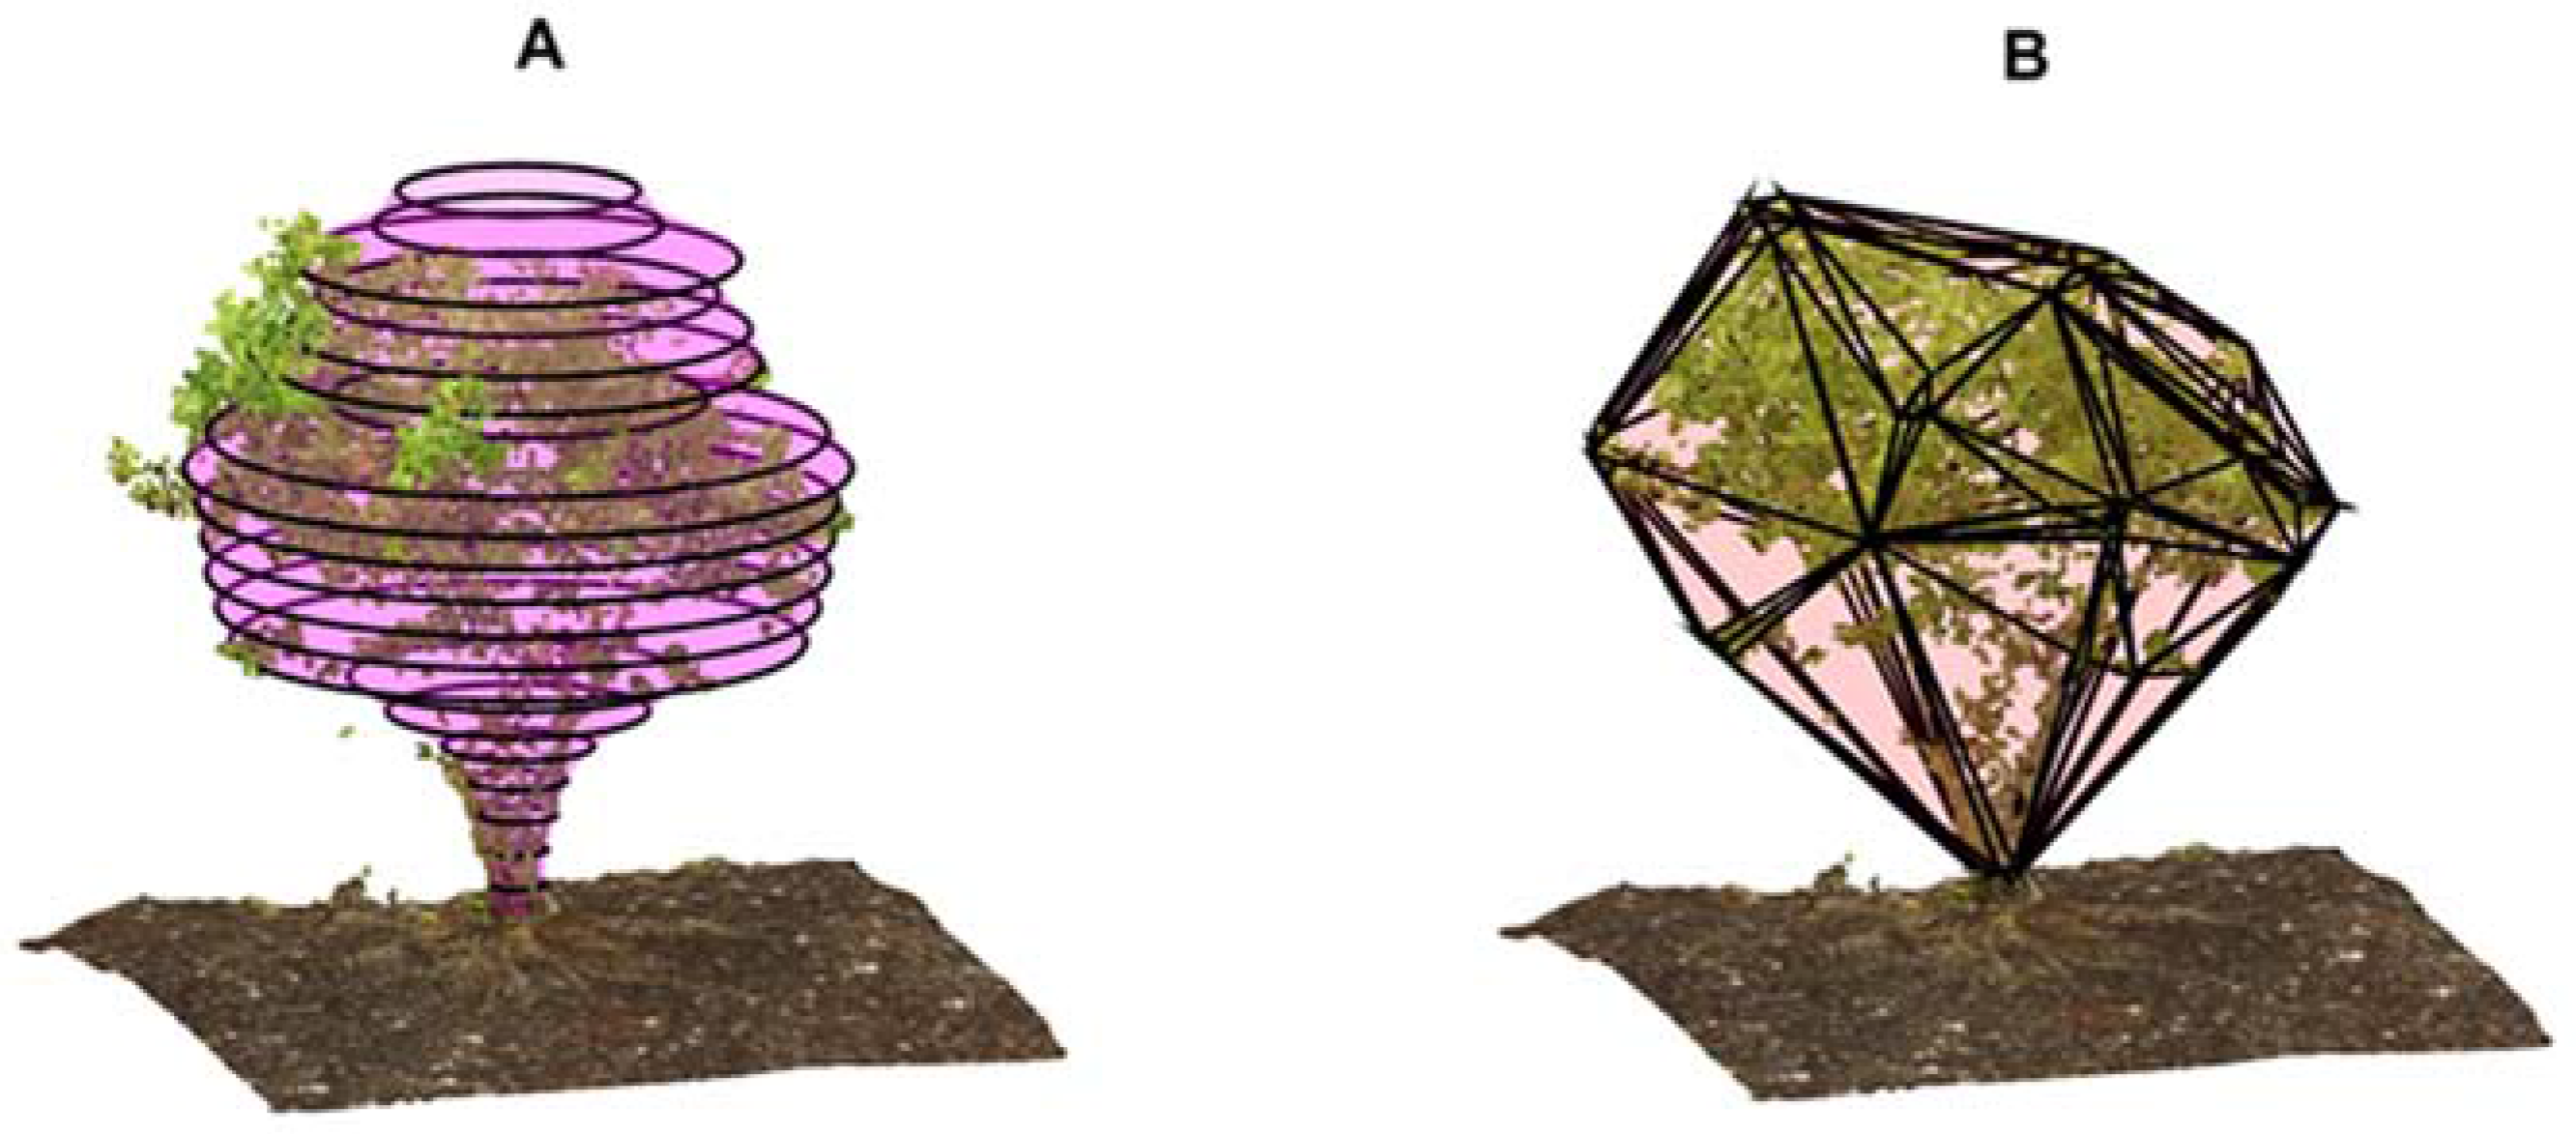
Figure 9.
Resolution comparison between still images and frame the extracted from the video.

Figure 10.
Image resolution, flight speed to maintain overlap, and vertical wind disturbance speed, each as a function of true flight height. Ambient gust speed displayed for reference.
Figure 10.
Image resolution, flight speed to maintain overlap, and vertical wind disturbance speed, each as a function of true flight height. Ambient gust speed displayed for reference.

Figure 11.
Correlation of Manual and Point Cloud measurements (extents includes heights, WAR, WIR) for reference objects (A) and bushes (B).
Figure 11.
Correlation of Manual and Point Cloud measurements (extents includes heights, WAR, WIR) for reference objects (A) and bushes (B).

Figure 12.
Bush point cloud projected (black) with the Convex Hull area (green), Boundary area (red), and Bounding Rectangle area (blue) shown (A). Correlation between point cloud derived areas and manual area (B).
Figure 12.
Bush point cloud projected (black) with the Convex Hull area (green), Boundary area (red), and Bounding Rectangle area (blue) shown (A). Correlation between point cloud derived areas and manual area (B).

Figure 13.
Bush point cloud with meshes generated with shrink factors 0, 0.3, and 1 and correlations of mesh volume to manual volume.
Figure 13.
Bush point cloud with meshes generated with shrink factors 0, 0.3, and 1 and correlations of mesh volume to manual volume.

Figure 14.
Crown point cloud and bounding cylinder (A) Projected crown with width across row and diameter shown (B).
Figure 14.
Crown point cloud and bounding cylinder (A) Projected crown with width across row and diameter shown (B).
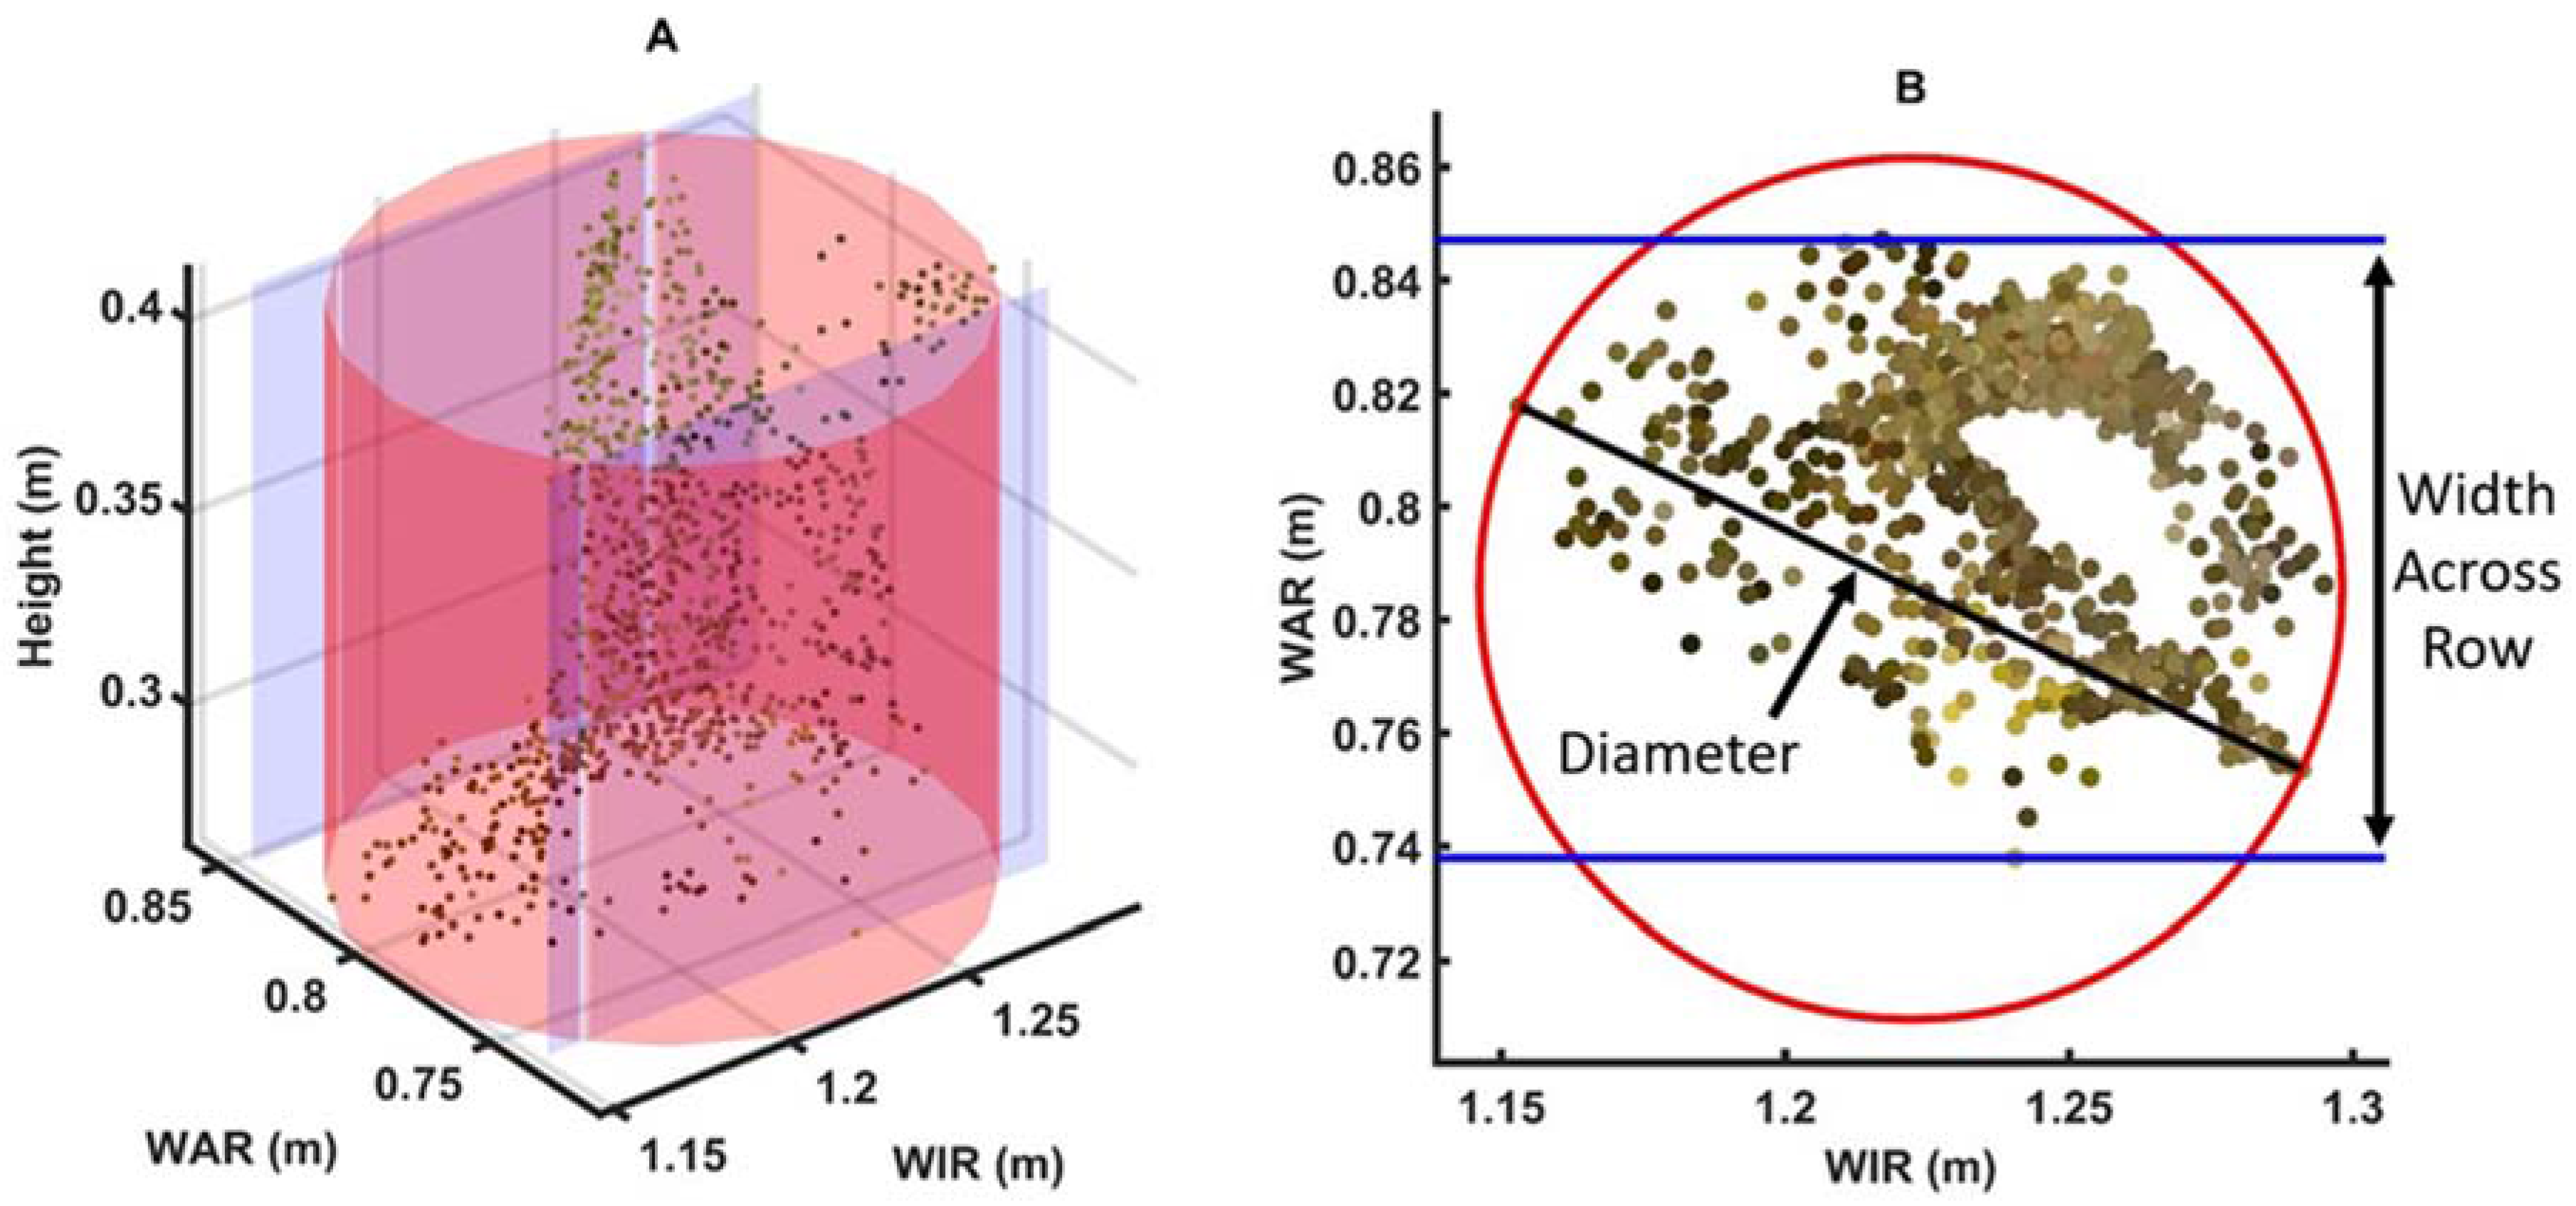
Figure 15.
Manual and point cloud derived WAR (A) and crown diameters (B) at 15 cm. Bushes with canopies occluding the crown not shown.
Figure 15.
Manual and point cloud derived WAR (A) and crown diameters (B) at 15 cm. Bushes with canopies occluding the crown not shown.
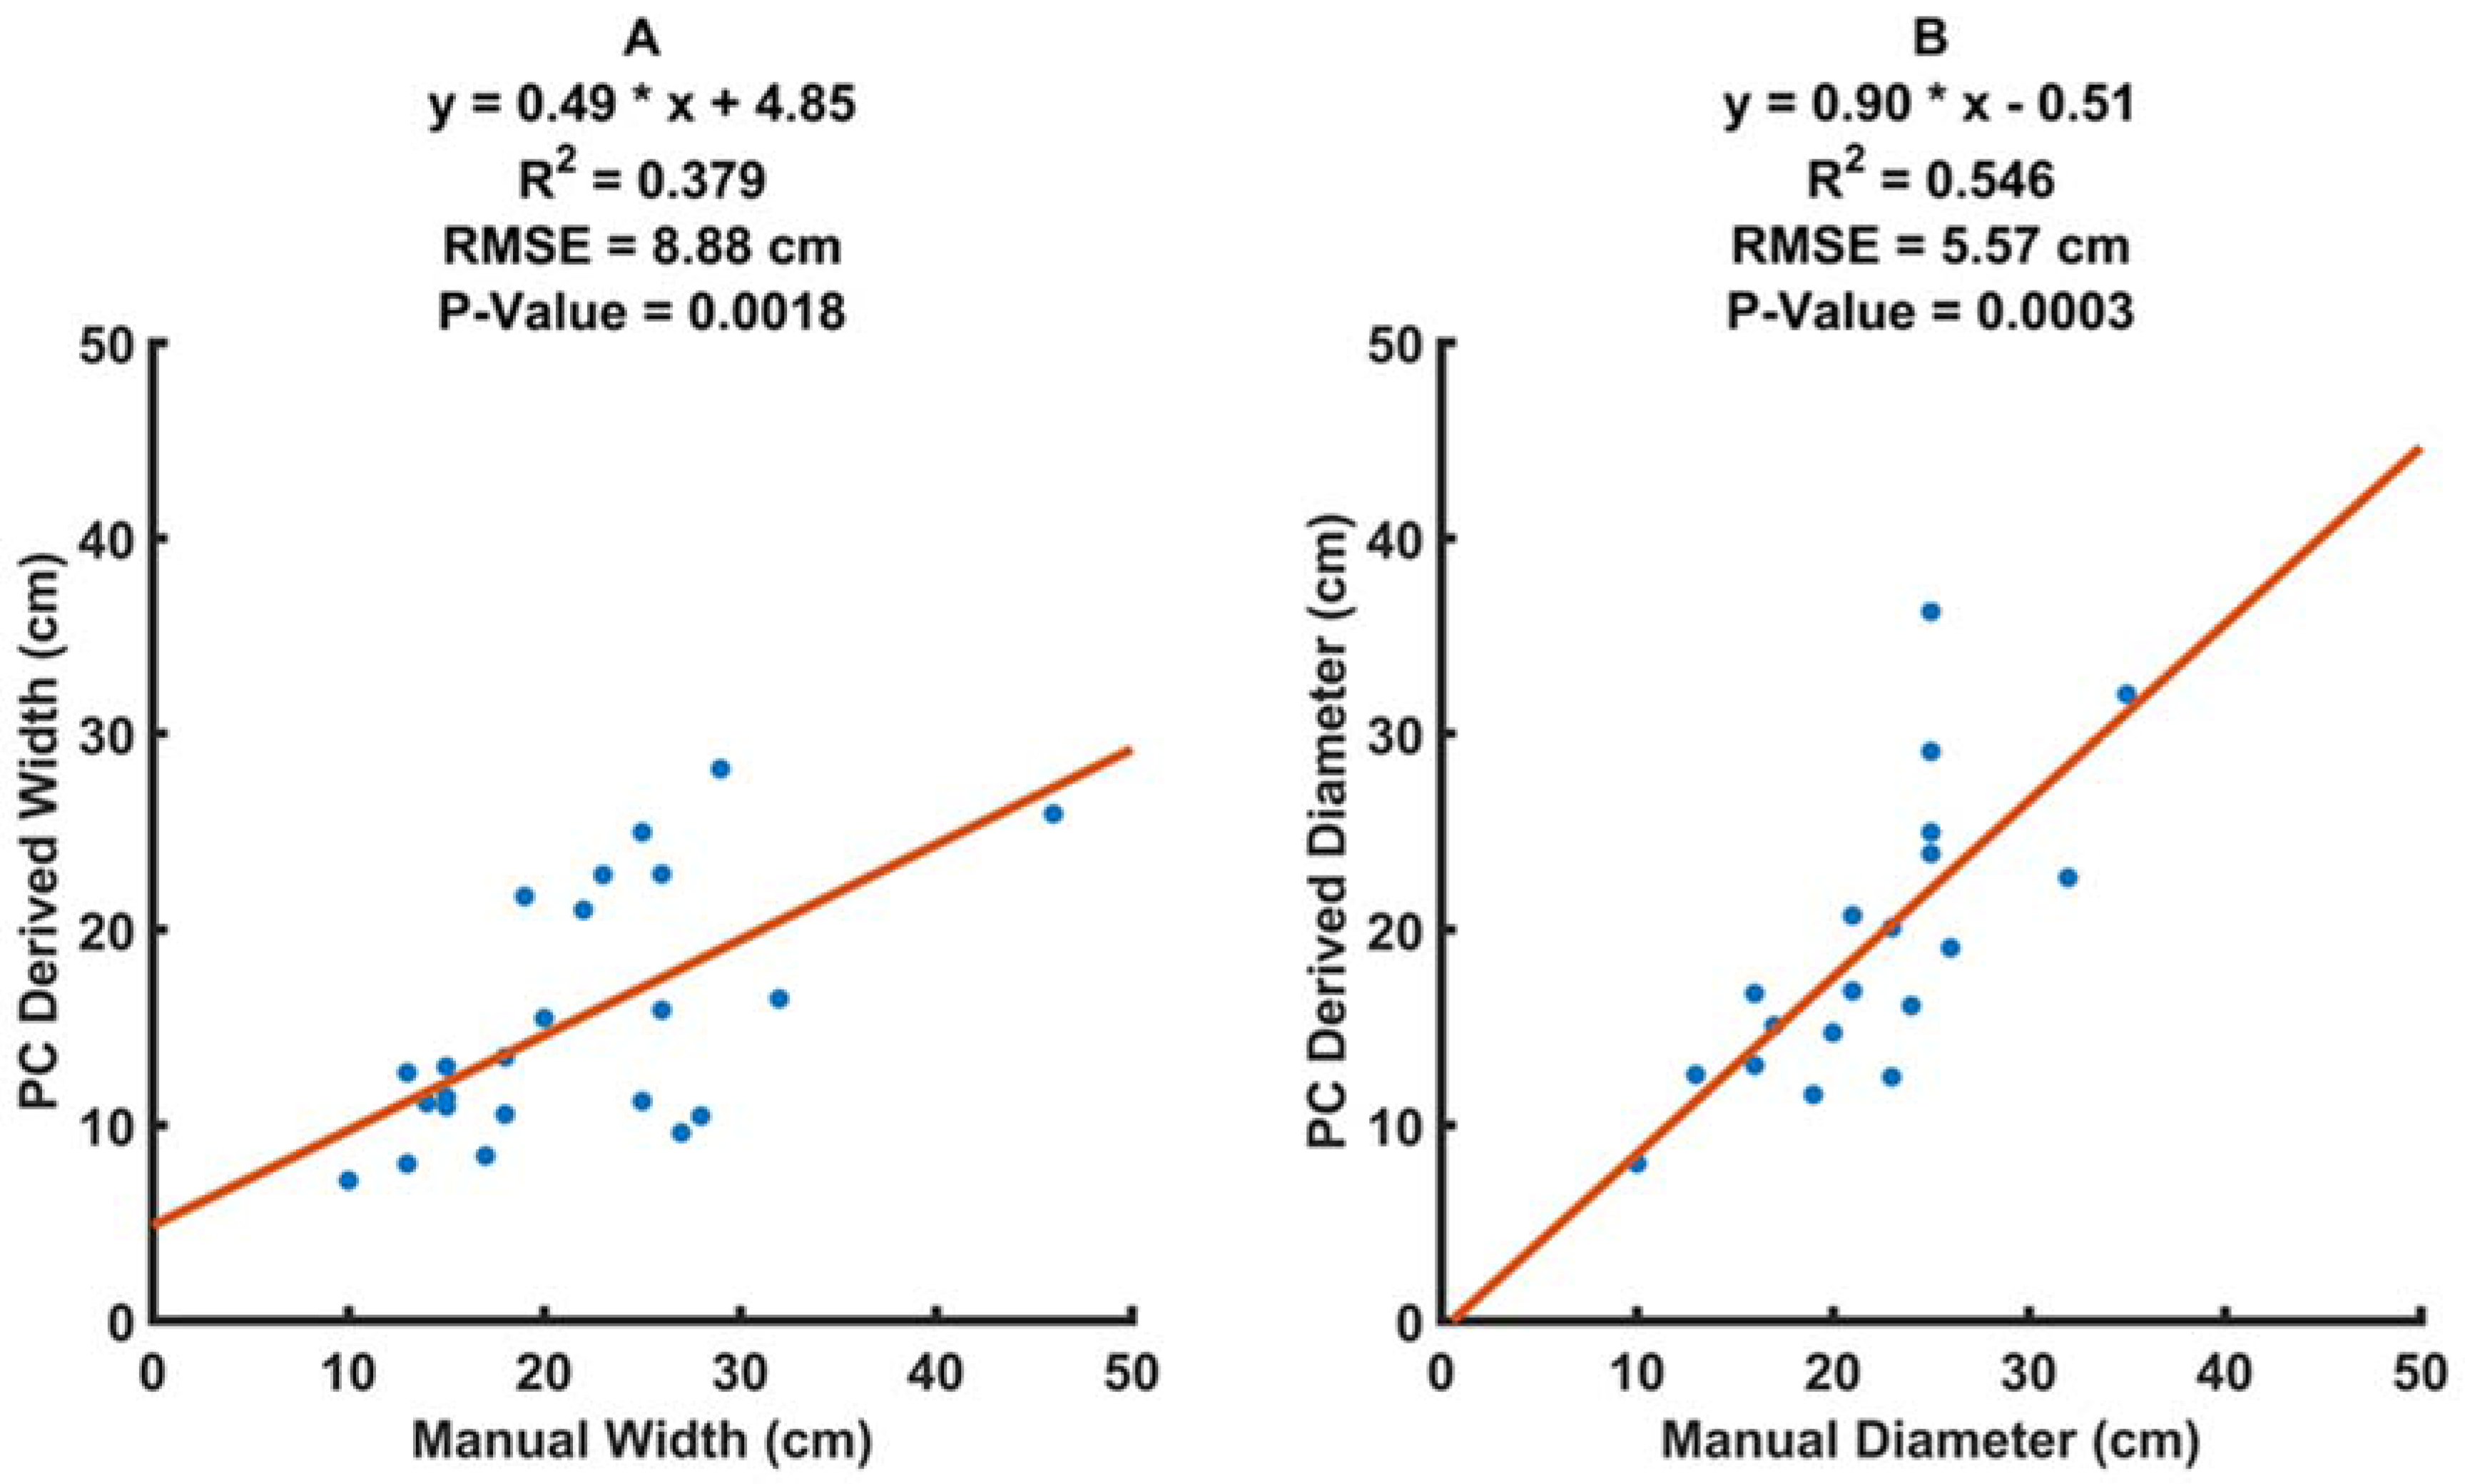
Figure 16.
Correlations of growth indices (GI) and volume (V) in m3. ‘M’ and ‘P’ denote manually determined and point cloud derived data. PV0—shrink factor of 0, PV03—shrink factor of 0.3. All correlations are significant at α = 1 × 10⁻⁶.
Figure 16.
Correlations of growth indices (GI) and volume (V) in m3. ‘M’ and ‘P’ denote manually determined and point cloud derived data. PV0—shrink factor of 0, PV03—shrink factor of 0.3. All correlations are significant at α = 1 × 10⁻⁶.
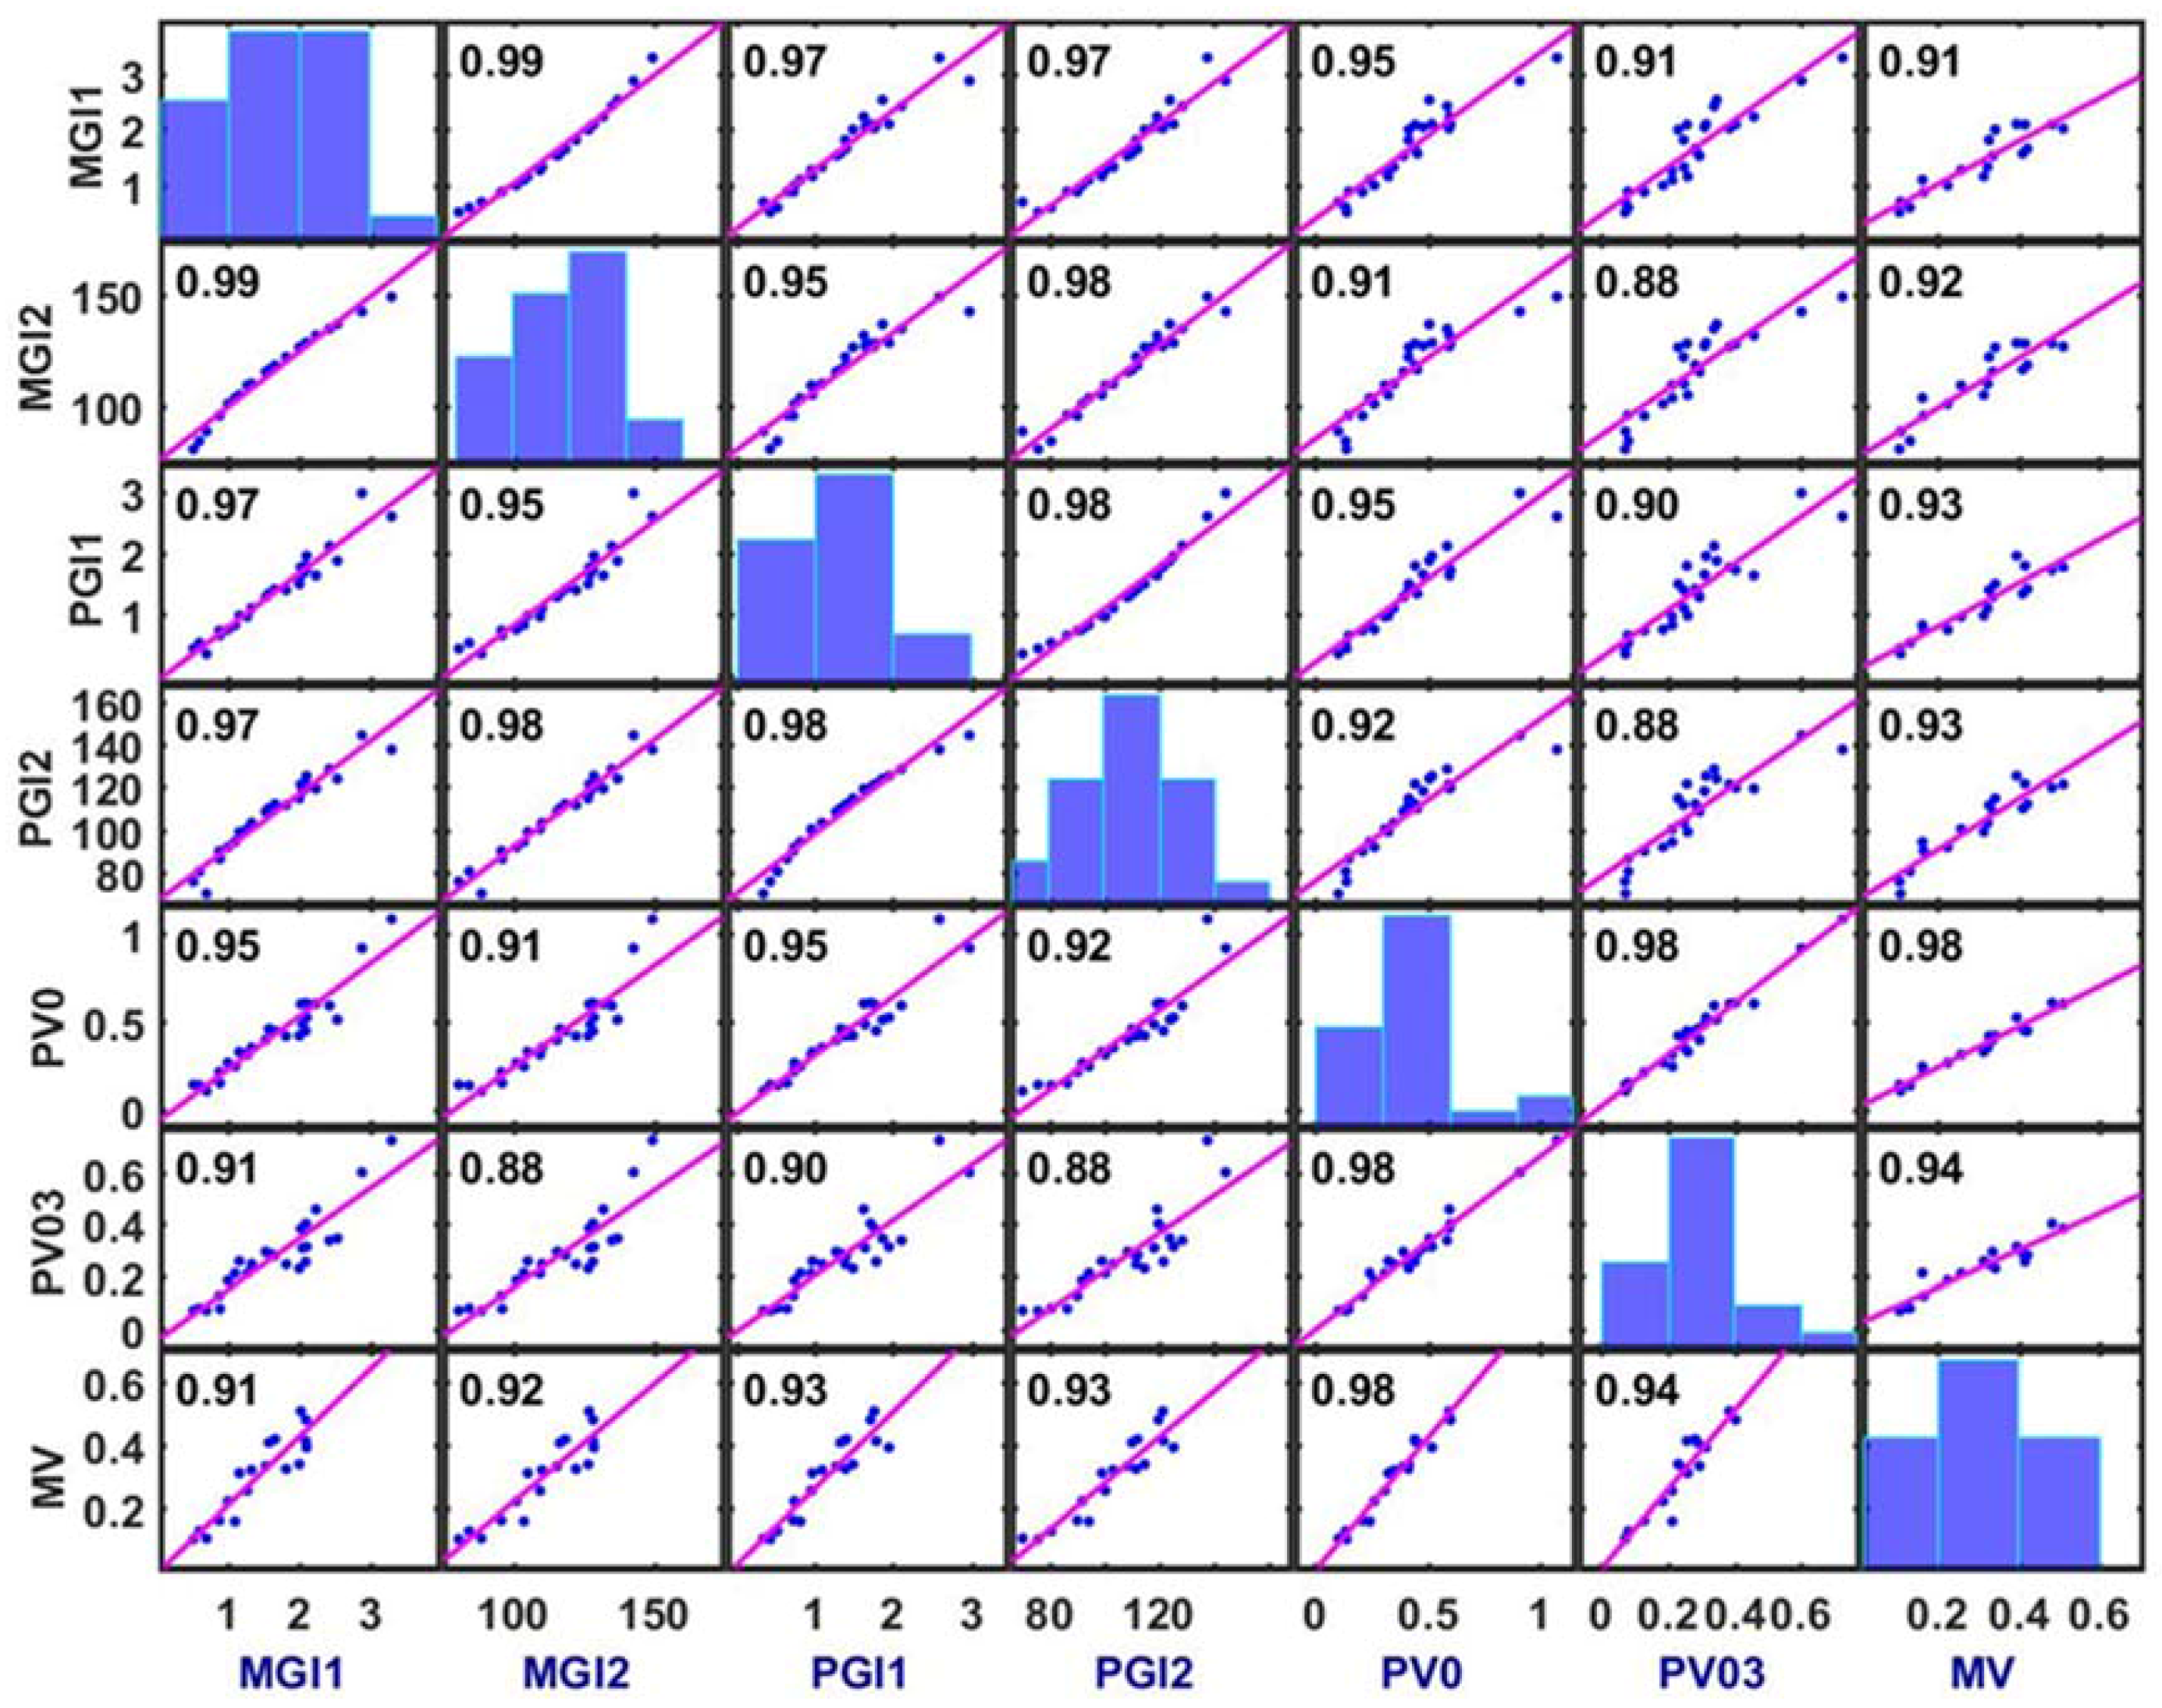
Figure 17.
Commercially grown hedgerow bush scatters with crown and vegetative bounding boxes, base angle, and widths for blockiness calculation shown.
Figure 17.
Commercially grown hedgerow bush scatters with crown and vegetative bounding boxes, base angle, and widths for blockiness calculation shown.
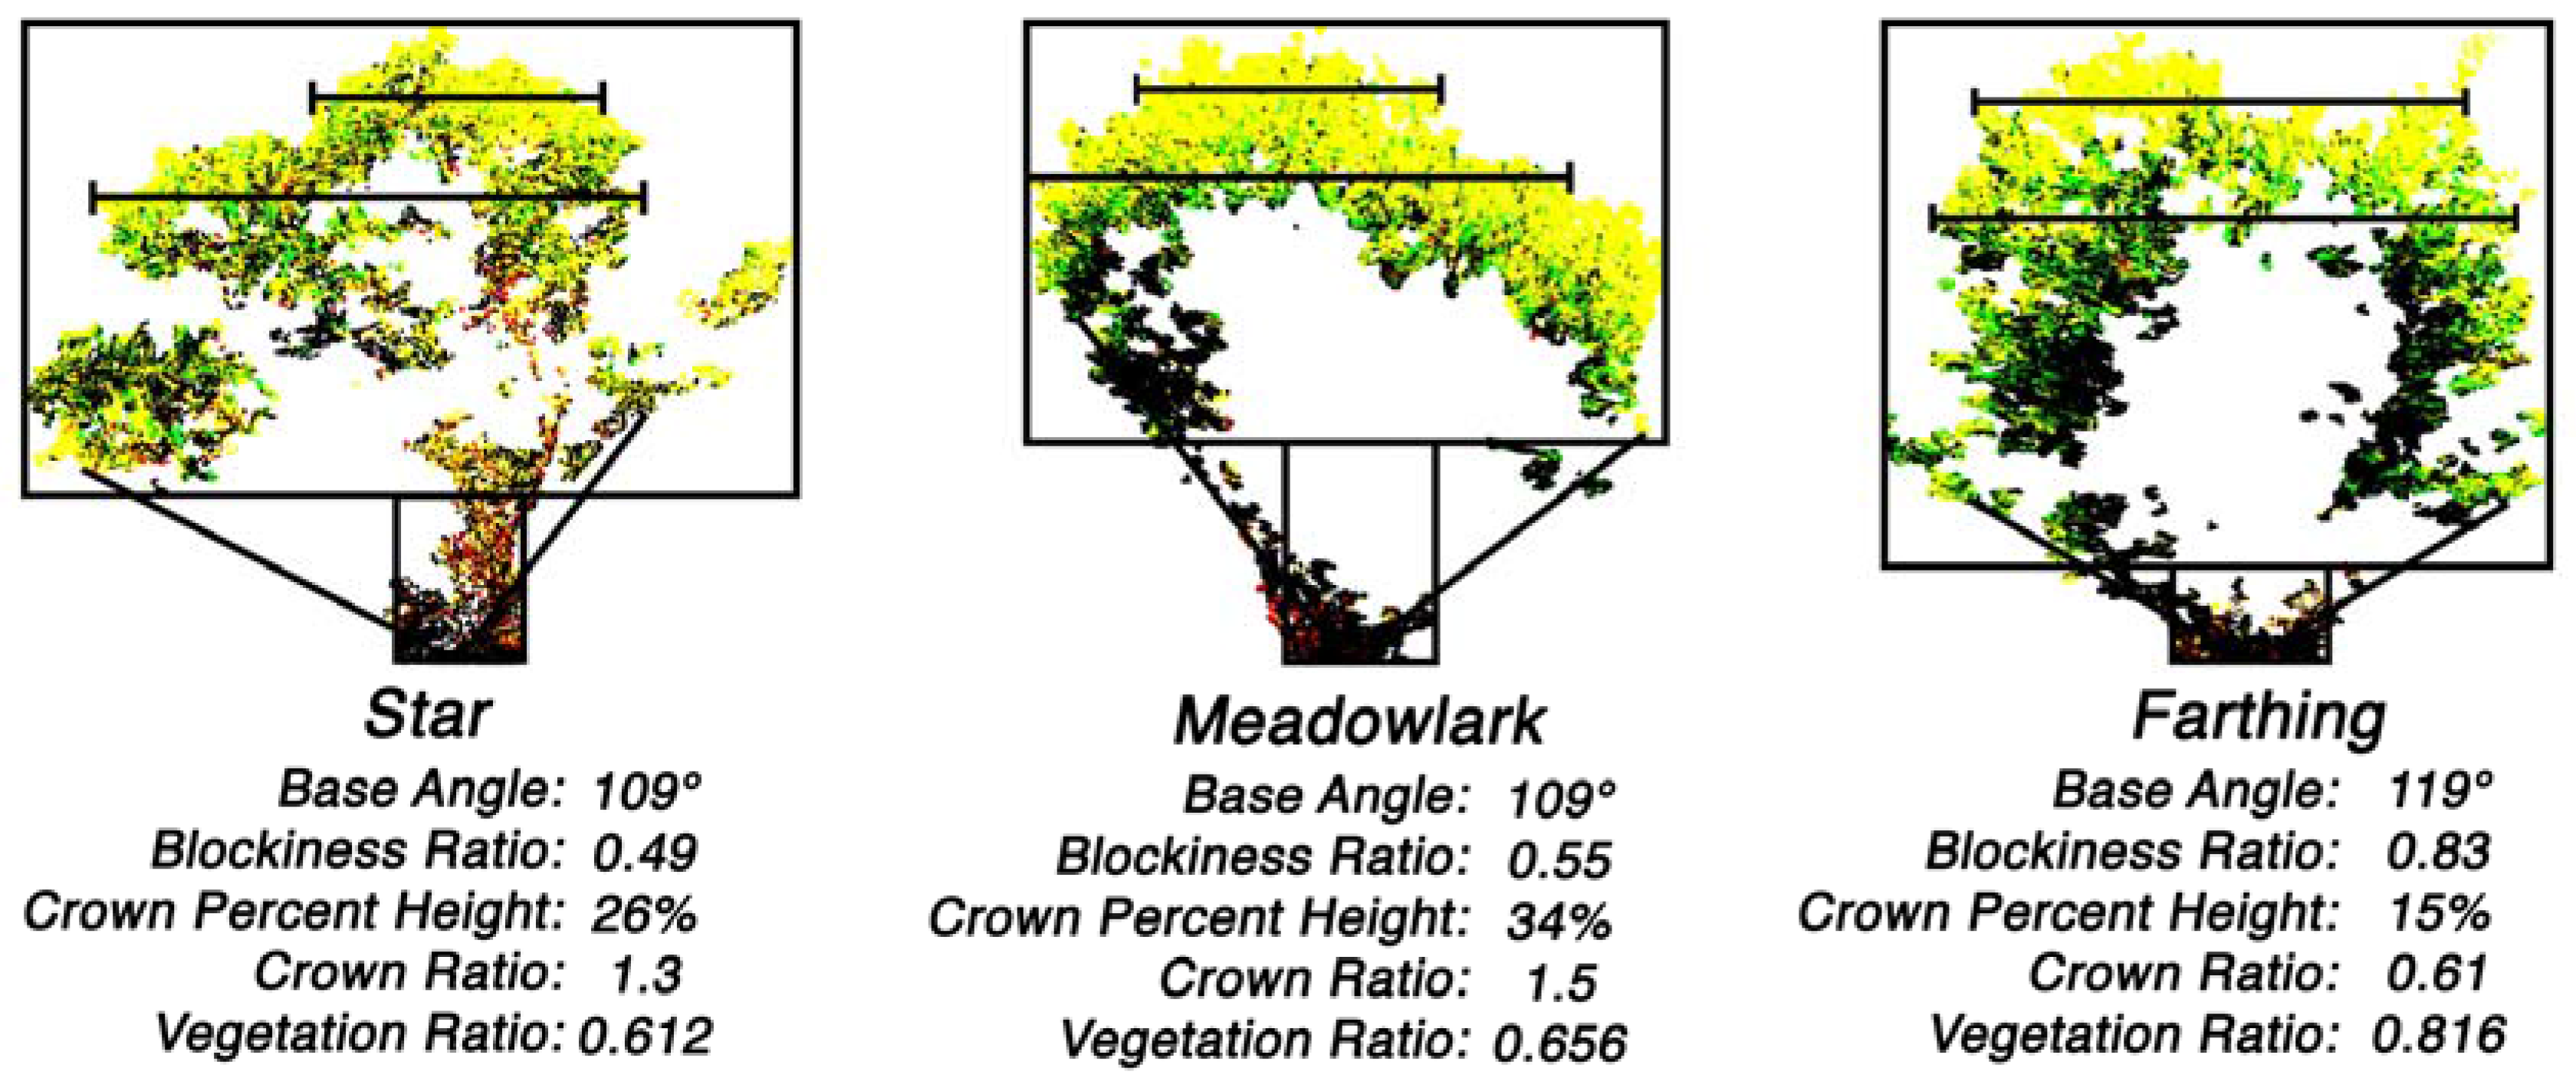
Figure 18.
Boxplots and ANOVA tests of individual shape features (a–e) and Canonical score plot of five shape features combined (f).
Figure 18.
Boxplots and ANOVA tests of individual shape features (a–e) and Canonical score plot of five shape features combined (f).

© 2017 by the authors. Licensee MDPI, Basel, Switzerland. This article is an open access article distributed under the terms and conditions of the Creative Commons Attribution (CC BY) license (http://creativecommons.org/licenses/by/4.0/).
Share and Cite
MDPI and ACS Style
Patrick, A.; Li, C. High Throughput Phenotyping of Blueberry Bush Morphological Traits Using Unmanned Aerial Systems. Remote Sens. 2017, 9, 1250. https://doi.org/10.3390/rs9121250
AMA Style
Patrick A, Li C. High Throughput Phenotyping of Blueberry Bush Morphological Traits Using Unmanned Aerial Systems. Remote Sensing. 2017; 9(12):1250. https://doi.org/10.3390/rs9121250
Chicago/Turabian StylePatrick, Aaron, and Changying Li. 2017. "High Throughput Phenotyping of Blueberry Bush Morphological Traits Using Unmanned Aerial Systems" Remote Sensing 9, no. 12: 1250. https://doi.org/10.3390/rs9121250
Note that from the first issue of 2016, this journal uses article numbers instead of page numbers. See further details here.