Article

Cutbank Geophysics: A New Method for Expanding Magnetic Investigations to the Subsurface Using Magnetic Susceptibility Testing at an Awatixa Hidatsa Village, North Dakota

1
Department of Anthropology and Earth Science, Minnesota State University Moorhead, 1104 7th Avenue South, Moorhead, MN 56563, USA
2
National Park Service, Midwest Archeological Center, 100 Centennial Mall, North, Room 474, Lincoln, NE 68508, USA
3
Metcalf Archaeological Consultants, PO Box 2154, Bismarck, ND 58502, USA
4
Department of Geology, University of Kansas, 1475 Jayhawk Blvd., Lawrence, KS 66045, USA
*
Author to whom correspondence should be addressed.
Remote Sens. 2017, 9(2), 112; https://doi.org/10.3390/rs9020112
Submission received: 30 September 2016 / Revised: 6 January 2017 / Accepted: 20 January 2017 / Published: 28 January 2017
(This article belongs to the Special Issue Archaeological Prospecting and Remote Sensing)

Abstract

:
Magnetic susceptibility investigations were conducted at an Awatixa Hidatsa village (32ME11, also known as Sakakawea Village) along a cutbank at the Knife River Indian Villages National Historic Site (KNRI) in central North Dakota, USA. This extensive exposure provided a superb opportunity to correlate magnetic susceptibility measurements with a variety of subsurface features. These features were visible in the cutbank, and also recorded in cutbank profiles completed in the late 1970s in work supervised by Robert Nickel and Stanley Ahler. The susceptibility studies are part of a larger program of geophysics at KNRI that commenced with pioneering surveys of John Weymouth and Robert Nickel, also in the 1970s, and continued with extensive surface-based magnetic surveys over the interior portion of the site in 2012 by the National Park Service. Our magnetic susceptibility study differs from other geophysical efforts in that measurements were collected from the vertical cutbank, not from the surface, to investigate different feature types within their stratigraphic context and to map small-scale vertical changes in susceptibility. In situ measurements of volume magnetic susceptibility were accomplished on the cutbank at six areas within the village and a control location off-site. Samples were collected for use in soil magnetic studies aimed at providing an understanding of susceptibility contrasts in terms of magnetic mineralogy, grain size, and concentration. Distinctive susceptibility signatures for natural and cultural soils, different feature types, and buried soils, suggest that down-hole susceptibility surveys could be usefully paired with surface-based geophysics and soil magnetic studies to explore interior areas of this and other KNRI sites, mapping vertical and horizontal site limits, activity areas, features, and perhaps even earlier occupations. This study showcases the potential of cutbank studies for future geophysical survey design and interpretation, and also underscores the importance of information gained through pioneering studies of the past.

Graphical Abstract

1. Introduction

Cutbank geophysics, a term coined for geophysical surveys conducted on the vertical bank of a river, afford a novel approach for mapping subsurface cultural remains that can usefully extend more-traditional geophysical surveys of a site. At-surface geophysical surveys are used to identify and analyze archaeological remains on a broad scale decreasing the need for labor-intensive and expensive excavations. These surface-based approaches, however, may require targeted subsurface sampling (i.e., coring and/or excavation) for correct interpretation and to obtain additional information not available through the surface measurements. Subsurface geophysical investigations can be used to improve both geophysical and archaeological interpretations. Such comparisons can also provide information necessary for extrapolation to other areas of the site or to similar sites and environments. Bevan [1] provides a detailed consideration of the use of geophysical surveys on excavated surfaces, key advantages of which are the detection of thin and small features at depth and less interference from surrounding deposits. These subsurface geophysical studies can be used to understand exposed features as well as to reveal features invisible to the excavator. Subsurface geophysical surveys, however, have generally been conducted in conjunction with controlled excavations (e.g., [1,2]) or utilized small-diameter corers coupled with down-hole geophysical sensors (e.g., [3]) and thus have not provided broad access to buried cultural features made possible through a cutbank geophysical approach.
Magnetic surveys, one of the most common surface-based geophysical methods employed at archaeological sites, have proven successful in detecting and delineating both historic and prehistoric features [4,5]. Magnetic surveys, however, may not supply the detail desired on the dimensions or depth of an archaeological feature, its magnetic susceptibility and remanence, or internal variation. Subsurface magnetic susceptibility surveys can be used to complement surface-based magnetic surveys in addressing these issues.
Magnetic susceptibility, the ratio of the magnetization induced in a sample to the inducing (magnetizing) field [6], allows an assessment of the concentration of magnetic minerals in subsurface soils and sediments. Magnetic susceptibility measurements are of archaeological importance because magnetic mineralogy is directly modified by human occupation. Humans influence magnetic mineralogy by increasing organic matter and altering properties such as soil temperature, soil chemistry, and soil porosity [7]. They expose soils to high temperatures through burning, and incorporate fired or other high susceptibility materials into the soil matrix. They redistribute soils and sediments through earthmoving activities. Soils from archaeological sites often exhibit enhanced magnetic susceptibilities over surrounding non-site soils [8,9], and within sites susceptibility contrasts may also be observed between different features, activity areas, or occupation layers. Susceptibility studies thus yield information on the dynamics of archaeological terrains.
The current study involves taking advantage of more than 200 m of the Sakakawea Village site (32ME11) exposed along the bank of the Knife River (Figure 1). Though cutbanks threaten to destroy sites, they also provide an opportunity, and one that has not been utilized to date, to enhance geophysical studies without involving additional invasive excavation. Cutbank exposures provide a crucial means of mapping changes in geophysical properties with depth, in this case both gradual and abrupt changes in magnetic susceptibility with a resolution of 1–2 cm, even at depths of 1 m or greater. The ability to resolve very thin and small archaeological features at depth is one that is critical in archaeology. Archaeologists, at least those that work on many prehistoric sites, by necessity work at a very different scale in terms of depth and resolution from that common in many other remote sensing applications. The cutbank exposure also allowed direct correlation with site stratigraphy and permitted sampling for soil magnetic studies to enhance the interpretation of the magnetic susceptibility signal. Geophysical and soil magnetic studies along the cutbank provide data complimentary to surface-based magnetic surveys that will allow us to better map, image, and interpret subsurface features at this and similar sites in the future.
The Sakakawea Village, an Awatixa Hidatsa fortified village occupied in the early part of the 19th century, is located within the Knife River Indian Villages National Historic Site (KNRI) in North Dakota. KNRI was established in 1974 to “…preserve, protect, and interpret archeological and natural resources as they relate to cultural and agricultural lifestyles of the Northern Great Plains Indian peoples, and to conduct research to further understand how those lifestyles changed over time” [10]. The enabling park legislation clearly defines in situ preservation, research, and interpretation as a core part of the park’s mission. Excavations are generally targeted and at smaller scales than other types of archaeological investigations, thereby limiting access to wider exposures of buried archaeological features. Working within this framework requires researchers to generate information by utilizing non-invasive technologies or techniques that require less ground disturbance.
After creation of the park, arresting the movement of the Knife River and the erosion of significant archaeological materials from the cutbank became a priority. One of the first preservation actions taken by the park was to stabilize the bank at Sakakawea Village utilizing stone rip-rap and earth to create an artificial berm along the toe of the slope. This effort began in 1976 and was completed in cooperation with the U.S. Army Corps of Engineers by the summer of 1979 [11] (p. 2). Because the stabilization was placed at the toe of the slope, however, and does not extend to the top of the bank, erosional processes continue to act on the unprotected upper section of the former cutbank leaving cultural deposits in a few areas at the top 1.5 m of bank exposed. Addressing the ongoing loss of archaeological materials at Sakakawea Village is part of a comprehensive adaptive management strategy being developed by the park to identify and mitigate archaeological resource loss [12].
Surface-based magnetic surveys were conducted within the interior portion of the Sakakawea Village and magnetic susceptibility measurements and samples were collected along the cutbank. The surface-based magnetic studies were designed to build upon the pioneering remote sensing work completed at KNRI in the 1970s and 1980s [13,14,15]. This included both new surveys as well as a re-examination of the 1970s magnetic data. The original dataset that was collected by Weymouth was re-processed using modern software and then compared to the current surveys to identify subsurface features that have changed or were not previously detected 30 years ago. Magnetic susceptibility techniques were tested on a range of exposed feature types as a compliment to the surface-based surveys. The goals of the magnetic susceptibility study were exploratory in nature, directed toward providing quantitative information useful for improving the effectiveness of geophysical techniques at the site, especially in areas interior from the bank, but also to gather information on the unprotected and eroding upper section of the cutbank. To this end, we built a catalogue of susceptibility contrasts and signatures on a range of deposits at various locations and depths both on- and off-site. Detailed soil magnetic studies were applied to refine our understanding of the susceptibility signal and to provide information on formation processes and magnetic enhancement in the local environment.

2. Materials and Methods

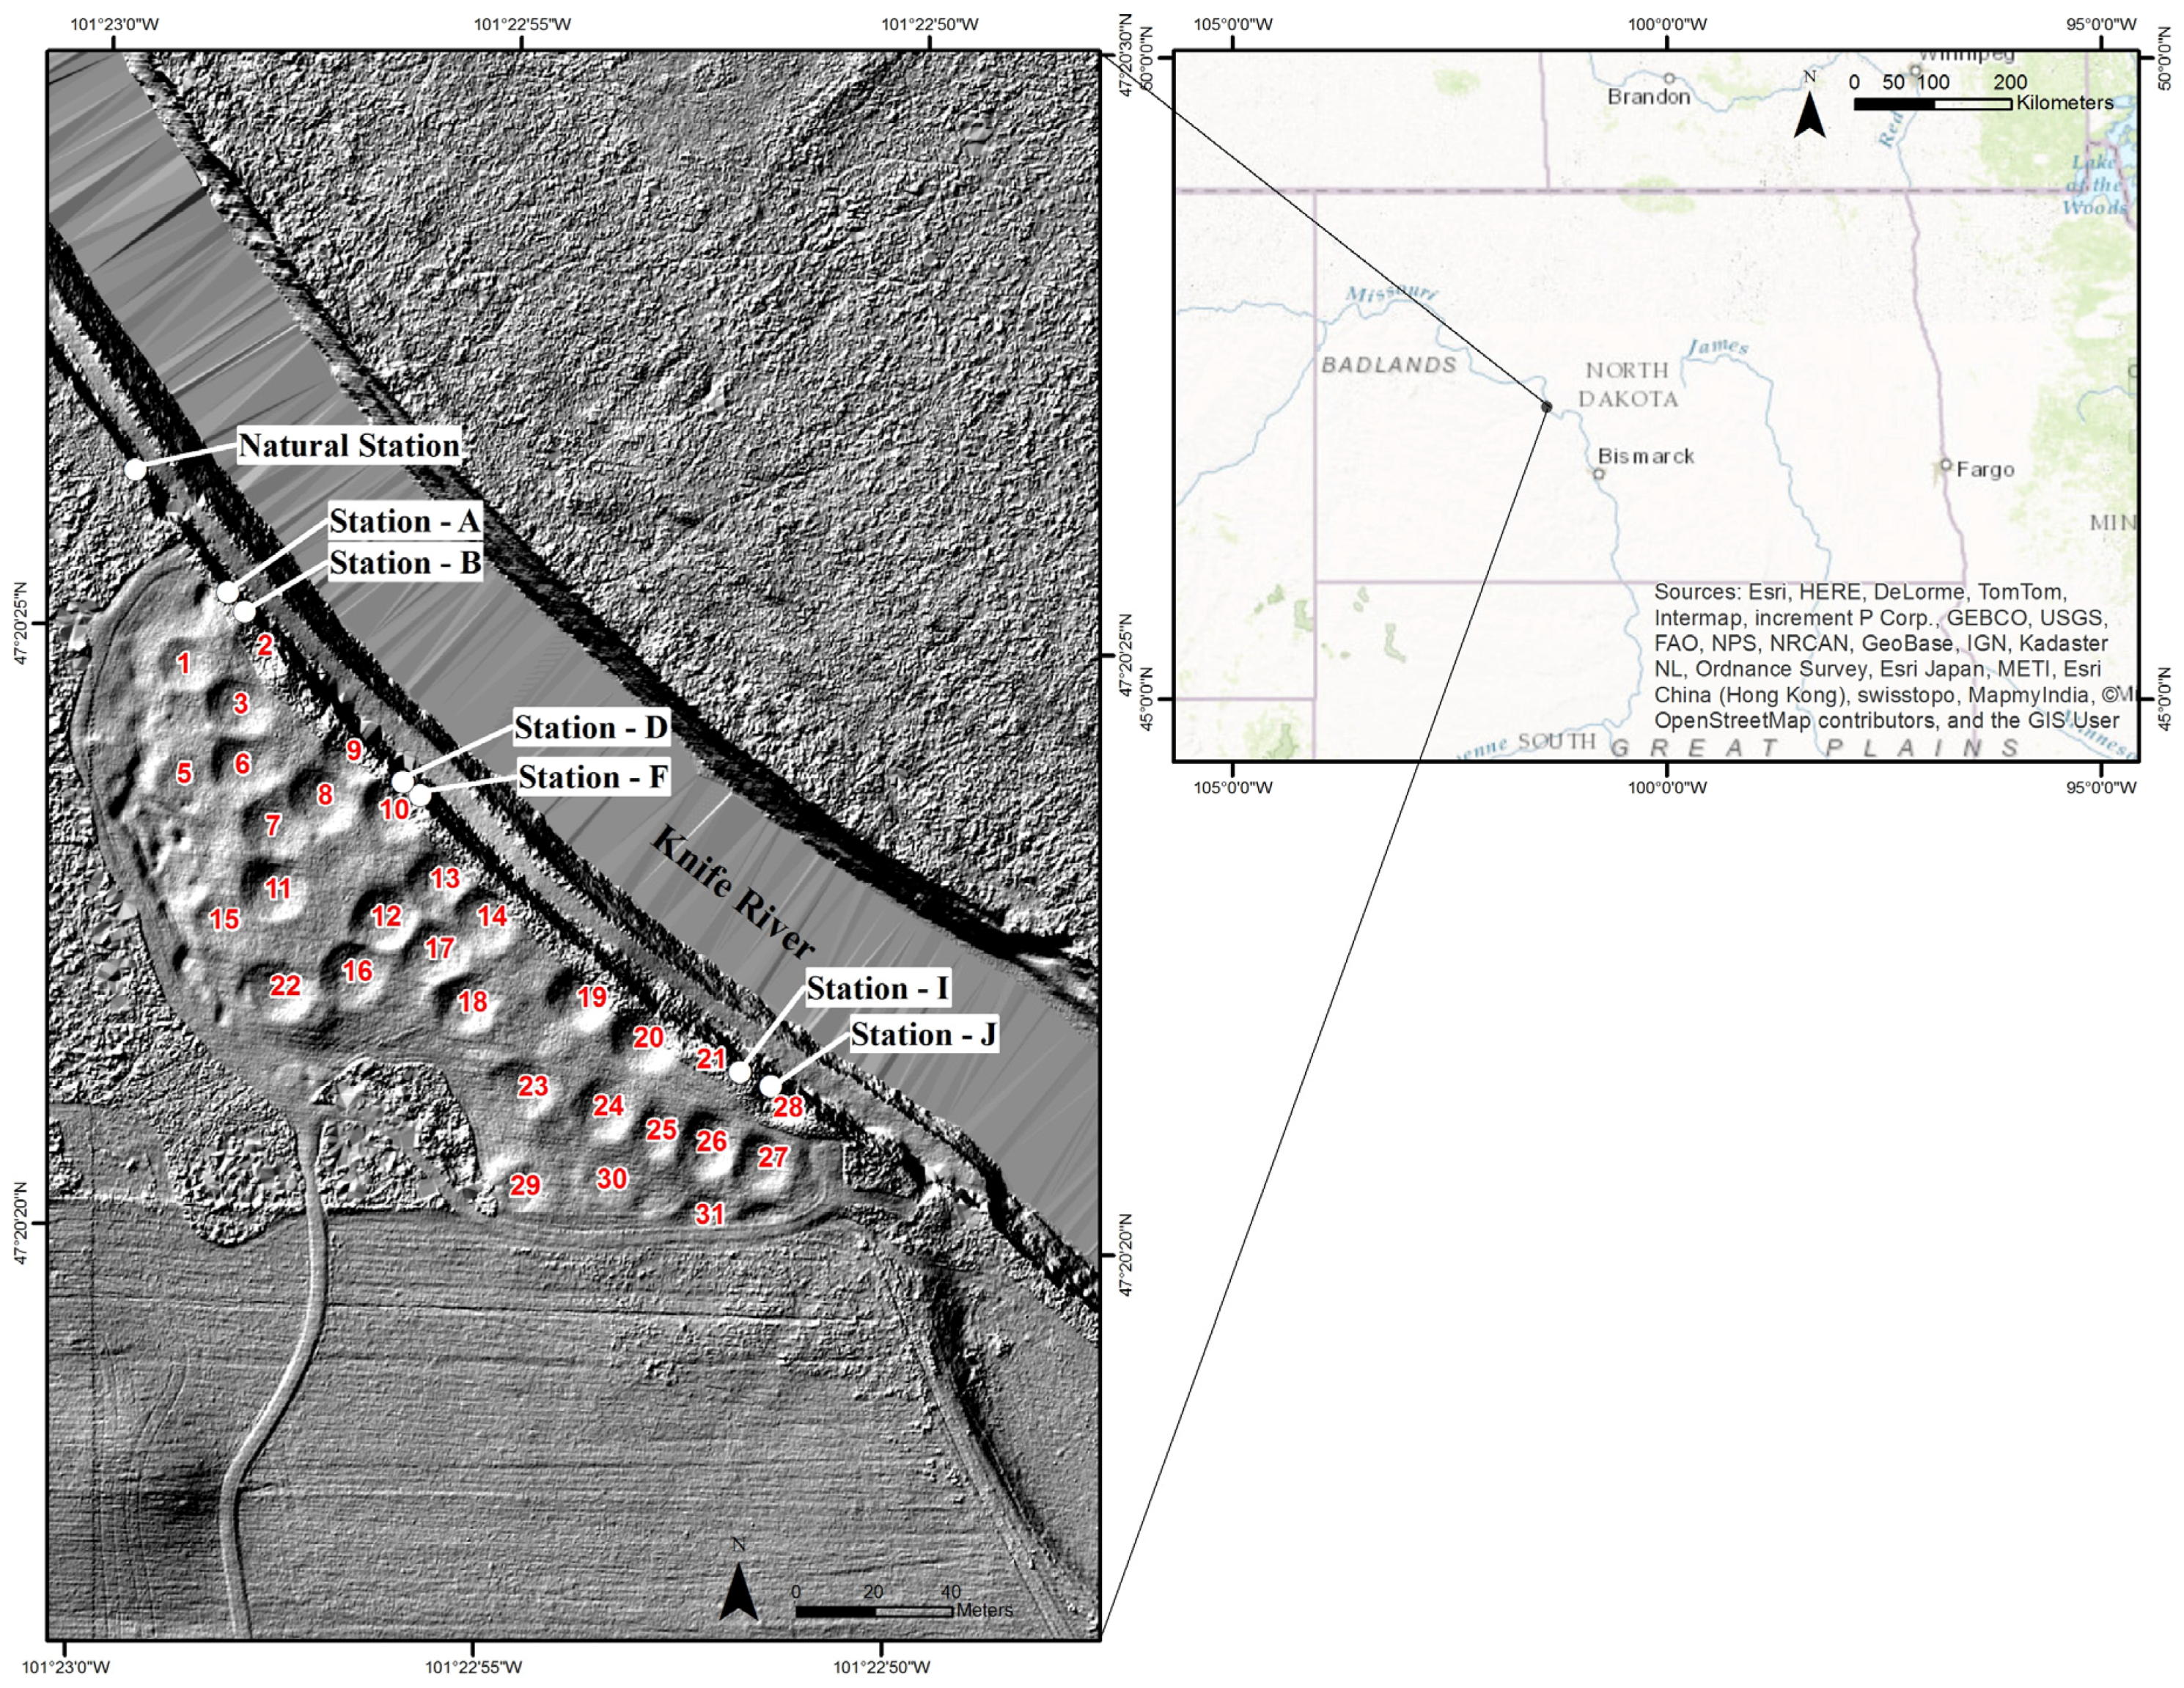
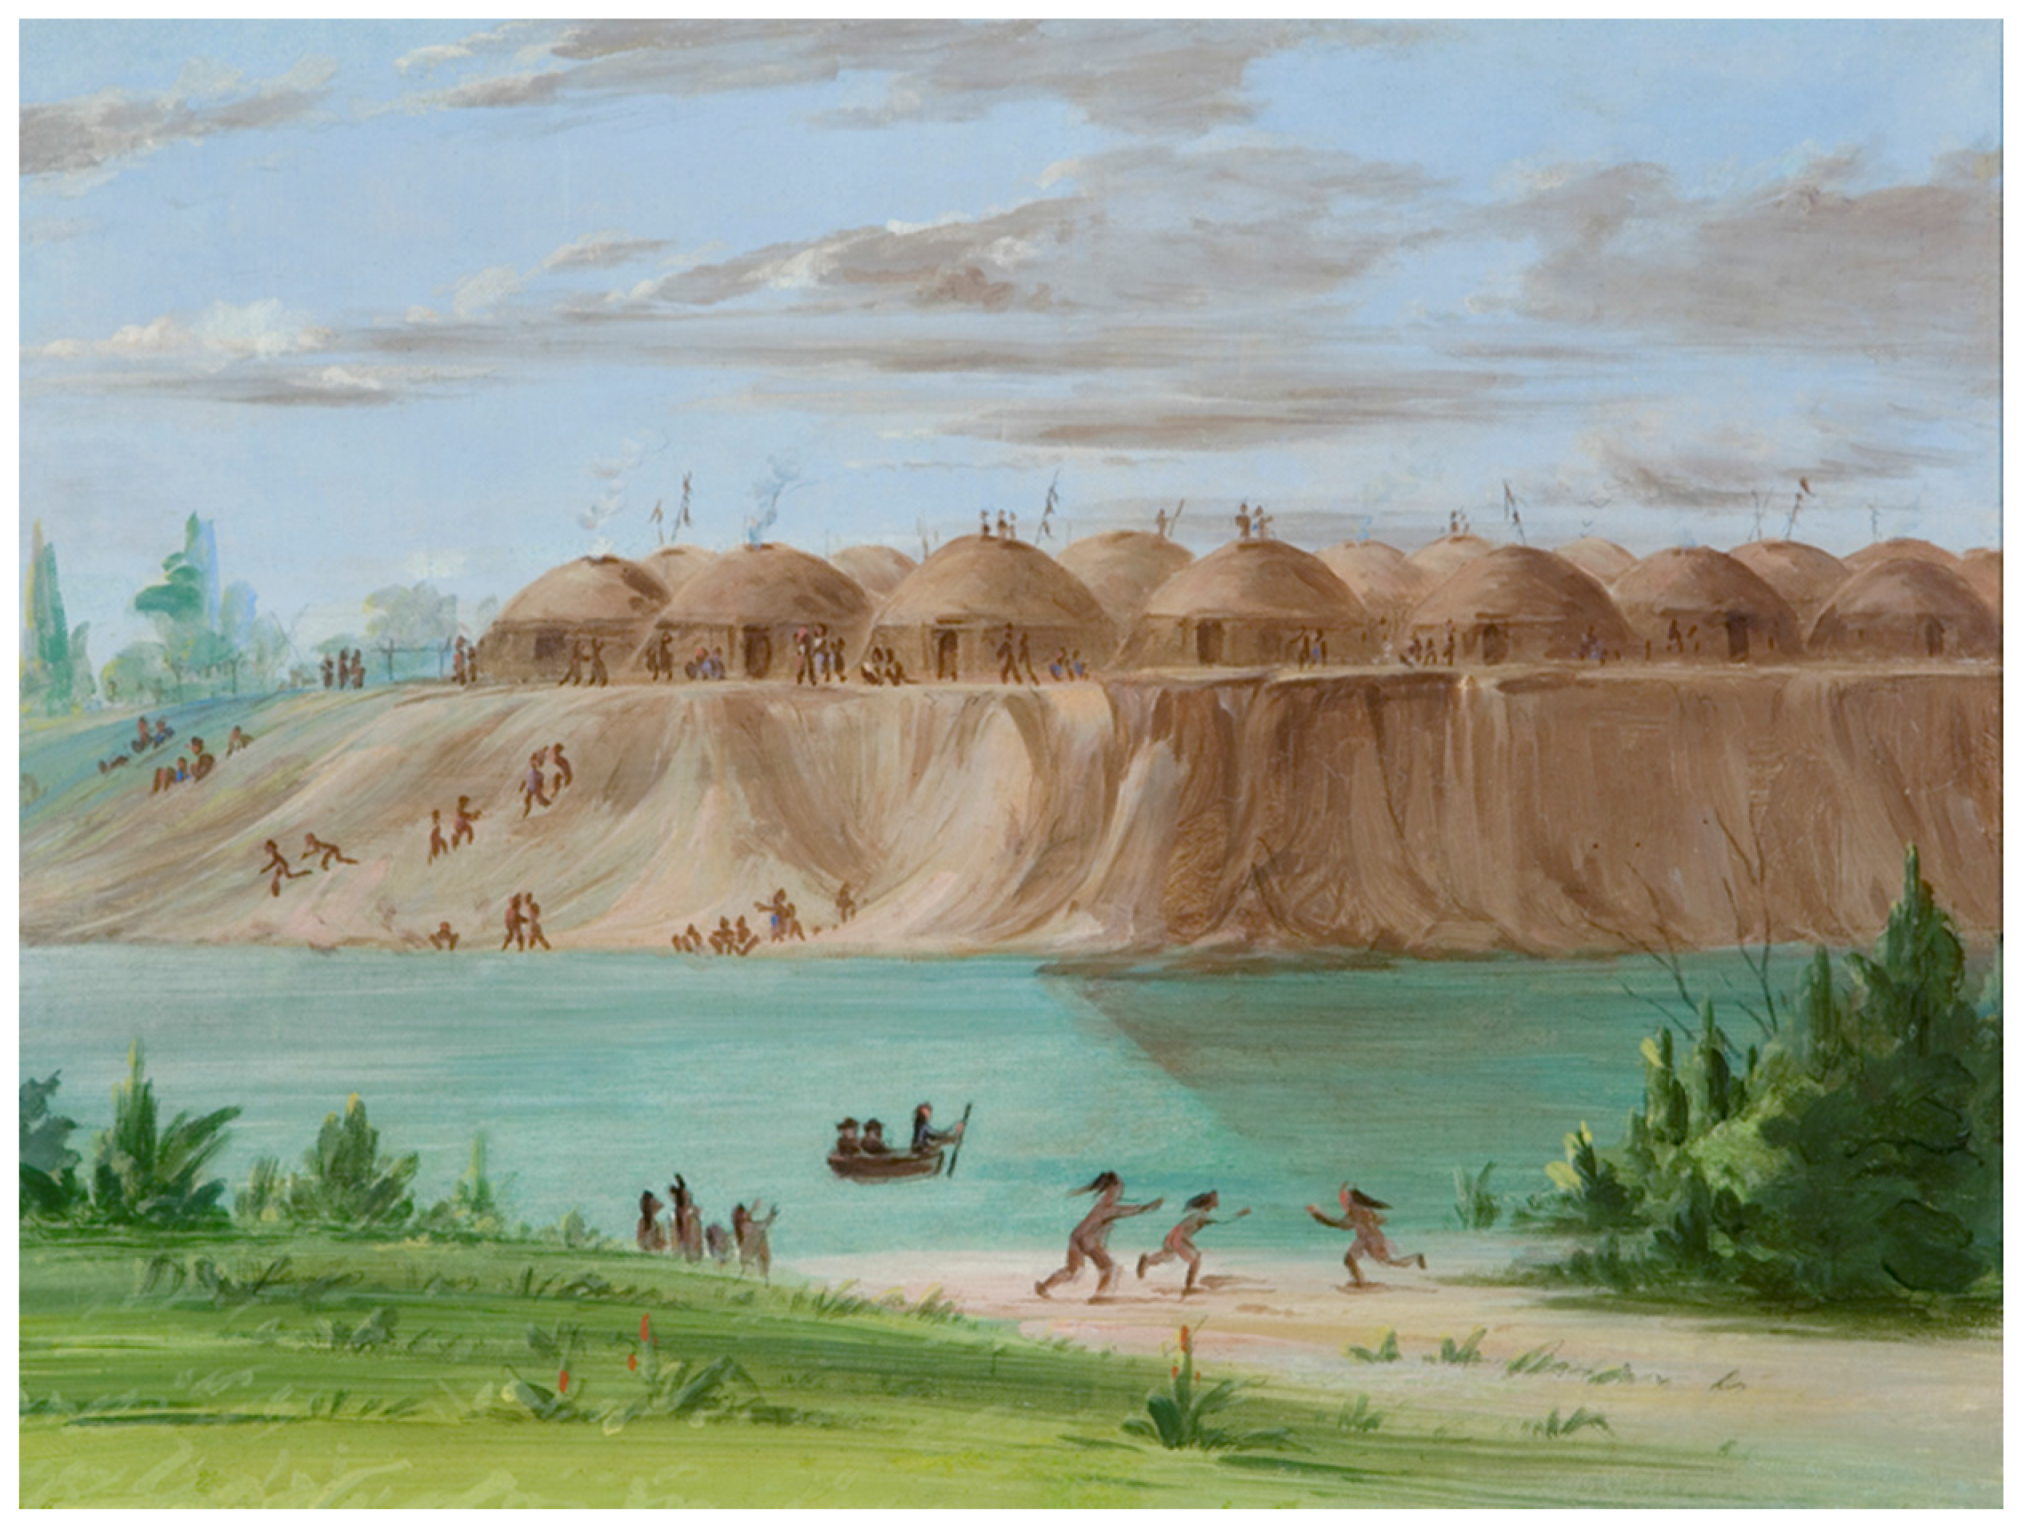
2.1. Awatixa Hidatsa and the Sakakawea Village

When first encountered by European fur traders and explorers in the late 18th century, the Awatixa Hidatsa had a well-established group identity as one of the original Hidatsa sub-groups to occupy the Missouri River trench. There is general agreement on the existence of three separate sub-groups of Hidatsa that lived in individual villages at the mouth of the Knife River [16,17,18]. Each sub-group has a unique origin tradition, historic trajectory, and occupational sequence. The Awatixa Hidatsa are generally considered the longest residents at the Knife River/Missouri confluence [11]. Today, the Awatixa Hidatsa are part of the Mandan, Hidatsa, Arikara Nation (MHA Nation) at the Fort Berthold Reservation located 35 miles upriver from KNRI.
Lewis and Clark and the Corps of Discovery visited the Hidatsa villages in the fall of 1804 and mention the inhabitants, including Sakakawea Village, living at the mouth of the Knife River [19]. With the arrival of the Corps of Discovery in 1804 we have the first unambiguous reference to the Hidatsa living at Sakakawea Village [11,19]. This places the date of initial occupation at Sakakawea Village sometime between 1797 and 1804.
In 1832, George Catlin visited the Hidatsa Villages at Knife River. During his time on the Upper Missouri, Catlin produced an invaluable set of paintings, sketches, and observations of people on the northern Great Plains. One of his paintings depicts a vibrant village life at the Sakakawea Village and the cutbank along the river (Figure 2). The village is situated immediately above and in close-proximity to the river.
Abandonment of the village came during a time of great catastrophe for the Hidatsa people. Smallpox and other diseases had been a scourge upon the peoples of the upper Missouri River from at least the 18th century if not as early as the 16th century [20,21]. The Sakakawea Village was abandoned by 1837 and in 1845 all bands of the Hidatsa moved from the KNRI area upriver to the area that would later become the Fort Berthold reservation [22,23].
The Sakakawea Village, previously considered part of the Knife River Phase (1780–1845) of the Post-Contact Coalescent or Disorganized Coalescent Tradition [24], has more recently been designated the Knife River Complex with four separate phases [25,26]. The Hidatsa are part of the Northern Plains lifeway focused on growing staple crops—maize, beans, and squash, hunted bison, lived in compact fortified villages made up of anywhere from 20 to 100 circular earthlodges that used four main support posts.

2.2. Previous Site Investigations

Prior to the creation of the park, the Sakakawea Village and other KNRI sites were known to collectors, some of who accumulated sizable accumulations of artifacts [27] (p. 45). Test excavations along the Sakakawea Village cutbank in 1965 [24] provided information useful in the creation of the Knife River Indian Villages National Historic Site. In the “Research Plan” developed for the park, the erosion issue at Sakakawea was listed as the top threat to preservation of resources at the park [28] (p. 39). The period following establishment of KNRI in 1974 thus included pioneering archaeological and geophysical work [11,15,29] conducted as part of mitigation efforts designed to protect the rapidly eroding Sakakawea Village cutbank. Comparing topographic maps made in 1911 and 1977 showed that at least 15%–20% of the site had been lost to cutbank erosion, which included six complete houses [11] (p. 23).
Extensive magnetic data was collected over the interior portions of the site during the late 1970s and early 1980s by John Weymouth and Robert Nickel using two proton-precession magnetometers [13,15]. One magnetometer remained in the same position functioning as a base station. They collected the data in 20 m by 20 m grids, with a 1 m line spacing and 1 m sampling rate. This work was one of the earliest successful applications of non-invasive magnetic surveying at a North American archaeological site. Figure 3 presents a map of the magnetic data that was collected, which clearly shows the locations of previous earthlodge, as well as the hearths located within the earthlodge interiors [13].
Archaeological studies included extensive profiling of the cutbank over three field seasons, resulting in detailed stratigraphic profiles of about 76% (175 m) of this approximately 230 m long, 9 m high cutbank being recorded (Figure 4). The cutbank was profiled in 10 sections (Units 1–10), with one of these sections (Unit 10) capturing a natural profile outside the northwestern margins of the site. All three seasons of work are summarized in a 1980 report by Stanley Ahler and others [11]. The magnetometer surveys and detailed stratigraphic profiles generated almost 40 years ago have served an important role in our research, as will be detailed below.

2.3. Current Investigations

In 2012, KNRI began a new program of geophysical investigations within the park. Multi-instrument geophysical surveys were conducted at the primary village sites to (1) build upon the pioneering geophysical surveys completed at KNRI in the 1970s and 1980s, and to (2) employ new techniques, such as magnetic susceptibility and LiDAR, to document archaeological resources across the park.
Like our colleagues in the 1970s, we decided to take advantage of the cutbank exposure and use this “fortuitous” transect through the village. Using the 1970s bank profile data, we selected 6 locations (Stations A, B, D, F, J, and I) within the village to capture a range of exposed features, both inside and outside houses, as well as a control, or background station (Natural Station) outside the village (Figure 1). The so-called “Natural Station” was located near (approximately 10 m south of) Unit 10 and approximately 25 m northwest of the Sakakawea site [11] (pp. 41, 43). Station I and J were located at the SE edge of the site within the cutbank unit (Unit 1) profiled in 1976 that encompassed House 28 [11] (p. 31). Station J is inside the house and Station I sampled midden deposits northwest of the house. Cultural deposits within the house margin are 35 cm thick, which is relatively thin compared to the almost 1.5 m thick deposits outside the house. On both the southeast and northwest edges of the house there are areas of complex, horizontally layered midden (made of interbedded roofwash, dirt, refuse, ash, and burned earth), likely accumulated as a result of occupation of House 28 and neighboring houses [11] (pp. 30–33, 57–60). Stations D and F are both within the cutbank profile (Unit 6) that encompassed House 10 and its associated middens [11] (p. 38). Station D is located on the north margins and Station F is on the east margins of the house. Like House 28, the cultural deposits within House 10 are much thinner than the midden deposits outside. Stations A and B sampled thermal features on the northwest edge of the site.

2.3.1. Surface-Based Magnetic Surveys

In 2012 magnetic surveys were conducted across the interior portion of the Sakakawea Village site using a dual fluxgate gradiometer. Data was collected in 20 m by 20 m grids with a line spacing of 1 m and a 0.125 m sampling rate. The data was processed in Geoplot using a zero mean transverse and low pass filter, and then interpolated.
In addition, the magnetic data collected by John Weymouth and Robert Nickel in the 1970s was reformatted and reprocessed using modern day software. The same processing steps as used for the current data were then applied. Unfortunately, not all of the data Weymouth and Nickel collected was able to be recovered and so a portion of the data from the southern part of the Sakakawea Village is missing.

2.3.2. In Situ Measurements of Magnetic Susceptibility

In situ measurements of volume magnetic susceptibility on the cutbank were accomplished using a Bartington MS2 meter and MS2K sensor controlled by a laptop computer and Multisus Fieldpro software (Figure 5). The laptop and operator were positioned on top of the bank while another person faced the cutbank, taking readings at 2 cm increments down the profile. Vertical profiles of susceptibility were accomplished at the Natural Station and at five of the six stations within the village (in situ measurements were not recorded at Station J). At Station A, two vertical profiles were completed to sample both red and black portions of a thermal feature that was located approximately halfway down the profile.

2.3.3. Sample Collection and Basic Magnetic Susceptibility Reconnaissance

Soil samples were collected from the cutbank for two different purposes: (1) to obtain soils for magnetic measurements in the laboratory; and/or (2) to allow hand-texturing and soil color determinations in the lab. Samples for soil magnetic measurements in the laboratory were obtained using two different techniques. At some stations, an aluminum sampling tube was pounded into the bank using a rubber mallet. The soil from the tube was then extruded directly into the small, non-magnetic Althor P15 (5.28 cc) boxes used in laboratory soil magnetic measurements. At other locations, the Althor P15 boxes were packed in the laboratory from bulk soil samples collected in 7.5 × 12.5 cm plastic bags. Bulk samples were collected by stratigraphic levels if those had been recorded; if not, samples were collected by arbitrary 10 cm levels. Prior to packing the soil magnetic samples, the samples were first dried and non-soil content (bone, charcoal, etc.) was removed and recorded. Ninety-nine P15 boxes and 68 bulk samples were collected in the field, with an additional 26 boxes packed in the lab from the bulk samples for a total of 125 P15 boxes.
A basic soil magnetic reconnaissance was conducted on all 125 samples. A Bartington MS2B sensor with a counter and customized computer interface was used to measure the magnetic susceptibility, both mass (χ) and volume (κ) specific and the frequency dependence of susceptibility for each boxed sample. The frequency dependence of susceptibility (χfd) is the percent difference in susceptibility measured at two frequencies (approximately 460 Hz and 4600 Hz). Measurement of χfd is used to investigate the contribution of superparmagnetic (SP, i.e., ultrafine) magnetic grains as these show the most pronounced frequency dependence of susceptibility (due to their delayed response to the magnetizing field).

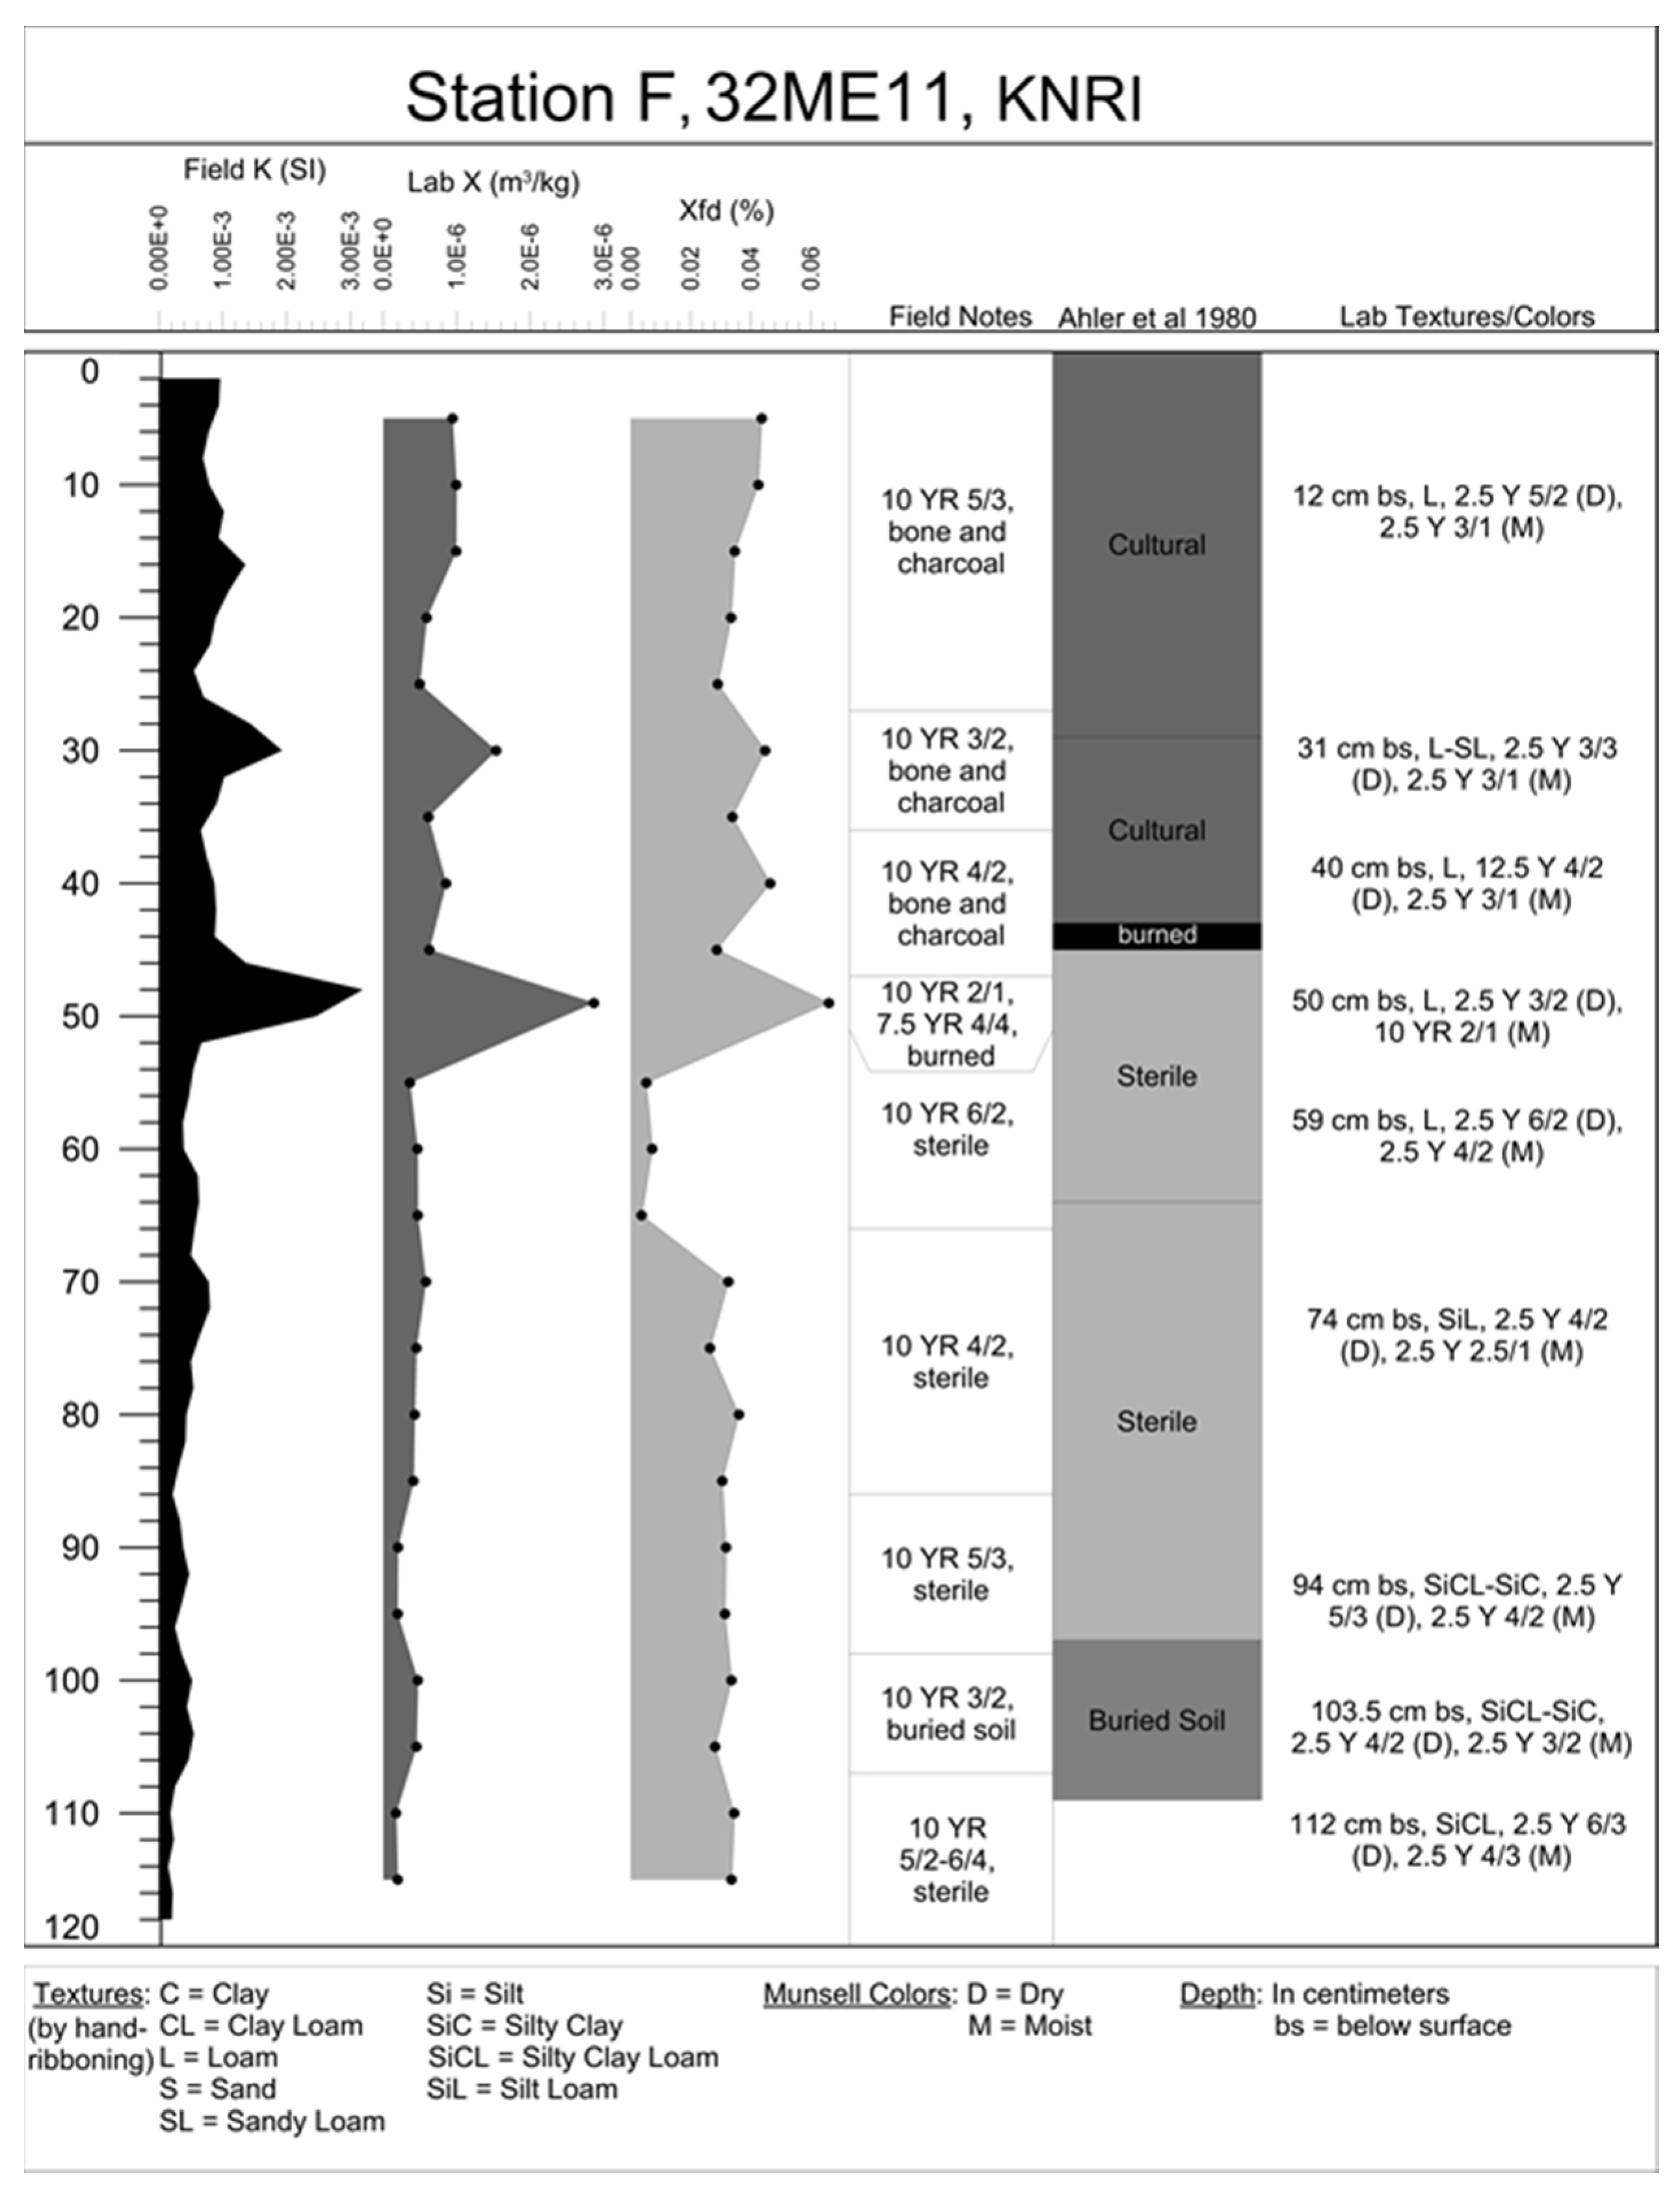
2.3.4. Stratigraphic Information

At 5 of the 7 stations, including the control (Natural) station outside the village, brief stratigraphic descriptions were completed (due to time constraints, Station B and Station D were not described in the field). To supplement the field descriptions, bulk samples were collected from 6 of the 7 stations as described above. These samples were hand-textured in the lab using the ribbon method, and both wet and dry Munsell colors were recorded.
While on site, we also visited the KNRI archives to access detailed stratigraphic profiles that were prepared in the 1970s. These, along with the generalized profiles and descriptions provided in Ahler et al., 1980, were used to supplement our descriptions. In most cases there was sufficient correlation in stratigraphic features that the 1970s descriptions could be employed to provide valuable context for interpretation of the soil magnetic results, an extremely important benefit as the cost of completing even a brief description of the entire cutbank would have been prohibitive.

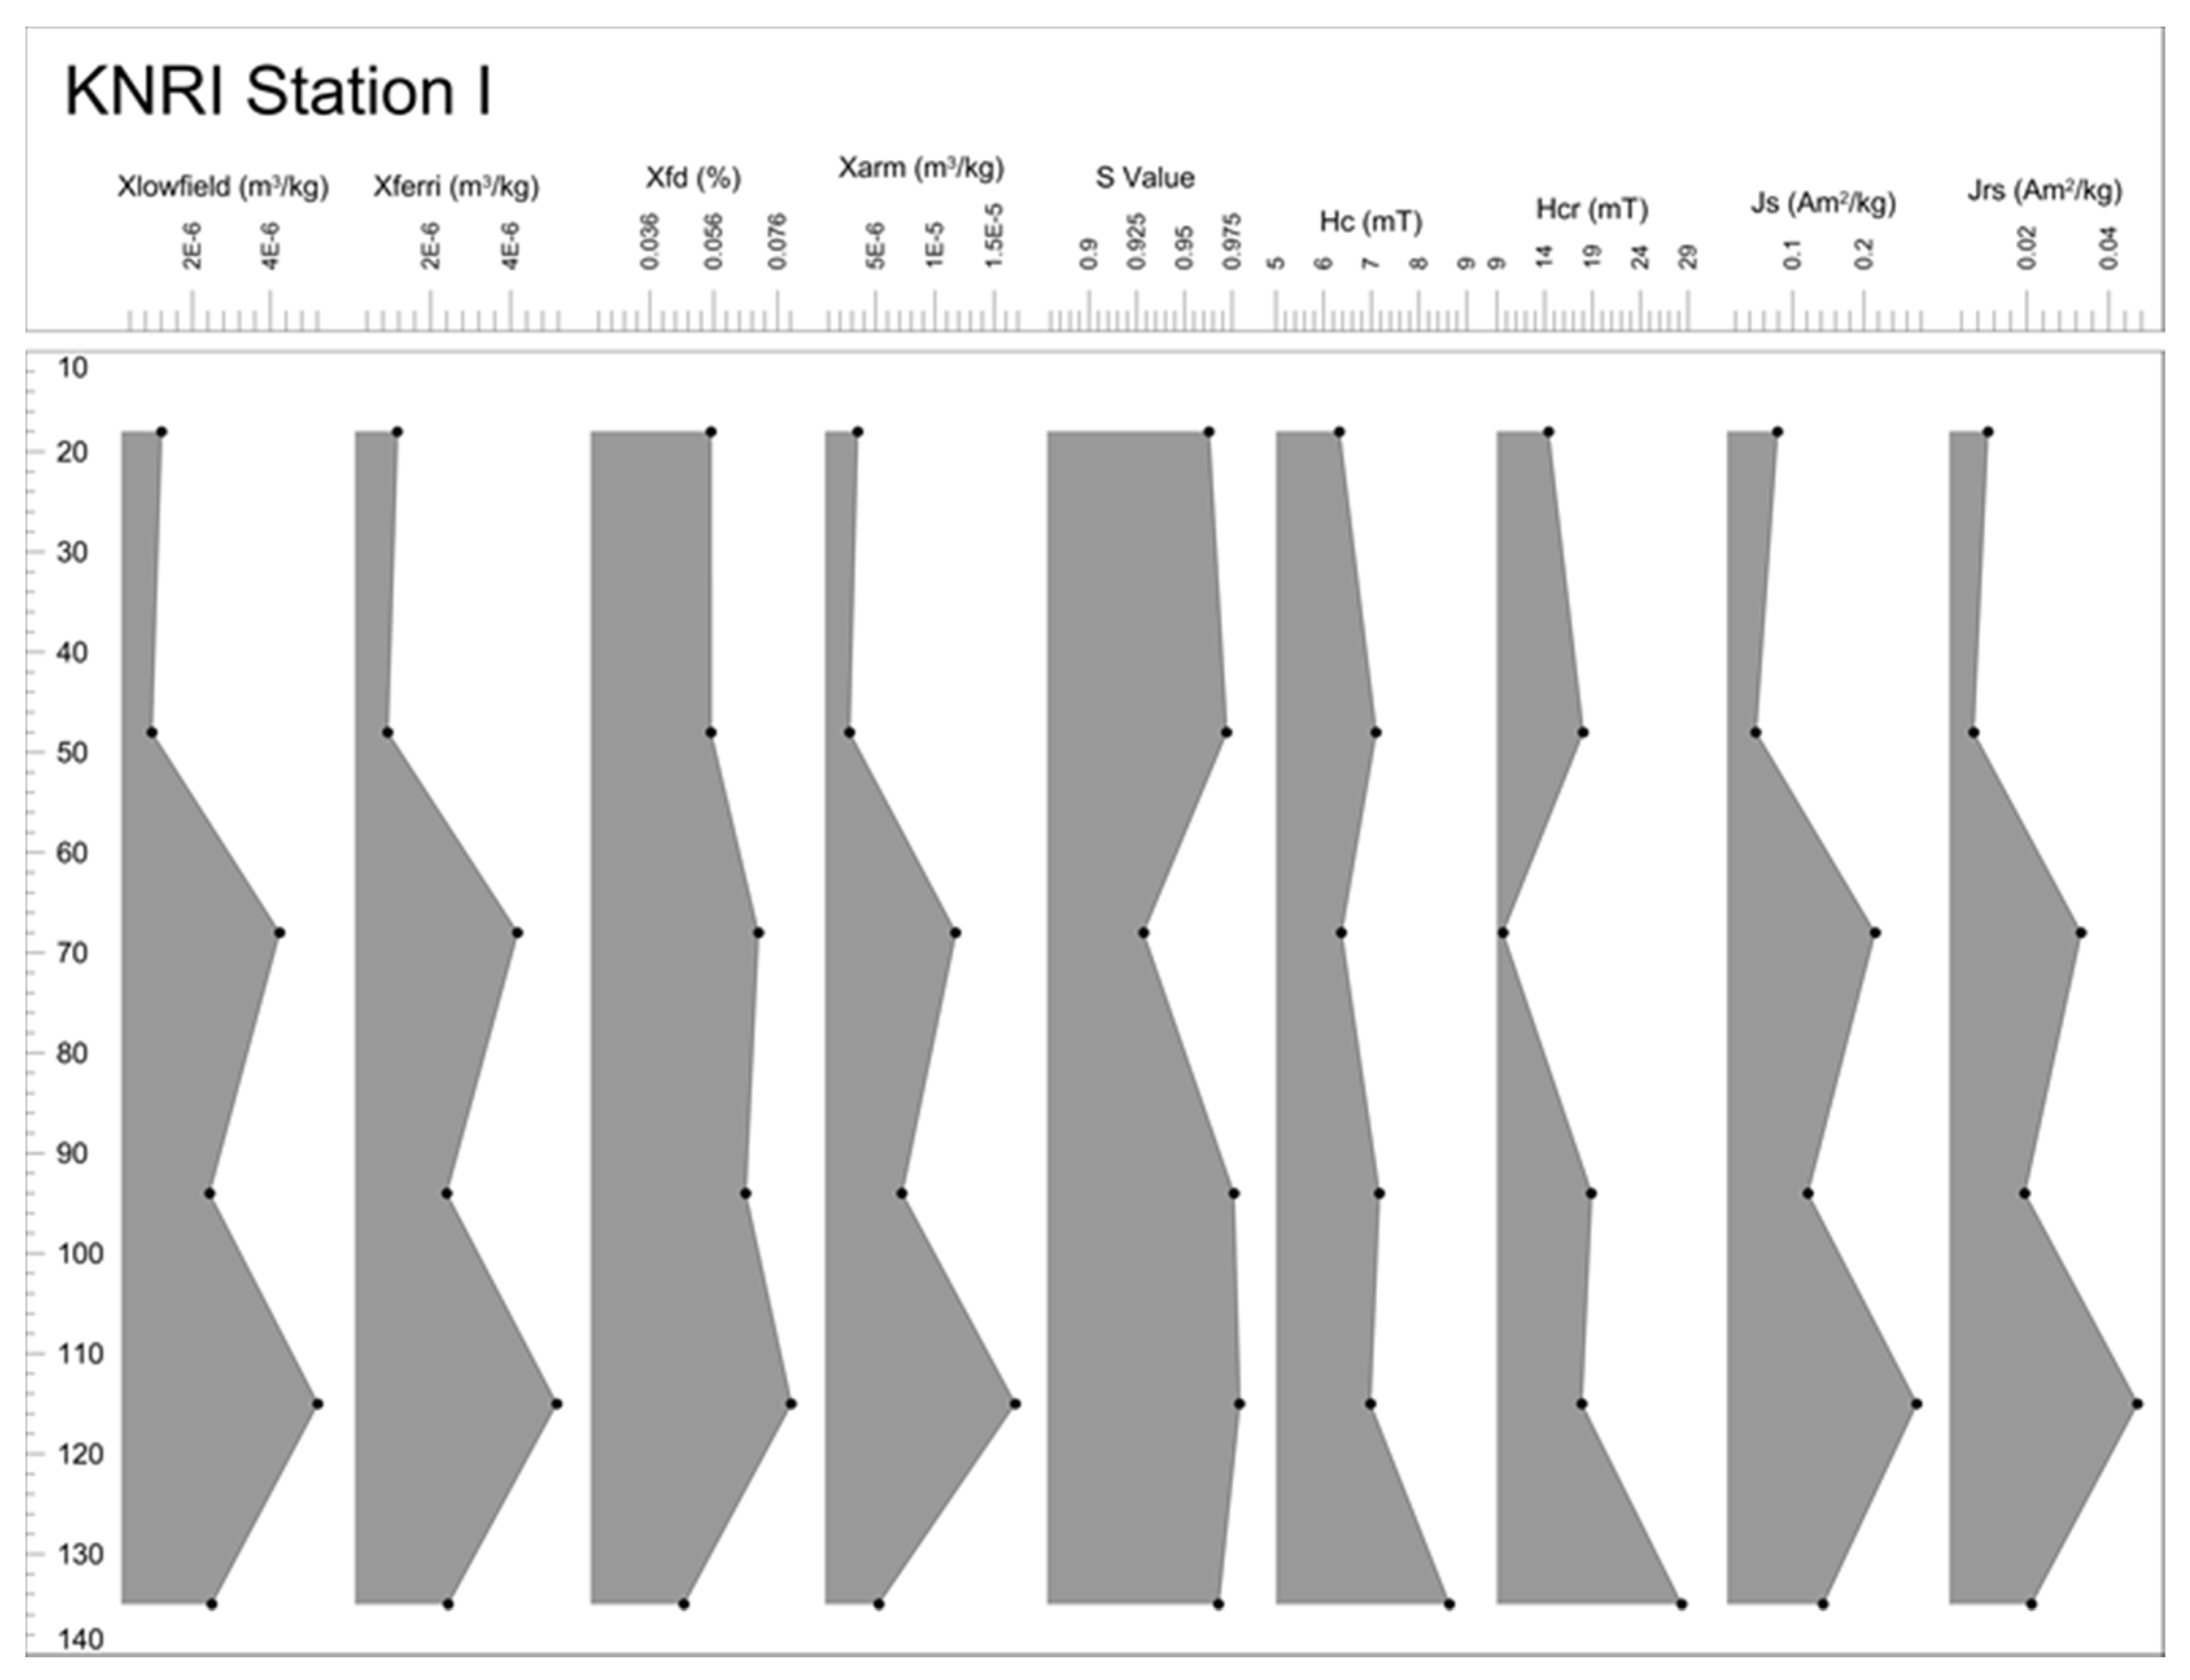
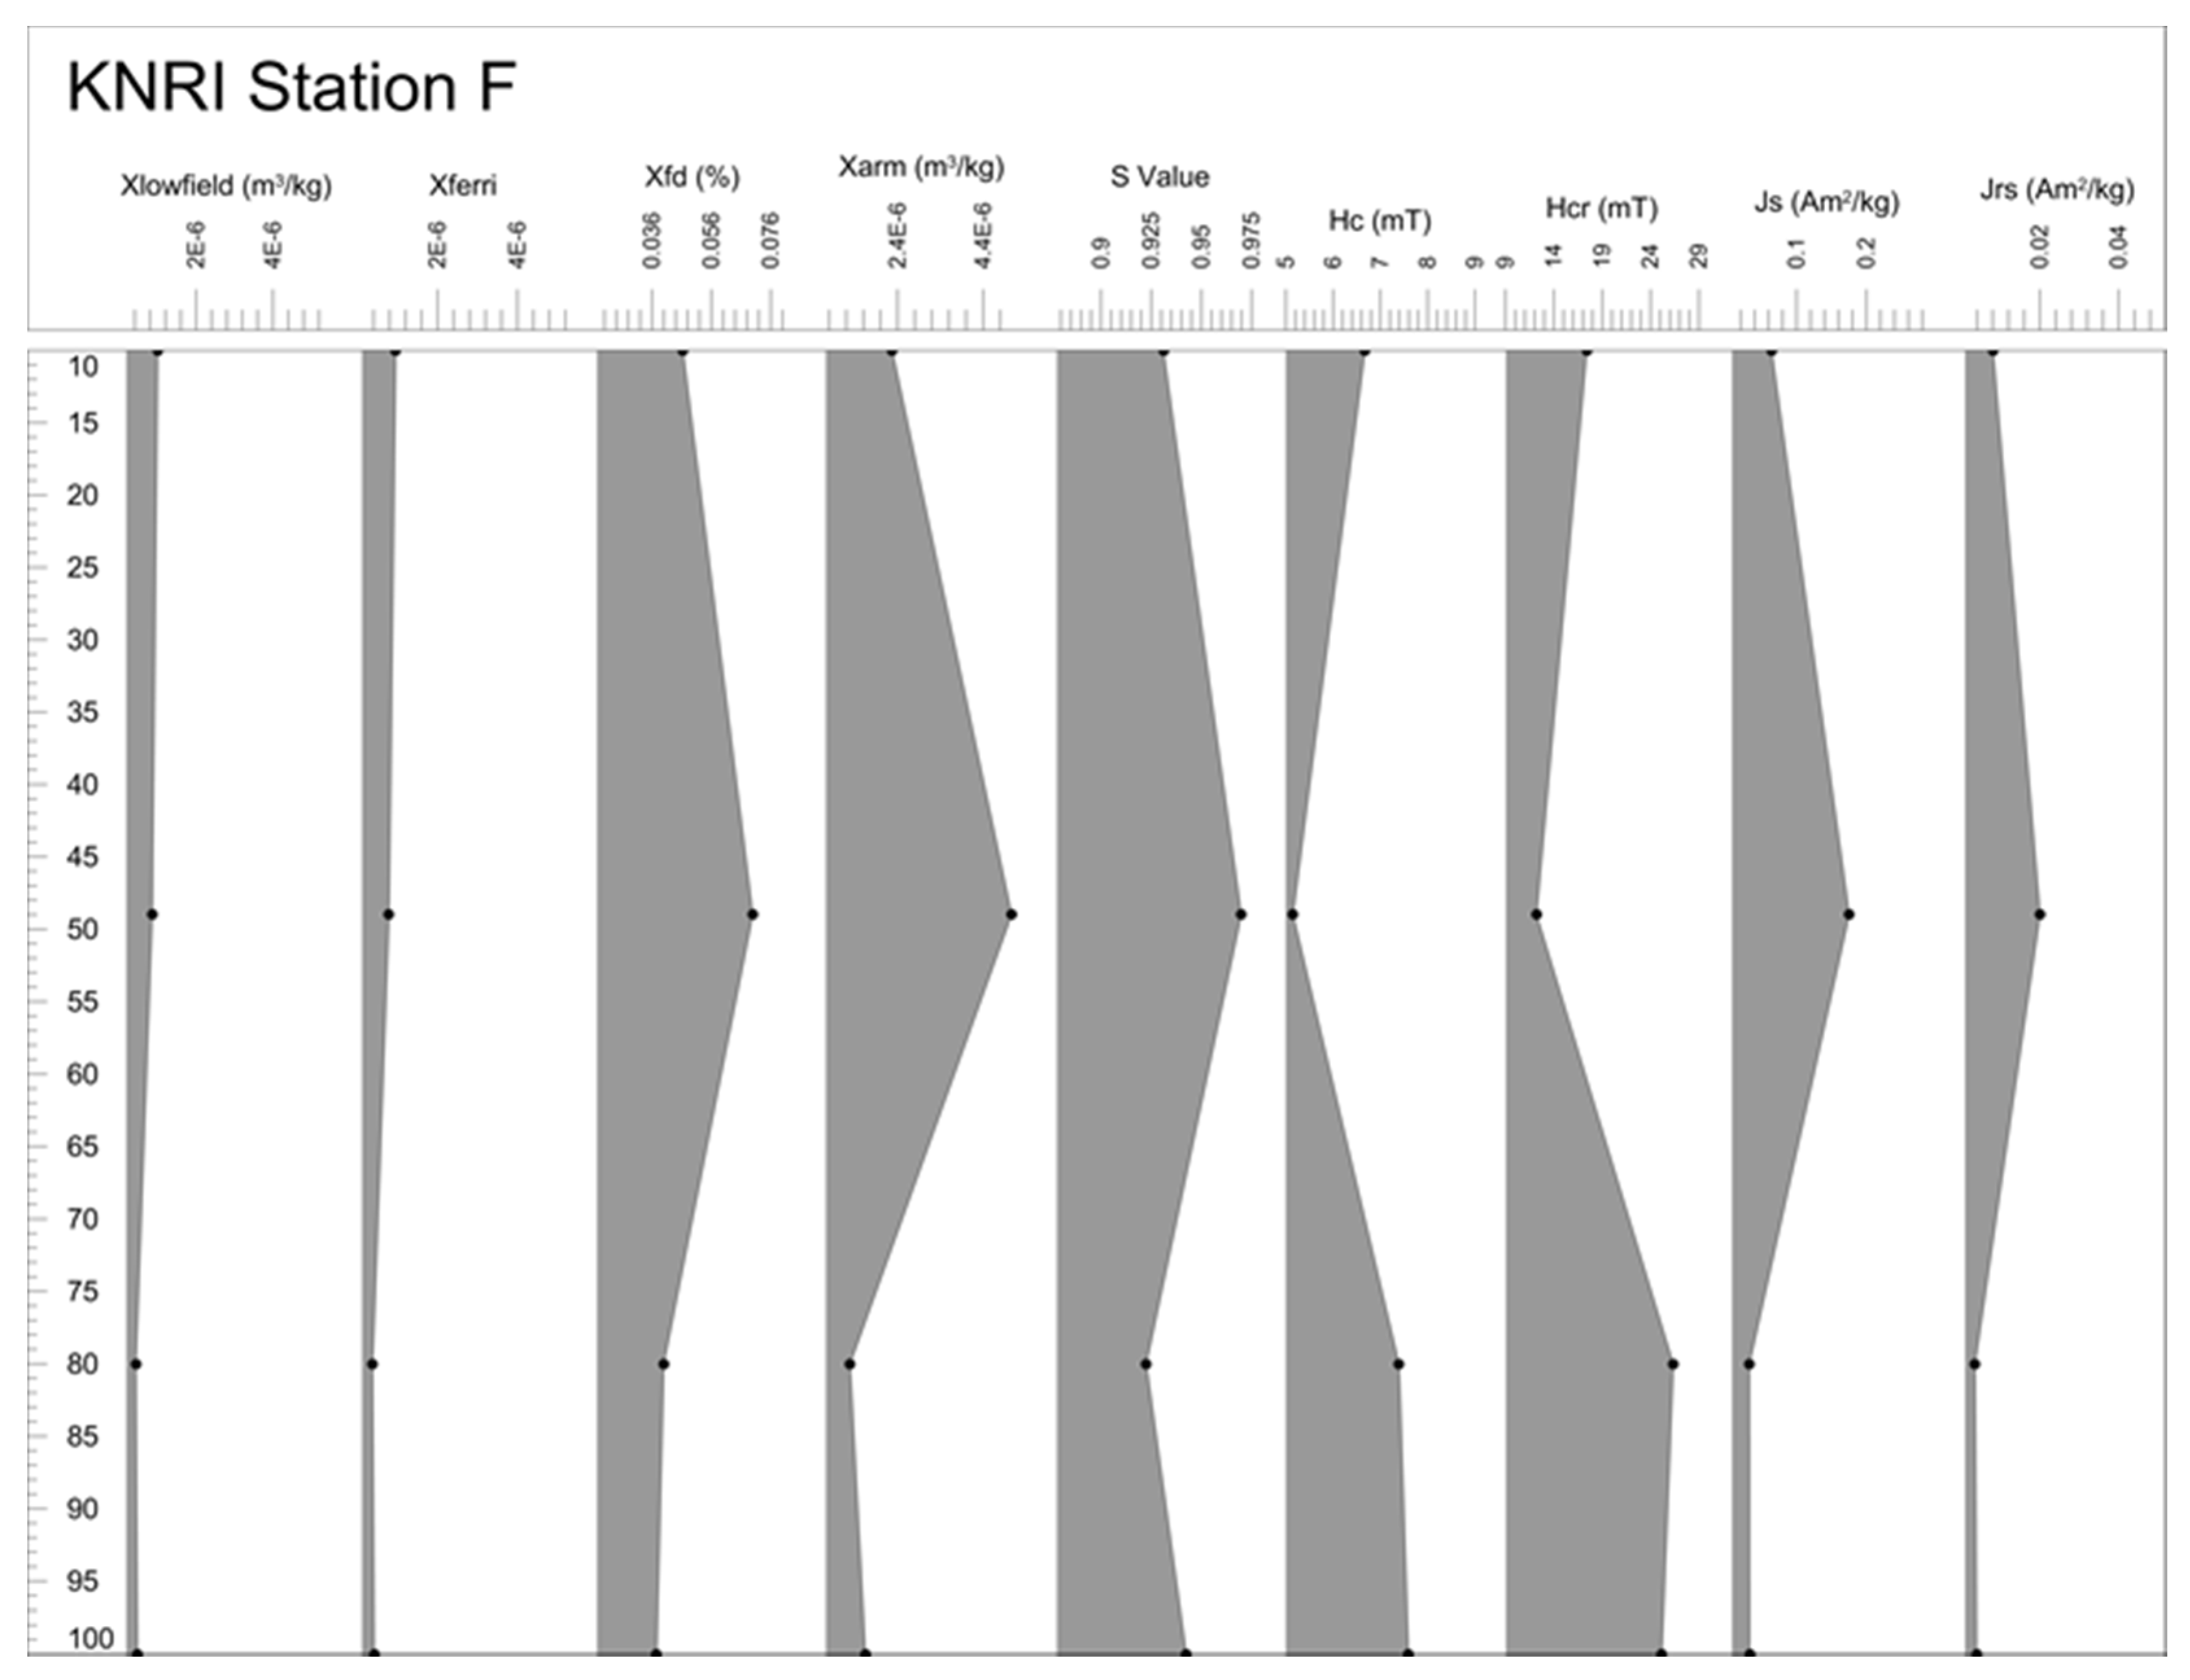
2.3.5. Detailed Soil Magnetic Studies

Magnetic susceptibility is controlled not only by the concentration of magnetic grains but also by the composition (magnetic mineralogy) and size of those grains. Grain size refers to the size-dependent magnetic domain state, ranging from thermally unstable ultrafine or superparamagnetic (SP) magnetic grains to stable single domain (SD) and pseudo-single domain (PSD) grains to large multidomain (MD) grains [30]. Additional soil magnetic measurements in the laboratory, extending the basic susceptibility reconnaissance described above, were used to examine the contribution of magnetic concentration, composition, and grain size to the susceptibility signal, allowing exploration of magnetic characteristics of host soils and cultural deposits.
A subset (16%) of the 125 samples studied in the magnetic reconnaissance was selected for these more time-intensive and magnetically-destructive tests. These 20 samples characterized the top 80 cm of the Natural Station (at 10 cm depth intervals), house floor, midden, ash and charcoal layers, burned roof fall, sterile soils, and buried soils at Stations F and I, and the thermal feature at Station A. Magnetic measurements completed for each of these samples include anhysteretic remanent magnetization (ARM), Saturation Isothermal Remanent Magnetization (SIRM), S values (the degree of loss of remanence on a previously saturated sample at selected reverse fields), and hysteresis loops.
A peak field of 99 mT and a steady field of 0.1 mT were employed to produce an ARM. ARMs were imparted on a Magnon International AFD 300 alternating field demagnetizer with an ARM coil and measured on an AGICO JR-6 Dual Speed Spinner Magnetometer. Samples were next saturated in a strong magnetic field (2 T) and the resulting SIRM measured. The samples were then placed in a reversed field of 300 mT. S values were calculated by dividing the absolute value of the magnetization produced in the backfield by the SIRM. Magnetizations were imparted on an ASC Model IM-10-30 Impulse Magnetizer and measured on an AGICO JR-6 Dual Speed Spinner Magnetometer.
Hysteresis loops measured on each of these samples yielded a number of magnetic parameters (i.e., saturation magnetization (Js), saturation remanent magnetization (Jrs), coercivity (Hc), coercivity of remanence (Hcr), and χp, the paramagnetic portion of the susceptibility signal) that provide information on magnetic mineralogy, concentration, and grain size. Hysteresis loops were produced using a Princeton Applied Research Vibrating Sample Magnetometer (VSM) employing a maximum field of 1 T, a time constant of 0.01 s, and variable field increments ranging from 0.5 mT near zero and increasing to 20 mT near the maximum field.

3. Results

3.1. Surface-Based Magnetic Data

The reprocessed magnetic data from Weymouth and Nickel’s 1970s survey and the 2012 magnetic data are shown in Figure 6. Both datasets were clipped to an interval of ±10 nanoteslas (nT) in order to highlight any prehistoric features. Analysis of the magnetic data from both surveys indicates the presence of numerous magnetic anomalies within the geophysical project area. The majority of the magnetic anomalies consist of single and complex dipolar classes. These anomalies appear to be associated with buried ferrous metal artifacts, surface features, and buried archeological features, as well as several new modern intrusions in the 2012 dataset that are attributed to ground squirrel activity. Numerous clusters of dipole, monopole, and linear anomalies represent earthlodge locations. The magnetic anomalies that represent surface house features identified by Ahler and others [11] are numbered in Figure 3. Additional magnetic anomalies that represent potential house features not previously identified at the surface are also indicated in Figure 3, including the areas of interest previously identified by Weymouth in his 1988 report. Dipole anomalies within the earthlodge locations appear to represent central fire hearths. Other dipole anomalies within the earthlodge locations may represent the major support posts for the lodges. Numerous monopole anomalies located within and outside the earthlodge house features may represent storage or refuse pits used by the inhabitants of the Sakakawea Village. The survey area south of the buried fence line in the 2012 dataset does show potential features, including previously unidentified earthlodges, but with reduced visibility because the area has been plowed extensively. Figure 7 shows an interpreted version of the modern dataset.

3.2. Background Off-Site Soils

Investigations at the Natural Station provide a control, or background, for comparison of non-site versus site soils. Figure 8 shows both in situ (field) versus laboratory measurements of susceptibility, together with stratigraphic information from field notes and lab studies, as well as the natural stratigraphy of the terrace recorded in the 1970s in nearby Unit 10 by Ahler and others [11] (p. 41). Based on field inspection of the soil profile and susceptibility data, this location appears relatively undisturbed by cultural activities.
Although our studies and those of Ahler and others are separated by approximately 10 m and 40 years, the 1970s and 2012 profiles are very similar. In Unit 10, Ahler and others [11] (p. 43) recorded a modern soil and two buried soils, each separated by a yellowish grey silt. The intervening C horizons represent periods of overbank sedimentation separating the modern soil at the surface and two buried A horizons (dark grey clayey silt layers) formed during periods of stability and soil genesis. As the 2012 investigations were shallower, we did not sample the second, deeper, buried soil. Blocky structure within the upper buried soil suggested to us that this horizon has been modified from the surface downward by subsequent pedogenesis forming a B horizon. This general area is mapped as a Straw silty clay loam with textures ranging from loams to clay loams to silty clay loams and typical profiles consisting of A, AC, C, and Ab horizons [31].
Susceptibility enhancement of surface soils is apparent, indicated by a peak in susceptibility in the modern soil followed by a secondary peak of similar magnitude in the buried soil. Maximum values of >5 × 10⁻⁷ m3/kg for mass susceptibility (χ) and >6 × 10⁻⁴ (SI) for volume (κ) susceptibility were measured in the lab. This corresponds well with average values of 6.68 × 10⁻⁴ (SI) and 5.64 × 10⁻⁴ (SI) for the modern and buried A horizons respectively recorded by in situ measurements on the cutbank face. Susceptibility values decrease to approximately 2 × 10⁻⁷ m3/kg (3 × 10⁻⁴ SI) below the buried soil. Typical topsoil enhancement on these relatively young soils is thus 2–2.5 times that of the underlying overbank sediments.
Agreement in both magnitudes and broad trends between measurements of susceptibility on the cutbank and in the laboratory on collected samples indicates that the density of the soil remained relatively unaltered by sampling and thus that the sampling procedure was successful in replicating field conditions. Laboratory values for volume susceptibility, therefore, will only be provided below if field values are not available (i.e., when in situ measurements were not recorded). The smaller sampling interval employed in the field (2 versus 5 cm depth intervals) provided enhanced detail on susceptibility variations.

3.3. Moderately-Enhanced On-Site Surface Soils

Samples from Stations A and J document how site soils are enhanced in susceptibility over non-site soils (Figure 9). In essence these stations provide a measure of background values for the site, in contrast to off-site background values documented at the Natural Station. They indicate that surface soils across the site are enhanced over subsurface layers, and, furthermore, that surface soils within site boundaries are moderately enhanced over surface soils in off-site areas. Susceptibility values below cultural layers on site are the same as documented for subsoil values off-site.
Ahler and others [11] (pp. 41–43) recorded 30 cm of cultural deposits in the vicinity of Station A. As shown in Figure 9, susceptibility values decrease just below this depth (at 35 cm), with the large peak just above this level corresponding to a thermal feature observed in the cutbank. Susceptibility values vary between the two vertical profiles measured through this feature in areas that were relatively more black or red in color. Surficial cultural deposits, excluding the thermal feature, average 7.5 × 10⁻⁴ (SI) and 9 × 10⁻⁴ (SI) for the two profiles, with maximum susceptibility values of 8–10 × 10−4 (SI). The maximum value measured within the thermal feature was 4.71 × 10⁻³ (SI), approximately 5 times the maximum values measured in the surface horizon. Mass susceptibilities for the collected samples, excluding the thermal feature, averaged 6.35 × 10⁻⁷ m3/kg. Susceptibility values below the thermal feature are similar to those observed at the Natural Station, with volume susceptibilities at ranging from 2–3 × 10⁻⁴ (SI).
For Station J, Ahler and others [11] (pp. 30–33) indicated that the house was approximately 35 cm thick. Susceptibility samples from this station showed an enhanced surface ending by the 40 cm sample depth. Similar levels of magnetic enhancement as those observed in the relatively quiet northwest area of the site were documented from the surface through the bottom of the house. Volume susceptibilities were approximately 1 × 10⁻³ (SI) and mass susceptibilities were approximately 8 × 10⁻⁷ m3/kg. Susceptibilities decreased below this point, and at depth averaged approximately 3 × 10⁻⁷ m3/kg.
Magnetic enhancement of the surface at Station A, using the robustly-sampled field values, is greater than 3 times subsoil values and approximately 1.5 times the magnitude of off-site surface soils (Figure 9). Similarly-enhanced surface soils (averaging >8–10 × 10−4 SI) were observed at other stations within the site, as will be discussed below, suggesting that, as a whole, surface soils at the site are only modestly enhanced over off-site soils.
As shown in Figure 9, frequency dependence of susceptibility values for Stations A, J, and the Natural Station are similar and relatively low, ranging from 1%–6% and averaging approximately 3%. Surface soils on site appear to have a slightly larger frequency dependence in comparison to the Natural Station (averaging over 3.5% for Stations A and J in the top 40 cm as opposed to 2.3% for the Natural Station).

3.4. Highly-Enhanced Site Soils and Magnetic Variation

Modest levels of topsoil enhancement, over those observed outside the site, however, are not the only magnetic changes that have been precipitated by occupation at the Sakakawea Village. Several stations exhibited not only deeper deposits of enhanced susceptibility, but markedly higher susceptibilities. Figure 10 compares susceptibility data from Station I to that discussed above for Station J and the Natural Station. Station I is located 8.35 m from Station J in what Ahler and others [11] (pp. 30–33) recorded as nearly 1.5 m of complex stratified midden deposits just outside House 28 (Figure 11).
Figure 10 and Figure 11 illustrate the degree of enhancement and the variability in susceptibility values observed within these midden deposits. Volume susceptibilities recorded in the field range from approximately 4 × 10⁻⁴ to 6 × 10⁻³ (SI) and mass susceptibilities in the lab from approximately 4 × 10⁻⁷ to 5.22 × 10⁻⁶ m3/kg. Note the scale change on the volume and mass susceptibility plots from that used in Figure 8 and Figure 9 to accommodate these larger values. Enhanced susceptibility readings at this station extended to the last few readings of the profile, a meter deeper than observed within House 28.
The upper section (top 65 cm) of the Station I profile produced values at the high end of those observed at other on-site stations, approximately 1 × 10⁻³ (SI) in the field and 1 × 10⁻⁶ m3/kg in the laboratory. Below this, more variable and higher susceptibility values were observed. Four major peaks were documented within the midden deposits, each of these associated with a discrete layer containing ash and/or charcoal (Figure 11). In addition, a fifth peak in susceptibility was documented at the base of the midden that was interpreted by Ahler and others [11] (p. 32) as burned roof fall of an earlier house. These peaks ranged from 1.8 × 10⁻³ SI in the field (1.9 × 10⁻⁶ m3/kg in the laboratory) to 5.87 × 10⁻³ SI in the field (5.2 × 10⁻⁶ m3/kg in the laboratory). In contrast to susceptibility values measured within the upper, more uniform midden, the ash and charcoal layers in the deeper parts of the midden are 2 to 6 times the susceptibility values of the on-site surface layers, and 10 times or more those of subsoil layers.
Frequency dependence of susceptibility for Station I samples range from 1%–8%, with an average of 5%. The range and average are thus higher than observed at Stations J, A, and the Natural Station. Frequency dependence decreases below the midden, indicating the higher χfd values relate to cultural activities. The highest values (7%–8%) are associated with the deposits producing the high susceptibility peaks described above, indicating that at least some of the enhanced susceptibility signal derives from fine-grained magnetic materials. The increase in frequency dependence correlates with the visible presence of ash.
Stations D and F that sampled House 10 provide information on the variability of magnetic susceptibility values and patterns associated with houses (Figure 12). The House 10 location also provided an opportunity to sample a buried soil and to explore potential for tracing these time-diagnostic horizons across the site.
Investigations at Station D focused on a relatively thick ash layer noted from 70–83 cm·bs. Field measurements, recording susceptibility at 2 cm intervals between 58–110 cm·bs, documented contrasts in susceptibility between this layer and surrounding soils (Figure 12). The ash layer produced a peak in susceptibility of 4.22 × 10⁻³ (SI) at 76 cm·bs (with a peak in mass susceptibility of 5.42 × 10⁻⁶ m3/kg from collected samples). This highly-enhanced ash layer is similar in magnitude to the peak in susceptibility in the ash layer at 68 cm·bs located at the base of the uniform midden at Station 1. Station D is thus not representative of a typical house basin (as documented at Station J) with shallow, low-enhancement susceptibility deposits, but is in an area that was recorded as a broad disturbed zone with deeper deposits. Ahler and others [11] (pp. 37–39) were uncertain as to whether this disturbed zone relates to House 10 or to later activities.
Station F exhibited complex stratification and variable susceptibilities that correlate well with the depth and types of cultural deposited noted by Ahler and others in the 1970s (Figure 13). Susceptibilities were investigated to a depth of 120 cm·bs. Two major peaks in susceptibility were noted. At 30 cm·bs, in a darker layer containing charcoal, a susceptibility of 1.93 × 10⁻³ (SI) was measured (1.54 × 10⁻⁶ m3/kg on a collected sample from this depth in the laboratory). A deeper, burned layer with plentiful charcoal produced a volume susceptibility in the field of 3.19 × 10⁻³ (SI) at 48 cm·bs (2.87 × 10⁻⁶ m3/kg in the laboratory for a sample collected at 49 cm·bs). These values are comparable to the more moderate susceptibility peaks noted at Station I. The high susceptibility layer just above 50 cm·bs corresponds to a burned layer recorded by Ahler and others [11] (p. 38) marking the bottom of House 10. Sterile soils were recorded below this. A marked fall-off in susceptibility values corresponds with the sterile soils.
What is interesting about Station F is that within this expanse of sterile soils, at a depth of approximately 100–106 cm, a slightly-enhanced susceptibility zone was observed that correlated with what visually appeared to be a buried soil. This buried soil was recorded at a similar depth on the detailed stratigraphic profiles accessed at the KNRI archives. This may correlate with the second (deepest) buried soil they identified in their off-site profile. Magnetic enhancement was small but noticeable within the low susceptibility sterile deposits, with values over 5 × 10⁻⁴ (SI) (in contrast to overlying and underlying susceptibilities of approximately 2 × 10⁻⁴ SI) measured in the field. Maximum mass susceptibilities measured on collected samples were 4.72 × 10⁻⁷ m3/kg. A slight peak in susceptibility was also noted at Station D at this depth, more distinctive in field than laboratory measurements. An expected increase in χfd was not indicated for the buried soil, thus only the increase in susceptibility serves as a distinctive marker. Frequency dependence of susceptibility for Station F ranges from 1%–5% with an average 3.6%, Station D, with the more highly enhanced ash layer, ranges from 3% to over 6% with an average of 4.5%, but sampling at this station did not extend into sterile soils as it did at Station F.

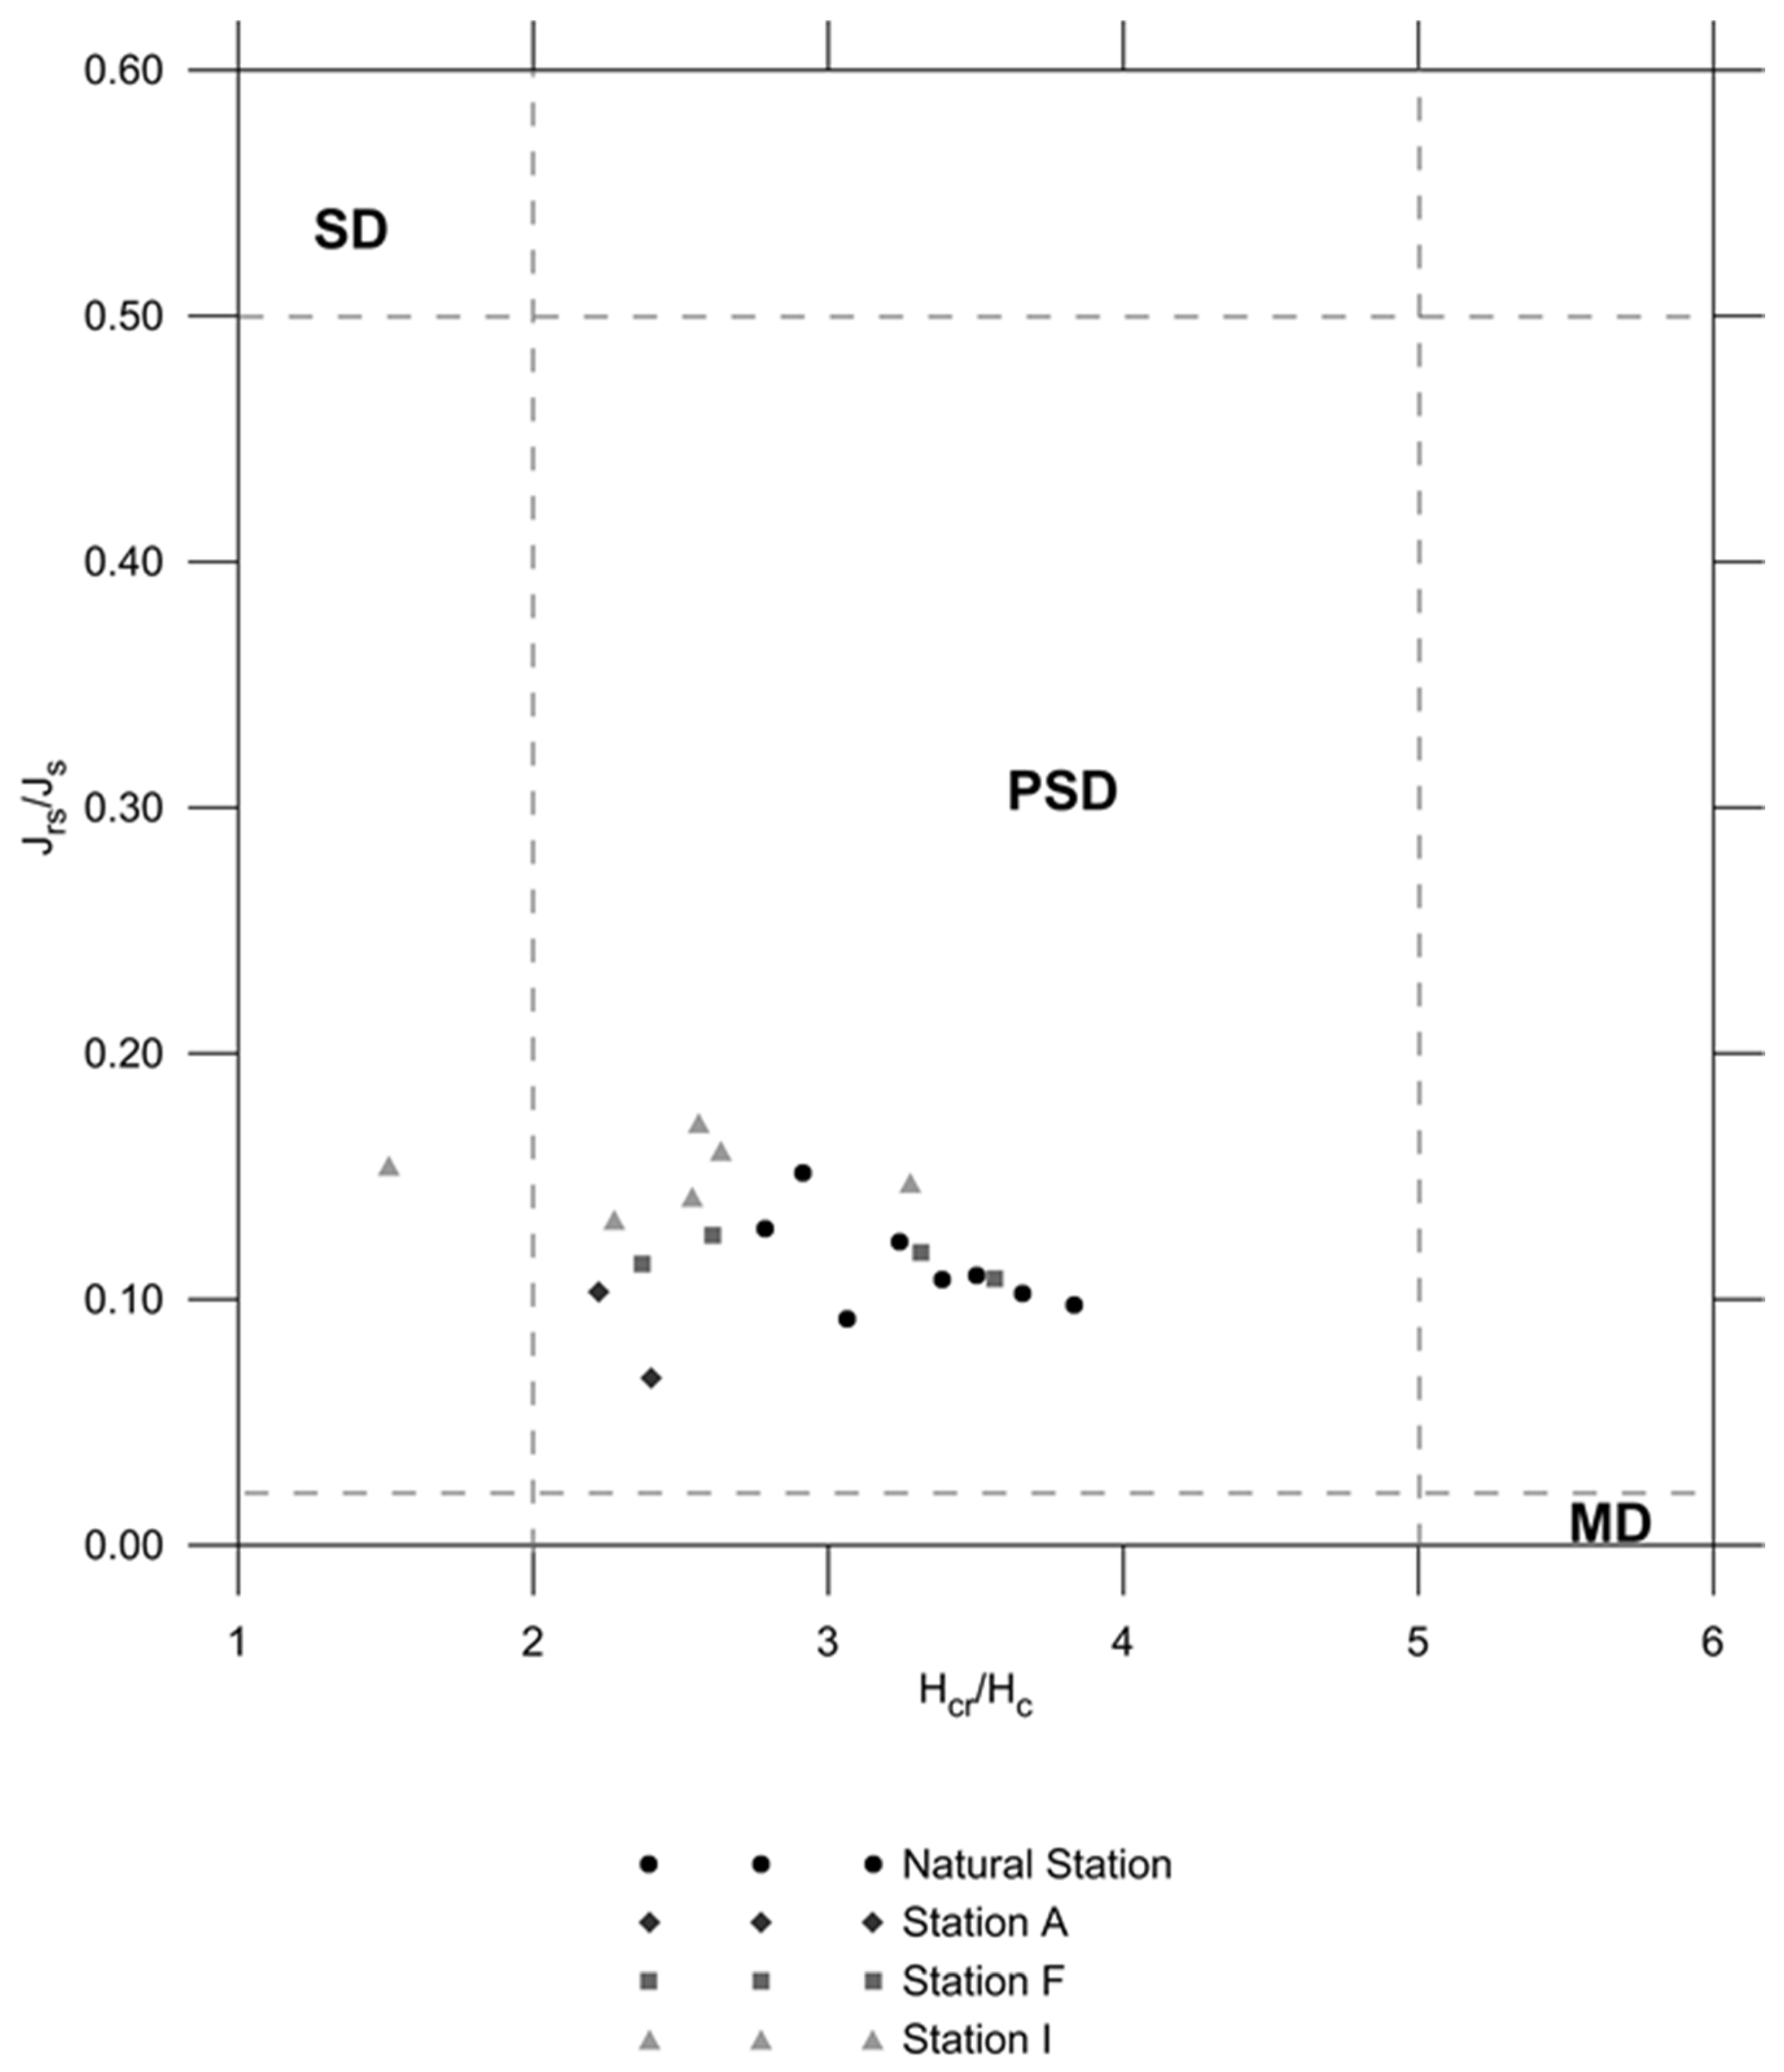
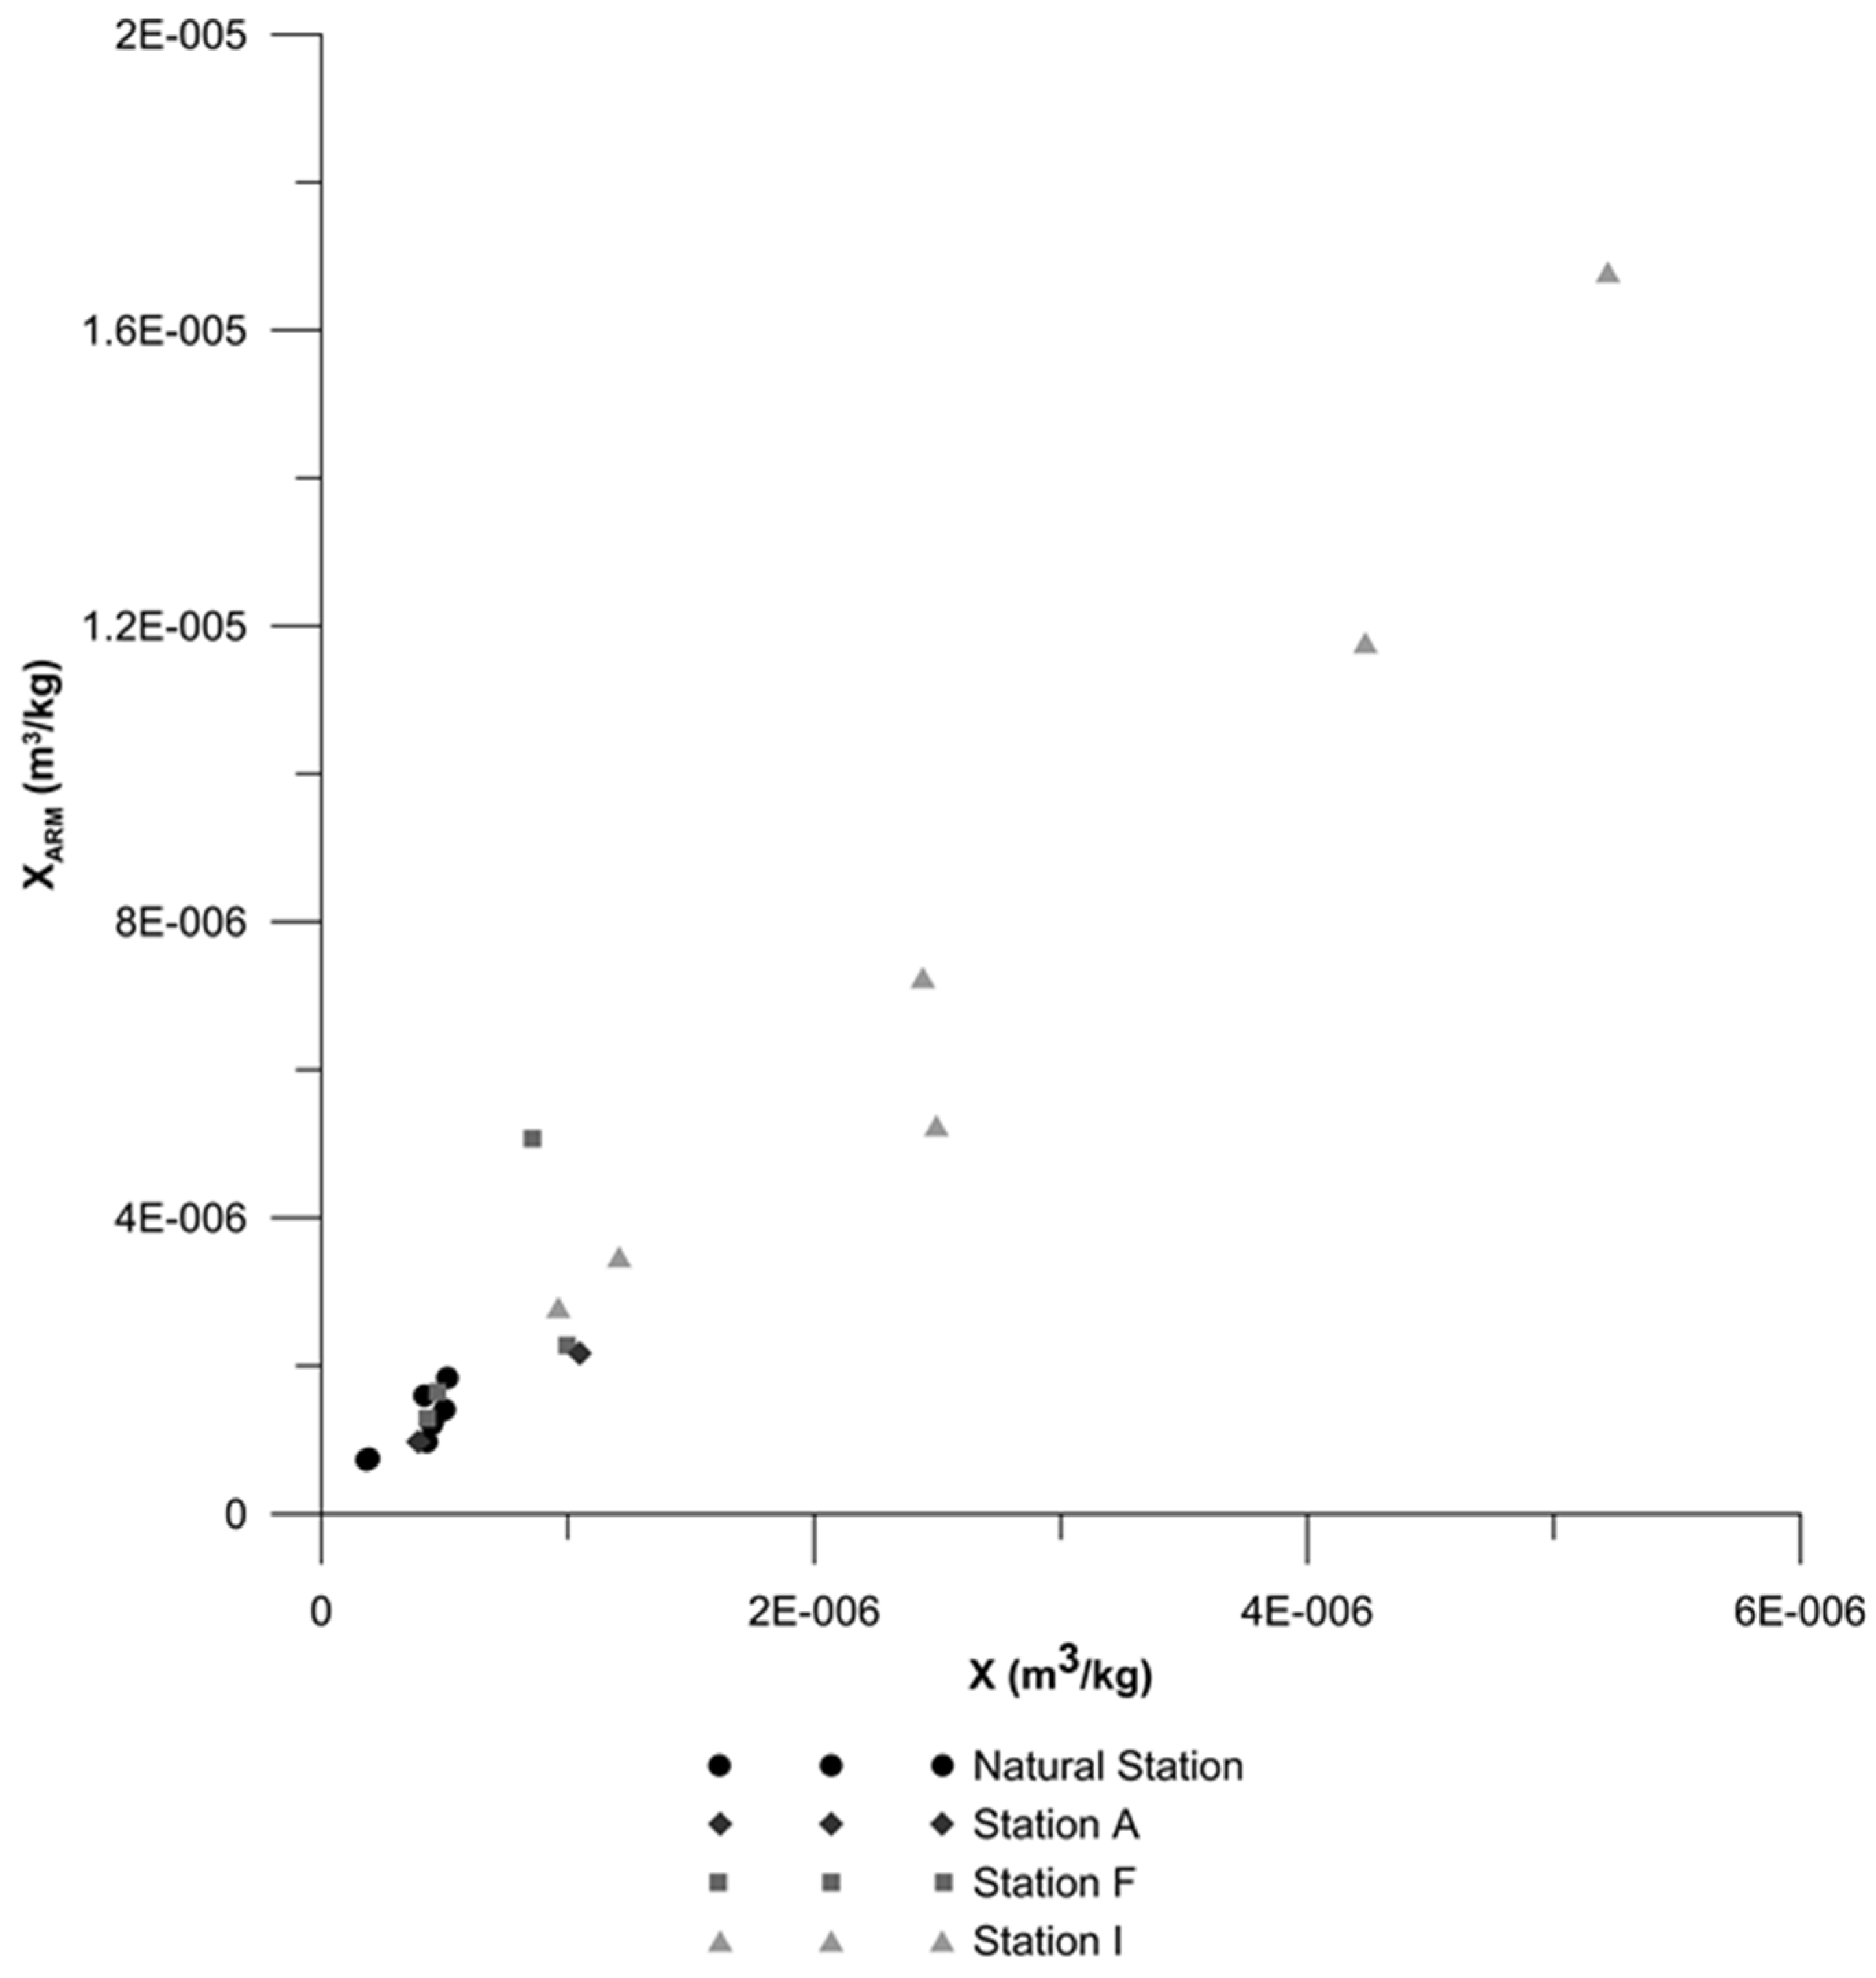
3.5. Soil Magnetic Results

Based on magnetic susceptibility studies along the cutbank, it appears that there are variations in the concentration of magnetic materials between topsoils and subsoils, between site and non-site topsoils, among different types of cultural deposits within the site (e.g., between house basins, middens, and other features), and even contrasts between buried soils and surrounding sediments. These findings are, of course, important in terms of being able to use susceptibility or magnetometer studies in defining and mapping site limits and activity areas and perhaps even earlier occupations. There is also a suggestion, based on χfd measurements on collected samples, that there may be slight differences in the proportion of small magnetic grains between cultural midden and other site and non-site deposits. Soil magnetic studies of collected samples confirm these findings and provide additional details about variations in magnetic mineralogy, grain size, and concentration. Selected soil magnetic measurements for Stations I and F and the Natural Station are presented in Figure 14, Figure 15 and Figure 16, with all figures scaled the same for easy comparison. Soil magnetic studies were only completed on two samples for Station A.
S values and coercivity parameters (Hc, Hcr) provide information about relative proportions of “hard” and “soft” magnetic minerals. An increase in the S value indicates an increase in “soft” ferrimagnetic minerals, e.g., magnetite or maghemite, over “hard” canted aniferrimagnetics such as haematite and goethite. For Hcr and Hc, the relationship is an inverse one, with decreasing values corresponding to the addition of magnetically soft (i.e., low coercivity) magnetic grains.
S values for the 20 samples are relatively high, ranging from approximately 88%–98%, indicating the magnetic signal is predominantly from ferrimagnetic minerals. Samples saturated in fields well under 1 T (in general under 0.3 T) in keeping with the interpretation that the magnetic signal is dominated by magnetite or maghemite. S values for on-site samples (92%–98%, averaging 94% and 96% for stations F and I respectively) are greater than samples from the Natural Station (88%–93%, averaging 91%), indicating that magnetic enhancement of site versus off-site soils is via the increase of ferrimagnetic grains such as magnetic or maghemite. At the Natural Station, S values for surface soils are larger than for subsoil samples (above 90% versus below 90%), indicating enhancement through the pedogenic production of “soft” magnetic grains. On-site sterile subsoil samples are similar to upper sections of the Natural Station (91%–93%).
The coercivity parameters measured via hysteresis loops also indicate a larger proportion of antiferrimagnetic minerals for off-site versus on-site soils with greater values of Hc, Hcr, and the ratio Hcr/Hc for the Natural Station. Hc and Hcr increase with depth at the Natural Station, also indicating pedogenic enhancement of surface over subsoil layers.
Low field susceptibility (χ, or χ lowfield) is the mass magnetic susceptibility measured on the Bartington MS2B sensor. This signal also includes paramagnetic minerals. The paramagnetic proportion of the signal (χp) can be quantified using the high field slope in hysteresis measurements. Paramagnetic susceptibilities (χp), tracking the absolute contribution of the paramagnetic fraction, are relatively low and only vary slightly across all samples (3–7 × 10⁻⁸ m3/kg). Subtracting paramagnetic susceptibility from low field susceptibility yields χferri, a measure of the amount of ferrimagnetic minerals. Due to the small contribution and relative uniformity of χp values, patterns in χferri vary in only minor ways from the patterns shown by χ lowfield.
In addition to χferri, magnetic intensity parameters measured as part of the soil magnetic studies, which track the amount or concentration of magnetic minerals, include χarm, Jrs and Js. Of these intensity parameters, however, only Js is solely dependent on concentration; the other properties, as for X, are also influenced by magnetic grain size. Susceptibility of ARM (χarm) is ARM normalized by the biasing field and the mass of the sample and this parameter is particularly sensitive to SD grains.
The on-site samples exhibit higher values in these magnetic intensity parameters, in keeping with measurements of χ, thus indicating an increase in the concentration of magnetic materials, probably magnetite and/or maghemite. The highest Js values were from the Station I ash layers (a maximum of 2.7 × 10⁻¹ Am2/kg) and the lowest values were observed at the Natural Station (a minimum of 8.7 × 10⁻³ Am2/kg, with an average of 3 × 10⁻² Am2/kg). Intermediate values were observed at Stations F and A, with the lowest on-site values from the surficial midden layers and lower samples (sterile subsurface and buried soil) at Station I and the highest values from the burned layer at Station F (at 49 cm·bs). Jrs values exhibit similar patterning.
Examining the ratio of Jrs/Js (Figure 17), indicates that not only do Station I samples have the highest concentration of magnetic minerals, but also the highest proportion of remanence carrying material (i.e., the ratio of saturation remanent magnetization to saturation magnetization is larger). This indicates enrichment, not only in SP grains, as suggested by the previously discussed χfd data, but also in grains at and above the SD boundary.
Plotting Jrs/Js against the coercivity ratio in a Day et al. plot [32] as modified by Dunlop [33,34], (Figure 17) shows that all samples but one fall within the values expected for PSD grains. This is not to say that they only contain, or even predominantly contain, PSD materials. Environmental materials commonly plot in this zone even though they are comprised of mixtures of different grain sizes. What is indicated is the mean grain size [35] and therefore whether the samples trend closer to MD or SD zones can be used to suggest larger proportions of either coarser or finer grains. This would indicate that many of the Natural Station samples, together with village soils at depth (the underlying sterile soils at station F and I and the buried soil at F) have proportionally the most MD grains while the midden deposits at Station I, the thermal feature at Station A, and some layers at Station F have proportionally more SD particles.
A King [36,37], or χarm vs χ, biplot (Figure 18) allows an interpretation of both concentration and grain size. Susceptibility of arm (χarm) is particularly sensitive to the finer SD grains and so an increase in the χarm vs χ ratio indicates a finer grain size. In general, the 20 points describe a linear relationship (concentration line) extending out from the origin. Clustering near the origin with the lowest concentrations of magnetic materials are the Natural Station samples and also the Station A samples and the deeper (sterile soils) at Station F. The highest concentrations, indicated by the greatest distance from the origin, are the Station I samples, particularly those samples with high ash and charcoal concentrations. There are only a few deviations from this concentration line, suggesting that it is the concentration of magnetic minerals, more than contrasts in grain size, that allows the different types of deposits to be distinguished. Some of the Station I and Station F samples plot above this line, particularly those from the ashy layers; this would suggest they are proportionally finer-grained and thus more efficient at acquiring remanence. This assumes that the dominant magnetic mineral is magnetite or maghemite, which, as discussed previously, appears to be the case, although Natural Station samples do appear to have a larger proportion of antiferrimagnetic grains.
In sum, off-site soils have the lowest concentration of magnetic minerals, the highest proportion of hard minerals, especially in subsoil deposits, and the lowest proportion of fine-grained materials. Midden and feature layers rich in ash and charcoal have the highest concentrations of magnetic minerals, the highest proportions of soft magnetic minerals, and the highest proportions of SP and SD grains. Intermediate in concentration, grain size, and the proportion of magnetite/maghemite are non-feature village areas and midden zones containing lesser amounts of burned residues. Overall, grain size variations are relatively small compared to variations in concentration.

4. Discussion

At-surface magnetometer surveys have convincingly demonstrated the importance of contrasts in susceptibility for mapping and understanding archaeological sites in the Northern Plains. At the Sakakawea Village and other KNRI sites, these include pioneering total field magnetometer surveys by Weymouth and Nickel [14,15] as well as subsequent surveys by De Vore and others [38,39,40] and the 1970s to 2012 survey comparison presented here. Together with magnetic results at other sites in the region by Kvamme and others (e.g., [41,42,43]), these surveys build a cohesive picture of how contrasts in susceptibility allow mapping of earthlodges, pits, fortification ditches, bastions, and many other types of cultural features which provided the incentive for magnetic susceptibility measurements in the vertical dimension.
Our approach for utilizing complimentary magnetic susceptibility surveys on the vertical cutbank at the Sakakawea Village was also fueled by an increased appreciation of the usefulness of susceptibility data for providing both environmental and cultural information [7,44,45] as well developments in instrumentation [2,46,47]. Although no previous subsurface susceptibility studies had been conducted within the KNRI, down-hole and in-excavation susceptibility results from other sites in the Northern Plains had demonstrated the potential of subsurface measurements for detailing earthlodges and other typical features (e.g., [3,43,48,49]). At the Double Ditch site in North Dakota ([43,48], also summarized in [2]), a prototype Bartington Instruments MS2H down-hole sensor was tested on a subterranean food storage pit, house basin, borrow pit, mound, and paleosol. Magnetic susceptibility studies had also been shown to be effective in alluvial settings for identifying buried soils, tracing them across the landscape, and mapping concentrations of human activity [50,51]. Research by Kvamme and Wiewel [48] at Double Ditch involving profiles of susceptibility along previously excavated unit walls [43] yielded patterns useful for distinguishing a range of features, some of which were interpreted as individual depositional events. Importantly, Kvamme and Wiewel [48] (p. 58) noted that such deposits are not always apparent in traditional profile drawings and inspections.
By necessity and opportunity (given the focus on in situ management of resources within the park together with the long subsurface exposure provided by the cutbank and the existence of stratigraphic profiles for much of this length) we developed an approach for subsurface measurements of susceptibility different from these earlier studies. This cutbank geophysical approach is more similar in scale to that employed within the Hopewell Culture National Historical Park in Chillicothe, Ohio where magnetic susceptibility measurements, along with other geophysical and geoarchaeological studies, were completed along long (up to ca. 50 m) excavated trench walls that cross-cut the Hopewell earthworks [2,52,53,54,55]. This approach is also similar to initial proof-of-concepts tests of the Bartington down-hole susceptibility sensor where comparison measurements were made along the face of a gravel pit [56]. As in those studies, the cutbank of the Knife River provides a much larger window into the subsurface than available either through down-hole tests or excavations.
Previous studies in the Northern Plains and elsewhere provide comparative results, lending confidence to the KNRI findings. As has been long-recognized in archaeology [8,9,57] we expected site soils to be magnetically enhanced over surrounding ‘non-cultural’ or non-site topsoils, with the degree of enhancement controlled by the extent of a site’s occupation, its history of being exposed to fire, and the quantity of organic material [58]. Spatial patterning in susceptibility was expected to be useful for the definition of sites, activity areas and features (e.g., [59,60,61]). Modest levels of enhancement were also expected given the relatively recent age of this landscape. The magnetic enhancement of surficial off-site soils that was documented as part of this study is commensurate with enhancement levels of 1 to 4 times base levels measured at alluvial sites within the Red River Valley [50] (p. 189). Though only one station at KNRI was studied to obtain the background (off-site) signature, values measured at this station did match sterile soils measured below cultural layers at several on-site stations.
Documented contrasts between cultural layers along the Sakakawea cutbank, with the highest levels of susceptibility related to an increased contribution from fine-grained magnetic minerals in deposits containing ash and charcoal, align well with expectations gained from studies of the magnetic products of burning. Peters and Thompson [62], using archaeological soils from Orkney and Cyprus, suggest burning produces significant fine-grained magnetic minerals, of SP grains close to the SP-SD boundary. Studies of wood ash in modern fire pits [63] also indicate fine-grained magnetic minerals, probably magnetite, with a large contribution from SP grains. Linford and Canti [64] examined ash and thermally altered soil in experimental fires and observed significant enhancement due to fine-grained magnetic material in short term (1–4 day) campfires. Studies on buried soils from archaeological sites in the Red River Valley [50] suggest enhancement of both SP grains and those at and above the SP-SD boundary deriving from burned soils directly below domestic fires.
At the Biesterfeldt Site, a protohistoric earthlodge village located along the Sheyenne River in eastern North Dakota, magnetic enhancement of lodge floors [3] was similar to that at the Sakakawea site. Like Sakakawea, the highest values were associated with ashy areas and associated features (hearths and pits). Lodge floors showed an increase in χfd, which was not apparent at the Sakakawea site. Peaks in susceptibility have also been associated with potential basin-shaped structures and living floors at other Late Prehistoric fortified settlement in the Sheyenne River Valley [49].
At Double Ditch, Kvamme and Wiewel [48] (pp. 31–59) recorded susceptibility signatures similar to those found at the Sakakawea Village. There, low susceptibility silty background soils contrasted with high susceptibility fills containing ash or fire-cracked rock. A deposit of burned roof fall on the floor of a structure was also shown to be relatively high in susceptibility. Sterile subsoils were of the same order of magnitude (averaging 4 × 10⁻⁴ SI) as those observed at Sakakawea (ranging from 2–6 × 10⁻⁴ SI), with enhancements ranging from 3–4 times base values for the roof fall and the pit averaging 2 times, but up to 10 times, the values outside the pit. Kvamme and Wiewel [48] (p. 32) suggest the less magnetic pit fill derived from common settlement soils (only modestly enhanced over surrounding non-site soils), while highly magnetic layers derived from hearth cleanings or more magnetic midden materials. Kvamme and Wiewel also recorded relatively low susceptibilities associated with rodent burrows due to sterile subsoil and less compact fills. Their findings suggest another potential use for susceptibility surveys might be mapping the level of bioturbation across a site, an important consideration in site management.
In addition to agreement with patterns in susceptibility documented elsewhere, the consistency of measurements across the different stations at the Sakakawea Village increases confidence in the susceptibility signatures. The two house basins studied have similar levels of enhancement, as do midden and ash layers found in multiple levels at stations I, D, and F. Hearth and other thermal features at the site, only studied at Station A, however, warrant further investigation to provide a more detailed understanding of susceptibility alterations due to spatial variations in temperature, atmosphere, and materials.

5. Conclusions

This study has revealed 12 new magnetic features of interest at the Sakakawea Village site and advanced geophysical studies through an approach employing in situ measurements of magnetic susceptibility coupled with soil magnetic studies along the Knife River cutbank. While magnetometer surveys at KNRI and elsewhere in the region have been very successful in mapping certain features of village sites, including earthlodges, hearths, pits, support posts, and even magnetic zones surrounding earthlodges resulting from roof wash and midden, they do not provide information on the depths or layering of these features or on earlier (deeper) lodges and occupations that are too thin or small to be resolved through at-surface surveys. Cutbank geophysics are less-invasive than in-excavation geophysics in providing this resolution and align with KNRI goals of in situ research.
The cutbank studies provided a quantitative understanding of the background susceptibility of off-site and sub-site soils as well as signatures for different feature types, use areas, and cultural layers. Contrasts in susceptibility were relatively high (values ranging from approximately 2 × 10⁻⁴ to 6 × 10⁻³ SI). Background (off-site) soils indicate topsoil magnetic enhancements of 2–2.5 times subsoil values for the modern surface and buried horizons (averaging 6 × 10⁻⁴ versus 2.76 × 10⁻⁴ SI). At village locations, non-feature surficial village soils are slightly elevated in susceptibility, averaging 8–10 × 10−4 SI. As sterile subsoil values below village deposits are commensurate with those observed off-site (2–3 × 10⁻⁴ SI), surface soils are greater than 3 times more magnetic than subsoils and approximately 1.5 times more magnetic than non-site topsoils. Midden deposits and thermal features were much more magnetic, reaching enhancement levels of nearly 10 times background values and providing opportunity to identify midden layers with high ash and charcoal content and roof fall and other features related to burning. Soil magnetic studies indicate enhancement via varying proportions of soft (magnetite/maghemite), relatively fine-grained (SP-SD) magnetic minerals. Grain size variations are relatively small, with only slight increases in χfd related to cultural activities. Greater proportions of fine-grained magnetic material, and thus slightly higher percentages of χfd (3%–8%), were observed for deposits containing ash and charcoal, but these small changes, in and of themselves, do not appear reliable for discriminating different feature types.
This study demonstrates the potential of cutbank geophysical studies for use at this site, elsewhere within the KNRI, and as a general method where there are river bank and other natural and cultural exposures (e.g., along reservoirs, road cuts, etc.). The susceptibility signatures documented at the Sakakawea Village could be used to more effectively explore areas of the site away from the cutbank, through the design and/or interpretation of surface, down-hole, or in-excavation geophysical surveys. Moderate levels of enhancement observed in the upper soil layers of all on-site stations indicate that site limits (both lateral and vertical) could be deliminted using susceptibility techniques. Similarly, horizontal and vertical limits of lodges, middens, pits, and other cultural features could be mapped. Differences in fired versus non-fired features, and between midden versus non-midden areas suggests that susceptibility surveys might also reveal site activity areas. Burned roof fall and ashy layers could be identified, and susceptibility could be used as a proxy for the quantity of ash and charcoal, and for targeting features appropriate for radiocarbon dating. Enhanced susceptibilities associated with a buried soil at Sakakawea Village indicate that down-hole susceptibility techniques might be used to identify this earlier surface, and perhaps even to identify if there are associated areas of occupation. Susceptibility contrasts, together with feature dimensions, could also be used in modeling studies to aid in the interpretation of magnetometer surveys [65]. More intensive geophysical surveys of the cutbank would also be useful for exploring susceptibility signatures potentially related to activity areas, depositional events, and feature types different from those studied here.

Acknowledgments

Funding for this research was provided by the Knife River Indian Villages National Historic Site. Thanks are due KNRI Superintendent Craig Hansen, Theodore Roosevelt National Park Superintendent (Former KNRI Superintendent) Wendy Ross, and Museum Technician Joanne Kerns for their assistance with this project. MWAC Archeological Technicians Stephen Damm, Luke Trout, Archeologist Albert LeBeau III, Archeologist/GIS Specialist Amanda Davey, and GIS Specialist Austin Butterfield provided crucial support. From Minnesota State University Moorhead, the authors would like to thank Jessica Sharp, a former student who was part of the team that conducted the cutbank measurements and completed the basic magnetic reconnaissance of the collected samples. Lynsee Langsdon assisted with the description of collected samples and Ryan Hamilton explored uses of the Golden Software Strater program for presenting geophysical and stratigraphic data. Additional thanks are due Jes Kalina and Trisha Tank for their work in formatting references used in this manuscript and the three anonymous reviewers and academic editor for this special volume for their helpful comments and suggestions. The views expressed in this article do not necessarily represent the views of the National Park Service, Department of the Interior or the United States Government.

Author Contributions

Jay Sturdevant conceived the unique combination of field experiments and applicability to Sakakawea Village. Steven De Vore designed the magnetic surveys. Rinita Dalan designed the magnetic susceptibility studies. Steven De Vore, Jay Sturdevant, and Blair Schneider performed the magnetic surveys. Rinita Dalan, Jay Sturdevant, and Blair Schneider conducted the magnetic susceptibility studies in the field and Rinita Dalan and Rebecca Wallace conducted the soil magnetic studies in the lab. Jay Sturdevant provided coordination support for all field studies, including location control. Steven De Vore and Blair Schneider analyzed the magnetic data. Rinita Dalan and Rebecca Wallace analyzed the magnetic susceptibility data. Rinita Dalan, Jay Sturdevant, Rebecca Wallace, Blair Schneider, and Steven De Vore wrote the paper.

Conflicts of Interest

The authors declare no conflict of interest. Funding was provided by the park (KNRI). The funding sponsors (KNRI) had no role in the design of the study; in the collection, analyses, or interpretation of data; in the writing of the manuscript, and in the decision to publish the results.

References

  1. Bevan, B.W. Geophysics in Excavations; Geosight: Weems, VA, USA, 2005. [Google Scholar]
  2. Dalan, R.A. A review of the role of magnetic susceptibility in archaeogeophysical studies in the United States: Recent developments and prospects. Archaeol. Prospect. 2008, 15, 1–31. [Google Scholar] [CrossRef]
  3. Dalan, R.A.; Bevan, B.; Goodman, D.; Lynch, D.; De Vore, S.; Adamek, S.; Martin, T.; Holley, G.; Michlovic, M. The measurement and analysis of depth in archaeological geophysics: Tests at the Biesterfeldt site USA. Archaeol. Prospect. 2011, 18, 245–265. [Google Scholar] [CrossRef]
  4. Gaffney, C. Detecting trends in the prediction of the buried past: A review of geophysical techniques in archaeology. Archaeometry 2008, 50, 313–336. [Google Scholar] [CrossRef]
  5. Kvamme, K.L. Geophysical surveys as landscape archaeology. Am. Antiq. 2003, 63, 435–457. [Google Scholar] [CrossRef]
  6. Banerjee, S.K. Experimental methods of rock magnetism and paleomagnetism. In Advances in Geophysics; Saltzman, B., Ed.; Academic Press: New York, NY, USA, 1981; Volume 23, pp. 25–99. [Google Scholar]
  7. Evans, M.E.; Heller, F. Environmental Magnetism: Principles and Applications of Environmagnetics; Academic Press: New York, NY, USA, 2003. [Google Scholar]
  8. Mullins, C.E. The magnetic properties of the soil and their application to archaeological prospecting. Archaeo-Physika 1974, 5, 143–347. [Google Scholar]
  9. Tite, M.S.; Mullins, C.E. Enhancement of the magnetic susceptibility of soils on archaeological sites. Archaeometry 1971, 13, 209–219. [Google Scholar] [CrossRef]
  10. National Park Service. Foundation Document, Knife River Indian Villages National Historic Site, North Dakota; U.S. Department of Interior, National Park Service: Washington, DC, USA, 2013.
  11. Ahler, S.A.; Weston, T.; McMiller, K.D. Cutbank Profiling and Test Excavations at Sakakawea Village (32ME11), Knife River Indian Villages National Historic Site; Report submitted to the U.S. National Park Service; Department of Anthropology and Archeology, University of North Dakota: Grand Forks, ND, USA, 1980. [Google Scholar]
  12. National Park Service. Draft Archeological Resources Management Plan and Environmental Impact Statement, Knife River Indian Villages National Historic Site, North Dakota; U.S. Department of Interior, National Park Service: Washington, DC, USA, 2016.
  13. Weymouth, J.W. Magnetic Surveys of Archaeological Sites in the Knife River Indian Villages National Historic Site: Major Village Sites; U.S. Report submitted to National Park Service; Department of Physics and Astronomy, University of Nebraska-Lincoln: Lincoln, NE, USA, 1988. [Google Scholar]
  14. Weymouth, J.W. A Magnetic Survey of Sakakawea Village (32ME11); Report submitted to the U.S. National Park Service; Department of Physics and Astronomy, University of Nebraska-Lincoln: Lincoln, NE, USA, 1979. [Google Scholar]
  15. Weymouth, J.W.; Nickel, R.K. A magnetometer survey of the Knife River Indian Villages. Plains Anthropol. Mem. 1977, 13, 104–118. [Google Scholar]
  16. Bowers, A.W. Hidatsa Social and Ceremonial Organization; Bureau of American Ethnology, Smithsonian Institution: Washington, DC, USA, 1965. [Google Scholar]
  17. Wood, W.R. Hidatsa Origins and Relationships. In The Phase I Archeological Research Program for the Knife River Indian Villages National Historic Site, Part II: Ethnohistorical Studies; National Park Service, Midwest Archeological Center: Lincoln, NE, USA, 1993; pp. 11–28. [Google Scholar]
  18. Stewart, F.H. Hidatsa. In Handbook of North American Indians, Plains; DeMallie, R.J., Ed.; Smithsonian Institution: Washington, DC, USA, 2001; Volume 1, pp. 329–348. [Google Scholar]
  19. Molton, G.E. The Journals of the Lewis and Clark Expedition, Volume 3, August 25, 1804–April 6, 1805; University of Nebraska Press: Lincoln, NE, USA, 1987. [Google Scholar]
  20. Trimble, M.K. Infectious Disease and Northern Plains Horticulturalists: A Human-Behavior Model. In The Phase I Archeological Research Program for the Knife River Indian Villages National Historic Site, Part II: Ethnohistorical Studies; National Park Service, Midwest Archeological Center: Lincoln, NE, USA, 1993; pp. 75–130. [Google Scholar]
  21. Hollenback, K.L. Disaster, Technology, and Community: Measuring Responses to Smallpox Epidemics in Historic Hidatsa Villages, North Dakota. Ph.D. Dissertation, University of Arizona, Tucson, AZ, USA, 2012. [Google Scholar]
  22. Smith, G.H. Like-A-Fishhook Village and Fort Berthold, Garrison Reservoir, North Dakota; U.S Department of Interior, National Park Service: Washington, DC, USA, 1972.
  23. Gilman, C.; Schneider, M.J. The Way to Independence: Memories of a Hidatsa Indian Family, 1840–1920; Minnesota Historical Society Press: St. Paul, MN, USA, 1987. [Google Scholar]
  24. Lehmer, D.J.; Wood, W.R.; Dill, C.L. The Knife River Phase; Report on file; National Park Service, Midwest Archeological Center: Lincoln, NE, USA, 1978.
  25. Ahler, S.A. Plains Village Cultural Taxonomy for the Upper Knife-Heart Region. In The Phase I Archeological Research Program for the Knife River Indian Villages National Historic Site, Part IV: Interpretation of the Archeological Record; National Park Service, Midwest Archeological Center: Lincoln, NE, USA, 1993; pp. 57–108. [Google Scholar]
  26. Johnson, C.M.; Ahler, S.A.; Haas, H.; Bonani, G. A Chronology of Middle Missouri Plains Village Sites; Smithsonian Institution Scholarly Press: Washington, DC, USA, 2007. [Google Scholar]
  27. Godfrey, A. Contact with Northern Plains Indian Villages and Communities: An Administrative History of Knife River Indian Villages National Historic Site, North Dakota; National Park Service, Midwest Regional Office: Omaha, NE, USA, 2009.
  28. Ahler, S.A. A Research Plan for Investigation of the Archeological Resoruces of the Knife River Indian Villages National Historic Site; Report on File; National Park Service, Midwest Archeological Center: Lincoln, NE, USA, 1978.
  29. Weymouth, J.W. Technical developments and results of the 1977 season of the Great Plains magnetic surveying program. Archaeo-Physika 1979, 10, 710–717. [Google Scholar]
  30. Hunt, C.P.; Moskowitz, B.M.; Banerjee, S.K. Magnetic properties of rocks and minerals. In Rock Physics and Phase Relations: A Handbook of Physical Constants; Ahrens, T.J., Ed.; American Geophysical Union: Washington, DC, USA, 1995; pp. 189–204. [Google Scholar]
  31. Wilhelm, F.J. Soil Survey of Mercer County, North Dakota; USDA Soil Conservation Service: Washington, DC, USA, 1978.
  32. Day, R.; Fuller, M.; Schmidt, V.A. Hysteresis properties of titanomagnetites: Grain size and compositional dependence. Phys. Earth Planet. Int. 1977, 13, 260–277. [Google Scholar] [CrossRef]
  33. Dunlop, D.J. Theory and application of the Day plot (Mrs/Ms versus Hcr/Hc) 1: Theoretical curves and tests using titanomagnetite data. J. Geophys. Res. 2002, 107. [Google Scholar] [CrossRef]
  34. Dunlop, D.J. Theory and application of the Day plot (Mrs/Ms versus Hcr/Hc) 2: Application to data for rocks, sediments, and soils. J. Geophys. Res. 2002, 107. [Google Scholar] [CrossRef]
  35. Jackson, M.; Worm, H.-U.; Banerjee, S.K. Fourier analysis of digital hysteresis data: Rock magnetic applications. Phys. Earth Planet. Inter. 1990, 65, 78–87. [Google Scholar] [CrossRef]
  36. Banerjee, S.K.; King, J.W.; Marvin, J.A. A rapid method for magnetic granulometry with application to environmental studies. Geophys. Res. Lett. 1981, 8, 333–336. [Google Scholar] [CrossRef]
  37. King, J.W.; Banerjee, S.K.; Marvin, J.; Ozdemir, O. A comparison of different magnetic methods for determining the relative grain size of magnetite in natural materials: Some results in lake sediments. Earth Planet. Sci. Lett. 1982, 59, 404–419. [Google Scholar] [CrossRef]
  38. DeVore, S.L. Magnetic Survey of the Southern Portion of the Elbee Site (32ME408), Mercer County, North Dakota; National Park Service, Midwest Archeological Center: Lincoln, NE, USA, 2008.
  39. DeVore, S.L. Geophysical Investigations of Three Sites within the Knife River Indian Villages National Historic Site, Mercer County, North Dakota; National Park Service, Midwest Archeological Center: Lincoln, NE, USA, 2015.
  40. Volf, W.J. Magnetic Gradient Geophysical Survey of the Northern Portion of the Elbee Site (32ME408), Mercer County, North Dakota; National Park Service, Midwest Archeological Center: Lincoln, NE, USA, 2002.
  41. Bales, J.R.; Kvamme, K.L. Geophysical signatures of earthlodges in the Dakotas. In Plains Earthlodges; Roper, D.C., Pauls, E.R., Eds.; University of Alabama Press: Tuscaloosa, AL, USA, 2005; pp. 157–183. [Google Scholar]
  42. Kvamme, K.L. Multidimensional prospecting in North American Great Plains village sites. Archaeol. Prospect. 2003, 10, 131–142. [Google Scholar] [CrossRef]
  43. Kvamme, K.L.; Ahler, S.A. Integrated remote sensing and excavation at Double Ditch State Historic Site, North Dakota. Am. Antiq. 2007, 72, 539–561. [Google Scholar] [CrossRef]
  44. Thompson, R.; Oldfield, F. Environmental Magnetism; Allen and Unwin: London, UK, 1986. [Google Scholar]
  45. Verosub, K.L.; Roberts, A.P. Environmental magnetism: past, present and future. J. Geophys. Res. 1995, 100, 2175–2192. [Google Scholar] [CrossRef]
  46. Lecoanet, H.; Lévêque, F.; Segura, S. Magnetic susceptibility in environmental applications: Comparison of field probes. Phys. Earth Planet. Int. 1999, 115, 191–204. [Google Scholar] [CrossRef]
  47. Benech, C.; Marmet, E. Optimum depth of investigation and conductivity response rejection of the different electromagnetic devices measuring apparent magnetic susceptibility. Archaeol. Prospect. 1999, 6, 31–45. [Google Scholar] [CrossRef]
  48. Kvamme, K.L.; Wiewel, A.S. Comprehensive Understanding of Archaeological Magnetism and Instrumentation; Report submitted to the National Center for Preservation Technology and Training; Department of Anthropology & Archeo-Imaging Lab, University of Arkansas: Fayetteville, IL, USA, 2013. [Google Scholar]
  49. Lowe, K.M.; Fogel, A.S. Understanding Northeastern plains village sites through archaeological geophysics. Archaeol. Prospect. 2010, 17, 247–257. [Google Scholar] [CrossRef]
  50. Dalan, R.A. A geophysical approach to buried site detection using down-hole susceptibility and soil magnetic techniques. Archaeol. Prospect. 2006, 13, 182–206. [Google Scholar] [CrossRef]
  51. Dalan, R.A.; Goodman, D. Imaging buried landforms using down-hole susceptibility data and 3D GPR visualization software. Archaeol. Prospect. 2007, 14, 273–280. [Google Scholar] [CrossRef]
  52. Bevan, B.W. A Review of Some Geophysical Surveys at Hopeton Mounds; Geosight: Weems, VA, USA, 2016. [Google Scholar]
  53. Dempsey, E.C. An Exercise in Remote Sensing: The Results of Magnetic Susceptibility Testing at the Hopeton Earthworks (33RO26). Undergraduate Senior Thesis, University of Nebraska, Lincoln, NE, USA, 2006. [Google Scholar]
  54. Lynott, M.J. Hopewell Ceremonial Landscapes of Ohio: More than Mounds and Geometric Earthworks; Oxbow Books: Oxford, UK, 2014. [Google Scholar]
  55. Weymouth, J.W.; Bevan, B.; Dalan, R. Geophysical investigations at the Hopeton Earthworks. In the Footprints of Squier and Davis: Archeological Fieldwork in Ross County, Ohio; Lynott, M.J., Ed.; National Park Service, Midwest Archeological Center: Lincoln, NE, USA, 2009; pp. 145–158. [Google Scholar]
  56. Dalan, R.A. A magnetic susceptibility logger for archaeological application. Geoarchaeology 2001, 16, 263–273. [Google Scholar] [CrossRef]
  57. Aitken, M.J. Magnetic location. In Science and Archaeology; Brothwell, D., Higgs, E., Eds.; Praeger Publishers: Washington, DC, USA, 1970; pp. 681–694. [Google Scholar]
  58. Tite, M.S.; Mullins, C.E. Magnetic properties of soils. Prospez. Archeol. 1970, 5, 111–112. [Google Scholar]
  59. Clark, A.J. Seeing Beneath the Soil: Prospecting Methods in Archaeology; B.T. Batsford: London, UK, 1990. [Google Scholar]
  60. Challands, A. Field magnetic susceptibility measurement for prospection and excavation. In Geoprospection in the Archaeological Landscape; Spoerry, P., Ed.; Oxbow Books: Oxford, UK, 1992. [Google Scholar]
  61. Batt, C.; Fear, S.; Heron, C. The role of magnetic susceptibility as a geophysical survey technique: A site assessment. Archaeol. Prospect. 1995, 2, 179–196. [Google Scholar]
  62. Peters, C.; Thompson, R. Supermagnetic enhancement, superparamagnetism, and archaeological soils. Geoarchaeology 1999, 14, 401–413. [Google Scholar] [CrossRef]
  63. McLean, R.G.; Kean, W.F. Contributions of wood ash magnetism and archaeomagnetic properties of fire pits and hearths. Earth Planet. Sci. Lett. 1993, 119, 387–394. [Google Scholar] [CrossRef]
  64. Linford, N.; Canti, M.G. Geophysical evidence for fires in antiquity: Preliminary results from an experimental study. Archaeol. Prospect. 2001, 8, 211–225. [Google Scholar] [CrossRef]
  65. Bevan, B.W. Forward Magnetic Models: Creation and Calculation; Geosight: Weems, VA, USA, 2016. [Google Scholar]
Figure 1. Map of project area with inset illustrating the location of the Knife River Indian Villages National Historic Site in North Dakota. Project area map includes the sampling stations (in black) and the earthlodge numbers (in red). Project area baselayer is a hillshade created from the bare earth model generated from the 2012 LiDAR data.
Remotesensing 09 00112 g001
Figure 2. Oil on canvas (34.3 × 43.2 × 3.2 cm) “Village of the Minatarees on Knife River above the Mandan, 1852” by George Catlin (1796–1872). This image illustrates earthlodges and daily life at Sakakawea Village along the Knife River cutbank. Image (GM 0176.2137) provided from the collection of the Gilcrease Museum, Tulsa, Oklahoma.
Remotesensing 09 00112 g002
Figure 3. (a) The magnetic data collected over the Sakakawea Village Site by John Weymouth [13] (p. 14). The circular features represent the outlines of the earthlodge remnants, and the dots in the center are the central hearths. A buried fence line can be seen as a linear feature across grids 310 W to 190 W and 180 N to 200 N; (b) The magnetic data was combined with the topographic houses that were mapped at the surface to identify additional earthlodges that are not visible at the surface. The cutbank units are also included in this outline. From [13] (p. 15).
Remotesensing 09 00112 g003
Figure 4. Photograph of cutbank at the Sakakawea Village overlooking the Knife River, showing profiling in operation in the summer of 1977, view northwest. Photograph courtesy of National Park Service, Knife River Indian Villages National Historic Site, North Dakota. (Original published in [11] (p. 27) as Figure 3).
Remotesensing 09 00112 g004
Figure 5. Magnetic susceptibility measurements on the Sakakawea Village cutbank. (a) Data collection was controlled by Multisus Fieldpro software; (b) In situ measurements with the Bartington MS2 and MS2K Sensor.
Remotesensing 09 00112 g005
Figure 6. (a) Weymouth’s [13,14] magnetic data reprocessed using modern software; (b) The 2012 magnetic survey data results. The buried fence line identified in Figure 3 can be seen clearly in this dataset. Several new magnetic anomalies are present in the new dataset, but many are most likely attributed to the ground squirrel mounds that now cover the site; (c) An outline of the 2012 magnetic survey grids is overlain onto John Weymouth’s survey grids for reference.
Remotesensing 09 00112 g006
Figure 7. Interpreted version of the modern dataset using the key Weymouth assigned to the earthlodge remnants in his 1988 map [13]. Earthlodge remnants that are visible at the surface and in the magnetic data are shown in solid yellow lines and numbered. Earthlodge 1 is visible at the surface, but cannot be seen in the magnetic data and so its location is shown using a dotted yellow line. Magnetic areas of interest identified by Weymouth [13] are indicated in solid red lines, and new areas of interest more recently discovered in the 2012 dataset are indicated by the dotted red lines. A total of 12 new possible earthlodge locations are interpreted in the new dataset, and 8 of these were corroborated in the reprocessed Weymouth dataset.
Remotesensing 09 00112 g007
Figure 8. Field and laboratory measurements of susceptibility, together with stratigraphic descriptions, at an off-site location (the Natural Station). The profile description from Ahler and others [11] was recorded at a location approximately 10 m away.
Remotesensing 09 00112 g008
Figure 9. Field and laboratory measurements of susceptibility at Stations A (NW Village area) and J (SE Village Area, House 10) compared to background values measured off-site (Natural Station). (a) In situ measurements of susceptibility (not conducted at Station J); (b,c) Laboratory measurements of susceptibility and the frequency dependence of susceptibility on collected samples.
Remotesensing 09 00112 g009
Figure 10. Field and laboratory measurements of susceptibility in midden deposits at Station I compared to values measured within the adjacent house basin (Station J) and background values measured off-site (Natural Station). (a) In situ measurements of susceptibility (not conducted at Station J); (b,c) Laboratory measurements of susceptibility and the frequency dependence of susceptibility on collected samples.
Remotesensing 09 00112 g010
Figure 11. Field and laboratory measurements of susceptibility, together with stratigraphic descriptions, at Station I.
Remotesensing 09 00112 g011
Figure 12. Field and laboratory measurements of susceptibility in House 10 (Stations D and F) compared to background values measured off-site (Natural Station). (a) In situ measurements of susceptibility; (b,c) Laboratory measurements of susceptibility and the frequency dependence of susceptibility on collected samples.
Remotesensing 09 00112 g012
Figure 13. Field and laboratory measurements of susceptibility, together with stratigraphic descriptions, at Station F.
Remotesensing 09 00112 g013
Figure 14. Various soil magnetic parameters measured on samples collected from the Natural Station.
Remotesensing 09 00112 g014
Figure 15. Various soil magnetic parameters measured on samples collected from the Station F.
Remotesensing 09 00112 g015
Figure 16. Various soil magnetic parameters measured on samples collected from the Station I.
Remotesensing 09 00112 g016
Figure 17. Plot of the ratio of saturation magnetization (Js) to saturation remanent manetization (Jrs) against the ratio of coercivity (Hc) to coercivity of remanence (Hcr) for the soil magnetic samples.
Remotesensing 09 00112 g017
Figure 18. Plot of susceptibility of ARM versus mass susceptibility for the soil magnetic samples.
Remotesensing 09 00112 g018

