Article

Investigation of Potential Volcanic Risk from Mt. Baekdu by DInSAR Time Series Analysis and Atmospheric Correction

1
Department of Geoinformatics, University of Seoul, Seoulsiripdaero 163, Dongdaemum-gu, Seoul 02504, Korea
2
Department of Land Economics, National Chengchi University, 64, Sec. 2, Zhinan Rd., Wenshan Dist., Taipei 11605, Taiwan
3
National Meteorological Satellite Center, 64-18, Kwanghewon-ri, Juncheon-Gun, Chungchongpukdo 365-831, Korea
4
Department of Environment, Energy and Geoinformatics, Sejong University, 209, Neungdong-ro, Seoul 143-747, Korea
*
Author to whom correspondence should be addressed.
Remote Sens. 2017, 9(2), 138; https://doi.org/10.3390/rs9020138
Submission received: 29 September 2016 / Revised: 25 January 2017 / Accepted: 26 January 2017 / Published: 7 February 2017

Abstract

:
Mt. Baekdu is a volcano near the North Korea-Chinese border that experienced a few destructive eruptions over the course of its history, including the well-known 1702 A.D eruption. However, signals of unrest, including seismic activity, gas emission and intense geothermal activity, have been occurring with increasing frequency over the last few years. Due to its close vicinity to a densely populated area and the high magnitude of historical volcanic eruptions, its potential for destructive volcanic activity has drawn wide public attention. However, direct field surveying in the area is limited due to logistic challenges. In order to compensate for the limited coverage of ground observations, comprehensive measurements using remote sensing techniques are required. Among these techniques, Differential Interferometric SAR (DInSAR) analysis is the most effective method for monitoring surface deformation and is employed in this study. Through advanced atmospheric error correction and time series analysis, the accuracy of the detected displacements was improved. As a result, clear uplift up to 20 mm/year was identified around Mt. Baekdu and was further used to estimate the possible deformation source, which is considered as a consequence of magma and fault interaction. Since the method for tracing deformation was proved feasible, continuous DInSAR monitoring employing upcoming SAR missions and advanced error regulation algorithms will be of great value in monitoring comprehensive surface deformation over Mt. Baekdu and in general world-wide active volcanoes.

Graphical Abstract

1. Introduction

Monitoring of the circum-Pacific tectonic activity and volcanism is paramount for understanding mechanisms and coupling of processes and, more importantly, for assessing and potentially mitigating risks imposed to human settling. For these reasons, governmental bodies have been putting resources in establishing in situ ground-based as well as orbital monitoring platforms. When compared to countries facing a long history of exposure to volcanic risk in Asia, such as Japan (Mt. Fuji in 1707, Mt. Asama in 2009), the Philipines (Kanlaon and Bulusan activity between 1886 and 2006 or 2011, respetively), or Indonesia (Krakatau in 1883, Agung in 1963, Merapi in 2010), the Korean peninsula can be considered as relatively stable and volcanically quiet. Recent findings from ground-based observations, however, reveal the possibility of prolonged volcanic activity in Korea and continuous monitoring of the Mt. Baekdu volcano (Changbaishan) located at the North Korean-Chinese border has shown an increase in seismic activity, ground unrest and emission of CO2, He and Ar based on GPS measurements and targeted gas sampling, respectively [1,2]. Seismometers employed on the Chinese side have been identifying a sudden increase in seismic activity beginning in 2002 and peaking in 2003. The number of recorded earthquakes increased by a factor of up to 2100, between two faults lines extending in N50W and N10W to NS direction at a depth of 2–4 km [3]. Seismic measurements, gas detections as well as GPS and precise levelling observations conducted on the Chinese side of the summit [4] revealed signs of unrest. These observations included:
  • Record of strong seismic activity between 2002 and 2006 peaking in Nov 2003 followed by a seismically quite phase between 2006 and 2011.
  • Detection of abnormally high gas emissions between 2002 and 2006 in three hot springs located near the summit.
  • GPS-based measurements of considerable vertical uplift and horizontal displacement between 2002 and 2005.
  • Observation of abnormally high thermal activity in hot springs.
  • Record of surface deflation indicating new magma activity at the western and northern slopes beginning in 2009.
Consequently, the ground observations in 2010 identified the incensement of the potential volcanic activity over Mt. Baekdu. Recently, Choi et al. [5] conducted a gravity anomaly analysis using the Earth Gravitation Model (EGM) dataset covering Mt. Baekdu, and attempted to model the magma source. Due to Mt Baekdu’s close vicinity to a densely populated area, the record of potential volcanic activity has drawn considerable attention. It is, therefore, of importance to develop monitoring techniques allowing to conduct long-term observations of Mt. Baekdu. After the initial research by Zebker and Goldstein [6], volcano monitoring with Synthetic Aperture Radar (SAR) data has been conducted by a number of researchers in subsequent years [7,8,9,10,11,12]. As DInSAR techniques have commonly been considered as one of the most favourable and effective remote-sensing solutions for monitoring of volcanic activities [13,14], we here conducted a DInSAR survey over Mt. Baekdu to assess its potential activity.
To do so, a number of technical challenges needed to be solved, including:
  • Corrections due to dense vegetation canopy at the summit of Mt. Baekdu which creates low-phase coherence for the DInSAR analysis.
  • Atmospheric corrections due to significant tropospheric errors over Mt. Baekdu.
  • Sparse data in particular regarding topographic and atmospheric field and validation data.
Considering these challenges, a high-accuracy deformation detection scheme is required in order to evaluate the risk of volcanic eruptions. To address these limitations and confirm the feasibility of a DInSAR analysis for Mt. Baekdu, we tested two different approaches in this study.
Firstly, we employed a two-pass DInSAR analysis with L-band ALOS PALSAR, which was expected to produce robust observations in challenging environments due to its operation at long wavelengths. Analysis was conducted using atmospheric error correction by applying an external error-source map derived from a weather forecasting model. Secondly, SAR time series analysis techniques were applied using stable DInSAR analysis methods. These suppress atmospheric and topographic errors in surface deformation estimates by additionally employing C-band ENVISAT ASAR images.
In this study, the main focus was therefore put on establishing a reliable deformation analysis using a DInSAR methodology by minimizing the noise, and accounting for atmospheric errors. The methodologies associated with error suppression for specific area conditions and their respective outputs are described in Section 3 and Section 4, respectively. A discussion about the detected deformation and the geophysical inversion modelling work validating the DInSAR observations are summarized in Section 5.

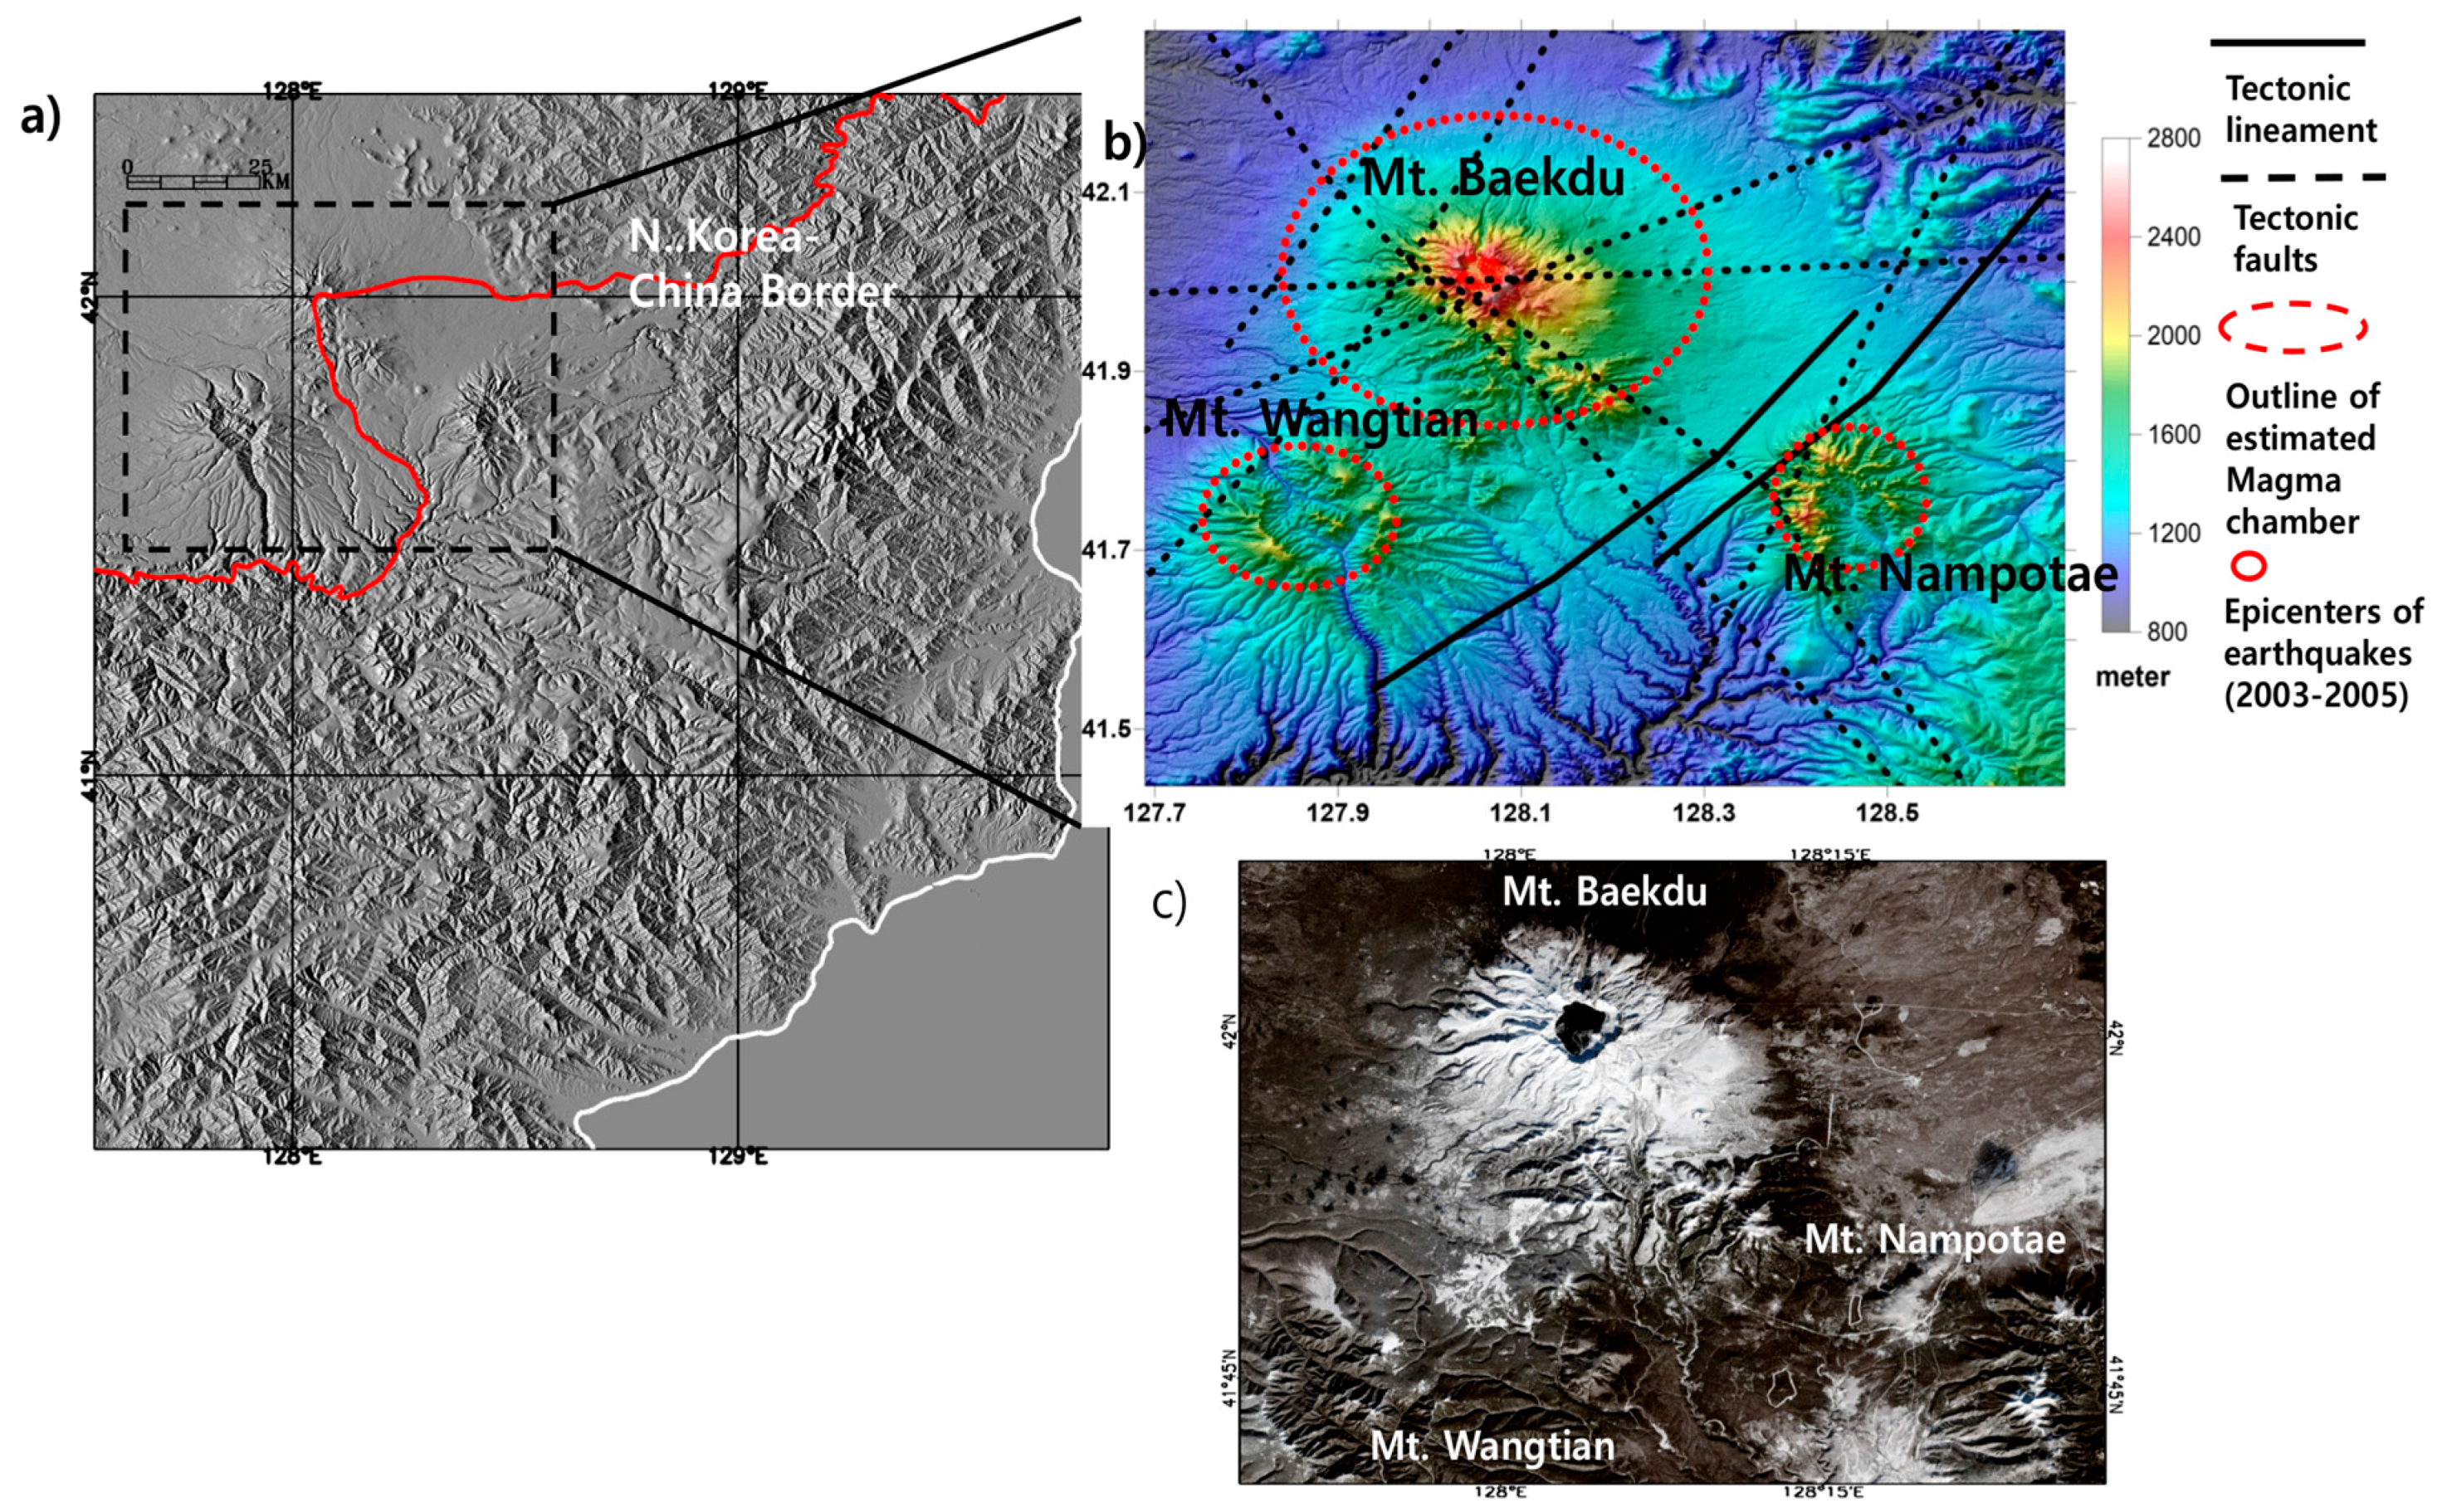
2. Target Area and Relevant SAR Analysis Issues

Baekdu Mountain is located on the border between North Korea and China. A major eruption in 1013 A.D. was estimated to have Volcanic Explosivity Index (VEI) of 7 [15]. This is comparable to Mt. Tambora’s 1815 VEI, the largest recorded historical volcanic eruption [16]. After that, it was believed that Mt. Baekdu remained dormant with the exception of a number of minor recorded eruptions (i.e., 1702 A.D, 1898 A.D, 1903 A.D, and 1925 A.D) [17]. Considering its potential for large explosive eruptions, observations should be continuously carried out to monitor the volcanic activity. Based on these observations, early warning could be provided to all of far Eastern Asia to prepare for potential disaster.
Detection and monitoring of volcano activity can be performed from various perspectives using remotely sensed data. The detection of gas emissions from the volcano is one of these methods [18]. This is based on the unusual observation of some components of the collected gases, for instance, the sudden increase in sulfur dioxide, normally indicating activation of a magmatic chamber. Remote sensing products such as thermal/near infrared imagery can also be applied to observe thermal anomalies over potential volcanoes. For instance, Vaughan and Hoot [19] pioneered volcanic activity detection using thermal anomalies derived from spaceborne image analysis. In addition, Leprince et al. [20] employed SAR and optical imagery to detect movement of the terrain. Because SAR can operate under difficult weather conditions, and covers a wide range. In this study, we select SAR images to monitor deformation. Moreover, based on the theoretical basis of Interferometric SAR (InSAR) developed by Zebker and Goldstein [6], the InSAR technique is capable of tracing surface deformation after correcting the phase angle difference produced by common topography. This is known as the DInSAR technique and was applied as the basic approach of this study.
There are few previous DInSAR studies pointing at possible reactivation of Baekdu volcano. Kim et al. [21] implemented a DInSAR analysis using JERS and ERS imagery with tropospheric delay correction and detected a maximum of 9 cm/year deformation. As the observed value was abnormally high for the normal estimated magma intrusion, it revealed, to some extent, the necessity of reliable atmospheric correction and hence became one of the objectives to be attained in this study. Recently Kim et al. [22] employed Small Baseline Subset (SBAS) analysis and detected a minor deformation over the eastern flank. However, it is unsure whether the deformation signals is related to volcanic activity considering the absence of detailed investigation of atmospheric effects with the DInSAR technique and tracing of temporal surface migration. Given the issues limiting the performance of DInSAR remote sensing observations of volcanic activity over Baekdu Mountain, potential solutions were introduced to improve the accuracy of the DInSAR observations in this paper.
As shown in Figure 1, the natural environment of the target area is the first challenge for DInSAR analysis. The target area is surrounded by very dense forests but only a small amount around the Choenji caldera. Vegetation canopy is actually covering all edifices of the Mt. Baekdu area, although the density of vegetation differs according to the altitude range. Thus, the phase coherence values of SAR pairs over the volcano are usually low and therefore the ability to produce coherent interferograms is limited. The snow cover around the summit exists even in May, and also significantly decreases the phase coherence. Less vegetated areas consisting of bare soil and brush fields exist, but those partly coincide with the snow covered area. Secondly, the slope around Choenji Lake on the flank of the mountain is greater than 25 degrees on average. As reported in Lee and Liu [23], such steep slope topography also causes loss of phase coherence. Thirdly, the height of Mt. Baekdu is 2740 m, which means the tropospheric turbulence and the electromagnetic wave delay by the vertical stratification can create significant error in DInSAR results [24,25]. Zebker et al. [26] identified that a 20% change of tropospheric humidity could produce 10 to 14 cm ground deformation error. Considering the estimated deformation in the current stage is relatively small, the error elements occurring in such high relief topography over Mt. Baekdu should be removed, including the localized water vapor component introduced by tropospheric turbulences and the vertical stratification. At last, as stated by Samsonov [27], the degradation of base Digital Terrain Model (DTM) quality may also contribute significant errors in DInSAR products. Hanssen [28] estimated a 1 cm deformation error by 1 m height difference in base DTM when performing DInSAR analysis. Hence the topographic error should be considered as well.
Based on the challenges introduced above, we estimate the contribution of atmospheric and topographic errors. Initial investigation using Moderate Resolution Imaging Spectroradiometer (MODIS) data was first performed to understand the characteristics of the atmospheric error component. In Figure 2, the water vapor distribution on the 14th of April and 5th of May in 2009 is shown in the MODIS Total Perceptible Water (TPW) MOD 5 [29] products. The depletion of water vapor around the summit of Mt. Baekdu are obvious in Figure 2a and identified less clearly in Figure 2b. The orographic effect caused by precipitation on the flanks of high-altitude mountains or plateaus and the local dryness along the other side of the mountain are clearly identified at Mt. Baekdu. The strength of this effect partly depends on some climate factors such as wind direction, so that the amount of atmospheric error of DInSAR by orthographic effect varies temporally and is not easily predictable without external water vapor observation. Meanwhile, the refractivity in wave propagation by the stratified pressure in high altitude topography produces another atmospheric error in DInSAR analysis. Thus, these atmospheric related error factors over Mt. Baekdu should be taken into account. As for the topographic error, however, the ground and aerial surveying campaigns for geodetic control of topographic products are unavailable over the area of Mt. Baekdu. As a result, the investigation and interpretation of the deformation signal including the analysis of atmospheric error are the main technical topic of this study.

3. Processing Strategy and Data Sets

To address atmospheric error issues, the water vapor correction method developed by Li et al. [30,31,32] was employed in this study. Since Medium Resolution Imaging Spectrometer (MERIS) sensor which was the source of water vapor information shares the same satellite platform with the ENVISAT ASAR system, there is no temporal gap exists between each SAR image acquisition and the water vapor data, allowing for reliable error estimates could be achieved [31,32].
In addition, methods based on InSAR time series calculation based on stacked interferograms allow to estimate and reduce the errors, such as Permanent Scatterers (PS) by Ferretti et al. [33,34] and SBAS by Berardino et al. [35]. However, although these methods are feasible for solving atmospheric error, the processing efficiency and required number of SAR image sequences become limitations in employing these approaches. Considering both the estimated small deformation and the low phase coherence in the target area, two-pass DInSAR processing using error correction based on a high-resolution weather forecasting model and improved interferogram time series analysis, were applied and cross-validated.

3.1. Two Pass DInSAR with Atmospheric Error Compensation

With the characteristic of long wavelength, the L-band SAR has significant merits for producing coherence when observing high altitude volcanoes which are covered with snow and vegetation. Therefore, in Mt. Baekdu target area, it is preferable to employ ALOS PALSAR which is currently the only available L-band spacebone SAR at the time of this paper preparation. However there are only16 SAR images covering three years time interval over Mt. Baekdu which is not suggested to establish time series in order to conduct stable PS and/or SBAS processing [36]. Thus, instead of time series analysis, we track the surface deformation using two pass ALOS PALSAR DInSAR analyses were conducted. Moreover, the terms involving electromagnetic wave propagation delay in troposphere over Mt. Baekdu were estimated and removed. The amount of tropospheric phase change was computed based on the formula using pressure estimation and corresponding height value and total water vapor. It is simply summarised as:
Ф t r o p o s p h e r i c = 4 π λ c o s Θ ( Z D D D + Z W D D ) ,
where ZDDD is zenith dry delay difference and ZWDD is zenith wet delay difference, both in unit of λ , and Θ is the incidence angle of SAR images.
Basically the ZDDD can be estimated as the pressure and temperature which are correlated with the altitude. Thus, with a number of weather observations, the estimation and the correction of dry component can be achieved using the relationship listed below.
Z D D D = Z D D m Z D D s ,
Z D D = ( 2.2779   +   0.024 ) P s f ( l a t , H )
from   which   f ( l a t , H ) = 1 0.000266   c o s ( 2 l a t ) 0.00028 H ,
where ZDDm is zenith dry delay for the master image (see [37] for detailed model), ZDDs is zenith dry delay for the slave image, Ps (in Hpa) is the surface pressure, lat is the latitude (in degrees) of target area and H (in km) is the height.
Compared with the dry delay correction, the effect of wet delay induced by water vapor is relatively significant and difficult to estimate. As a result, many different approaches have been proposed by which to estimate and rectify the magnitude of the wet delay. The model shown in [32] was used in this study:
Z W D D =   Z W D m Z W D s ,
Z W D = c   T P W V = c I W V P w ,
where ZWDm is zenith wet delay in master, ZWDs is zenith wet delay in slave, Pw is the density of water, IWV is the total amount of water vapor over an observation point and c is a conversion factor for the total perceptible water vapor (TPWV) to ZWD. According to [38], c is very close to 6.67 although there is some dependency on temperature.
Since it is not feasible to achieve global water vapor distribution with dense enough GPS delay observations or radiometer measurements, Li et al. [31,32] used water vapor data derived from MODIS and MERIS as another solution. However, the cloud coverage issue and the temporal gap between each SAR image acquisition and the water vapor estimation limits the feasibility of the method. Although high accuracy water vapor data from MERIS with sufficient spatial resolution is available occasionally, the temporal gap between MERIS and ALOS PALSAR image acquisitions cannot be avoided. Especially, considering the high mountainous areas are seldom free from cloud coverage over the time acquisition of MERIS and MODIS, it is required to use another source of water vapor data.
In this study, we use high resolution water vapor maps derived from weather forecasting models to correct for two pass DInSAR in the error correction procedure, based on previous research conducted by Wedge et al. [39], Foster et al. [40] and Nico et al. [41].

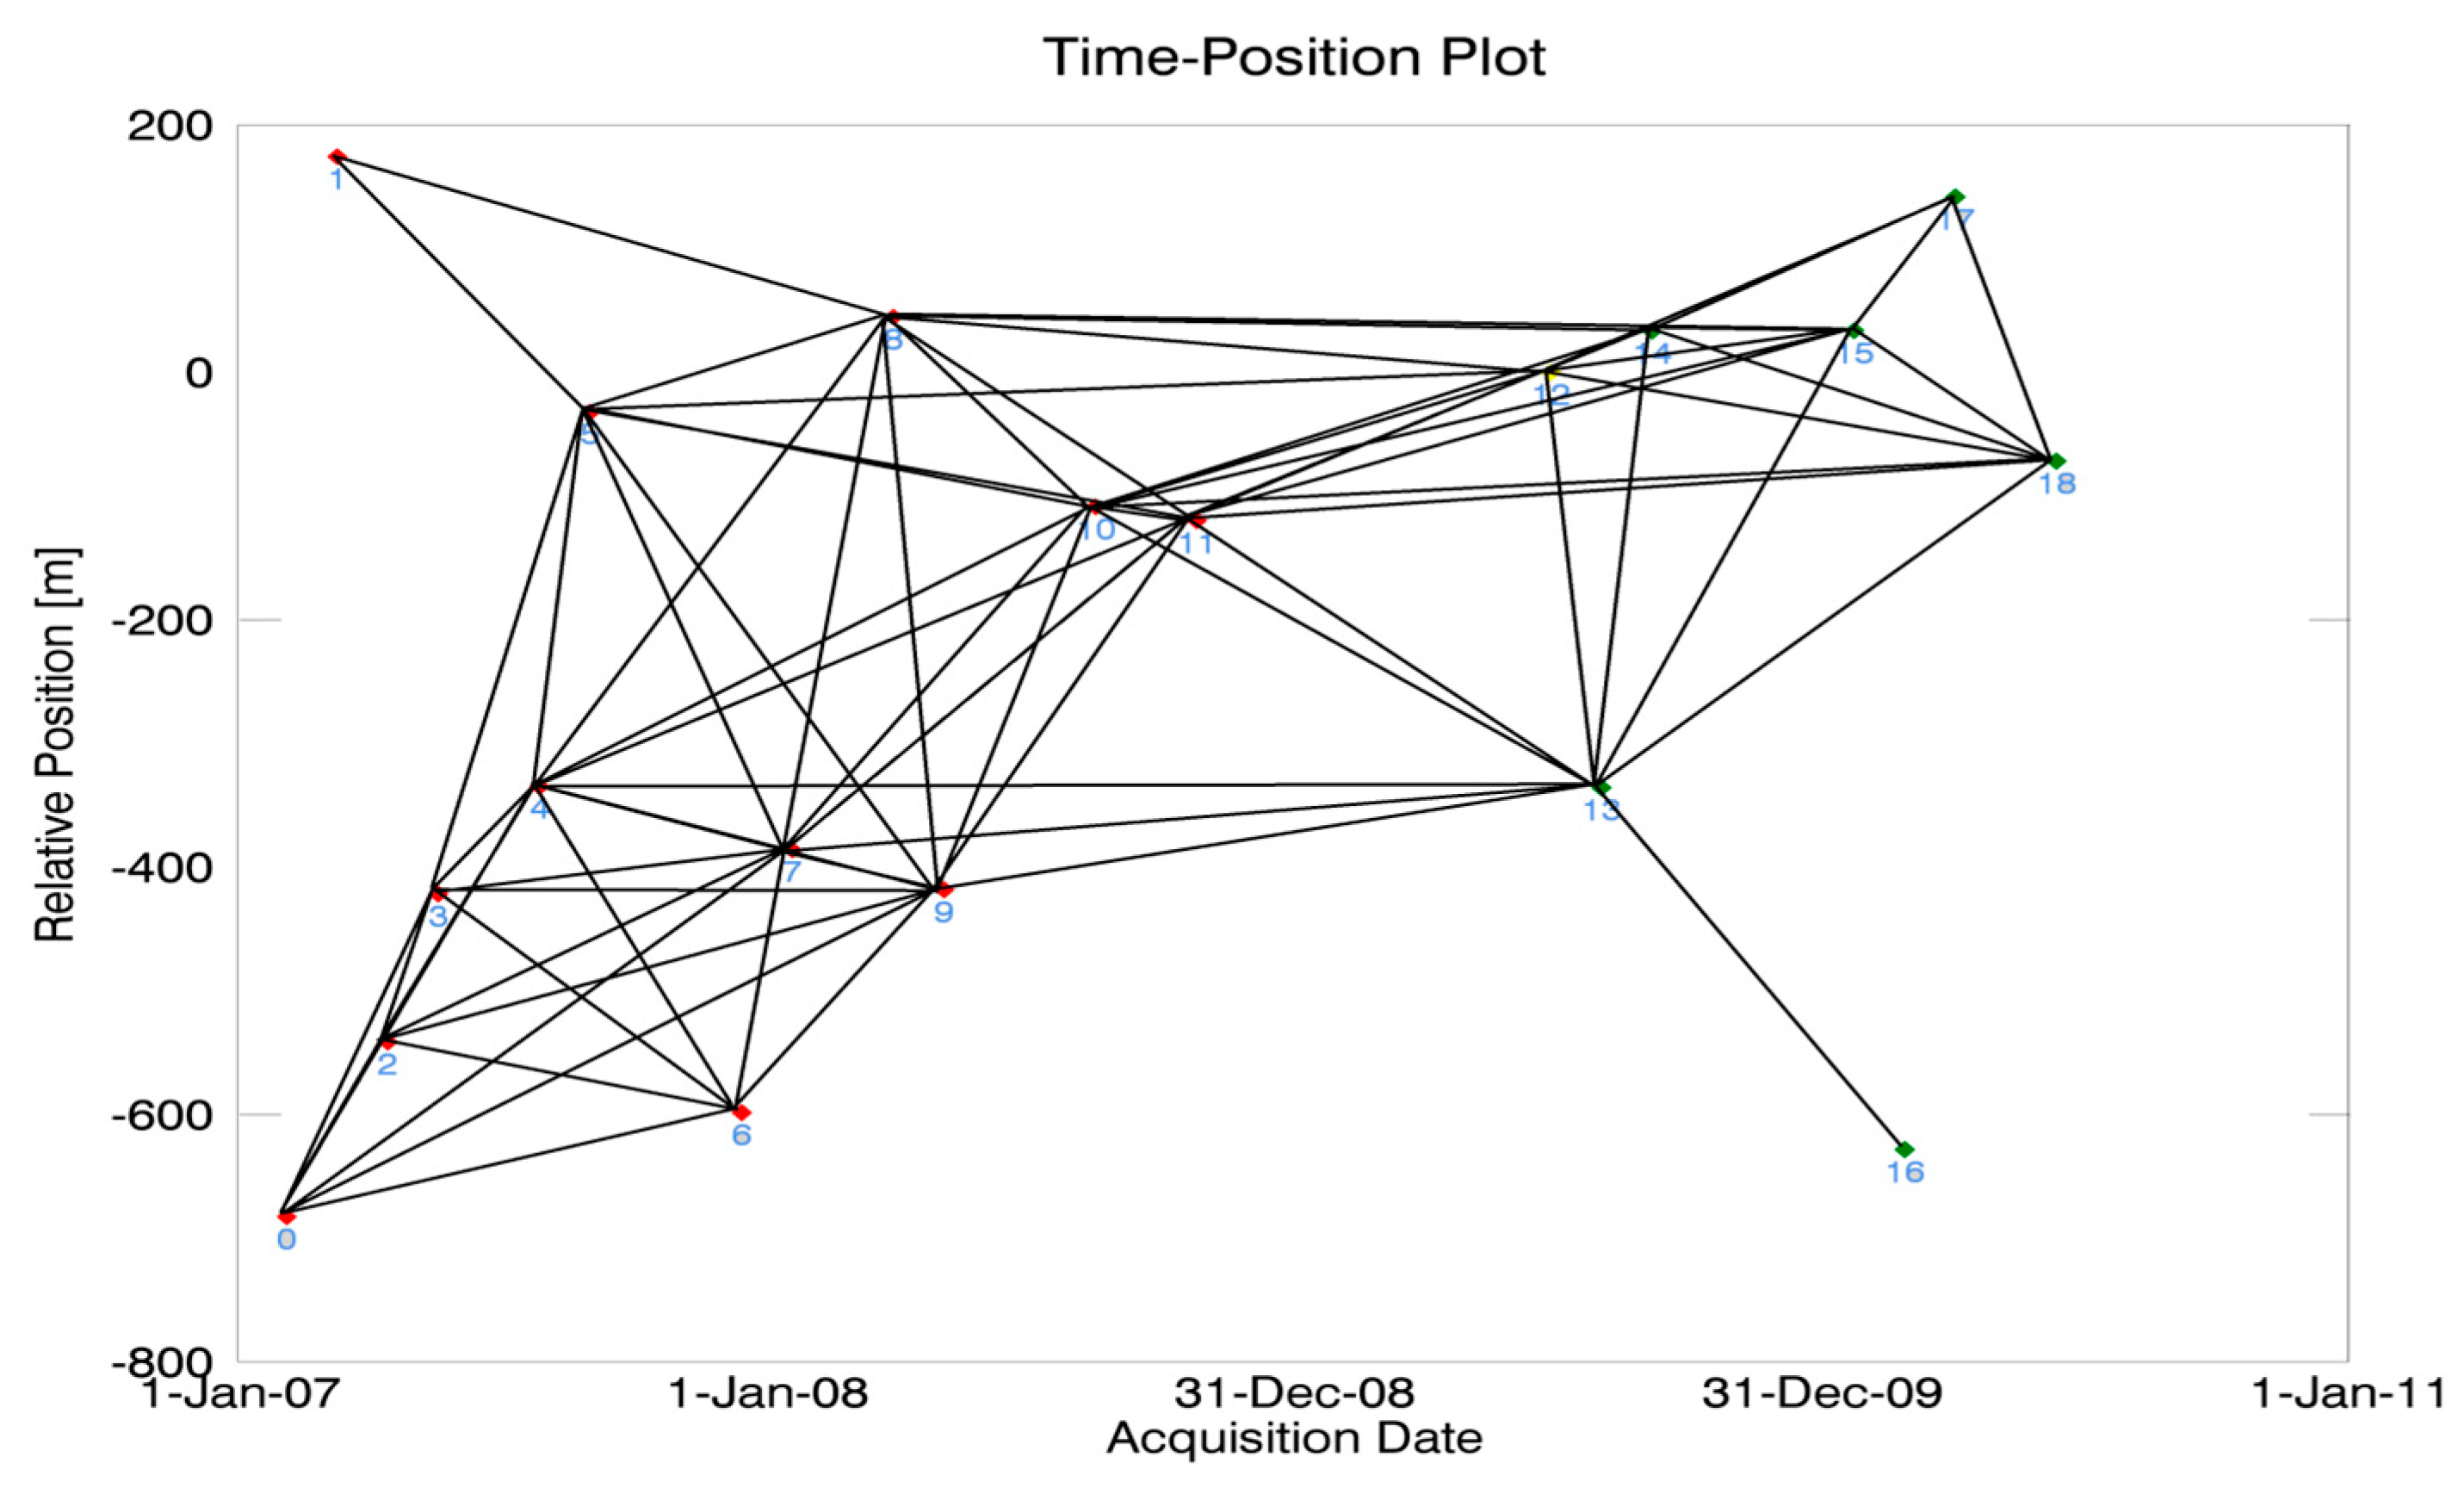
3.2. Time Series Analysis with StaMPS/MTI Approach

PS-InSAR [33] and SBAS [35] are two methods widely used for performing time series analysis. Nevertheless, a number of limitations were encountered when applying the two methods over the target area. For PS-InSAR processing, the temporal and spatial baseline conditions between SAR images in this study were inadequate for extracting persistent scatterers. This is because a minimum of 25 pairs is necessary to build reliable PS results [36]. In addition, because vegetation cover exists in the high-altitude area around the summit, it was not expected that a sufficient number of persistent scatterers could be extracted. The SBAS processing employs all the appropriate DInSAR pair with small baselines [35]. Once the stacked differential interferogram is constructed, a linear system consisting of a small baseline combination matrix, phase values, and mean phase velocities are calculated. Singular Value Decomposition (SVD) together with LP (low pass) and HP (high pass) filters are used to extract the spatial and temporal components of the noise. The atmospheric, orbital and base DEM artifacts are estimated and corrected, and then the deformation velocities can be derived. Although in common cases the SBAS approach is capable of achieving high density deformation rate, some interferograms with low phase coherence may produce unreliable results as a consequence of permanent snow and cover vegetation on Mt. Baekdu.
To resolve all these issues, a complementary approach developed by Hooper [42] for combining PS-InSAR and SBAS was employed in this study. Although conventional PS-InSAR results showed satisfactory performance for monitoring the target area where artificial scatterers were widely populated, as shown by Colesanti et al. [36], it is difficult to define the sufficient number of PS over the vegetated mountain area where the stable scatterer such as artificial structures are absent. Hooper et al. [43] tackled this problem by introducing a new method for PS definition by investigating spatial and temporal correlation of phase, and extracted reliable results over natural landscape terrain. The algorithm was later updated using spatial and temporal correlation of interferogram phase to find pixels with low-phase variance in all terrains [44] and produced reliable deformation over Volcano Alcedo (Galapagos) where the vegetation extended even up to the highest altitude. Subsequently, the algorithm was improved by incorporating the PS and SBAS results by applying the spatial and temporal correlation tracking method of phase for SBAS interferograms [42]. Consequently, this approach increased the spatial sampling resolution of deformation measurement, as well as the reliability of the phase cycle.
The measurement of PS pixel was conducted by measuring the variation of residual phase in the time series [43]:
γ x = 1 N [ i = 1 N exp { 1 ( Ф x , i Ф ¯ x , i Ф ^ ex , i ) } ] ,
where N is the number of interferogram, Фx,i is the phase change in pixel x, Ф ¯ x , i is the phase change in sample mean within window patch and Ф ^ ex , i is the estimated phase change residual with window patch. If the value is smaller than a predefined threshold, it was considered as a stable scatterer.
The StaMPS/MTI (Stanford Method for Persistent Scatterers/Multi-Temporal InSAR) software implementing InSAR persistent scatterer (PS) method and SBAS [42] was employed to determine the PS pixels over the target area with high challengeable conditions for PS tracking. Based on the identified time series PS pixels, the displacement occurring over the target areas could be identified. Successful monitoring in similar condition and approach were reported in Hooper et al. [44], Pinel et al. [45], Chang et al. [46] and Decriem et al. [47].
The StaMPS/MTI processing began with two pre-processing steps. The first was to focus the raw data, and the second was to form interferograms from single-look complex (SLC) images in which JPL’s Repeat Orbit Interferometry PACkage (ROI-PAC) was applied for interferogram calculation [48]. Based on the coherence and amplitude data produced by ROI-PAC, PS candidates were selected and permanent PS pixels were further identified in the StaMPS routine. Then the Statistical-cost, Network-flow Algorithm for Phase Unwrapping (SNAPHU) package [49] was used to unwrap the PS phase. At the last stage, the StaMPS/MTI was implemented again to perform DEM error correction and atmospheric filtering. The ground displacement was also solved at this stage.

3.3. Data Sets

A number of 4 ALOS PALSAR images listed in Table 1 are used for two pass DInSAR processing. Additionally, in order to examine the reliability of the water vapor map produced by spaceborne data, the water vapor products from MODIS Total Perceptible Water (TPW) MOD 5 [29] was also acquired. Due to the consistent cloud coverage over the summit in Mt. Baekdu, it was judged visually that it was not feasible to find complete MODIS water vapor product covering target area. To overcome the limitation, Kriging interpolation capable of reconstructing natural 3D surface from largely voided spatial measurements was employed to spatially interpolate water vapor from MODIS TPW products. Then two water vapor maps before and after each SAR acquisition time are linearly temporally interpolated into the water vapor map for each SAR acquisition time. The resulting spatially and temporally interpolated water vapor maps for the first ALOS PALSAR DInSAR pair are shown in Figure 3. The water vapor map for the slave SAR images (Figure 3b) show proper water vapor depletion but the one for the master SAR image (Figure 3a) shows a very different pattern from the expected orthographic water vapor distribution probably caused by an over-populated cloud cover. As the MODIS/MERIS water vapor products for another ALOS PALSAR pair possess even more cloud coverage and long temporal gaps, it was not possible to utilize the MODIS/MERIS water vapor product for the two pass DInSAR correction over Mt. Baekdu. Instead, the water vapor map produced through weather forecast modelling was applied.
ENVISAT ASAR imagery was chosen for the time series analysis owing to constant image acquisitions during the 2007–2010 period. A total of 19 ENVISAT ASAR C-band images in descending mode are available (see Table 2). It is sufficient to apply the proposed interferogram time series analysis in target area.

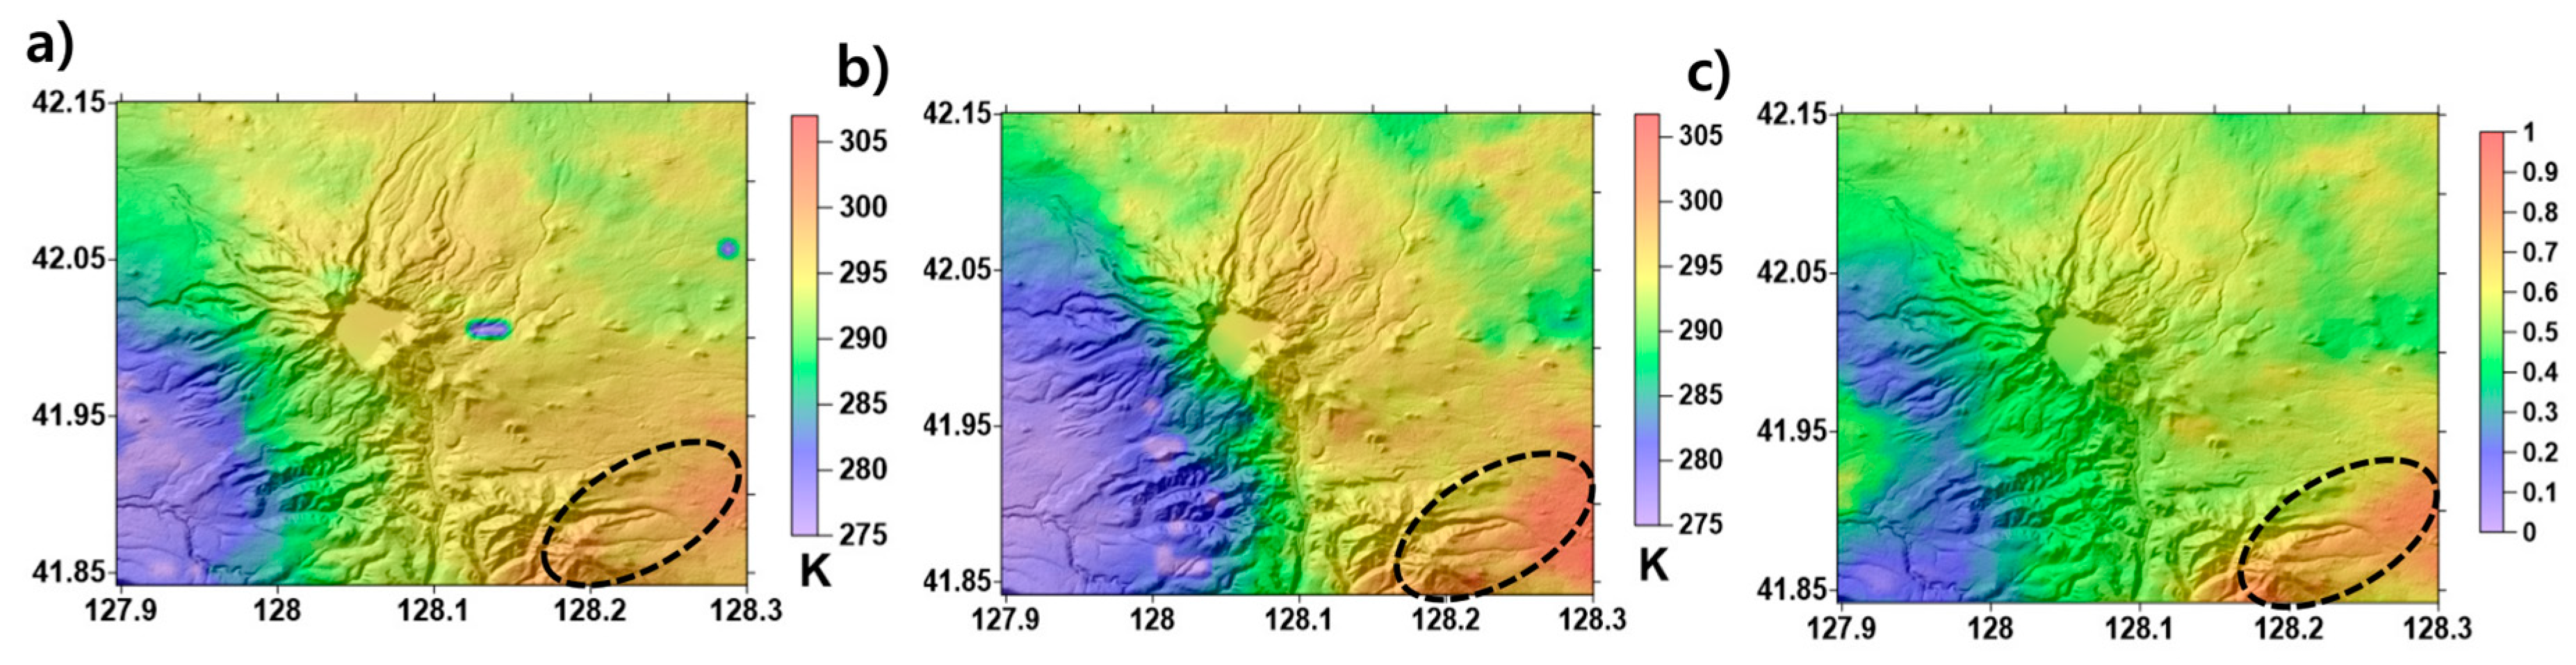
3.4. WRF Model Processing

For the reasons stated above, the weather forecasting model was employed to create the water vapor and surface pressure products for atmospheric correction of DInSAR processing. The Fifth-Generation Penn State/NCAR Mesoscale Mode (MM5) (see [40,50]) used in precedent researches [41] successfully demonstrated the capability of the Weather Research and Forecasting (WRF) model for the error migration of InSAR. Hence the version 3.2.1 Advanced Research WRF (WRF-ARW) [51] was applied for the construction of weather model. The predicted domain consists of 60 × 60 grids with 2 km spatial resolution and 40 vertical levels covering ±3 h of corresponding SAR image acquisition time. For the initial and boundary condition of the WRF model, the National Center for Environmental Prediction Final (NCEP_FNL) Global Analysis data was used as a reference. The NCEP_FNL data have 1°×1° grids with 26 vertical levels, and are produced every 6 h [52]. The microphysics was dealt with using the WRF Single-Moment 6-class (WSM 6) scheme [53]. The radiation was calculated using the Rapid Radiative Transfer Model (RRTM) scheme [54] for longwave radiation, and the MM5 scheme [55] for shortwave radiation. The surface layer was simulated using the MM5 similarity scheme [56,57,58]. The land surface was processed using the Noah and Surface Model [59]. The planetary boundary layer and urban surface were performed using Yonsei University (YSU) scheme [60] and Kain-Fritsch scheme [61], respectively.

4. Processing Results

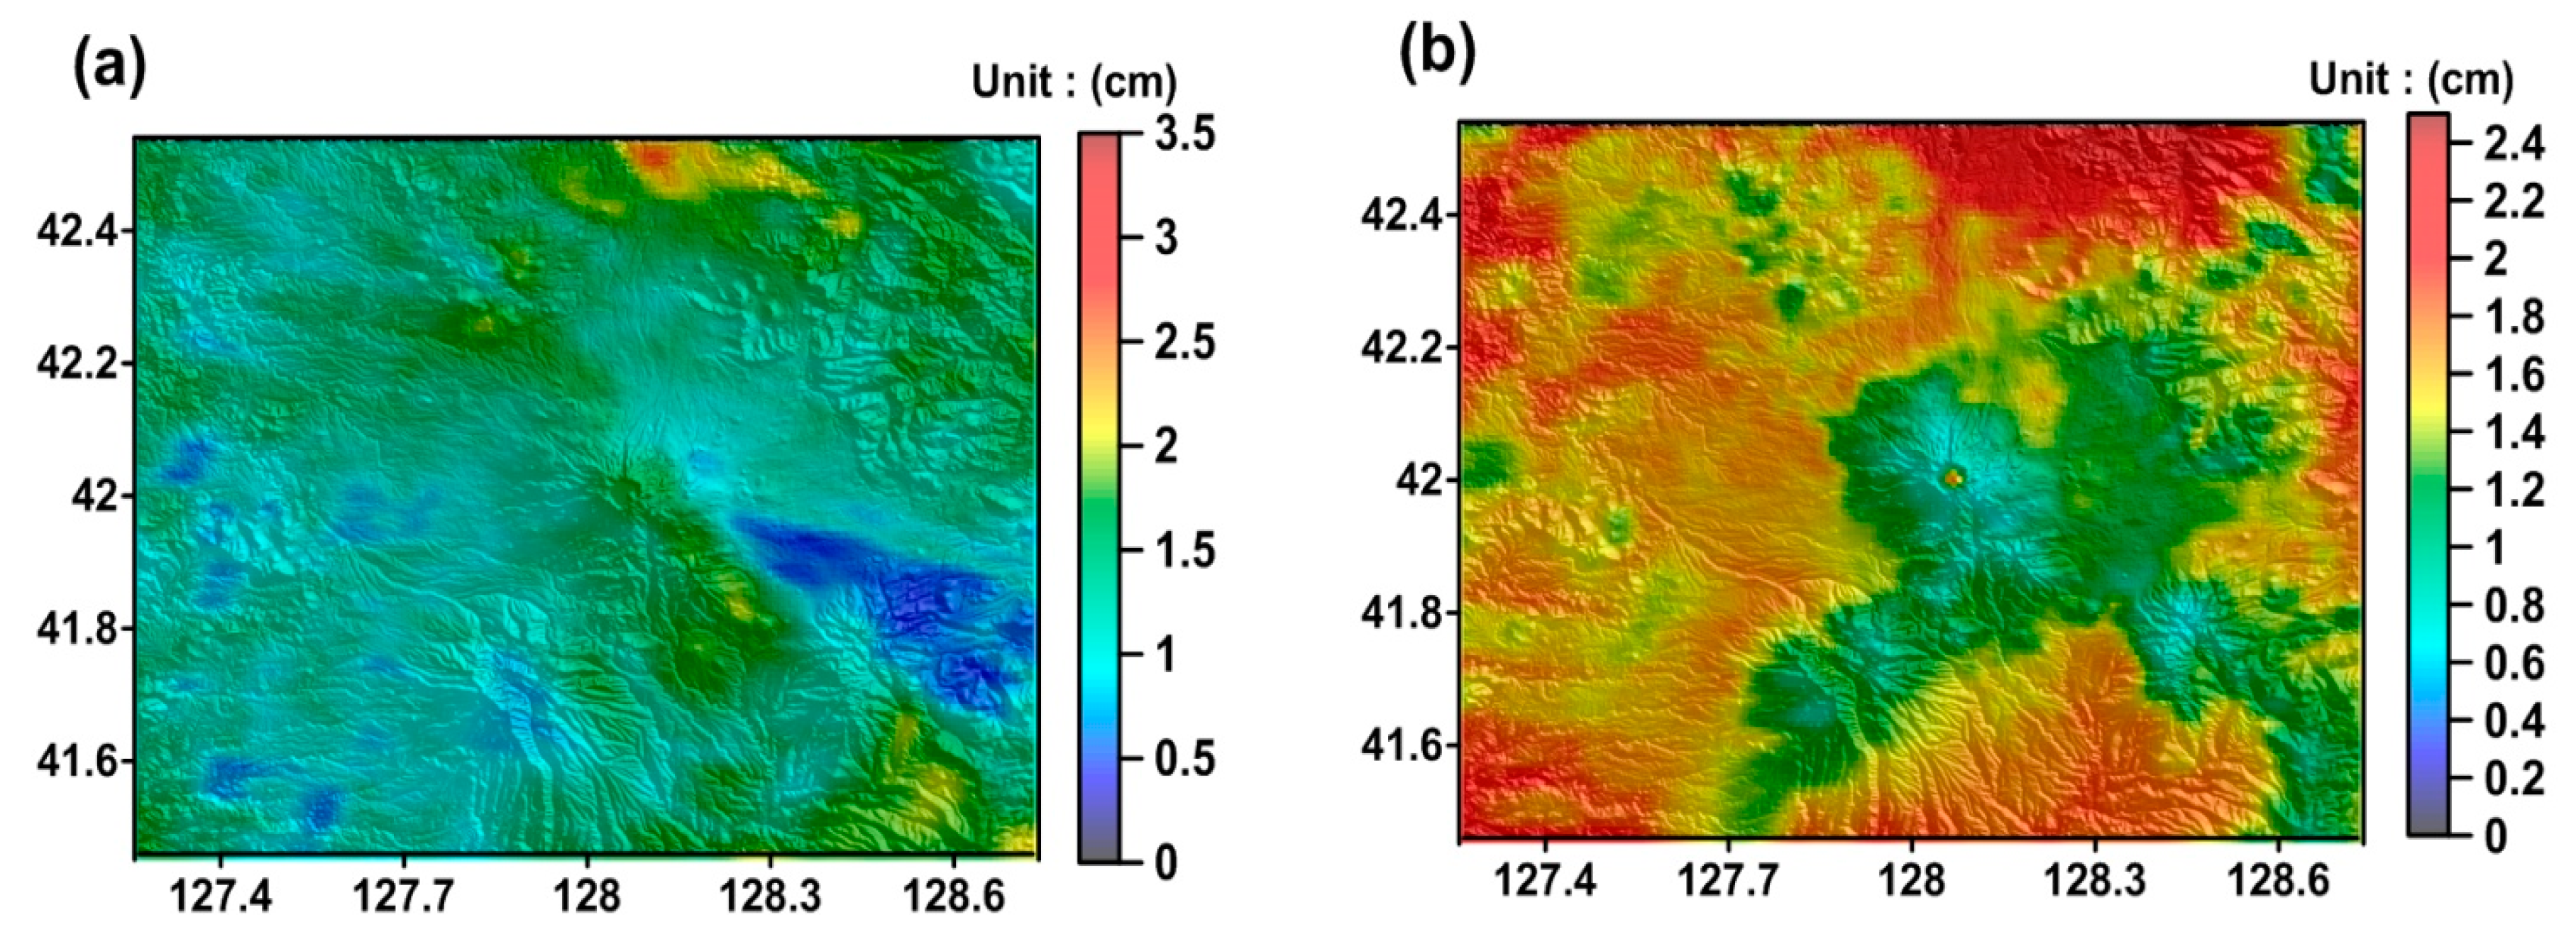
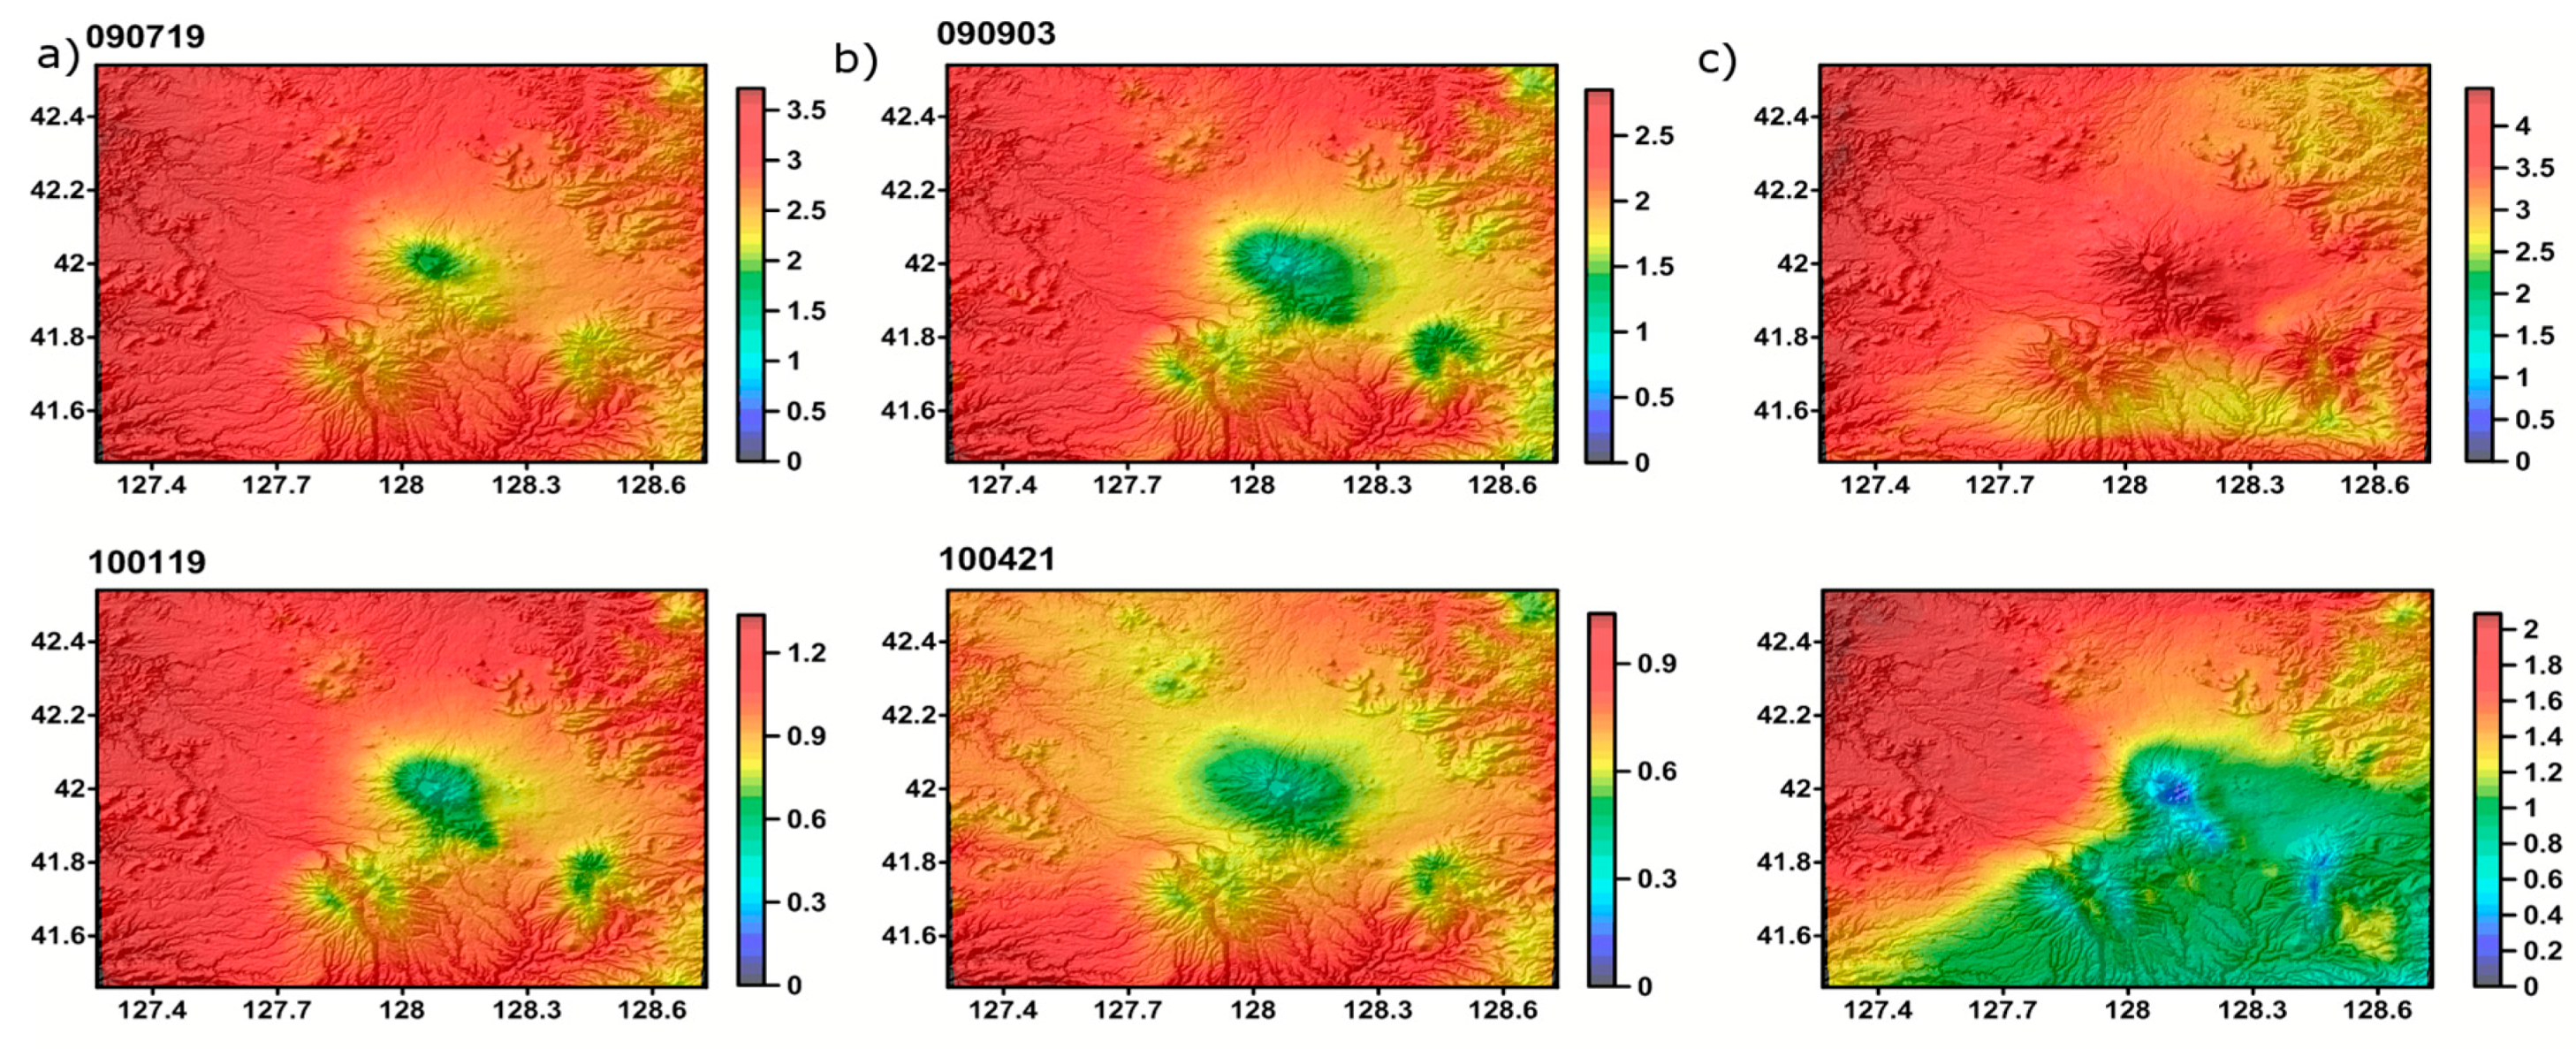
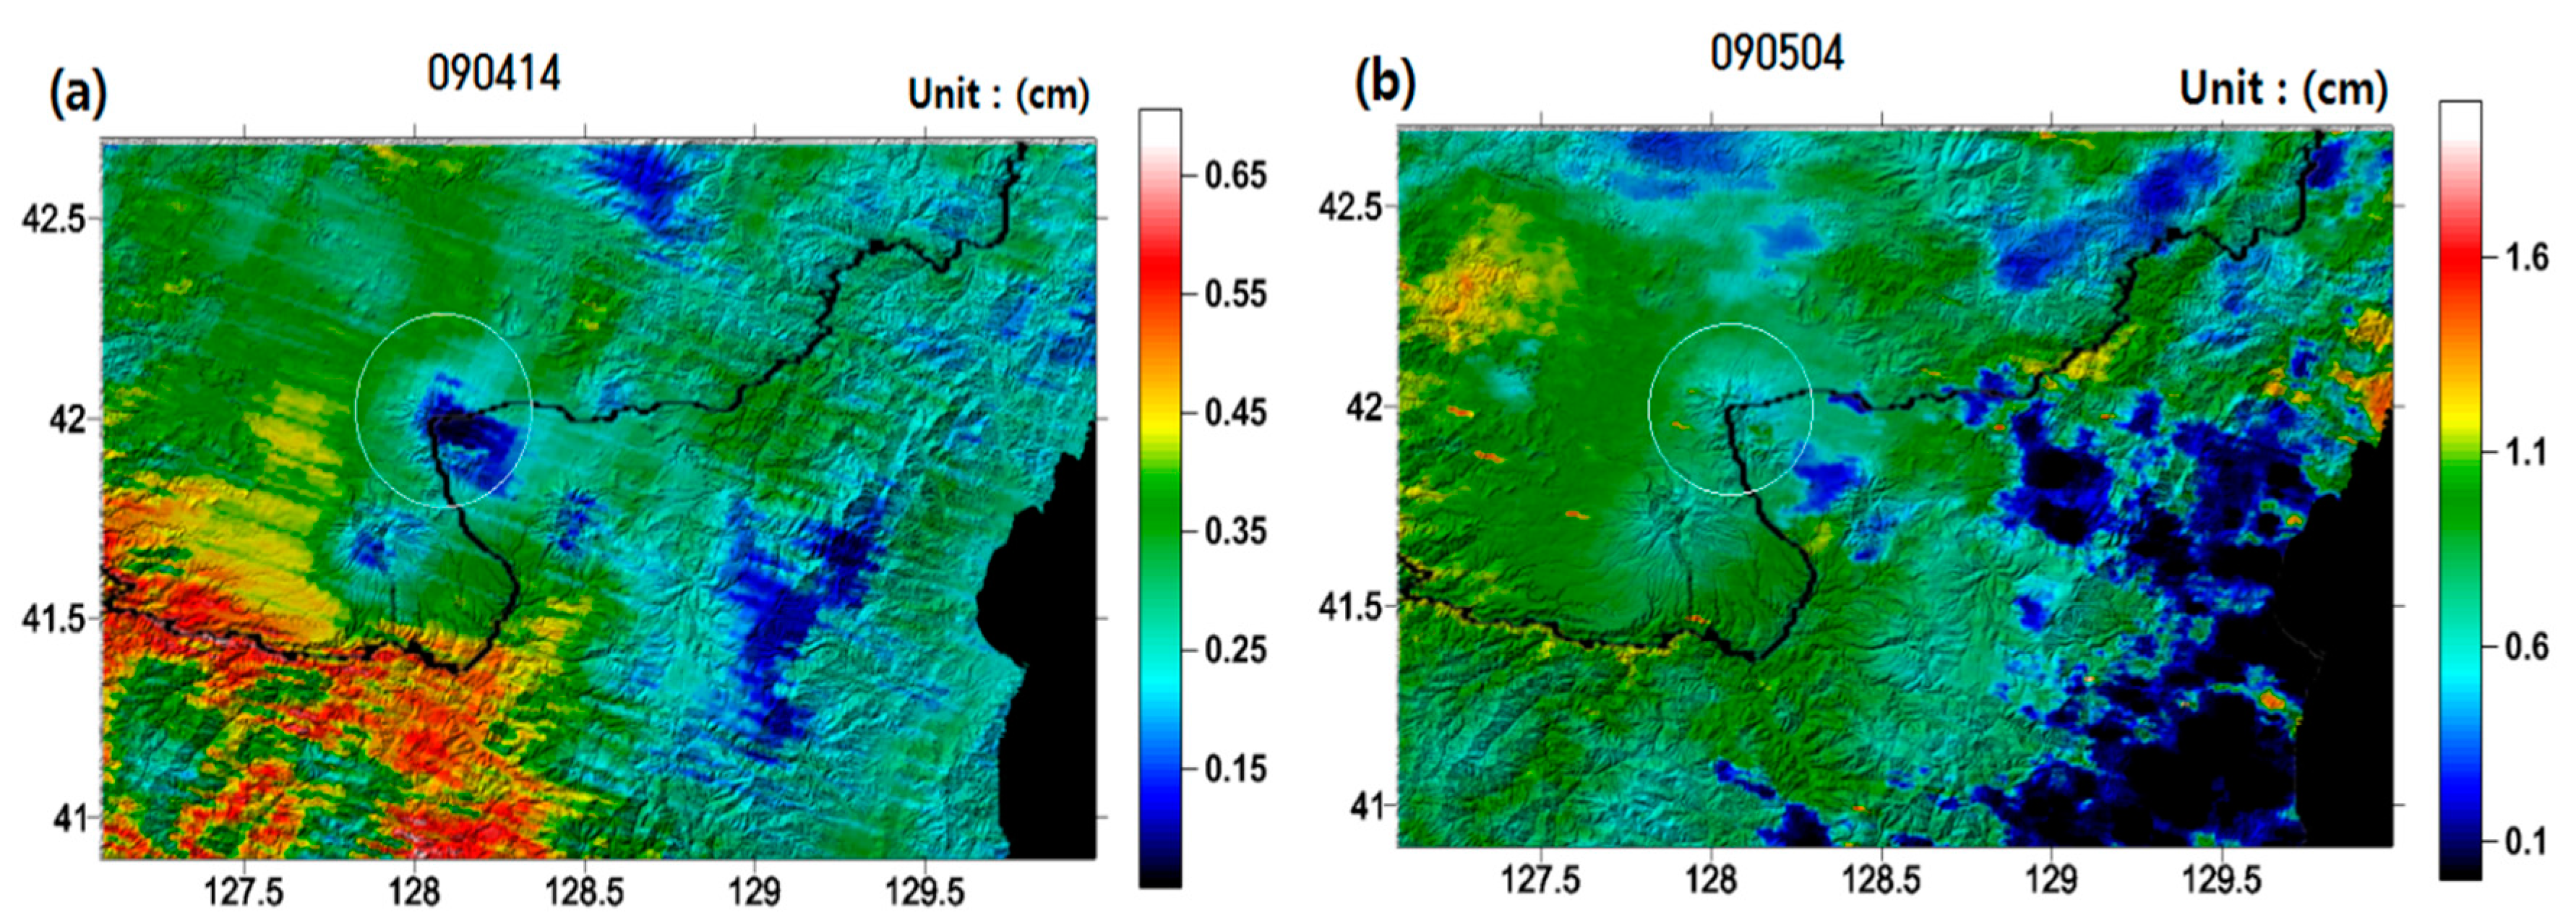
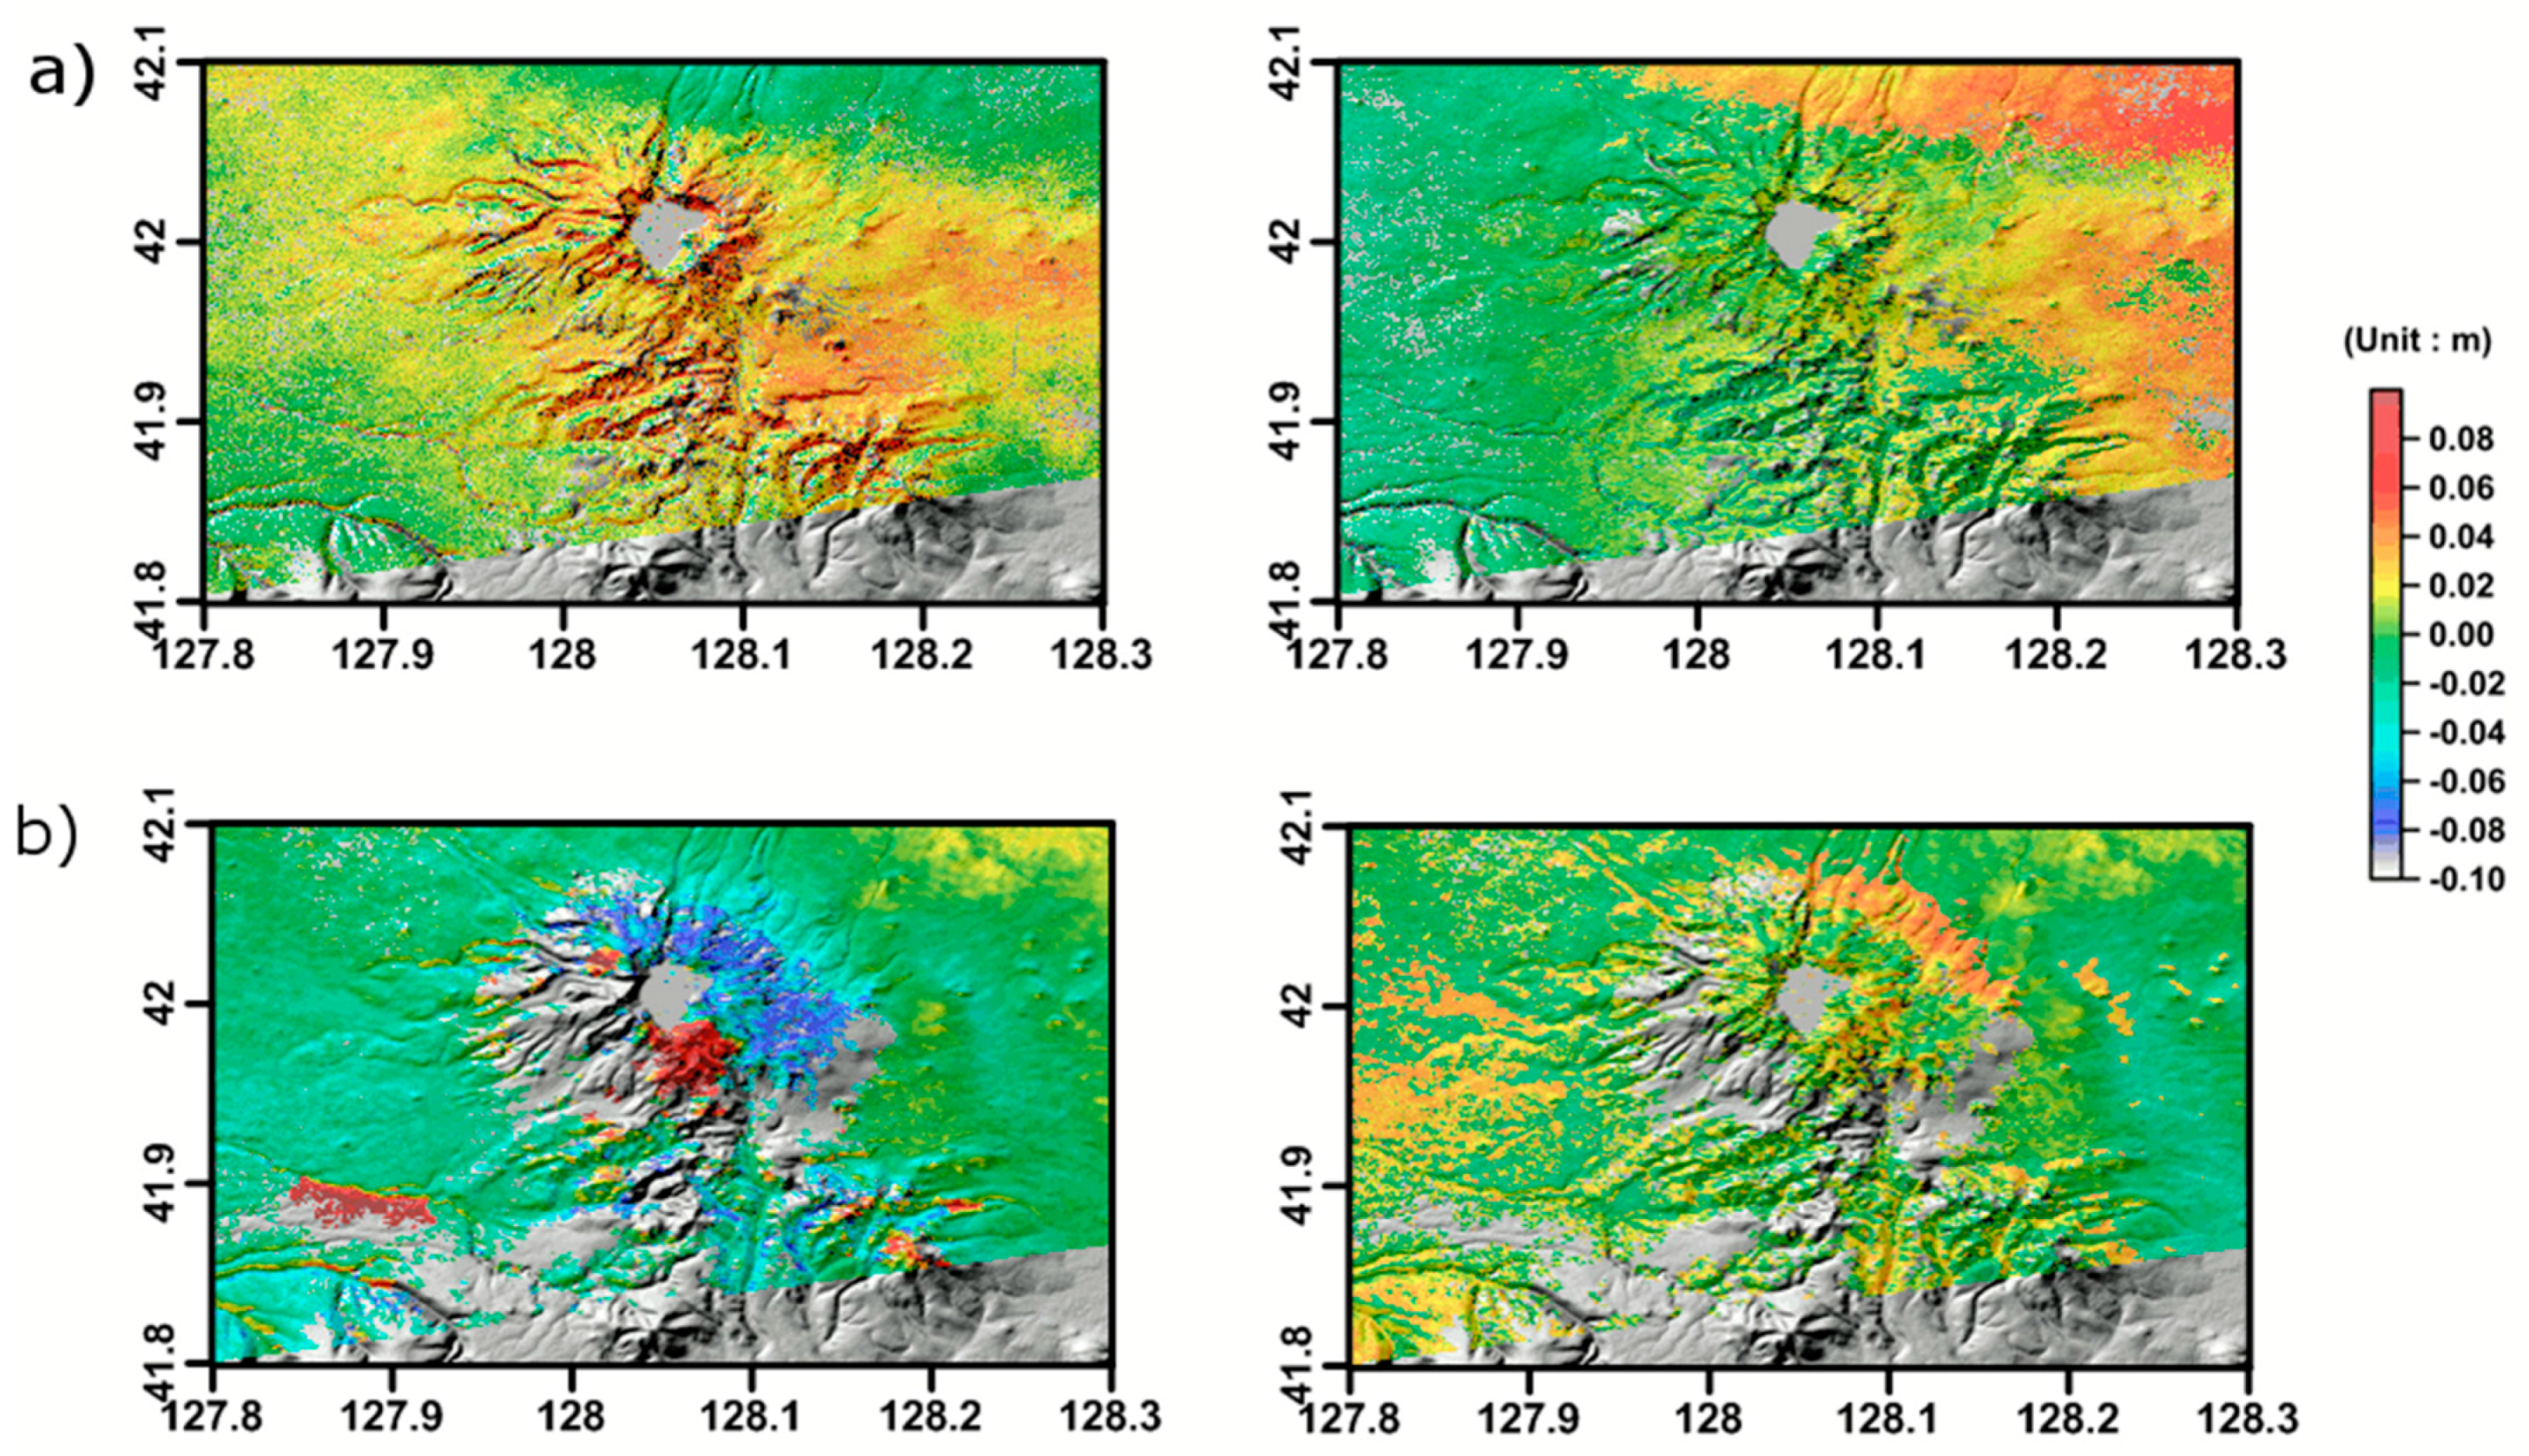
4.1. Validation of the Atmospheric Error Model and Two Pass DInSAR Analyses Using ALOS PALSAR

Following the method and data described in Section 3.4, the WRF simulation was performed and the atmospheric models on the 4 ALOS PALSAR image acquisition dates were extracted. All quantities derived from WRF were subsequently converted to total water vapor following Equation (7):
T P W = 1 2 G [ ( q i + q i + 1 ) ( p i p i + 1 ) ] ,
where G is the universal gravitation constant, qi is the water vapor mixture ratio in ith layer and pi is the pressure in ith layer. The computed result was used for the DInSAR wet delay correction.
Once the two WRF maps for the master and slave images were constructed (Figure 4a,b), the ZWDD of DInSAR was extracted using Equation (4). It was clearly showed that the constructed water vapor from WRF successfully caught the water vapor void around the mountain summits due to orographic effects. Although the direct inter-comparison was not possible due to the temporal gap between MODIS water vapor and WRF simulation, the interpolated MODIS water vapor from the cloud free raw products and water vapor from WRF show similarities to some extents as shown in Figure 3b and Figure 4b. Together with ZDD, based on the surface pressure in WRF and Equation (6), the total delay map was constructed and is shown in Figure 4c. The constructed total delays then were applied into DInSAR analyses. Figure 5 shows the deformation field derived from DInSAR analyses conducted with the error correction method described above.

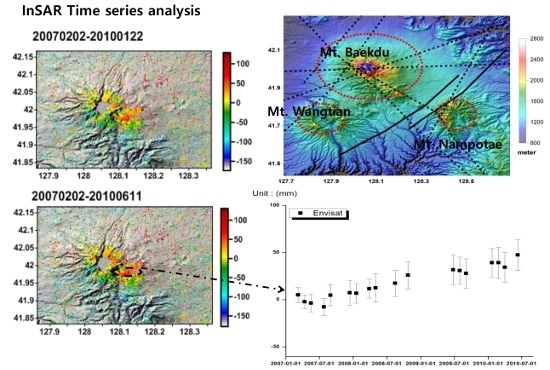
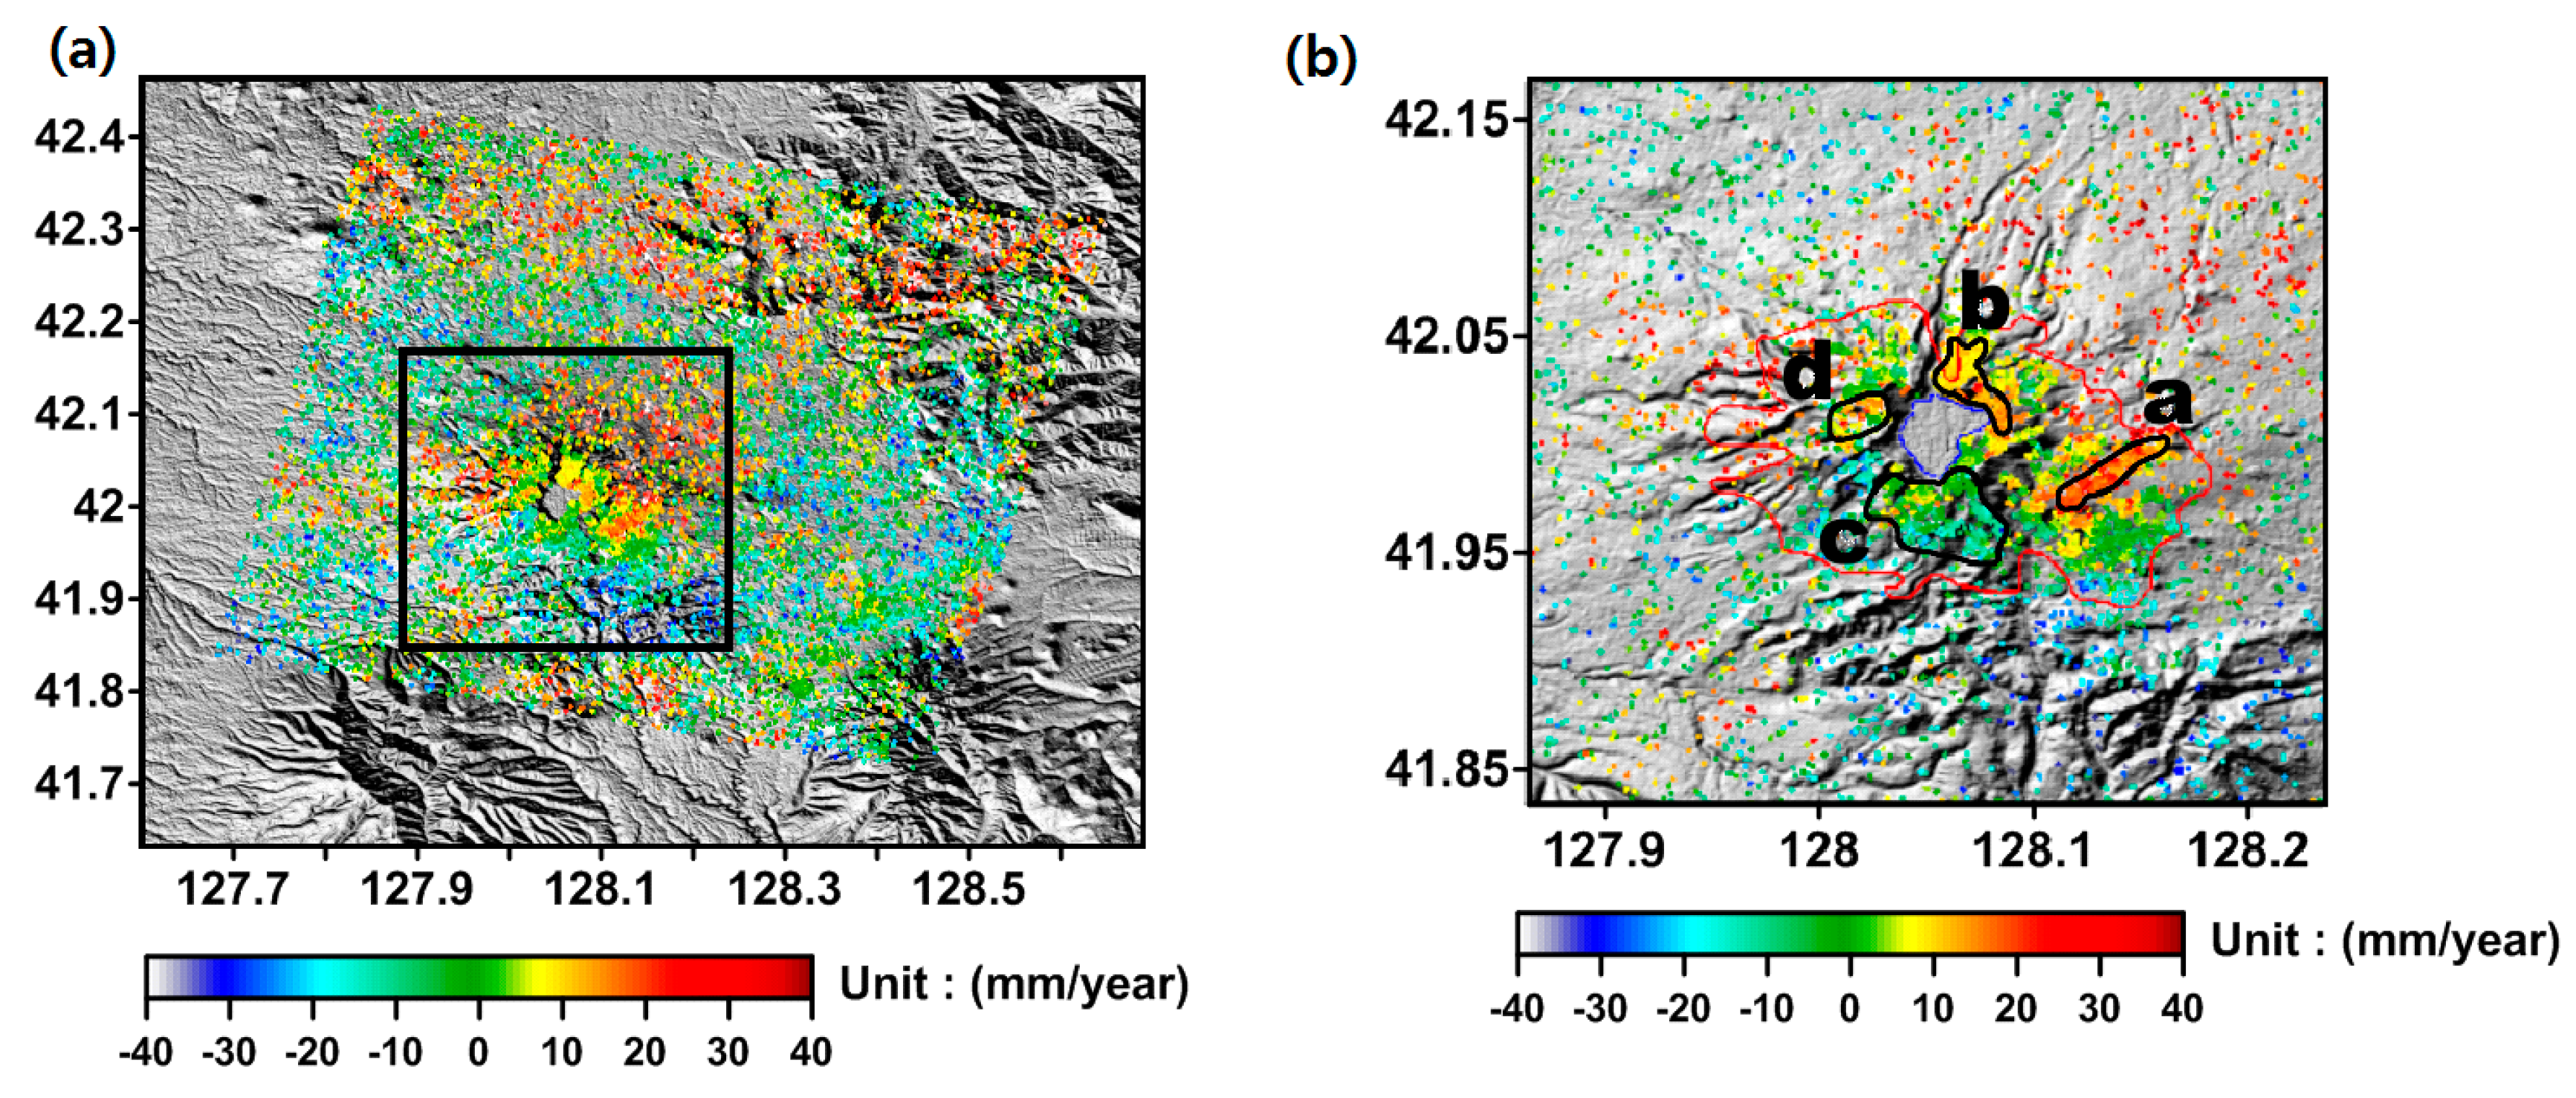
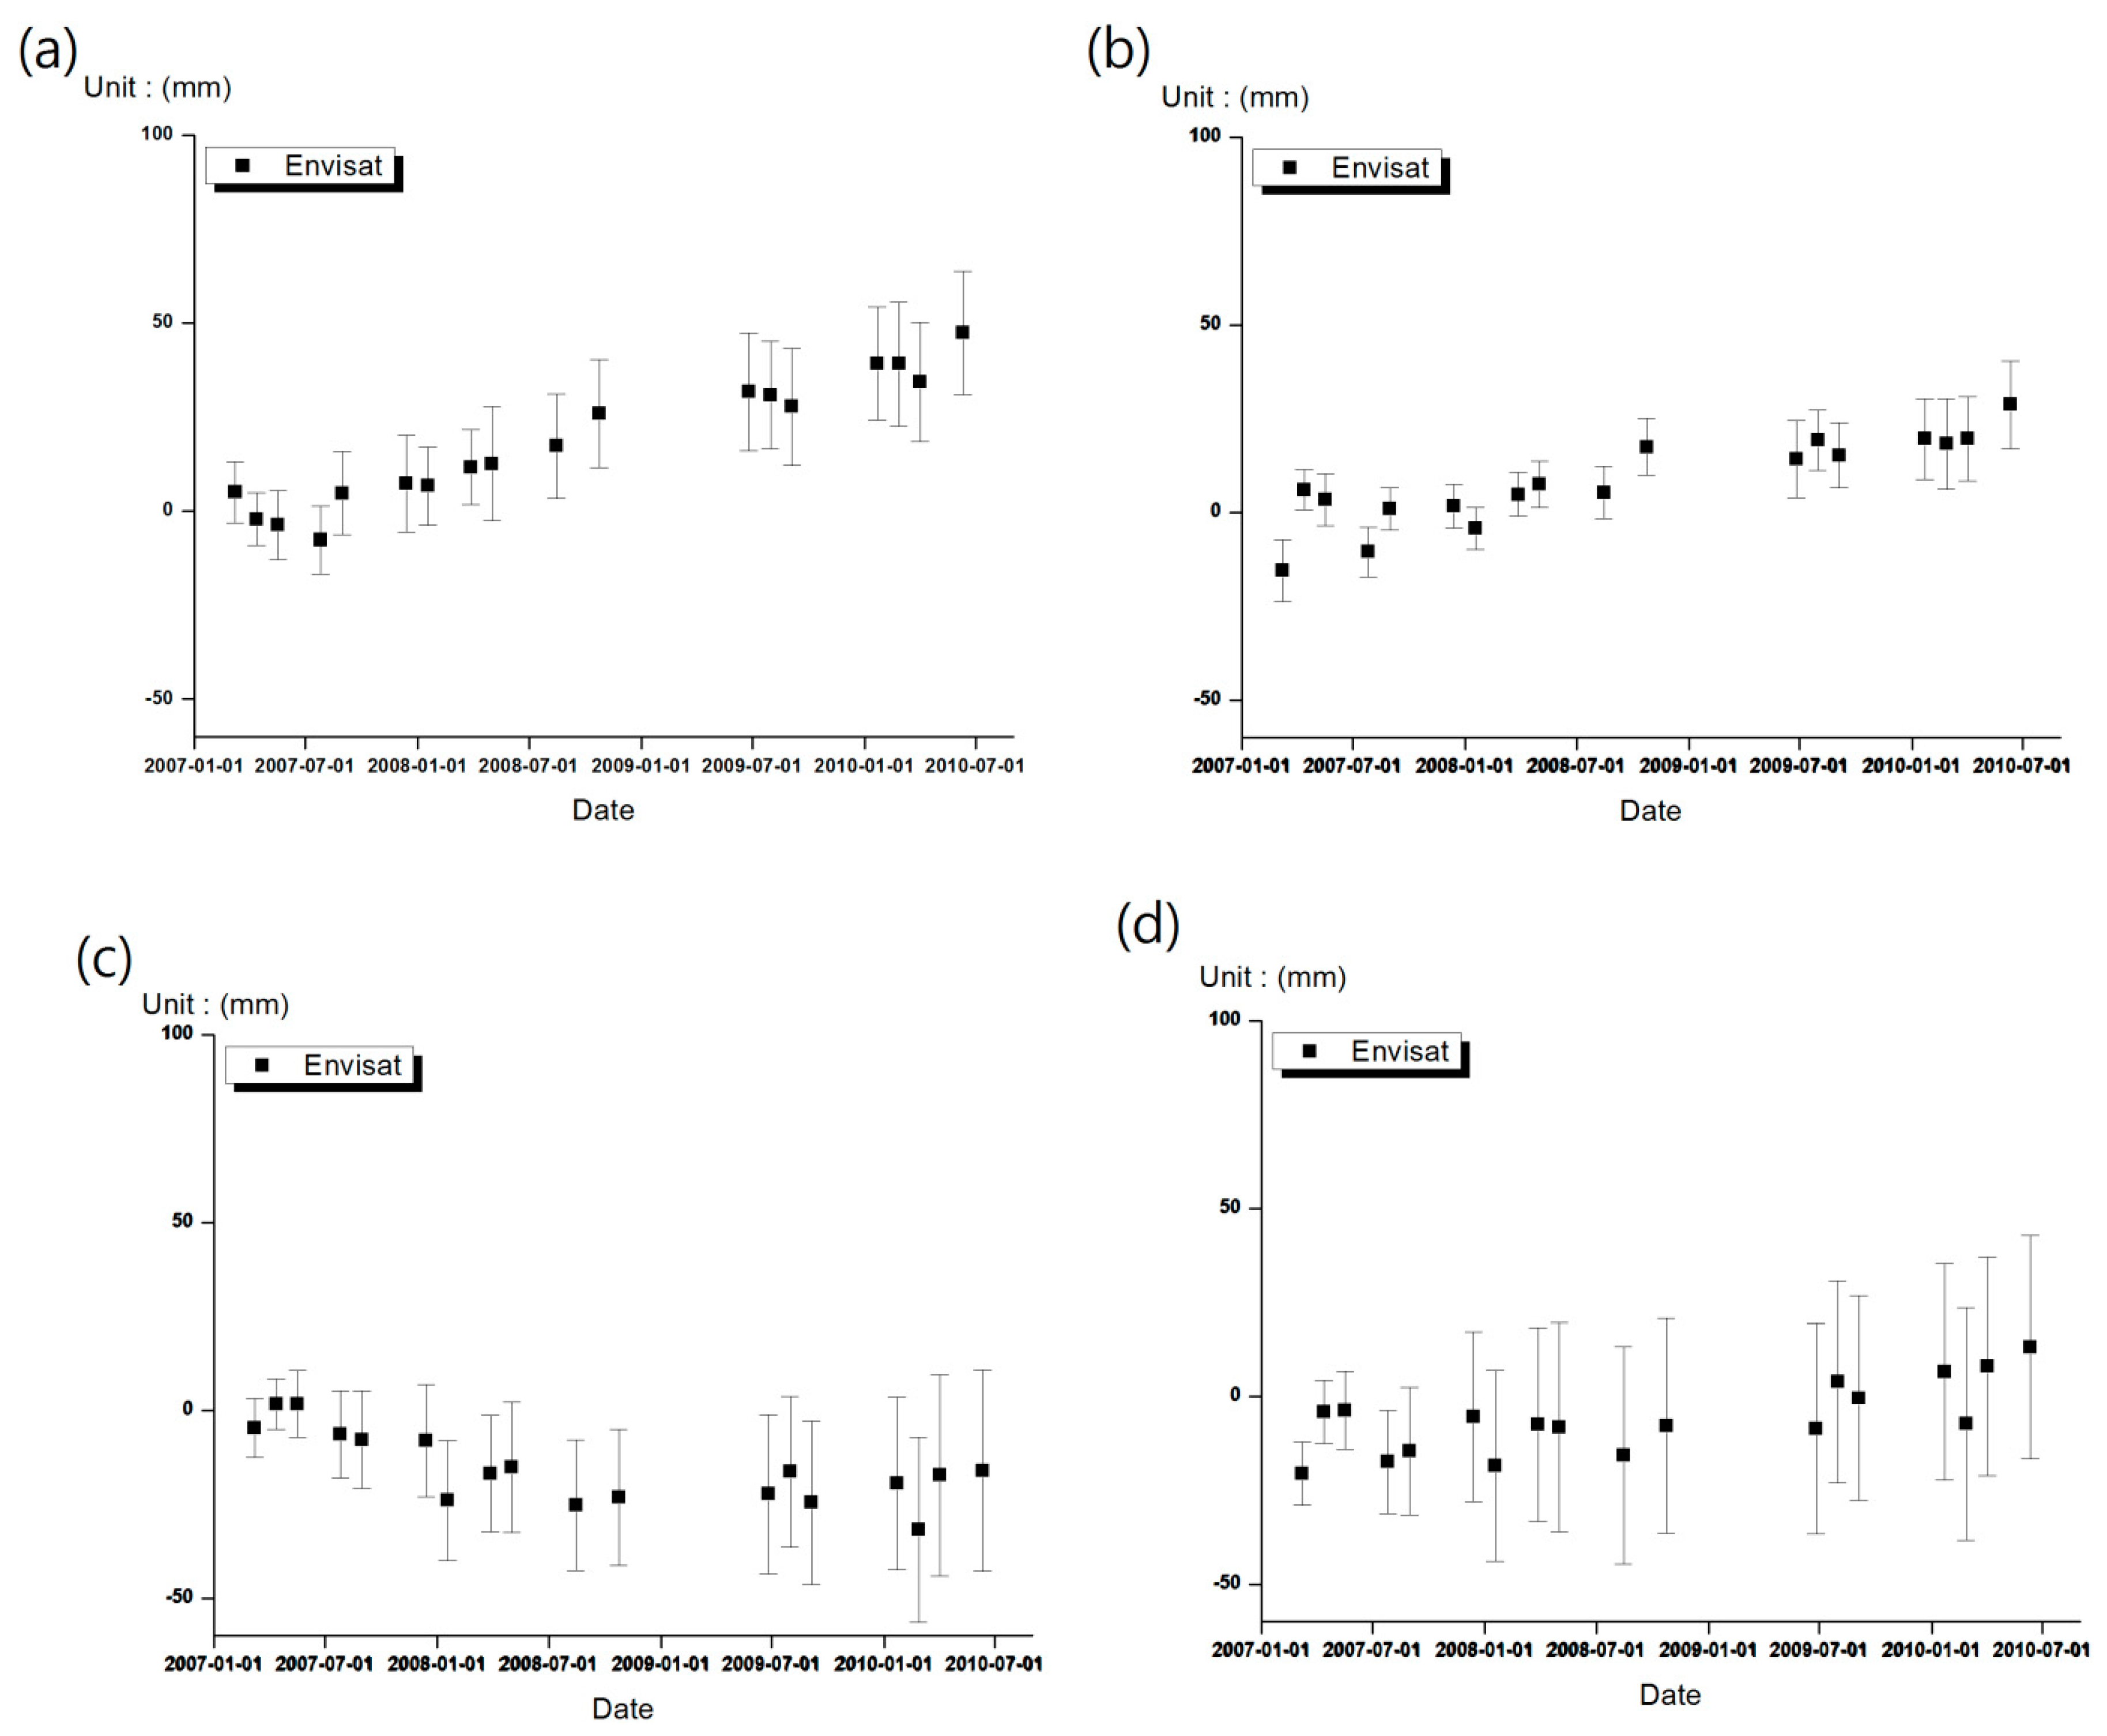
4.2. Time Series Analysis with ENVISAT ASAR

StaMPS/MTI processor conducted the PS analysis with the master SAR image of 24 July 2009 and then SBAS analysis over three years period with the 18 images illustrated in Figure 6. The resulting velocity map and the mean precision dispersion maps derived from StaMPS/MTI processing are presented in Figure 7 and Figure 8.
For further interpretation, the area of timberline was extracted using the SAR classification scheme proposed by [62]. The boundaries are drawn using a red line in Figure 7b and Figure 8b. It is observed that the mean velocity and its dispersion of scatterers over the area outside of timberline are much higher than the stable scatterers within the timberlines. Therefore the following discussion was conducted based on the surface deformation detected inside the timberline area.

5. Discussion

Based on the DInSAR analysis with atmospheric correction and time-series processing, the errors and relevant issues are discussed below to achieve a reliable interpretation of volcanic activity.

5.1. DInSAR Performance

As shown in Figure 5, after the atmospheric correction, two pass DInSAR using ALOS PALSAR images demonstrated high deformation values. Particularly in mountain flank areas, the displacement rate was up to 15–20 cm/year, which is a very high value compared with the StaMPS/MTI output and close to the deformation observed at other activate volcanoes [63,64]. It was suspected that most of this deformation might be caused by the base DTM error remaining from the two pass DInSAR processing. To examine this error source, the data collected by Geoscience Laser Altimeter System (GLAS) on board the Ice, Cloud and land Elevation Satellite (ICESAT) was employed as the reference for inter-comparison. Due to the high vertical and planimetric accuracy (2 cm radially and 5 cm vertically [65], it is a highly reliable topographic product to assess the accuracy of the 3 arc-second resolution SRTM DEM used in the DInSAR processing over Mt. Baekdu. The comparison between SRTM DEM and ICESAT scanned profiles is shown in Figure 9. Along the two ICESAT track profiles, it was clearly observed that the horizontal and vertical geodetic offsets of STRM DTM existed with about 20 m height difference over the DInSAR processing area. Then the deformation error resulting from the residual height of the base DTM could be computed based on the equation:
Ф t = 4 π λ B p r s i n ( θ ) z e r r o r ,
where Фt is the phase difference via inaccurate base topography, λ is the wavelength of SAR sensor, Bp is the perpendicular baseline, θ is the look angle, r is the range between sensor and target and zerror is the base DTM error. As a result, the calculated deformation errors were up to 1.9 cm and 2.3 cm respectively in pairs 1 to 2 (about 10 cm/year, refer to Section 4.1 and Figure 5). Hence large portion of the deformation derived from the DInSAR processing originated from the geodetic offset of the base DTM.
Together with the offset caused by the base DTM error, atmospheric error might be another unresolved error component. First, the discontinuities in error maps and Figure 5 should be noted. The discontinuities shown in the error maps (Figure 5) in pair 1 and especially pair 2 clearly revealed the discontinuities around the summit of Mt. Baekdu, which might be due to the estimated frontal surfaces of WRF outputs. DInSAR deformation showed the unpredicted discontinuities by WRF in both pairs 1 and 2. These were artifacts derived from inaccurate WRF outputs as WRF has limited capability to forecast local weather instabilities. In addition, considering the locations over the boundaries of estimated discontinuities revealed in the WRF error map, deformation over some local area, for instance in the north eastern flank of pair 1 and the western flank in pair 2 (shown in Figure 5), were inferred as the result of a mismatch between WRF estimation and real atmosphere instability.
With all of the above unresolved phase delay errors, the two pass DInSAR results were unable to show precise genuine deformation patterns. There is only weak evidence of deformation on the eastern flank. Next, we use the StaMPS/MTI method to precisely track the deformation.

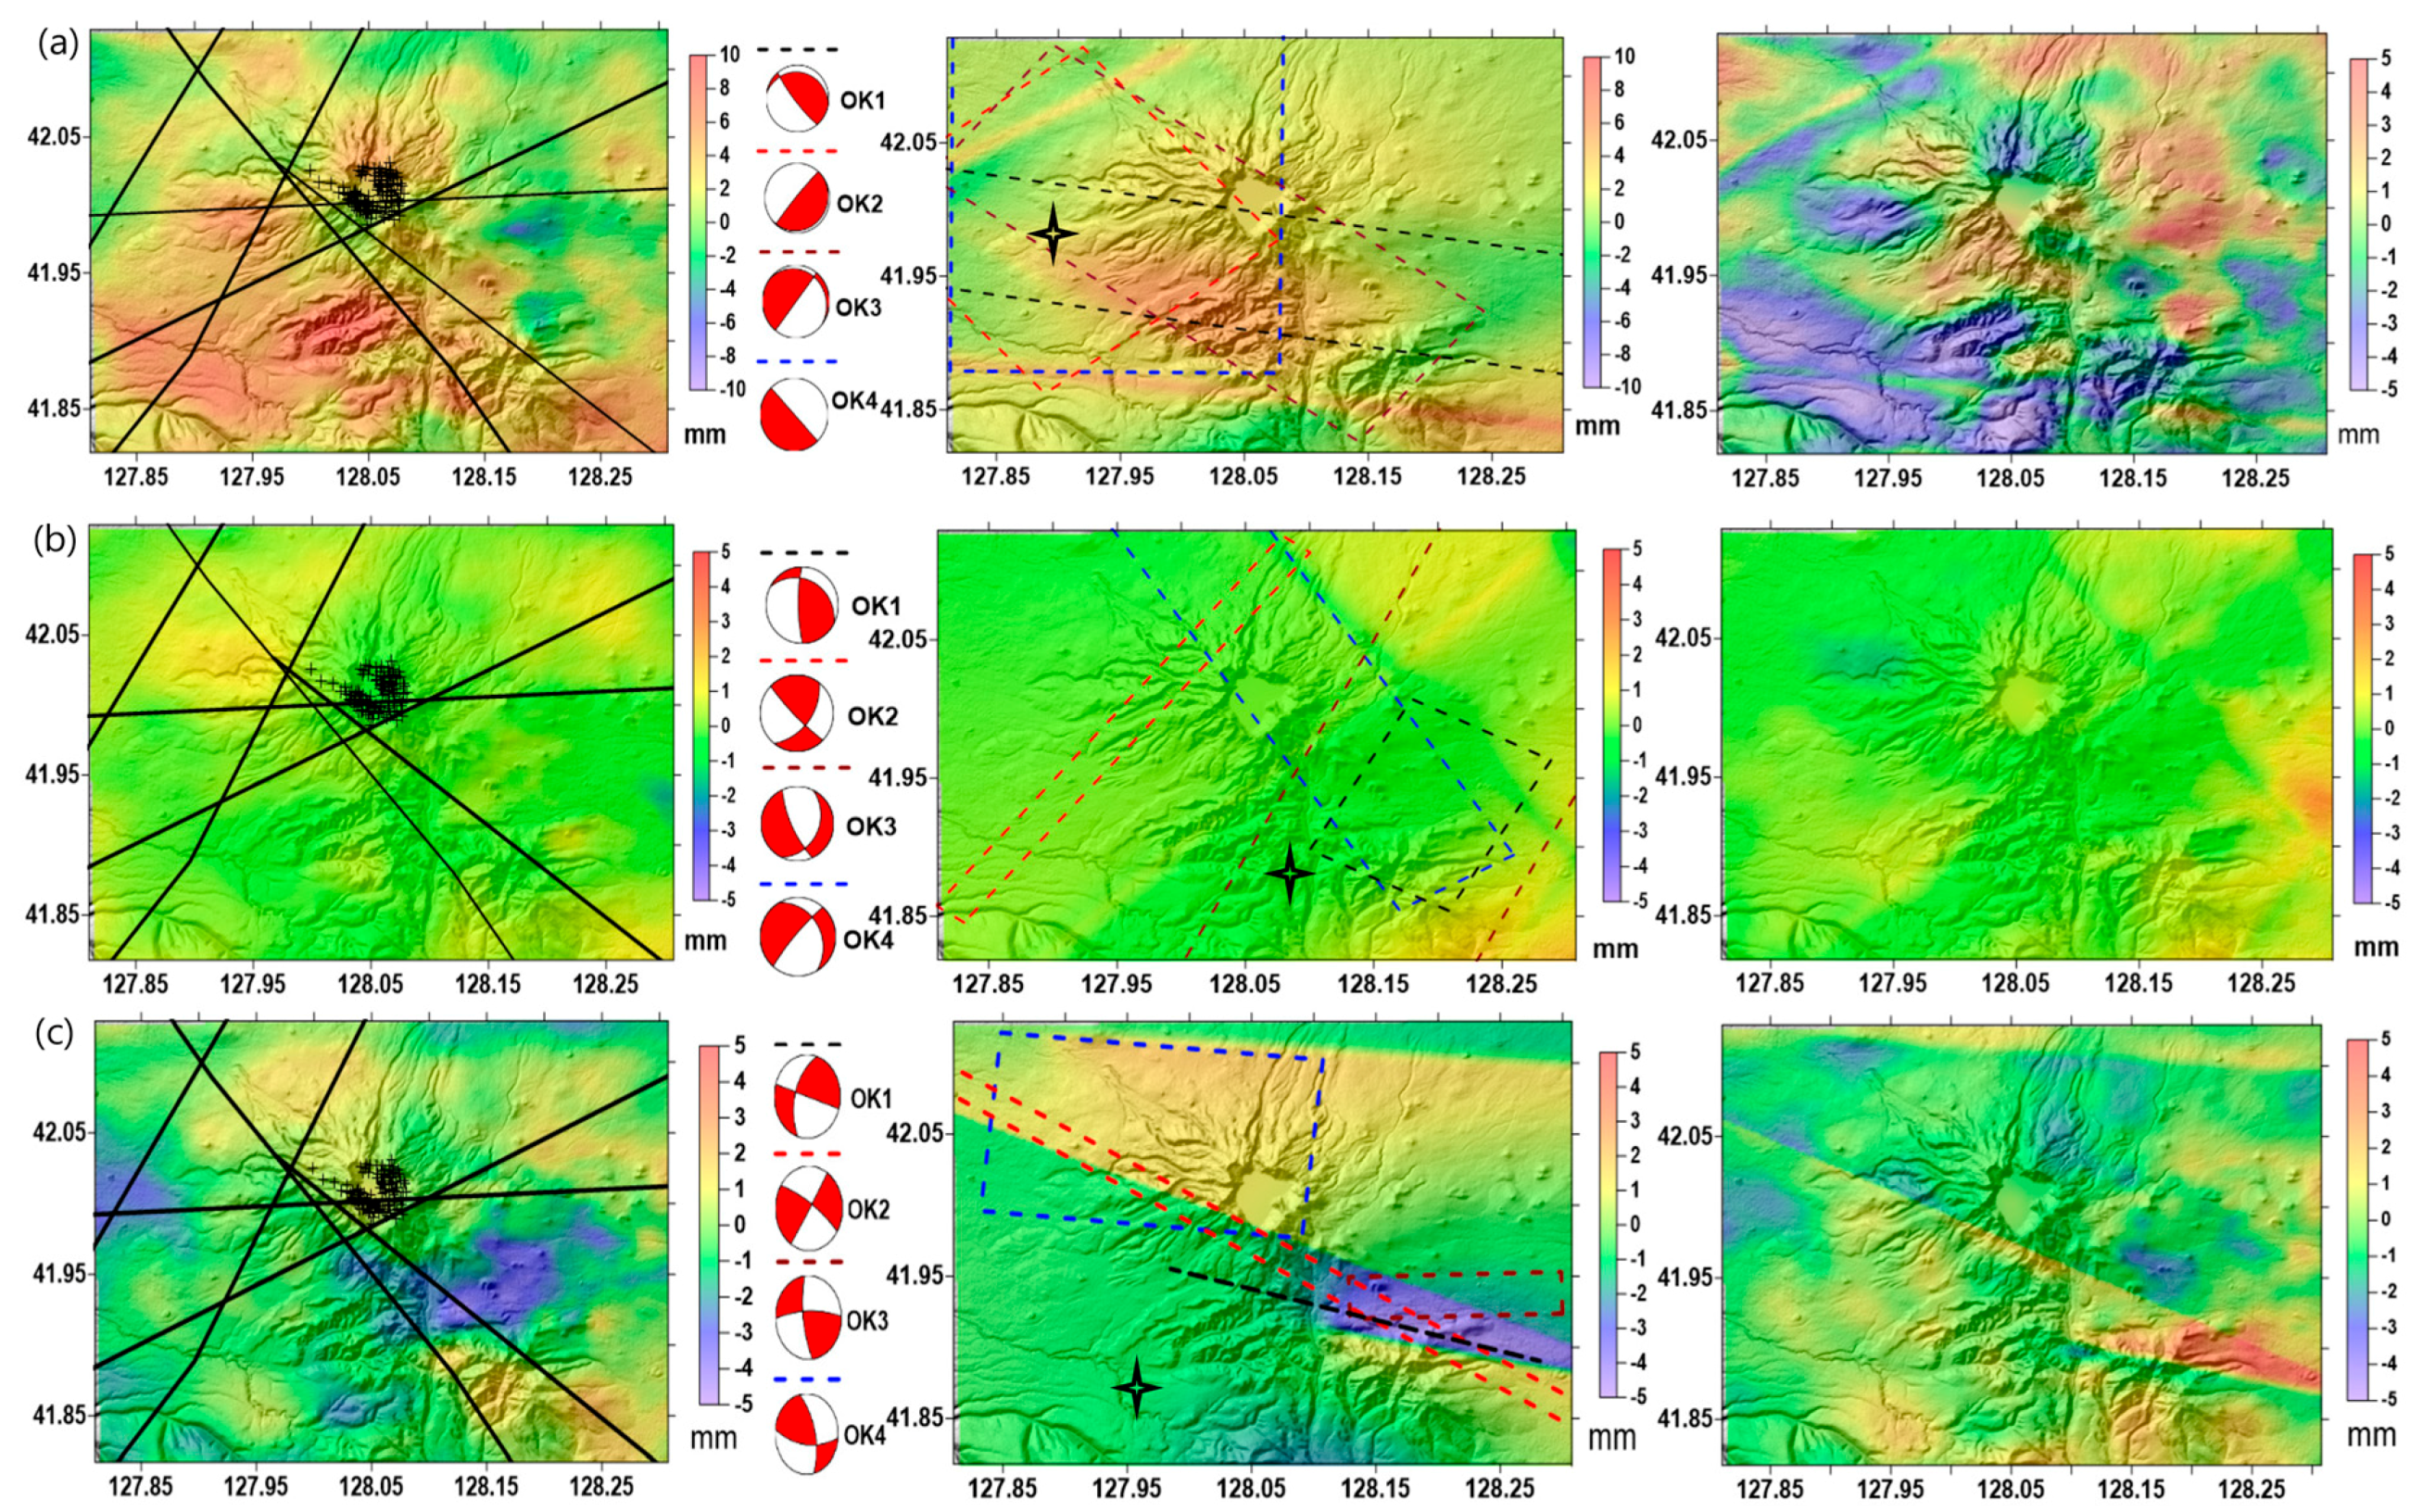
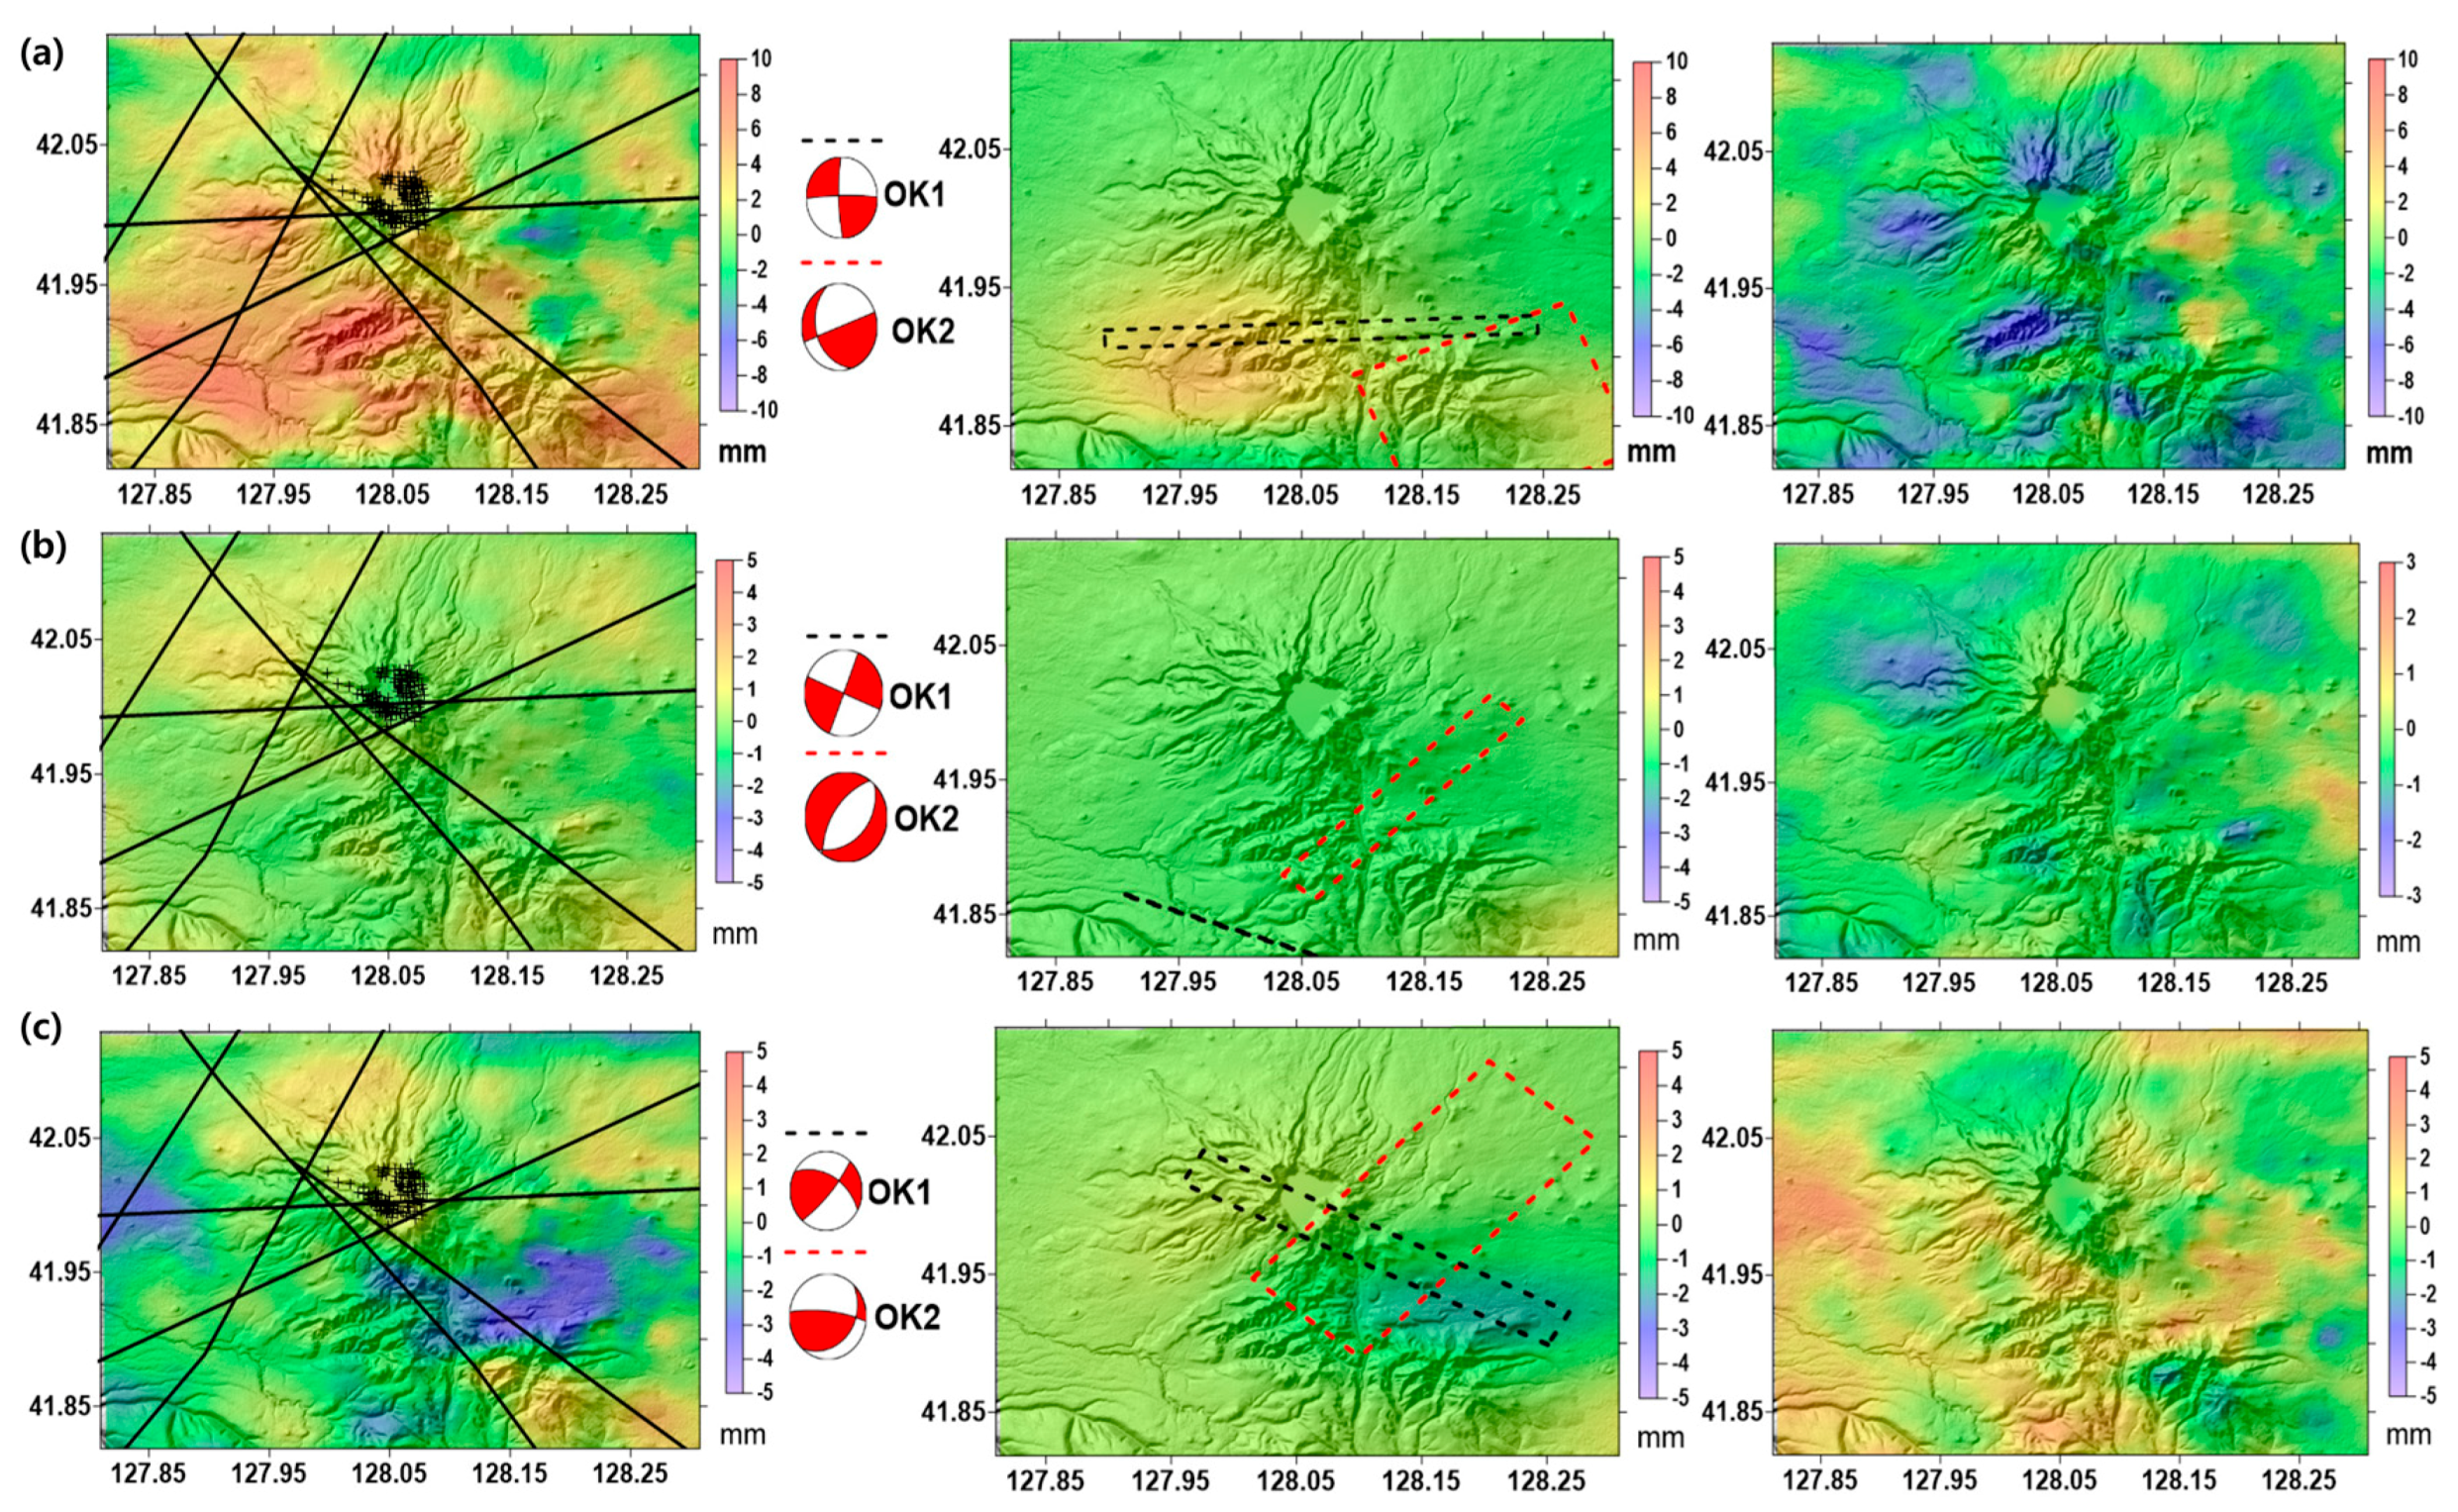
5.2. Interpretation of StaMPS/MTI Processing Results

In the StaMPS/MTI processing results, the obvious inflation on eastern flank was distinguished. Specifically over the site “a” indicated in Figure 7b, inflation up to 30 mm/year is shown. This deformation rate is significant and represent genuine surface change based on: (1) the coincidence with the deformation in the other SBAS campaign shown in Kim et al. [22]; (2) its location in the non-vegetated area (hence this deformation was not the result of time varying scatterers); and (3) a relatively small velocity dispersion as shown in Figure 8. The sources of the other deformation in the small areas around the summit are not clearly identified as those are very localized pattern. In addition, the minor inflation on the site “b” is relatively obvious and reliable according to the low mean velocity dispersion shown in Figure 8.
The deformation over sites “c” on the southern flank and “d” o the western flank is not negligible; however it is not very clear in both the mean velocity and the velocity dispersion. The deformation of site “c” is more likely the noise of DInSAR processing or the deformation caused by other sources considering its localized distribution. Regarding the site “d”, as the topographic slope in this area is higher than in any other place, the influence of decorrelation in steep topography may cause the erroneous measurement in phase difference as stated in [23]. The relatively low reliability in velocity dispersion was noticed over the western flank. However, since it was difficult to address the de-correlation problem originating from the vegetation canopy, such as shrub at high altitude, snow coverage or steep slopes which are dominant on the western flank, the high dispersion in this area was inferred as the effects of such natural environmental factors. Thus, together with the spatially small extents, the observed deformation in the western flank was not readily considered as real deformation signal. The site “a” is clearly distinguished in the well-defined uplift pattern as observed consistently in Figure 10. Although there are some fluctuations, the deformation over the site “a” is very clear for the entire observation period, which is also shown in Figure 11a. Moreover, the deformation on the site “b” on the northern flank area during the 2007–2008 period showed the small velocity dispersion in Figure 11b and is identified visually in Figure 10.
In contrast, it is found that the deformation detected over sites “c” on the southern flank and “d” on the western flank areas is ambiguous. As described by Cao et al. [66], the deformation extracted for site “c” might be local creep and it agrees with Figure 11c which shows slow subsidence with high velocity dispersion. As for site “d”, the less obvious deformation with large deformation velocity dispersion shown in Figure 10 and Figure 11d imply that the observed deformation over site “d” may not be actual surface uplift and subsidence but error in the DInSAR analysis.
Unfortunately, the reliable StaMPS/MTI observation areas in this study are not overlapped with [4] survey areas spatially and temporally especial ly “a” to “c” are located within North Korean territory; hence, the direct inter-comparison is not feasible. However, we can compare [4] survey work and the InSAR analyses conducted in this paper. Firstly, it was identified that there were still remained surface deformation in the 2007–2011 period after the long inflation during the 2002–2005 period observed in [4] ground survey, which was covered by the time series analysis using ENVISAT ASAR data and in the DInSAR analysis using ALOS PALSAR images. Specifically, the ENVISAT ASAR StaMPS/MTI analyses showed a clear evidence of surface deformation on the eastern flank of Mt. Baekdu, which was not covered by the on-site GPS and levelling survey conducted by [4] as the area is located within N. Korean territory. The phenomenon could also be observed in the SBAS analysis reported in [22]. All StaMPS/MTI observations identified quite obvious deformation (up to 15–30 mm) on the eastern flank. Thus, it ruled out the possibility of outliers in the DInSAR analyses originating from erroneous factors, especially considering the timberline extent and the small velocity dispersion. It should be noted that the circumscribed patterns of deformation connecting sites “a”, “b” and “d” around the eastern summit, fit with the epicenters of swarms around the caldera lake [67]. These were described in Liu et al. (2001) [2]. Such circumscribed deformation patterns are also revealed in the atmospheric corrected two pass DInSAR results of pairs 1–3 shown in Figure 5. This implies that the deformation observed around the caldera lake is the consequences of ongoing geological unrest, not error components. It should be noted the levelling and GPS results conducted in [4] is not directly comparable to our StaMPS/MTI observations as the spatial extent, the temporal coverage and the measured direction were not within our test scope.
In order to infer the deformation source model of Mt. Baekdu and to validate the effectiveness of our DInSAR observations, we conducted model inversion incorporating the DInSAR observations for a specific time period. According to [5], the Earth Gravitational Model (EGM) 2008 [68] was applied which approximates a magma chamber along with several faults. Hence in this study we combined the Mogi [69] and Okada [70] models to simulate a comprehensive underground source causing surface deformation. The spherical Mogi model [69] handles circular surface displacement well, specifically when the source depth is much larger than the radius of the deformation cavity. Because of its simplicity it has been widely used for volcanic region inversion [71,72]. The rectangular Okada model [70] mimics fault behavior and is widely modeled in subduction and fault areas [73,74].
Both models were optimized using the Levenberg-Marquardt algorithm (LMA) which was implemented using Gauss-Newton iteration and loops in order to obtain a convergence of the gradient descent [75]. Initial model values for geometrical parameters are set to ranges published in previous studies [5]. For the Mogi model they include depth, projected planar location, and volume; for the Okada model they include, length, width, depth, degree of dip and rake, distance of strike and slip. Through the iterative calculation during the inversion, these parameters were optimized to minimize the differences between the model estimates and our DInSAR observations [76]. Once the processing was completed, parameters of the pressure source can be determined and described. Successful studies using inversion modelling have been published by, e.g., Yassen et al. [77] and Cheloni et al. [78].
We tested the inversions of all DInSAR observations. Since only a few StaMPS/MTI results showed clear surface deformation and produced the source parameters in reasonable ranges, we calculated inversions based on observed that occurred between 2007/08/31–2007/12/14, 2008/03/28–2008/05/02 and 2010/02/26–2010/04/02, referred to as the 2007-, 2008- and 2010 observations, respectively. Two possible scenarios were hypothesized to initialize model inversions and to investigate agreements between the model and the observations of surface displacement.
In the first scenario, a Mogi-type magma chamber of spherical shape in an elastic half-space [70] and four faults lines inferred from [5] were introduced. In this scenario the central magma chamber contributes to surface unrest by volume or pressure changes interacting with the faults lines as shown by, e.g., Feuillet et al. [79]. Figure 12 and Table 3 present the observed and modelled deformation and error residuals for this hypothesis. Although the modelled deformation values show significant differences when compared to the DInSAR observations, the spatial patterns between modelled and observed surface deformation are well comparable. To estimate the goodness of fit of the model more objectively, we introduced the statistical metric from Tizzani et al. [80] together with the conventional RMS error estimate between the observation and modelled displacement. Their statistical test is based on the experimental variogram model of deformation distribution. First, the normalized root mean square error (NRMSE) was calculated which provides a measure for the discrepancy between the observed and model variogram. It is defined as
NRMSE = 1 N k = 1 N ( o b s k m o d e l k ) o b s m a x o b s m i n
where obs and model are observational and model data and N is the number of data points. We also conducted a Chi-squared test between the observed and the model variogram and calculated χ2 (see Table 3 and Table 4). All cases show a comparable fitness although in the case of the 2007 observation it is slightly higher due to the possibility that the observed deformation possessed strong deviation. Volume change in the model magma chamber using Mogi source model parameters is also extracted using
V = π a 3 P μ [ 1 + ( a z 0 ) 4 ]
where ΔV is the volume change in the Mogi source, a is the source radius, ΔP is the pressure change in the source, z0 is the depth of source and μ is the shear modulus [81] (see Table 3).
Overall it appears that the deformation in the cases of the 2007 and 2008 observations is due to the inflation of the magma chamber and its corresponding interaction with fault lines. In contrast, the 2010 observations seem to show the depressurization of the magma chamber. Consequently the focal mechanism of faults lines (Figure 12) display different patterns according to the magnitude and direction of volume changes of the Mogi source, in particular between the major inflation of the 2007 observation period and the deflation of the 2010 observation period. It is obvious that significant pressure change or any physical state migration of the magma chamber caused by, e,g. magma intrusion which can induce measureable and frequent major seismic activity, have ceased after 2005 [2]. Thus, the magma chamber did not significantly contribute to the observed surface deformation during the period of this study. Assuming the absence of major activity in the magma chamber, it was proposed that minor coulomb stress changes of the deep magma chamber induced the clamping and unclamping of fault planes as shown in the case studies by [79,82]. It is characterized by predominantly normal faulting in the focal mechanisms of the 2007 observation towards a tendency of strike-slip faulting in the 2008 observation. Deformation during the 2010 observation period is characterized by dominant strike-slip faulting which then might be directly connected to the deflation of the magma chamber (Figure 12C).
It should be noted that the residuals between observed and modelled deformation shown in Figure 12 are significant although some deformation patterns such as discontinuities probably induced by faults can be roughly traceable in the observations. A possible explanation is the effect of phase errors induced by local atmospheric components such as local precipitation. However, in order to explain the distribution and migration of the residuals between observations and models and their temporal migrations, it is useful to infer the existence of additional small scale deformation sources. Such additional local faults might be trapdoor faults resulting from intense magmatic activity during the 2003–2005 period [2] as shown in Sierra Negra Volcano [83]. However, we found that an improvement of the model inversion including a magma chamber, major fault lines based on [5] and a number of unknown local deformation sources were not possible to obtain due to many unconstrained parameters uncertainties.
Instead, as the second scenario, we examined the model inversion including only locally distributed Okada type deformation sources assuming negligible contribution from a magma chamber and major fault lines as inferred from [5]. The assumption can be justified considering the decrease in seismic activity after 2005 [2] which implies a stabilization of the magma chamber. Therefore, the model inversion was conducted with only two rectangular dislocations in an elastic half space [70] and the initial parameter values inferred from the location of main area of deformation. The models incorporating the NW-SE and NE-SW trending fault lines provided the best results. Parameters derived from these models are shown in Table 4, together with observed and modelled deformation and error residual distributions as shown in Figure 13. Location of deformation sources in these models showed a better agreement with the depth of earthquake hypocenters (2–5 km) described in [4]. One hypothesis involving these local deformation models is that hydrothermal activity might have followed main inflation events and intensive seismic activity during the 2003–2005 period [2]. In such a scenario, close proximity between an aquifer and the magma chamber could have caused significant gas emission, including water vapor and induced relatively localized surface deformation along existing faults as observed in [84,85] or with the changes of pore pressure and rock temperature [86]. The focal mechanisms and the spatial patterns of deformation sources have been changing significantly across the three inversions and may also support a scenario of temporal migration of hydrothermally activated regions. The focal mechanisms clearly demonstrate strike-slip faulting and can be well discriminated from the cases of Figure 12A with predominant normal faulting and Figure 12B with a tendency towards strike-slip faulting. It seems that the error residual patterns in Figure 13 and higher error metrics in Table 4 (cf. to values in Table 3) require the introduction of more sophisticated deformation source models and mechanisms. However, the thermal anomaly around the summit observed in MODIS land temperature products [87] shown on Figure 14 strongly support the possibility of hydrothermally induced deformation. These data demonstrate a consistent thermal anomaly with up to 10 Celsius degree, in particular near the location of the south-eastern part of the caldera lake. We interpret these anomalies as possible outlets of hydrothermal activity based on the proximity to the modelled deformation sources.

6. Conclusions and Future Work

Based on recent ground observations and seismic data, a number of indicators of potential volcanic activity around Mt. Baekdu could be identified, making a thorough re-evaluation of its potential volcanic risk critical. However, since a major part of Mt. Baekdu is not accessible for ground surveying and in situ studies, we focused on the implementation and validation of InSAR techniques that allowed us to monitor the target area both temporally and spatially.
To overcome the environmental conditions limiting the InSAR performance (such as potentially inaccurate base DTM, instability of atmospheric condition resulting in partial phase delay, dense vegetation canopy and steep slope), error elimination techniques, including two pass DInSAR with atmospheric correction and StaMPS/MTI methods were employed successively. As a result, it was verified that the local deformation identified in both approaches is not negligible. In particular, the hybrid interferogram stacking algorithms developed by [34] revealed significant surface inflation up to 20 mm/year supposedly around faults over the caldera lakes. To explain this deformation, we propose two hypotheses: (1) faults interacting with the magma chamber and (2) hydrothermal activity and effects around local faults in the flank over Mt. Baekdu. Although both hypotheses do not fully explain the complicated deformation pattern identified by DInSAR observations, the temporal migration of the modelled deformation source, calculated focal mechanism and thermal anomaly detected by MODIS land products support a scenario of recently ongoing volcanic activity. A unified scenario combining both mechanisms, i.e., vestigated but the final model inversion is not yet determined due to the difficulties in building more complex models, in particular with remaining atmospheric errors and insufficient DInSAR observations. Once reliable long-term observations are derived from ground observation and also remote sensing analyses, an identification and a detailed model of the deformation source underneath Mt. Baekdu could be derived. To achieve this purpose, the approaches combining InSAR analyses from different observation conditions and techniques [88,89] and/or data fusion with GPS monitoring [90], are suggested to be an appropriate bases for complex model inversion to infer various deformation sources.
In this work the effectiveness of DInSAR time series analysis over Mt. Baekdu has been demonstrated and exploitation of all possible space-borne SAR missions to determine the model that best fit the data over Mt. Baekdu is necessary. However, advanced error correction methods need be developed and introduced to improve the results. Although time series using StaMPS/MTI with C-band ENVISAT ASAR data produced relatively reliable deformation measurements, it is suggested to introduce long wavelength L-band DInSAR time series for highly intensive measurements over vegetated and/or snow covered topography at Mt. Baekdu. In addition, the base topography error issue should also be considered when time series analysis with L-band ALOS PALSAR is employed due to its temporal dependency on the perpendicular baseline [91]. In order to address these issues, approaches proposed by [91] and [92] can be introduced to make base DTM corrections for constant monitoring over Mt. Baekdu. Although it was shown that two-pass DInSAR compensated with external error estimation by weather forecasting models is not very effective in such severe atmospheric turbulence cases, it is still worthwhile to employ this method to investigate relatively short term deformation. The higher resolution and the improved accuracy of the WRF model to forecast the local climate instability over mountain areas such as the approach described in [93] is essential in that case.
The replacement of space-borne SAR sensors from ERS, ENVISAT ASAR and ALOS PALSAR to C-band Sentinel-1 of ESA, X-band high resolution SAR, and L-band ALOS PALSAR-2 provide enhanced opportunities to monitor Mt. Baekdu with improved spatial and temporal resolutions at various wavelengths. Together with the new SAR missions and improved DInSAR techniques described in this work, further monitoring over Mt. Baekdu could be continued and results described in this study, in particular with respect to various atmospheric error components, will be of great benefit.

Acknowledgments

The authors would like to thank the Korean National Meteorological Satellite Center (Project No. 153-3100-3137-301-210-13) and the Korean National Research Foundation (Grant No. 2013078206) for supporting this study. YonSoo Choi’s contribution was supported by 2016 sabbatical year research grant of University of Seoul. The authors thank the University of Seoul for the computer resource support by the engineering equipment grant. ESA kindly provided ENVISAT images by the EOLI-SA dataship scheme.

Author Contributions

Jung-Rack Kim designed the research structure and wrote the paper. Hey-Won Yun conducted DInSAR analysis. Shih-Yuan Lin and Ya-Lun Tsai were in charge of StaMPS and geophysical modelling together with the corresponding writing. Atmospheric analyses were conducted by Hwa-Jung Seo and Sungwook Hong. YonSoo Choi provided the ground information of test area and MODIS data processings.

Conflicts of Interest

The authors declare no conflict of interest.

References

  1. Gao, Q. Volcanic hydrothermal activities and gas-releasing characteristics of the Tianchi lake region, Changbai mountains. Acta Geosci. Sin. 2004, 25, 345–350. [Google Scholar]
  2. Liu, G.; Zhang, H.; Kong, Q. Analysis of the seismic activity at the Changbaishan Tianchi volcano. Seismol. Geol. 2006, 28, 503–508. [Google Scholar]
  3. Yun, S.H.; Lee, J.H. Analysis of unrest signs of activity at the Baegdusan volcano. J. Petrol. Soc. Korea 2012, 21, 1–12. [Google Scholar] [CrossRef]
  4. Xu, J.; Liu, G.; Wu, J.; Ming, Y.; Wang, Q.; Cui, D.; Shangguan, Z.; Pan, B.; Lin, X.; Liu, J. Recent unrest of Changbaishan volcano, northeast China: A precursor of a future eruption? Geophys. Res. Lett. 2012, 39, L16305. [Google Scholar] [CrossRef]
  5. Choi, S.; Oh, C.W.; Götze, H.J. Three-dimensional density modeling of the EGM2008 gravity field over the Mount Paekdu volcanic area. J. Geophys. Res. Solid Earth 2013, 118, 3820–3836. [Google Scholar] [CrossRef]
  6. Zebker, H.A.; Goldstein, R.M. Topographic mapping from interferometric SAR observations. J. Geophys. Res. Solid Earth 1986, 91, 4993–4999. [Google Scholar] [CrossRef]
  7. Massonnet, D.; Briole, P.; Arnaud, A. Deflation of Mount Etna monitored by spaceborne radar interferometry. Nature 1995, 375, 567–570. [Google Scholar] [CrossRef]
  8. Dzurisin, D.; Lisowski, M.; Wicks, C.W.; Poland, M.P.; Endo, E.T. Geodetic observations and modeling of magmatic inflation at the Three Sisters volcanic center, central Oregon Cascade Range, USA. J. Volcanol. Geotherm. Res. 2006, 150, 35–54. [Google Scholar] [CrossRef]
  9. Borgia, A.; Tizzani, P.; Solaro, G.; Manzo, M.; Casu, F.; Luongo, G.; Pepe, A.; Berardino, P.; Fornaro, G.; Sansosti, E.; et al. Volcanic spreading of Vesuvius, a new paradigm for interpreting its volcanic activity. Geophys. Res. Lett. 2005, 32. [Google Scholar] [CrossRef]
  10. Brunori, C.A.; Bignami, C.; Stramondo, S.; Bustos, E. 20 years of active deformation on Volcano Caldera: Joint analysis of InSAR and AInSAR techniques. Int. J. Appl. Earth Obs. Geoinf. 2012, 23, 279–287. [Google Scholar] [CrossRef] [Green Version]
  11. Pinel, V.; Poland, M.P.; Hooper, A. Volcanology: Lessons learned from synthetic aperture radar imagery. J. Volcanol. Geotherm. Res. 2014, 289, 81–113. [Google Scholar] [CrossRef]
  12. Marra, F.; Gaeta, M.; Giaccio, B.; Jicha, B.R.; Palladino, D.M.; Polcari, M.; Stramondo, S. Assessing the volcanic hazard for Rome: 40Ar/39Ar and In-SAR constraints on the most recent eruptive activity and present-day uplift at Colli Albani Volcanic District. Geophys. Res. Lett. 2016, 43, 6898–6906. [Google Scholar] [CrossRef]
  13. Meyer, F.J.; McAlpin, D.B.; Gong, W.; Ajadi, O.; Arko, S.; Webley, P.W.; Dehn, J. Integrating SAR and derived products into operational volcano monitoring and decision support systems. ISPRS J. Photogramm. Remote Sens. 2015, 100, 106–117. [Google Scholar] [CrossRef]
  14. Di Traglia, F.; Nolesini, T.; Intrieri, E.; Mugnai, F.; Leva, D.; Rosi, M.; Casagli, N. Review of ten years of volcano deformation recorded by the ground-based InSAR monitoring system at Stromboli volcano: A tool to mitigate volcano flank dynamics and intense volcanic activity. Earth Sci. Rev. 2014, 139, 317–335. [Google Scholar] [CrossRef]
  15. Yin, J.; Jull, A.J.; Burr, G.S.; Zheng, Y. A wiggle-match age for the Millennium eruption of Tianchi Volcano at Changbaishan, Northeastern China. Quat. Sci. Rev. 2012, 47, 150–159. [Google Scholar] [CrossRef]
  16. Newhall, C.G.; Self, S. The volcanic explosivity index (VEI) an estimate of explosive magnitude for historical volcanism. J. Geophys. Res. Ocean. 1982, 87, 1231–1238. [Google Scholar] [CrossRef]
  17. Yun, S.H.; Cho, E.; Yang, I. Interpretation of historical eruptions of Mt. Baekdu Volcano, Korea. In Proceedings of the AGU Fall Meeting, San Francisco, CA, USA, 15–19 December 2014; Volume 1, p. 4766.
  18. Eisinger, M.; Burrows, J.P. Tropospheric sulfur dioxide observed by the ERS-2 GOME instrument. Geophys. Res. Lett. 1998, 25, 4177–4180. [Google Scholar] [CrossRef]
  19. Vaughan, R.G.; Hook, S.J. Using satellite data to characterize the temporal thermal behavior of an active volcano: Mount St. Helens, WA. Geophys. Res. Lett. 2006, 33, 867–873. [Google Scholar] [CrossRef]
  20. Leprince, S.; Barbot, S.; Ayoub, F.; Avouac, J.P. Automatic and precise orthorectification, coregistration, and subpixel correlation of satellite images, application to ground deformation measurements. IEEE Trans. Geosci. Remote Sens. 2007, 45, 1529–1558. [Google Scholar] [CrossRef]
  21. Kim, S.W.; Won, J.S.; Kim, J.W.; Moon, W.M.; Min, K.D. Multi temporal JERS-1 SAR investigation of Mt. Baekdu stratovolcano using differential interferometry. Geosci. J. 2001, 5, 301–312. [Google Scholar] [CrossRef]
  22. Kim, J.R.; Lin, S.Y.; Hong, S.; Choi, Y.S.; Yun, H.W. Ground deformation tracking over Mt. Baekdu: A pre-evaluation of possible magma recharge by D-InSAR analysis. KSCE J. Civ. Eng. 2014, 18, 1505–1510. [Google Scholar] [CrossRef]
  23. Lee, H.; Liu, J.G. Analysis of topographic decorrelation in SAR interferometry using ratio coherence imagery. IEEE Trans. Geosci. Remote Sens. 2001, 39, 223–232. [Google Scholar]
  24. Parker, A.L.; Biggs, J.; Walters, R.J.; Ebmeier, S.K.; Wright, T.J.; Teanby, N.A.; Lu, Z. Systematic assessment of atmospheric uncertainties for InSAR data at volcanic arcs using large-scale atmospheric models: Application to the Cascade volcanoes, United States. Remote Sens. Environ. 2015, 170, 102–114. [Google Scholar] [CrossRef]
  25. Remy, D.; Chen, Y.; Froger, J.L.; Bonvalot, S.; Cordoba, L.; Fustos, J. Revised interpretation of recent InSAR signals observed at Llaima volcano (Chile). Geophys. Res. Lett. 2015, 42, 3870–3879. [Google Scholar] [CrossRef]
  26. Zebker, H.A.; Rosen, P.A.; Hensley, S. Atmospheric effects in interferometric synthetic aperture radar surface deformation and topographic maps. J. Geophys. Res. 1997, 102, 7547–7563. [Google Scholar] [CrossRef]
  27. Samsonov, S. Topographic correction for ALOS PALSAR interferometry. IEEE Trans. Geosci. Remote Sens. 2010, 48, 3020–3027. [Google Scholar] [CrossRef]
  28. Hanssen, R.F. Radar Interferometry: Data Interpretation and Error Analysis; Springer: Dordrecht, The Netherlands, 2001; p. 308. [Google Scholar]
  29. NASA GSFC MODIS Atmosphere H2O Vapor. Available online: http://modis-atmos.gsfc.nasa.gov/MOD05_L2/index.html (accessed on 2 June 2015).
  30. Li, Z.; Muller, J.P.; Cross, P. Comparison of precipitable water vapor derived from radiosonde, GPS, and Moderate-Resolution Imaging Spectroradiometer measurements. J. Geophys. Res. Atmos. 2003, 108. [Google Scholar] [CrossRef]
  31. Li, Z.; Muller, J.P.; Cross, P.; Fielding, E.J. Interferometric synthetic aperture radar (InSAR) atmospheric correction: GPS, Moderate Resolution Imaging Spectroradiometer (MODIS), and InSAR integration. J. Geophys. Res. Solid Earth (1978–2012) 2005, 110. [Google Scholar] [CrossRef]
  32. Li, Z.; Muller, J.P.; Cross, P.; Albert, P.; Fischer, J.; Bennartz, R. Assessment of the potential of MERIS near-infrared water vapor products to correct ASAR interferometric measurements. Int. J. Remote Sens. 2006, 27, 349–365. [Google Scholar] [CrossRef]
  33. Ferretti, A.; Prati, C.; Rocca, F. Nonlinear subsidence rate estimation using permanent scatterers in differential SAR interferometry. IEEE Trans. Geosci. Remote Sens. 2000, 38, 2202–2212. [Google Scholar] [CrossRef]
  34. Ferretti, A.; Prati, C.; Rocca, F. Permanent scatterers in SAR interferometry. IEEE Trans. Geosci. Remote Sens. 2001, 39, 8–20. [Google Scholar] [CrossRef]
  35. Berardino, P.; Fornaro, G.; Lanari, R.; Sansosti, E. A new algorithm for surface deformation monitoring based on small baseline differential SAR interferograms. IEEE Trans. Geosci. Remote Sens. 2002, 40, 2375–2383. [Google Scholar] [CrossRef]
  36. Colesanti, C.; Ferretti, A.; Novali, F.; Prati, C.; Rocca, F. SAR monitoring of progressive and seasonal ground deformation using the permanent scatterers technique. IEEE Trans. Geosci. Remote Sens. 2003, 41, 1685–1701. [Google Scholar] [CrossRef]
  37. Saastamoinen, J. Atmospheric correction for the troposphere and stratosphere in radio ranging satellites. Geophys. Monogr. Ser. 1972, 15, 247–251. [Google Scholar]
  38. Bevis, M.; Businger, S.; Chiswell, S.; Herring, T.A.; Anthes, R.A.; Rocken, C.; Ware, R.H. GPS meteorology: Mapping zenith wet delays onto precipitable water. J. Appl. Meteorol. 1994, 33, 379–386. [Google Scholar] [CrossRef]
  39. Wadge, G.; Webley, P.W.; James, I.N.; Bingley, R.; Dodson, A.; Waugh, S.; Veneboer, T.; Puglisi, G.; Mattia, M.; Baker, D.; et al. Atmospheric models, GPS and InSAR measurements of the tropospheric water vapor field over Mount Etna. Geophys. Res. Lett. 2002, 29, 1905. [Google Scholar] [CrossRef]
  40. Foster, J.; Brooks, B.; Cherubini, T.; Shacat, C.; Businger, S.; Werner, C.L. Mitigating atmospheric noise for InSAR using a high resolution weather model. Geophys. Res. Lett. 2006, 33. [Google Scholar] [CrossRef]
  41. Nico, G.; Tomé, R.; Catalao, J.; Miranda, P.M. On the Use of the WRF model to mitigate tropospheric phase delay effects in SAR interferograms. IEEE Trans. Geosci. Remote Sens. 2011, 49, 4970–4976. [Google Scholar] [CrossRef]
  42. Hooper, A. A multi-temporal InSAR method incorporating both persistent scatterer and small baseline approaches. Geophys. Res. Lett. 2008, 35. [Google Scholar] [CrossRef]
  43. Hooper, A.; Zebker, H.; Segall, P.; Kampes, B. A new method for measuring deformation on volcanoes and other natural terrains using InSAR persistent scatterers. Geophys. Res. Lett. 2004, 31. [Google Scholar] [CrossRef]
  44. Hooper, A.; Segall, P.; Zebker, H. Persistent scatterer interferometric synthetic aperture radar for crustal deformation analysis, with application to Volcán Alcedo, Galápagos. J. Geophys. Res. Solid Earth 2007, 112. [Google Scholar] [CrossRef]
  45. Pinel, V.; Hooper, A.; De la Cruz-Reyna, S.; Reyes-Davila, G.; Doin, M.P. Study of the deformation field of two active Mexican Strato volcanoes (Popocatepetl and Colima Volcano) by time series of InSAR data. In Fringe Workshop Proceedings; ESA Special Publication: Frascati, Italy, 2008; Volume SP-649, p. 7. [Google Scholar]
  46. Chang, C.; Yen, J.; Hooper, A.; Chou, F.; Chen, Y.; Hou, C.; Hung, W.; Lin, M. Space-borne Radar for surface deformation analysis of northern Taiwan area, differential and persistent scatterer interferometry. In Proceedings of the AGU Fall Meeting, San Francisco, CA, USA, 15–19 December 2008; Volume 1, p. 1982.
  47. Decriem, J.; Árnadóttir, T.; Hooper, A.; Geirsson, H.; Sigmundsson, F.; Keiding, M.; Ófeigsson, B.G.; Hreinsdóttir, S.; Einarsson, P.; LaFemina, P.; et al. The 2008 May 29 earthquake doublet in SW Iceland. Geophys. J. Int. 2010, 181, 1128–1146. [Google Scholar] [CrossRef]
  48. Rosen, P.A.; Hensley, S.; Peltzer, G.; Simons, M. Updated repeat orbit interferometry package released. Eos Trans. Am. Geophys. Union 2004, 85, 47. [Google Scholar] [CrossRef]
  49. Chen, C.W.; Zebker, H.A. Phase unwrapping for large SAR interferograms: statistical segmentation and generalized network models. IEEE Trans. Geosci. Remote Sens. 2002, 40, 1709–1719. [Google Scholar] [CrossRef]
  50. Puysségur, B.; Michel, R.; Avouac, J.P. Tropospheric phase delay in interferometric synthetic aperture radar estimated from meteorological model and multispectral imagery. J. Geophys. Res. Solid Earth (1978–2012) 2007, 112. [Google Scholar] [CrossRef]
  51. Skamarock, W.C.; Klemp, J.B.; Dudhia, J.; Gill, D.O.; Barker, D.M.; Wang, W.; Powers, J.G. A Description of the Advanced Research WRF Version 2 (No. NCAR/TN-468+STR); National Center for Atmospheric Research Boulder Co Mesoscale and Microscale Meteorology Division: Boulder, CO, USA, 2005. [Google Scholar]
  52. National Centers for Environmental Prediction (NCEP). U.S. National Centers for Environmental Prediction Updated Daily: NCEP FNL Operational Model Global Tropospheric Analyses, Continuing from July 1999; CISL Data Support Section at the National Center for Atmospheric Research: Boulder, CO, USA; Dataset ds083.2. Available online: http://dss.ucar.edu/datasets/ds083.2/ (accessed on 2 June 2013).
  53. Hong, S.Y.; Noh, Y.; Dudhia, J. A new vertical diffusion package with an explicit treatment of entrainment processes. Mon. Weather Rev. 2006, 134, 2318–2341. [Google Scholar] [CrossRef]
  54. Mlawer, E.J.; Clough, S.A. On the extension of RRTM to the shortwave region. In Proceedings of the Sixth Atmospheric Measurement (ARM) Science Team Meeting, CONF-9603149, San Antonio, TX, USA, 4–7 March 1996; pp. 223–226.
  55. Dudhia, J. Numerical study of convection observed during the winter monsoon experiment using a mesoscale two-dimensional model. J. Atmos. Sci. 1989, 46, 3077–3107. [Google Scholar] [CrossRef]
  56. Paulson, C.A. The mathematical representation of wind speed and temperature profiles in the unstable atmospheric surface layer. J. Appl. Meteorol. 1970, 9, 857–861. [Google Scholar] [CrossRef]
  57. Dyer, A.J.; Hicks, B.B. Flux-gradient relationships in the constant flux layer. Q. J. R. Meteorol. Soc. 1970, 96, 715–721. [Google Scholar] [CrossRef]
  58. Webb, E. Profile relationships: The log-linear range, and extension to strong stability. Q. J. R. Meteorol. Soc. 1970, 96, 67–90. [Google Scholar] [CrossRef]
  59. Ek, M.B.; Mitchell, K.E.; Lin, Y.; Rogers, E.; Grunmann, P.; Koren, V.; Gayno, G.; Tarpley, J.D. Implementation of Noah land surface model advances in the National Centers for Environmental Prediction operational mesoscale Eta model. J. Geophys. Res. Atmos. 2003, 108. [Google Scholar] [CrossRef]
  60. Hong, S.Y.; Lim, J.O.J. The WRF single-moment 6-class microphysics scheme (WSM6). Asia-Pac. J. Atmos. Sci. 2006, 42, 129–151. [Google Scholar]
  61. Kain, J.S. The Kain-Fritsch convective parameterization: an update. J. Appl. Meteorol. 2004, 43, 170–181. [Google Scholar] [CrossRef]
  62. Yun, H.W.; Kim, J.R.; Choi, Y.S. The application of InSAR signature time series for landcover classification. Geoadvanced 2012. [Google Scholar] [CrossRef]
  63. Trasatti, E.; Casu, F.; Giunchi, C.; Pepe, S.; Solaro, G.; Tagliaventi, S.; Sansosti, E. The 2004–2006 uplift episode at Campi Flegrei caldera (Italy): Constraints from SBAS-DInSAR ENVISAT data and Bayesian source inference. Geophys. Res. Lett. 2008, 35, 521–539. [Google Scholar] [CrossRef]
  64. Currenti, G.; Solaro, G.; Napoli, R.; Pepe, A.; Bonaccorso, A.; Del Negro, C.; Sansosti, E. Modeling of ALOS and COSMO-SkyMed satellite data at Mt Etna: Implications on relation between seismic activation of the Pernicana fault system and volcanic unrest. Remote Sens. Environ. 2012, 125, 64–72. [Google Scholar] [CrossRef] [Green Version]
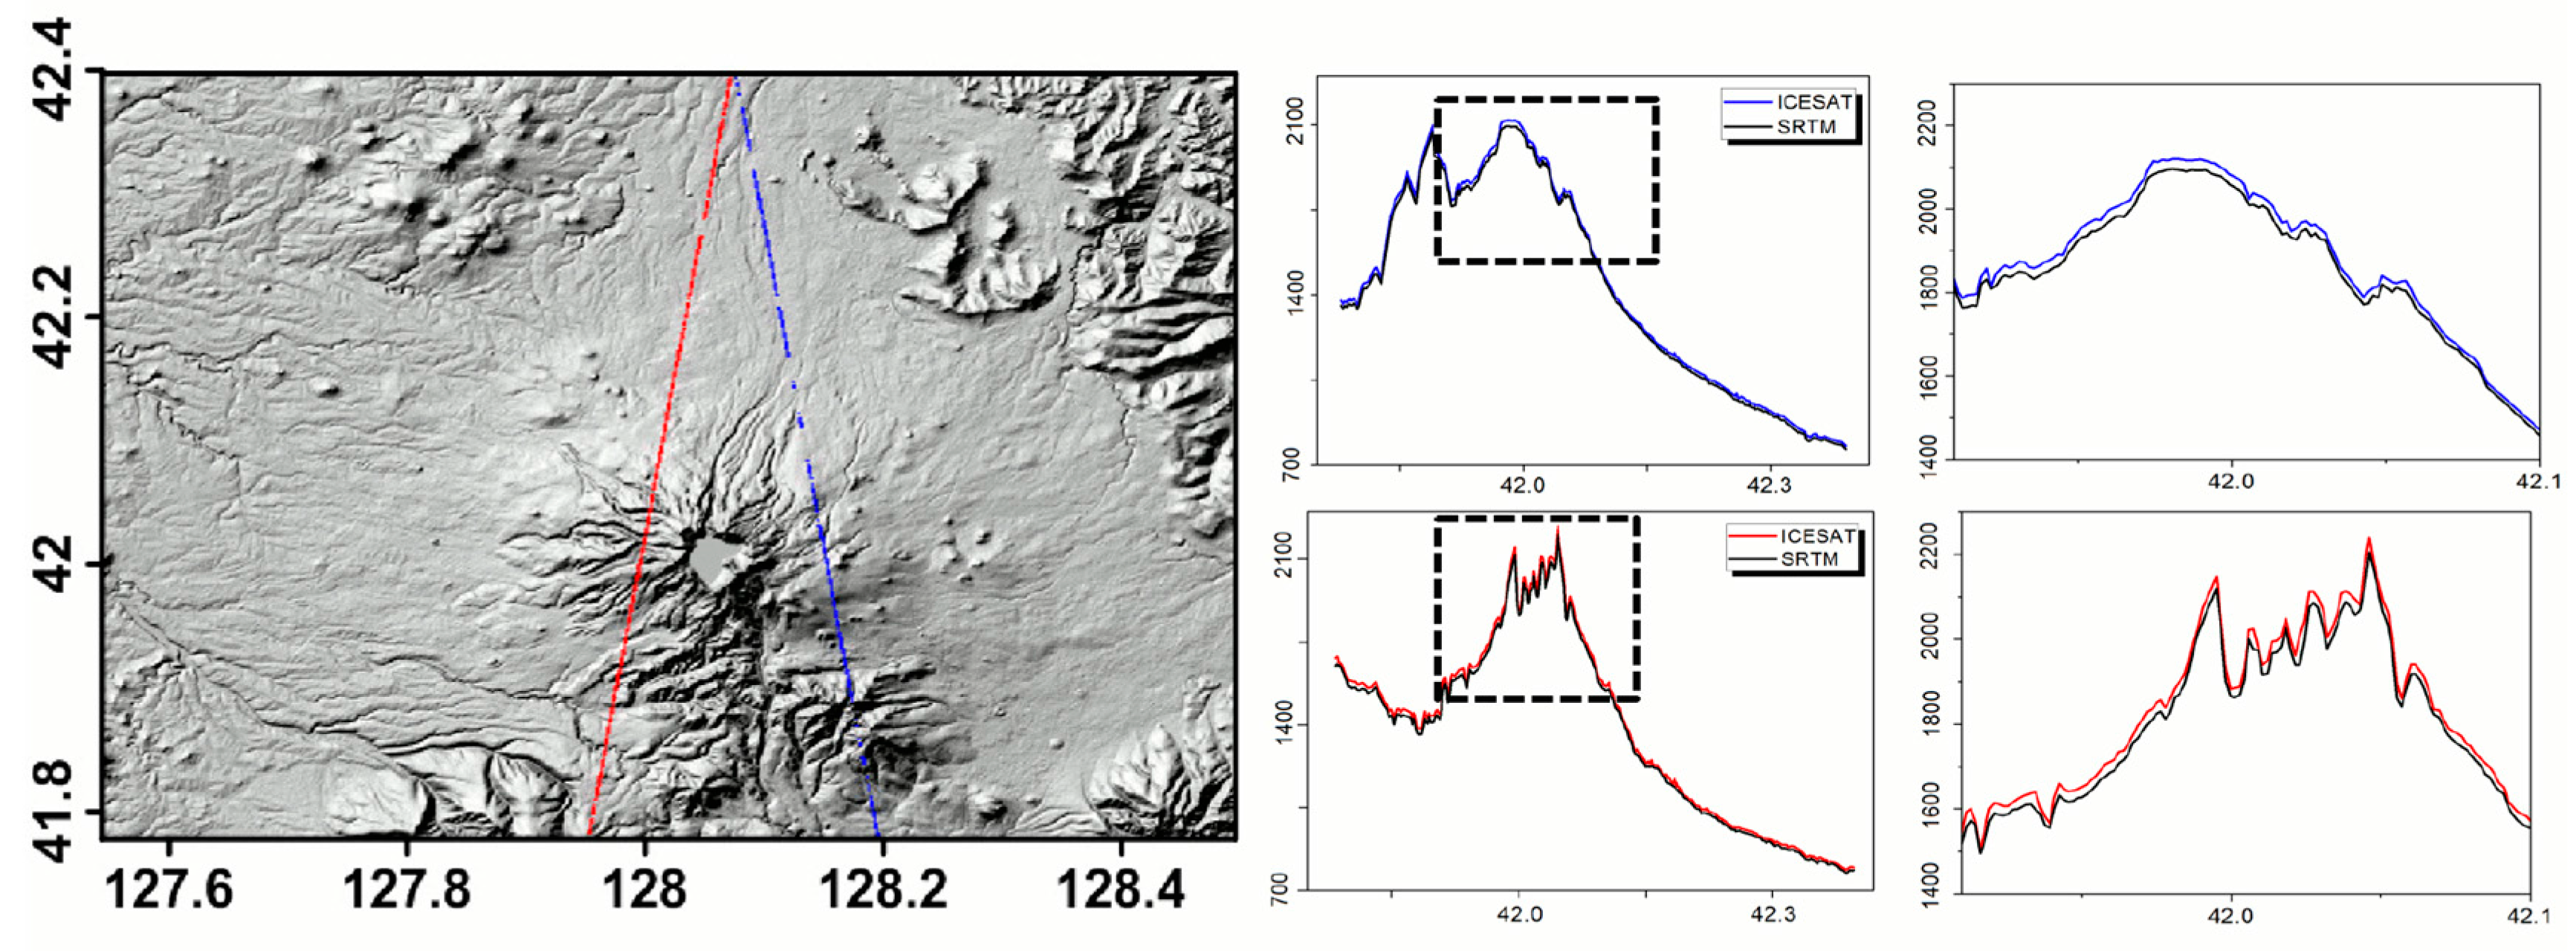
  65. Schutz, B.E.; Zwally, H.J.; Shuman, C.A.; Hancock, D.; DiMarzio, J.P. Overview of the ICESat mission. Geophys. Res. Lett. 2005, 32, 97–116. [Google Scholar] [CrossRef]
  66. Cao, B.; Wang, G.; Liu, Z. The disaster features of rock avalanche and landslide in Tianchi Lake tourist area of Changbai Mountain. In Proceedings of the 1999 IGCP-425 Meeting at Bonvin Building, Paris, France, 20–22 September 1999.
  67. Wu, J.; Ming, Y.; Zhang, H. Seismic activity at the Changbaishan Tianchi volcano in the summer of 2002. Chin. J. Geophys. 2005, 48, 621–628. [Google Scholar] [CrossRef]
  68. Pavlis, N.K.; Holmes, S.A.; Kenyon, S.C.; Factor, J.K. The development and evaluation of the Earth Gravitational Model 2008 (EGM2008). J. Geophys. Res. Solid Earth 2008, 117. [Google Scholar] [CrossRef]
  69. Mogi, K. Relations between the eruptions of various volcanoes and the deformation of the ground surfaces around them. Bull. Earth Res. Inst. Tokyo 1958, 36, 99–134. [Google Scholar]
  70. Okada, Y. Surface deformation due to shear and tensile faults in a half-space. Bull. Seismol. Soc. Am. 1985, 75, 1135–1154. [Google Scholar]
  71. Furuya, M. Localized deformation at Miyakejima volcano based on JERS-1 radar interferometry: 1992–1998. Geophys. Res. Lett. 2004, 31. [Google Scholar] [CrossRef]
  72. Chen, G.H.; Shan, X.J.; Moon, W.M.; Kim, K.R. A modeling of the magma chamber beneath the Changbai Mountains volcanic area constrained by InSAR and GPS derived deformation. Chin. J. Geophys. 2008, 51, 1085–1092. (In Chinese) [Google Scholar] [CrossRef]
  73. Chen, Y.L.; Wu, J.C.; Guo, L.Y.; Wang, X.Y.; Tan, H.B.; Shen, C.Y. 3D coseismic deformation inversion of Wenchuan Ms8. 0 earthquake with D-InSAR and the fault movement model. In Proceedings of the Remote Sensing of the Environment: 19th National Symposium on Remote Sensing of China, Xian City, China, 20 October 2014.
  74. Xu, C.; Xu, B.; Wen, Y.; Liu, Y. Heterogeneous fault mechanisms of the 6 October 2008 MW 6.3 Dangxiong (Tibet) earthquake using interferometric synthetic aperture radar observations. Remote Sens. 2016, 8, 228. [Google Scholar] [CrossRef]
  75. Marquardt, D.W. An algorithm for least-squares estimation of nonlinear parameters. J. Soc. Ind. Appl. Math. 1963, 11, 431–441. [Google Scholar] [CrossRef]
  76. Hu, Y.X.; Wang, Q.L.; Cui, D.X. Influence on surface deformation by the three different stress source models in volcano area. Seismol. Res. Northwest China 2005, 21, 32–38. (In Chinese) [Google Scholar]
  77. Yaseen, M.; Hamm, N.A.; Woldai, T.; Tolpekin, V.A.; Stein, A. Local interpolation of coseismic displacements measured by InSAR. Int. J. Appl. Earth Obs. Geoinf. 2013, 23, 1–17. [Google Scholar] [CrossRef]
  78. Cheloni, D.; Giuliani, R.; D’Anastasio, E.; Atzori, S.; Walters, R.J.; Bonci, L.; D’Agostino, N.; Mattone, M.; Calcaterra, S.; Gambino, P.; et al. Coseismic and post-seismic slip of the 2009 L’Aquila (central Italy) MW 6.3 earthquake and implications for seismic potential along the Campotosto fault from joint inversion of high-precision levelling, InSAR and GPS data. Tectonophysics 2014, 622, 168–185. [Google Scholar] [CrossRef]
  79. Feuillet, N.; Cocco, M.; Musumeci, C.; Nostro, C. Stress interaction between seismic and volcanic activity at Mt Etna. Geophys. J. Int. 2006, 164, 697–718. [Google Scholar] [CrossRef]
  80. Tizzani, P.; Battaglia, M.; Castaldo, R.; Pepe, A.; Zeni, G.; Lanari, R. Magma and fluid migration at Yellowstone Caldera in the last three decades inferred from InSAR, leveling, and gravity measurements. J. Geophys. Res. Solid Earth 2015, 120, 2627–2647. [Google Scholar] [CrossRef]
  81. Battaglia, M.; Cervelli, P.F.; Murray, J.R. Modeling crustal deformation near active faults and volcanic centers-A catalog of deformation models. In US Geological Survey Technique Methods; USGS: Reston, VA, USA, 2013; p. 96. [Google Scholar]
  82. Folch, A.; Gottsmann, J. Faults and ground uplift at active calderas. Geol. Soc. Lond. Spec. Publ. 2006, 269, 109–120. [Google Scholar] [CrossRef]
  83. Yun, S.; Segall, P.; Zebker, H. Constraints on magma chamber geometry at Sierra Negra Volcano, Galápagos Islands, based on InSAR observations. J. Volcanol. Geotherm. Res. 2006, 150, 232–243. [Google Scholar] [CrossRef]
  84. Manzo, M.; Ricciardi, G.P.; Casu, F.; Ventura, G.; Zeni, G.; Borgström, S.; Berardino, P.; Del Gaudio, C.; Lanari, R. Surface deformation analysis in the Ischia Island (Italy) based on spaceborne radar interferometry. J. Volcanol. Geotherm. Res. 2006, 151, 399–416. [Google Scholar] [CrossRef]
  85. Todesco, M.; Rutqvist, J.; Chiodini, G.; Pruess, K.; Oldenburg, C.M. Modeling of recent volcanic episodes at Phlegrean Fields (Italy): Geochemical variations and ground deformation. Geothermics 2004, 33, 531–547. [Google Scholar] [CrossRef]
  86. Chiodini, G.; Todesco, M.; Caliro, S.; Del Gaudio, C.; Macedonio, G.; Russo, M. Magma degassing as a trigger of bradyseismic events: The case of Phlegrean Fields (Italy). Geophys. Res. Lett. 2003, 30. [Google Scholar] [CrossRef]
  87. Land Surface Temperature and Emissivity 8-Day L3 Global 1km. Available online: https://lpdaac.usgs.gov/dataset_discovery/modis/modis_products_table/mod11a2 (accessed on 2 November 2016).
  88. Wright, T.J.; Parsons, B.E.; Lu, Z. Toward mapping surface deformation in three dimensions using InSAR. Geophys. Res. Lett. 2004, 31. [Google Scholar] [CrossRef]
  89. Fialko, Y.; Simons, M.; Agnew, D. The complete (3-D) surface displacement field in the epicentral area of the 1999 Mw7. 1 Hector Mine earthquake, California, from space geodetic observations. Geophys. Res. Lett. 2001, 28, 3063–3066. [Google Scholar] [CrossRef]
  90. Hu, J.; Li, Z.W.; Sun, Q.; Zhu, J.J.; Ding, X.L. Three-dimensional surface displacements from InSAR and GPS measurements with variance component estimation. IEEE Geosci. Remote Sens. Lett. 2012, 9, 754–758. [Google Scholar]
  91. Samsonov, S.; van der Kooij, M.; Tiampo, K. A simultaneous inversion for deformation rates and topographic errors of DInSAR data utilizing linear least square inversion technique. Comput. Geosci. 2011, 37, 1083–1091. [Google Scholar] [CrossRef]
  92. Fattahi, H.; Amelung, F. DEM error correction in InSAR time series. IEEE Trans. Geosci. Remote Sens. 2013, 51, 4249–4259. [Google Scholar] [CrossRef]
  93. Chun, J.M.; Rang Kim, K.; Lee, S.Y.; Kang, W.S.; Park, J.S.; Yi, C.Y.; Choi, Y.J.; Park, E.W.; Hong, S.S.; Jung, H.S. High Resolution Forecasting System for Mountain area based on KLAPS-WRF. In Proceedings of the EGU General Assembly Conference, Vienna, Austria, 7–2 April 2013; Volume 15, p. 6656.
Figure 1. The location of Mt. Baekdu is indicated by a box in (a) and the corresponding zoomed-in view of 30m resolution Shuttle Radar Topography Mission (SRTM) DEM is shown in (b). The faults lines and the estimated magma chambers from the gravity model in [5] and epicenters of earthquakes [2] are also represented. The Sentinel-2 space-borne image taken in October, 2010 is shown in (c). The snow cover, dense vegetation canopy and steep slope around the Cheonji Candela Lake can be observed.
Remotesensing 09 00138 g001
Figure 2. Water vapor anomaly around Mt. Baekdu (outlined by the white circle) shown in MODIS MOD 5 water vapor products on (a) 14th of April 2009 (b) 5th of May 2009.
Remotesensing 09 00138 g002
Figure 3. Interpolated MODIS TPW (Total Perceptible Water) maps over Mt. Baekdu: (a) TPW map for master SAR image acquisition time (19 July 2009); (b) TPW map for water vapor map in slave SAR image acquisition time (3 September 2009).
Remotesensing 09 00138 g003
Figure 4. Weather Research and Forecasting (WRF) water vapor in master (a) slave (b) and constructed error maps in unit of cm (c).
Remotesensing 09 00138 g004
Figure 5. The two-pass D-InSAR processing using ALOS PALSAR pair (left: before atmospheric error correction, right after error correction) (a) the pair 1DInSAR results obtained on 2009/07/19 and 2009/09/03, (b) the pair 2 results obtained on 2010/01/19 and 2010/04/21.
Remotesensing 09 00138 g005
Figure 6. Connection graph of ENVISAT ASAR pairs during 2007–2010 for SBAS processing in StaMPS software, from which the spatial and temporal baseline can be observed. Refer to Table 2 for the image acquisition date.
Remotesensing 09 00138 g006
Figure 7. Mean velocity in Line of Sight (LOS) direction over Mt. Baekdu during 2007/02/02–2010/06/11. Left figure (a) shows the velocity map covering the whole ASAR processing area. The black polygon outlined in (a) is zoomed-in and shown in figure (b), in which the area outlined by the red line in the timberline area. The significant deflation occurring in the eastern slope is observed.
Remotesensing 09 00138 g007
Figure 8. The map of mean precision dispersion (a) of mean velocity corresponding to the extent shown on Figure 7. and zoomed-in on (b). The area covered with a low number dots represents the area with high estimated precision. The area outlined by the red line in (b) is the timberline area.
Remotesensing 09 00138 g008
Figure 9. ICESAT Track profiles over Mt. Baekdu. The mean and standard deviation values of height difference (ICESAT-SRTM DTM) along ICESAT track 2008/03/05 (red line) are 18.892 m and 5.741 m respectively. Along the ICESAT track 2008/03/17 (blue line), the mean and standard deviation of height difference are 19.432 m and 7.932 m.
Remotesensing 09 00138 g009
Figure 10. LOS displacement time series over Mt. Baekdu derived from PS-InSAR processing using ENVISAT ASAR images.
Remotesensing 09 00138 g010
Figure 11. Cumulative deformation in obvious anomalous sites around the summit: (a) in site “a”, (b) in site “b”, (c) in site “c” and (d) in site “d” (see Figure 7 to identiy each location). Note that the error bar represents the standard deviation of deformation for each site. The error bar mean the standard deviation of surface deformation in each area 5.3. Geophysical Modelling and Interpretations
Remotesensing 09 00138 g011
Figure 12. Deformation extracted by StaMPS/MTI observations (left column) and modelling with a Mogi, three Okada models (middle column) and error residuals (right column) for the time periods (a) 2007/08/312007/12/14, (b) 2008/03/282008/05/02, (c) 2010/02/262010/04/02. The lines in (a) represented the fault lines inferred from [5] and the crosses are the epicenters of earthquakes during 2002–2005 [2]. The dotted lines in (b) are projected outlines of Okada deformation sources (OK1 to OK4) and the star signs are for the location of Mogi type sources. Note rough discontinuities of deformation patterns in the location of the fault line by StaMPS/MTI observations.
Remotesensing 09 00138 g012
Figure 13. Deformation extracted by StaMPS/MTI observations (left column), modelling with two Okada models (middle column) and error residuals for three time periods (right column) (a) 2007/08/31–2007/12/14, (b) 2008/03/28–2008/05/02 and (c) 2010/02/26–2010/04/02 (top to bottom).
Remotesensing 09 00138 g013
Figure 14. MODIS thermal anomaly around deformation areas (a) 2007/07/26, (b) 2009/04/24, (c) average of 10 normalized surface temperature of cloud free MODIS land temperature products during 2007–2010.
Remotesensing 09 00138 g014
Table 1. ALOS PALSAR images used for two pass DInSAR processing over the target area.
Perpendicular Baseline (m)Image IDOperation ModeAcquisition Time TrackFramePolarization
Pair 1562.6ALPSRP185620830FBD2009/07/19 13:53401770HH + HV
ALPSRP192330830FBD2009/09/03 13:53401770HH + HV
Pair 2912.1ALPSRP212460830FBS2010/01/19 13:53401770HH
ALPSRP225880830FBS2010/04/21 13:53401770HH
Table 2. ENVISAT ASAR images over Mt. Baekdu during the 2007–2010 period.
NoAcquisition TimeOrbitTrackFramePass
02007/02/02 01:44:47.53257511462759Descend
12007/03/09 01:44:48.84262521462760Descend
22007/04/13 01:44:47.23267531462760Descend
32007/05/18 01:44:50.34272541462760Descend
42007/07/27 01:44:52.77282561462760Descend
52007/08/31 01:44:51.35287571462760Descend
62007/12/14 01:44:44.71302601462759Descend
72008/01/18 01:44:45.79307611462759Descend
82008/03/28 01:44:46.06317631462759Descend
92008/05/02 01:44:44.21322641462759Descend
102008/08/15 01:44:46.07337671462759Descend
112008/10/24 01:44:44.65347691462759Descend
122009/06/26 01:44:45.26382761462760Descend
132009/07/31 01:44:44.86387771462760Descend
142009/09/04 01:44:43.53392781462760Descend
152010/01/22 01:44:38.78412821462759Descend
162010/02/26 01:44:36.34417831462759Descend
172010/04/02 01:44:36.99422841462761Descend
182010/06/11 01:44:35.17432861462761Descend
Table 3. Source parameters determined by inversion. See Figure 12 for location of deformation sources (OK1 to OK4).
Time2007/08/31–2007/12/142008/03/28–2008/05/022010/02/26–2010/04/02
SourcesPoint SourcePoint SourcePoint Source
Volume Variation (m3)3,755,982.1411,579,134.672−1,556,898.017
Depth (m)11,465.46711,094.18310,013.452
East (m)40,872.121423,213.874415,155.909
North (m)4,648,746.0964,635,012.3444,635,640.076
SourcesFault line1 (OK1)Fault line2 (OK2)Fault line1 (OK1)Fault line2 (OK2)Fault line1 (OK1)Fault line2 (OK2)
Length (m)49,637.68620,224.74710,229.78937,199.06525,677.19359,879.098
Width (m)10,068.54420,793.34714,943.4003401.96629,832.4987353.123
Depth (m)488.956497.9560489.432487.3430
Dip (deg)13.6575.08722.55848.2769075.416
Strike (deg)280.45651.397299.11337.600106.851302.676
East (m)422,950.597409,249.061433,181.514413,386.896428,145.174421,806.633
North (m)4,644,922.4134,649,463.4304,642,377.5924,648,702.5274,641,577.1944,647,159.085
Rake (deg)50.521100.38432.014168.951139.269178.033
Slip(m)0.0130.0130.0030.0120.0150.005
SourcesFault line3 (OK3)Fault line4 (OK4)Fault line3 (OK3)Fault line4 (OK4)Fault line3 (OK3)Fault line4 (OK4)
Length (m)36,275.33044,430.80159,398.23459,989.43314,173.72521,509.433
Width (m)13,861.33622,048.05919,446.2349758.04210,852.91627,445.590
Depth (m)459.5640.122459.212496.309487.209458.321
Dip (deg)8.353028.34327.85272.53959.372
Strike (deg)308.203181.13726.061329.567268.35496.573
East (m)418,759.992412,945.360431,978.382419,622.734434,841.328414,725.131
North (m)4,647,442.7454,659,005.6404,641,027.3664,661,893.4344,643,033.1844,655,743.219
Rake (deg)−180134.407−42.816−159.69219.09434.943
Slip (m)0.0100.0060.0030.0080.0240.004
Goodness of fitNRMSE: 0.029NRMSE: 0.119NRMSE: 0.015
χ2: 0.588χ2: 0.372χ2: 0.034
RMSE: 2.069RMSE: 0.815RMSE: 0.971
Table 4. Source parameters determined by inversion. See Figure 12 for location of deformation sources (OK1 to OK2).
Time2007/08/31–2007/12/142008/03/28–2008/05/022010/02/26–2010/04/02
SourcesFault line1 (OK1)Fault line2 (OK2)Fault line1 (OK1)Fault line2 (OK2)Fault line1 (OK1)Fault line2 (OK2)
Length(m)26,854.21812,738.54021,471.38120,381.85927,459.67723,449.507
Width(m)14,210.86617,033.6135124.0123589.1454,253.37110,298.3151
Depth(m)3916.3821647.7554987.5211202.6272582.4804933.270
Dip(deg)84.055325.830389.201334.667845.833622.7832
Strike(deg)269.253160.596111.94743.991298.86042.389
East(m)421,214.302434,197.853419,186.531428,028.4981426,536.008429,767.141
North(m)4,641,029.6024,634,698.0014,631,301.9144,643,152.0404,646,755.0594,649,816.136
Rake(deg)10.428−179.512−179.522−82.732161.64538.525
Slip(m)0.0900.02680.03900.01200.05050.0159
Goodness of fitNRMSE: 0.024NRMSE: 0.021NRMSE: 0.027
χ2: 1.937χ2: 1.266χ2: 1.067
RMSE: 2.700RMSE: 0.501RMSE: 1.094

