Article

An Improved Shape Contexts Based Ship Classification in SAR Images

1
Key Laboratory of Technology in Geo-spatial Information Processing and Application System, Institute of Electronics, Chinese Academy of Sciences, 100190 Beijing, China
2
University of the Chinese Academy of Sciences, Beijing 100039, China
*
Author to whom correspondence should be addressed.
Remote Sens. 2017, 9(2), 145; https://doi.org/10.3390/rs9020145
Submission received: 8 December 2016 / Accepted: 4 February 2017 / Published: 10 February 2017
(This article belongs to the Special Issue Ocean Remote Sensing with Synthetic Aperture Radar)

Abstract

:
In synthetic aperture radar (SAR) imagery, relating to maritime surveillance studies, the ship has always been the main focus of study. In this letter, a method of ship classification in SAR images is proposed to enhance classification accuracy. In the proposed method, to fully exploit the distinguishing characters of the ship targets, both topology and intensity of the scattering points of the ship are considered. The results of testing the proposed method on a data set of three types of ships, collected via a space-borne SAR sensor designed by the Institute of Electronics, Chinese Academy of Sciences (IECAS), establish that the proposed method is superior to several existing methods, including the original shape contexts method, traditional invariant moments and the recent approach.

Graphical Abstract

1. Introduction

Synthetic aperture radar (SAR) has become a valuable tool for maritime surveillance studies. Satellite SAR images are used for ship detection by virtue of their wide coverage and the all-day and any-weather acquisition capability. At present, there have been many literatures on ship detection in SAR imagery. The early researches are generally based on intensity images [1,2,3,4]. As early as 1996, an automatic ship and ship wake detection system for spaceborne SAR image is proposed by Eldhuset [1]. In [2], Crisp presents a review of the available literatures on algorithms for ship detection based on intensity images. The information provides by the backscattered intensity collected by a single-polarization SAR is not sufficient to observe metallic targets. To obtain more effective observation techniques, great attention to polarimetric approaches has been paid [5,6]. More recently, many researchers [7,8] propose different approaches relying on the information kept in the spectrum of a single-look complex (SLC) SAR images.
With improvement in the resolution of SAR sensor, as another interesting research field in the domain of marine surveillance, ship classification in SAR images has been receiving greater attention in recent years. Restricted by the amount of samples, many early studies were carried out on simulated images. Graphical electromagnetic computation SAR (GRECOSAR), an orbital polarimetric SAR simulator, is employed by Margarit et al. [9] for ship classification. The usefulness of the simulator on vessel classification studies is assessed. Osman et al. [10] present a back propagation neural network to classify simulated ship images with a correct classification rate of 98%. A ship classifier based on the principal components analysis (PCA) are proposed [11] and the recognition performance of the classifier are measured using various sets of simulated ship images under various aspect angles. However, the above methods require a large amount of data samples. Since it is difficult to get enough real samples, the algorithms can only be carried on simulated images. With the launching of several commercial satellites since the 1990s, such as Envisat and RadarSat-1, the polarimetric SAR is exploited for ship classification [12,13]. Symmetric scattering characterization method (SSCM) [12], a new method based on Poincare sphere representation, is introduced by Touzi [13] for ship characterization. Dominant scatters which are useful for ship characterization are extracted by SSCM. However, the method is sensitive to the system focus setting and Doppler centroid shift. In [14], a new ship classification methodology that takes advantage of single-pol SAR images based on a fuzzy logic (FL) decision rule is presented. Experiments conducted with the ENVISAT images and AIS polls have achieved a classification ratio to 70%. These researches are based on low-resolution images, leading to poor classification accuracy. In recent years, the successful launching of high-resolution and multi-polarization SAR sensors, such as TerraSAR-X and RadarSat-2, provided better observation conditions for ship targets. Researchers paid much more attention to ship classification. Margarit et al. [14] propose an approach combining Pauli data analysis with height-retrieval techniques to classify ships, based on their 3-D geometry. The experimental results prove good performance of algorithm for realistic system, TanDEM-X. By extracting geometric and local Radar Cross Section (RCS) density features and applying the sparse-representation classification (SRC), Xing et al. [15] present a method to recognize ships in the feature space. Zhang et al. [16] consider the scattering components that can represent the structure, materials, orientation, and other information relating to merchant ships. However, the results of their research are mainly limited to civil ships, such as oil tank, bulk and container, which has large difference in shape and appearance. The SRC proposed in Xing's literature [15] requires a large number of ship samples, which is not satisfied by many categories of ships. Besides, the principal axis direction extraction and Zhang's classification criteria [16] are not applicable for warships whose shape difference is not obvious. The key to ship recognition is discriminative feature extraction. Many researchers investigate the effective shape features extraction using the public moving and stationary target acquisition and recognition (MSTAR) dataset which includes several types of armored vehicles with azimuth angles that range from 0 to 360. Zhou et al. [17] put forward scattering center features at different target poses using a global scattering center model. Park et al. [18] propose 12 new features based on the projection length curve. Park and Kim [19] extract the 1-D projection on radius and compressed coefficients by principal component analysis (PCA) based on polar-mapped image. Zernike moments have been introduced by Amoon [20] for target recognition in SAR images. The targets shadow is considered by Papson and Narayanan [21] for classification. However, since it is difficult to obtain enough samples, the above feature extraction methods cannot be applied to warship classification. To sum up, there has not been enough research on ship classification in SAR imagery, especially the warships with a low degree of distinction and those with few samples.
This paper focuses on devising a precise classification of warship targets, without the need for a large number of samples. Besides, compared with the civilian ships, the warships are much closer in shape and structure. In SAR images, the ship targets are composed of scattering points, whose distribution patterns vary from ship to ship. Shape contexts feature [22] is a kind of feature extraction method using log-polar histogram to describe the distribution of contour sampling points in natural images. It has good recognition accuracy and has applied in many fields [23,24]. But so far no literature has applied this method to target classification in SAR imagery. The matching procedure of shape contexts does not require large numbers of samples which are necessary in many machine learning approaches. Due to the characteristics of shape contexts, it would be an effective method for warship classification in SAR images. However, this feature is not rotationally invariant and cannot utilize the intensity of the scattering points. In this work, by modifying the original shape contexts (OSC) method, we propose a novel classification method called improved shape contexts (ISC). Through principal axis extraction of ship by PCA and weighted matching process, both the intensity and the topology of scattering points are utilized in the method. The proposed method is validated by testing on a real ship data set collected via a space-borne SAR sensor designed by the Institute of Electronics, Chinese Academy of Sciences (IECAS). The result shows that the improved shape contexts method is superior to original method and other traditional moment methods.
The remainder of this letter is organized as follows: Section 2 analyzes the main characteristics of ships in SAR images and presents the authors novel classification method for warships in SAR images; Section 3 validates the proposed method by testing it on real data set collected from a space-borne SAR sensor; the conclusions are presented in Section 4.

2. The Proposed Classification Method

2.1. Problem Description

According to the mechanism of imaging SAR, the ship targets in SAR imageries are composed of many discrete scattering points. The discrete scattering points are called scattering centers, as shown in Figure 1.
The scattering points are generated by the interaction between the radar wave and the superstructure of ships, such as the castle, bridge and mast. Since different types of warships have different types of superstructures, the intensity and the topology of scattering points are also different. They are the best discriminating features to differentiate one type of ship from others in SAR imagery.
However, precise ship classification is always a challenging task for three reasons. First, because of the special imaging process of SAR and the electromagnetic scattering mechanism, the scattering points are sensitive to the azimuth angle of the ship. Second, since the ships in SAR image do not have obvious texture and edge, some local features, such as Scale-Invariant Feature Transform (SIFT) and Histogram of Oriented Gradient (HOG), are no longer applicable. Besides, many types of ships are similar in size, as shown in Figure 1; so, it is not enough to just measure the length and width to distinguish them. Last but not the least, it is quite difficult to collect adequate experimental ship samples; so, it is hard to take advantage of machine learning methods.
In conclusion, the classification strategy should not require many experimental samples. Second, the feature descriptors should have a good description of the ship's global characteristics, specifically the intensity and the topology of scattering points. In addition, since scattering points are sensitive to the azimuth angle of ships, the method should also be robust against changes in scattering intensity.

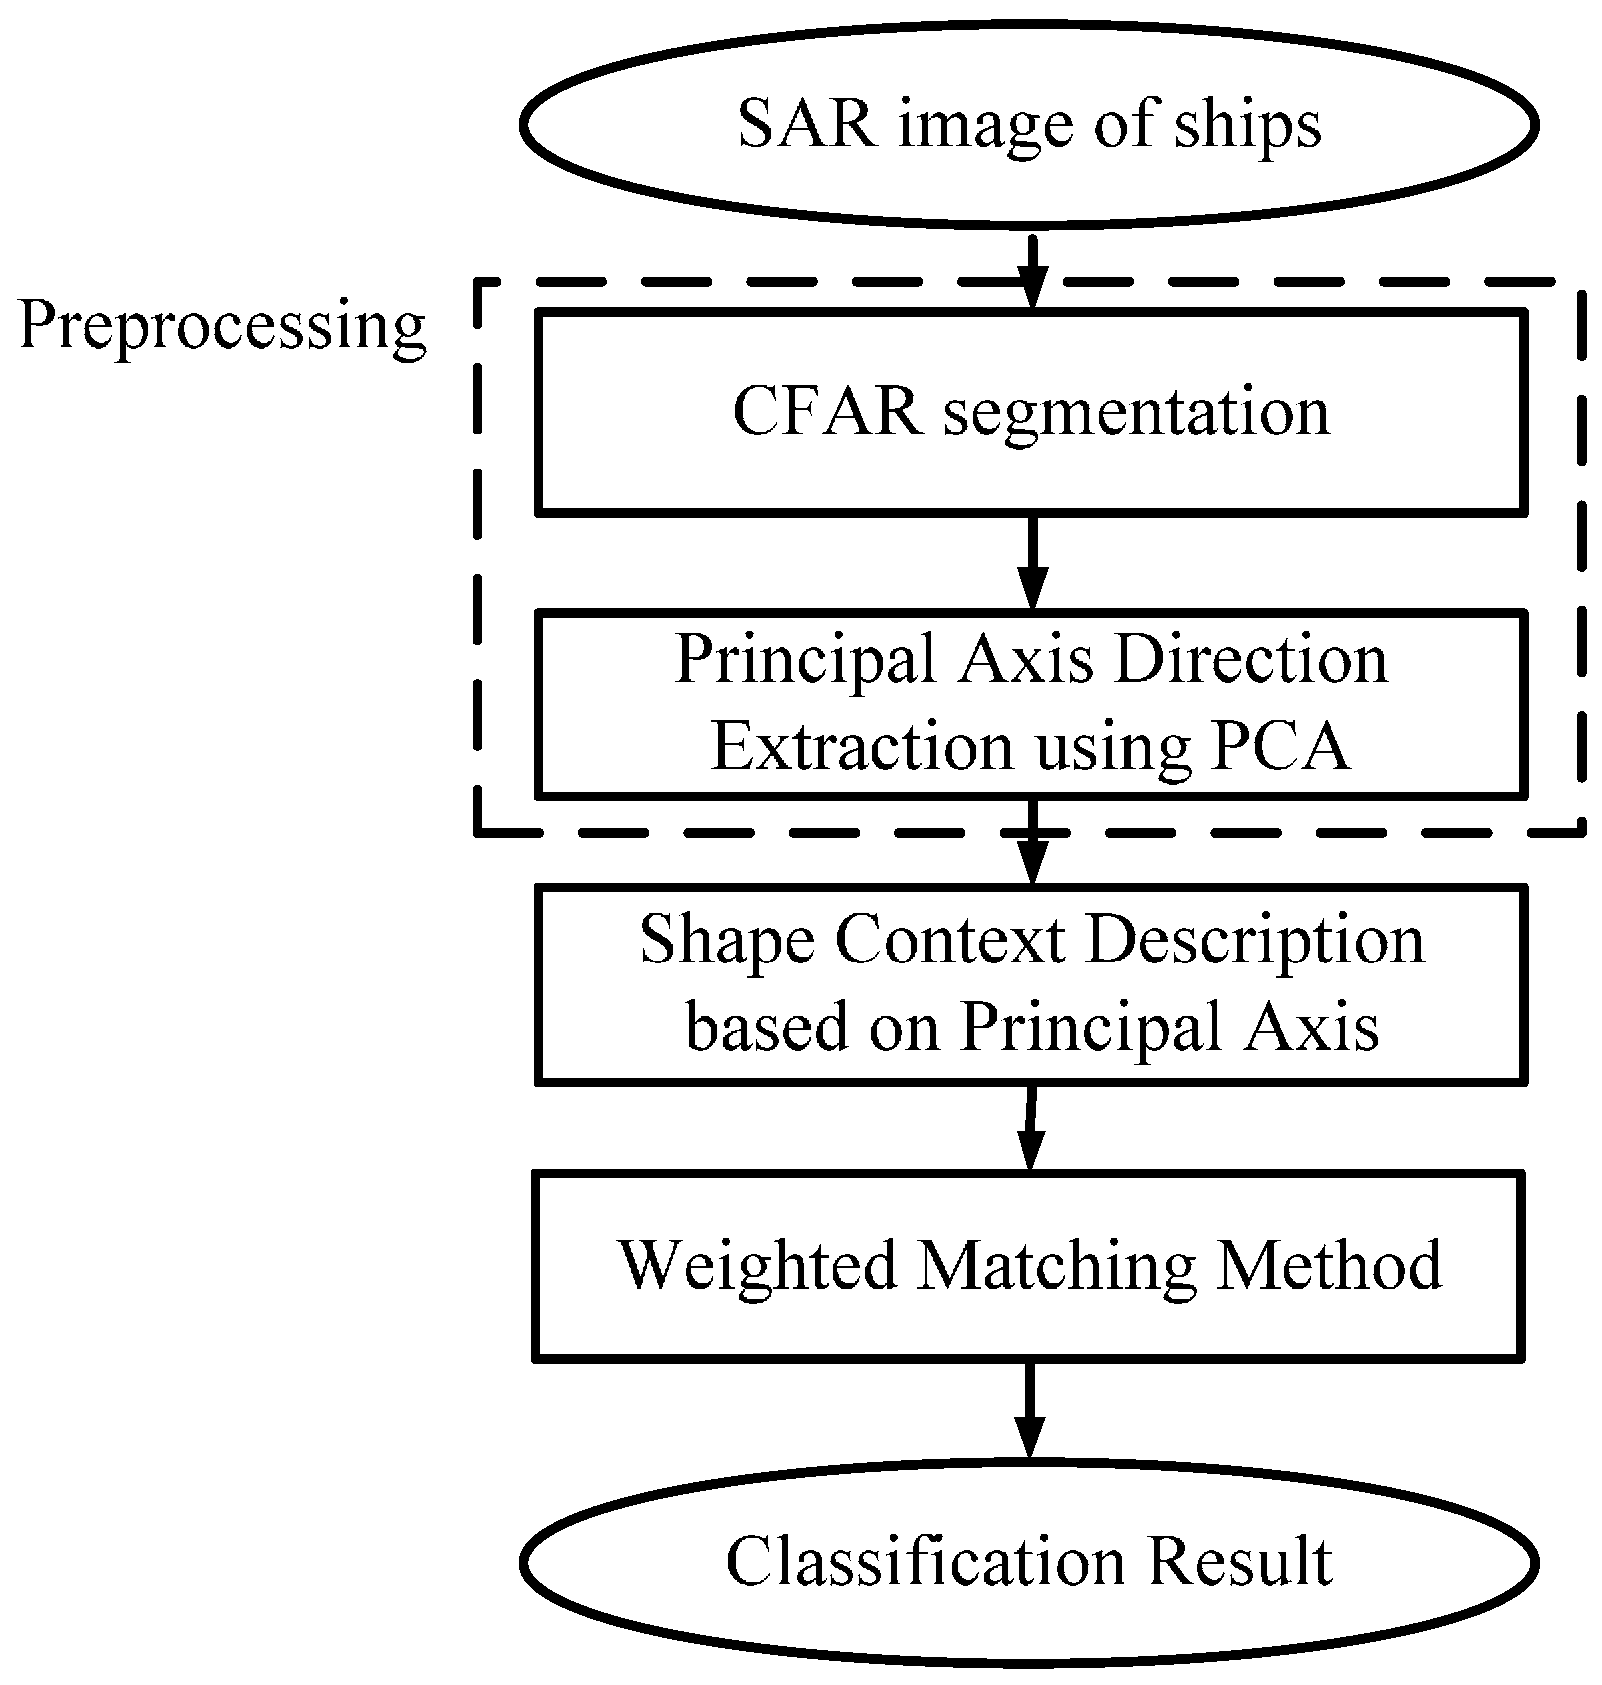
2.2. Proposed Ship Classification Method

In this section, a novel method for classification of warships in SAR images is proposed, based on the improved shape contexts. The proposed method includes two steps: (i) feature extraction and (ii) feature matching. The feature extraction method takes full advantage of the topology of scattering points, with invariance to image translation and rotation. The feature matching method exploits the intensity of the scattering points.
The proposed method is divided into several stages, as shown in Figure 2. Before attempting to classify the ships, the ships must have been reliably detected by applying the ship detection technique, and separated from the surroundings.

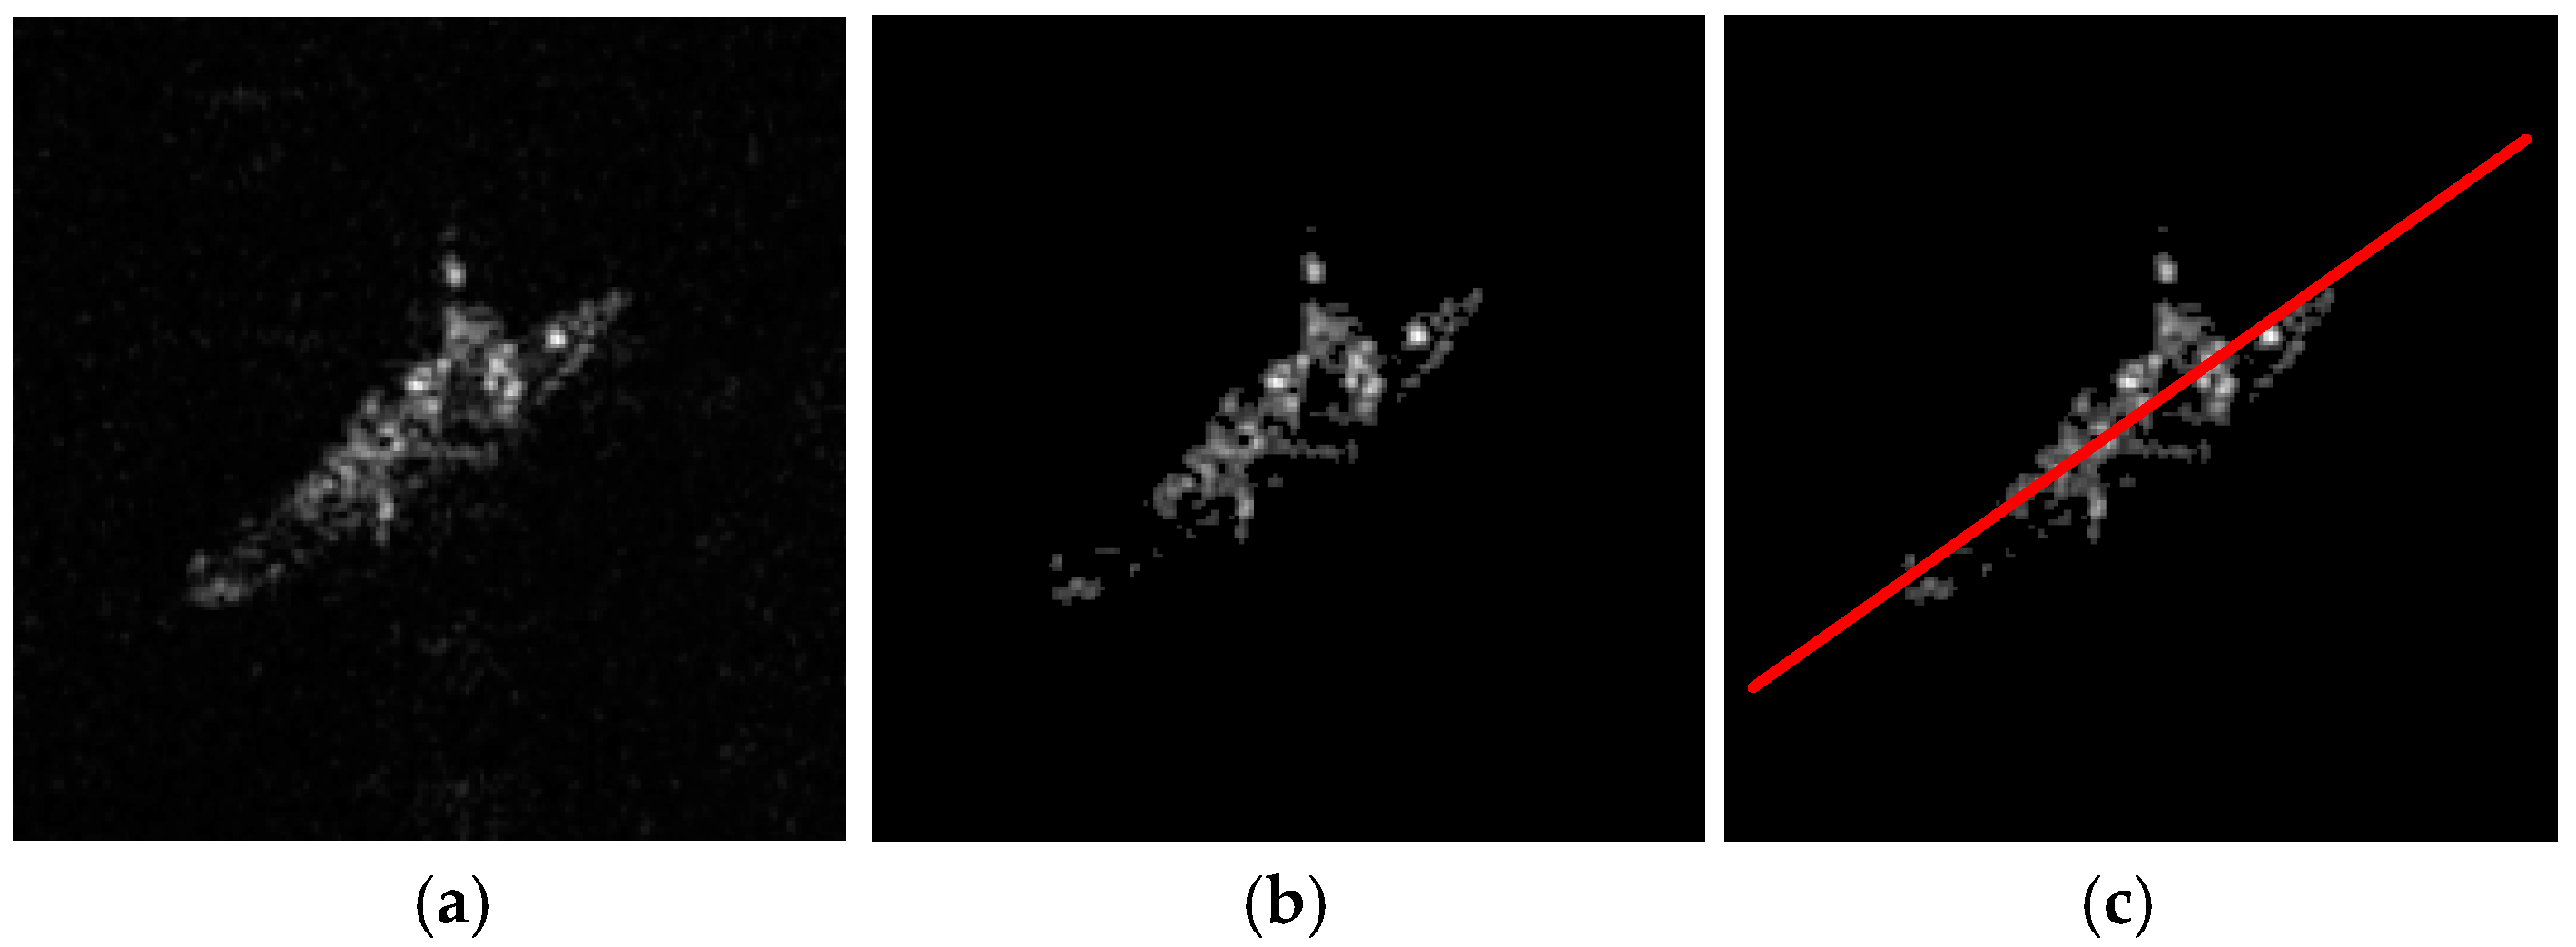
2.2.1. Preprocessing

1. CFAR segmentation
First of all, Constant False Alarm Rate (CFAR) [25] segmentation is used to extract the scattering centers of ships, as shown in Figure 3. In this paper, the 2-parameter CFAR is employed for ship segmentation. Both of the sea clutter and the sidelobes of ships appeared in the segmented image will affect the topology of scattering centers. These interferences will affect the subsequent experimental performance. Besides, the stable scattering centers are more valuable in subsequent experiments. So we set a low false alarm rate (10−6) to remove all the sea clutter. Since the sidelobes of warships in our experiments are rather weak, they are also generally removed after segmentation. So, there is no need to suppress the sidelobes. After CFAR segmentation, the stable scattering centers (see Figure 3b) are segmented from the original image.
2. Principal axis direction extraction using PCA
Because of the geometrical characteristics of ship targets, the scattering points are distributed along the principal axis of ships. Besides, the scattering points are symmetrically distributed on both sides of ships. So, the principal component analysis (PCA) method [26] can be employed to compute the principal axis of the scattering points of the segmented targets.

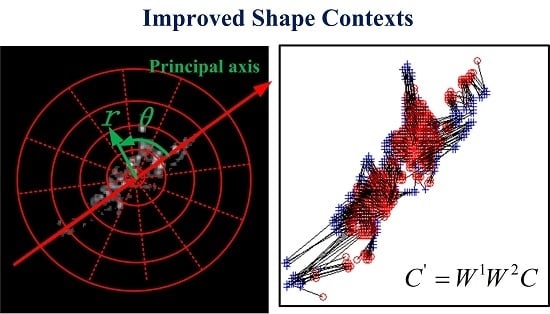
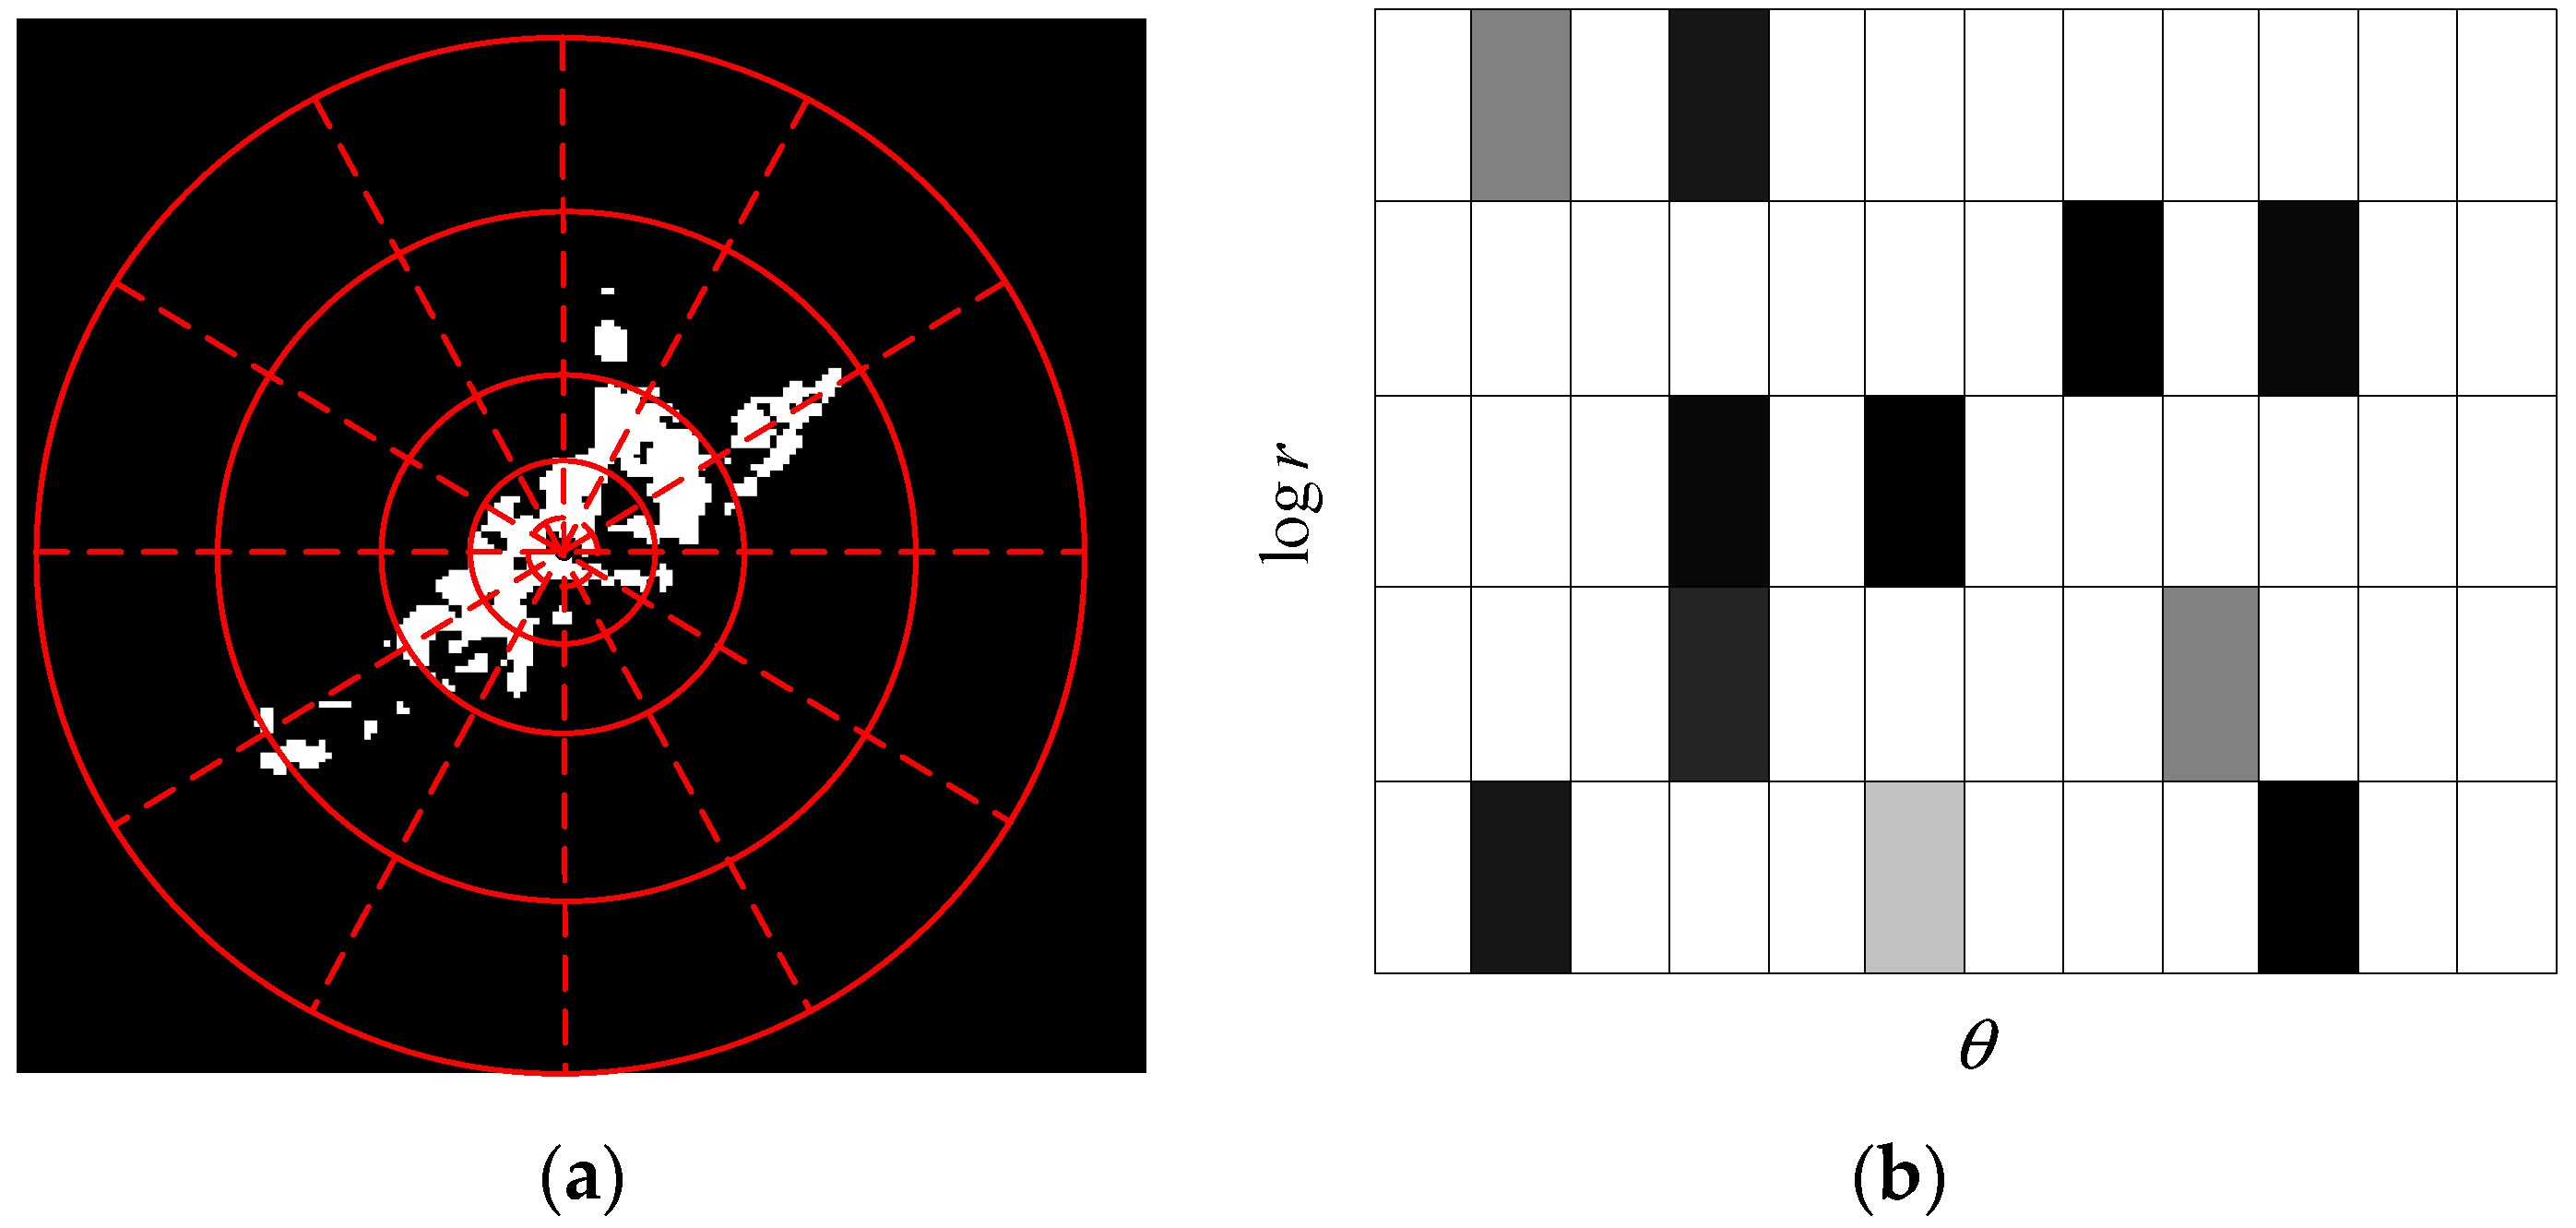
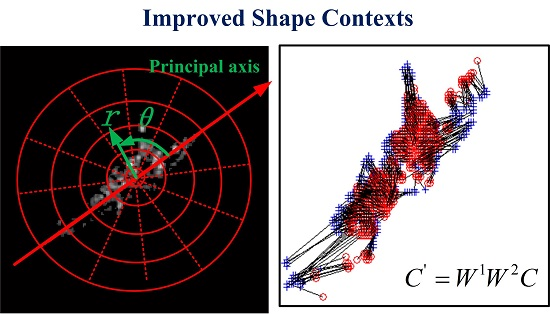
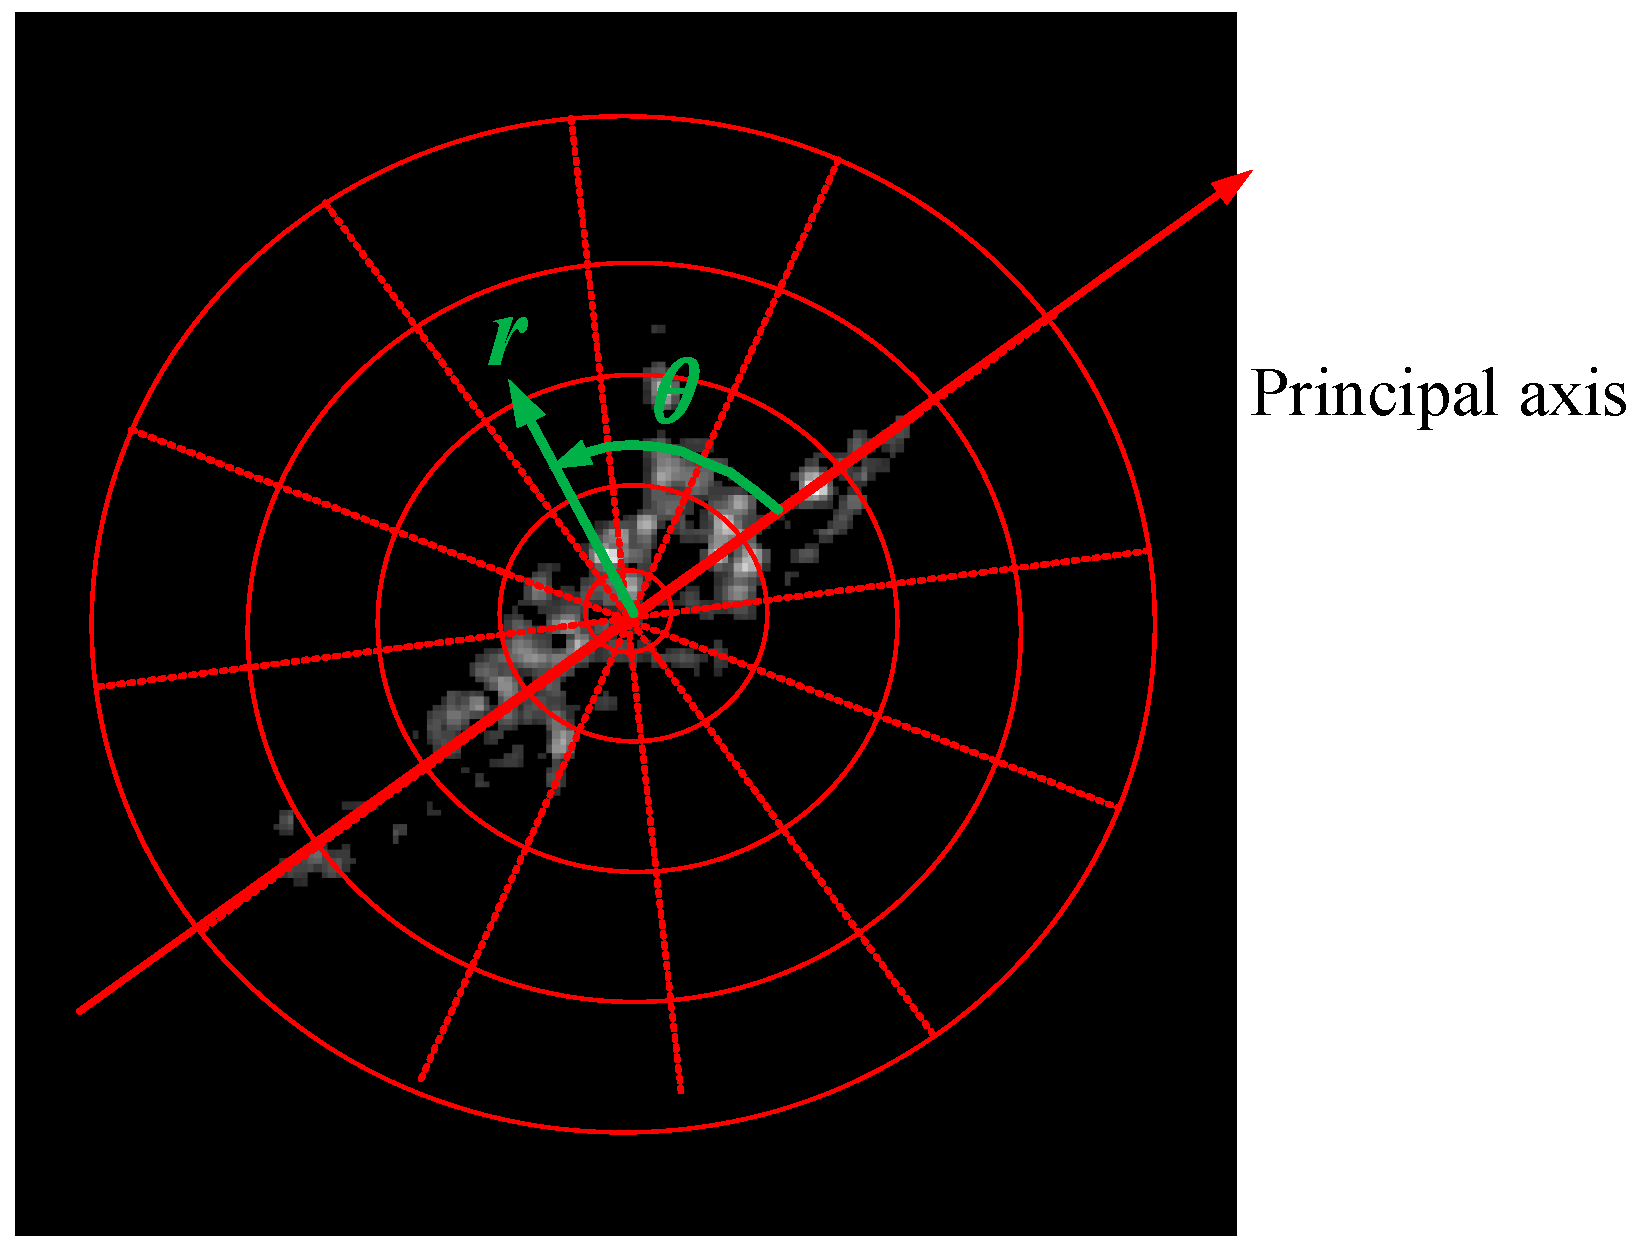
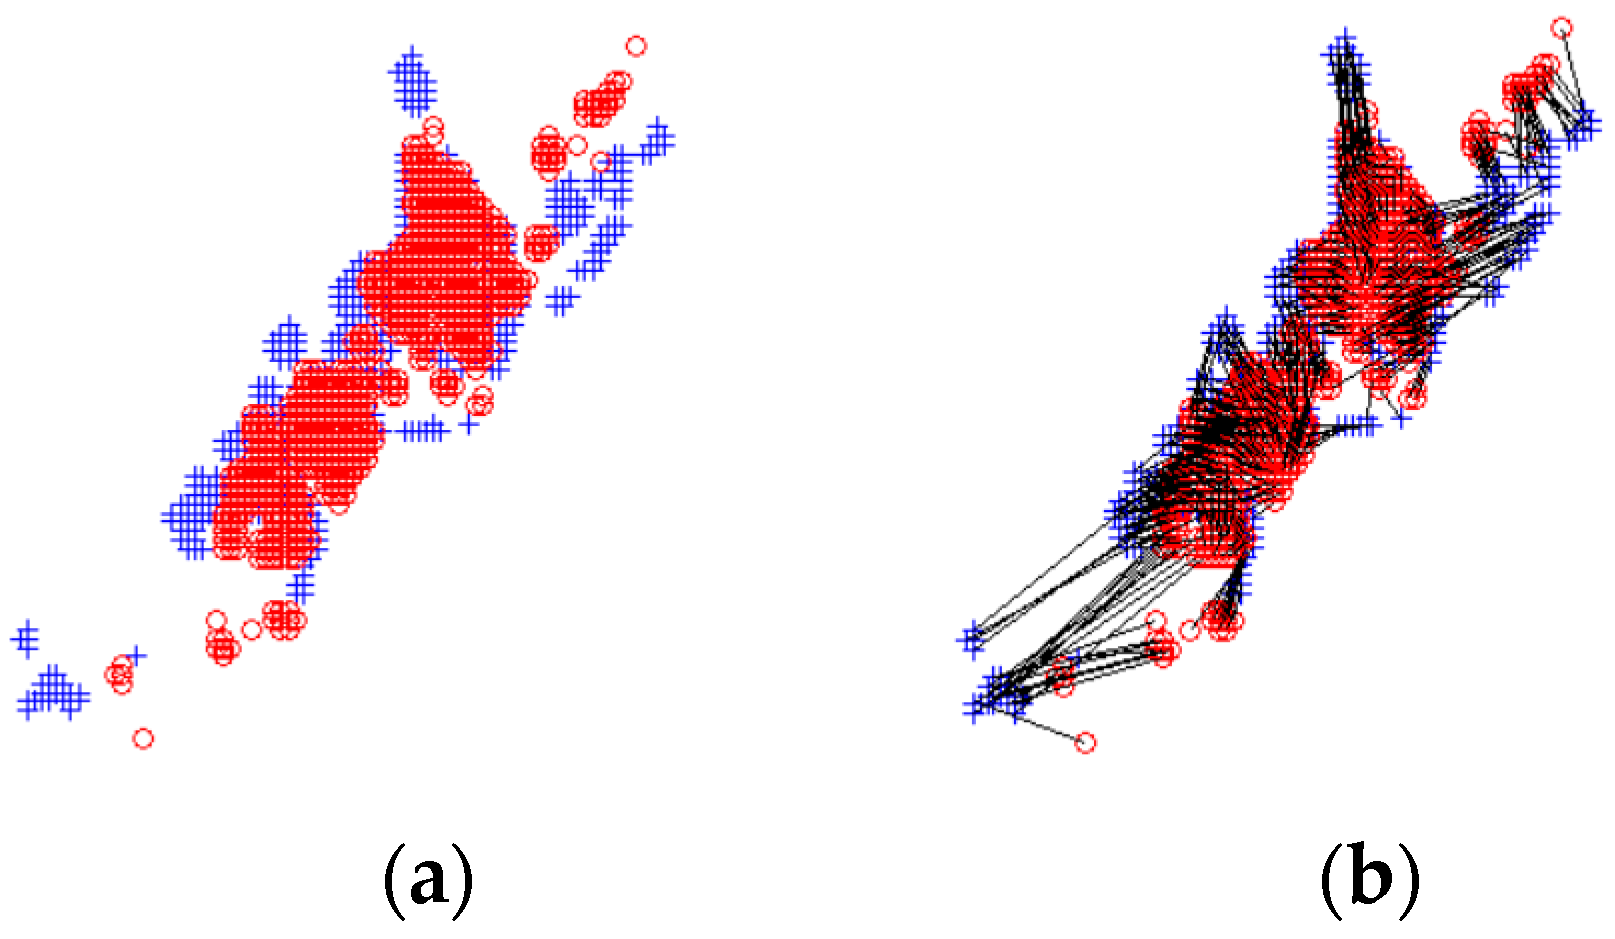
2.2.2. The Improved Shape Contexts Method

After extracting the scattering points and the principal axis, the feature extraction and matching methods are implemented for ship classification.
1. Shape contexts description based on principal axis
Shape context (see Figure 4) is a kind of shape feature that uses log-polar histograms to describe the distribution of sampling points of the object contour. The sampling points are defined as P = { p 1 , p 2 , p 3 , p n } , p i I R 2 , (the meaning of I R 2 is two dimensional real number vector space) where n is the total number of points. By selecting the ith point p i as the point of origin, a coarse histogram h i of the relative coordinates of the remaining n − 1 points can be computed,
h i ( k ) = # { q p i : ( q p i ) b i n ( k ) }       1 k K
This histogram is defined as the shape context of p i . q denotes the remaining sampling point and K denotes the number of histogram grid partitions. b i n are uniform in log-polar space. The polar coordinates of q are defined as ( r , θ ) . r represents for the distance between q and p i . θ represents for the angle between the connecting line of the two points and the zero angle axis, measured in anticlockwise direction.
Specifically, log r is divided uniformly into M parts and θ into N parts; so, the dimensions of histogram K are M × N . The two dimensional histogram is defined as
S = { ( m , n ) : 1 m M , 1 n N }
Then, the histogram set for all the sampling points is defined as
h i = { h i ( k ) : 1 k K } = { h i ( m , n ) : ( m , n ) S }     , k = ( n 1 ) × M + m
However, the original shape contexts do not satisfy rotation invariance. The histograms of ships of the same type, at different azimuth angles, are vastly different. To enable the feature suitable for recognizing ships with different azimuths, we utilize the extracted principal axis of the ship as the reference angle for shape context. The angle between every scattering point and the reference point is measured by the angle between the connecting line of the two points and the principal axis, measured in anticlockwise direction (see Figure 5). After this measurement, the topology of the scattering points is described by the histograms. Since the angle between every two points depends on the principal axis of the ship, the scattering points of the ship are rotational invariant.
2. The weighted feature matching procedure
Because of limited experimental samples, template matching is used to classify different types of ships. Specifically, after calculating the matching costs of the query ship and different candidate ship templates, the candidate ship template with the lowest matching cost would be the final recognition result. The specific shape contexts matching method is as follows.
After obtaining the shape context feature of each scattering point, the distance between the shape contexts of the query ship and the ship template are calculated by χ 2 statistic. The cost of two points is denoted as
C i j C ( p i , q j ) = 1 2 k = 1 K [ h i ( k ) h j ( k ) ] 2 h i ( k ) + h j ( k )
Given the matrix of costs C i j between all pairs of points p i on the query ship and q j on the ship template, the next task is minimizing the total matching cost C = 1 N i = 1 N C ( p i , q π ( i ) ) = 1 N i = 1 N C i , π ( i ) , subject to the constraint that the matching be one-to-one. q π ( i ) is matching point of p i , which is an instance of the square assignment problem that can be solved by the Hungarian method [27]. The matching result of the two ships is shown in Figure 6.
So far, every scattering point of the query ship matches the scattering point of the ship template, with almost similar topology. But we have taken advantage of only the topological relations of the scattering points, without taking into consideration the intensity information of the corresponding scattering points.
The shape context of a scattering point represents its topological relation with other points. Because the same types of ships are similar in structure, the scattering points with similar shape contexts are also similar in intensity. Some scattering points of different types of ships may have similar shape contexts. However, their intensity may be vastly different.
For calculating the matching cost of two ships, the intensities of their scattering points should be taken into account by giving weight to the cost of every two matching points. Specifically, the original matching cost C i , π ( i ) of p i and q π ( i ) should be multiplied by a weight factor W i , π ( i ) , which contains the intensity information of the scattering points.
We believe that the more the similarity between the intensities of two matching points, the smaller would be the matching cost. Assuming that the intensities of the matching points are I i ( k ) and I π ( i ) ( k ) , then the weight indicating the degree of similarity in intensity is
W i , π ( i ) 1 = ( I i ( k ) I i ( k ) + I π ( i ) ( k ) I π ( i ) ( k ) I i ( k ) + I π ( i ) ( k ) ) 2 = ( I i ( k ) I π ( i ) ( k ) I i ( k ) + I π ( i ) ( k ) ) 2
Generally, the scattering points with higher intensity have greater effects on the matching degree of the two ships. So, we multiply the original matching cost C i , π ( i ) with another weight W i , π ( i ) 2 = I i ( k ) + I π ( i ) ( k ) . Finally, the weighted matching cost is
C i , π ( i ) ' = W i , π ( i ) 1 W i , π ( i ) 2 C i , π ( i ) = W i , π ( i ) 1 W i , π ( i ) 2 C ( p i , q π ( i ) ) = ( I i ( k ) I π ( i ) ( k ) ) 2 I i ( k ) + I π ( i ) ( k ) C ( p i , q π ( i ) )
Finally, the total matching cost of the query ship and the ship template is
C ' = 1 N i = 1 N C i , π ( i ) ' = 1 N i = 1 N W i , π ( i ) 1 W i , π ( i ) 2 C i , π ( i ) = 1 N i = 1 N W i , π ( i ) 1 W i , π ( i ) 2 C ( p i , q π ( i ) )
The type of candidate ship template with the lowest matching cost would be the final classification result of the query ship.
Compared with the original shape contexts method, there are two improvements in our proposed method. Firstly, the principal component analysis (PCA) is employed to compute the principal axis of the scattering points, so the algorithm is suitable for classification of warships under different azimuth angles. Secondly, in the matching stage, the intensities of scattering centers are taken into account by giving weight to the cost of every two matching points. In general, the improved shape contexts method fully describes the distinguishing characteristics of the ship targets. The ship signature is dependent on the azimuth angle of the ship, but given one angle, the algorithm is invariant to rotation and translation.

3. Experimental Results

In this section, we implement the experiments on a real ship dataset via a space-borne SAR sensor designed by IECAS to examine the effectiveness of the proposed method. The ships are collected from 32 stripmap-model SAR images with X band, 3m resolution in both azimuth and range directions. The image acquisitions dates vary from 16 May 2008 to 9 September 2015. The categories of the ships are confirmed by the professional interpreters. The data relates to three types of destroyers (total 150 samples). The number of the three kinds of ships is 50, 50 and 50, respectively (See Figure 7). The incidence angle ranges between 40° and 55°. The azimuth angles ranges between 0° and 360°. The ship dataset is extracted from geo-coded images, which have subjected to geometric correction.
Due to the limitation of sample size, the methods we compare are all template matching with features. The features that are commonly used in computer vision for shape matching are Hu moments [28] and Zernike moments [29]. They are invariant to image translation, scaling and rotation, with global characteristic description. Invariant moments are widely used for target recognition and tracking, texture analysis and other related purposes. Besides, we also compare our method with the recent approach [15] proposed by Xing in 2013. The approach proposes to use both geometric features and electromagnetic scattering characteristic for ship classification. The geometric feature includes the ship length (Len), length to width ratio (R), centroid (C), shape complexity (X) and covariance coefficient (V). The electromagnetic scattering characteristic is described by the local RCS density (LRCS), specifically, the pixel intensity ratio of three parts of the ship. The feature vector f denoted as follows.
f = [ L e n , R , C , X , V , L R C S ] T
In our study, for the sake of comparison, we conducted classification experiments with the improved shape contexts (ISC) method we propose, the original shape contexts (OSC) method, the feature proposed by the literature [15] with Euclidean distance and the conventional moment features, namely Hu moments and Zernike moments with Euclidean distance. In the ISC and OSC, we use five bins for log r and 12 equally spaced radial bins for θ . ( K = 60 , M = 5 and N = 12 ).
By randomly selecting one of each class as templates and the rest samples for classification test, we carry out the classification experiments. Specifically, we calculate the matching cost of every query ship and the three templates using the five methods cited above, the final classification result is the type of template with the lowest matching cost. As the template samples are selected randomly, the classification experiments are carried out repeatedly for ten times and the results are averaged. The results, presented in Table 1, show that the improved shape contexts method outperforms all the other methods with average classification rate nearly 91%.
Some correctly classified and incorrectly classified ship images of OSC are provided in Figure 8. The third column is misclassified. In this column, the first and third samples are misclassified as destroyer 2 while the second sample is misclassified as destroyer 3. This is mostly because, under some certain azimuth angles, the scattering centers of ships vary greatly due to the mechanism of imaging SAR. Besides, high speed navigation of ships also impacts image quality. These problems are not considered in the proposed algorithm.

4. Discussion

This paragraph we analyze the possible reasons of the above experimental results. Feature extraction is the key problem of target recognition. Both of Hu and Zernike moments are highly concentrated image features with rotation, translation and scaling invariance. Since Hu moments [28] feature is a kind of low order statistic, it cannot fully describe the details of an image. So the distinguishing ability of Hu moments is limited in many cases. Compared to Hu moments, Zernike moments [29] feature is more robust to noise and small shape changes with less redundant information. However, this paper focuses on the distinction of warships in SAR imagery. Since the above moments are not well designed for the specific targets classification, they cannot fully describe the distinguishing features of warships in SAR imagery. Hu moments and Zernike moments are universal features, so they cannot achieve good experiments results in such a specific dataset. Similarly, despite the effectiveness of f feature vector for civilian ships, the ability of the feature to distinguish warships is also limited. Though local RCS density in f feature vector is designed for civilian ships in SAR imagery, it just divides the ship into several parts and adds up the pixel intensity of each part. As warships are much closer in shape and structure, this simple feature is unable to make a complete use of the distinguishing characteristic of different warships in SAR imagery. As we have analyzed in Section 2.1, the topology and the intensity of the scattering centers are the main distinguishing features of warships in SAR imagery. The improved shape contexts method fully takes advantage of the distinguishing features, thus it can achieve better recognition results.

5. Conclusions

In this paper, an effective and precise ship classification method is proposed. The letter first analyzes the main distinguishing features of ships in SAR imagery. In the preprocessing stage of classification, the scattering points of warships are extracted by CFAR, and the principal axis is estimated using PCA. Then we propose the improved shape contexts method, which fully describes the topology and intensity of the scattering points of the ships. It is experimentally demonstrated with the space-borne data that the proposed method outperforms the traditional moments and the recent state-of-art approaches, as also the original shape contexts method, by achieving an average classification accuracy of about 91%. Despite the encouraging results of the novel method, the proposed algorithm needs many improvements. First, more types of ship samples are needed to validate the applicability of the method to a wide ranging variety of ships. Second, since the features of warships change with the azimuth angle in SAR images, more stable features should be looked for to strengthen the robustness of the method. Finally, the scattering mechanism of the ship should be studied in greater depth in future.

Acknowledgments

This work was jointly supported by the National Science Foundation of China under Grant No. 61331017.

Author Contributions

Jiwei Zhu, Xiaolan Qiu, Zongxu Pan, Yueting Zhang and Bin Lei initiated the research. Under supervision of Xiaolan Qiu, Jiwei Zhu performed the experiments and analysis. Jiwei Zhu, Xiaolan Qiu, Zongxu Pan, Yueting Zhang and Bin Lei wrote and revised the manuscript. All authors read and approved the final version of the manuscript.

Conflicts of Interest

The authors declare no conflict of interest.

References

  1. Eldhuset, K. An automatic ship 472 and ship wake detection system for spaceborne SAR images in coastal regions. IEEE Trans. Geosci. Remote Sens. 1996, 34, 1010–1019. [Google Scholar] [CrossRef]
  2. Crisp, D.J. The State-of-the-Art in Ship Detection in Synthetic Aperture Radar Imagery. Available online: http://www.dsto.defence.gov.au/publications/2660/ (accessed on 5 February 2004).
  3. Wang, C.; Liao, M.; Li, X. Ship detection in SAR images based on the Alpha-stable distribution. Sensors 2008, 8, 4948–4960. [Google Scholar] [CrossRef] [PubMed]
  4. Wackerman, C.C.; Friedman, W.G.; Pichel, W.G.; Clemente-Colon, P.; Li, X. Automatic detection of ships in RADARSAT-1 SAR imagery. Can. Remote Sens. 2001, 27, 568–577. [Google Scholar] [CrossRef]
  5. Nunziata, F.; Migliaccio, M.; Brown, C.E. Reflection symmetry for polarimetric observation of man-made metallic targets at sea. IEEE J. Ocean. Eng. 2012, 37, 384–394. [Google Scholar] [CrossRef]
  6. Marino, A. A notch filter for ship detection with polarimetric SAR data. IEEE J. Sel. Top. Appl. Eearth Obs. Remote Sens. 2013, 6, 1219–1232. [Google Scholar] [CrossRef]
  7. Anfinsen, S.N.; Brekke, C. Statistical models for constant false alarm rate ship detection with the sublook correlation magnitude. IEEE Trans. Geosci. Remote Sens. 2012, 53, 5626–5629. [Google Scholar]
  8. Marino, A.; Sanjuan-Ferrer, M.J.; Ouchi, K. Ship detection with spectral analysis of Synthetic Aperture Radar: A comparison of new and well-known algorithms. Remote Sens. 2015, 7, 5416–5439. [Google Scholar] [CrossRef]
  9. Margarit, G.; Mallorqui, J.J.; Rius, J.M.; Sanz-Marcos, J. On the usage of GRECOSAR, an orbital polarimetric SAR simulator of complex targets, for vessel classification studies. IEEE Trans. Geosci. Remote Sens. 2006, 44, 3517–3526. [Google Scholar] [CrossRef]
  10. Osman, H.; Pan, L.; Blostein, S.D.; Gagnon, L. Classification of ships in airborne SAR imagery using back propagation neural networks. Proc. SPIE 1997, 1997, 126–136. [Google Scholar]
  11. Gouaillier, V.; Gagnon, L. Ship silhouette recognition using principal components analysis. Proc. SPIE 1997, 1997, 59–69. [Google Scholar]
  12. Margarit, G.; Tabasco, A. Ship classification in single-Pol SAR images based on fuzzy logic. IEEE Trans. Geosci. Remote Sens. 2011, 49, 3129–3138. [Google Scholar] [CrossRef]
  13. Touzi, R.; Raney, R.K.; Charbonneau, F. On the use of permanent symmetric scatters for ship characterization. IEEE Trans. Geosci. Remote Sens. 2004, 42, 2039–2045. [Google Scholar] [CrossRef]
  14. Margarit, G.; Jordi, J.M.; Fabregas, X. Single-pass polarimetric SAR interferometry for vessel classification, IEEE Trans. Geosci. Remote Sens. 2007, 45, 3494–3502. [Google Scholar] [CrossRef]
  15. Xing, X.; Ji, K.; Zou, H.; Chen, W.; Sun, J. Ship classification in TerraSAR-X images with feature space based sparse representation. IEEE Geosci. Remote Sens. Lett. 2013, 10, 1562–1566. [Google Scholar] [CrossRef]
  16. Zhang, H.; Tian, X.; Wang, C.; Wu, F.; Zhang, B. Merchant vessel classification based on scattering component analysis for COSMO-SkyMed SAR images. IEEE Geosci. Remote Sens. Lett. 2013, 10, 1275–1279. [Google Scholar] [CrossRef]
  17. Zhou, J.; Shi, Z.; Cheng, X.; Fu, Q. Automatic target recognition of SAR images based on global scattering center model. IEEE Geosci. Remote Sens. Lett. 2011, 49, 3713–3729. [Google Scholar]
  18. Park, J.; Park, S.; Kim, K. New discrimination features for SAR automatic target recognition. IEEE Geosci. Remote Sens. Lett. 2013, 10, 476–480. [Google Scholar] [CrossRef]
  19. Park, J.; Kim, K. Modified polar mapping classifier for SAR automatic target recognition. IEEE Geosci. Remote Sens. Lett. 2014, 36, 1092–1106. [Google Scholar] [CrossRef]
  20. Amoon, M.; Rezai, G. Automatic target recognition of Synthetic Aperture Radar (SAR) images based on optimal selection of Zernike moments features. IET Comput. Vis. 2014, 8, 77–85. [Google Scholar] [CrossRef]
  21. Papson, S.; Narayanan, R. Classification via the shadow Region in SAR Imagery. IEEE Trans. Aerosp. Electron. Syst. 2012, 48, 969–980. [Google Scholar] [CrossRef]
  22. Belongie, S.; Malik, J.; Puzicha, J. Shape matching and object recognition using shape contexts. IEEE Trans. Pattern Anal. Mach. Intell. 2002, 24, 509–522. [Google Scholar] [CrossRef]
  23. Amores, J.; Sebe, N.; Radeva, P. Context-based object-class recognition and retrieval by generalized correlograms. IEEE Trans. Pattern Anal. Mach. Intell. 2007, 29, 1818–1833. [Google Scholar] [CrossRef] [PubMed]
  24. Shi, Y.; Thompson, P.M.; Zubicaray, G.I.; Rose, S.E.; Tu, Z.; Dinov, I.; Toga, A.W. Direct mapping of hippocampal surfaces with intrinsic shape context. NeuroImage 2007, 37, 792–807. [Google Scholar] [CrossRef] [PubMed]
  25. Ji, K.; Kuang, G.; Su, Y.; Yu, W. Methods of target’s peak extraction and azimuth estimation from SAR imagery. J. Astronaut. 2004, 25, 102–108. [Google Scholar]
  26. Jones, G.; Bhanu, B. Recognizing of articulated objects in SAR images. Pattern Recognition 2001, 34, 469–485. [Google Scholar]
  27. Papadimitriou, C.; Stieglitz, K. Combinatorial Optimization: Algorithms and Complexity; Courier Corporation: North Chelmsford, MA, USA, 1982. [Google Scholar]
  28. Hu, M.K. Visual pattern recognition by moment invariants. IEEE Trans. Inf. Theory 1962, 8, 179–187. [Google Scholar]
  29. Liao, S.X.; Pawlak, M. On the accuracy of Zernike moments for image analysis. IEEE Trans. Pattern Anal. Mach. Intell. 1988, 20, 1358–1364. [Google Scholar] [CrossRef]
Figure 1. The optical and synthetic aperture radar (SAR) images of different types of ships.
Remotesensing 09 00145 g001
Figure 2. The procedure of classification algorithm.
Remotesensing 09 00145 g002
Figure 3. The procedure of classification algorithm. Diagram of the principal axis extraction. (a) The original image; (b) The segmented image; (c) The principal axis extraction.
Remotesensing 09 00145 g003
Figure 4. The original shape context descriptor. (a) The division of sampling points; (b) The histogram of sampling points.
Remotesensing 09 00145 g004
Figure 5. Shape contexts description based on principal axis.
Remotesensing 09 00145 g005
Figure 6. An instance of the shape contexts matching. (a) The segmented image of the query ship and ship template; (b) The shape contexts matching result of the query ship and ship template. Query ship (red), Ship template (blue).
Remotesensing 09 00145 g006
Figure 7. The first column represents the optical images of three types of warships. The second column to the fourth column represents the samples corresponding to the three types of warships from different azimuth angles. destroyer1 (top), destroyer2 (middle), destroyer3 (bottom).
Remotesensing 09 00145 g007
Figure 8. The correctly and incorrectly classified ship images of OSC for three types of destroyers.
Remotesensing 09 00145 g008
Table 1. Comparison of Classification Accuracy obtained by Hu moments, Zernike moments, f feature, OSC (Original Shape Contexts) and ISC (Improved Shape Contexts).
Hu MomentsZernike Moments f FeatureOSCISC
Destoryer1 Classification Accuracy70%81%73%88%92%
Destoryer2 Classification Accuracy66%78%69%86%90%
Destoryer3 Classification Accuracy67%77%66%86%90%
Average Classification Accuracy68%79%69%87%91%

